
A GIS-Based Method of the Assessment of Spatial Integration of Bike-Sharing Stations


1
Department of Transport Systems, Traffic Engineering, and Logistics, Faculty of Transport and Aviation Engineering, Silesian University of Technology, Krasińskiego 8 Street, 40-019 Katowice, Poland
2
Faculty of Transport, Warsaw University of Technology, Koszykowa 75 Street, 00-662 Warsaw, Poland
*
Authors to whom correspondence should be addressed.
Sustainability 2021, 13(7), 3894; https://doi.org/10.3390/su13073894
Submission received: 21 January 2021
/
Revised: 23 March 2021
/
Accepted: 26 March 2021
/
Published: 1 April 2021
(This article belongs to the Special Issue Innovations towards Greener and Smarter Mobility for Sustainable Development)
Abstract
:The paper presents a method of the assessment of spatial integration of bike-sharing stations in urban agglomerations based on GIS tools for analyses. The method uses four sub-models: system of bike-sharing stations, road and street network, demand for bike-sharing ridership, bike-sharing ridership routing, and value matrix of spatial integration measures. The presented method allows the identification of different categories of segments of the road and street network used for bike travels and enables the identification of the set of segments that should be upgraded into bike-friendly infrastructure offering bike lanes or cycle paths in order to ensure the appropriate level of spatial integration of bike-sharing stations. The possibility of the application of the method has been studied on the example of the existing bike-sharing system in Katowice, a city in southern Poland. The research presented in the paper has been conducted based on data on bike rentals and bike trips from eight months of 2018. Selected results of the spatial integration assessment of bike-sharing stations, which may be useful for making investment decisions in the bike-sharing system development, are presented.
1. Introduction
Transport activity in large urban agglomerations has contributed to the numerous problems decreasing the quality of life. Such problems include congestion, pollution, noise, or health issues [1,2,3,4,5,6]. Many of them are derived from the dominant role of individual transport, especially private cars used for commuting [7]. Hence, multiple studies on sustainable mobility have highlighted the importance of transit and transport modes alternative to private cars [8,9,10,11].
In recent years, the expansion of shared mobility systems around the world is observed [12,13,14]. Such systems encompass car-sharing, e-scooter-sharing, and bike-sharing. This is consistent with the transition from ownership to shareship of transport assets in public areas [15,16]. The number of bike-sharing systems in operation is also increasing and currently, such systems are present in over 1000 cities all over the world. One of the first systems was introduced in Amsterdam in the 1960s (the so-called White Bike Plan). It was the first-generation system in which bikes were accessible without any payments. Currently, systems with dockless bikes are introduced (fifth-generation systems) [17].
However, there are certain conditions that should be met to encourage the use of bike-sharing systems [18]. These conditions are associated with certain aspects of operation like the accessibility of stations, accessibility and quality of bike paths, fares and fees, the technical condition of bikes, or the spatial integration of bike-sharing stations. The issue of integration is of particular importance since effective bike traveling requires safe bike paths forming a coherent and extensive network. The network of paths should be accessible and integrated to connect bike-sharing stations throughout the area.
The main aim of this paper was to develop a method of the assessment of the spatial integration of bike-sharing stations operating in urban agglomerations with the application of GIS-tools for spatial analyses. The paper is divided into four main sections. The first section pertains to a critical analysis of the literature in the context of bike-sharing system development, decision-making problems in this field, methods of data acquisition, and spatial analyses applied to bike-sharing systems. In the second section, the general procedure of the proposed method and essential functionalities of sub-models constituting the method are presented. An important element of the methodological section of the paper is the set of measures of the spatial integration of bike-sharing stations that could be useful in the decision-making process of developing a bike-sharing system.
Subsequent parts of the paper are the case study and discussion of the obtained results. The research on possible applications of the method was performed based on an existing bike-sharing system in Katowice, a city in southern Poland. The research presented in this paper is based on data about bike rentals and bike travels collected during eight months in 2018.
2. Literature Review
The increase in the number of bike trips may have a positive effect on the quality of life in metropolitan areas, as they help to overcome transport-related problems [19,20]. The bike is an eco-friendly vehicle, as it does not emit any pollutants or fumes. Thus, bicycles contribute to a decrease in air pollution, they may be also a solution to the problem of congestion or space occupation [21,22]. Bicycles also have the potential to reduce energy consumption and promote economic growth [23]. Many researchers point out the positive influence of bicycle riding on human health, that is, decreased cardiovascular risk or improved mental wellbeing [24]. These factors, as well as the growing demand for bike services, have led to numerous studies focused on the planning of effective, convenient, and accessible bike-sharing systems in large urban agglomerations [25]. The assessment of comfort, accessibility, and convenience of bike network is called bikeability in the literature [26,27].
Different studies have been focused on the determination of factors influencing bikeability. In [28], the authors have identified the availability and quality of bicycle infrastructure, street connectivity, topography, and land use. Factors that may contribute to the success of a bike-sharing system and a large number of trips include a strong influence of socio-demographic determinants, such as population density [29]. Studies have also shown the relationship between tourism and the popularity of bike-sharing systems [30]. Systems in cities with intensive touristic operations are characterized by a larger number of trips with shared bikes [20]. Researchers also point out the influence of weather conditions on bike usage. It has been proven that severe weather, such as rainfall, cold temperature, snow, or high humidity may discourage potential bike users [31,32]. These factors are, however, associated with the surroundings of the bike-sharing system and are not connected with its innate qualities like the size of the system (number of stations, number of bikes), fares and fees, location of stations, internal integration (i.e., integration of stations), and integration with other transport sub-systems in the area.
There are different aspects of integration in transport, such as spatial integration, functional integration, integration of information, or integration of fares [33]. The importance of spatial integration has been highlighted by numerous authors. A study conducted in New York has shown that more trips made with shared bikes are generated from stations located near subway stations [34]. It is also connected with the importance of bikes in the first-mile/last-mile problem [20,34]. Bicycle transport infrastructure between stations is a key factor in the integration of stations in the system. The role of bike-friendly infrastructure has also been pointed out in many studies.
In paper [35], the authors have shown that bike-friendly infrastructure may be a motivator for using a bike. Such infrastructure encompasses routes away from traffic noise or separated from road traffic. Another study was focused on the factors that may encourage or discourage cycling associated with the physical, environmental, and service-related characteristics of bike paths [36]. Factors with dissuasive effects include the presence of other modes of transport along cycling paths or difficult spots such as transit stops or curbs. On the other hand, street connectivity and the directness of pathways may influence the number of trips made using shared bikes. The physical characteristics of cycle lanes, their width and surface, as well as quality may have a similar effect [36]. The impact of cycling infrastructure has also been investigated in paper [37]. The authors state that factors associated with bike lanes or bike paths are crucial for increasing the share of bike-sharing systems and demand for their services. Similar observations were presented in [38], where the authors showed that factors like supportive cycling facilities may positively influence the use of shared bikes. In the same paper, the authors noticed that easy access to transit may have a positive impact on transport mode preferences, thus emphasizing the role of integration between different transport sub-systems in metropolitan areas.
The positive impact of separated cycling infrastructure (bike lanes, cycle tracks, and bike paths) was also discussed in [39]. In this paper, GIS-based tools were used for spatial analysis. Such methods have been already applied to the studies associated with bike-sharing and decision-making problems. In paper [40], the authors used GIS-methods for the evaluation of bike-sharing stations. In numerous studies, that is, [41,42,43], GIS-based methods were used to optimize the number and location of bike-sharing stations. These methods were also exploited for the studies focused on the identification of factors that contribute to higher usage of shared bikes [44]. In paper [45], the authors used GIS-tools to choose the optimal location of transport infrastructure. The GIS-based method was also used for spatial analyses of transport infrastructure in [46].
Details about analyzed studies are presented in Table 1.
3. Methodology
3.1. General Overview and Assumptions of the Proposed Approach
The assessment of the spatial integration of the bike-sharing stations may be performed in many ways. The proposed method focuses on the infrastructural aspects having an impact on the quality of cycling trips. Identification of the elements of bicycle road and street network in urban areas and the classification of their convenience to cyclists is a step in the development of measures to adapt sections and nodes of this network to the requirements of bicycle traffic.
A sufficiently large set of data on both the location and operation of bike-sharing stations is necessary to assess the spatial integration of the system. The proposed method assumes that a bike-sharing system requires the rental and return of bikes only in specific locations—rental stations. Detailed data on the use of rental stations are collected by the companies managing this system.
It is also important to specify the period that will be analyzed. It should be noted that the parameters of a bike-sharing system change over time. These changes may concern both the number and location of stations, as well as the structure of rentals resulting from the needs of users. Therefore, an important step in the assessment is to identify the period with the greatest stability of operation. This also applies to the state of development of road and street network in the city, including sections and junctions used by cyclists.
It is important for the method to determine the spatial extent of the analysis, especially when the bike-sharing system covers several cities. Depending on the study purpose, analyses can be carried out for various options of spatial limitations. In the most comprehensive approach, the analysis is conducted for the entire area of operation of the bike-sharing system. To a more limited extent, it may be restricted to the area of a single city only.
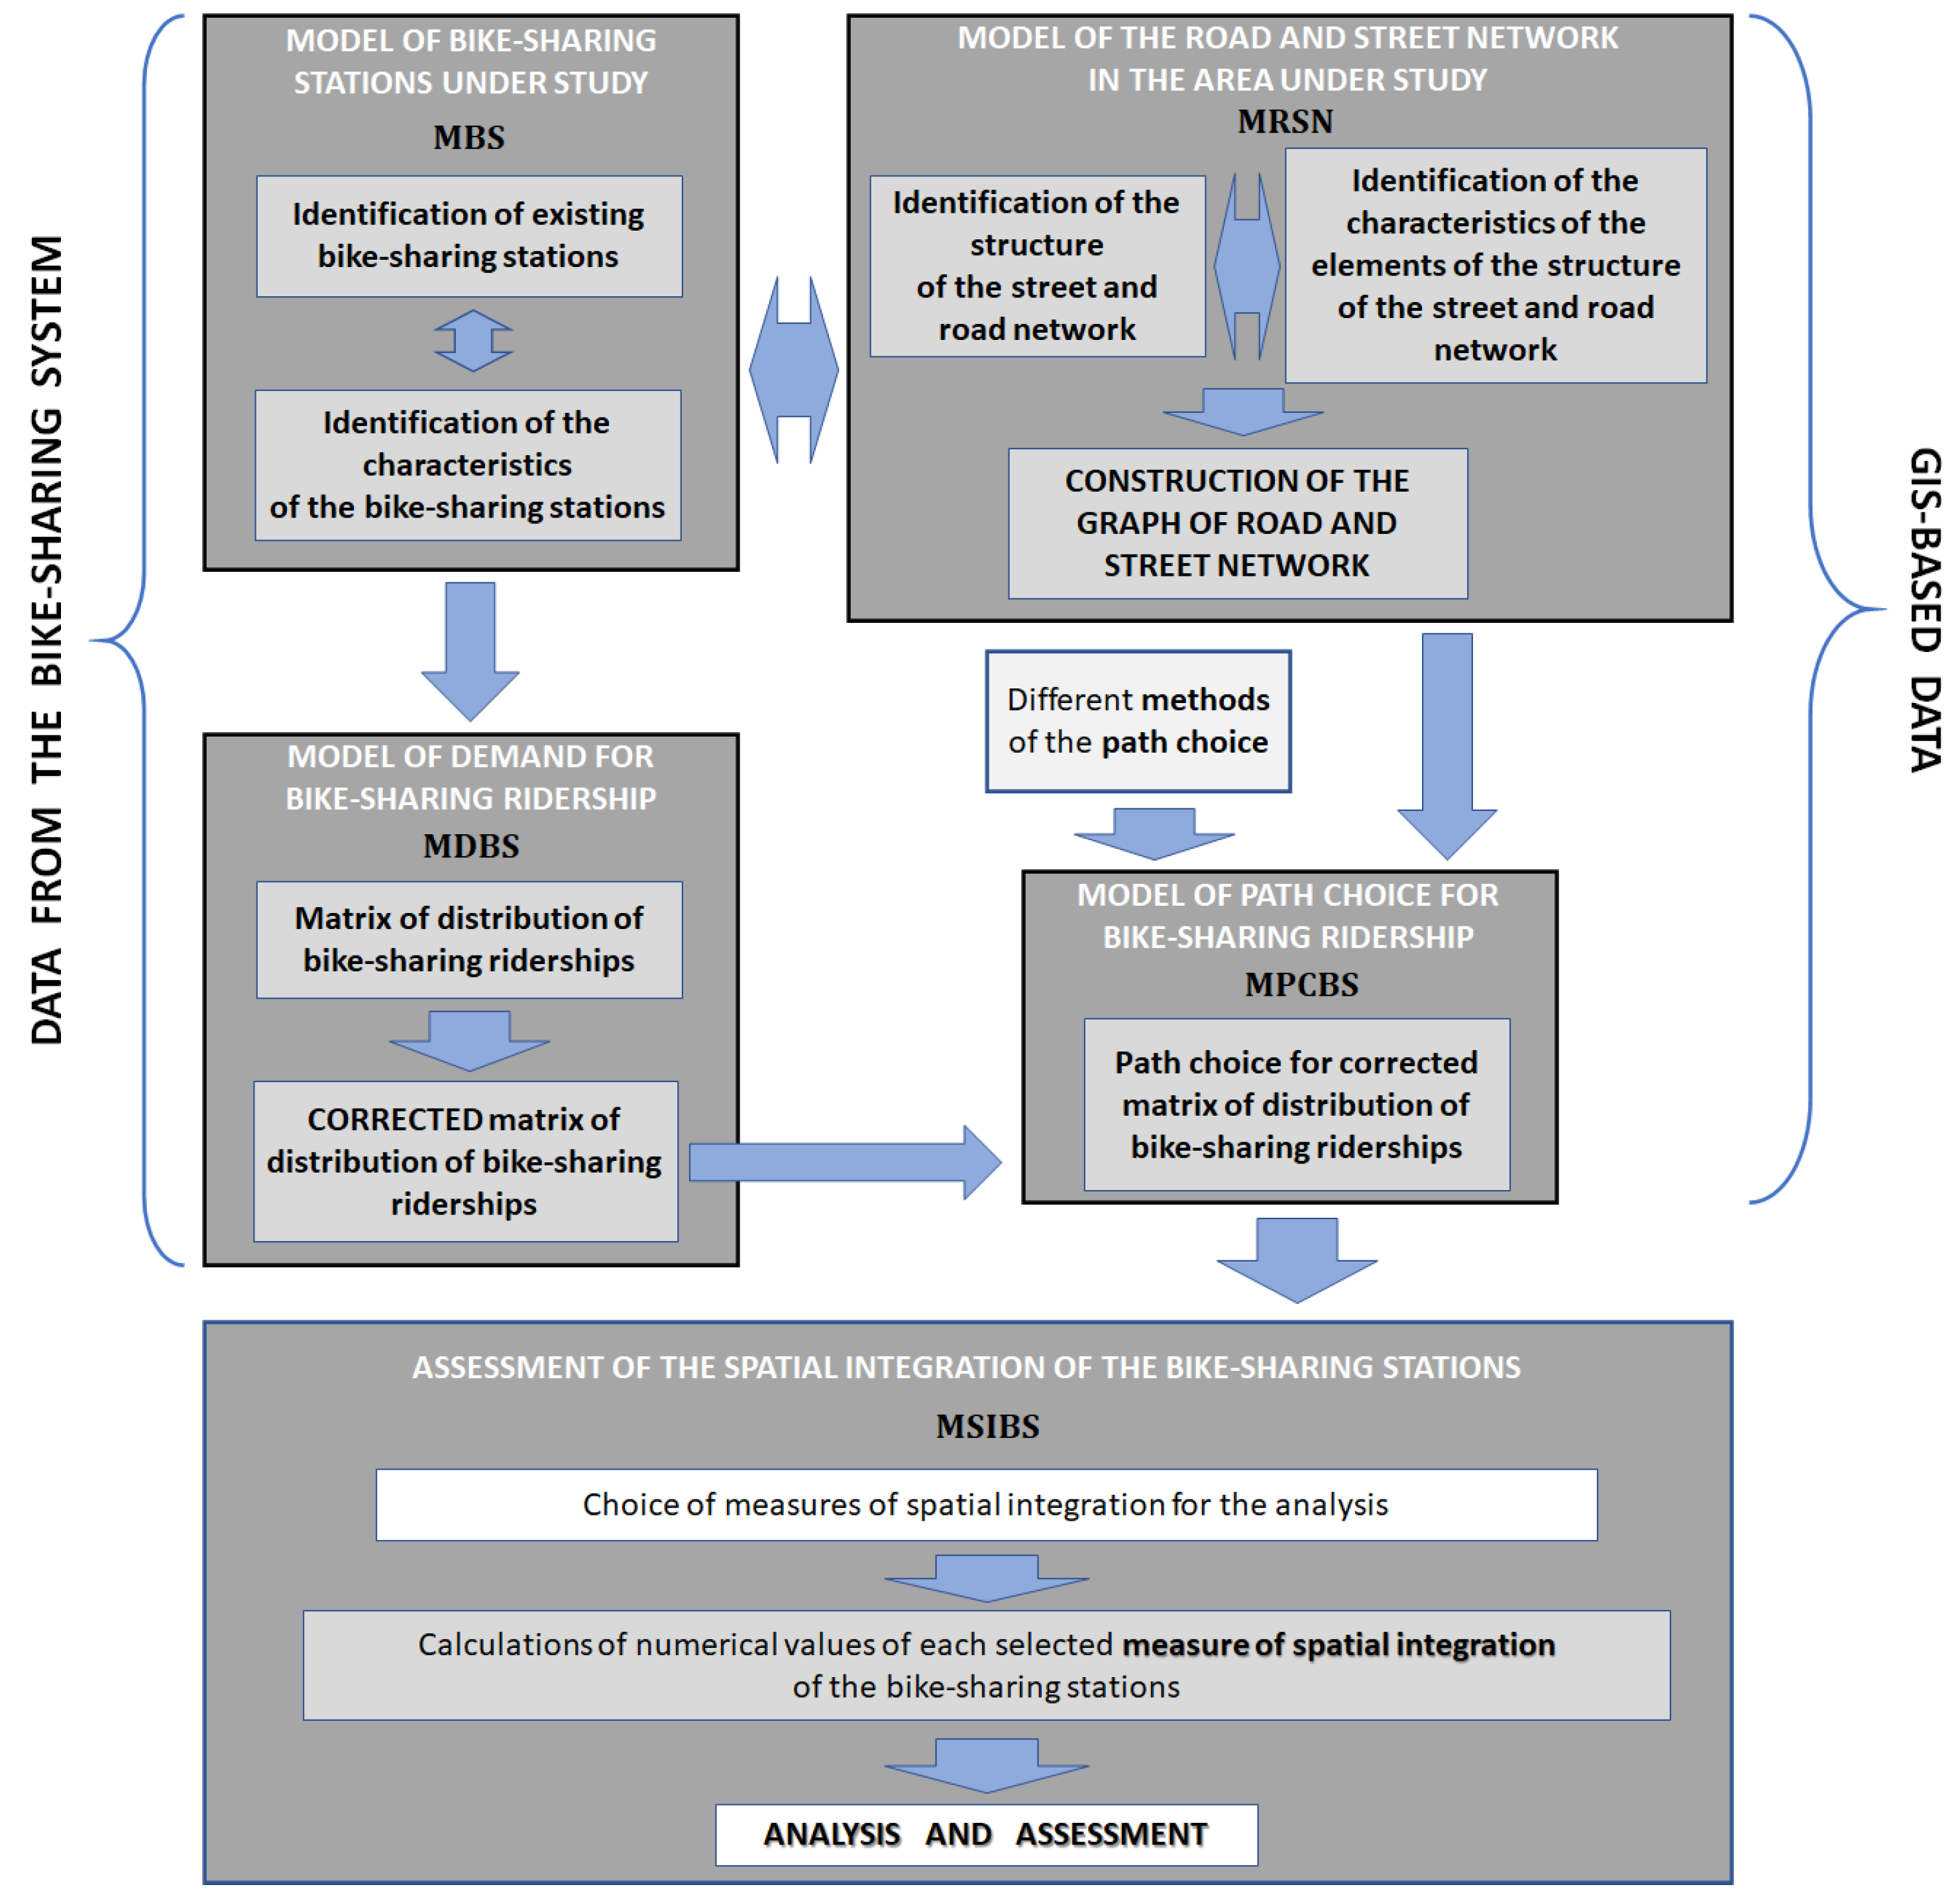
The proposed method consists of five main parts that can be treated as sub-models. The schematic connections between them are presented in Figure 1. It is assumed that data obtained from the bike-sharing system are used to build the distribution matrix of bicycle flows. In turn, the road and street network is described using GIS tools and graph theory. For the most loaded relations identified by the analysis of the distribution matrix, the shortest paths are determined, and then the sections of the road and street network belonging to these paths are subjected to a detailed analysis. The essential part of the method is the selection of appropriate measures and approaches to be used in the analysis. The selection of parameters describing segments of the road and street network is of great importance in this process.
The systemic approach to the problem in discussion requires presenting the proposed method as an ordered vector:
where:
—Method of the Assessment of the Spatial Integration of Bike-sharing Stations,
—model of bike-sharing stations system,
—model of road and street network,
—model of demand for bike-sharing ridership (trips),
—model of path choice for bike-sharing ridership (trips),
—value matrix of spatial integration measures of the assessment of bike-sharing stations selected for detailed analysis.
The model of the system of bike-sharing stations covers the attributes of bike-sharing stations divided into three main groups: descriptive, spatial, and related to bike traffic demand, which are presented in Table 2.
Descriptive attributes like the number or name are for the identification of the stations. The station name is usually associated with the name of the street or a landmark located in the immediate vicinity. In turn, spatial attributes, like latitude and longitude are for the precise location of the station in space. Data on bike traffic demand are also important attributes in the proposed method.
In terms of the operational research model of the road and street network— may be formulated as a structural graph of a transport network with sets of attributes assigned both to the edges and nodes of the graph, that is, features of the sections and intersections of the road and street network. The features can generally be divided into two main groups:
- qualitative (such as category),
- technical (such as length, average speed, number of lanes—for sections; number of inlets, type—for intersections; travel time for both types of elements).
In order to assess sections of the road and street network in terms of spatial integration of a bike-sharing system, it is necessary to assign each element of the road and street network to a predefined category corresponding to the appropriate degree of inconvenience for bicycle traffic. The classification according to OSM [50] was adopted with the following types of sections of the road and street network to be introduced:
- category Il—sidewalk,
- category IIl—service; for access to the buildings, service stations, beaches, campsites, industrial estates, business parks, etc. This is also commonly used for access to car parks, driveways, and alleys,
- category IIIl—unclassified; the lowest road category, also known as “quaternary roads”. These roads are usually the least important links of the road and street network in the hierarchy. In cities, such a category of roads complements the “tertiary roads”, while outside cities and inhabited areas, they are most often municipal roads. An unclassified road is often paved, but it can also be unpaved, for example, when it is a well-maintained main road to a village,
- category IVl—residential; usually used in cities to describe local roads that provide access to property or small settlements. Most often, roads of this category are in built-up areas, but not in residential zones. They do not have to be paved and do not function as roads connecting localities,
- category Vl—tertiary; roads situated outside the main road network but having an important role on a local scale. These often connect smaller cities, larger villages, or important parts of larger cities. In cities, they are the main inter-residential roads, often used also by public transport,
- category VIl—living street; a zone in which a pedestrian can move freely throughout the entire area available for public use and has priority over vehicles,
- category VIIl—stairs.
Cycleways constitute a special group of bicycle-friendly sections of the road and street network. Due to incomplete data on the OSM website, all sections were inventoried and appropriate categories were assigned to them. The following categories were adopted for the sections of bicycle paths:
- category Ib—completely separated bicycle path (separated, e.g., by a green line),
- category IIb—a bicycle path shared with the sidewalk (separated by color and marking),
- category IIIb—a bicycle path located on the sidewalk (separated only by vertical and/or horizontal marking),
- category IVb—bicycle path located in the road (a lane separated through horizontal and vertical marking),
- category Vb—bicycle path in the road (only horizontal and vertical markings are available).
The proposed method assumes that the minimum connectivity of the road and street network for bicycle traffic is ensured. This means that there is a connection between each pair of bike-sharing stations made by existing infrastructure, that is, sections of the categories Il–VIIl or Ib–Vb.
The classification of intersections considers types and the ways a cyclist moves along the section before and after the intersection. The categories of intersections are presented in Table 3.
To prevent outward and inward flows, it was assumed that rentals and returns of bicycles are possible only in the rental station inside the model. Moreover, bike-sharing trips, in which the bike has been rented and returned at the same station, were not considered in the analysis.
The primary assumption of the method is that the appropriate quality of the bicycle infrastructure should be ensured for connections that are most heavily loaded with bicycle traffic. There are many methods of assessing the volume of bicycle traffic. The significant values may be determined arbitrarily or by statistical methods. In the proposed method the upper quartile was adopted as the limit value of the traffic flow. It allowed to determine the relations for further analysis.
It was assumed that for each connection between bike-sharing stations exists a finite set of paths. For practical purposes, in the model of path choice for bike-sharing ridership—, each path is denoted as .
In dense road and street network, a pair of bike-sharing stations may be connected by many paths but only one of them was selected for further analysis. The proposed method allows one to consider various criteria to choose the path, but travel time and path length are most used. It is also possible to apply economic, ecological, and social criteria as well as various synthetic criteria corresponding to a multi-criteria approach. In this case, the path length was chosen as the criterion for the selection of the optimal path.
3.2. The Measures of Assessment of the Spatial Integration of Bike-Sharing Stations
The analyses for the assessment of spatial integration of bike-sharing stations may be carried out at the level of:
- sections of the road and street network,
- intersections constituting connections between sections,
- paths connecting bike-sharing stations,
- the entire bike-sharing system.
The analyses were conducted for two measures for which the values are compiled to the matrix :
- the percentage share of sections of a given category in relation to the length of the entire path,
- the number of intersections of a certain category in the optimal path.
The percentage share of sections of a given category in relation to the length of the entire path is an important measure of the spatial integration of bike-sharing stations. The values of this measure , were determined for each optimal path between the pair of the bike-sharing stations as:
where:
—total length of sections of the category belonging to the optimal path ,
—length of the optimal path .
The second important measure of the spatial integration of bike-sharing stations (noted as ) is the number of intersections of a certain category in the optimal path that can be determined as:
where takes the value of 1, if the intersection is of the category , and 0 otherwise.
When assessing the integration of bike-sharing stations, attention should be paid to those sections of the road and street network (i.e., categories Il–VIIl), that are not the elements of bicycle infrastructure, but belong to the paths connecting pairs of stations and are loaded with large numbers of bicycle trips. These are the elements that after modernization and adaptation to the needs of cyclists, can improve the conditions of bicycle traffic and increase its share in traffic within the city.
4. Case Study
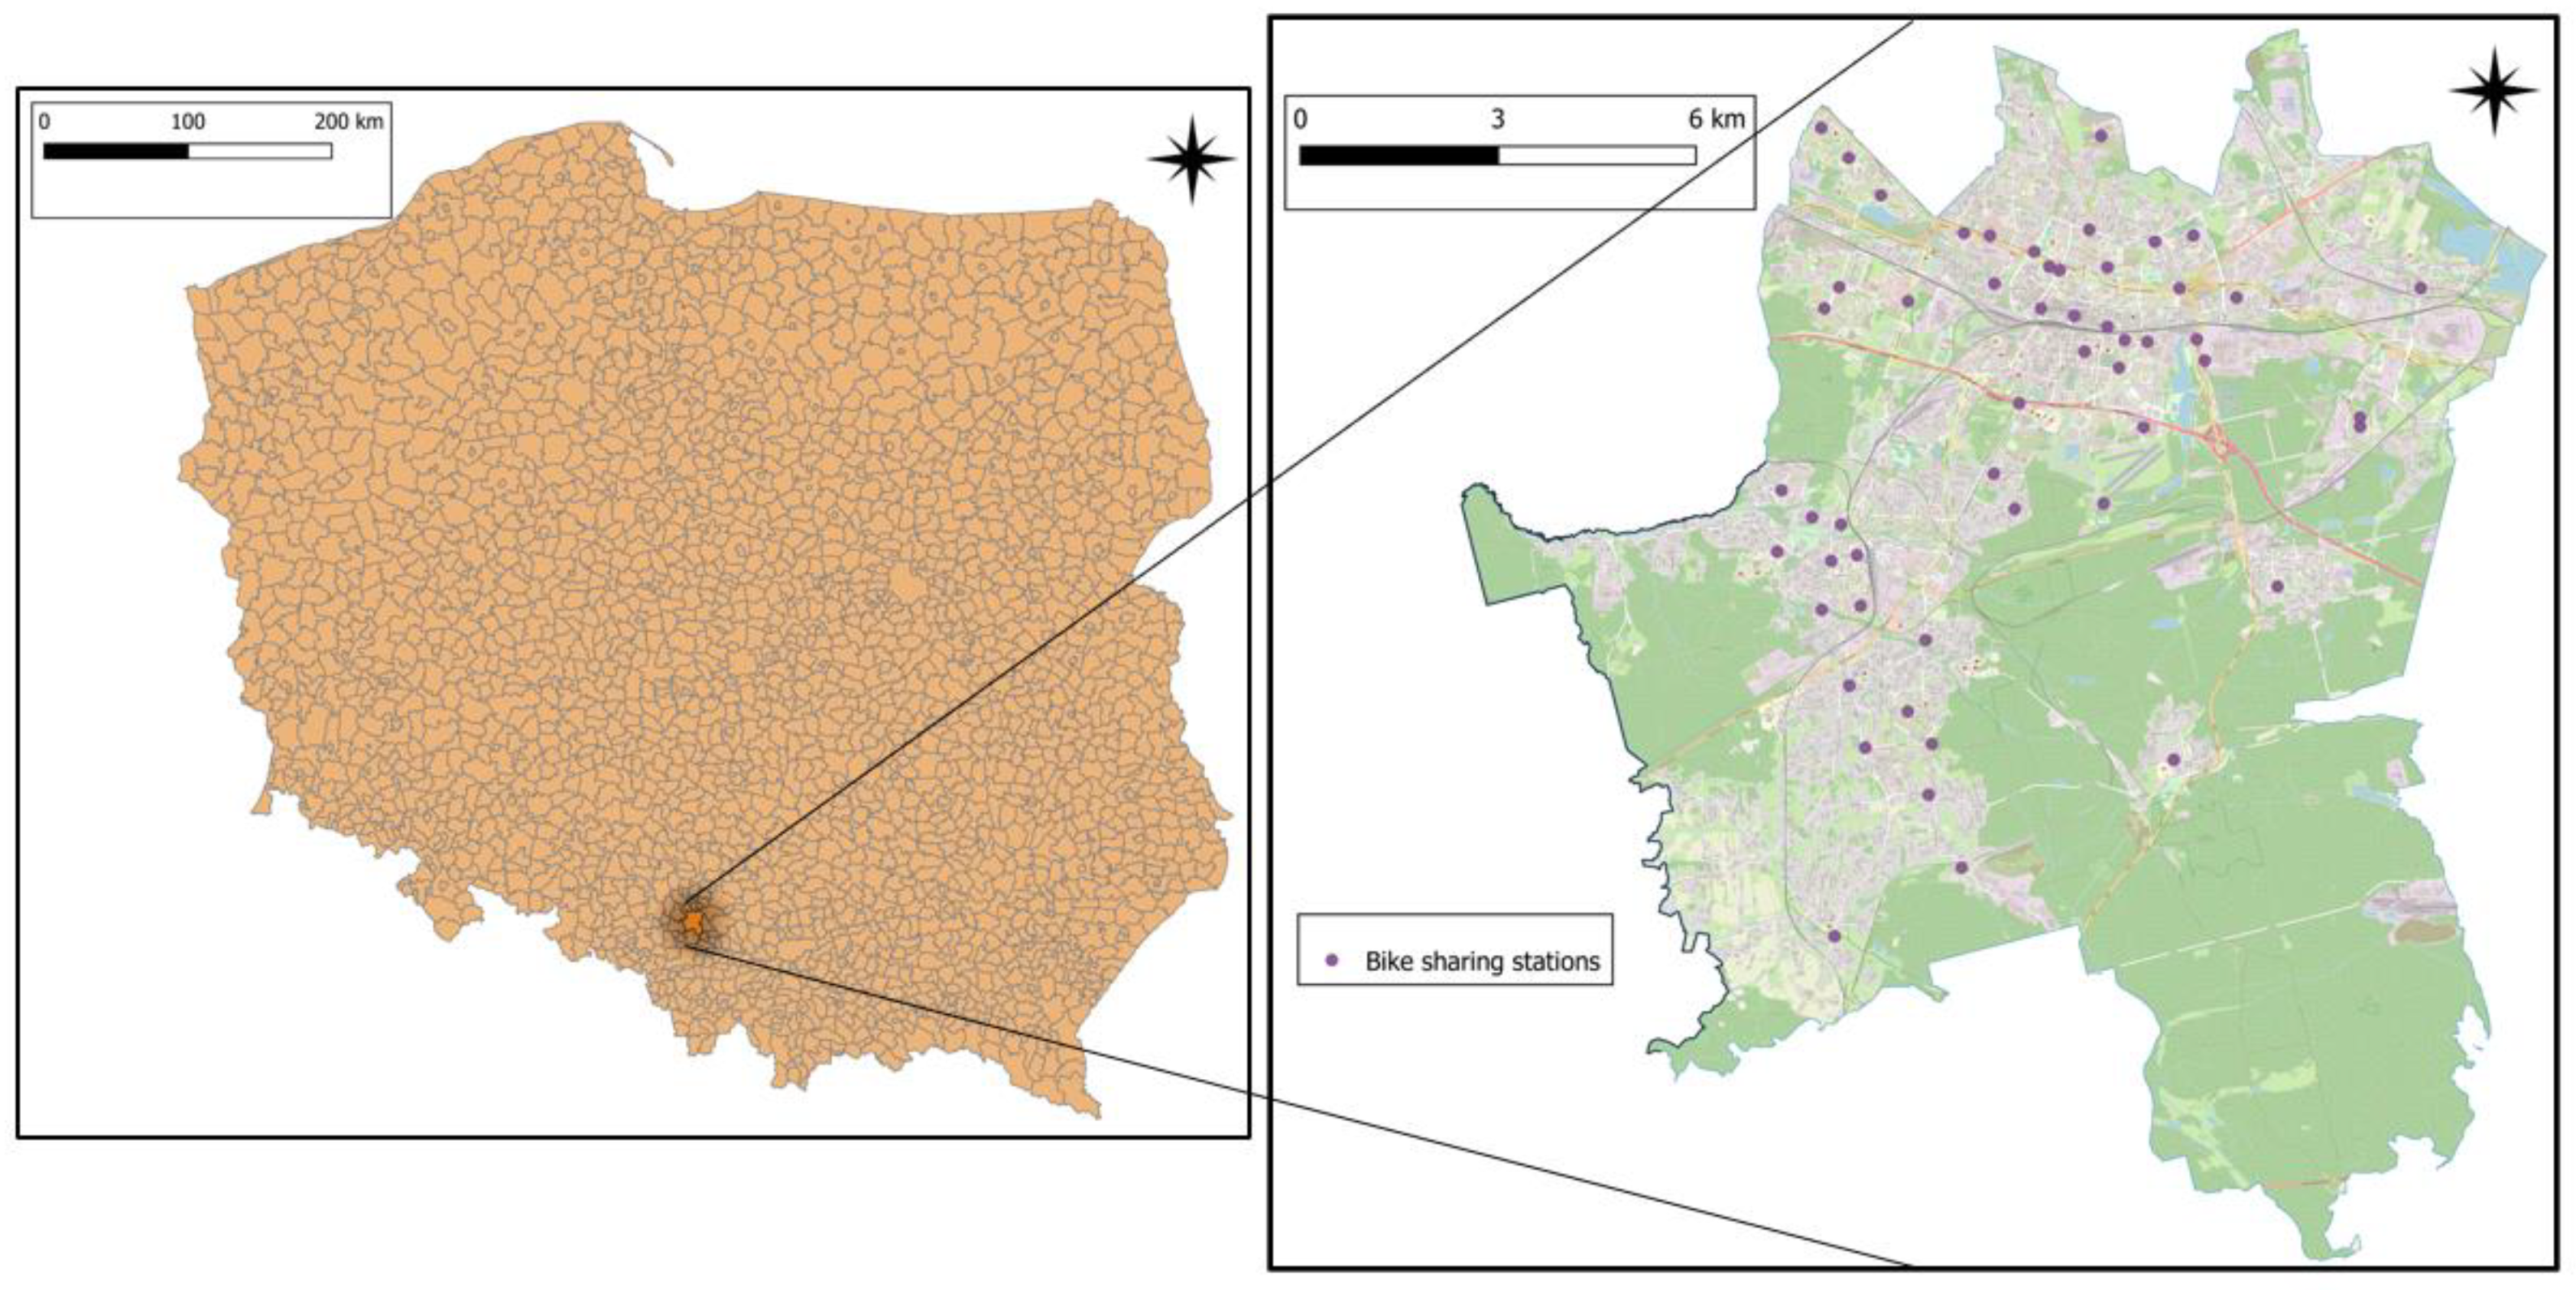
The developed method was applied in the city of Katowice. The city is in the south of Poland, in the central part of the Silesian region. The total number of inhabitants of Katowice is approximately 292,774 [51], and the area is 165 square kilometers. During the analysis period in 2018, 54 bike rental stations were operating in the city. Figure 2 shows the location of the city against the background of Poland and the location of the bicycle rental stations.
In 2018, the city bike rental season in which bikes are available to rent in Katowice started on 1 April and lasted continuously until 1 November. The duration of the season is mainly related to the weather conditions and covers eight months. The data on traffic were obtained from the authorities of the city of Katowice and the OpenStreetMap (OSM), which provided information on the category of the elements of road and street network. Data from OpenStreetMap conform to official data and are ready for processing using GIS tools.
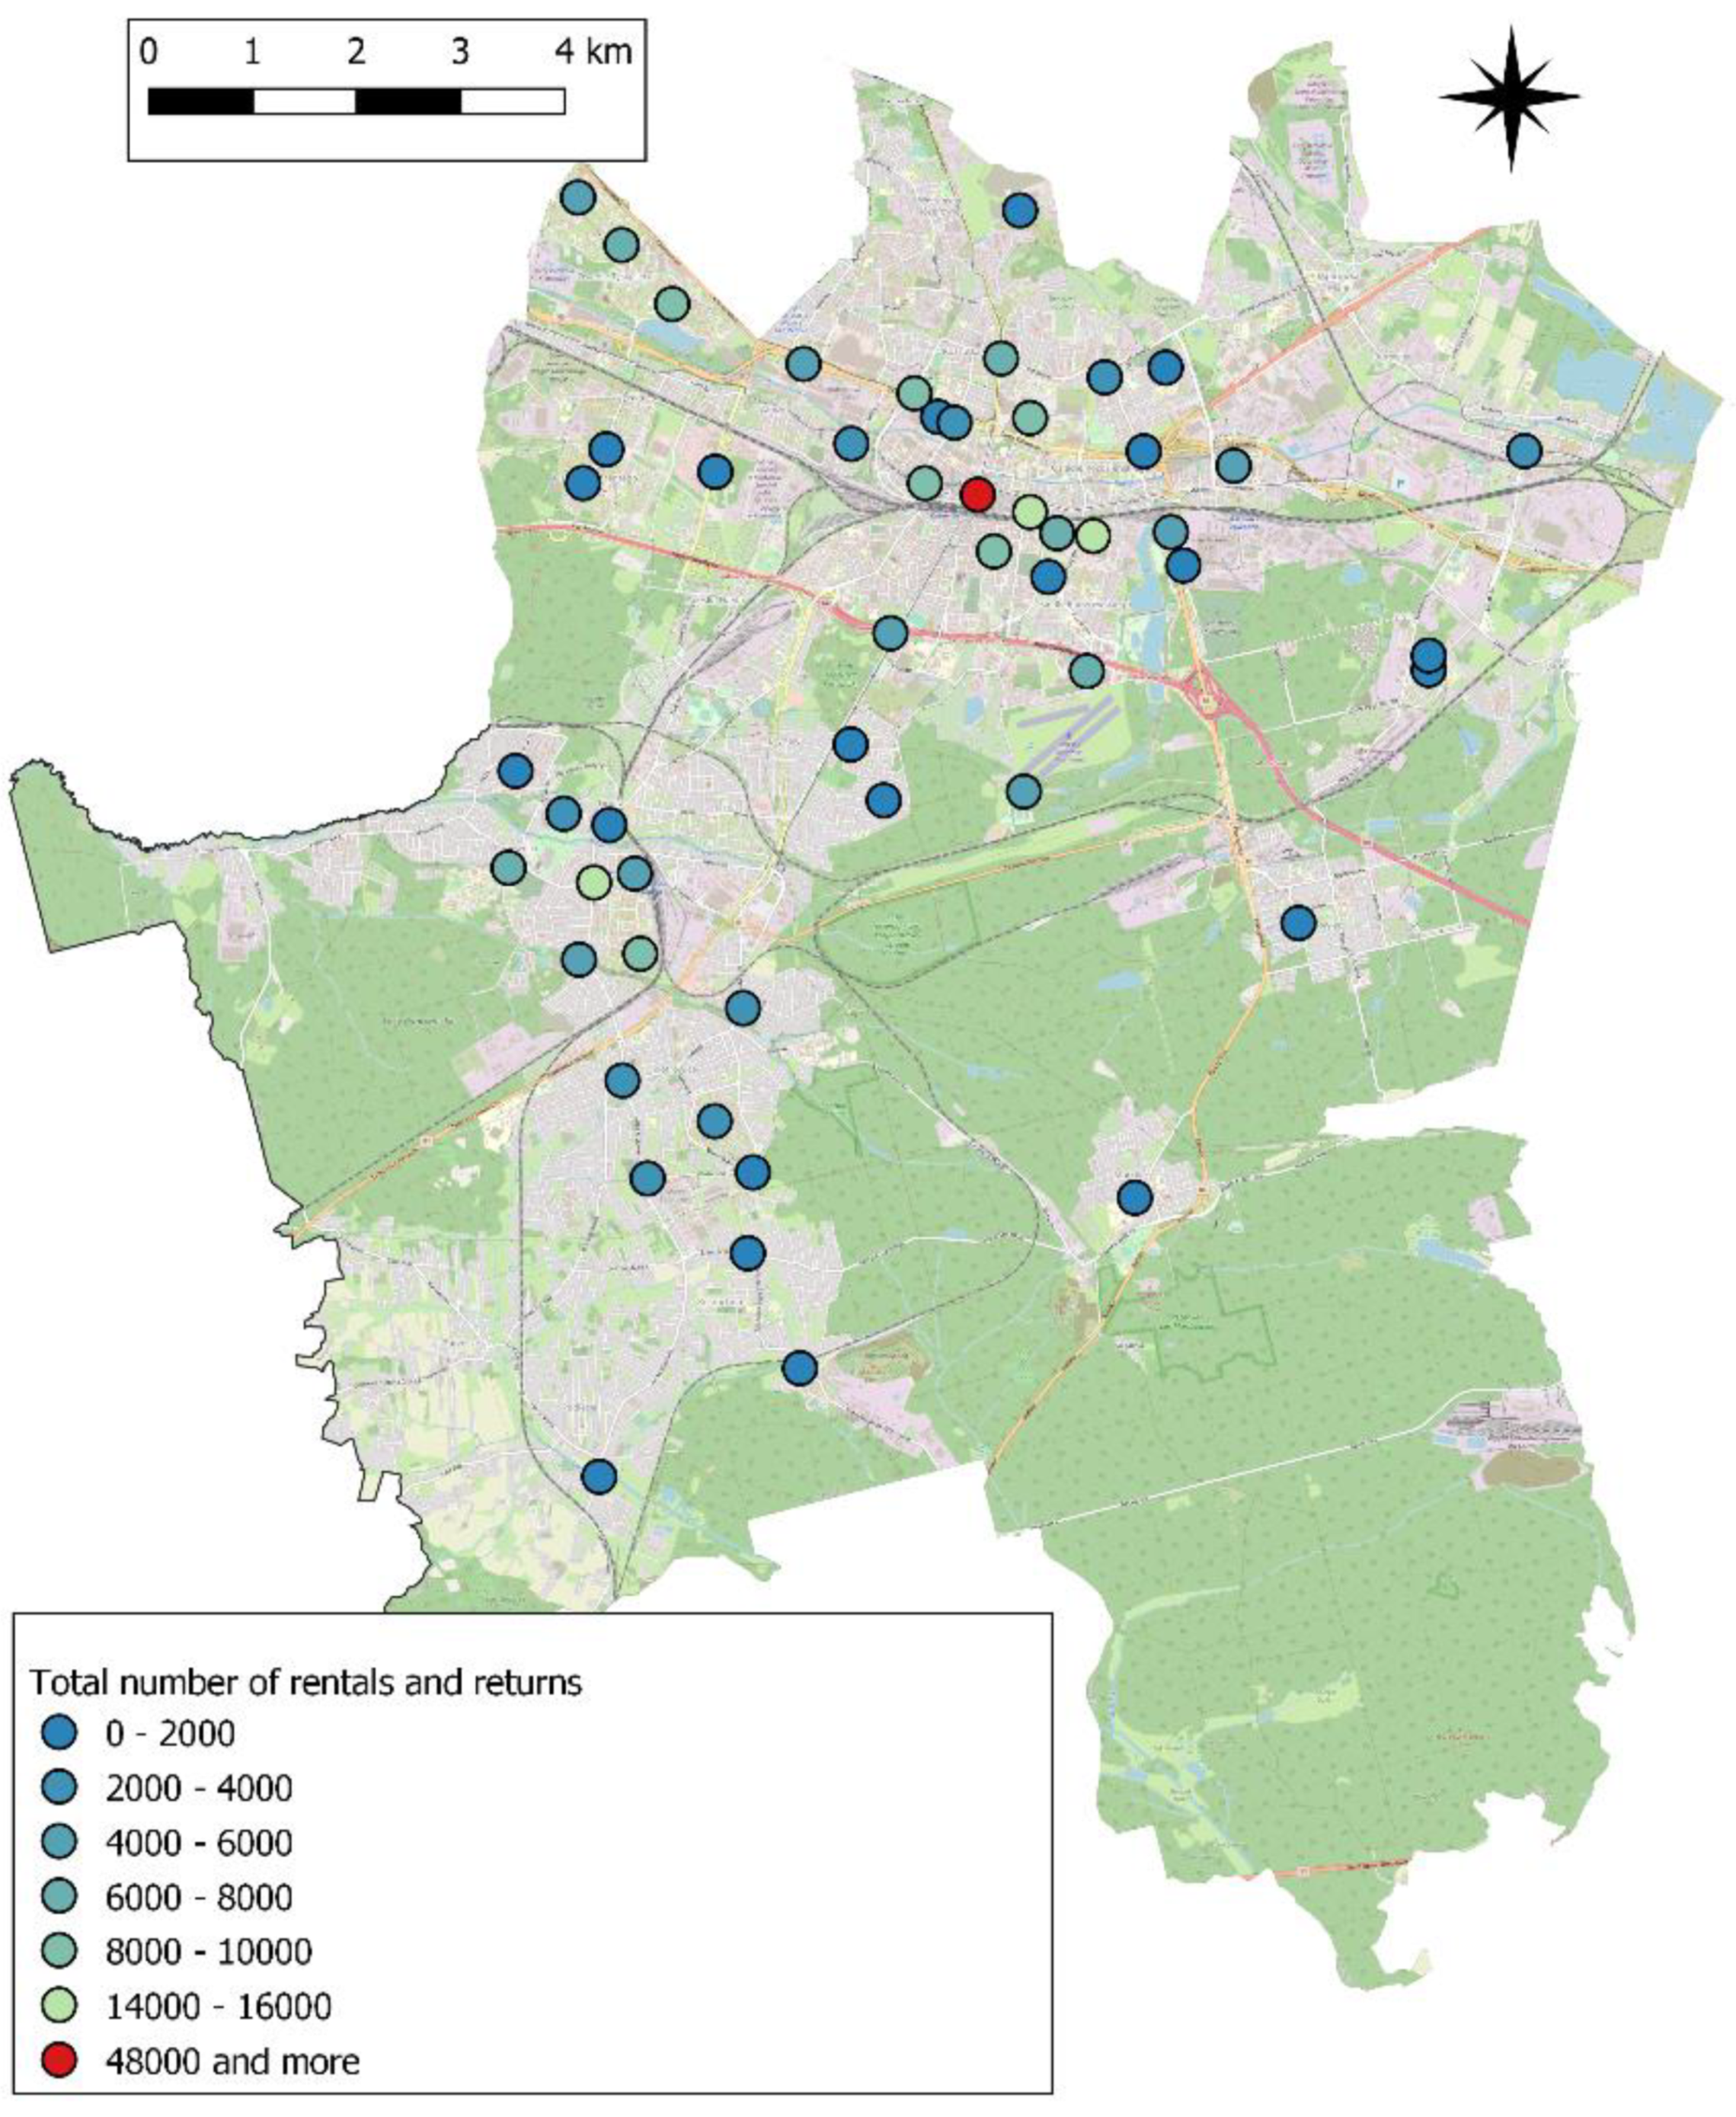
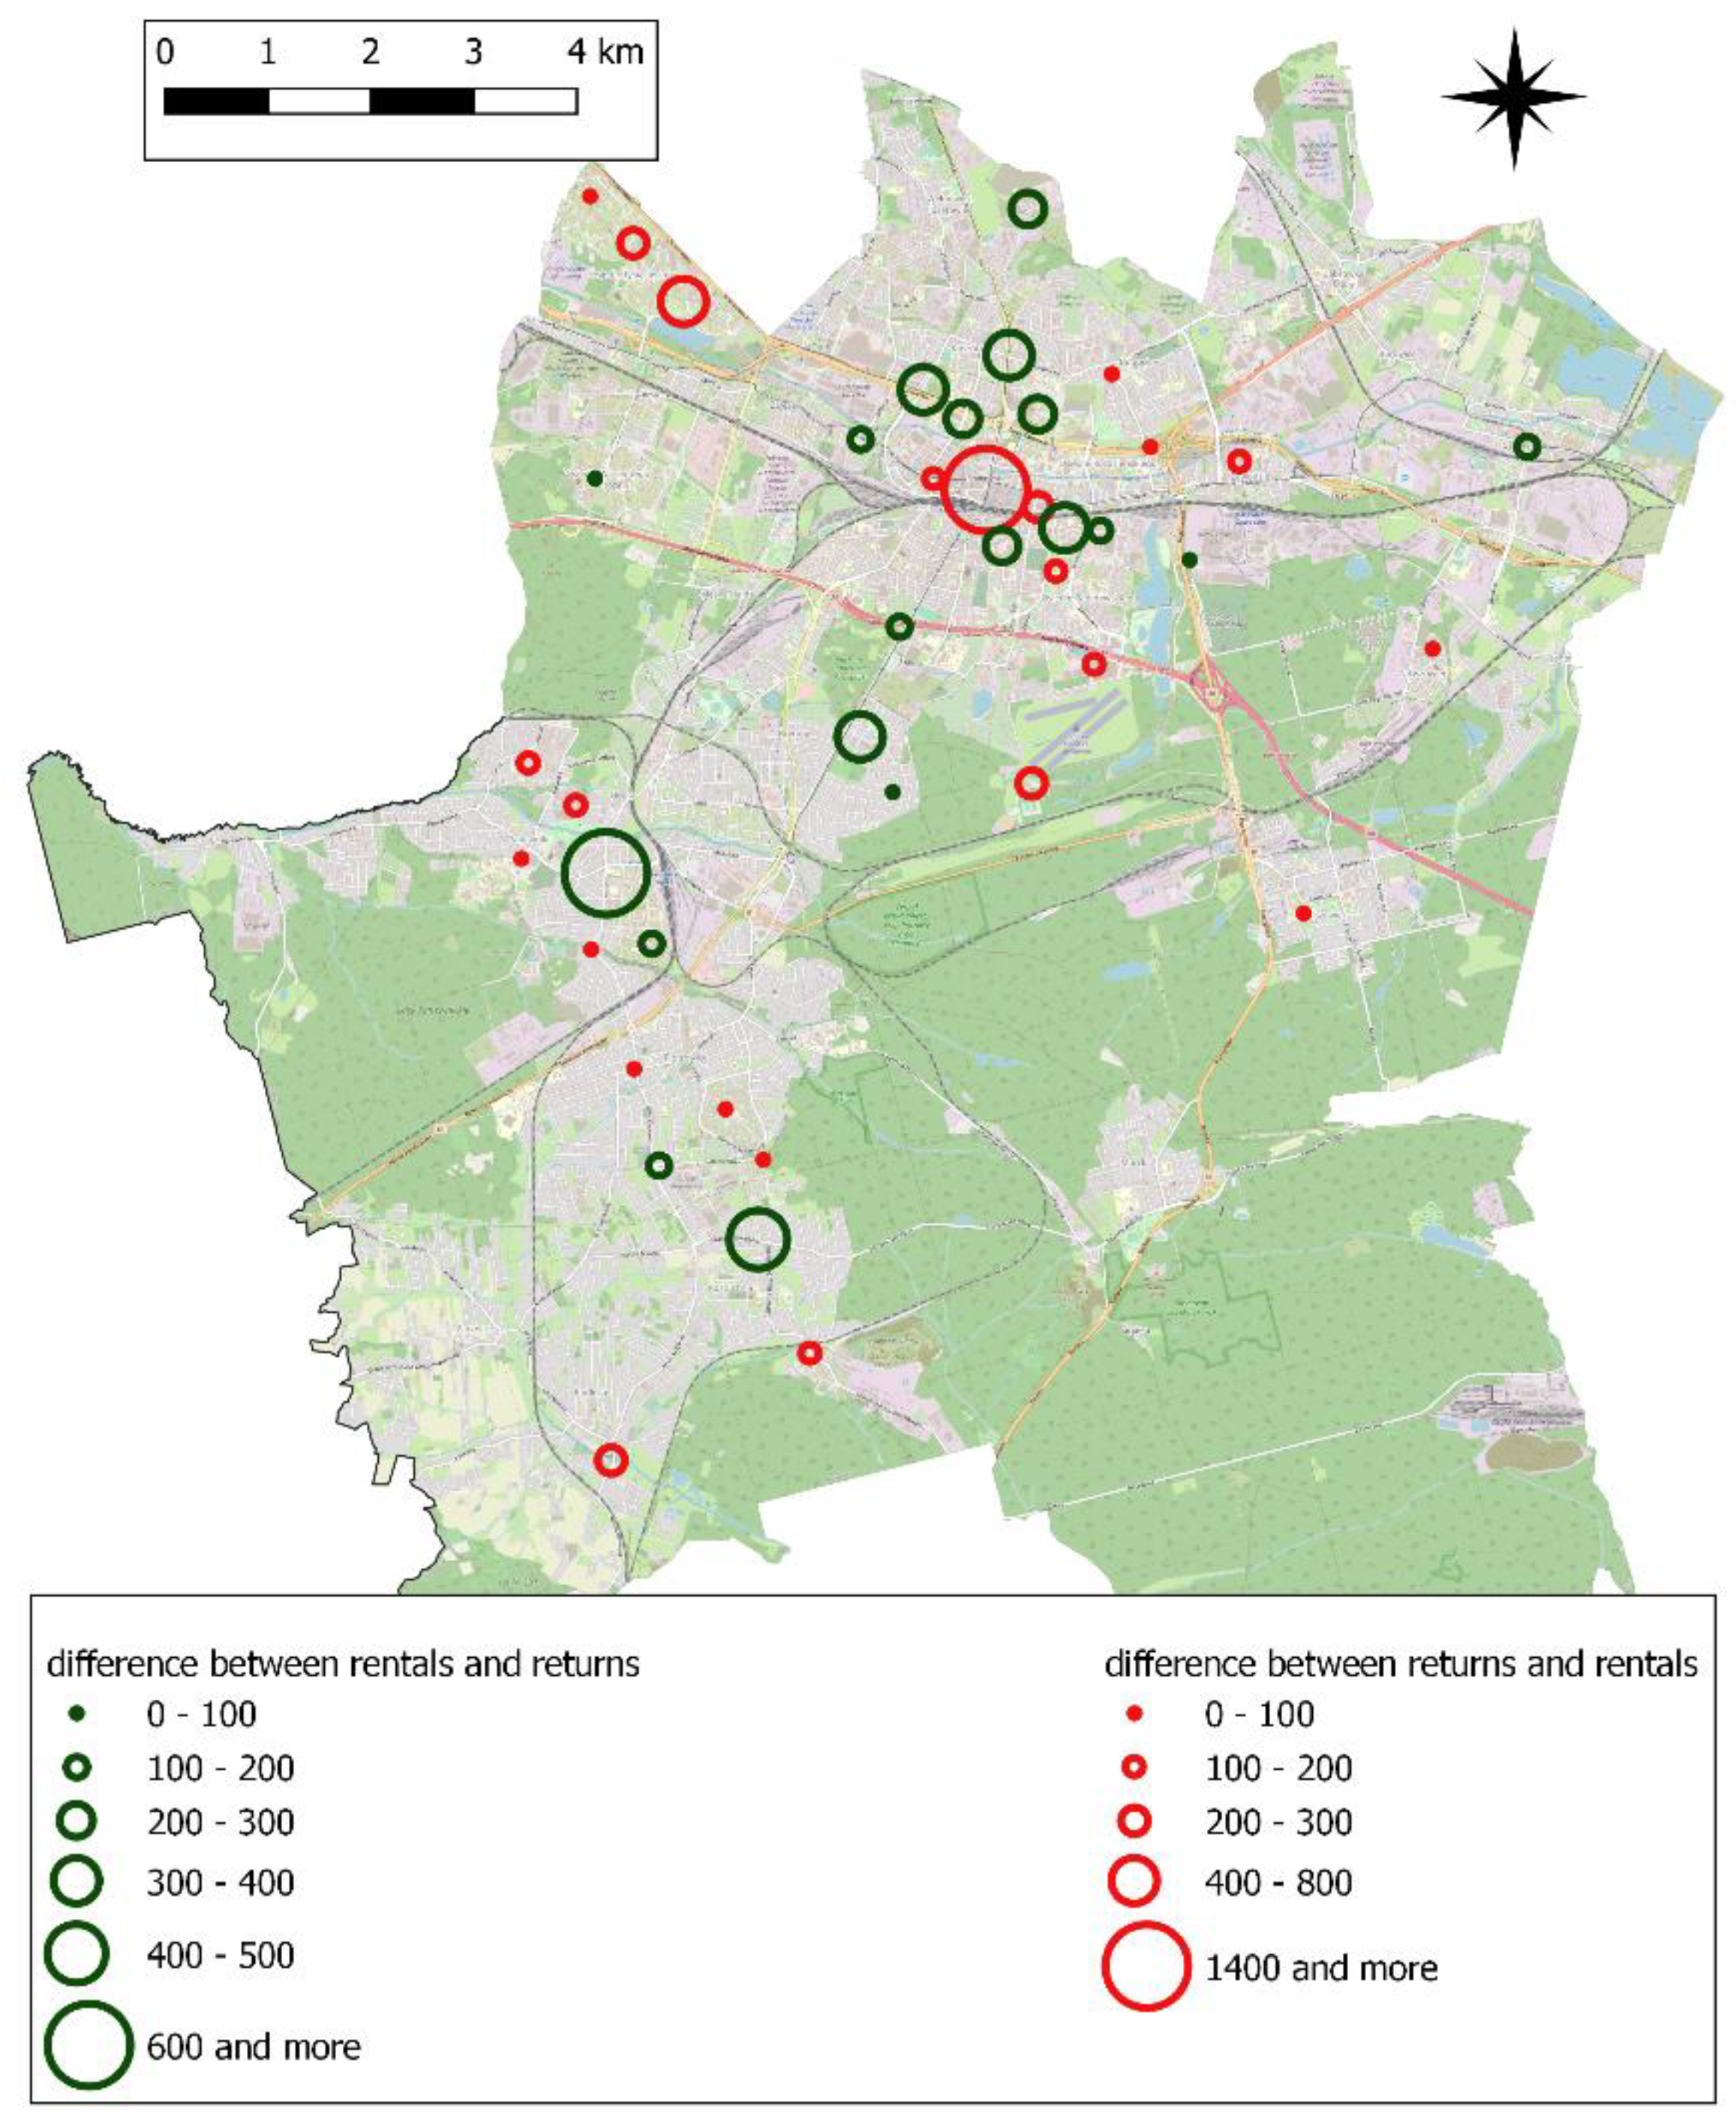
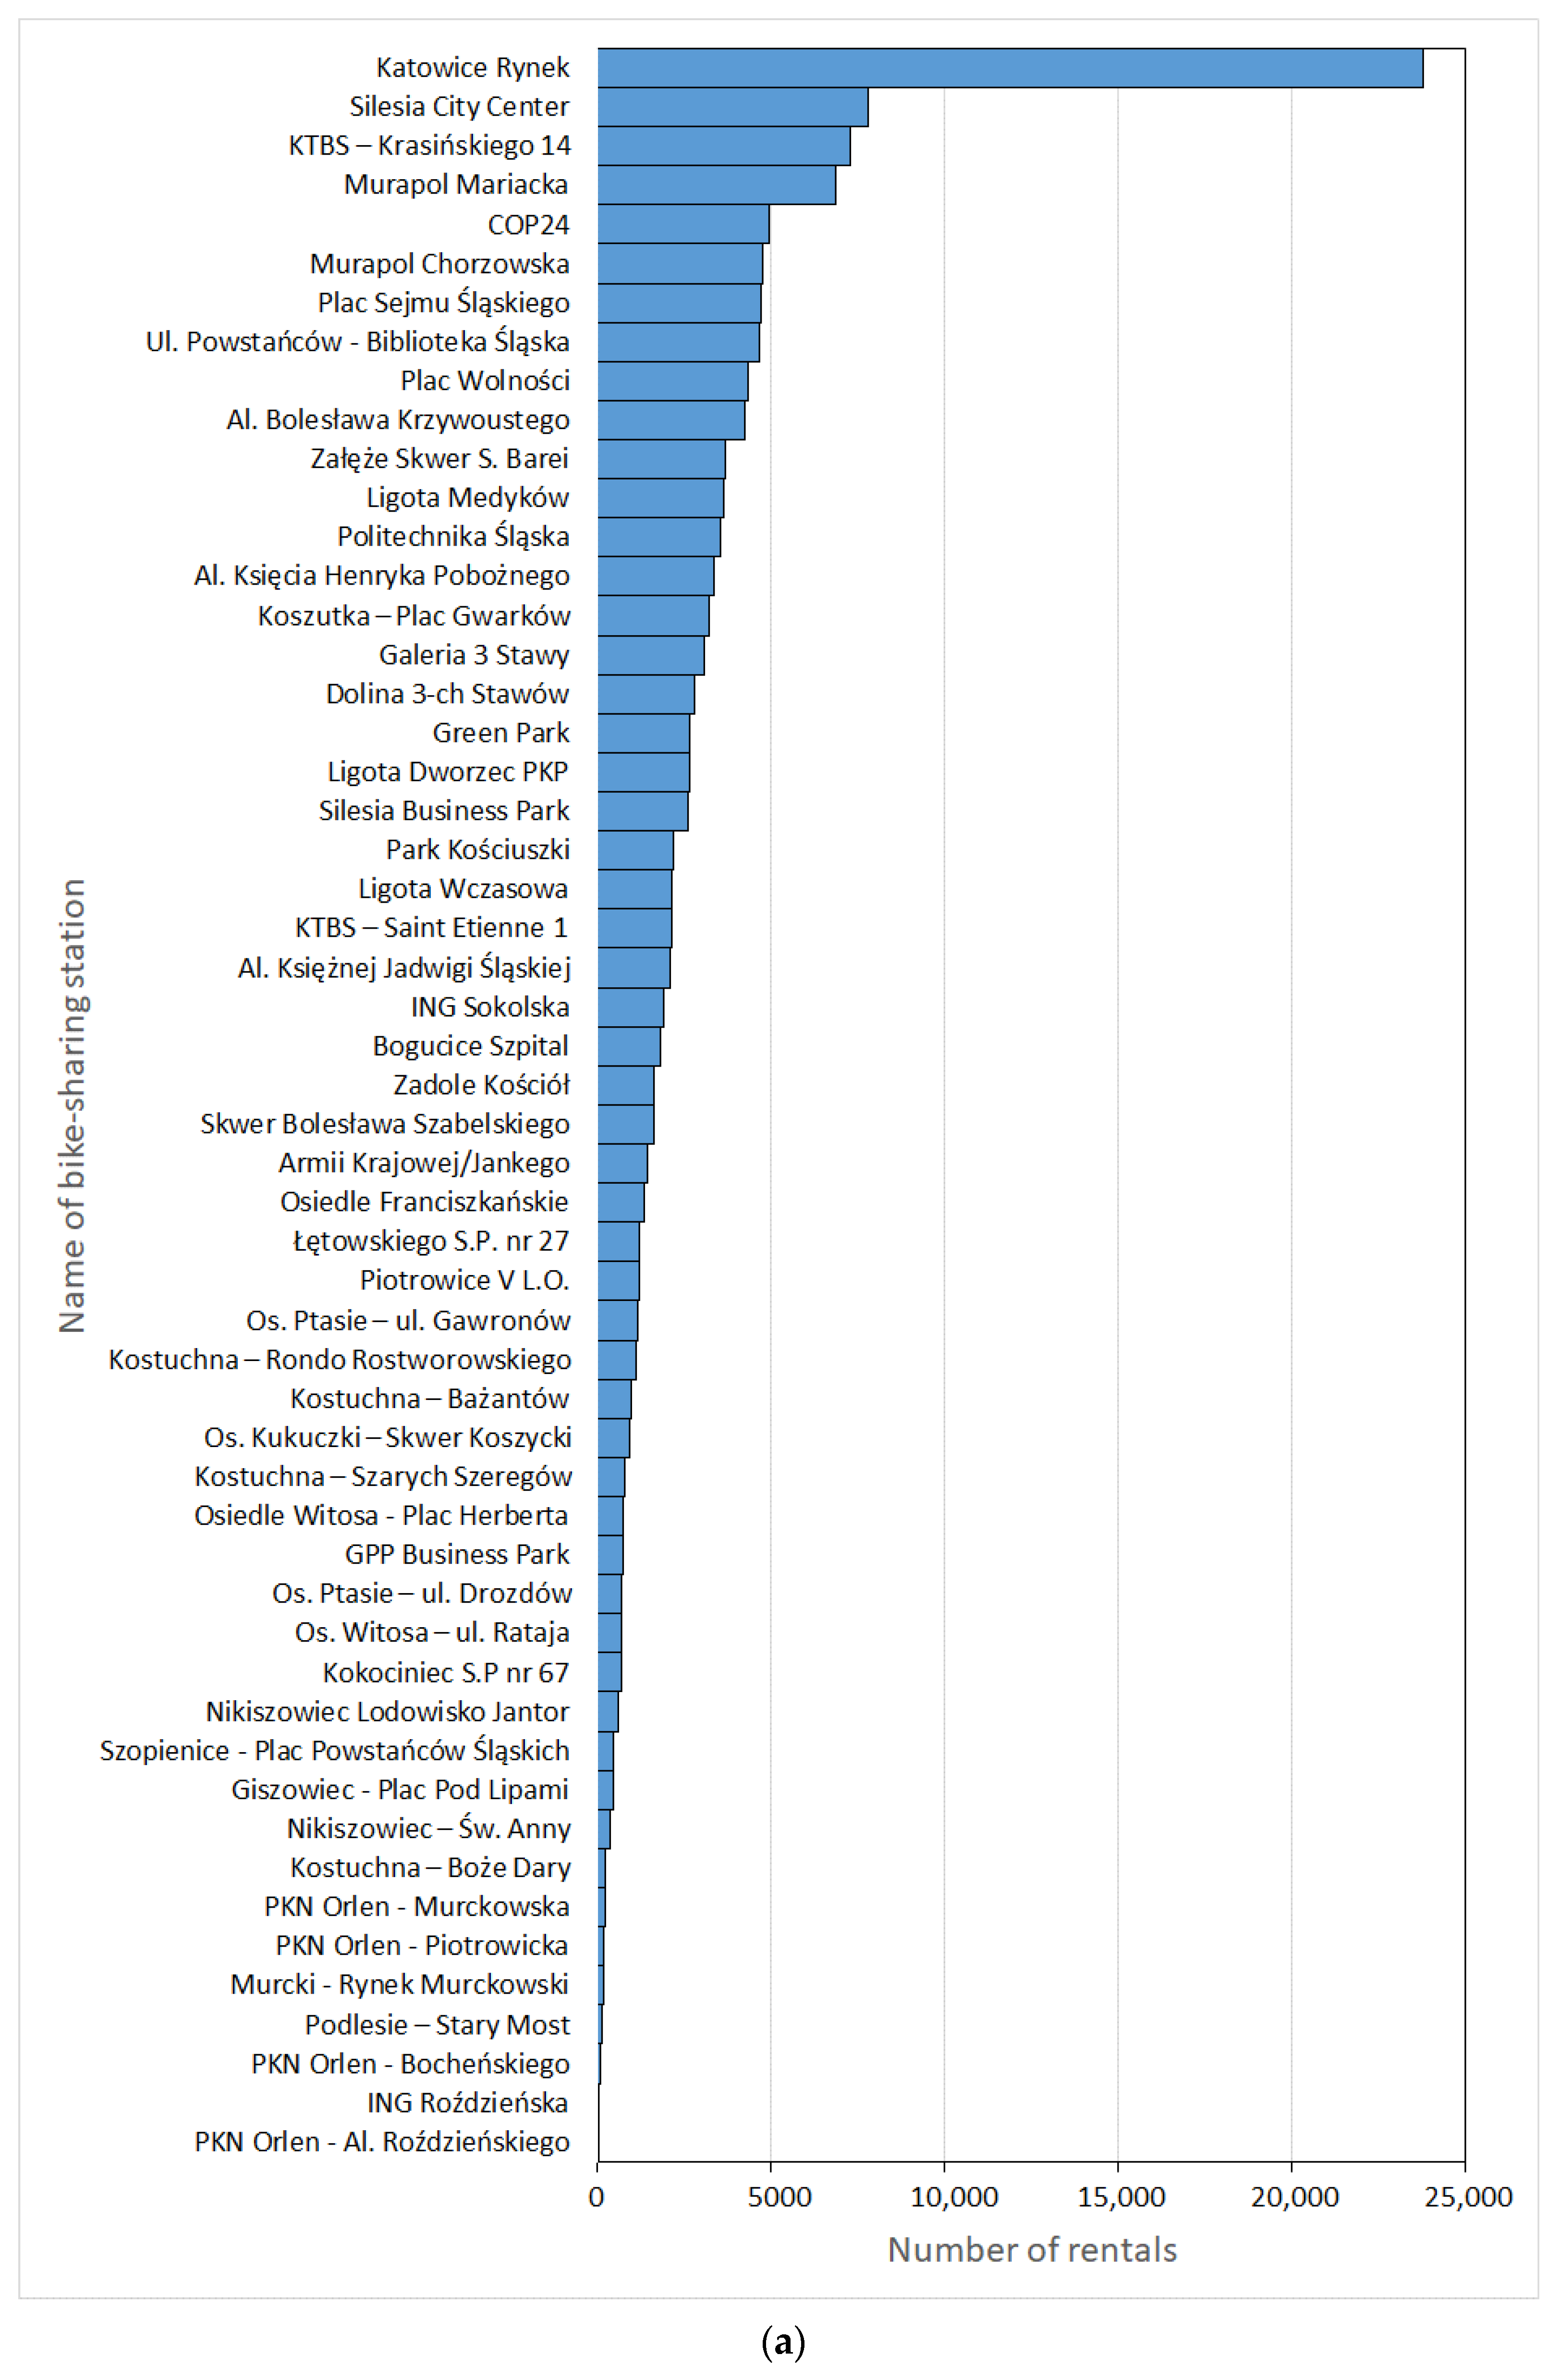
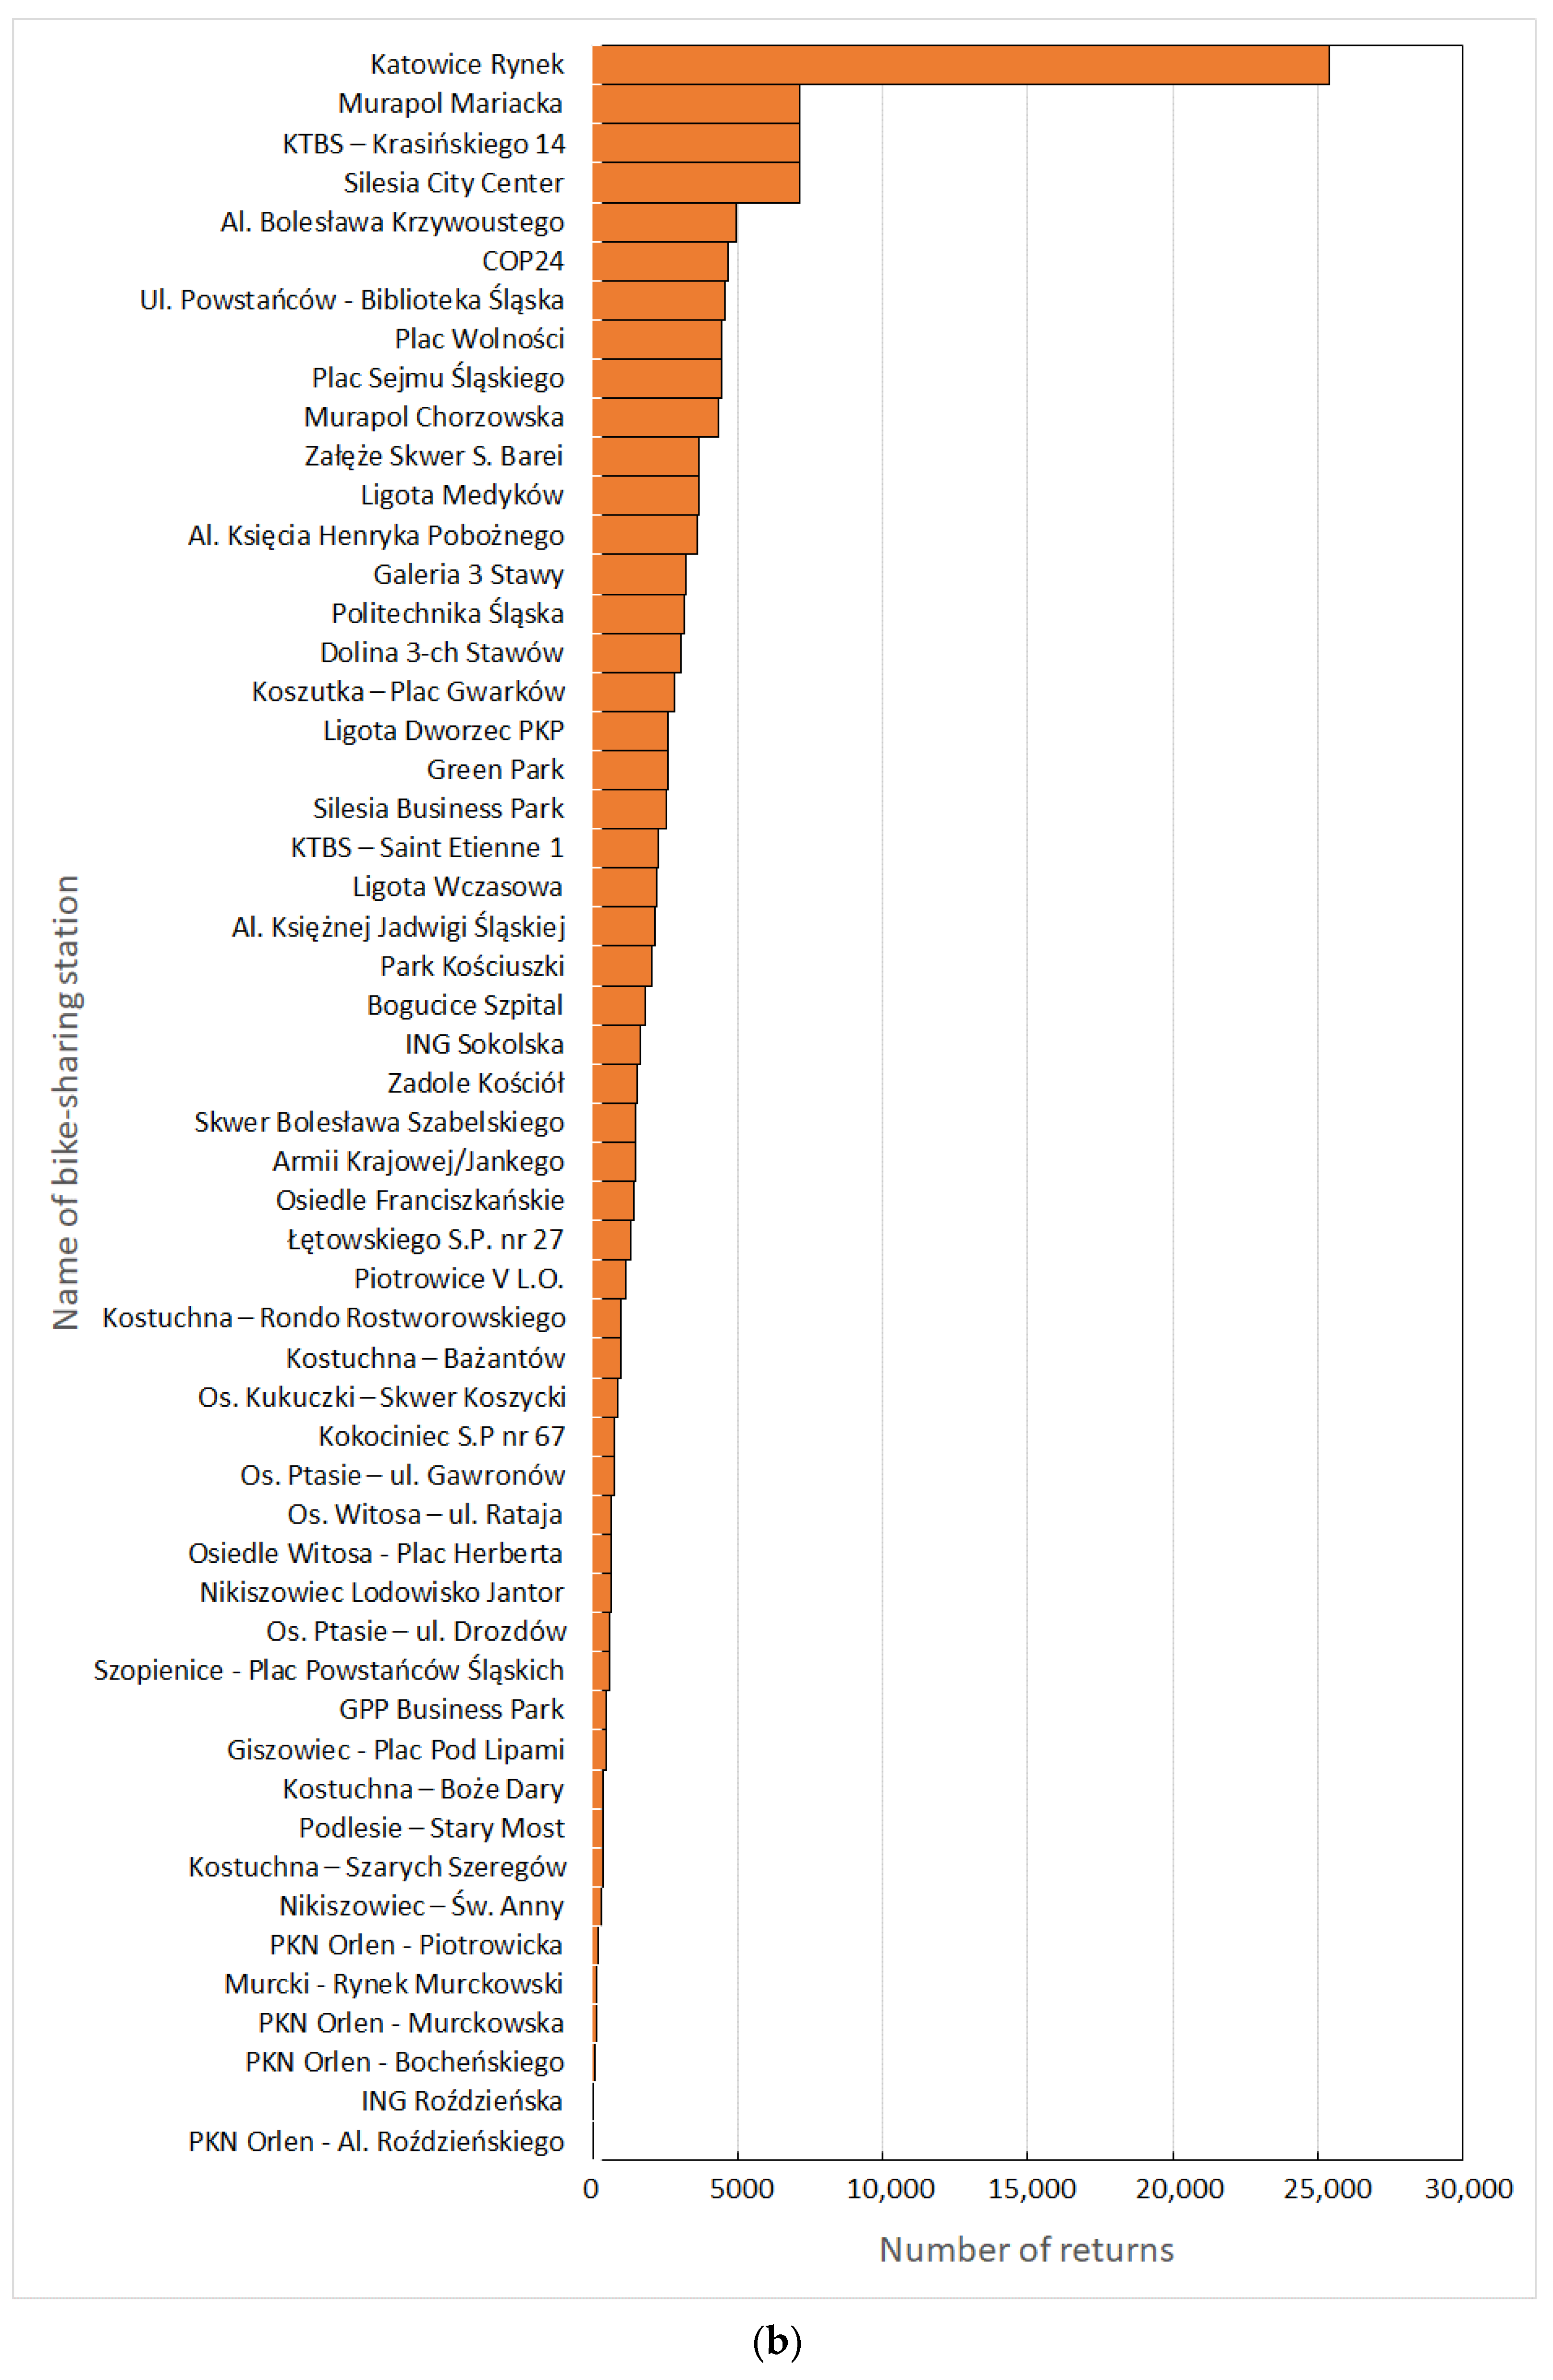
Figure 3 shows the total number of rentals and returns during the rental season. The bike-sharing stations in the system differ in their usability due to their location. Figure 4 presents differences between rentals and returns and between returns and rentals. Only those stations for which the measure had a positive value were considered.
Figure 4 shows clear disproportions between the usability of bike-sharing stations. Some of them are the main starting points for trips, while others are in the vicinity of popular destinations. The rankings of the bike-sharing stations, taking into account the number of rentals and number of returns, are presented in Figure 5a and Figure 5b, respectively. The most popular, both in terms of the number of bike rentals and returns, are the following stations: Katowice Rynek, Silesia City Center, KTBS—Krasińskiego 14, and Murapol Mariacka, with a clear dominance of the station Katowice Rynek. In turn, the lowest usability was noted at the following stations: PKN Orlen—Aleja Roździeńskiego, ING Roździeńska, and PKN Orlen—Bocheńskiego. The average use of bike-sharing stations in Katowice in 2018 was approximately 2100 rentals or returns per station (excluding Katowice Rynek station as an outlier).
The bike-sharing stations were also sorted according to the total number of rentals and returns of the bicycles to make the ranking. The numbers for the three most popular stations and three least popular are presented in Table 4. The full table is provided in Table A1 in Appendix A.
The station in the first place in the ranking, with the highest sum of bike rentals and returns, is located on the market square (Katowice Rynek) in the city center. The next station is in the vicinity of a shopping mall. The third place is located near popular university buildings. All these locations are associated with the objects acting as large traffic generators. Two of the last three stations are in the vicinity of petrol stations. The number of bikes rented in these places indicates an unattractive location for bicycle stations.
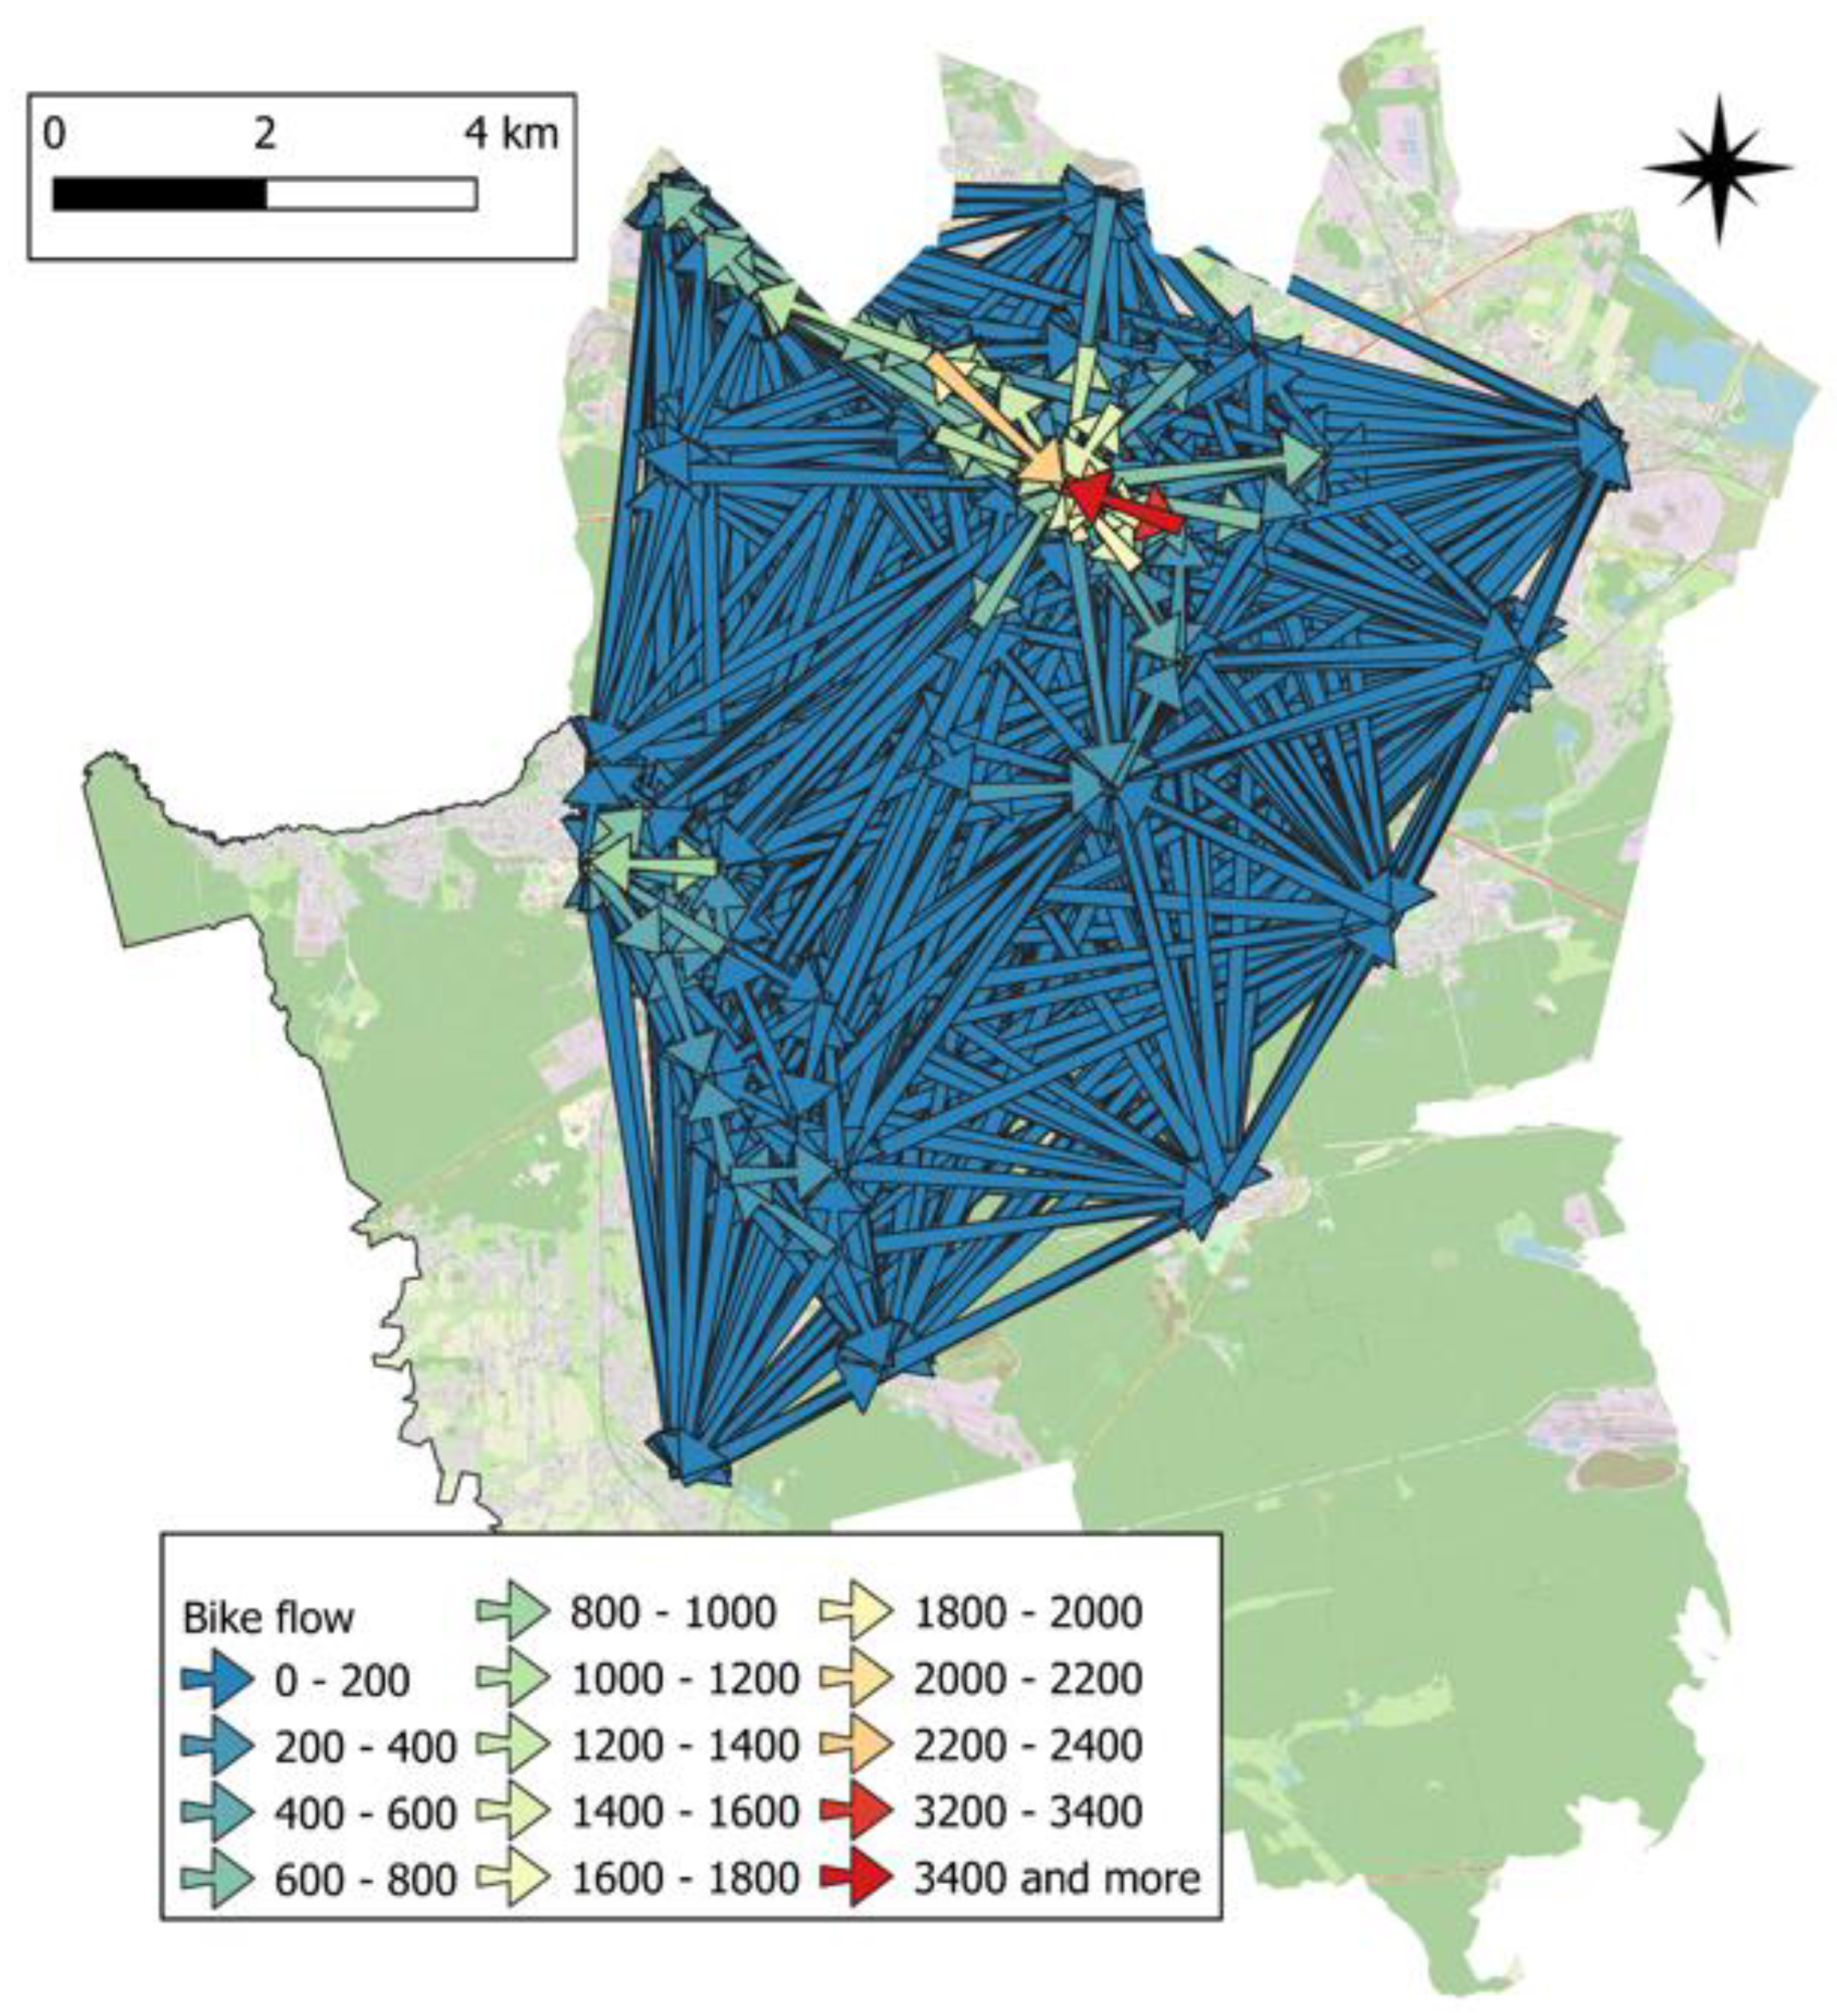
Figure 6 shows a two-way bicycle traffic pattern for all inter-station connections in the analyzed area. It shows the spatial distribution of traffic between each pair of stations without considering the road and street network. The color (from blue to red) of the arrow represents the number of bicycle trips between stations in each direction. To increase the transparency of the drawing, the most popular connections are displayed above those that are less used.
In total, 2862 relations may be determined in dense and connective road and street network with 54 bike-sharing stations (without cases where the bicycle is rented from and returned to the same station). In the analyzed period, 136,124 trips were made for 2087 of 2862 possible relations. Figure 6 reveals a high intensity of cycling in the northern part of the city (where the functional city center is located) and slightly in the south-western part of the city (with two large hospitals and an academic center). On the other hand, in 2018, less than 100 bicycle trips were made for over 1800 connections between bike-sharing stations.
In order to determine potential sections of the road and street network that require infrastructure improvement and adapting to bicycle traffic, 23 of the most heavily loaded relations for which the number of trips in the analyzed period exceeded 1000 were selected. These 23 relations are responsible for more than 25% of trips. Table 5 shows all selected relations with the number of trips between bike-sharing stations for each of them.
The selected relations connecting pairs of bike-sharing stations with the heaviest bicycle traffic are two-way relations. These relations were considered in further analysis, the purpose of which was to identify sections of road and street networks that require, in the first place, modernization of infrastructure in terms of bikeability. The overlapping of network sections resulting from common parts of paths between stations increases the volume of bicycles on a given road section.
For each of the indicated pairs of bike-sharing stations, a path was determined using the plug-in for QGIS: ORS Tools software which works based on the OpenRouteService [52]. After selecting two points on the map using the OpenRouteServices API, the path was searched according to the selected criterion (i.e., length) using parameterized sections archived on the OSM website. It allows to choose, considering the conditions and goals of the research, the following modes of paths search:
- normal—which uses a default set of speeds and road type preferences,
- electric—in which uphill speed is not affected as much by the incline,
- road—in which anything that is not the road pavement (i.e., paving stone, asphalt, etc.) is seen as a pushing section but allows for secondary and tertiary roads (other bike profiles are avoided),
- mountain—which allows going over most pavement types and tracks without defining as a pushing section,
- cycling-safe—which only applies to cycling paths.
Additionally, for each type of path, a time or distance criterion can be specified. After initial research, the normal mode was selected for the analysis and the length of the path was applied as the criterion for selecting the optimal one. The selected parameter makes it possible to determine the path in a way similar to reality. In the studied area, there are no direct bicycle connections between all bike-sharing stations and, therefore, a significant part of travelers also uses the areas shared with pedestrians or car traffic.
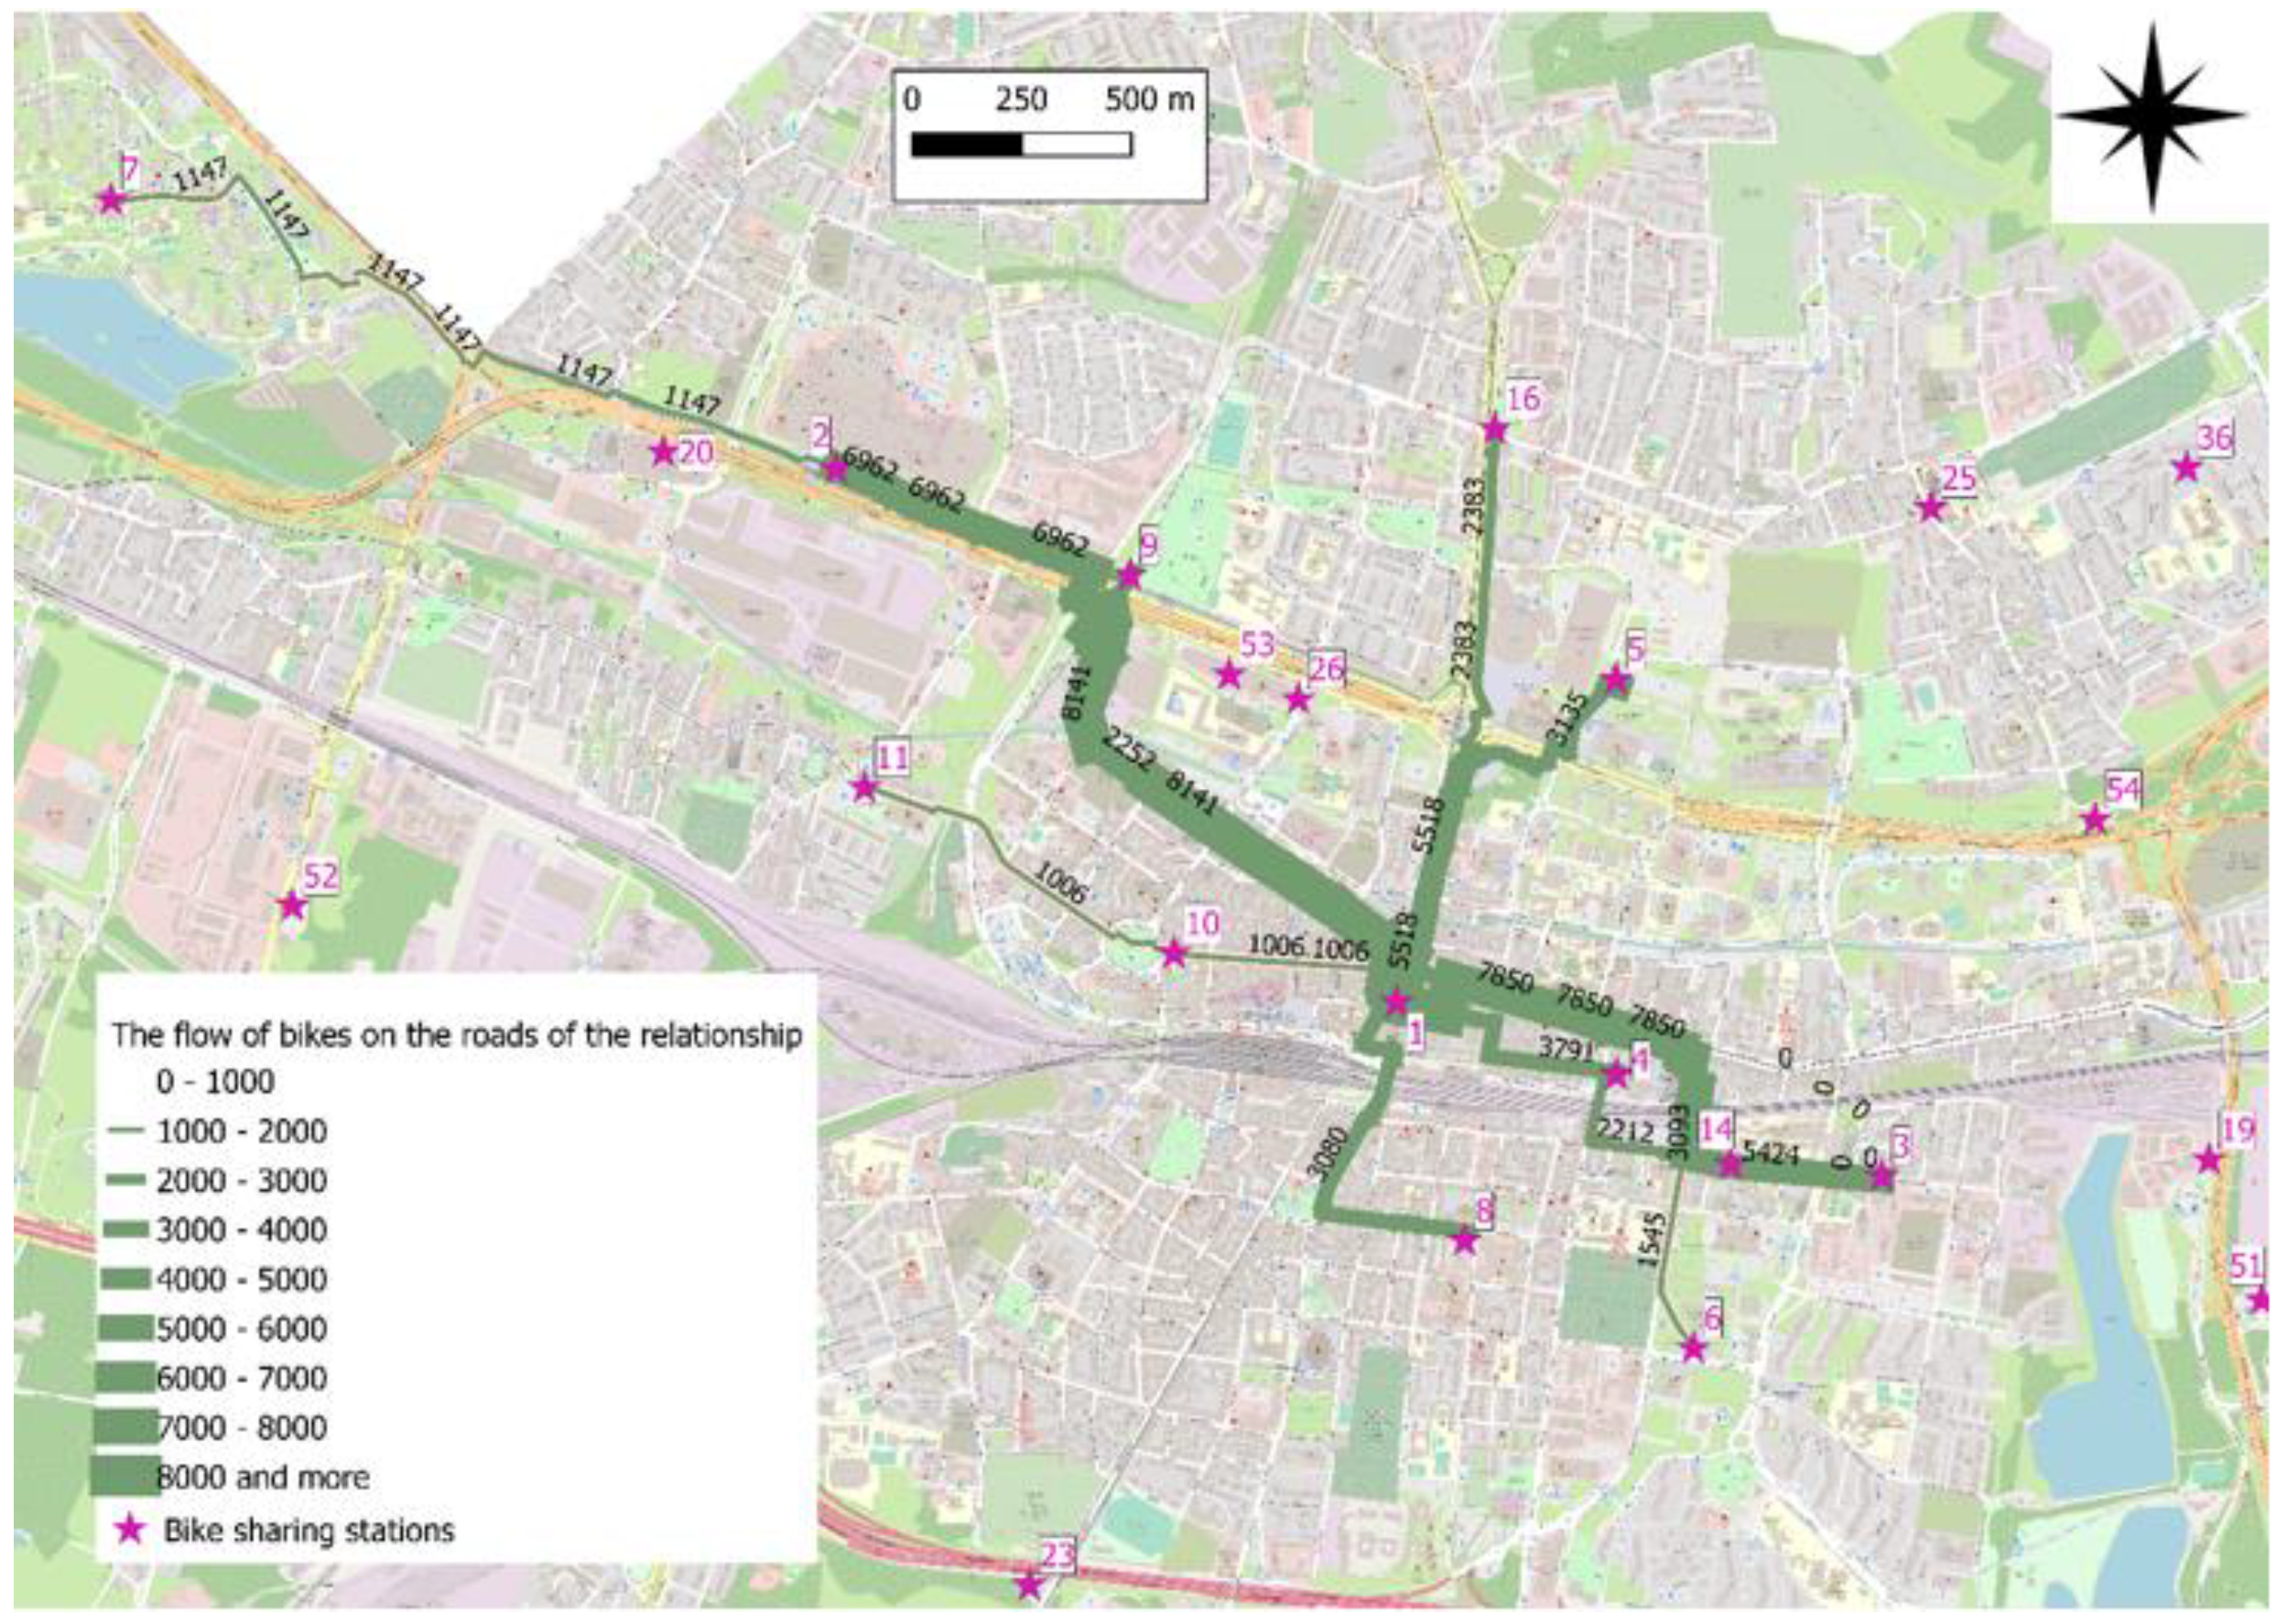
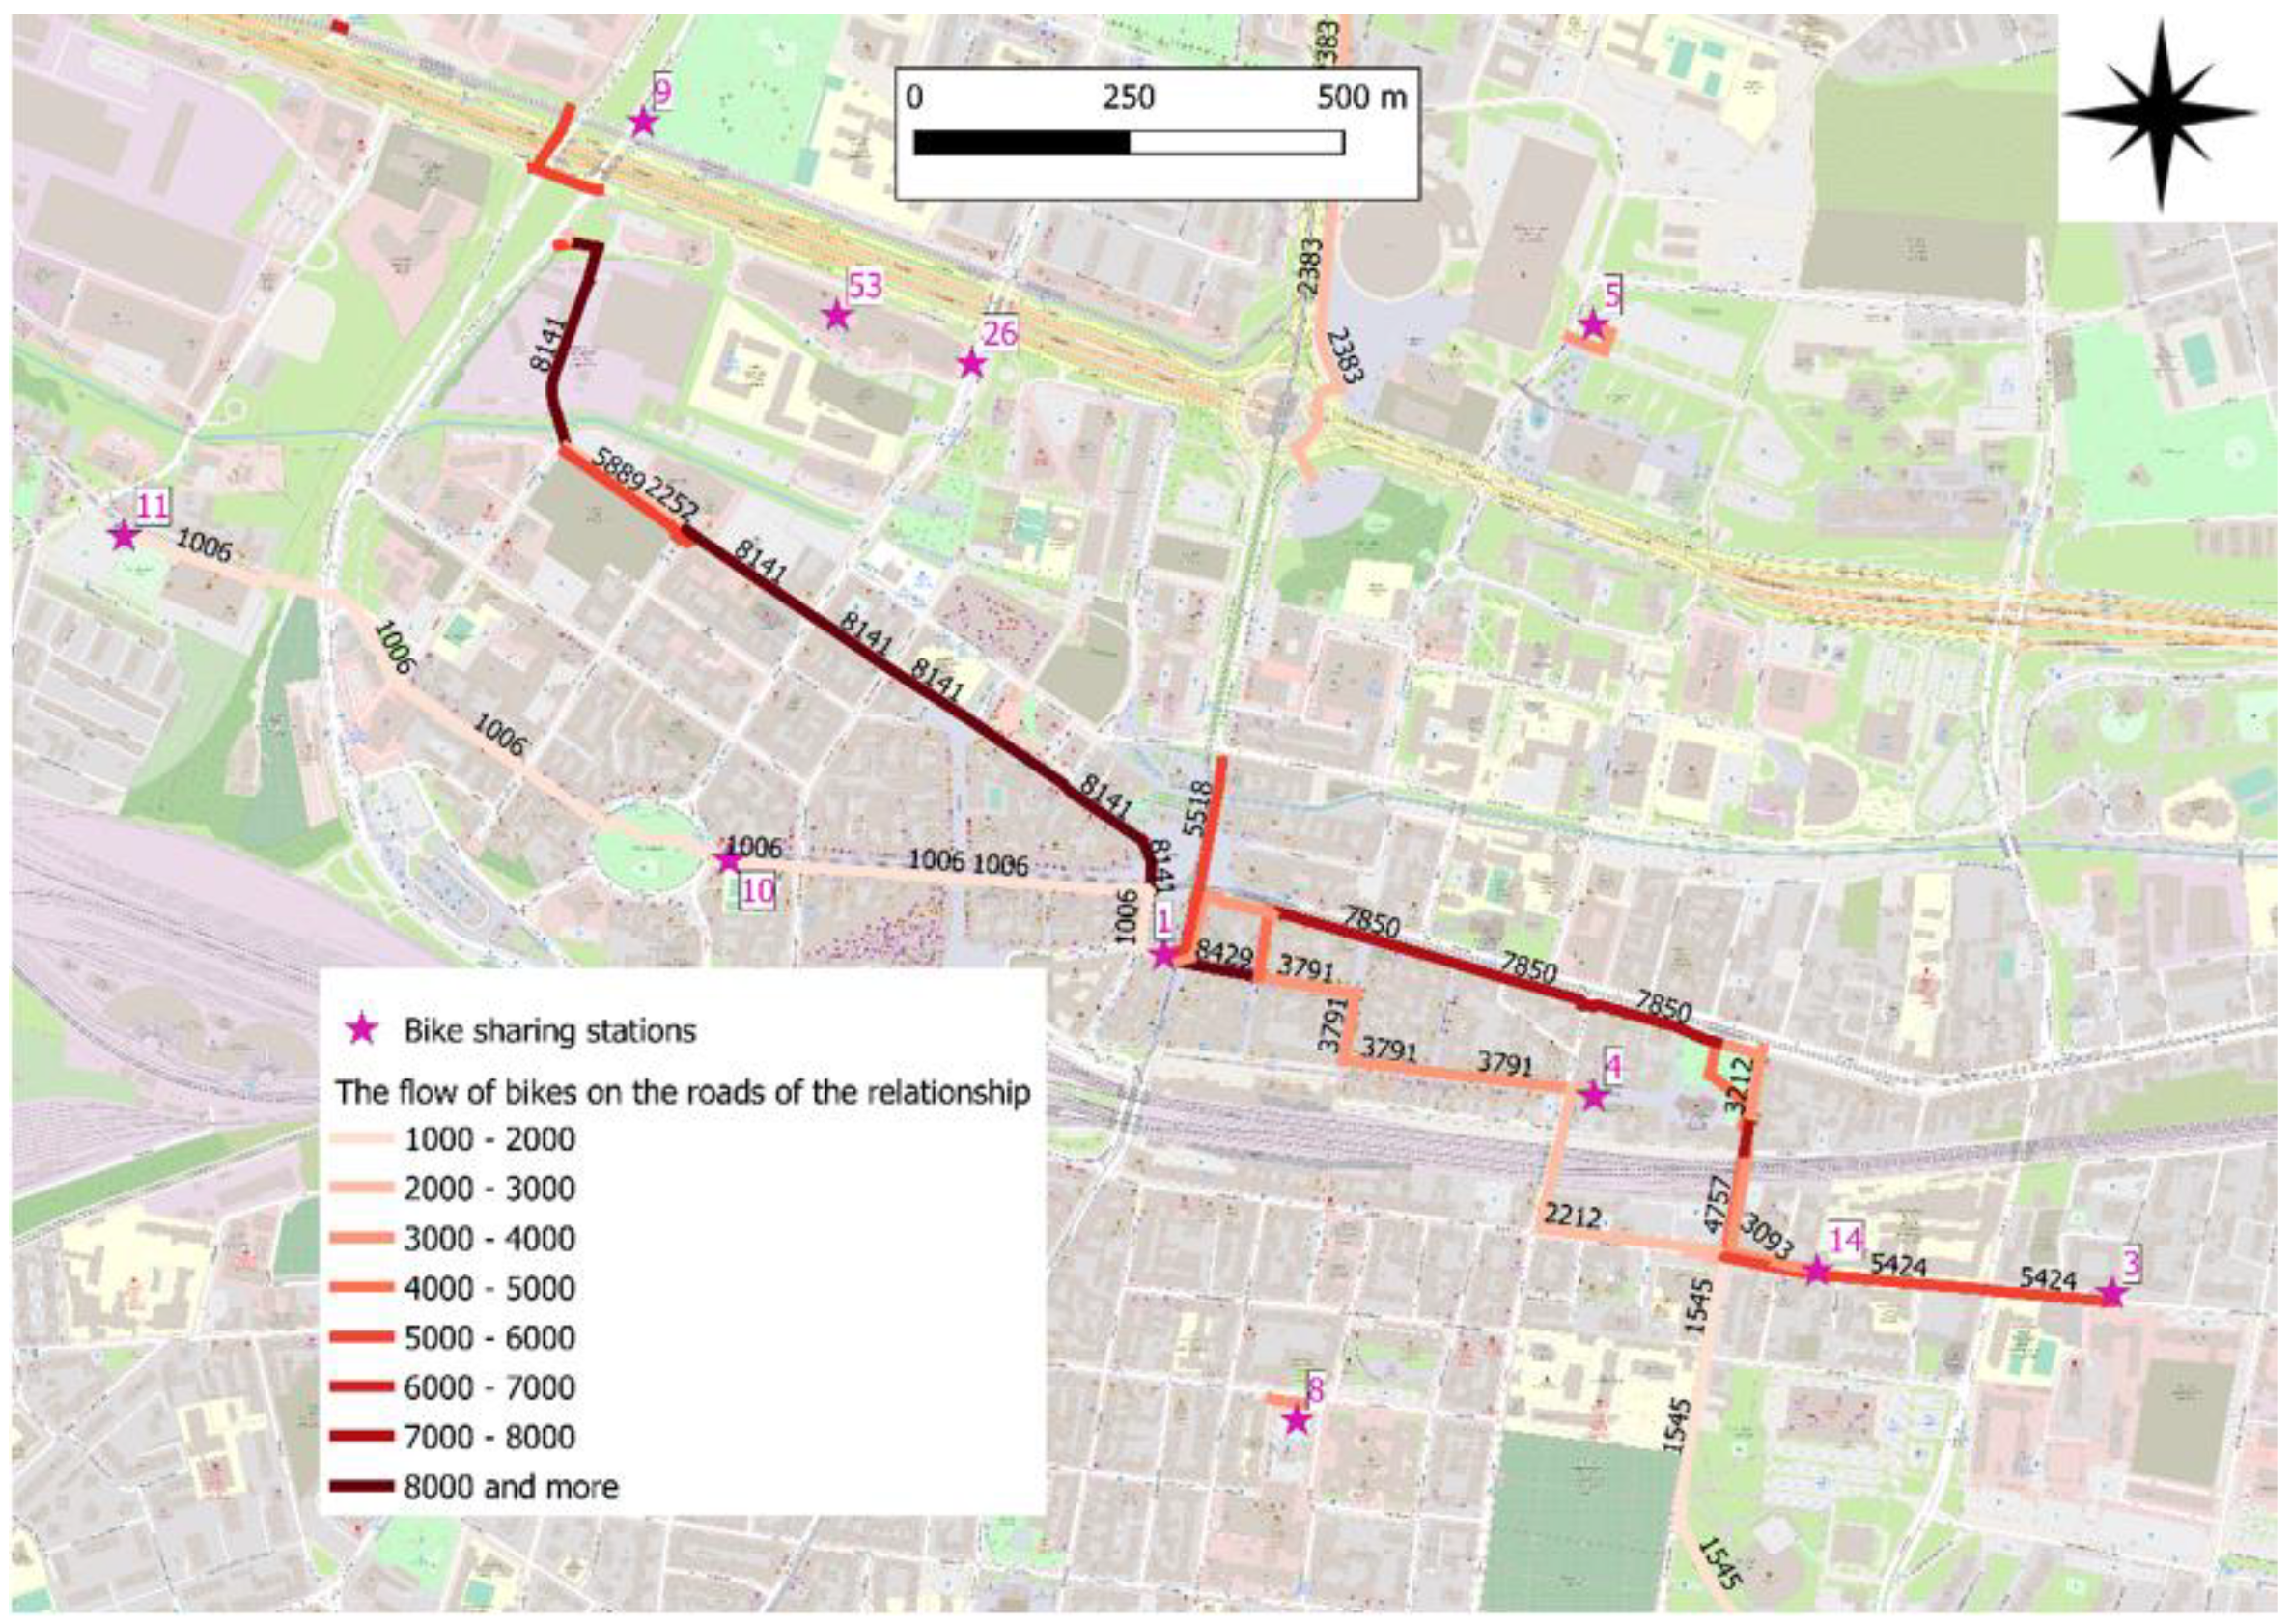
As a result, for each pair of bike-sharing stations, the optimal path was determined. Figure 7 shows the locations of bike-sharing stations with the optimal paths between them.
Spatial analysis showed that most of the paths have a common point in the Katowice Rynek station (city square). Table 6 shows the lengths of the optimal paths for each pair of bike-sharing stations and the percentage share of lengths of sections of individual categories in total length of the path between the pair of stations (measure ). The average length of the 23 most frequently used paths is 1278 (m).
The longest analyzed path is 2163.7 m and is located between the second station (Silesia City Center) and the first bike-sharing station (Katowice Rynek). It is the third link according to the bicycle traffic load. There are no sections of the IVb and Vb categories in any connection. For the three paths (IDL: 10, 13, 20) it is possible to complete the trip almost entirely using bicycle paths. On the other hand, in the case of 11 of the analyzed 23 paths, there is no section categorized as a bicycle path. For two connections between bike-sharing stations (IDL: 1, 15), it is necessary to overcome the stairs. Apart from bicycle paths, the most frequently used in the analyzed area are sidewalks (29.6% on average) and pedestrian zones (20.2% on average).
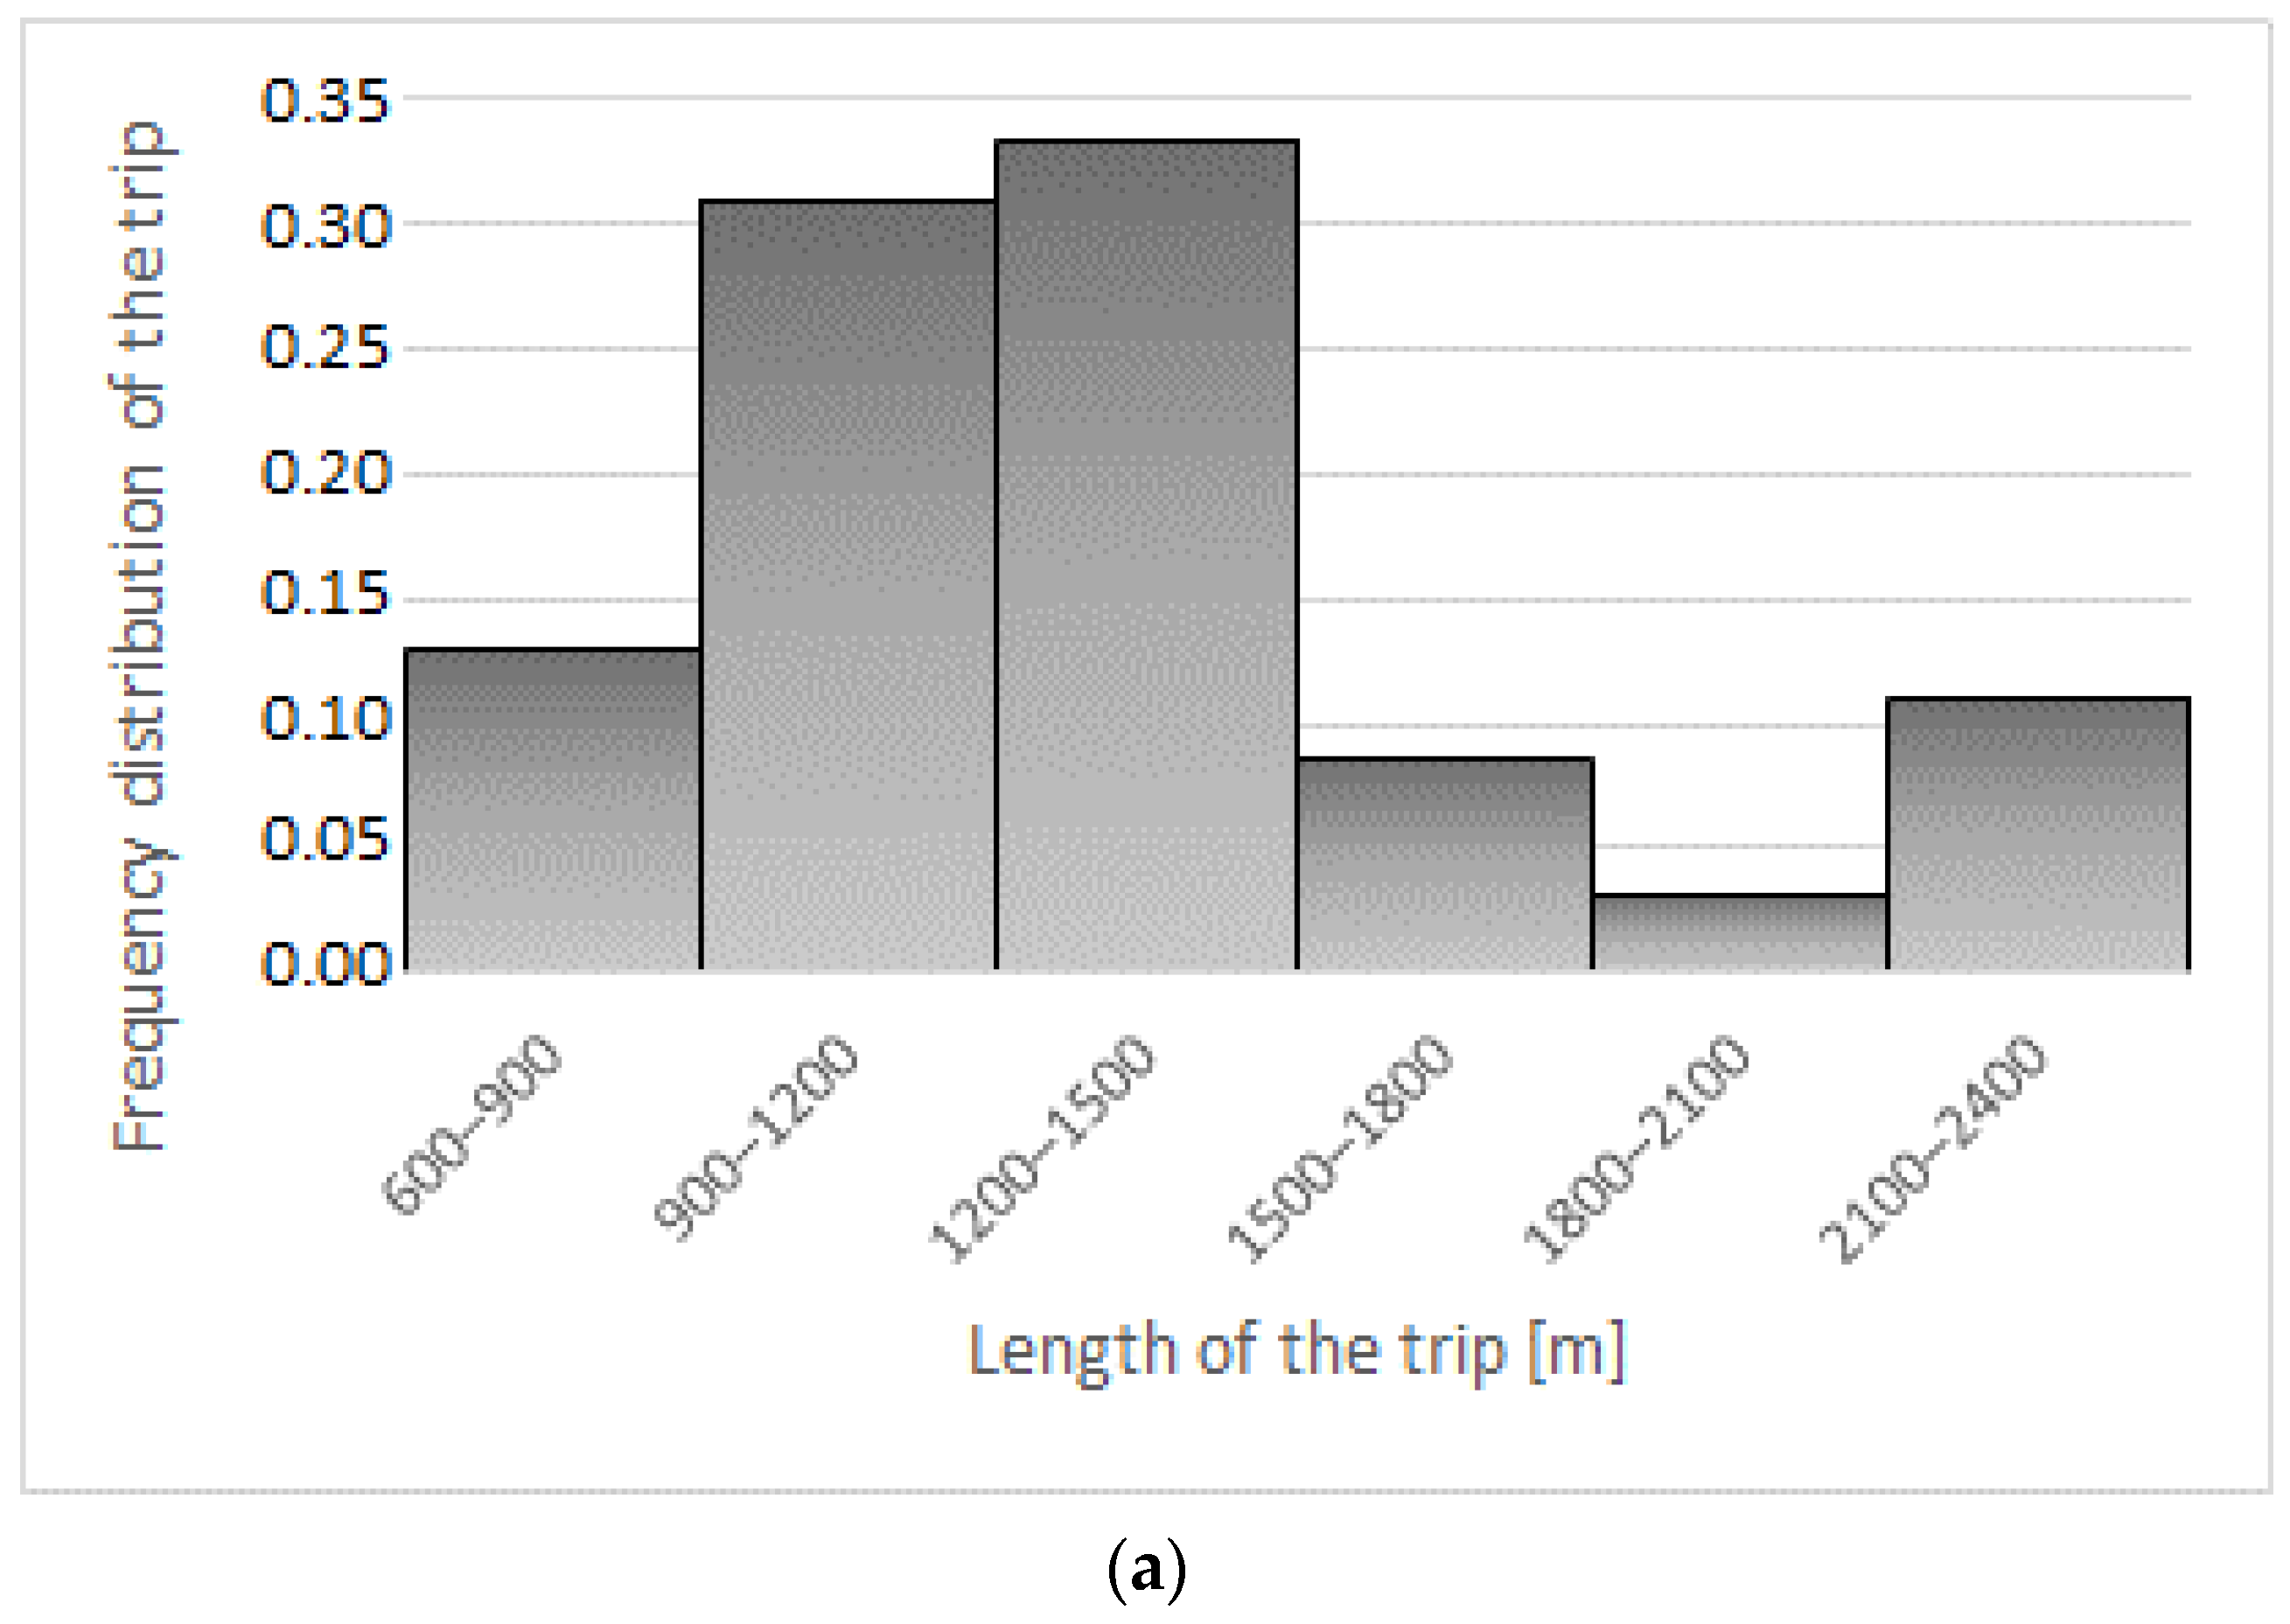
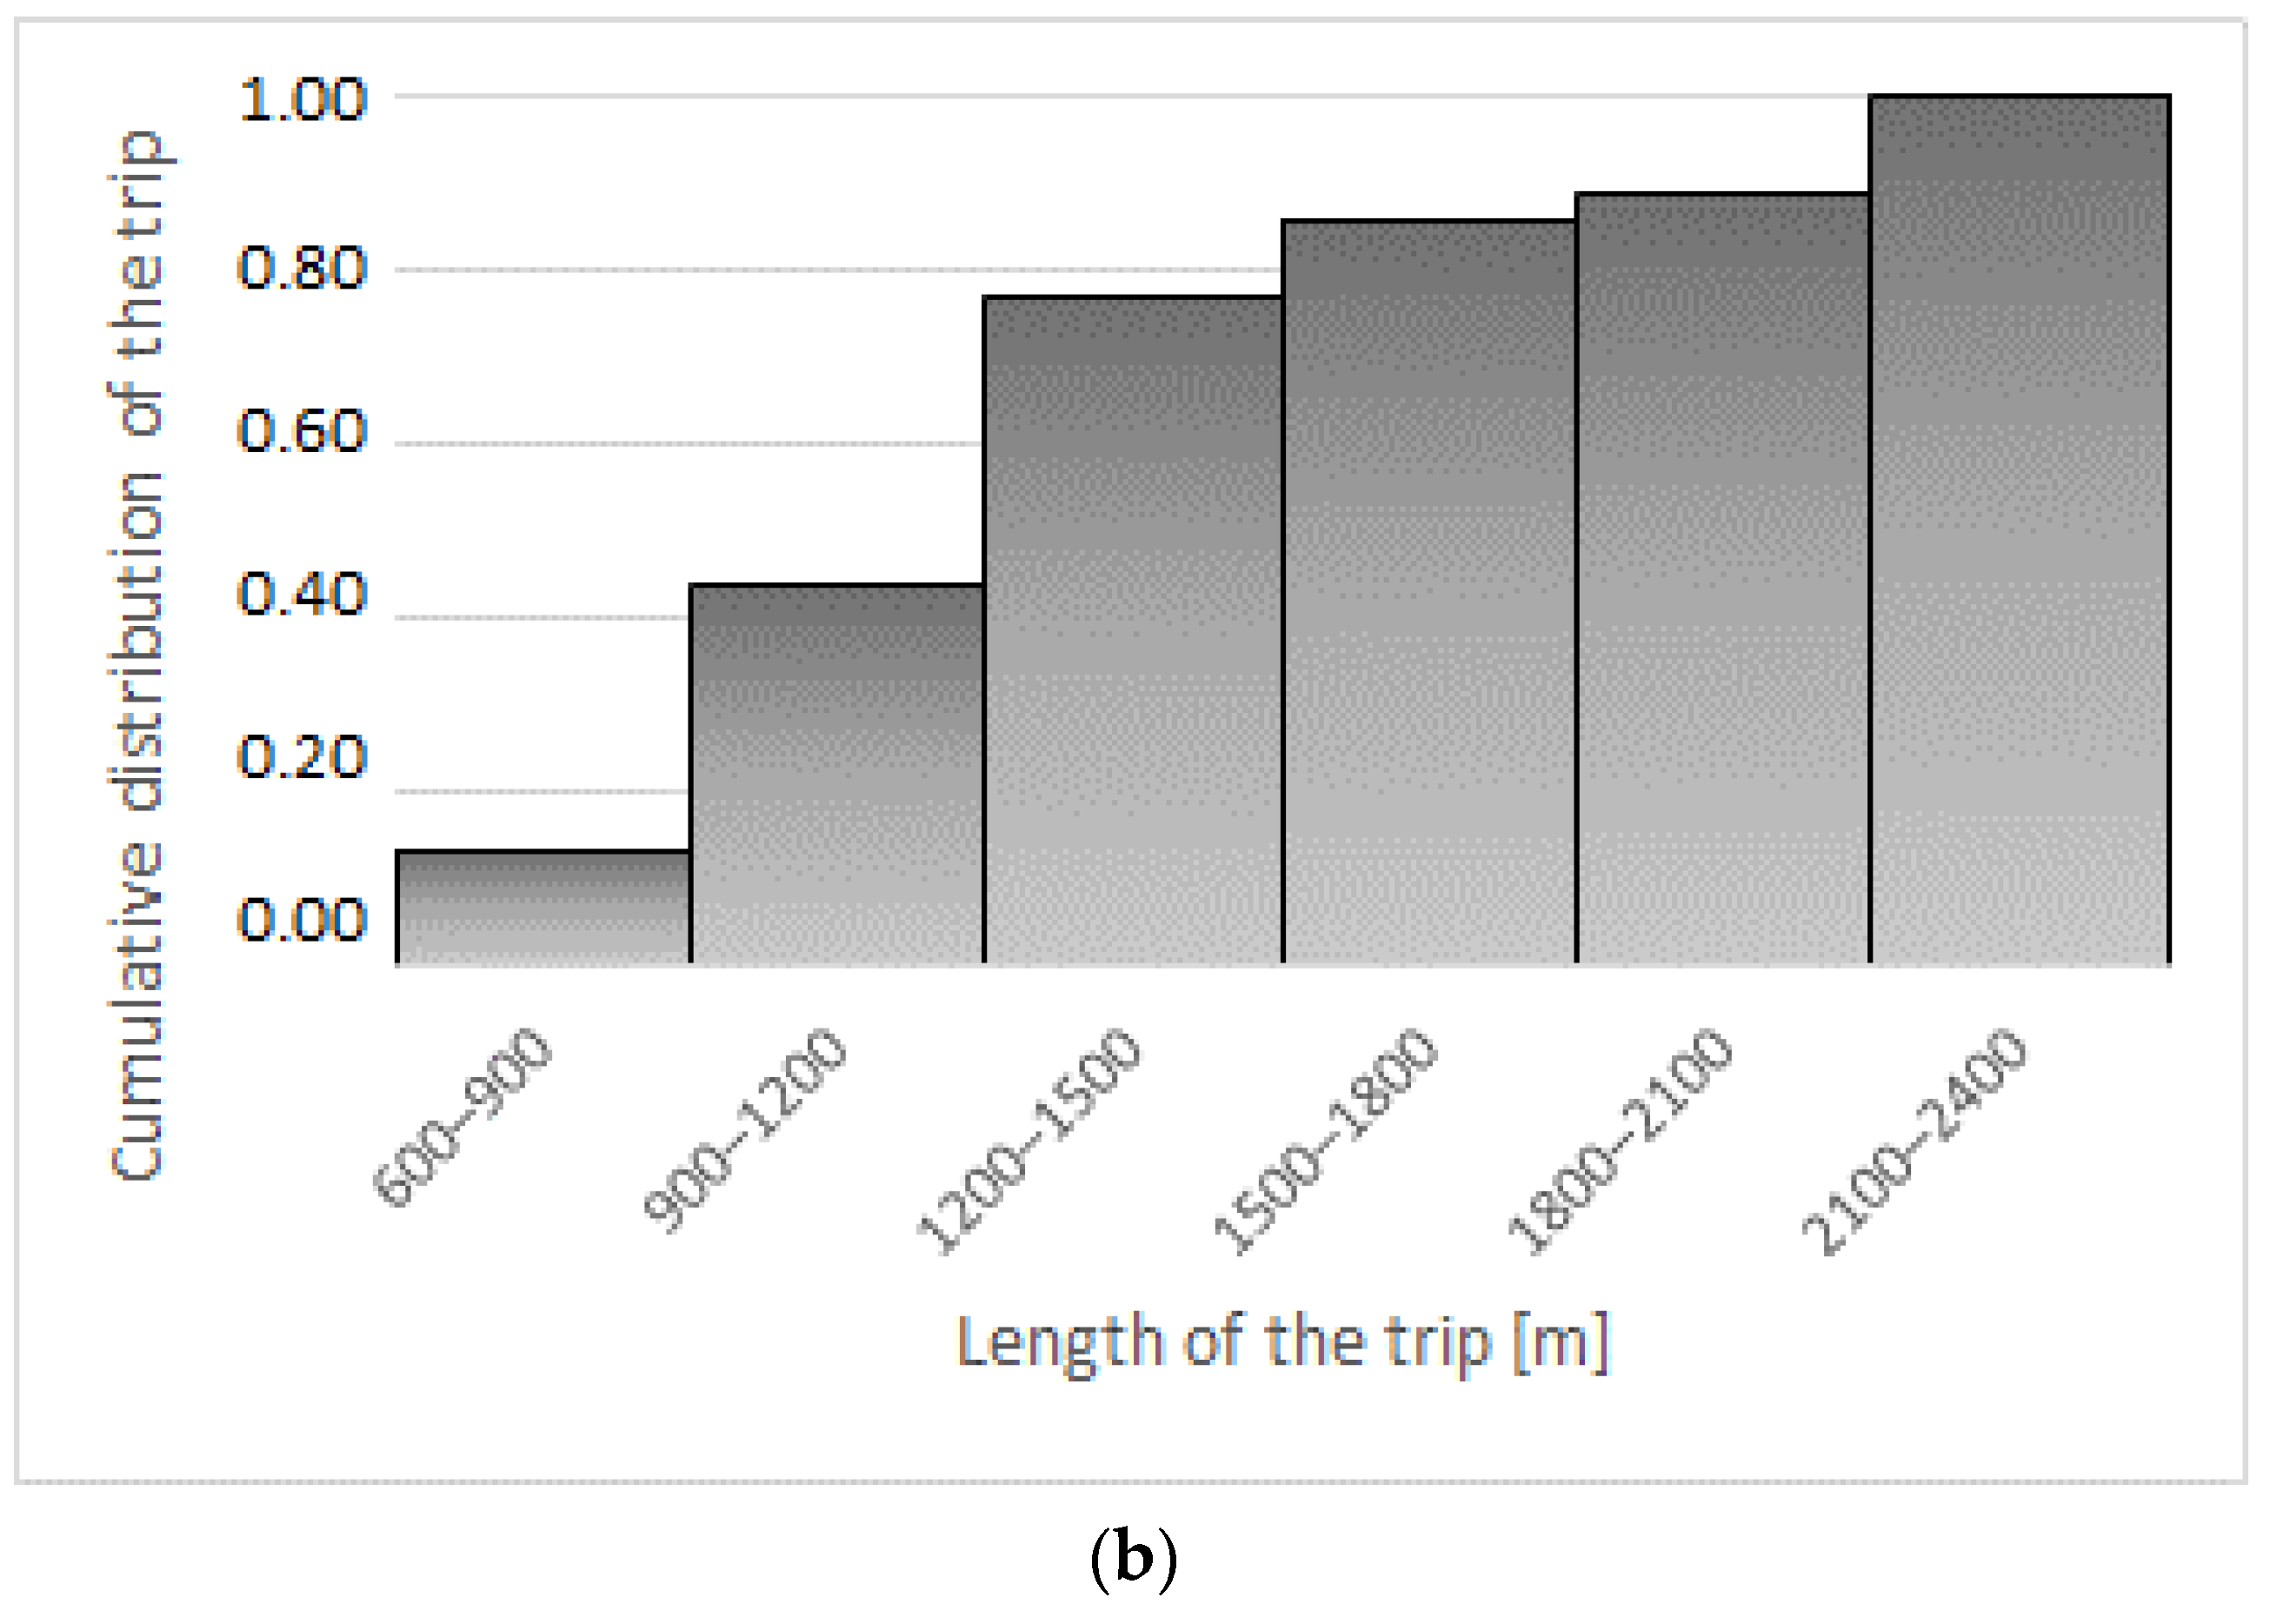
The total number of trips made within the bike-sharing system for the 23 selected relations is 37,241. The frequency and cumulative distributions of the trips as a function of their length are shown in Figure 8. It can be noticed that over 64% of bicycle trips in the most loaded 23 relations are longer than 900 m and shorter than 1500 m.
Table 7 shows the number of intersections of a specific category (measure ) in the optimal path for each pair of the bike-sharing stations, considering the adopted classification of the sections.
The most common category of intersections crossed by cyclists is Vp, which occurred 72 times for 23 paths. For five paths, at least 10 junctions must be followed to reach the destination. Pedestrian crossings with traffic lights also play an important role. In the future, consideration should be given to changing the indicated crossings to pedestrian and bicycle crossings which enable cyclists to cross such places more smoothly.
The conducted analyses allowed for the distribution of traffic flows into sections of optimal paths for the most frequently used relations (23 selected ones). Figure 9 shows the results of the analysis of the sections. At this stage, the existing bicycle paths, which were the subject of the general analysis (Figure 7), were not considered.
The analyzed sections of the road and street network (categories marked as Il to VIIl) were ordered according to the volume of bicycle traffic. Table 8 shows the 20 most heavily loaded sections with the data on the length and category of each section. Complete data are presented in Table A2 in Appendix A.
A total of 8471 m of new bicycle paths would ensure safer and faster travel on the relations most heavily loaded with bicycle traffic in the city of Katowice. This goal should be achieved in stages, considering sections for the most frequently used relations (pairs of bike-sharing stations). Table 9 shows the total lengths of the sections for each category and their percentage share in the total length of the sections (i.e., 8471 m).
The optimal paths for the 23 selected relations mostly lead through the sections of the category Il (over 50% of 139 sections), that is, sidewalks. This is also the category with the greatest total length of sections—3443 m. The sidewalks can be easily modified in order to introduce bicycle paths depending on their width. The shortest length of sections is in the category representing stairs—5 m. However, it is a big nuisance for cyclists, so the indicated places should be considered first for the changes.
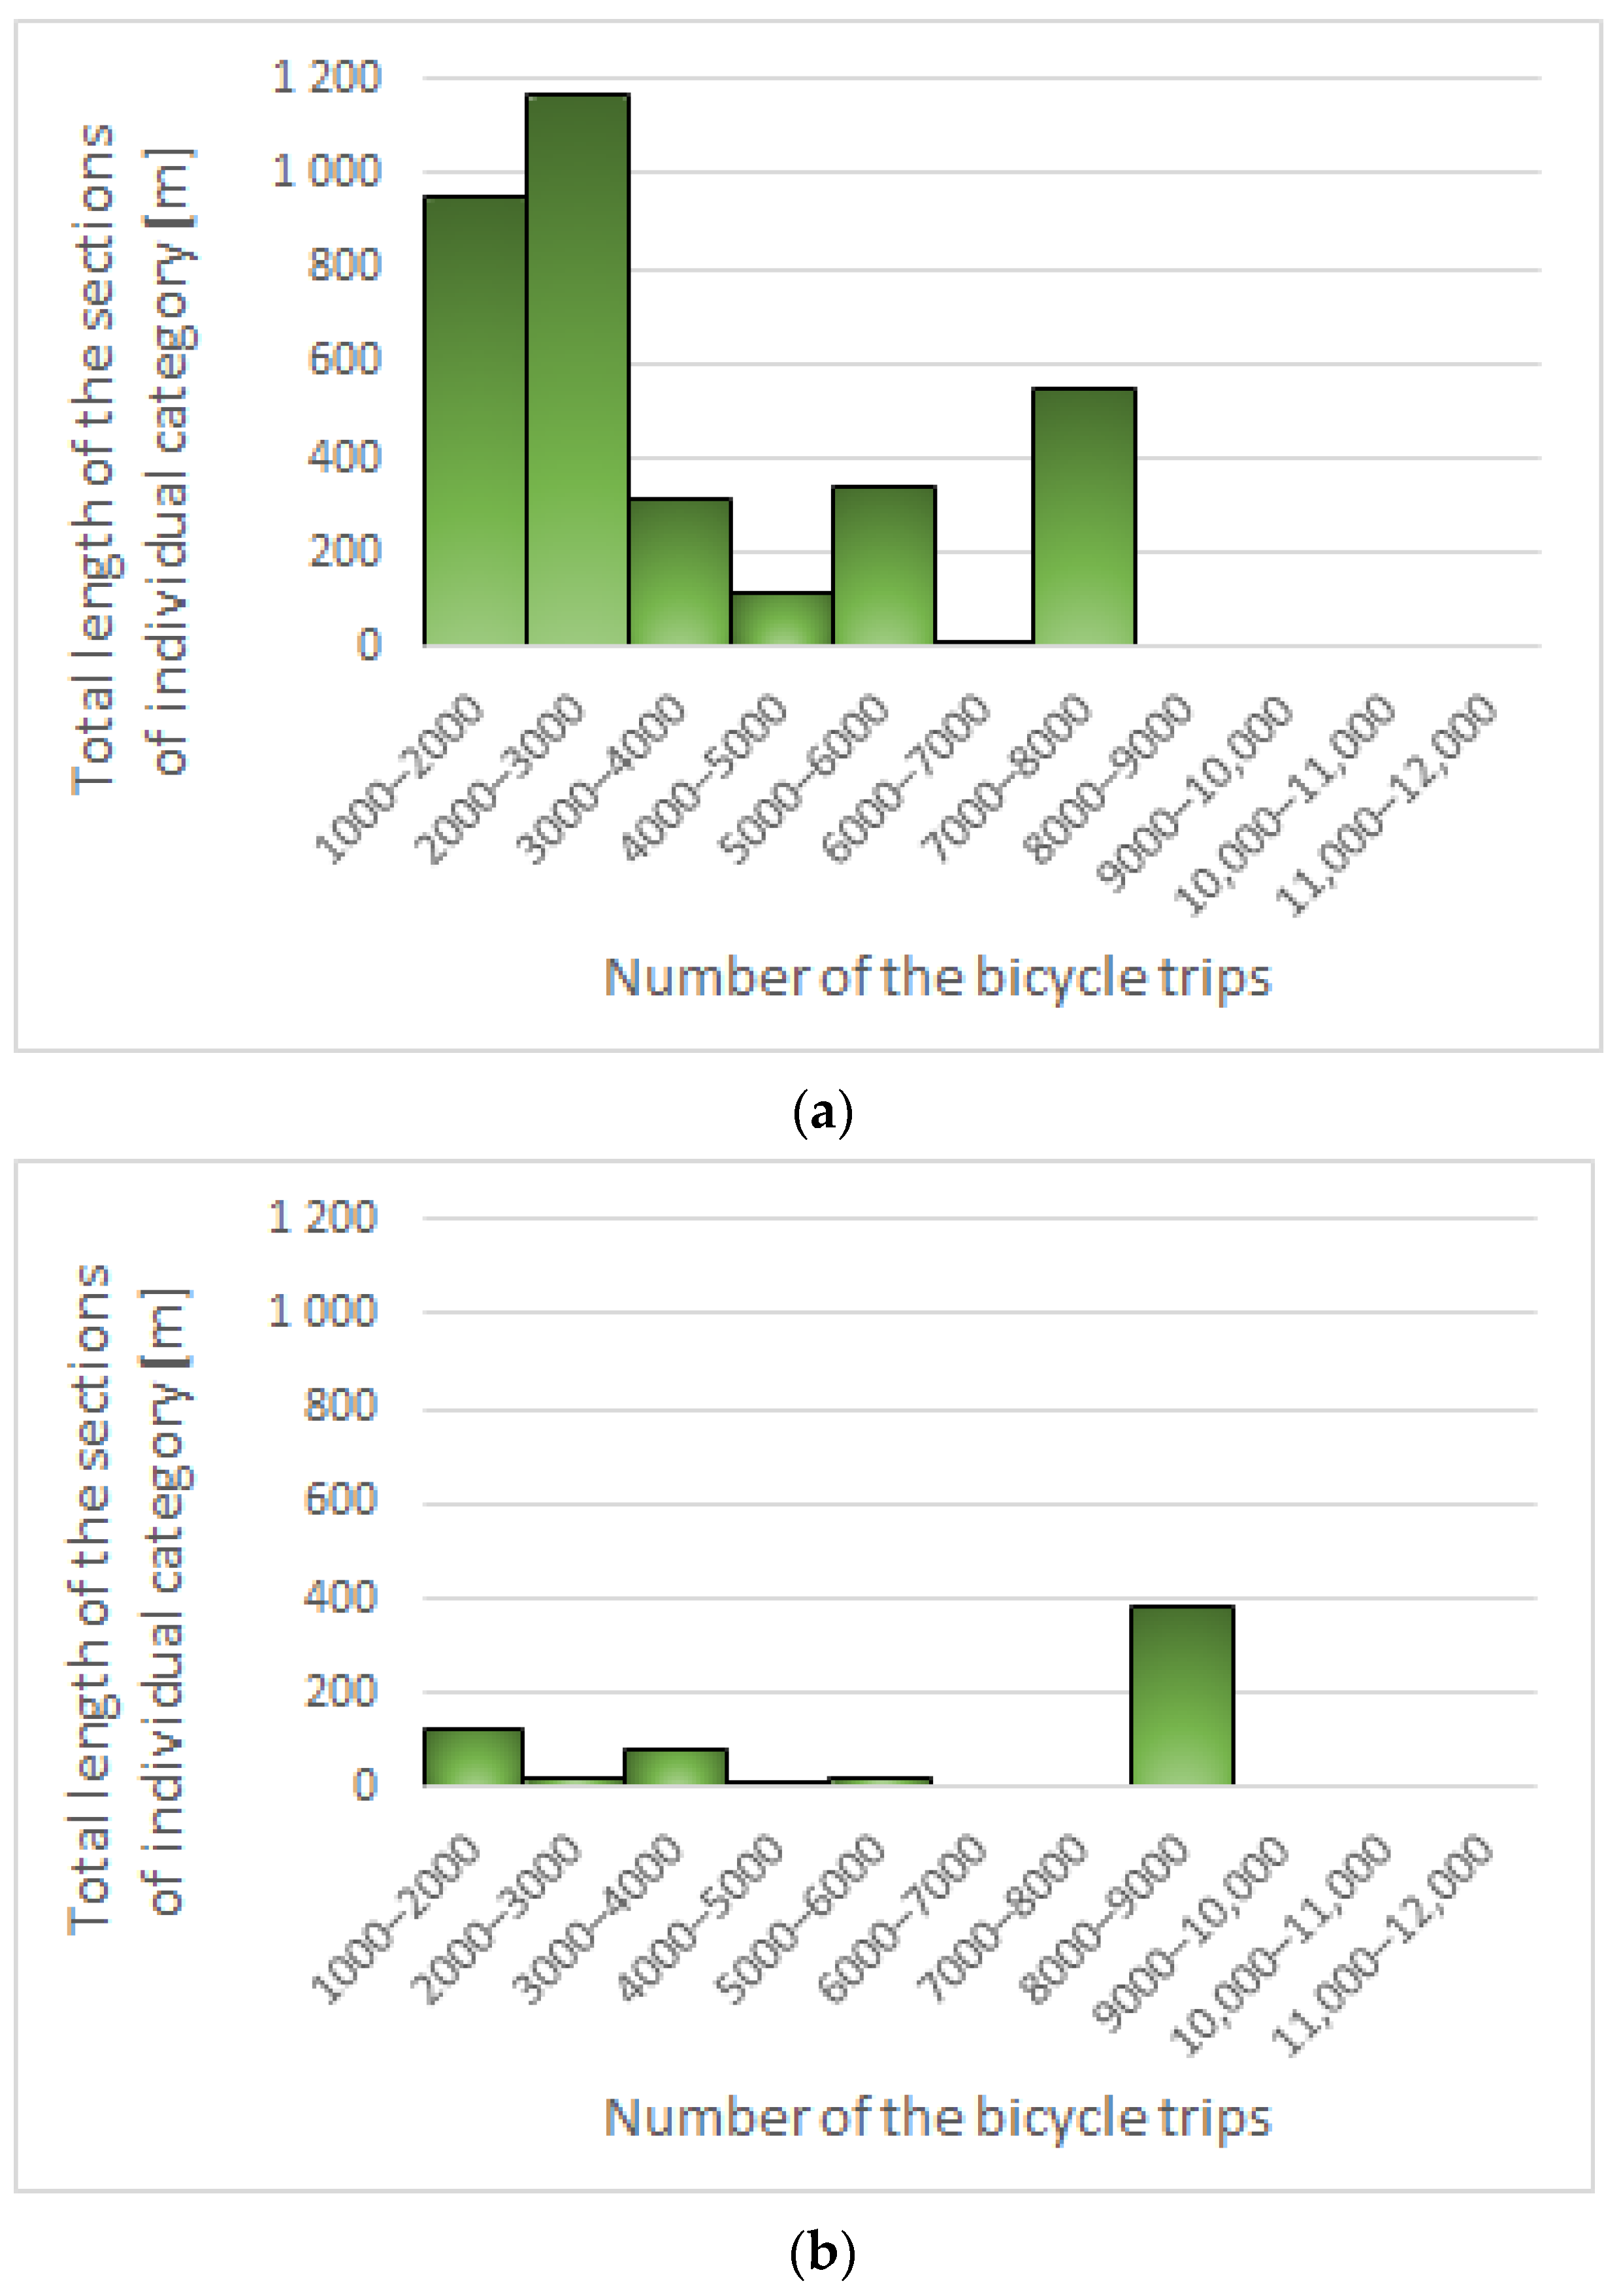
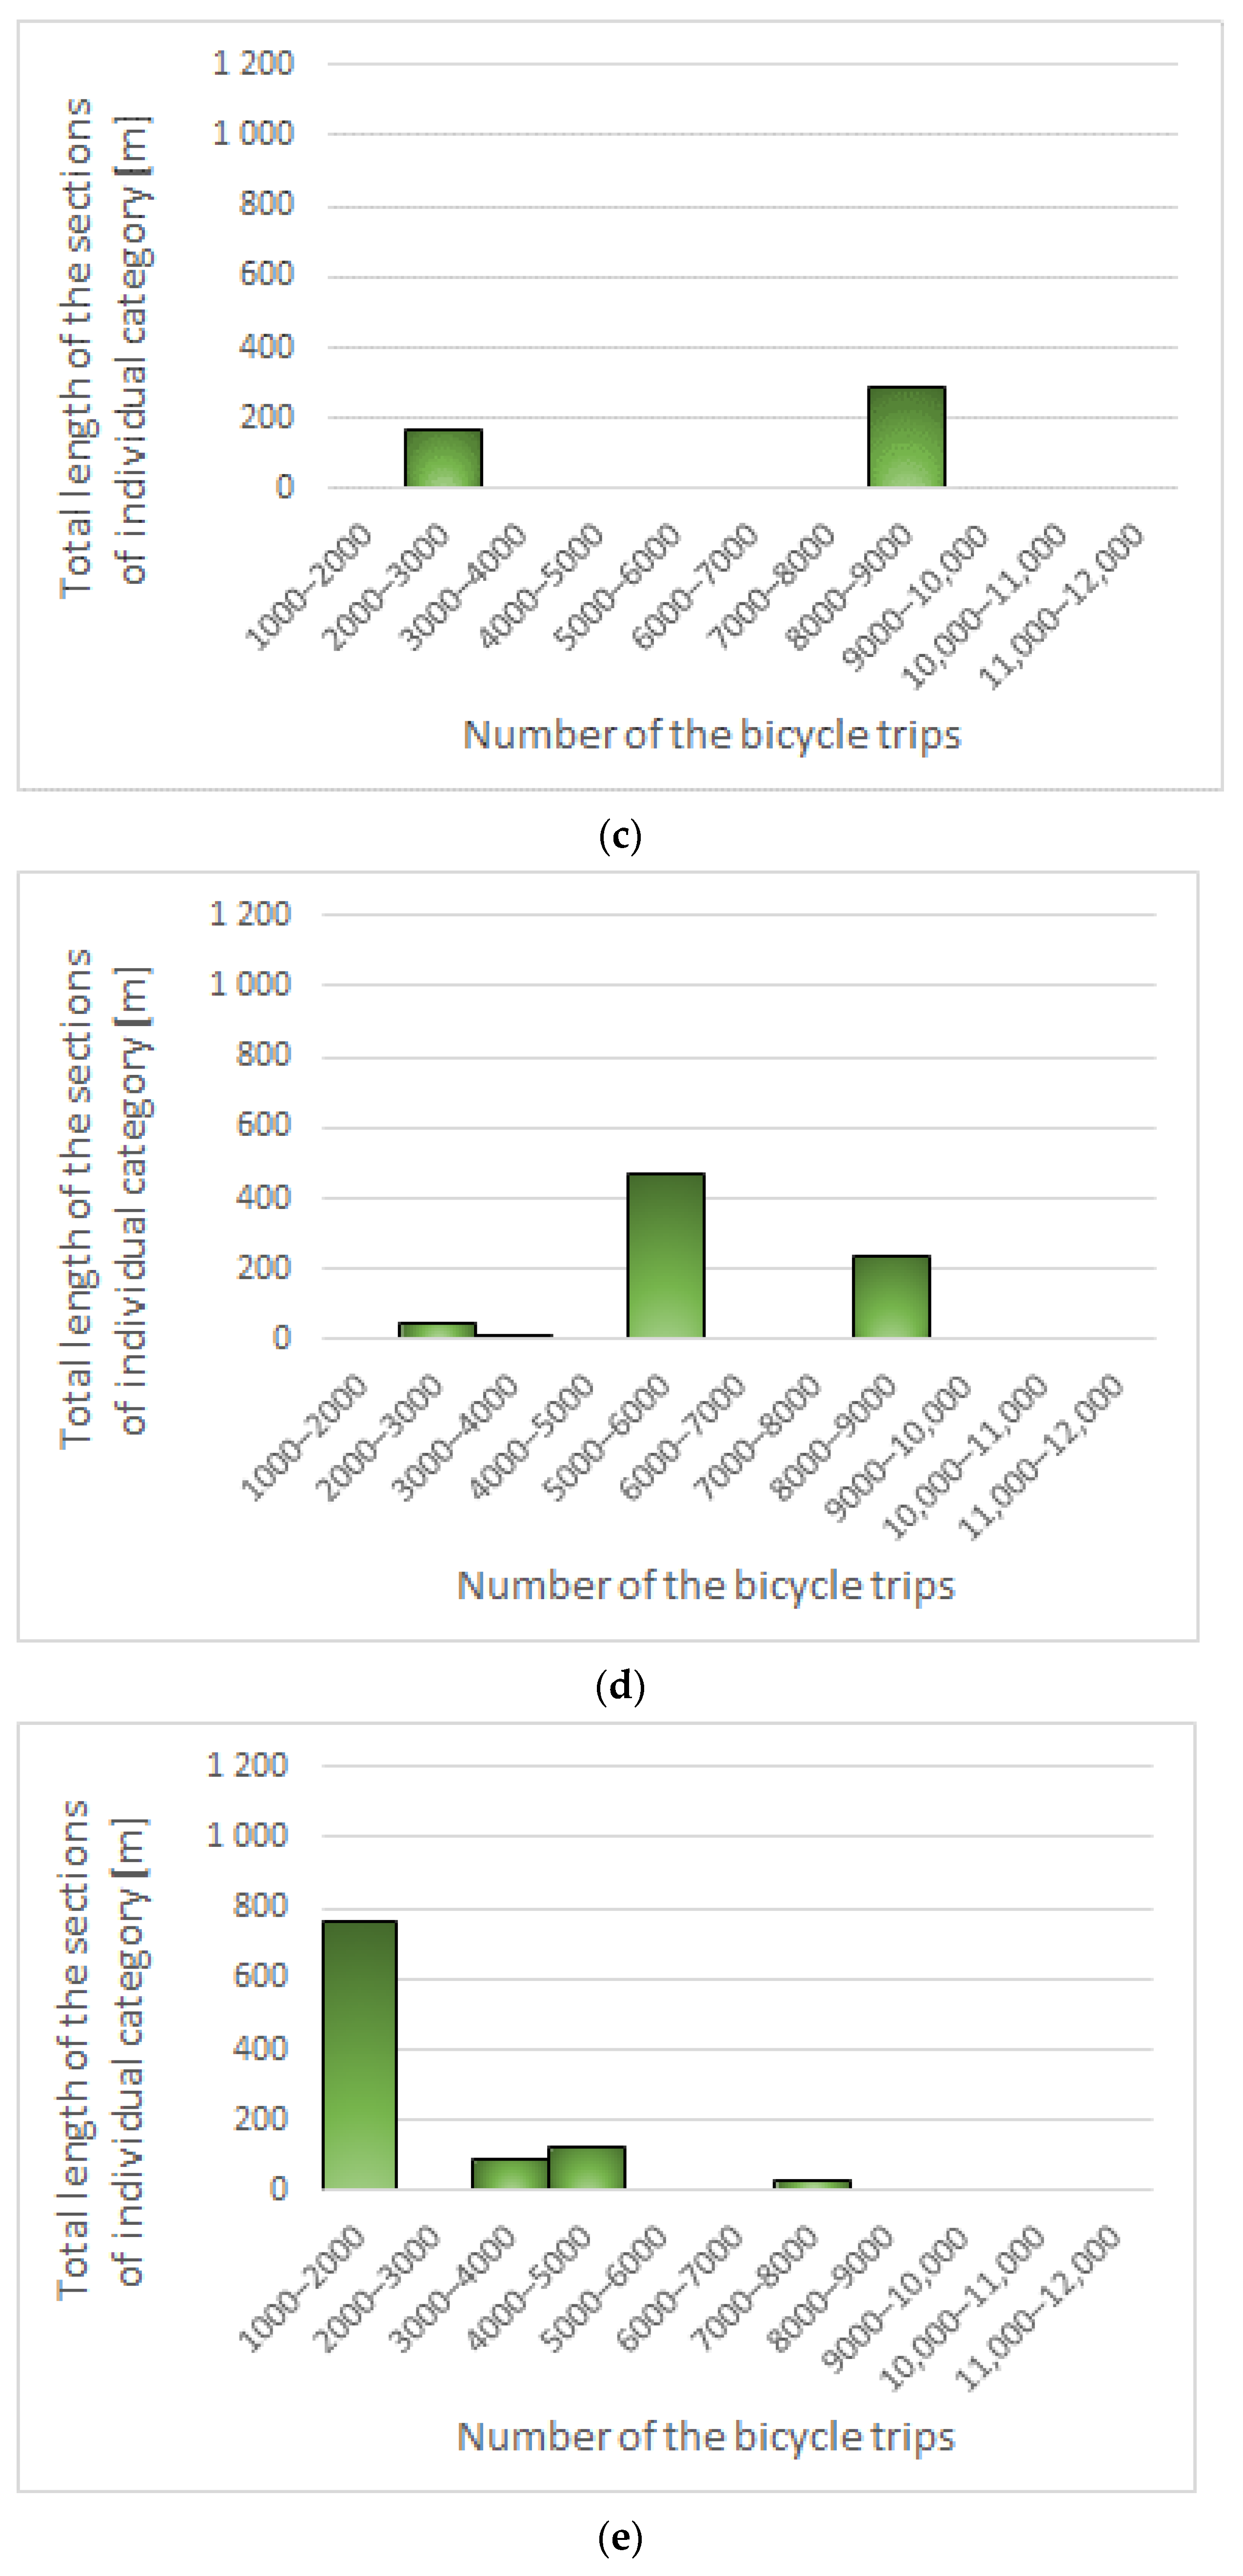
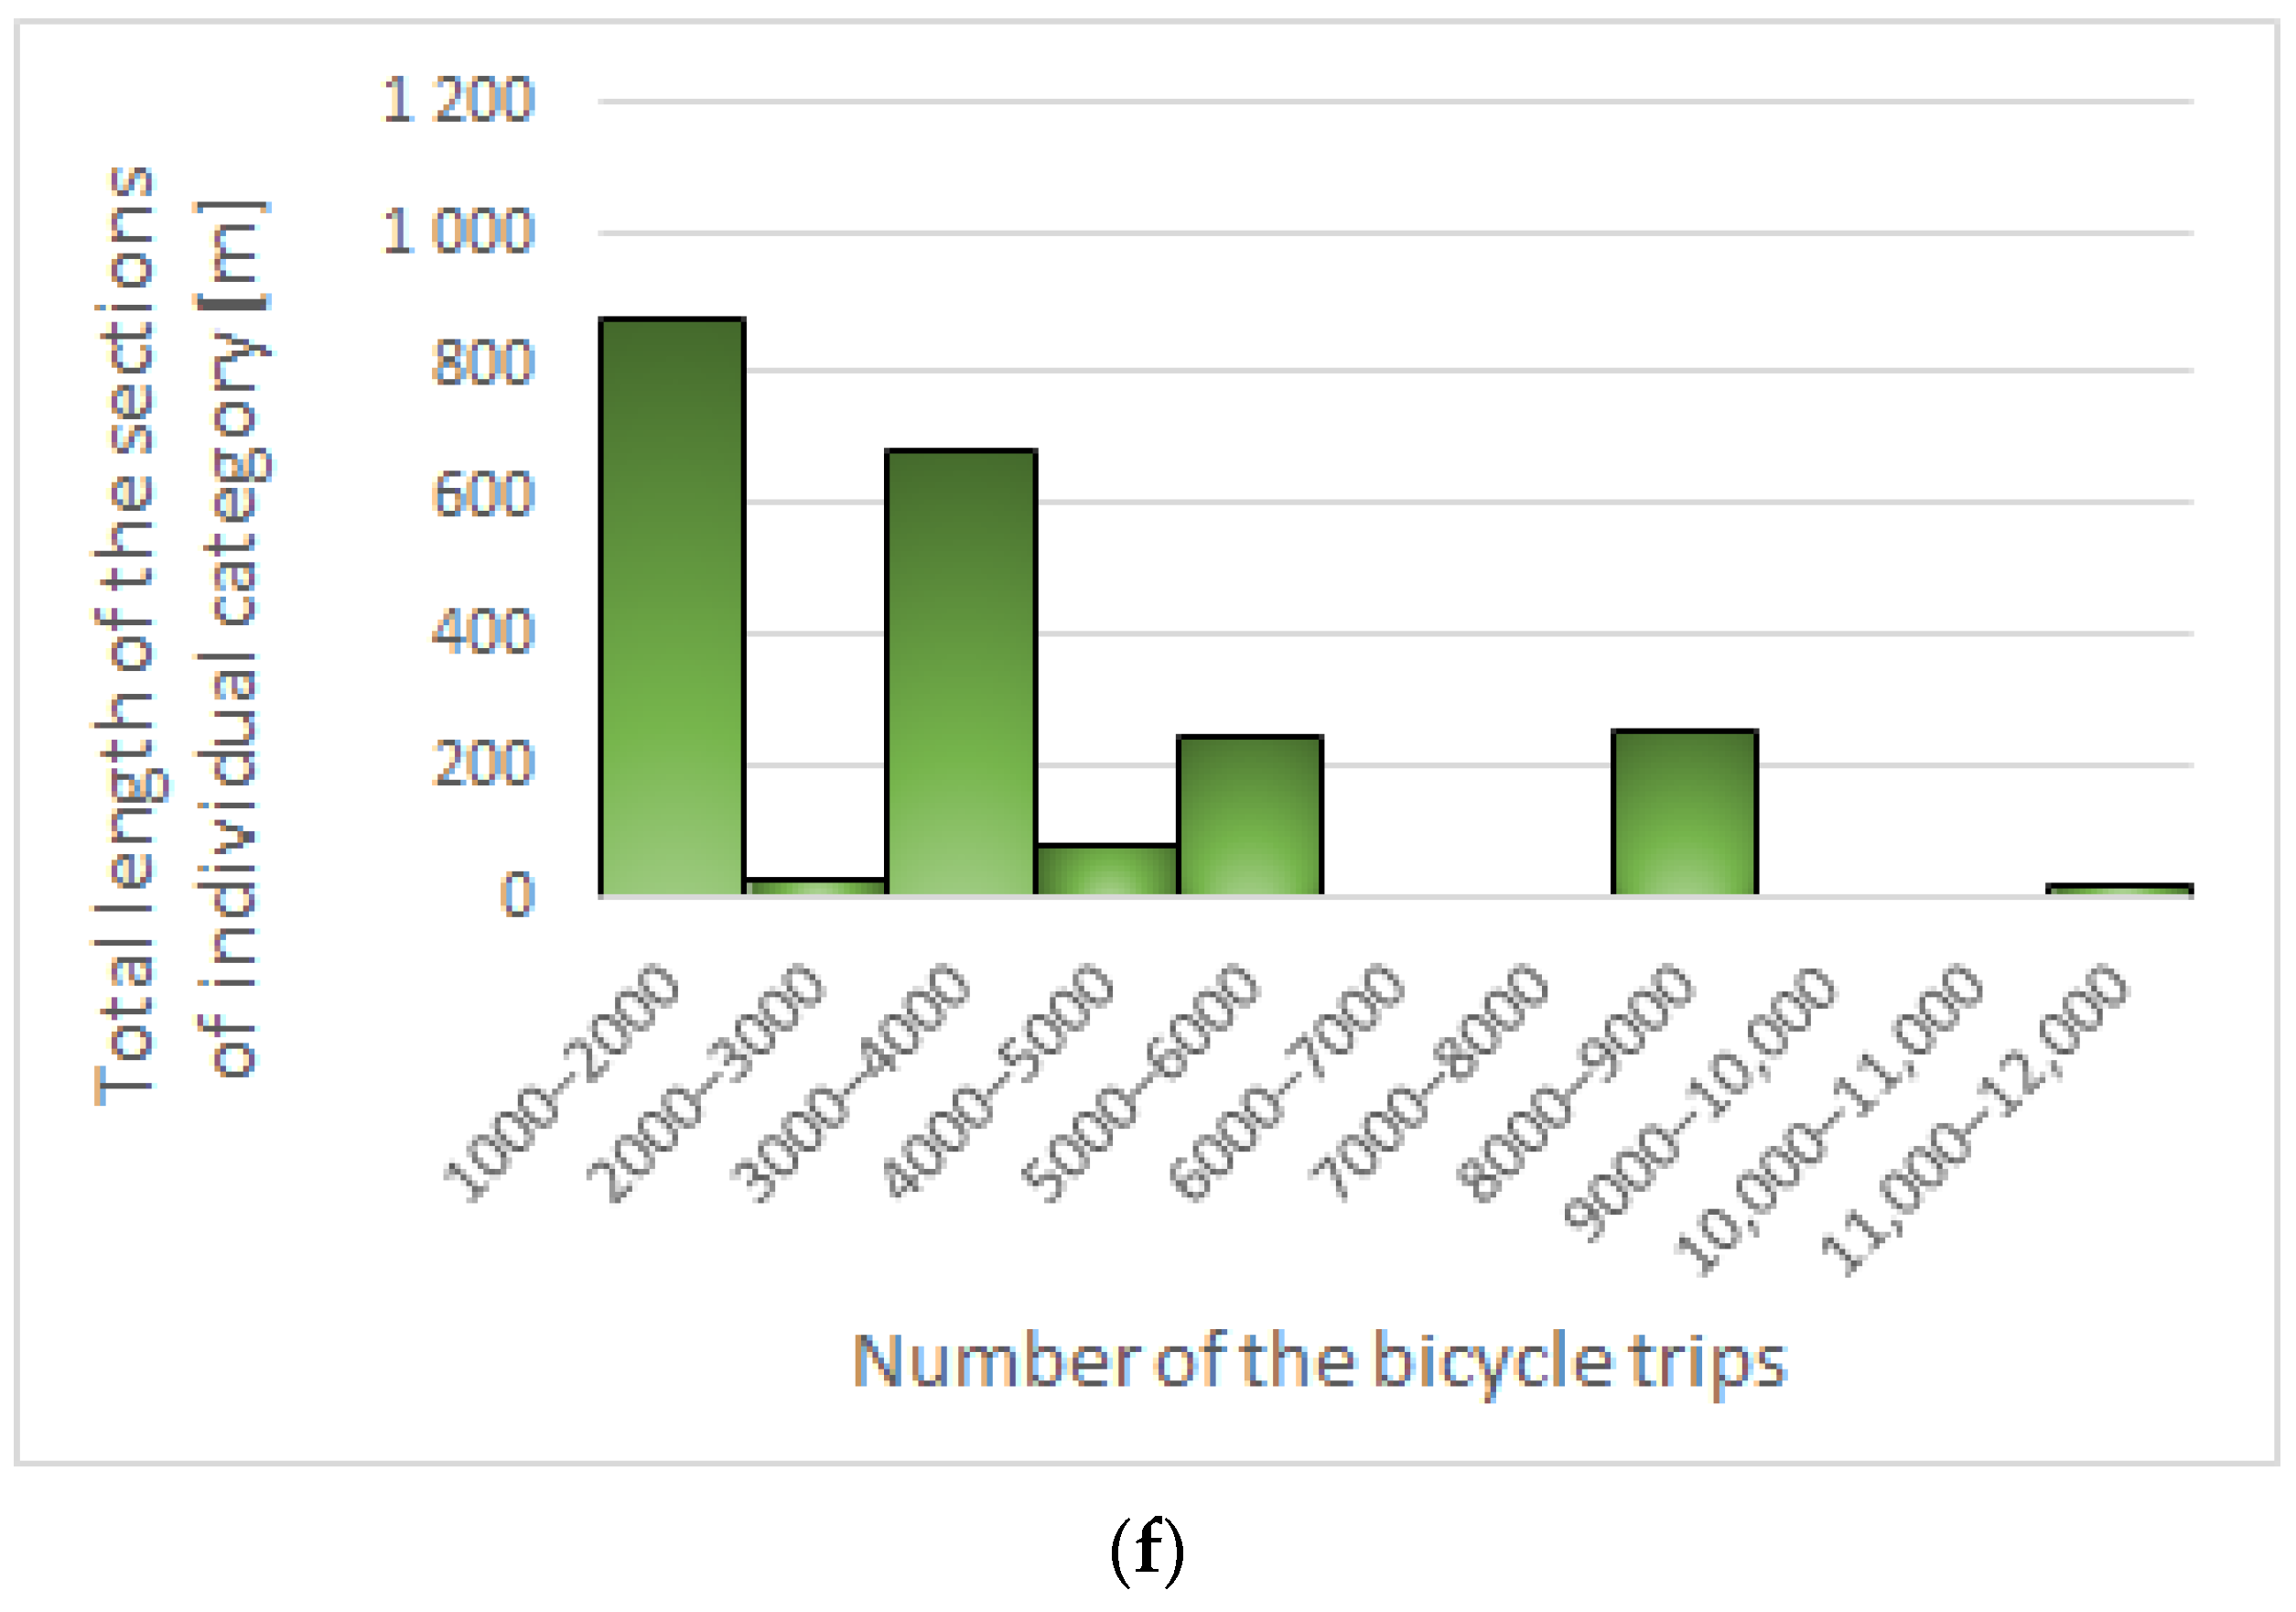
Figure 10 shows the distributions of the total length of sections for individual categories as a function of the number of trips made in the bike-sharing system. They provide an overall view of the use of sections in each category. Category VIIl, that is, stairs, was not included in the analyses due to the presence of only one such case for the selected 23 relations.
When analyzing distributions of the total length of the sections for each category separately, it can be noticed that the sections of category Il dominate for relatively small cycle flows (up to 8000 trips/season). In the case of sections of categories IIl, IIIl, IVl, and VIl, the use of 8000–9000 bicycle trips was also observed. For categories Vl and VIl, it can be stated that with the decrease in the number of journeys, the total length of sections in this category also decreases.
5. Discussion
To increase the number of bike-sharing system users it is necessary to take up actions to increase its attractiveness in comparison to other modes of traveling in urban areas. Therefore, it is inevitable to provide appropriate spatial integration of bike-sharing rental stations. It can be achieved by improving the technical parameters of segments of transport infrastructure that connect those stations, so they meet the needs of bike traffic. This requires the identification of segments of road and street network potentially preferred by bike users when traveling between stations.
The method proposed in the article requires determining the paths for the most loaded relations. The aim of the method is to select the sections which have a high potential of spatial integration (e.g., connectivity) but currently are not used. It is assumed that the improvement of these sections will have a positive effect on the network connectivity for cycling, and thus on the integration of bike-sharing stations. The data obtained from the operator of the bicycle rental system allowed us to determine the most popular directions of bike traffic between the stations. The use of GIS tools made the choice of the shortest path in terms of length possible. The path selected in this way may also include sections that are less frequently used by cyclists due to lower safety or riding comfort. Such sections should be modernized and adapted to the requirements of bicycle traffic.
Two measures W1 and W2 were calculated for each relation. The W1 measure expresses the percentage share of the length of sections assigned to each category of road and street network segments. Several categories of such segments were distinguished. It is of great importance to enable traveling between stations using bicycle paths separated from road traffic. On the other hand, the W2 measure pertains to the percentage share of intersections assigned to categories.
Results of calculations of the W1 measure have shown that in the case of only 4 out of 23 relations, there are segments of the network which are bike-friendly—completely separated from road traffic. In the case of only one path, these segments constitute more than 20% of the total length of the path. Most paths consist of segments of sidewalks separated only by floor markings and signs. The analysis shows which segments should be adjusted and upgraded and to what extent in order to increase the level of integration of the whole bike-sharing system. The analysis of values of the W2 measure shows that most intersections, which the cyclists cross using the sidewalks, are not equipped with traffic lights (category Vp). It is necessary to determine whether such intersections provide an appropriate level of safety or not. This requires a thorough analysis of specific locations, considering the environmental conditions, traffic organization, and the visibility of both cyclists and drivers of other vehicles.
6. Conclusions
The analysis presented in the paper allows stating that the proposed method of the assessment of the spatial integration of bike-sharing stations in urban agglomerations based on GIS tools may be a useful instrument to perform essential analyses for the appropriate development of a bike-sharing system in the city. The analysis performed according to the proposed method allowed us to identify segments of road and street network that should be upgraded in order to increase the spatial integration of bike-sharing stations as well as bikeability.
Presently, for the enhancement of the ecological safety of cities, decision-makers implement new instruments for the development of sustainable mobility. Important actions include providing new bike paths and bike-sharing stations, especially since bike-sharing systems are popular, and the number of their users is increasing. It is indicated by research presented in numerous studies, that is, [17,22,25], that pertain to analyses from different parts of the world.
In the presented study, the authors point out that increasing the number of active bike-sharing users requires actions that enhance the attractiveness of bike-sharing systems in comparison to other modes of transport available in urban areas. It is indispensable to provide an appropriate level of spatial integration of bike-sharing stations by adjusting technical parameters of segments of transport infrastructure which connect stations so they meet the needs of bike traffic. That process requires the identification of segments of road and street network that may be potentially used by bike users in trips between stations. The method proposed by the authors allows the performing of such actions.
The method is based on GIS-tools and contains four sub-models that constitute a complex approach to all aspects of the analysis and assessment of necessary investment actions. An important part of the method is a model of a bike-sharing station system. It allows the identification of existing bike-sharing stations and their characteristics, both from the point of view of a user and infrastructural needs. The model of road and street networks that describes the network of streets and intersections in combination with the model of demand for bike-sharing ridership allows preparing a matrix of traffic flows between stations. Therefore, it is possible to apply the model of path choice for the bike-sharing system. To assess the spatial integration of bike-sharing stations, appropriate measures were developed.
Results of empirical research indicate that the percentage share of segments, in particular, categories of segments of road and street network, allows the identification of categories that are important for possible traveling between stations using bike paths separated from road traffic.
Another important measure that was analyzed is the percentage share of intersections assigned to categories. The analysis showed that the most common type of intersection is an intersection without traffic lights, where bike users ride on sidewalks both before and after the intersection. It is essential to conduct additional research to determine whether such intersections always provide the required level of safety.
The analysis of said measures shows which segments of road and street network, and to what extent, should be modified and upgraded to increase the level of spatial integration of the whole bike-sharing system. Undoubtedly, the research conducted, and the method proposed indicate that it is necessary to perform a complex study on shaping the network of streets and intersections to develop the bike-sharing network in the future, so its users could travel to every location and park or return the bike without additional hassle.
Bike-sharing systems provide interesting opportunities for future research. Therefore, it is possible to expand the proposed method by including different analyses, that is, analysis of centrographic indicators, hot spot analysis, or correlation and multivariate statistics. Moreover, the number of trips in each relation could be compared with the share of each type of section of the road or intersection and the observed flow could be compared with the gravity model. Future expansion of the method should lead to more systematic analyses of the bike-sharing network in urban areas.
Author Contributions
Conceptualization, R.Ż., M.J.K., and P.S.; methodology, R.Ż., M.J., and M.J.K.; software, M.J.K.; validation, R.Ż., M.J., and P.S.; formal analysis, R.Ż. and M.J.; investigation, R.Ż.; resources, M.J.K.; data curation, M.J.K.; writing—original draft preparation, R.Ż., M.J., M.J.K., and P.S.; writing—review and editing, R.Ż., M.J., and P.S.; visualization, M.J.K. and P.S.; supervision, M.J.; project administration, R.Ż. All authors have read and agreed to the published version of the manuscript.
Funding
This research received no external funding.
Institutional Review Board Statement
Not applicable.
Informed Consent Statement
Not applicable.
Data Availability Statement
Not applicable.
Acknowledgments
The authors would like to thank the Reviewers for their profound and valuable comments, which have contributed to enhancing the standard of the paper, as well as the authors’ future research in this area. These studies were possible thanks to the provision of data on the bike-sharing system by Przedsiębiorstwo Komunikacji Miejskiej Katowice sp. z o.o.
Conflicts of Interest
The authors declare no conflict of interest.
Appendix A

Table A1.
Ranking of the stations in terms of the total number of rentals and returns of bicycles.
| Station IDs in Hierarchy | Station Name | Number of Rentals | Number of Returns | Total Number of Rentals and Returns |
|---|---|---|---|---|
| 1 | Katowice Rynek | 23,787 | 25,384 | 49,171 |
| 2 | Silesia City Center | 7773 | 7119 | 14,892 |
| 3 | KTBS—Krasińskiego 14 | 7268 | 7123 | 14,391 |
| 4 | Murapol Mariacka | 6861 | 7149 | 14,010 |
| 5 | COP24 | 4954 | 4672 | 9626 |
| 6 | Ul. Powstańców—Biblioteka Śląska | 4668 | 4540 | 9208 |
| 7 | Al. Bolesława Krzywoustego | 4242 | 4949 | 9191 |
| 8 | Plac Sejmu Śląskiego | 4682 | 4428 | 9110 |
| 9 | Murapol Chorzowska | 4736 | 4343 | 9079 |
| 10 | Plac Wolności | 4314 | 4475 | 8789 |
| 11 | Załęże Skwer S. Barei | 3677 | 3671 | 7348 |
| 12 | Ligota Medyków | 3628 | 3666 | 7294 |
| 13 | Al. Księcia Henryka Pobożnego | 3331 | 3606 | 6937 |
| 14 | Politechnika Śląska | 3529 | 3166 | 6695 |
| 15 | Galeria 3 Stawy | 3061 | 3226 | 6287 |
| 16 | Koszutka—Plac Gwarków | 3189 | 2840 | 6029 |
| 17 | Dolina 3-ch Stawów | 2779 | 3058 | 5837 |
| 18 | Ligota Dworzec PKP | 2625 | 2606 | 5231 |
| 19 | Green Park | 2649 | 2581 | 5230 |
| 20 | Silesia Business Park | 2584 | 2527 | 5111 |
| 21 | KTBS—Saint Etienne 1 | 2109 | 2278 | 4387 |
| 22 | Ligota Wczasowa | 2115 | 2199 | 4314 |
| 23 | Park Kościuszki | 2189 | 2065 | 4254 |
| 24 | Al. Księżnej Jadwigi Śląskiej | 2063 | 2137 | 4200 |
| 25 | Bogucice Szpital | 1800 | 1846 | 3646 |
| 26 | ING Sokolska | 1881 | 1644 | 3525 |
| 27 | Zadole Kościół | 1640 | 1534 | 3174 |
| 28 | Skwer Bolesława Szabelskiego | 1618 | 1494 | 3112 |
| 29 | Armii Krajowej/Jankego | 1443 | 1483 | 2926 |
| 30 | Osiedle Franciszkańskie | 1323 | 1433 | 2756 |
| 31 | Łętowskiego S.P. nr 27 | 1215 | 1312 | 2527 |
| 32 | Piotrowice V L.O. | 1184 | 1168 | 2352 |
| 33 | Kostuchna—Rondo Rostworowskiego | 1118 | 1004 | 2122 |
| 34 | Kostuchna—Bażantów | 984 | 984 | 1968 |
| 35 | Os. Ptasie—ul. Gawronów | 1131 | 761 | 1892 |
| 36 | Os. Kukuczki—Skwer Koszycki | 901 | 883 | 1784 |
| 37 | Kokociniec S.P nr 67 | 669 | 772 | 1441 |
| 38 | Osiedle Witosa—Plac Herberta | 732 | 643 | 1375 |
| 39 | Os. Witosa—ul. Rataja | 673 | 669 | 1342 |
| 40 | Os. Ptasie—ul. Drozdów | 678 | 578 | 1256 |
| 41 | GPP Business Park | 722 | 504 | 1226 |
| 42 | Nikiszowiec Lodowisko Jantor | 587 | 625 | 1212 |
| 43 | Kostuchna—Szarych Szeregów | 773 | 343 | 1116 |
| 44 | Szopienice—Plac Powstańców Śląskich | 428 | 570 | 998 |
| 45 | Giszowiec—Plac Pod Lipami | 426 | 463 | 889 |
| 46 | Nikiszowiec—Św. Anny | 353 | 324 | 677 |
| 47 | Kostuchna—Boże Dary | 228 | 367 | 595 |
| 48 | Podlesie—Stary Most | 120 | 362 | 482 |
| 49 | PKN Orlen—Piotrowicka | 187 | 170 | 357 |
| 50 | Murcki—Rynek Murckowski | 165 | 153 | 318 |
| 51 | PKN Orlen—Murckowska | 198 | 114 | 312 |
| 52 | PKN Orlen—Bocheńskiego | 76 | 74 | 150 |
| 53 | ING Roździeńska | 47 | 23 | 70 |
| 54 | PKN Orlen—Al. Roździeńskiego | 11 | 16 | 27 |
Table A2.
Ranking of the sections in terms of the volume of bicycle traffic.
| Section IDse in the Hierarchy | Volume of Bicycle Traffic (bikes/8 months) | Length of the Section (m) | Category of the Section | Section IDse in the Hierarchy | Volume of Bicycle Traffic (Bikes/8 Months) | Length of the Section (m) | Category of the Section |
|---|---|---|---|---|---|---|---|
| 1 | 11,641 | 16 | VIl | 71 | 2383 | 3 | Il |
| 2 | 8429 | 97 | VIl | 72 | 2383 | 4 | Il |
| 3 | 8141 | 178 | IIIl | 73 | 2383 | 69 | Il |
| 4 | 8141 | 111 | IVl | 74 | 2383 | 5 | VIIl |
| 5 | 8141 | 22 | IIl | 75 | 2383 | 11 | Il |
| 6 | 8141 | 84 | IVl | 76 | 2383 | 23 | Il |
| 7 | 8141 | 42 | IIl | 77 | 2383 | 13 | Il |
| 8 | 8141 | 24 | IIl | 78 | 2383 | 21 | Il |
| 9 | 8141 | 50 | IVl | 79 | 2383 | 21 | Il |
| 10 | 8141 | 21 | IVl | 80 | 2383 | 40 | Il |
| 11 | 8141 | 117 | IIl | 81 | 2383 | 6 | Il |
| 12 | 8141 | 166 | IIl | 82 | 2383 | 5 | Il |
| 13 | 8141 | 14 | IIl | 83 | 2383 | 4 | Il |
| 14 | 8141 | 29 | IVl | 84 | 2383 | 2 | Il |
| 15 | 8141 | 37 | IVl | 85 | 2383 | 274 | Il |
| 16 | 8141 | 15 | IVl | 86 | 2383 | 12 | Il |
| 17 | 8141 | 156 | VIl | 87 | 2383 | 52 | Il |
| 18 | 7850 | 13 | Il | 88 | 2383 | 31 | Il |
| 19 | 7850 | 157 | Il | 89 | 2383 | 41 | Il |
| 20 | 7850 | 226 | Il | 90 | 2383 | 146 | Il |
| 21 | 7850 | 153 | Il | 91 | 2252 | 169 | IIIl |
| 22 | 7850 | 31 | Vl | 92 | 2252 | 17 | IIl |
| 23 | 6962 | 7 | Il | 93 | 2212 | 16 | Il |
| 24 | 5889 | 11 | Il | 94 | 2212 | 44 | IVl |
| 25 | 5889 | 20 | Il | 95 | 2212 | 12 | Il |
| 26 | 5889 | 34 | Il | 96 | 2212 | 16 | Il |
| 27 | 5889 | 19 | Il | 97 | 2212 | 27 | VIl |
| 28 | 5889 | 46 | Il | 98 | 2212 | 342 | Il |
| 29 | 5889 | 4 | Il | 99 | 1545 | 131 | Il |
| 30 | 5889 | 11 | Il | 100 | 1545 | 118 | Vl |
| 31 | 5889 | 11 | Il | 101 | 1545 | 20 | Il |
| 32 | 5889 | 12 | Il | 102 | 1545 | 3 | Il |
| 33 | 5889 | 5 | Il | 103 | 1545 | 172 | Vl |
| 34 | 5889 | 8 | Il | 104 | 1147 | 19 | IIl |
| 35 | 5889 | 13 | IVl | 105 | 1147 | 333 | Il |
| 36 | 5889 | 22 | IIl | 106 | 1147 | 67 | VIl |
| 37 | 5889 | 158 | Il | 107 | 1147 | 45 | Il |
| 38 | 5518 | 248 | VIl | 108 | 1147 | 59 | Il |
| 39 | 5424 | 47 | IVl | 109 | 1147 | 141 | VIl |
| 40 | 5424 | 264 | IVl | 110 | 1147 | 9 | Il |
| 41 | 5424 | 144 | IVl | 111 | 1147 | 11 | IIl |
| 42 | 4757 | 124 | Vl | 112 | 1147 | 36 | IIl |
| 43 | 4757 | 1 | Vl | 113 | 1147 | 5 | Il |
| 44 | 4638 | 38 | Il | 114 | 1147 | 11 | Il |
| 45 | 4638 | 10 | Il | 115 | 1147 | 7 | Il |
| 46 | 4638 | 47 | Il | 116 | 1147 | 37 | IIl |
| 47 | 4638 | 79 | VIl | 117 | 1006 | 268 | Vl |
| 48 | 4638 | 7 | IIl | 118 | 1006 | 64 | Vl |
| 49 | 4638 | 23 | Il | 119 | 1006 | 17 | IIl |
| 50 | 3791 | 81 | VIl | 120 | 1006 | 9 | Vl |
| 51 | 3791 | 32 | VIl | 121 | 1006 | 56 | Vl |
| 52 | 3791 | 106 | VIl | 122 | 1006 | 20 | Il |
| 53 | 3791 | 157 | VIl | 123 | 1006 | 18 | Il |
| 54 | 3791 | 116 | VIl | 124 | 1006 | 33 | Il |
| 55 | 3212 | 52 | Il | 125 | 1006 | 17 | Il |
| 56 | 3212 | 60 | VIl | 126 | 1006 | 17 | Il |
| 57 | 3212 | 16 | VIl | 127 | 1006 | 76 | Vl |
| 58 | 3212 | 67 | VIl | 128 | 1006 | 130 | Il |
| 59 | 3212 | 10 | VIl | 129 | 1006 | 6 | Il |
| 60 | 3212 | 28 | VIl | 130 | 1006 | 8 | Il |
| 61 | 3212 | 0 | VIl | 131 | 1006 | 22 | Il |
| 62 | 3212 | 90 | Vl | 132 | 1006 | 9 | Il |
| 63 | 3135 | 43 | IIl | 133 | 1006 | 10 | Il |
| 64 | 3135 | 23 | IIl | 134 | 1006 | 8 | Il |
| 65 | 3135 | 14 | IIl | 135 | 1006 | 32 | Il |
| 66 | 3093 | 5 | IVl | 136 | 1006 | 83 | VIl |
| 67 | 3093 | 172 | Il | 137 | 1006 | 80 | VIl |
| 68 | 3093 | 49 | Il | 138 | 1006 | 121 | VIl |
| 69 | 3080 | 17 | Il | 139 | 1006 | 384 | VIl |
| 70 | 3080 | 23 | Il | - | - | - | - |
References
- Chuprov, S.; Viksnin, I.; Kim, I.; Marinenkov, E.; Usova, M.; Lazarev, E.; Melnikov, T.; Zakoldaev, D. Reputation and trust approach for security and safety in intersection management system. Energies 2019, 12, 4527. [Google Scholar] [CrossRef] [Green Version]
- Adamec, V.; Licbinsky, R.; Cholava, R. Transport and health risks of transport. Trans. Transp. Sci. 2011, 4, 1–20. [Google Scholar] [CrossRef] [Green Version]
- Żochowska, R.; Soczówka, P. Method for identifying hazardous road locations at the intersection of tramlines and road traffic. Sci. J. Sil. Univ. Technol. Ser. Transp. 2017, 97, 201–213. [Google Scholar] [CrossRef]
- Rao, A.M.; Rao, K.R. Measuring urban traffic congestion—A review. Int. J. Traffic Transp. Eng. 2012, 2, 286–305. [Google Scholar]
- Licbinsky, R.; Adamec, V. The unfavorable influence of transport on the environment. Trans. Transp. Sci. 2011, 4, 1–22. [Google Scholar]
- Jacyna, M.; Wasiak, M. Data Exploration for Determining the Parameters of Volume-Delay Function for Sections in the Traffic Models for Heavily Urbanized Areas. In Proceedings of the 20th International Scientific Conference Transport Means, Juodkrante, Lithuania, 5–7 October 2016; Technologija: Kaunas, Lithuania, 2016; pp. 866–871. [Google Scholar]
- Rye, T.; Hrelja, R. Policies for reducing car traffic and their problematisation. Lessons from the mobility strategies of British, Dutch, German and Swedish cities. Sustainability 2020, 12, 8170. [Google Scholar] [CrossRef]
- Jacyna-Gołda, I.; Żak, J.; Gołębiowski, P. Models of traffic flow distribution for various scenarios of the development of proecological transport system. Arch. Transp. 2014, 32, 17–28. [Google Scholar] [CrossRef]
- Karoń, G.; Żochowska, R. Problems of Quality of Public Transportation Systems in Smart Cities-Smoothness and Disruptions in Urban Traffic. (In Polish: Modelling of the Interaction of the Different Vehicles and Various Transport Modes); Sładkowski, A., Ed.; Springer: Cham, Switzerland, 2020; pp. 383–414. [Google Scholar]
- Jacyna, M.; Kłodawski, M. Model of Transportation Network Development in Aspect of Transport Comodality. In Proceedings of the 21st International Conference on Systems Engineering, Las Vegas, NV, USA, 16–18 August 2011; pp. 341–345. [Google Scholar] [CrossRef]
- Jacyna, M.; Wasiak, M.; Lewczuk, K.; Kłodawski, M. Simulation model of transport system of Poland as a tool for developing sustainable transport. Arch. Transp. 2014, 31, 23–35. [Google Scholar] [CrossRef]
- Ruhrort, L. Reassessing the role of shared mobility services in a transport transition: Can they contribute the rise of an alternative socio-technical regime of mobility? Sustainability 2020, 12, 8253. [Google Scholar] [CrossRef]
- Zheyan, C.; van Lierop, D.; Ettema, D. Dockless bike-sharing systems: What are they implications? Transp. Rev. 2020. [Google Scholar] [CrossRef]
- Fishman, E.; Washington, S.; Haworth, N.; Watson, A. Factors influencing bike share member-ship: An analysis of Melbourne and Brisbane. Transp. Res. Part A Policy Pract. 2015, 71, 17–30. [Google Scholar] [CrossRef] [Green Version]
- Politis, I.; Fyrogenis, I.; Papadopoulos, E.; Nikolaidou, A.; Verani, E. Shifting to shared wheels: Factors affecting dockless bike-sharing choice for short and long trips. Sustainability 2020, 12, 8205. [Google Scholar] [CrossRef]
- Cieśla, M.; Sobota, A.; Jacyna, M. Multi-Criteria Decision Making Process in Metropolitan Transport Means Selection Based on the Sharing Mobility Idea. Sustainability 2020, 12, 7231. [Google Scholar] [CrossRef]
- Chen, F.; Turoń, K.; Kłos, M.J.; Czech, P.; Pamuła, W.; Sierpiński, G. Fifth-generation bike-sharing systems: Examples from Poland and China. Sci. J. Sil. Univ. Technol. Ser. Transp. 2018, 99, 5–13. [Google Scholar] [CrossRef]
- Shui, C.S.; Szeto, W.Y. A review of bicycle-sharing service planning problems. Transp. Res. Part C 2020, 117, 102648. [Google Scholar] [CrossRef]
- Bieliński, T.; Ważna, A. Electric scooter sharing and bike sharing user behaviour and characteristics. Sustainability 2020, 12, 9640. [Google Scholar] [CrossRef]
- Jacyna, M.; Wasiak, M.; Kłodawski, M.; Gołębiowski, P. Modelling of bicycle traffic in the Cities using Visum. Procedia Eng. 2017, 187, 435–441. [Google Scholar] [CrossRef]
- Bieliński, T.; Kwapisz, A.; Ważna, A. Bike-sharing systems in Poland. Sustainability 2019, 11, 2458. [Google Scholar] [CrossRef] [Green Version]
- Macioszek, E.; Świerk, P.; Kurek, A. The bike-sharing system as an element of enhancing sustainable mobility—A case study based on a city in Poland. Sustainability 2020, 12, 3285. [Google Scholar] [CrossRef] [Green Version]
- Qiu, L.-Y.; He, L.-Y. Bike Sharing and the Economy, the Environment, and Health-Related Externalities. Sustainability 2018, 10, 1145. [Google Scholar] [CrossRef] [Green Version]
- Ogilvie, F.; Goodman, A. Inequalities in usage of a public bicycle sharing scheme: Socio-demographic predictors of uptake and usage of the London (UK) cycle hire scheme. Prev. Med. 2012, 55, 40–45. [Google Scholar] [CrossRef] [PubMed] [Green Version]
- Ważna, A.; Bieliński, T. New Generation of Bike-Sharing Systems in China: Lessons for European Cities. J. Manag. Financ. Sci. 2018, 11, 25–42. [Google Scholar]
- Schmid-Querg, J.; Keler, A.; Grigoropoulos, G. The Munich Bikeability Index: A Practical Approach for Measuring Urban Bikeability. Sustainability 2021, 13, 428. [Google Scholar] [CrossRef]
- Lowry, M.B.; Callister, D.; Gresham, M.; Moore, B. Assessment of communitywide bikeability with bicycle level of service. Transp. Res. Rec. 2012, 2314, 41–48. [Google Scholar] [CrossRef]
- Winters, M.; Brauer, M.; Setton, E.M.; Teschke, K. Mapping bikeability: A spatial tool to support sustainable travel. Environ. Plan. B Plan. Des. 2013, 40, 865–883. [Google Scholar] [CrossRef]
- Zhang, Y.; Thomas, T.; Brussel, M.; Van Maarseveen, M. Exploring the impact of built environment factors on the use of public bikes at bike stations: Case study in Zhongshan, China. J. Transp. Geogr. 2017, 58, 59–70. [Google Scholar] [CrossRef]
- Hall, C.M.; Le-Klahn, D.-T.; Ram, Y. Tourism, Public Transport and Sustainable Mobility; Channel View Publications: Bristol, UK, 2017. [Google Scholar]
- Gebhart, K.; Noland, R.B. The impact of weather conditions on bikeshare trips in Washington, DC. Transportation 2014, 41, 1205–1225. [Google Scholar] [CrossRef]
- Pazdan, S. The impact of weather on bicycle risk exposure. Arch. Transp. 2020, 56, 89–105. [Google Scholar] [CrossRef]
- Soczówka, P.; Żochowska, R.; Sobota, A.; Kłos, M.J. Identification of good practices for railway systems in urban areas. Probl. Transp. Logist. 2019, 46, 69–81. [Google Scholar] [CrossRef]
- Noland, R.B.; Smart, M.J.; Guo, Z. Bikeshare trip generation in New York City. Transp. Res. Part A Policy Pract. 2016, 94, 164–181. [Google Scholar] [CrossRef]
- Winters, M.; Davidson, G.; Kao, D.; Teschke, K. Motivators and deterrents of bicycling: Comparing influences on decisions to ride. Transportation 2011, 38, 153–168. [Google Scholar] [CrossRef]
- Nogal, M.; Jiménez, P. Attractiveness of Bike-Sharing Stations from a Multi-Modal Perspective: The Role of Objective and Subjective Features. Sustainability 2020, 12, 9062. [Google Scholar] [CrossRef]
- El-Assi, W.; Salah Mahmoud, M.; Nurul Habib, K. Effects of built environment and weather on bike sharing demand: A station level analysis of commercial bike sharing in Toronto. Transportation 2017, 44, 589–613. [Google Scholar] [CrossRef]
- Yu, S.; Xiaohu, Z.; Jinhua, Z. Understanding the usage of dockless bike sharing in Singapore. Int. J. Sustain. Transp. 2018, 12, 686–700. [Google Scholar] [CrossRef]
- Buehler, R.; Dill, J. Bikeway networks: A review of effects on cycling. Transp. Rev. 2015. [Google Scholar] [CrossRef]
- Kabak, M.; Erbas, M.; Cetinkaya, C.; Ozceylan, E. A GIS-based MCDM approach for the evaluation of bike-share stations. J. Clean. Prod. 2018, 201, 49–60. [Google Scholar] [CrossRef]
- Banerjee, S.; Kabir Muhib, M.; Khadem, N.K.; Chavis, C. Optimal locations for bikeshare stations: A new GIS based spatial approach. Transp. Res. Interdiscip. Perspect. 2020, 4. [Google Scholar] [CrossRef]
- Ghandehari, M.; Pouyandeh, V.H.; Javadi, M.H.M. Locatin of bicycle stations in the city of Isfahan using mathematical programming and multi-criteria decision making techniques. Int. J. Acad. Res. Account. Financ. Manag. Sci. 2013, 3, 18–26. [Google Scholar]
- Palomares, J.C.G.; Gutierrez, J.; Latorre, M. Optimizing the location of stations in bike sharing programs: A GIS approach. Appl. Geogr. 2020, 35, 235–246. [Google Scholar] [CrossRef]
- Croci, E.; Rossi, D. Optimizing the Position of Bike Sharing Stations: The Milan Case. CERE Work. Pap. 2014, 68. [Google Scholar] [CrossRef]
- Sierpiński, G.; Staniek, M.; Kłos, M.J. Decision making support for local authorities choosing the method for siting on in-city ev charging stations. Energies 2020, 13, 4682. [Google Scholar] [CrossRef]
- Soczówka, P.; Żochowska, R.; Sobota, A.; Kłos, M.J. The Effect of Delimitation of the Area on the Assessment of the Density of the Road Network Structure. In Modern Traffic Engineering in the System Approach to the Development of Traffic Networks; Springer: Cham, Switzerland, 2019; pp. 20–36. [Google Scholar]
- Botma, H. Method to Determine Level of Service for Bicycle Paths and Pedestrian Bicycle Paths. Transp. Res. Board 1995, 1502, 38–44. [Google Scholar]
- Jensen, S. Pedestrian and Bicyclist Level of Service on Roadway Segments. Transp. Res. Board 2007, 2031, 43–51. [Google Scholar] [CrossRef] [Green Version]
- Kazemzadeh, K.; Laureshyn, A.; Hiselius, L.W.; Ronchi, E. Expanding the Scope of the Bicycle Level-of-Service Concept: A Review of the Literature. Sustainability 2020, 12, 2944. [Google Scholar] [CrossRef] [Green Version]
- Available online: http://www.wiki.openstreetmap.org (accessed on 7 December 2020).
- Available online: http://www.bdl.stat.gov.pl (accessed on 10 January 2021).
- Available online: http://www.openrouteservice.org (accessed on 12 December 2020).
Figure 1.
The general scheme for the method of assessment of spatial integration of bike-sharing stations—MACSIBS.
Figure 1.
The general scheme for the method of assessment of spatial integration of bike-sharing stations—MACSIBS.

Figure 2.
The location of Katowice against the background of Poland and the map of bicycle rental stations.
Figure 2.
The location of Katowice against the background of Poland and the map of bicycle rental stations.

Figure 3.
Total number of rentals and returns in bike-sharing stations. Source: own work based on OpenStreetMap.
Figure 3.
Total number of rentals and returns in bike-sharing stations. Source: own work based on OpenStreetMap.

Figure 4.
Difference between rentals and returns and between returns and rentals in bike-sharing stations. Source: own work based on OpenStreetMap.
Figure 4.
Difference between rentals and returns and between returns and rentals in bike-sharing stations. Source: own work based on OpenStreetMap.

Figure 5.
The bike rentals and returns in the bike-sharing system in Katowice in 2018, (a) number of rentals from individual station, (b) number of returns to individual station.
Figure 5.
The bike rentals and returns in the bike-sharing system in Katowice in 2018, (a) number of rentals from individual station, (b) number of returns to individual station.


Figure 6.
Bicycle trips between bike-sharing stations. Source: own work based on OpenStreetMap.

Figure 7.
Paths for 23 most heavily loaded relations between bike-sharing stations. Source: own work based on OpenStreetMap.
Figure 7.
Paths for 23 most heavily loaded relations between bike-sharing stations. Source: own work based on OpenStreetMap.

Figure 8.
Distributions of the bicycle trips as a function of their length, (a) frequency distribution, (b) cumulative distribution.
Figure 8.
Distributions of the bicycle trips as a function of their length, (a) frequency distribution, (b) cumulative distribution.


Figure 9.
Volume of bicycle traffic at individual sections of the road and street network (excluding bicycle paths). Source: own work based on OpenStreetMap.
Figure 9.
Volume of bicycle traffic at individual sections of the road and street network (excluding bicycle paths). Source: own work based on OpenStreetMap.

Figure 10.
Distributions of the total length of sections for individual categories as a function of the number of bike trips, (a) category Il, (b) category IIl, (c) category IIIl, (d) category IVl, (e) category Vl, (f) category VIl.
Figure 10.
Distributions of the total length of sections for individual categories as a function of the number of bike trips, (a) category Il, (b) category IIl, (c) category IIIl, (d) category IVl, (e) category Vl, (f) category VIl.


Table 1.
Detailed description of analyzed studies.
| Authors and Reference | Year | Country | Data | Description |
|---|---|---|---|---|
| Winters, Davidson, Kao [35] | 2011 | Canada | survey of cyclists in Vancouver | investigation of factors that influence the decision on taking a bike |
| Palomares, Gutierrez, Latorre [43] | 2012 | Spain | data from Madrid | employment of GIS-based methods to determine the locations of bike-sharing stations |
| Ghandehari, Pouyandeh, Javadi [42] | 2013 | Iran | data from bike system in Isfahan | employment of mathematical programming and MCDM methods to determine locations of bike-sharing stations |
| Croci, Rossi [44] | 2014 | Italy | data from bike-sharing system in Milan | employment of econometric analysis to examine the influence of selected factors on bike-sharing ridership |
| Buehler, Dill [39] | 2015 | United States | n/a | analysis of existing studies on bike ridership |
| El-Assi, Salah Mahmoud, Nurul Habib [37] | 2015 | Canada | bike ridership data from Toronto, 2013 | employment of the regression analysis to examine the influence of built environment factors, socio-economic factors, and demographic factors on ridership |
| Noland, Smart, Guo [34] | 2016 | United States | trip data from New York, 2014 | use of spatial models and Bayesian regression models on estimation of trip generation at bike-sharing stations |
| Gebhart, Noland [31] | 2017 | Sweden | n/a | analysis of existing studies on the influence of weather conditions on bike ridership |
| Zhang, Thomas, Brussel, Van Maarseveen [29] | 2017 | China | trip data from Zhongshan’s (China) public bike system | employment of multiple linear regression model to examine the influence of built environment factors on trip demand |
| Yu, Xiaohu, Jinhua [38] | 2018 | Singapore | GPS data on dockless bikes trips from nine days | employment of autoregressive models to analyze the spatiotemporal patterns of bike usage |
| Kabak, Erbas, Cetinkaya, Ozceylan [40] | 2018 | Turkey | data on bike-sharing stations from Karsiyaka, Izmir | employment of GIS-tools, MCDM methods, and AHP to determine the location of bike-sharing stations |
| Pazdan [32] | 2020 | Poland | n/a | analysis of existing studies on the influence of weather on bike risk exposure |
| Nogal, Jiménez [36] | 2020 | Netherlands and Spain | n/a | analysis of factors that may influence bike-sharing ridership (based on literature review) |
| Banerjee, Kabir Muhib, Khadem, Chavis [41] | 2020 | United States | GPS data on bike-sharing trips from Baltimore | modification of Huff’s gravity model and GIS-tools to determine the locations of bike-sharing stations |
Table 2.
Attributes of bike-sharing stations.
| Group of the Attributes | Attribute |
|---|---|
| descriptive | number |
| name | |
| spatial | longitude |
| latitude | |
| bike traffic demand | number of rentals in analyzed period |
| number of returns in analyzed period |
Table 3.
Categories of intersections.
| Category | Type of Intersection | The Way the Cyclist Moves | |
|---|---|---|---|
| Before the Intersection | After the Intersection | ||
| Ip | intersection with traffic lights | the road | the road |
| IIp | the sidewalk | the sidewalk | |
| IIIp | intersection without traffic lights | the major road | the road |
| IVp | the minor road | the road | |
| Vp | the sidewalk | the sidewalk | |
| VIp | the sidewalk | the road | |
| VIIp | the road | the sidewalk | |
Table 4.
Stations with the highest and smallest total number of rentals and returns of bicycles.
| Station IDs in Hierarchy | Station Name | Number of Rentals | Number of Returns | Total Number of Rentals and Returns |
|---|---|---|---|---|
| 1 | Katowice Rynek | 23,787 | 25,384 | 49,171 |
| 2 | Silesia City Center | 7773 | 7119 | 14,892 |
| 3 | KTBS—Krasińskiego 14 | 7268 | 7123 | 14,391 |
| … | … | … | … | … |
| 52 | PKN Orlen—Bocheńskiego | 76 | 74 | 150 |
| 53 | ING Roździeńska | 47 | 23 | 70 |
| 54 | PKN Orlen—Al. Roździeńskiego | 11 | 16 | 27 |
Table 5.
Set of relations selected for further analysis.
| Relation IDL in the Hierarchy | Name of the Start Station | The IDs of the Start Station | Name of the End Station | The IDs of the End Station | Number of Bicycle Trips |
|---|---|---|---|---|---|
| 1 | KTBS—Krasińskiego 14 | 3 | Katowice Rynek | 1 | 3423 |
| 2 | Katowice Rynek | 1 | KTBS—Krasińskiego 14 | 3 | 3212 |
| 3 | Silesia City Center | 2 | Katowice Rynek | 1 | 2290 |
| 4 | Katowice Rynek | 1 | Murapol Mariacka | 4 | 2008 |
| 5 | Katowice Rynek | 1 | Silesia City Center | 2 | 1804 |
| 6 | Ul. Powstańców—Biblioteka Śląska | 6 | Katowice Rynek | 1 | 1795 |
| 7 | Murapol Mariacka | 4 | Katowice Rynek | 1 | 1783 |
| 8 | Politechnika Śląska | 14 | Katowice Rynek | 1 | 1657 |
| 9 | COP24 | 5 | Katowice Rynek | 1 | 1596 |
| 10 | Plac Sejmu Śląskiego | 8 | Katowice Rynek | 1 | 1588 |
| 11 | Katowice Rynek | 1 | Ul. Powstańców—Biblioteka Śląska | 6 | 1545 |
| 12 | Katowice Rynek | 1 | COP24 | 5 | 1539 |
| 13 | Katowice Rynek | 1 | Plac Sejmu Śląskiego | 8 | 1492 |
| 14 | Katowice Rynek | 1 | Politechnika Śląska | 14 | 1436 |
| 15 | Koszutka—Plac Gwarków | 16 | Katowice Rynek | 1 | 1295 |
| 16 | Katowice Rynek | 1 | Murapol Chorzowska | 9 | 1206 |
| 17 | Murapol Mariacka | 4 | KTBS—Krasińskiego 14 | 3 | 1178 |
| 18 | Silesia City Center | 2 | Al. Bolesława Krzywoustego | 7 | 1147 |
| 19 | Katowice Rynek | 1 | Koszutka—Plac Gwarków | 16 | 1088 |
| 20 | Murapol Chorzowska | 9 | Silesia City Center | 2 | 1073 |
| 21 | Murapol Chorzowska | 9 | Katowice Rynek | 1 | 1046 |
| 22 | KTBS—Krasińskiego 14 | 3 | Murapol Mariacka | 4 | 1034 |
| 23 | Załęże Skwer S. Barei | 11 | Katowice Rynek | 1 | 1006 |
Table 6.
Values of the measure (%).
| IDL | Length of the Path (m) | Categories of the Sections | |||||||||||
|---|---|---|---|---|---|---|---|---|---|---|---|---|---|
| Sections of Road and Street Networks | Sections of Bicycle Infrastructure | ||||||||||||
| Il | IIl | IIIl | IVl | Vl | VIl | VIIl | Ib | IIb | IIIb | IVb | Vb | ||
| 1 | 1461.2 | 86.4 | 0.0 | 0.0 | 0.0 | 0.0 | 13.1 | 0.5 | 0.0 | 0.0 | 0.0 | 0.0 | 0.0 |
| 2 | 1500.7 | 40.1 | 0.0 | 0.0 | 30.3 | 16.4 | 13.1 | 0.0 | 0.0 | 0.0 | 0.0 | 0.0 | 0.0 |
| 3 | 2163.7 | 16.0 | 18.9 | 8.2 | 16.7 | 0.0 | 7.2 | 0.0 | 9.5 | 3.6 | 19.9 | 0.0 | 0.0 |
| 4 | 604.1 | 0.0 | 0.0 | 0.0 | 0.0 | 0.0 | 100.0 | 0.0 | 0.0 | 0.0 | 0.0 | 0.0 | 0.0 |
| 5 | 2163.7 | 16.0 | 18.9 | 8.2 | 16.7 | 0.0 | 7.2 | 0.0 | 9.5 | 3.6 | 19.9 | 0.0 | 0.0 |
| 6 | 1466.5 | 56.0 | 0.4 | 0.0 | 0.0 | 30.5 | 13.1 | 0.0 | 0.0 | 0.0 | 0.0 | 0.0 | 0.0 |
| 7 | 604.1 | 0.0 | 0.0 | 0.0 | 0.0 | 0.0 | 100.0 | 0.0 | 0.0 | 0.0 | 0.0 | 0.0 | 0.0 |
| 8 | 1122.5 | 79.1 | 0.6 | 0.0 | 0.5 | 2.8 | 17.1 | 0.0 | 0.0 | 0.0 | 0.0 | 0.0 | 0.0 |
| 9 | 1111.0 | 0.0 | 7.2 | 0.0 | 0.0 | 0.0 | 22.3 | 0.0 | 0.0 | 54.3 | 16.3 | 0.0 | 0.0 |
| 10 | 941.4 | 4.3 | 0.0 | 0.0 | 0.0 | 0.0 | 0.0 | 0.0 | 0.0 | 95.7 | 0.0 | 0.0 | 0.0 |
| 11 | 1466.5 | 56.0 | 0.4 | 0.0 | 0.0 | 30.5 | 13.1 | 0.0 | 0.0 | 0.0 | 0.0 | 0.0 | 0.0 |
| 12 | 1111.0 | 0.0 | 7.2 | 0.0 | 0.0 | 0.0 | 22.3 | 0.0 | 0.0 | 54.3 | 16.3 | 0.0 | 0.0 |
| 13 | 941.4 | 4.3 | 0.0 | 0.0 | 0.0 | 0.0 | 0.0 | 0.0 | 0.0 | 95.7 | 0.0 | 0.0 | 0.0 |
| 14 | 1122.5 | 79.1 | 0.6 | 0.0 | 0.5 | 2.8 | 17.1 | 0.0 | 0.0 | 0.0 | 0.0 | 0.0 | 0.0 |
| 15 | 1387.2 | 56.2 | 0.0 | 0.0 | 0.0 | 0.0 | 17.9 | 0.4 | 0.0 | 19.7 | 5.9 | 0.0 | 0.0 |
| 16 | 1432.0 | 0.0 | 28.1 | 24.2 | 24.2 | 0.0 | 10.9 | 0.0 | 0.0 | 5.9 | 6.6 | 0.0 | 0.0 |
| 17 | 912.4 | 42.3 | 0.0 | 0.0 | 54.7 | 0.0 | 3.0 | 0.0 | 0.0 | 0.0 | 0.0 | 0.0 | 0.0 |
| 18 | 1939.8 | 24.2 | 5.3 | 0.0 | 0.0 | 0.0 | 10.7 | 0.0 | 19.2 | 36.7 | 3.9 | 0.0 | 0.0 |
| 19 | 1381.8 | 56.4 | 0.0 | 0.0 | 0.0 | 0.0 | 17.9 | 0.0 | 0.0 | 19.7 | 5.9 | 0.0 | 0.0 |
| 20 | 736.0 | 1.0 | 0.0 | 0.0 | 0.0 | 0.0 | 0.0 | 0.0 | 27.9 | 3.3 | 67.9 | 0.0 | 0.0 |
| 21 | 1432.0 | 0.0 | 28.1 | 24.2 | 24.2 | 0.0 | 10.9 | 0.0 | 0.0 | 5.9 | 6.6 | 0.0 | 0.0 |
| 22 | 912.4 | 42.3 | 0.0 | 0.0 | 54.7 | 0.0 | 3.0 | 0.0 | 0.0 | 0.0 | 0.0 | 0.0 | 0.0 |
| 23 | 1485.8 | 22.1 | 1.2 | 0.0 | 0.0 | 31.8 | 44.9 | 0.0 | 0.0 | 0.0 | 0.0 | 0.0 | 0.0 |
Table 7.
Values of the measure [−].
| IDL | Categories of the Intersections of Road and Street Network | Total Number of the Intersections in the Path | ||||||
|---|---|---|---|---|---|---|---|---|
| Ip | IIp | IIIp | IVp | Vp | VIp | VIIp | ||
| 1 | 0 | 3 | 0 | 1 | 5 | 0 | 0 | 9 |
| 2 | 2 | 1 | 0 | 0 | 5 | 1 | 1 | 10 |
| 3 | 2 | 3 | 1 | 0 | 2 | 2 | 1 | 11 |
| 4 | 0 | 1 | 0 | 0 | 1 | 0 | 0 | 2 |
| 5 | 2 | 3 | 1 | 0 | 2 | 2 | 1 | 11 |
| 6 | 1 | 1 | 1 | 0 | 4 | 1 | 1 | 9 |
| 7 | 0 | 1 | 0 | 0 | 1 | 0 | 0 | 2 |
| 8 | 0 | 1 | 0 | 0 | 3 | 1 | 0 | 5 |
| 9 | 0 | 2 | 0 | 1 | 7 | 0 | 0 | 10 |
| 10 | 0 | 0 | 0 | 0 | 7 | 0 | 0 | 7 |
| 11 | 1 | 1 | 1 | 0 | 4 | 1 | 1 | 9 |
| 12 | 0 | 2 | 0 | 1 | 7 | 0 | 0 | 10 |
| 13 | 0 | 0 | 0 | 0 | 7 | 0 | 0 | 7 |
| 14 | 0 | 1 | 0 | 0 | 3 | 1 | 0 | 5 |
| 15 | 0 | 2 | 0 | 0 | 4 | 0 | 0 | 6 |
| 16 | 2 | 1 | 4 | 1 | 0 | 0 | 1 | 9 |
| 17 | 2 | 0 | 0 | 0 | 2 | 1 | 0 | 5 |
| 18 | 0 | 4 | 1 | 0 | 1 | 0 | 0 | 6 |
| 19 | 0 | 2 | 0 | 0 | 4 | 0 | 0 | 6 |
| 20 | 0 | 3 | 0 | 0 | 0 | 0 | 0 | 3 |
| 21 | 2 | 1 | 4 | 1 | 0 | 0 | 1 | 9 |
| 22 | 2 | 0 | 0 | 0 | 2 | 1 | 0 | 5 |
| 23 | 1 | 1 | 3 | 0 | 1 | 2 | 1 | 9 |
| Sum | 17 | 34 | 16 | 5 | 72 | 13 | 8 | 165 |
Table 8.
Ranking of 20 sections according to the volume of bicycle traffic.
| Section IDse in the Hierarchy | Volume of Bicycle Traffic (Bikes/8 Months) | Length of the Section (m) | Category of the Section |
|---|---|---|---|
| 1 | 11,641 | 16 | VIl |
| 2 | 8429 | 97 | VIl |
| 3 | 8141 | 178 | IIIl |
| 4 | 8141 | 111 | IVl |
| 5 | 8141 | 22 | IIl |
| 6 | 8141 | 84 | IVl |
| 7 | 8141 | 42 | IIl |
| 8 | 8141 | 24 | IIl |
| 9 | 8141 | 50 | IVl |
| 10 | 8141 | 21 | IVl |
| 11 | 8141 | 117 | IIl |
| 12 | 8141 | 166 | IIl |
| 13 | 8141 | 14 | IIl |
| 14 | 8141 | 29 | IVl |
| 15 | 8141 | 37 | IVl |
| 16 | 8141 | 15 | IVl |
| 17 | 8141 | 156 | VIl |
| 18 | 7850 | 13 | Il |
| 19 | 7850 | 157 | Il |
| 20 | 7850 | 226 | Il |
Table 9.
Categories of the sections of road and street network together with total lengths of the sections and their share in total length for all analyzed paths between pair of bike-sharing stations.
Table 9.
Categories of the sections of road and street network together with total lengths of the sections and their share in total length for all analyzed paths between pair of bike-sharing stations.
| Category of Section | Total Length of Sections of the Category (m) | Share of the Length of Sections of the Category in Total Length of all Sections (%) | Number of Sections of the Category | Average Length of Section of the Category (m) |
|---|---|---|---|---|
| Il | 3443 | 0.41 | 72 | 47.82 |
| IIl | 631 | 0.07 | 17 | 37.12 |
| IIIl | 458 | 0.05 | 3 | 152.67 |
| IVl | 753 | 0.09 | 12 | 62.75 |
| Vl | 1009 | 0.12 | 11 | 91.73 |
| VIl | 2172 | 0.26 | 23 | 94.43 |
| VIIl | 5 | 0.00 | 1 | 5.00 |
Publisher’s Note: MDPI stays neutral with regard to jurisdictional claims in published maps and institutional affiliations. |
© 2021 by the authors. Licensee MDPI, Basel, Switzerland. This article is an open access article distributed under the terms and conditions of the Creative Commons Attribution (CC BY) license (https://creativecommons.org/licenses/by/4.0/).
Share and Cite
MDPI and ACS Style
Żochowska, R.; Jacyna, M.; Kłos, M.J.; Soczówka, P. A GIS-Based Method of the Assessment of Spatial Integration of Bike-Sharing Stations. Sustainability 2021, 13, 3894. https://doi.org/10.3390/su13073894
AMA Style
Żochowska R, Jacyna M, Kłos MJ, Soczówka P. A GIS-Based Method of the Assessment of Spatial Integration of Bike-Sharing Stations. Sustainability. 2021; 13(7):3894. https://doi.org/10.3390/su13073894
Chicago/Turabian StyleŻochowska, Renata, Marianna Jacyna, Marcin Jacek Kłos, and Piotr Soczówka. 2021. "A GIS-Based Method of the Assessment of Spatial Integration of Bike-Sharing Stations" Sustainability 13, no. 7: 3894. https://doi.org/10.3390/su13073894
Note that from the first issue of 2016, this journal uses article numbers instead of page numbers. See further details here.