Article

Comparison of Projection in Meteorological and Hydrological Droughts in the Cheongmicheon Watershed for RCP4.5 and SSP2-4.5

1
Faculty of Civil Engineering, Seoul National University of Science and Technology, Seoul 01811, Korea
2
Han River Flood Control Office, Ministry of Environment, Seoul 06501, Korea
3
Faculty of Civil Engineering, Kangwon National University, 1 Gangwon-do 24341, Korea
4
Faculty of Civil Engineering, Chungnam National University, Daejeon 34134, Korea
5
Department of Environmental Sciences, Federal University Dutse, Dutse P.M.B. 7156, Nigeria
*
Author to whom correspondence should be addressed.
Sustainability 2021, 13(4), 2066; https://doi.org/10.3390/su13042066
Submission received: 31 December 2020 / Revised: 8 February 2021 / Accepted: 9 February 2021 / Published: 15 February 2021

Abstract

:
Due to the recent appearance of shares socioeconomic pathway (SSP) scenarios, there have been many studies that compare the results between Coupled Model Intercomparison Project (CMIP)5 and CMIP6 general circulation models (GCMs). This study attempted to project future drought characteristics in the Cheongmicheon watershed using SSP2-4.5 of Australian Community Climate and Earth System Simulator-coupled model (ACCESS-CM2) in addition to Representative Concentration Pathway (RCP) 4.5 of ACCESS 1-3 of the same institute. The historical precipitation and temperature data of ACCESS-CM2 were generated better than those of ACCESS 1-3. Two meteorological drought indices, namely, Standardized Precipitation Index (SPI) and Standardized Precipitation Evapotranspiration Index (SPEI) were used to project meteorological drought while a hydrological drought index, Standardized Streamflow Index (SDI), was used to project the hydrological drought characteristics. The metrological data of GCMs were bias-corrected using quantile mapping method and the streamflow was obtained using Soil and Water Assessment Tool (SWAT) and bias-corrected meteorological data. As a result, there were large differences of drought occurrences and severities between RCP4.5 and SSP2-4.5 for the values of SPI, SPEI, and SDI. The differences in the minimum values of drought index between near (2021–2060) and far futures (2061–2100) were very small in SSP2-4.5, while those in RCP4.5 were very large. In addition, the longest drought period from SDI was the largest because the variation in precipitation usually affects the streamflow with a lag. Therefore, it was concluded that it is important to consider both CMIP5 and CMIP6 GCMs in establishing the drought countermeasures for the future period.

1. Introduction

Since the 1900s, the global average concentration of greenhouse gases have increased rapidly, leading to the changes in the characteristics of meteorological variables and more occurrences in extreme events [1]. Studies have reported an increase in the frequency and intensity of disasters such as flooding, drought, heatwaves, etc. due to the impacts of climate change [2,3,4]. Of the natural disasters, droughts are critical as they can occur in both wet and dry climates [5] and they can be prolonged with devastating impacts. A drought can be generally classified as meteorological, hydrological, agricultural, and social. The other droughts are triggered by the meteorological drought as it occurs as a result of inadequate precipitation or atmospheric water balance from a long-term mean. In 2014, Brazil experienced its worst droughts in 80 years [6]; there were consecutive drought events in the United States between 2011 and 2016, leading to several billion dollar loses in agriculture [7]. In East Africa, three countries, namely, Ethiopia, Somalia, and Kenya, were ravaged by droughts between 2011 and 2012 that affected about 13 million people and caused the loss of lives and livelihoods [8].
In South Korea, there have been abnormal meteorological events such as severe long-term drought of 2013–2015. Therefore, there have been tremendous studies on the analysis of drought characteristics in Korea for the historical periods [9,10,11,12] and future projection using general circulation models (GCMs) [13,14,15,16]. For the quantitative assessment of drought characteristics, various droughts indices can be used such as Standardized Precipitation Index [17], Standardized Precipitation Evapotranspiration Index [18], and Streamflow Drought Index [19]. Most studies concluded that droughts have become more frequent and more severe [20] and will be much longer and larger [21].
Intergovernmental Panel on Climate Change (IPCC) developed new climate scenarios for Assessment Report 6 (AR6) shared socioeconomic pathways (SSPs) that considers social and economic factors together. SSPs scenarios are defined by various land use and greenhouse gas emission constraint conditions obtained according to the integrated evaluation model [22]. Therefore, many global climate research centers that had developed their own GCMs for RCP scenarios are upgrading or have improved for new SSP scenarios. The new GCMs showed better performances for the historical periods due to the use of more observed data and the improvement of physical simulation engine for South Korea [23], China [24,25], India [26], Tibet [27], Iran [28], Africa [29], and South Asia [30]. However, Zhu et al. [31] found the difficulties in simulating several meteorological variables such as cold nights and warm days over the Tibetan Plateau while better performances in most precipitation indices were found over China. Jiang et al. [32] found that models have improved from Coupled Model Intercomparison Project 5 (CMIP5) to CMIP6 for climatological temperature and precipitation and winter monsoon but display little improvement for the interannual temperature and precipitation variability and summer monsoon in East Asia monsoon. Therefore, the comparative studies between Coupled Model Intercomparison Project 5 (CMIP5) and CMIP6 have been conducted all over the world in terms of spatial distributions [33], uncertainty analysis [34], future projections [35], and drought characteristics of India [36] and China [37,38].
This study projected the drought characteristics from RCP4.5 of CMIP5 for Australian Community Climate and Earth System Simulator 1-3 (ACCESS1-3) and SSP2-4.5 of CMIP6 for ACCESS CM2 using three drought indices. Two meteorological drought indices, Standardized Precipitation Index (SPI), and Standardized Precipitation Evapotranspiration Index (SPEI) were applied, and a hydrological drought index, Streamflow Drought Index (SDI), was used in determining drought from the simulation results of Soil and Water Assessment Tool (SWAT) using the two GCMs. The study area is the Cheongmicheon watershed, which has suffered from frequent droughts and thus has been a popular subject in Korea [39].

2. Methodology

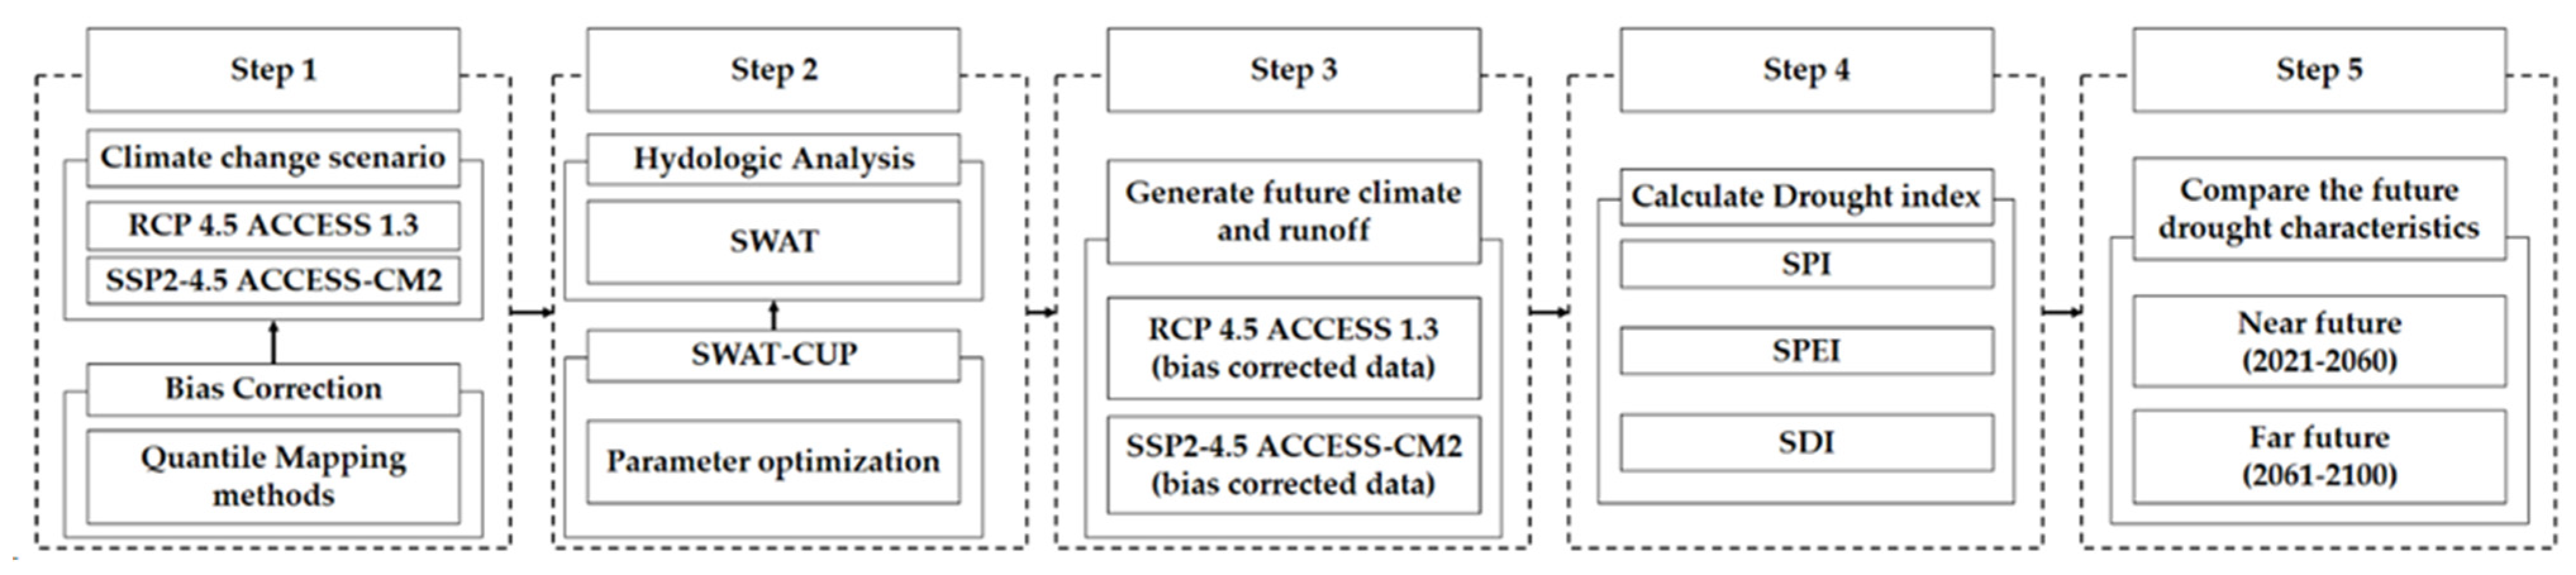
2.1. Study Procedure

This study consists of 5 steps as shown in Figure 1. The first step is to perform the bias correction for the simulations of RCP4.5 of ACCESS1-3 and SSP2-4.5 of ACCESS-CM2 using 3 quantile mapping methods. Here, the statistical performances for ACCESS1-3 and ACCESS-CM2 are compared. The second step is to formulate the SWAT model for the Cheongmicheon watershed. The calibration procedure is completed using SWAT-CUP (Calibration and Uncertainty Procedure; Abbaspour et al. [40]) and the observed discharges at Wonbu Bridge station. The third step is to generate the climate and runoff projections for the historical and future periods. The future scenarios for RCP4.5 and SSP2-4.5 were the bias-corrected data. The fourth step is to calculate three drought indices SPI, SPEI, and SDI for RCP4.5 and SSP2-4.5. The future periods are divided into two separate periods: near (2021–2060) and far (2061–2100). The fifth step is to compare the future drought characteristics for near and far futures between RCP4.5 and SSP2-4.5.

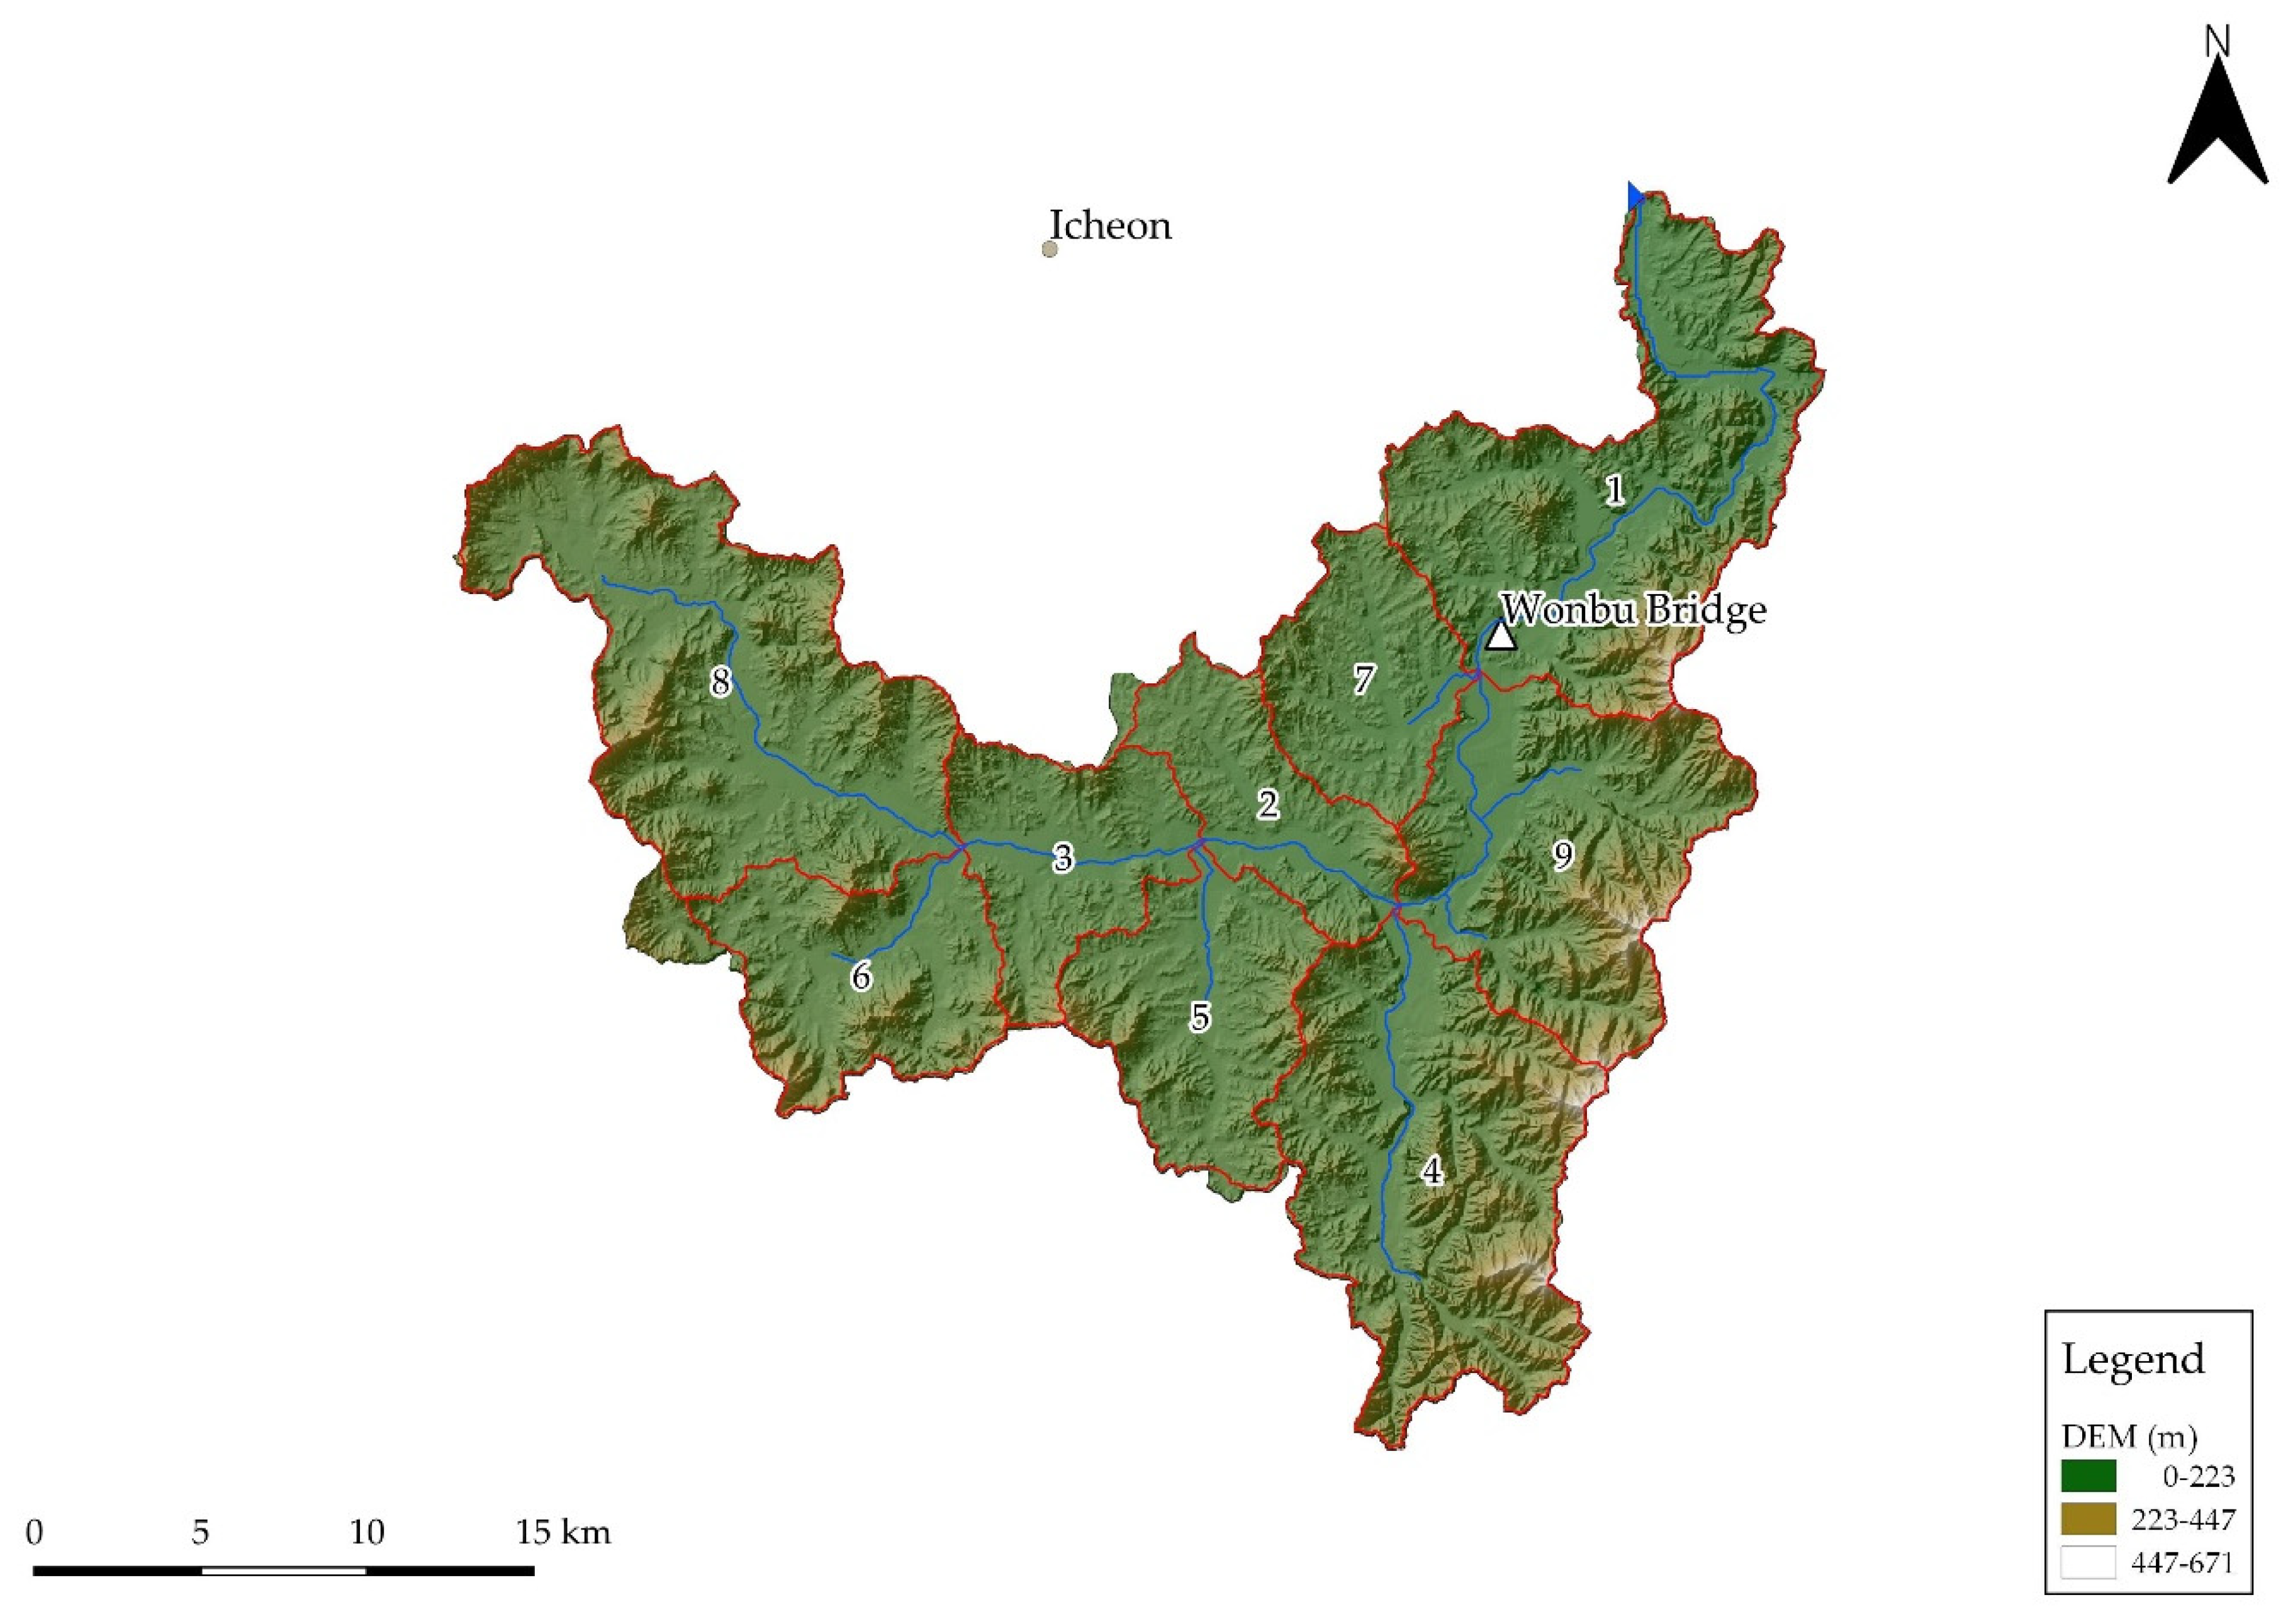
2.2. Study Area and Datasets

The Cheongmicheon watershed selected in this study is located at 37°34′12″–37.6000° N and 127°0′23″–127.0639° E. The Cheongmicheon is the first tributary of the Han River, with a watershed area of 595.13 km2 and a stream length of 62.76 km. The land uses are forests (44.0%), agricultural land (42.5%), urban areas (5.6%), grasslands (2.7%), water bodies (2.6%), bare lands (1.8%), and wetlands (0.7%). The study area has suffered from frequent droughts since 2014 [41]. Because the Cheongmicheon watershed is one of the watersheds designated by the International Hydrological Program (IHP), it is a watershed with relatively rich long-term hydrological and topographic data [42].
In this study, the Korea Meteorological Administration, the Water Management Information System (WAMIS), and the Environmental Geospatial Information Service were used to collect basic topographic, climate, and hydrologic data. The study area was divided into a total of 9 sub-watersheds on the basis of the Digital Elevation Model (DEM) required for the formulation of SWAT model, as shown in Figure 2. The climate data of the Icheon weather station near the Cheongmicheon watershed and the streamflow data of the Wonbu Bridge were used for the SWAT model. The information of weather and streamflow stations is shown in Table 1.

2.3. GCMs and Future Climate Change Scenarios

The General Circulation Model (GCM) represents the physical processes of the atmosphere, ocean, glaciers, and surface, and is a suitable model for simulating climate change and prediction according to an increase in greenhouse gas concentration. GCM is a model composed of a three-dimensional grid, and the spacing between the grids is composed of a minimum of 250 km and a maximum of 600 km. This study used the ACCESS1-3 for RCP4.5 and ACCESS-CM2 for SSP2-4.5, which all have been developed by the Centre for Australian Weather and Climate Research (CAWCR), a partnership between CSIRO and the Bureau of Meteorology. ACCESS1-3 includes RCP4.5 that stabilizes radiative forcing at 4.5 Wm−2 in the year 2100 without ever exceeding that value, and includes long-term global emissions of greenhouse gases, short-lived species, and land-use-land-cover in a global economic framework [43]. ACCESS-CM2 adopted the SSP scenario that considers social and economic factors together on the basis of radiative forcing. In this study, the SSP2-4.5 scenario was used, assuming that the degree of climate change mitigation and socio-economic development is at an intermediate stage. The information of two GCMs used in this study is shown in Table 2.

2.4. Quantile Mapping Method

Since the GCM is composed of data in the form of a grid, differences in precipitation values and hydrological factors occur when compared to the actual observed points. Because there have been many developed methods for bias correction, the performances of the bias-corrected data were all different according to the selection of method [44]. The quantile mapping is a representative method for the correction of the difference between the simulated value of GCM and the observed, and is one of the most effective bias correction methods [45,46]. In the quantile mapping method, the quantile function should be calculated to make the distribution of simulated GCM values equal to the distribution of observed values, as shown in Equation (1).
P 0 = h ( P m )
where P 0 is observed precipitation, P m is GCM simulated precipitation, and h is transformation function. Thus, the observed precipitation is calculated from the inverse function of the cumulative distribution function (cdf) as shown in Equation (2).
P 0 = F 0 1 ( F m ( P m ) )
where F m is the cdf of P m , and F 0 1 is the inverse function of the cdf of P 0 .
Quantile mapping applied in bias correction included non-parametric quantile mapping, which provides good results for extreme percentiles [45]. This study fits a quantile–quantile plot using a smoothing spline of non-parametric quantile.

2.5. SWAT and SWAT-CUP

The SWAT model can simulate the prediction of the effect of runoff, sediment, and nutrients in the watershed according to changes in various types of soil, land use, and land management conditions over a long period of time in a complex land use watershed [47]. The SWAT model can construct four physical sub-models (hydrology model, soil loss model, nutrient substance model, and stream tracking model) using input data that are relatively easy to access. The hydrological model analysis reflects the hydrological circulation of interception, surface runoff, intermediate runoff, infiltration, base runoff, waterway loss, and evapotranspiration, as shown in Equation (3).
S W t = S W 0 + i = 0 t ( R d a y Q s u r f E a w s e e p Q g w )
where S W 0 is initial soil moisture content (mm), S W t is final soil moisture per day (mm), R d a y is precipitation (mm), Q s u r f is surface runoff (mm), E a is evapotranspiration (mm), W s e e d is penetration, Q g w is groundwater runoff (mm), and t is time (day).
The method of parameter correction of SWAT model can be largely divided into manual calibration and automatic calibration. The SWAT model basically provides a manual correction function, but it is difficult to guarantee the reliability of the simulation result because the correction result may vary according to the user’s skill level depending on subjectivity. To solve this problem, the SWAT-CUP program was developed to provide automatic correction of SWAT parameters. The SWAT also has the advantage of being able to run simulations for large watersheds without extensive monitoring data and has the capability of predicting changes in hydrological parameters under different management practices and physical environmental factors [48,49]. This study used the SUFI2 algorithm, one of the optimization techniques that can quantify and express the uncertainty of parameters by the multivariate uniform distribution of Hypercube [40].
The procedure of the SUFI2 algorithm is as follows.
In the first step, the objective function g ( b ) and the initial uncertainty ranges [ b j ,   a b s _ m e a n ,   b i ,   a b s _ m a x ] for the parameters are defined. In this study, the Nash–Sutcliffe efficiency (NSE) was chosen as the objective function. Here, b j is the j th parameter, j = 1 , , m , and m is the number of parameters to be estimated.
The Latin Hypercube sampling is carried out in the hypercube [ b m i n ,   b m a x ] (initially set to [ b j ,   a b s _ m e a n ,   b j ,   a b s _ m a x ]), and the corresponding objective functions are assessed. The sensitivity matrix J and the parameter covariance matrix C are calculated as follows:
J i j = g i b j   i = 1 , ,   C 2 n ; j = 1 , , m
C = s g 2 ( J T J ) 1
where s g 2 is all combinations of two simulations, and s g 2 is the variance of the objective function values resulting from the n runs.
The 95PPU is calculated. It has two indices, i.e., the p -factor and r -factor. The r -factor is estimated as
r factor = d ¯ x σ x
where σ x is the satandard deviation of the measured variable X , and d ¯ I is the average distance between upper and lower boundary of 95PPU, which is calculated as follows:
d ¯ x = 1 k l = 1 k ( X U X L ) l
where l is a counter; k is the number of observed data points; and Q L (2.5th) and Q U (97.5th) are the lower and upper boundaries of the 95PPU, respectively.
Because parameter uncertainties are initially large, the value of d ¯ tends to be quite large during the first sampling round. Therefore, future sampling rounds are needed with updated parameter ranges.

2.6. Drought Index

2.6.1. Meteorological Drought Index

The SPI was developed to quantify drought at a given time interval (temporal resolution) for precipitation distribution from historical data. This tool can also be used to monitor periods of anomalously wet/dry events. According to McKee et al. [17], SPI calculation is based on the long-term precipitation taken for the required period. The computation of the SPI involves fitting a gamma probability density function (pdf) to a given frequency distribution of rainfall at a station. The α and β parameters of the gamma distribution are estimated for each timescale of interest (i.e., 1, 3, 6, and 12 months) and for each month of the year. The gamma distribution is defined by its pdf:
g ( x ) = 1 β α τ ( α ) x α 1 e x β ,   x 0
where α and β are shape and scale parameters, respectively; x is the rainfall amount; and τ ( α ) is the gamma function. Maximum likelihood solutions are used to estimate α and β . The resulting parameters are then used to find the cumulative probability of observed rainfall event for a given month and timescale. The cumulative probability, after its computation, is transformed to the standard normal random variable z with a mean equal to 0 and the variance of 1, which is the value of the SPI.
SPEI is calculated by the difference between precipitation and potential evapo-transpiration (PET). To determine PET, the Thornthwaite [50] method, which is easy to collect and simple to calculate, is used, and the calculation process is the same as Equation (9).
P E T = 16 K ( 16 T I ) m
where T is monthly average temperature and unit is °C, and I is the year heat index obtained by summing the month ( m ) heat index. Moreover, K is a function of latitude and month.
D i is calculated by the difference between precipitation and evapotranspiration according to different time scale. The drought index is calculated by converting it to a normal distribution [18].
D i = P i P E T i
D n k = i = 0 k 1 P n i P E T n i
where k is the synthesis time scale, and n is the month used in the calculation.

2.6.2. Hydrological Drought Index

SDI, which is a hydrological drought index, is calculated as Equation (12) [19].
S D I i , k = V i , k V ¯ k S k
where V i , k is the flow accumulated during the i th period in the i th year, and V ¯ k and S k represent the average and standard deviation of the accumulated river water, respectively. The critical level is mainly the average V ¯ k . In small scale rivers, the flow rate approximates the Gamma distribution type, and the probability distribution type is distorted. Therefore, the flow rate must be converted to fit the normal distribution. When converting to a two-variable log-normal distribution type, SDI is finally equal to Equation (13), and y i , k is a value obtained by taking the natural logarithm of the amount of river water, such as in Equation (14).
S D I i , k = y i , k y ¯ k S y , k ,   i = 1 , 2 , ,   k = 1 , 2 , 3 , 4
y i , k = ln ( V i , k ) ,   I = 1 , 2 , ,   K = 1 , 2 , 3 , 4
As shown in Table 3, the hydrological drought defined by SPI, SPEI, SDI are extreme drought if the value is less than −2, severe drought if it is less than −1.5, moderate drought if it is less than −1, and mild drought if it is less than 0; if it is more than 0, it is classified as no drought [19].

3. Result

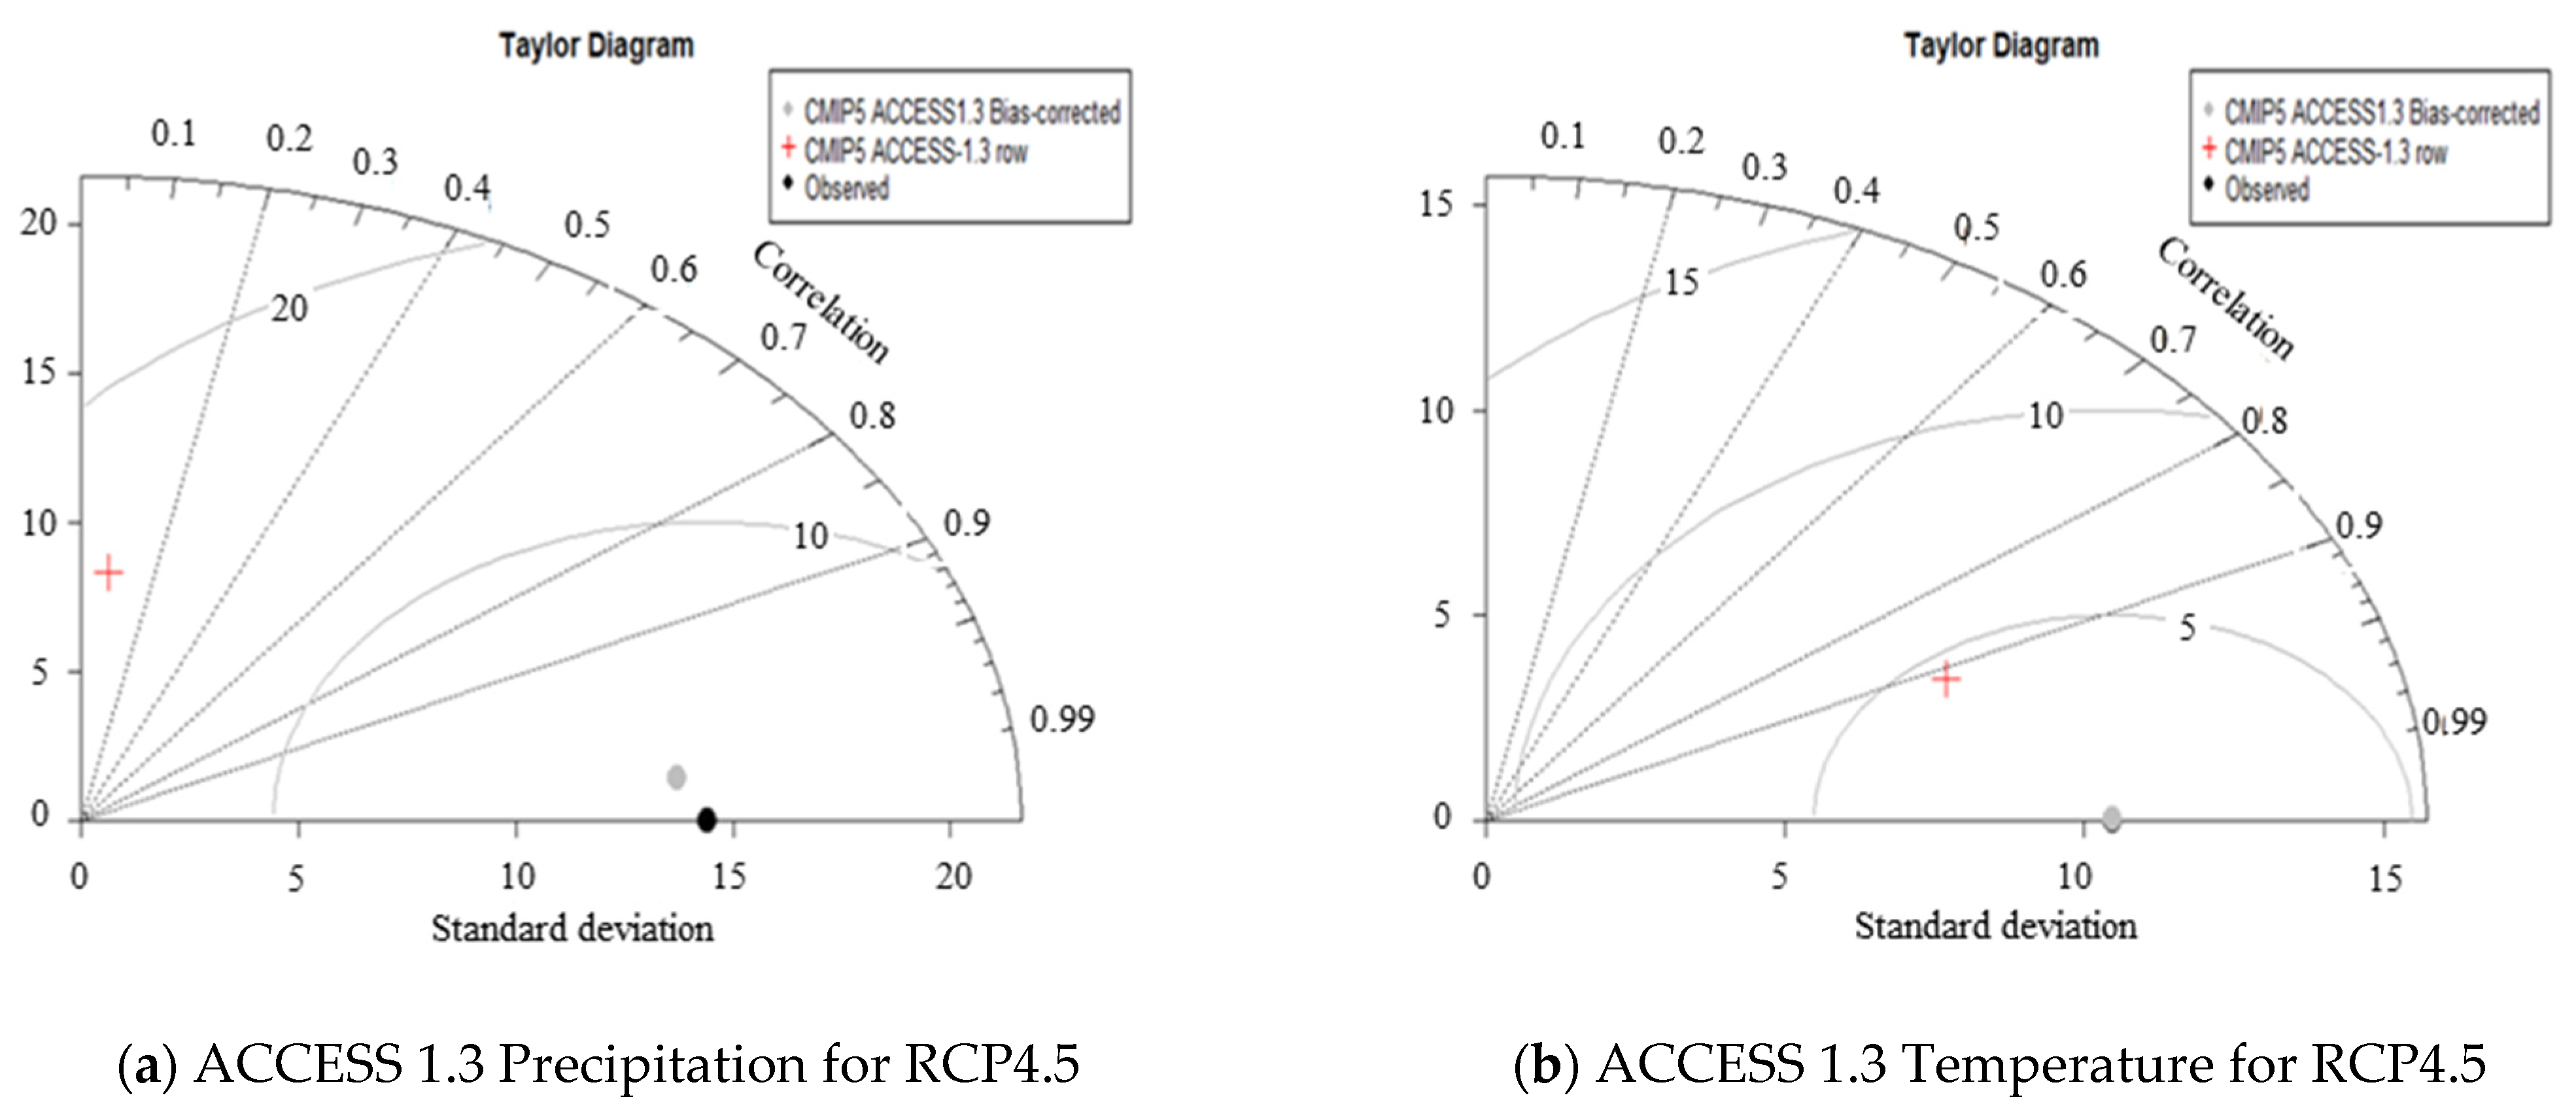
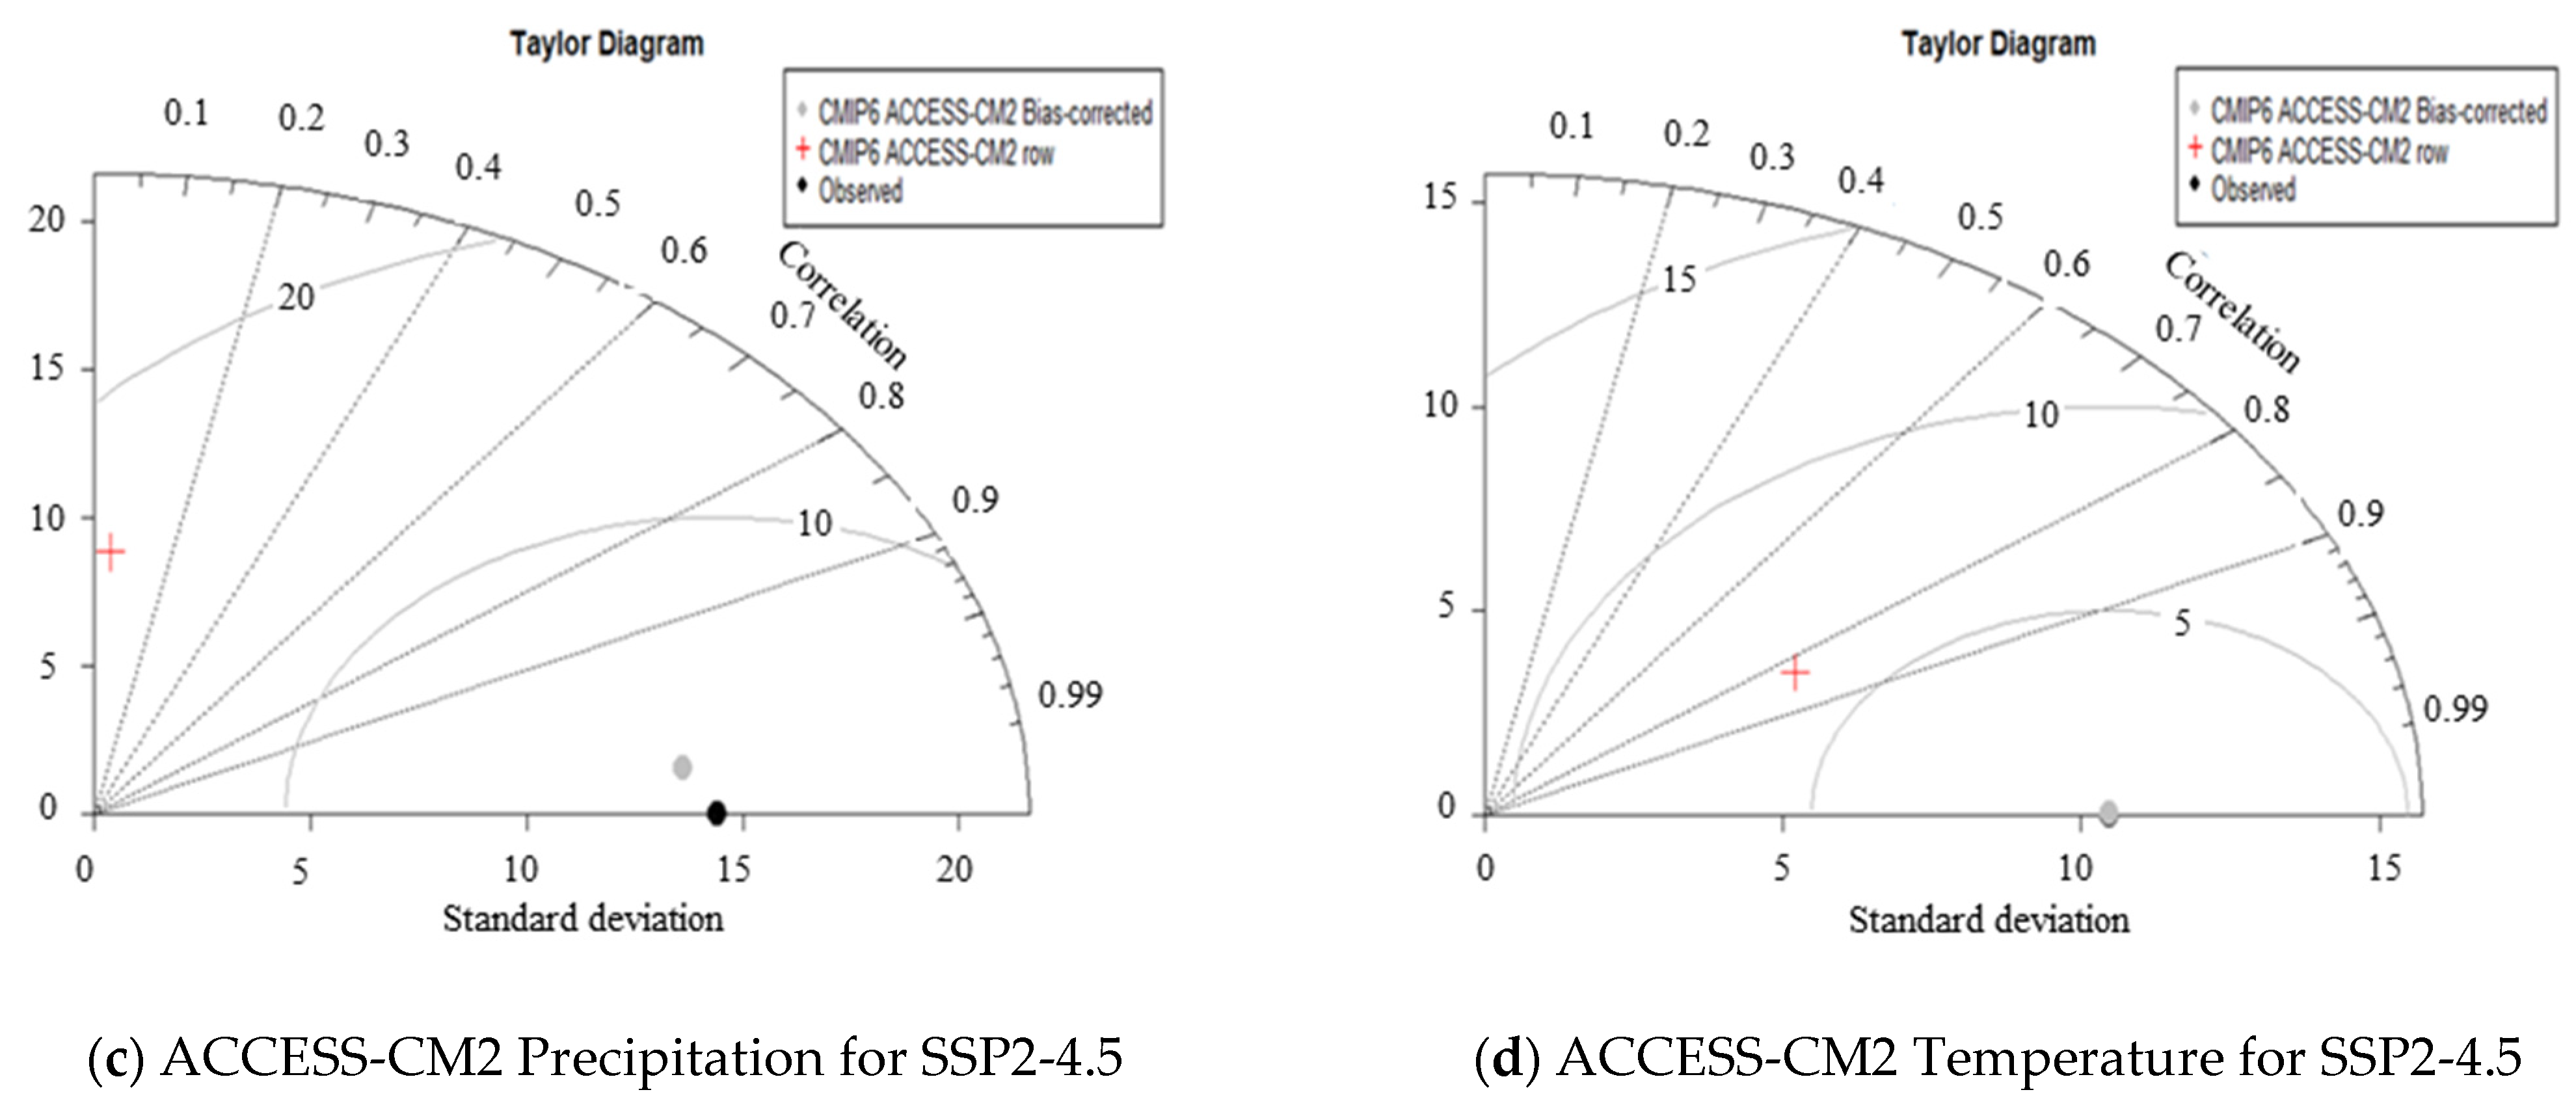
3.1. Step 1: Quantile Mapping Result

The results of bias-correction for precipitation and temperature in RCP 4.5 and SSP2-4.5 future climate change scenarios are shown in Figure 3. As a result of the application of bias correction, all performances were much improved. In the precipitation of RCP4.5, the R2 of precipitation increased from 0.08 to 0.99 and RMSE (root mean square error) decreased from 16.16 to 1.55. The standard deviation increased from 11.80 to 14.11. In the case of temperature, R2 increased from 0.91 before shift correction to 1.00, and RMSE decreased from 4.46 before shift correction to 0.05. The standard deviation increased from 9.51 to 10.48. In SSP2-4.5, the R2 of precipitation increased from 0.04 to 0.99 before bias-correction, and RMSE decreased from 16.65 before shift correction to 1.70. The standard deviation increased from 11.98 to 14.06. In the case of temperature, R2 increased from 0.83 before bias correction to 1.00, and RMSE decreased from 6.60 before shift correction to 0.05. The standard deviation increased from 8.68 to 10.47.

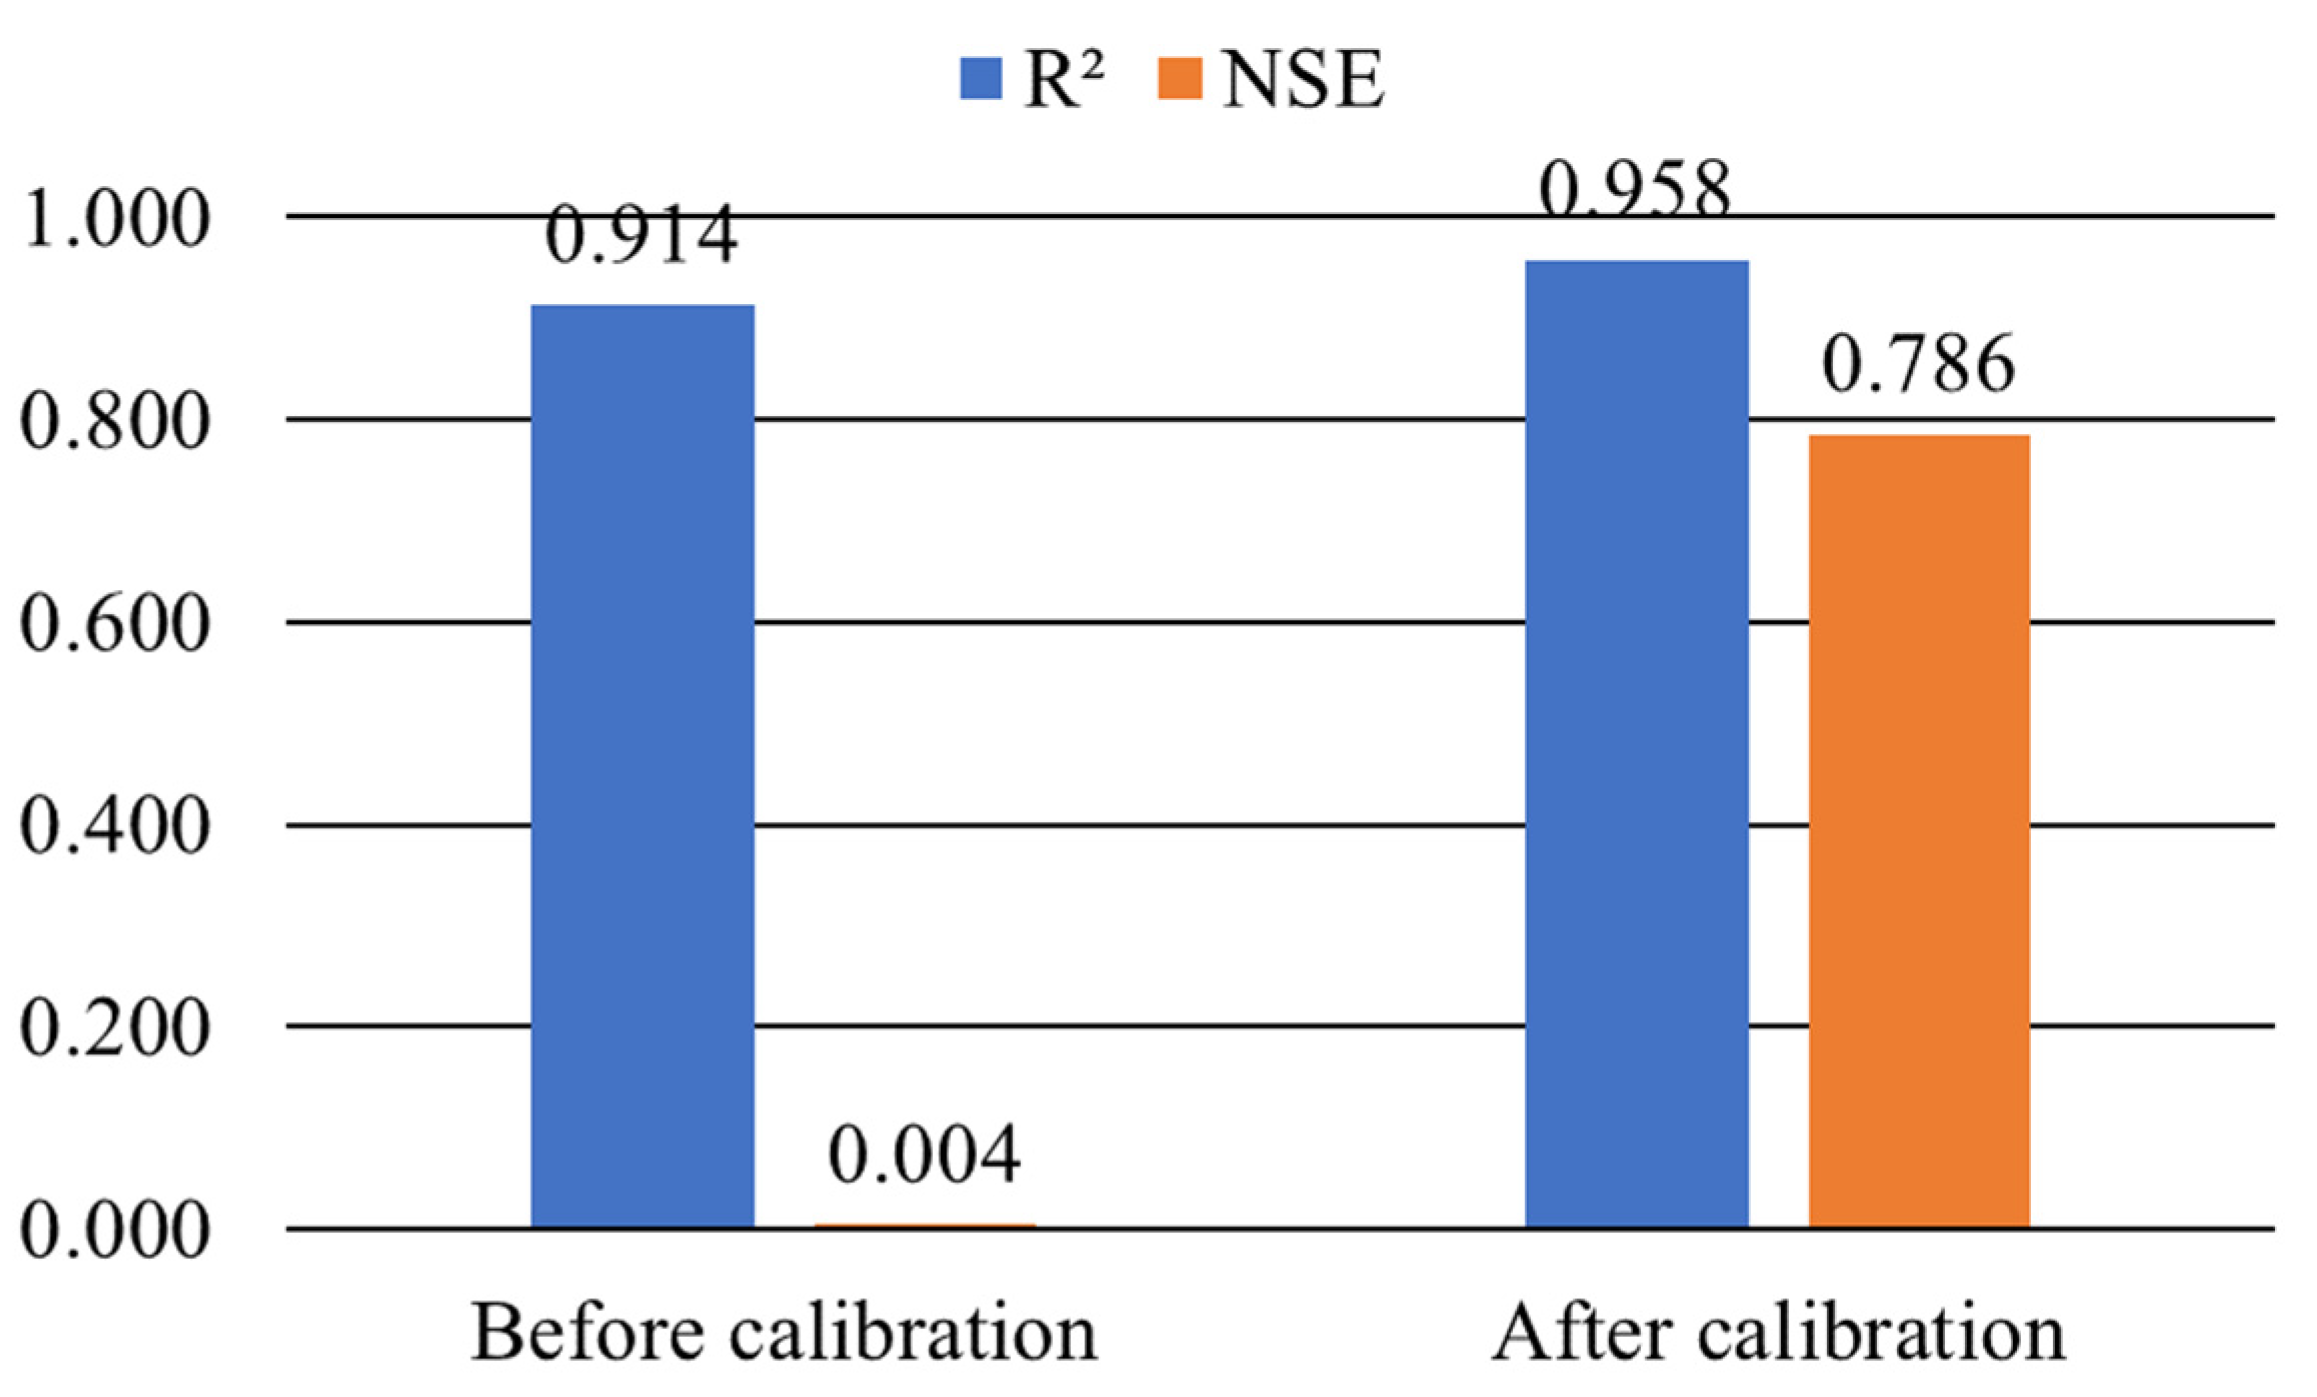
3.2. Step 2: SWAT Formulation

The parameters of SWAT were designated as variables related to groundwater, hydrologic response unit, basin, sub-catchment, soil, channel routing, and management that can affect the runoff process. All required 23 parameters of SWAT were considered and calibrated using the SUFI2 algorithm of SWAT-CUP. In this calibration, NSE was used as an objective function. For the calibration of SWAT, several studies [51,52,53] recommended performing simulations, mainly for 500–1500 times. In this study, parameters were optimized through 1000 iterations. The values of all considered parameters were determined as shown in Table 4.
The analysis results using the observed flow data at the Wonbu Bridge station in 2018 are shown in Figure 4. As a result of calibration, R2 increased from 0.914 to 0.958 and the NSE increased from 0.004 to 0.786. Therefore, it was confirmed that the SWAT model was well formulated.

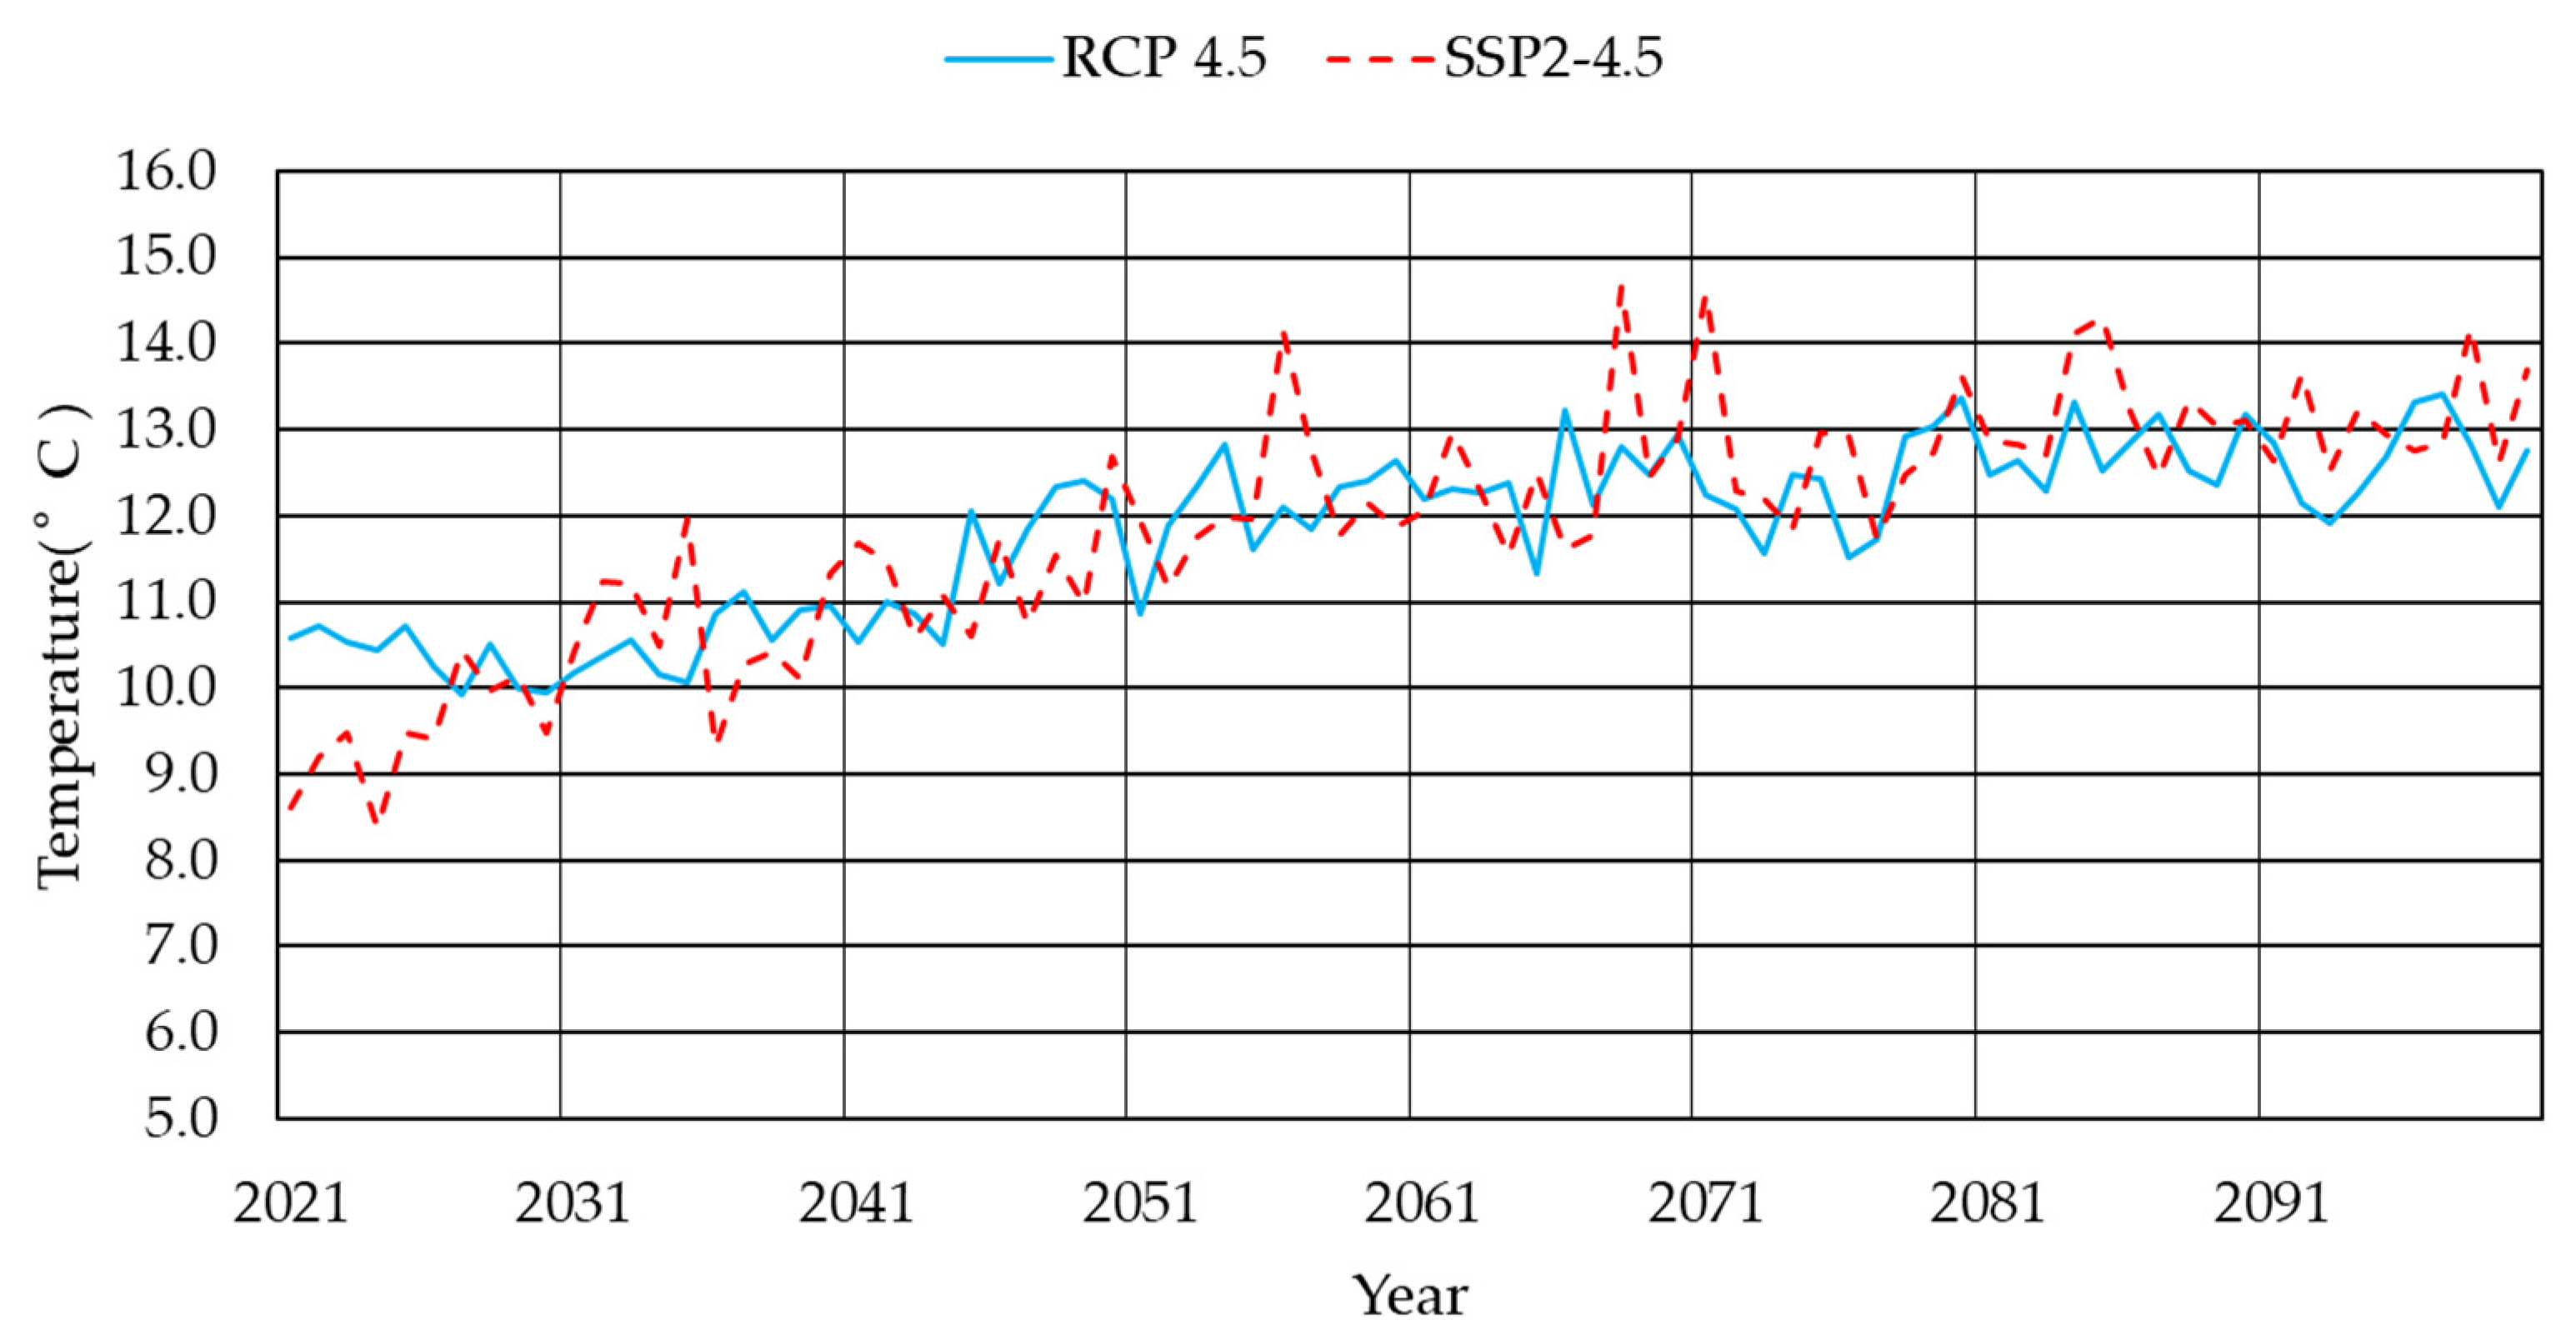
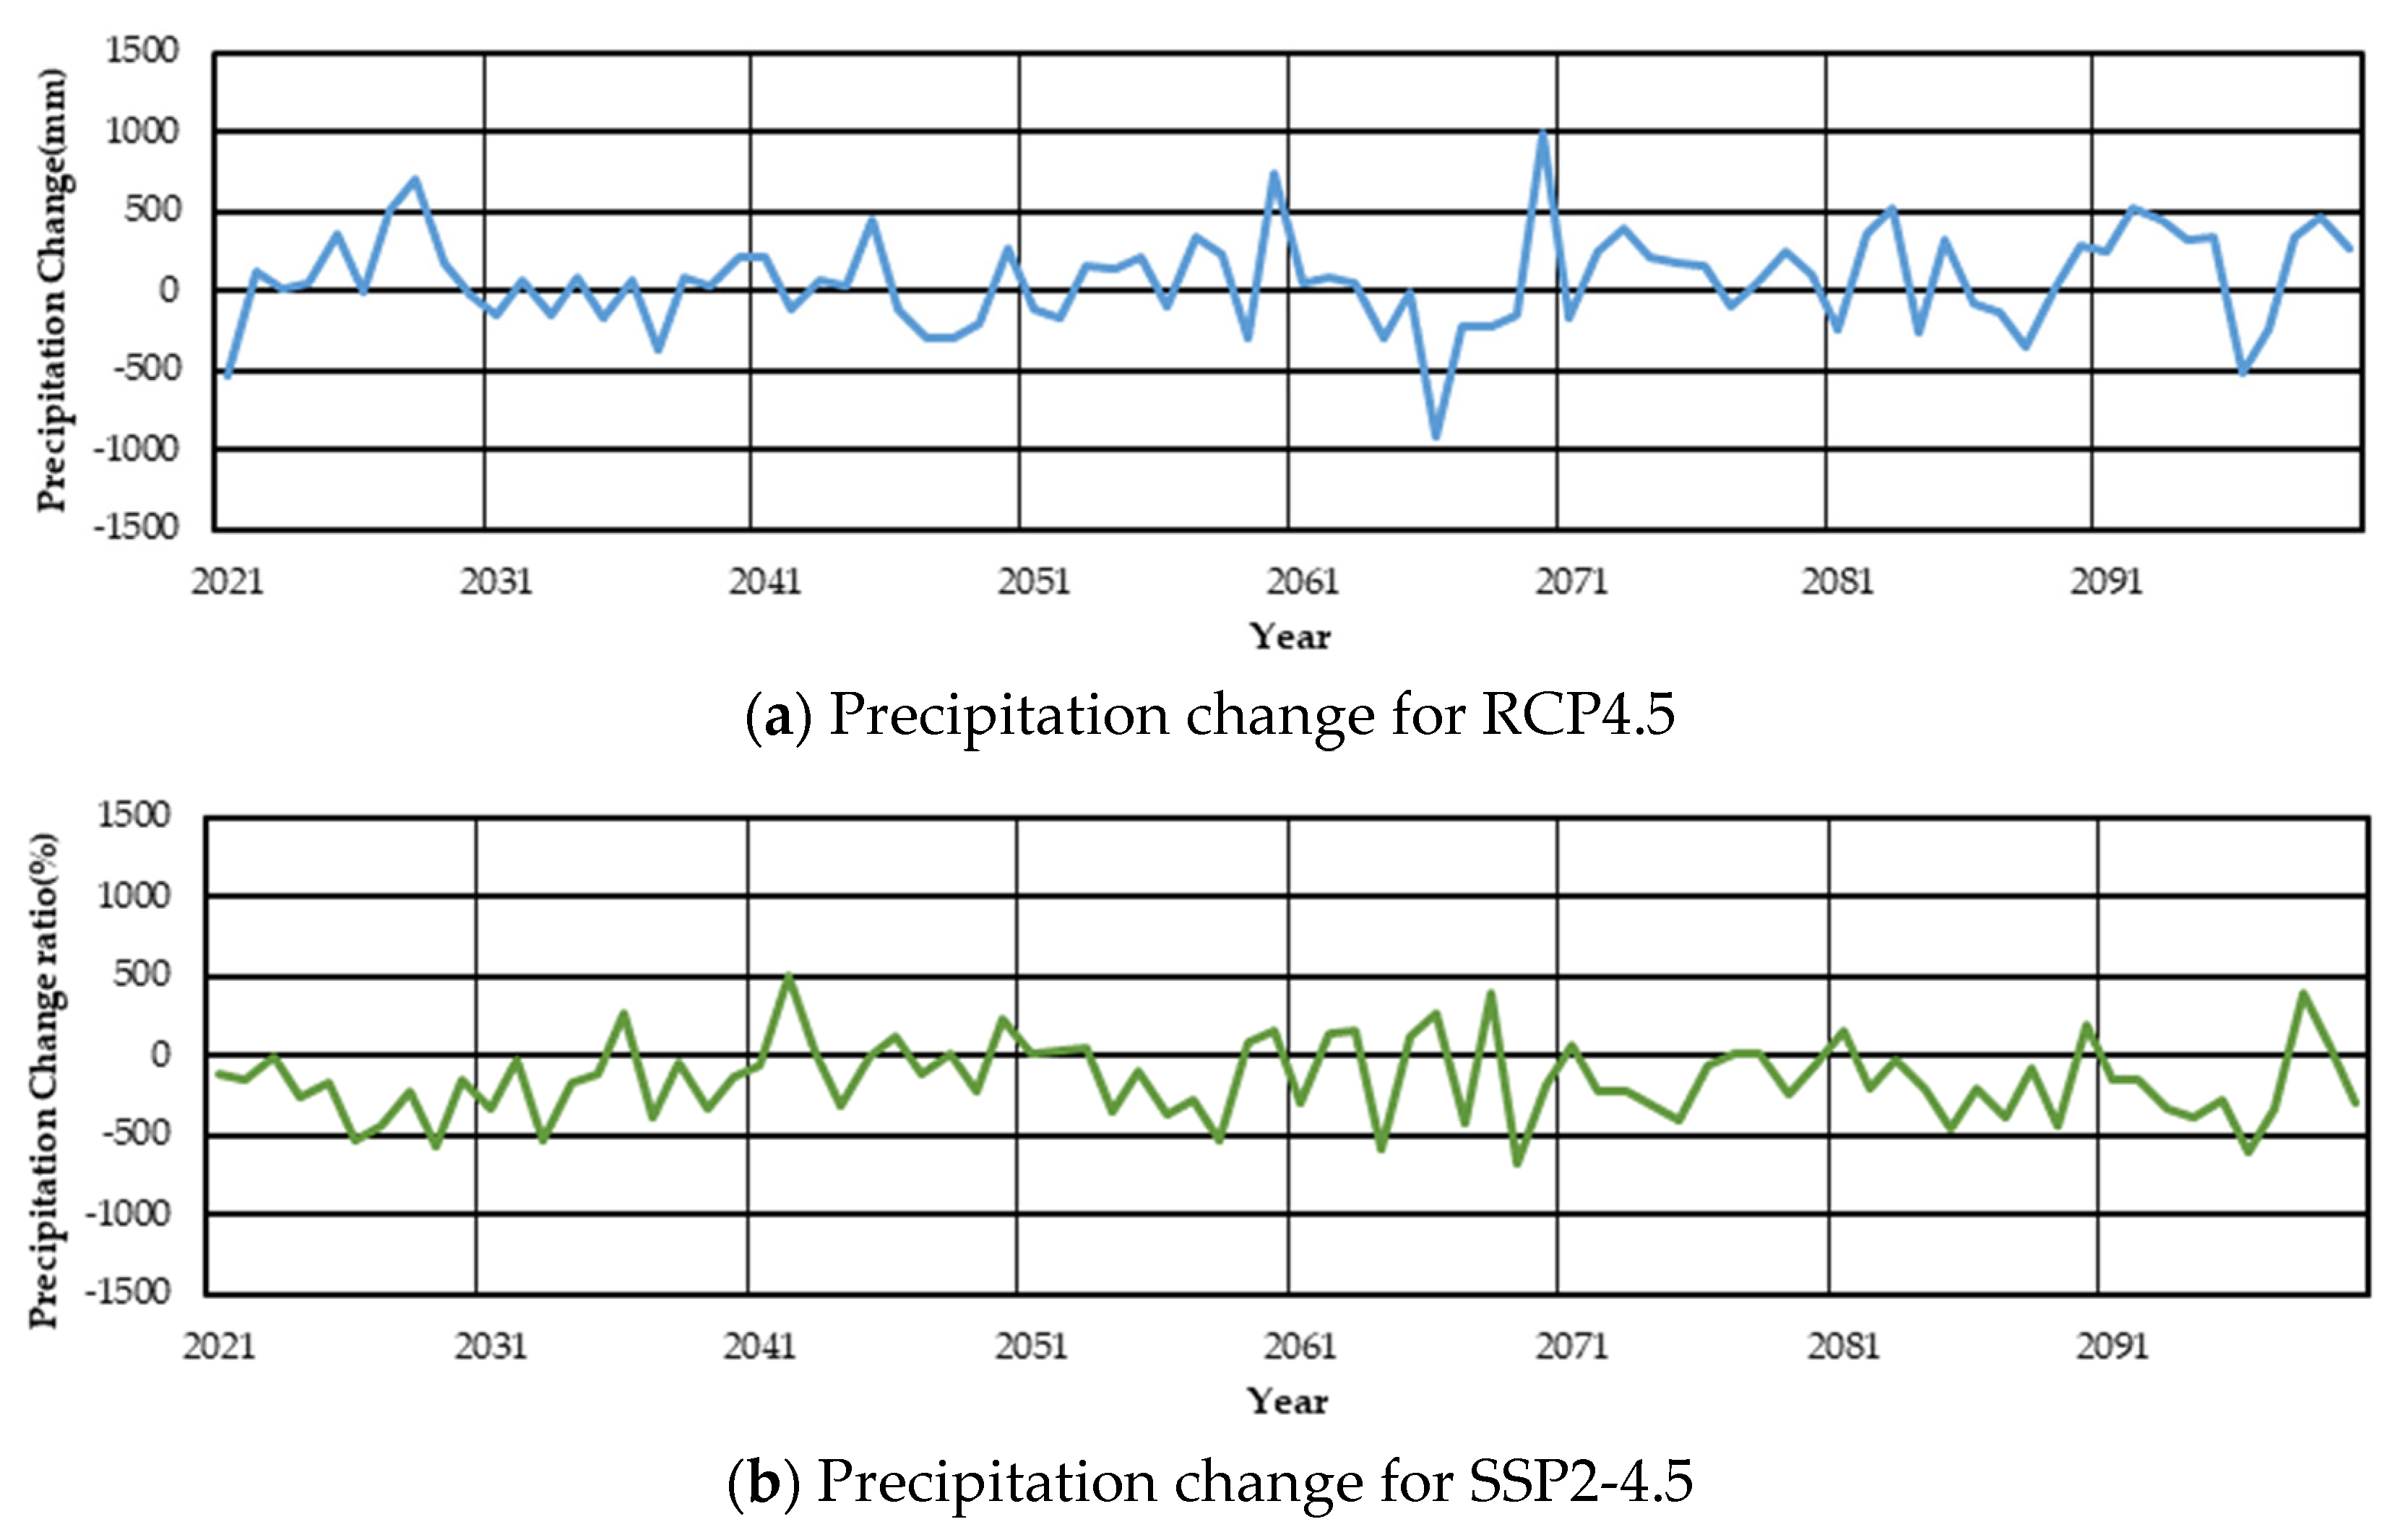
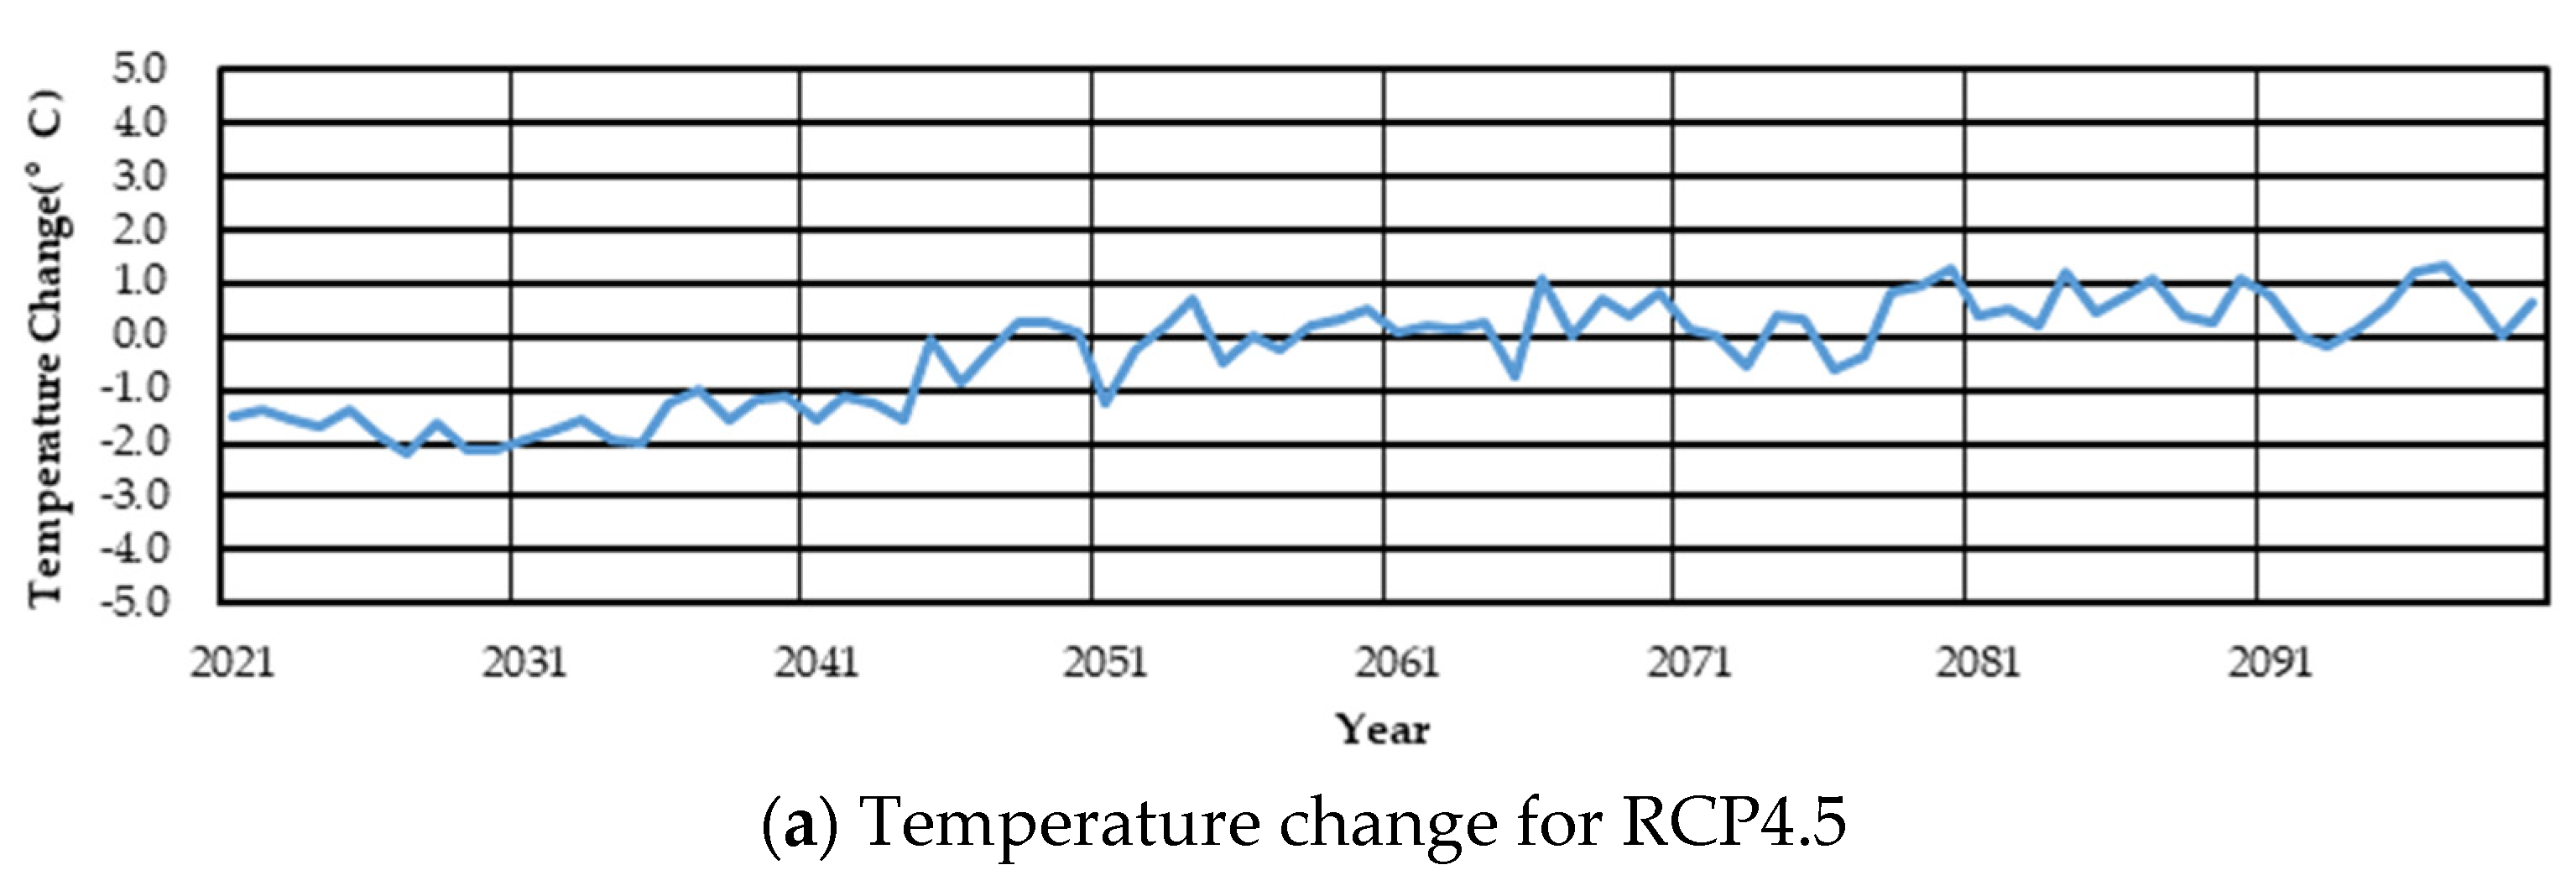
3.3. Step 3: Generation of Climate Variables and Runoff

After calibration, the runoff was estimated by dividing the entire period into the near (2021–2060) and the far (2061–2100) futures, and all results are shown in Table 5.
In the case of RCP4.5, the annual average precipitations for both futures increased to 1395.3 mm (4.0%) in the near future and 1423.6 mm (6.1%) in the far. On the contrary, in the case of SSP2-4.5, the annual average precipitation in the future was analyzed to decrease to 1205.7 mm (−10.2%) in the near future and 1188.5 mm (−11.4%) in the far.
In spring (MAM) of RCP4.5, the precipitation increased to 334.1 mm (56.7%) in the near future and 363.3 mm (70.4%) in the far. The average flow increased to 373.9 m3/s in the near future and 387.3 m3/s in the far. In SSP2-4.5, the runoff increased to 358.5 mm (68.2%) in near future and 358.9 mm (68.3%) in the far, and the average flow increased to 468.5 m3/s (154.8%) in the near future and 455.9 m3/s (147.9%) in the far. In summer (JJA), the average precipitations of RCP4.5 decreased to 650.9 mm (−18%) in the near future and 668.9 mm (−15.7%) in the far, and the average flow decreased to 822.9 m3/s (−14.8%) in the near future and 874.4 m3/s (−9.4%) in the far. In SSP2-4.5, the runoff decreased to 406.1 mm (−48.4%) in near future and 388.4 mm (−51.1%) in the far, and the average flow decreased to 525.6.1 m3/s (−45.6%) in the near future and 507.8 m3/s (−47.4%) in the far. In autumn (SON) of the RCP4.5, the precipitation increased to 275.1 mm (5.0%) in the near future and 267.3 mm (2.0%) in the far. The precipitation in the near was larger than that in far future. The average flow increased to 538.4 m3/s (2.4%) in the near future and 540.1 m3/s (2.7%) in the far. On the contrary, in the SSP2-4.5, the precipitation decreased to 224.3 mm (−14.4%) in the near future to 224.7 mm (−14.2%) in the far. The average flow increased to 336.5 m3/s (−36.0%) in the near future and 340.0 m3/s (−36.4%) in the far. In winter (DJF) of RCP4.5, the precipitation largely increased to 135.2 mm in the near future and 124.1 mm in the far, and the average flow decreased to 232.4 m3/s in the near future and 226.9 m3/s in the far. In SSP2-4.5, the precipitation increased largely to 216.7 mm in the near future and 216.6 mm in the far, and the average flow increased to 338.4 m3/s in the near future and 345.5 m3/s in the far.
In the case of temperature, both RCP4.5 and SSP2-4.5 showed an increasing trend. In RCP4.5, the annual average temperature decreased to 11.1 °C in the near future but increased to 12.5 °C in the far. This was similar to the result of SSP2-4.5. The temperature decreased to 10.9 °C in the near future but increased to 12.9 °C in the far. In spring (MAM) of RCP4.5, the temperature decreased to 10.1 °C in the near future and to 11.9 °C in the far, and in SSP2-4.5, it decreased to 5.7 °C in the near future and 7.8 °C in the far. In summer (JJA) of RCP4.5, the temperature decreased to 23.1 °C in the near future and similarly to 24.1 °C in the far, and in SSP2-4.5, the temperature decreased to 21.7 °C in the near future and to 23.3 °C in the far. In autumn (SON) of RCP4.5, the temperature decreased to 12.7 °C in the near future but increased to 14.6 °C in the far, and in SSP2-4.5, it increased to 16.9 °C in the near future and 19.6 °C in the far. In winter (DJF) of RCP4.5, the temperature decreased to −1.6 °C in the near future and increased to −0.6 °C in the far, and in SSP2-4.5, it decreased to −0.8 °C in the near future and to 0.6 °C in the far (Table 5). Annual precipitation and average annual temperature are shown in Figure 5 and Figure 6. and precipitation and temperature changes of RCP4.5 and SSP2-4.5 are shown in Figure 7 and Figure 8.

3.4. Step 4: Calculation of Drought Index

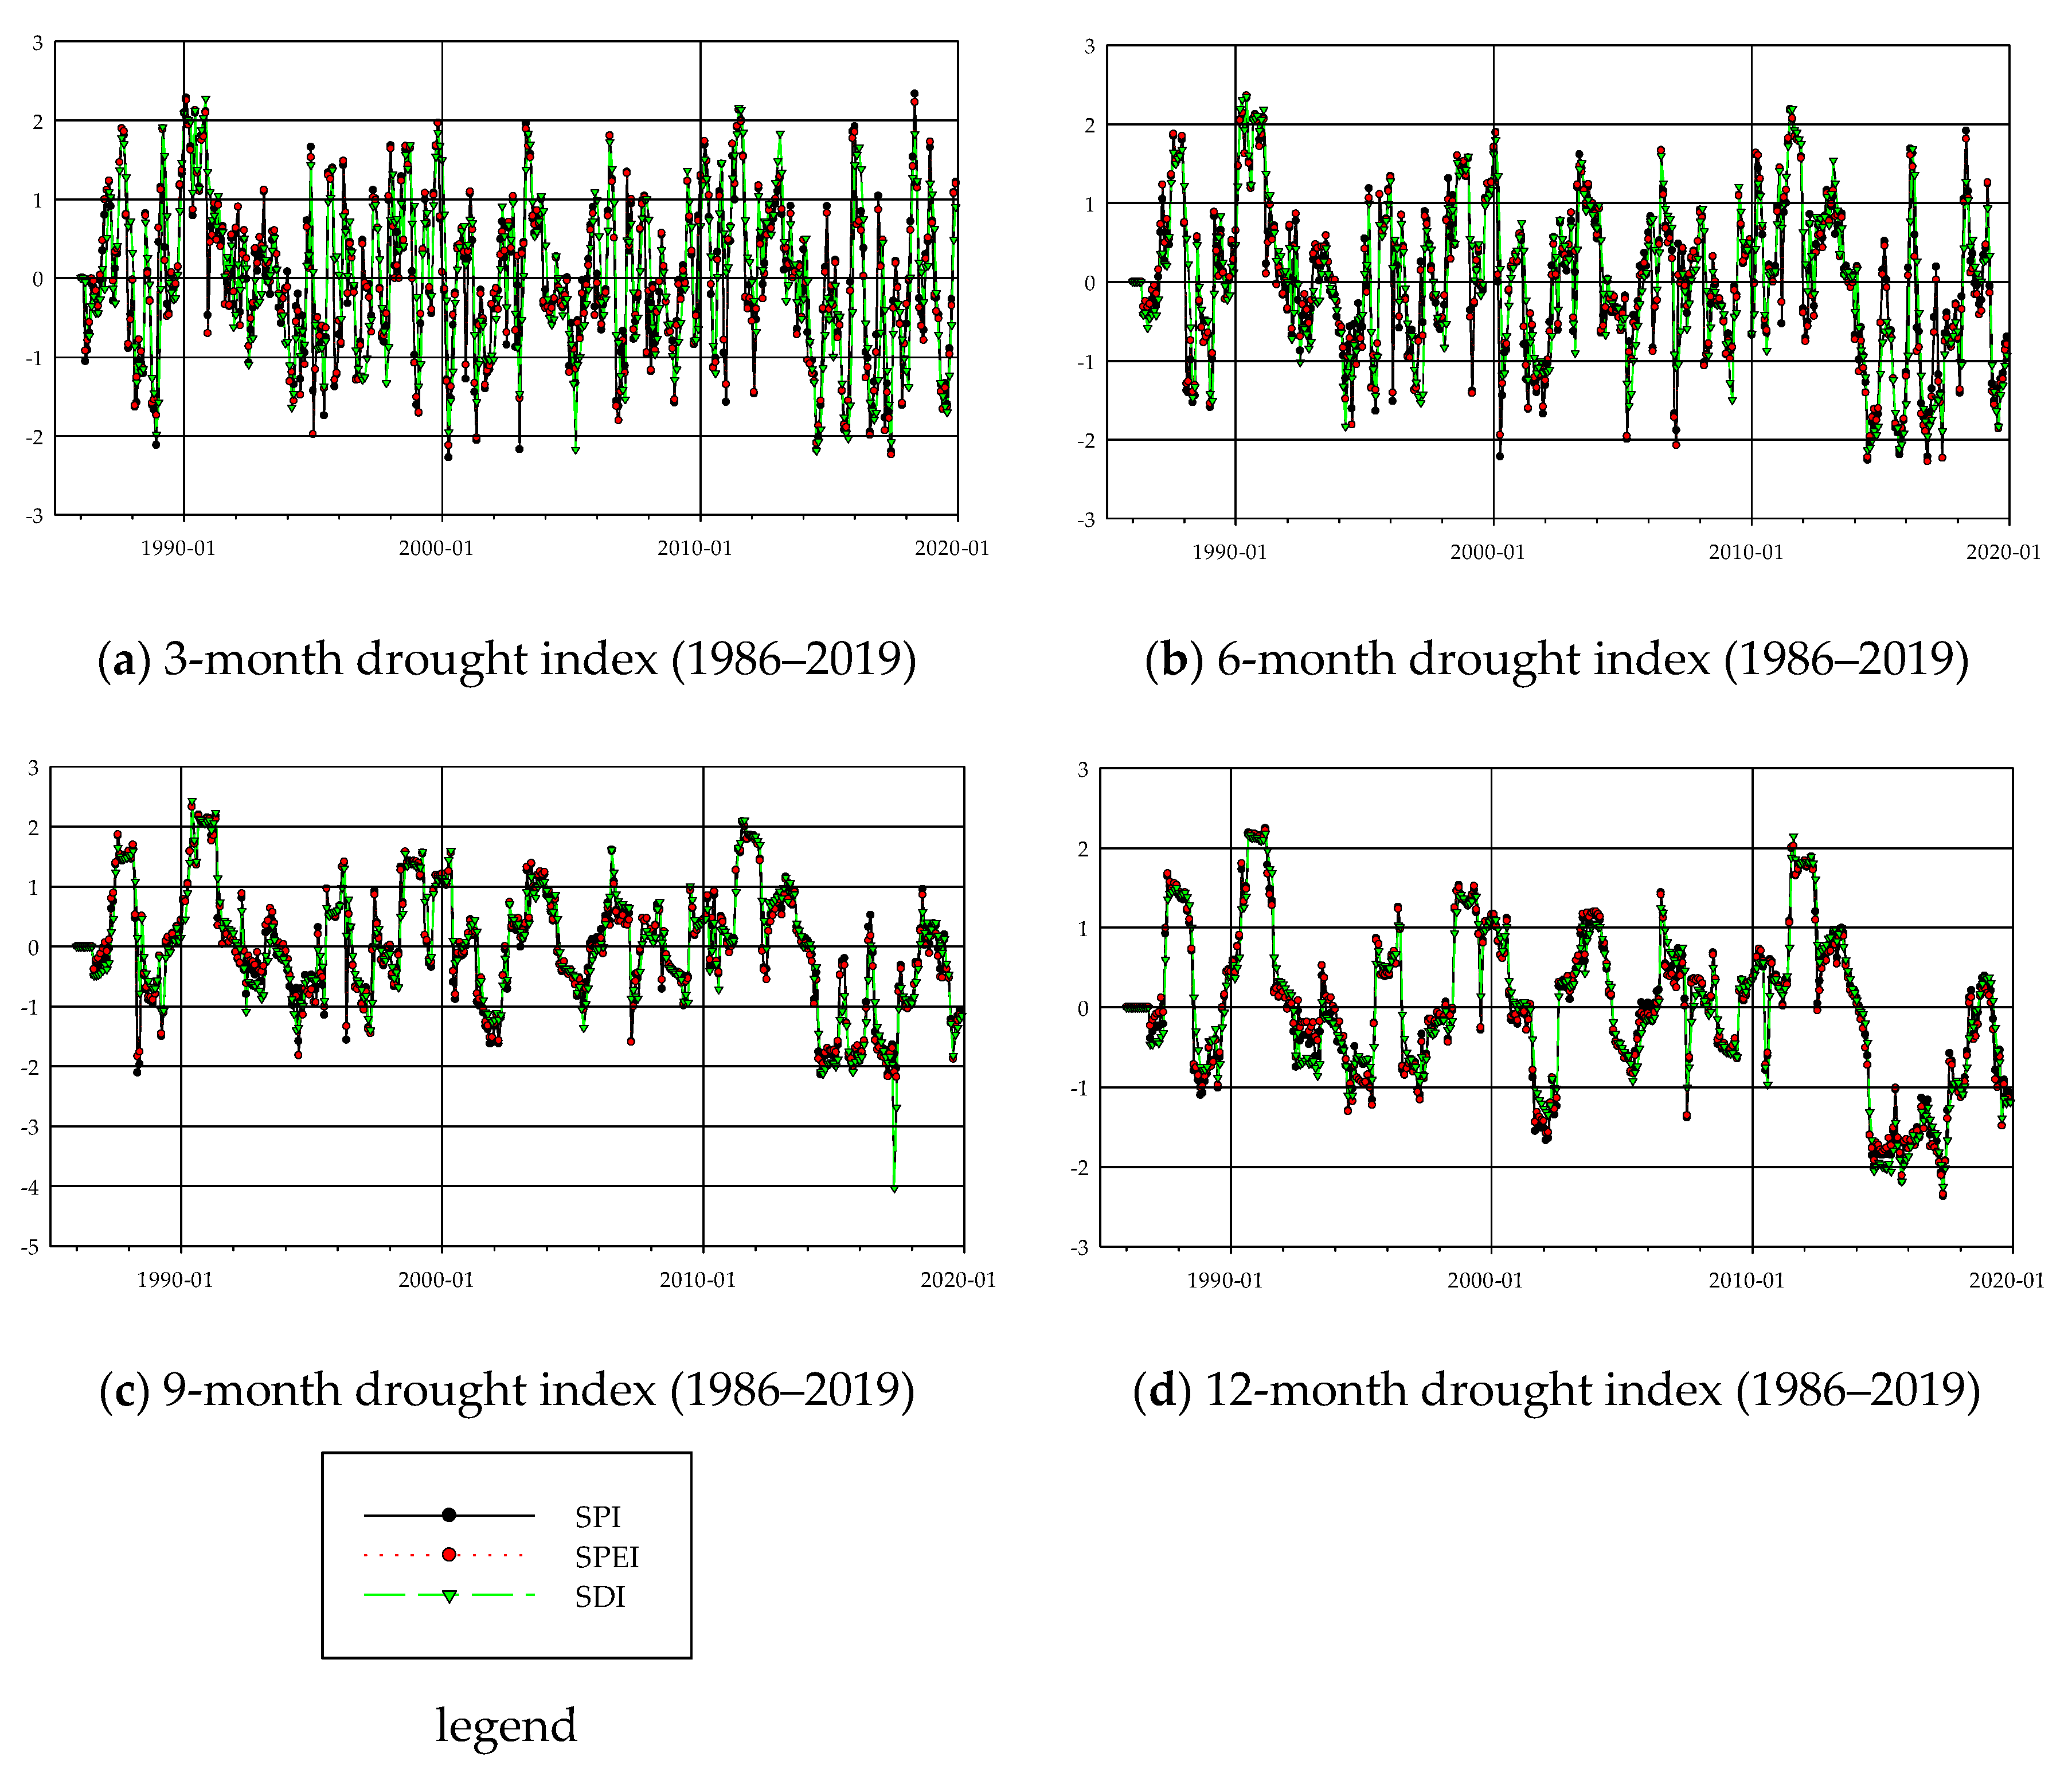
3.4.1. Historical Drought

Historical droughts were investigated using observations from the Cheongmicheon watershed as shown Table 6. As a result, the droughts occurred most frequently (68 times, 1986–2019) in SPEI3 and SDI6. The moderate drought frequency occurred more in SPI, SPEI, and SDI when the duration was shorter, and the number of severe droughts occurred less in SPI, SPEI and SDI as the duration became longer. This was because the severity became smoothed as the considered period became longer. The drought with the longest duration is shown in Table 7 and it was therein found that droughts occurred in 1994, 2000, 2012, 2015, and 2017. In addition, it can be concluded that the most severe drought occurred from 2014-03 to 2017-09.
To identify the spread between drought phases, we compared the variations of SPI, SPEI, and SDI. As a meteorological drought becomes more severe, a hydrological drought usually starts. In addition, unlike meteorological droughts, hydrological droughts do not occur at a small and short lack of precipitation, and it can be confirmed that droughts are relatively constant (Figure 9).

3.4.2. Future Drought

The SPI, SPEI, and SDI for 3-, 6-, 9-, and 12-month durations were calculated using the data of precipitation and temperature for RCP4.5 of ACCESS1-3 and SSP2-4.5 of ACCESS CM2. The minimum values of SPI, SPEI, and SDI in near and far futures are shown in Table 8. In the near future, the minimum indices of SPI, SPEI, and SDI in SSP2-4.5 were found to be slightly larger or equivalent, but those in far futures of RCP4.5 were much larger. That is, the differences in the minimum values of drought index between near and far futures were very small in SSP2-4.5, while the temporal changes of the minimum drought index in RCP4.5 were very large.

3.5. Step 5: Comparison of Future Drought Characteristics

3.5.1. Drought Occurrence and Severity

Occurrences and severities of droughts under RCP4.5 and SSP2-4.5 were compared as shown in Table 9 for SPI, Table 10 for SPEI, and Table 11 for SDI. In the SPI, the numbers of drought occurrences in SSP2-4.5 were higher in all periods. In the case of RCP4.5, it was analyzed that the numbers of occurrences over time increased from the near to the far futures. The numbers of severe and extreme droughts in the far future were larger than in the near future, e.g., 32 times (54%) for 3 months, 44 (69.8%) for 6 months, 42 (72.4%) for 9 months, and 39 (69.6%) for 12 months. In the case of SSP2-4.5, droughts occurred uniformly in both near and far futures, e.g., 28 times (50.9%) for 3 months, 29 (51.8%) for 6 months, 33 (54.1%) for 9 months, and 26 (39.4%) for 12 months. It was found that there was little climate variability of SSP2-4.5, which corresponds to the results of Table 8.
In the SPEI of SSP2-4.5, the number of drought occurrences in the far future was much more than in the near future for all durations. In both RCP4.5 and SSP2-4.5, the occurrence in far future was much larger than in the near future. Different from the result of SPI, the numbers of severe and extreme droughts in the far future were much larger for both RCP4.5 and SSP2-4.5.
In the near future of SDI, the numbers of drought occurrences in SSP2-4.5 were much higher than in RCP4.5 for all periods. On the other hand, the number of occurrences in RCP4.5 in the far future was much larger than in the near future. Thus, the occurrences in the far future for both RCP4.5 and SSP2-4.5 were similar for all durations. In addition, the numbers of severe and extreme droughts in the far future for both RCP4.5 and SSP2-4.5 were much larger or larger than in the near future for 3-, 6-, and 9-month durations.

3.5.2. The Longest Drought Period

The longest drought periods under RCP4.5 and SSP2-4.5 were compared for all durations as shown in Table 12. From the calculations of SPI, SPEI, and SDI under RCP4.5, the longest drought periods in the far future were much longer than those in the near for all durations. On the contrary, the longest periods in SSP2-4.5 were not consistent. The periods in near future for 9- and 12-month durations were larger, while those for 3- and 6-month durations were similar in both futures. In addition, the longest drought period from SDI was the largest and that from SPEI was the second largest because the variation in precipitation usually affects the streamflow with a lag.
Like many other parts of the globe, South Korea is being affected by the many impacts of climate change. Drought occurrence has been reported by many studies in the country. Bae et al. [54] assessed droughts at eight stations in the country between 1981 and 2010 and found the occurrence of droughts. Kwon et al. [55] assessed the spatio-temporal characteristics of meteorological and agricultural droughts using the Standardized Precipitation Index (SPI) and Standardized Soil Moisture Index (SSI), respectively, for 1986–2016. The study found that there were more drought episodes under the moderate and severe conditions at the coast of the country in the south, while at the northern parts, there were persistent droughts of higher severity. Many other studies have also reported drought occurrences in the country [36,37,38]. Similar findings have been reported from North Korea [56,57,58], Japan [58], and China [59,60] that neighbor South Korea. There are also studies from other parts of the globe that have reported increased occurrences of droughts using SPI, SPEI, and SDI [61,62,63].
Although in this study the agricultural yield was not considered, climatic factors have an influence on interannual variability of agricultural production and on water availability. However, existing works showed that drought can have impacts on agriculture, industries, and on human lives, as well as the ecosystem at large. Zampieri et al. [64] showed that seasonal surface water decreases as a result of drought affected the cultivation of rice in northern Italy. Similarly, the diversity of wheat in many European countries showed a decline due to droughts as the climate changes [65,66]. The impacts of warming due to climate change on cereal crops including maize, rice, and wheat over China was assessed [67]. The study showed that maize was very sensitive to warming and lower, and higher yields from rice and wheat correlated to increase in temperature. The reduction in yields was observed to be accompanied by decrease in precipitation, indicating droughts due to lack of water resources causes decrease in yields.
Due to insufficient precipitations in South Korea in 2001, there was a decrease in available agricultural water to as low as 10–30%, which affected rice farming as the sowing and growth periods of the crop were delayed [68,69]. Moreover, in the year 2014, there was an extreme drought that extended until 2015, causing critical water shortages due to decline in water levels in numerous multipurpose dams that serve domestic and industrial purposes in the country [70].

4. Conclusions

This study analyzed the future drought in the Cheongmicheon watershed using RCP4.5 of ACCESS 1-3 and the newly released SSP2-4.5 of ACCESS CM2. The daily precipitation and temperature data were downscaled using IDW and bias correction methods. The streamflow was simulated using SWAT model, which was calibrated using SWAT-CUP program. The SWAT model can perform runoff analysis of the watershed using relatively simple input data. In previous studies [36,37,38], meteorological drought indices such as SPI, SPEI, and potential evaporation were analyzed, but this study used a hydrological drought index. Thus, three drought indices, namely, SPI, SPEI, and SDI, were calculated for 3-, 6-, 9-, and 12-month durations. The results were analyzed for the historical (1970–2005), near future (2021–2060), and far future (2061–2100).
The annual average precipitations and flows under RCP4.5 increased in the future while those under SSP2-4.5 decreased in the future. Here, the increased or decreased values in far future were larger than in the near future. The annual average temperatures in near future decreased and then increased in the far future, except for the autumn of SSP2-4.5. The minimum severities of SPI, SPEI, and SDI in the near future under SSP2-4.5 were slightly larger than or equivalent to those of the far future, but those in the far future of RCP4.5 were much larger than in the near. That is, the differences in the minimum values of drought index between near and far futures were very small in SSP2-4.5 while the temporal changes of the minimum drought index in RCP4.5 were very large. From the calculations of SPI, SPEI, and SDI under RCP4.5, the longest drought periods in the far future were much longer than in the near for all durations. In addition, the longest drought period from SDI was the largest and that from SPEI was the second largest because the variation in precipitation usually affects the streamflow with a lag. Using these results, we could benefit from establishing a future drought response plan for agriculture and water management in the Cheongmicheon watershed.
Drought is a critical issue that can have significant impacts on the availability of water resources for various sectors including agriculture and industry. For sustainable agricultural and water resource availability for various purposes, adaptation and mitigation measures based on the historical drought occurrences and the future projected are therefore crucial to our sustainable existence. This study can be extended to more GCMs from CMIP5 and CMIP6 because their characteristics in precipitation and temperature are largely different. In addition, the data of more SSP scenarios, SSP1-2.6, and SSP3-7.0 can be included because those from many CMIP6 GCMs will be generated soon.

Author Contributions

Conceptualization, E.-S.C.; methodology, E.-S.C.; validation, J.H.S., S.U.K., and M.S.; formal analysis, J.H.K.; investigation, J.H.K.; resources, J.H.S.; data curation, J.H.K.; writing—original draft preparation, J.H.K.; writing—review and editing, E.-S.C., M.S.S., and J.H.S.; visualization, S.U.K., M.S.; supervision, E.-S.C.; project administration, E.-S.C.; funding acquisition, E.-S.C. All authors have read and agreed to the published version of the manuscript.

Funding

This study was supported by the Research Program funded by SeoulTech (Seoul National University of Science and Technology).

Institutional Review Board Statement

Not applicable.

Informed Consent Statement

Not applicable.

Data Availability Statement

Not applicable.

Conflicts of Interest

The authors declare no conflict of interest.

References

  1. Stocker, T.F.; Qin, D.; Plattner, G.-K.; Tignor, M.; Allen, S.K.; Boschung, J.; Nauels, A.; Xia, Y.; Bex, V.; Midgley, P.M. Climate Change 2013. The Physical Science Basis; Working Group I Contribution to the Fifth Assessment Report of the Intergovernmental Panel on Climate Change-Abstract for Decision-makers; (Changements climatiques 2013. Les elements scientifiques; Contribution du groupe de travail I au cinquieme rapport d’evaluation du groupe d’experts intergouvernemental sur l’evolution du CLIMAT-Resume a l’intention des décideurs); IPCC: Geneva, Switzerland, 2013. [Google Scholar]
  2. Shiru, M.S.; Shahid, S.; Alias, N.; Chung, E.-S. Trend Analysis of Droughts during Crop Growing Seasons of Nigeria. Sustainability 2018, 10, 871. [Google Scholar] [CrossRef] [Green Version]
  3. Arnell, N.W.; Gosling, S.N. The impacts of climate change on river flood risk at the global scale. Clim. Chang. 2016, 134, 387–401. [Google Scholar] [CrossRef] [Green Version]
  4. Khan, N.; Shahid, S.; Ismail, T.; Ahmed, K.; Nawaz, N. Trends in heat wave related indices in Pakistan. Stoch. Environ. Res. Risk Assess. 2019, 33, 287–302. [Google Scholar] [CrossRef]
  5. Mishra, A.K.; Singh, V.P. A review of drought concepts. J. Hydrol. 2010, 391, 202–216. [Google Scholar] [CrossRef]
  6. Freire-González, J.; Decker, C.; Hall, J.W. The Economic Impacts of Droughts: A Framework for Analysis. Ecol. Econ. 2017, 132, 196–204. [Google Scholar] [CrossRef]
  7. National-Centers-for-Environmental-Information (NCEI), U.S. Billion-dollar Weather and Climate Disasters. Available online: https://www.ncdc.noaa.gov/billions/ (accessed on 28 December 2020).
  8. Slim, H. IASC Real-time Evaluation of the Humanitarian Response to the Horn of Africa Drought Crisis in Somalia, Ethiopia and Kenya. Inter-Agency Standing Committee (IASC) Synthesis Report. 2012. Available online: http://reliefweb.int/report/world/iasc-real-time-evaluation-humanitarian-response-horn-africa-drought-crisis-somalia (accessed on 27 December 2020).
  9. Kwon, H.H.; Lall, U.; Kim, S. The unusual 2013–2015 drought in South Korea in the context of a multicentury precipitation record: Inferences from a nonstationary, multivariate, bayesian copula model. Geophys. Res. Lett. 2016, 43, 8534–8544. [Google Scholar]
  10. Abdulai, P.J.; Chung, E.-S. Uncertainty Assessment in Drought Severities for the Cheongmicheon Watershed Using Multiple GCMs and the Reliability Ensemble Averaging Method. Sustainability 2019, 11, 4283. [Google Scholar] [CrossRef] [Green Version]
  11. Jang, H.-W.; Cho, H.-W.; Kim, T.-W.; Lee, J.-H. Quantitative characterization of historical drought events in Korea -focusing on outlier analysis of precipitation-. J. Korea Water Resour. Assoc. 2016, 49, 145–153. [Google Scholar] [CrossRef] [Green Version]
  12. Jeung, S.; Park, J.; Yang, D.; Kim, B. Modified Standardized Precipitation Index and Evaluation of its Effectiveness using Past Extreme Drought Cases. J. Korean Soc. Hazard Mitig. 2019, 19, 117–124. [Google Scholar] [CrossRef]
  13. Sung, J.H.; Chung, E.-S.; Shahid, S. Reliability–Resiliency–Vulnerability Approach for Drought Analysis in South Korea Using 28 GCMs. Sustainablity 2018, 10, 3043. [Google Scholar] [CrossRef] [Green Version]
  14. Jeong, M.S.; Park, S.Y.; Jang, H.W.; Lee, J.H. A study on derivation of drought severity duration-frequency curve through a non-stationary frequency analysis. J. Korea Water Resour. Assoc. 2020, 53, 107–119. [Google Scholar]
  15. Ryu, Y.; Chung, E.-S.; Seo, S.B.; Sung, J.H. Projection of Potential Evapotranspiration for North Korea Based on Selected GCMs by TOPSIS. KSCE J. Civ. Eng. 2020, 24, 2849–2859. [Google Scholar] [CrossRef]
  16. Hong, H.P.; Par, S.Y.; Kim, T.W.; Lee, J.H. Assessment of CMIP5 GCMs for future extreme drought analysis. J. Korea Water Resour. Assoc. 2018, 51, 617–627. [Google Scholar]
  17. McKee, T.B.; Doeskin, N.J.; Kleist, J. Drought Monitoring with Multiple Time Scales. In Proceedings of the 9th Conference on Applied Climatology, Dallas, TX, USA, 15–20 January 1995; American Meteorological Society: Boston, MA, USA, 1995; pp. 233–236. [Google Scholar]
  18. Vicente-Serrano, S.M.; Beguería, S.; López-Moreno, J.I. A Multiscalar Drought Index Sensitive to Global Warming: The Standardized Precipitation Evapotranspiration Index. J. Clim. 2010, 23, 1696–1718. [Google Scholar] [CrossRef] [Green Version]
  19. Nalbantis, I.; Tsakiris, G. Assessment of Hydrological Drought Revisited. Water Resour. Manag. 2009, 23, 881–897. [Google Scholar] [CrossRef]
  20. Bang, N.K.; Nam, W.H.; Hong, E.M.; Michael, J.H.; Mark, D.S. Assessment of the meteorological characteristics and statistical drought frequency for the extreme 2017 spring drought event across South korea. J. Korean Soc. Agric. Eng. 2018, 60, 37–48. [Google Scholar]
  21. Gwak, Y.; Cho, J.; Jung, I.; Kim, D.; Jang, S. Projection of Future Changes in Drought Characteristics in Korea Peninsula Using Effective Drought Index. J. Clim. Chang. Res. 2018, 9, 31–45. [Google Scholar] [CrossRef]
  22. O’Neill, B.C.; Tebaldi, C.; Van Vuuren, D.P.; Eyring, V.; Friedlingstein, P.; Hurtt, G.; Knutti, R.; Kriegler, E.; Lamarque, J.-F.; Lowe, J.; et al. The Scenario Model Intercomparison Project (ScenarioMIP) for CMIP6. Geosci. Model Dev. 2016, 9, 3461–3482. [Google Scholar]
  23. Song, Y.H.; Nashwan, M.S.; Chung, E.-S.; Shahid, S. Advances in CMIP6 INM-CM5 over CMIP5 INM-CM4 for precipitation simulation in South Korea. Atmos. Res. 2021, 247, 105261. [Google Scholar] [CrossRef]
  24. Wu, T.; Lu, Y.; Fang, Y.; Xin, X.; Li, L.; Li, W.; Jie, W.; Zhang, J.; Liu, Y.; Zhang, L.; et al. The Beijing Climate Center Climate System Model (BCC-CSM): The main progress from CMIP5 to CMIP6. Geosci. Model Dev. 2019, 12, 1573–1600. [Google Scholar]
  25. Xin, X.; Wu, T.; Zhang, J.; Yao, J.; Fang, Y. Comparison of CMIP6 and CMIP5 simulations of precipitation in China and the East Asian summer monsoon. Int. J. Clim. 2020, 40, 6423–6440. [Google Scholar]
  26. Gusain, A.; Ghosh, S.; Karmakar, S. Added value of CMIP6 over CMIP5 models in simulating Indian summer monsoon rainfall. Atmos. Res. 2020, 232, 104680. [Google Scholar] [CrossRef]
  27. Zhu, Y.-Y.; Yang, S. Evaluation of CMIP6 for historical temperature and precipitation over the Tibetan Plateau and its comparison with CMIP5. Adv. Clim. Chang. Res. 2020, 11, 239–251. [Google Scholar] [CrossRef]
  28. Zamani, Y.; Monfared, S.A.H.; Moghaddam, M.A.; Hamidianpour, M. A comparison of CMIP6 and CMIP5 projections for precipitation to observational data: The case of Northeastern Iran. Theor. Appl. Clim. 2020, 142, 1–11. [Google Scholar] [CrossRef]
  29. Almazroui, M.; Saeed, F.; Saeed, S.; Islam, M.N.; Ismail, M.; Klutse, N.A.B.; Siddiqui, M.H. Projected Change in Temperature and Precipitation Over Africa from CMIP6. Earth Syst. Environ. 2020, 4, 455–475. [Google Scholar] [CrossRef]
  30. Almazroui, M.; Saeed, S.; Saeed, F.; Islam, M.N.; Ismail, M. Projections of Precipitation and Temperature over the South Asian Countries in CMIP6. Earth Syst. Environ. 2020, 4, 297–320. [Google Scholar] [CrossRef]
  31. Zhu, H.; Jiang, Z.; Li, J.; Li, W.; Sun, C.; Li, L. Does CMIP6 Inspire More Confidence in Simulating Climate Extremes over China? Adv. Atmos. Sci. 2020, 37, 1119–1132. [Google Scholar] [CrossRef]
  32. Jiang, D.; Hu, D.; Tian, Z.; Lang, X. Differences between CMIP6 and CMIP5 Models in Simulating Climate over China and the East Asian Monsoon. Adv. Atmos. Sci. 2020, 37, 1–17. [Google Scholar] [CrossRef]
  33. Luo, N.; Guo, Y.; Gao, Z.; Chen, K.; Chou, J. Assessment of CMIP6 and CMIP5 model performance for extreme temperature in China. Atmos. Ocean. Sci. Lett. 2020, 13, 589–597. [Google Scholar]
  34. Monerie, P.-A.; Wainwright, C.M.; Sidibe, M.; Akinsanola, A.A. Model uncertainties in climate change impacts on Sahel precipitation in ensembles of CMIP5 and CMIP6 simulations. Clim. Dyn. 2020, 55, 1385–1401. [Google Scholar] [CrossRef]
  35. Wyser, K.; Kjellström, E.; Koenigk, T.; Martins, H.; Doescher, R. Warmer climate projections in EC-Earth3-Veg: The role of changes in the greenhouse gas concentrations from CMIP5 to CMIP6. Environ. Res. Lett. 2020, 15, 054020. [Google Scholar]
  36. Shrestha, A.; Rahaman, M.M.; Kalra, A.; Jogineedi, R.; Maheshwari, P. Climatological drought forecasting using bias corrceted CMIP6 climate data: A case study for india. Forecasting 2020, 2, 59–84. [Google Scholar] [CrossRef]
  37. Su, B.; Huang, J.; Mondal, S.K.; Zhai, J.; Wang, Y.; Wen, S.; Gao, M.; Lv, Y.; Jiang, S.; Jiang, T.; et al. Insight from CMIP6 SSP-RCP scenarios for future drought characteristics in China. Atmos. Res. 2021, 250, 105375. [Google Scholar] [CrossRef]
  38. Zhai, J.; Mondal, S.K.; Fischer, T.; Wang, Y.; Su, B.; Huang, J.; Tao, H.; Wang, G.; Ullah, W.; Uddin, J. Future drought characteristics through a multi-model ensemble from CMIP6 over South Asia. Atmos. Res. 2020, 246, 105111. [Google Scholar] [CrossRef]
  39. Kim, S.U.; Son, M.; Chung, E.-S.; Yu, X. Effects of Non-Stationarity on Flood Frequency Analysis: Case Study of the Cheongmicheon Watershed in South Korea. Sustainability 2018, 10, 1329. [Google Scholar] [CrossRef] [Green Version]
  40. Abbaspour, K.C.; Yang, J.; Maximov, I.; Siber, R.; Bogner, K.; Mieleitner, J.; Zobrist, J.; Srinivasan, R. Modelling hydrology and water quality in the pre-alpine/alpine Thur watershed using SWAT. J. Hydrol. 2007, 333, 413–430. [Google Scholar] [CrossRef]
  41. Kim, S.H.; Chung, E.S. Analysis of peak drought severity time and period using meteorological and hydrological drought indices. J. Korea Water Resour. Assoc. 2018, 51, 471–479. [Google Scholar]
  42. International Hydrological Program. IHP Homepage. Available online: http://www.ihpkorea.or.kr/ (accessed on 14 February 2021).
  43. Thomson, A.M.; Calvin, K.V.; Smith, S.J.; Kyle, G.P.; Volke, A.; Patel, P.; Delgado-Arias, S.; Bond-Lamberty, B.; Wise, M.A.; Clarke, L.E.; et al. RCP4.5: A pathway for stabilization of radiative forcing by 2100. Clim. Chang. 2011, 109, 77–94. [Google Scholar] [CrossRef] [Green Version]
  44. Song, Y.H.; Chung, E.-S.; Shiru, M.S. Uncertainty Analysis of Monthly Precipitation in GCMs Using Multiple Bias Correction Methods under Different RCPs. Sustainability 2020, 12, 7508. [Google Scholar] [CrossRef]
  45. Dosio, A.; Paruolo, P. Bias correction of the ENSEMBLES high-resolution climate change projections for use by impact models: Evaluation on the present climate. J. Geophys. Res. Space Phys. 2011, 116, 1–22. [Google Scholar]
  46. Gudmundsson, L.; Bremnes, J.B.; Haugen, J.E.; Engenskaugen, T. Technical Note: Downscaling RCM precipitation to the station scale using statistical transformations – a comparison of methods. Hydrol. Earth Syst. Sci. 2012, 16, 3383–3390. [Google Scholar] [CrossRef] [Green Version]
  47. Arnold, J.G.; Srinivasan, R.; Muttiah, R.S.; Williams, J.R. Large area hydrologic modeling and assessment part I: Model development. JAWRA J. Am. Water Resour. Assoc. 1998, 34, 73–89. [Google Scholar] [CrossRef]
  48. Daloğlu, I.; Nassauer, J.I.; Riolo, R.; Scavia, D. An integrated social and ecological modeling framework—impacts of agricultural conservation practices on water quality. Ecol. Soc. 2014, 19, 12. [Google Scholar] [CrossRef] [Green Version]
  49. Gassman, P.W.; Reyes, M.R.; Green, C.H.; Arnold, J.G. The Soil and Water Assessment Tool: Historical Development, Applications, and Future Research Directions. Trans. ASABE 2007, 50, 1211–1250. [Google Scholar] [CrossRef] [Green Version]
  50. Thornthwaite, C.W. An approach toward a rational classification of climate. Geogr. Rev. 1984, 38, 55–94. [Google Scholar] [CrossRef]
  51. Yang, J.; Reichert, P.; Abbaspour, K.; Xia, J.; Yang, H. Comparing uncertainty analysis techniques for a SWAT application to the Chaoche basin in China. J. Hydrol. 2008, 358, 1–23. [Google Scholar] [CrossRef]
  52. Schuol, J.; Abbaspour, K.C. Calibration and uncertainty issues of a hydrological model (SWAT) applied to West Africa. Adv. Geosci. 2006, 9, 137–143. [Google Scholar] [CrossRef] [Green Version]
  53. Andersson, J.C.M.; Zehnder, A.J.B.; Jewitt, G.P.W.; and Yang, H. Water availability; demand and reliability of in situ water harvesting in smallholder rain-fed agriculture in the Thukla river basin, South Africa. Hydrol. Earth Syst. Sci. 2009, 13, 2239–2347. [Google Scholar]
  54. Bae, S.; Lee, S.-H.; Yoo, S.-H.; Kim, T. Analysis of Drought Intensity and Trends Using the Modified SPEI in South Korea from 1981 to 2010. Water 2018, 10, 327. [Google Scholar] [CrossRef] [Green Version]
  55. Kwon, M.; Kwon, H.; Han, D. Spatio-temporal drought patterns of multiple drought indices based on precipitation and soil moisture: A case study in South Korea. Int. J. Clim. 2019, 39, 4669–4687. [Google Scholar] [CrossRef]
  56. Lee, S.-H.; Yoo, S.-H.; Choi, J.-Y.; Bae, S. Assessment of the Impact of Climate Change on Drought Characteristics in the Hwanghae Plain, North Korea Using Time Series SPI and SPEI: 1981–2100. Water 2017, 9, 579. [Google Scholar] [CrossRef] [Green Version]
  57. Yu, J.; Lim, J.; Lee, K.-S. Investigation of drought-vulnerable regions in North Korea using remote sensing and cloud computing climate data. Environ. Monit. Assess. 2018, 190, 126. [Google Scholar] [PubMed]
  58. Lee, S.-M.; Byun, H.-R.; Tanaka, H.L. Spatiotemporal Characteristics of Drought Occurrences over Japan. J. Appl. Meteorol. Clim. 2012, 51, 1087–1098. [Google Scholar] [CrossRef] [Green Version]
  59. Li, L.; She, D.; Zheng, H.; Lin, P.; Yang, Z.-L. Elucidating Diverse Drought Characteristics from Two Meteorological Drought Indices (SPI and SPEI) in China. J. Hydrometeorol. 2020, 21, 1513–1530. [Google Scholar] [CrossRef]
  60. Zhang, Q.; Li, J.; Singh, V.P.; Bai, Y. SPI-based evaluation of drought events in Xinjiang, China. Nat. Hazards 2012, 64, 481–492. [Google Scholar] [CrossRef]
  61. Labudová, L.; Labuda, M.; Takáč, J. Comparison of SPI and SPEI applicability for drought impact assessment on crop production in the Danubian Lowland and the East Slovakian Lowland. Theor. Appl. Clim. 2016, 128, 491–506. [Google Scholar] [CrossRef]
  62. Mehr, A.D.; Vaheddoost, B. Identification of the trends associated with the SPI and SPEI indices across Ankara, Turkey. Theor. Appl. Clim. 2019, 139, 1531–1542. [Google Scholar] [CrossRef]
  63. Rahman, M.R.; Lateh, H. Meteorological drought in Bangladesh: Assessing, analysing and hazard mapping using SPI, GIS and monthly rainfall data. Environ. Earth Sci. 2016, 75, 1–20. [Google Scholar] [CrossRef]
  64. Zampieri, M.; Ceglar, A.; Manfron, G.; Toreti, A.; Duveiller, G.; Romani, M.; Rocca, C.; Scoccimarro, E.; Podrascanin, Z.; Djurdjevic, V. Adaptation and sustainability of water management for rice agriculture in temperate regions: The Italian case-study. Land Degrad. Dev. 2019, 30, 2033–2047. [Google Scholar] [CrossRef] [Green Version]
  65. Macholdt, J.; Honermeier, B. Yield stability in winter wheat production: A survey on German farmers’ and advisors’ views. Agronomy 2017, 7, 7030045. [Google Scholar]
  66. Kahiluoto, H.; Kaseva, J.; Balek, J.; Olesen, J.E.; Ruiz-Ramos, M.; Gobin, A.; Kersebaum, K.C.; Takáč, J.; Ruget, F.; Ferrise, R.; et al. Decline in climate resilience of European wheat. Proc. Natl. Acad. Sci. USA 2019, 116, 123–128. [Google Scholar] [CrossRef] [Green Version]
  67. Zhang, T.; Huang, Y. Impacts of climate change and inter-annual variability on cereal crops in China from 1980 to 2008. J. Sci. Food Agric. 2011, 92, 1643–1652. [Google Scholar] [CrossRef]
  68. Lee, D.R.; Kim, W.T.; Lee, D.H. Analysis of drought characteristics and process in 2001: Korea. J. Korea Water Resour. Assoc. 2002, 2, 898–903. [Google Scholar]
  69. Baek, S.-G.; Jang, H.-W.; Kim, J.-S.; Lee, J.-H. Agricultural drought monitoring using the satellite-based vegetation index. J. Korea Water Resour. Assoc. 2016, 49, 305–314. [Google Scholar] [CrossRef]
  70. Hong, I.; Lee, J.-H.; Cho, H.-S. National drought management framework for drought preparedness in Korea (lessons from the 2014–2015 drought). Hydrol. Res. 2016, 18, 89–106. [Google Scholar] [CrossRef]
Figure 1. Flow chart in this study.
Sustainability 13 02066 g001
Figure 2. Description of sub-watersheds including the locations of meteorological and streamflow stations.
Sustainability 13 02066 g002
Figure 3. Tylor diagrams showing the performances of bias correction for RCP4.5 ACCESS 1.3 and SSP2-4.5 ACCESS-CM2.
Sustainability 13 02066 g003aSustainability 13 02066 g003b
Figure 4. Performances before and after calibration.
Sustainability 13 02066 g004
Figure 5. Projections of future precipitations for RCP4.5 and SSP2-4.5.
Sustainability 13 02066 g005
Figure 6. Projections of future temperatures for RCP4.5 and SSP2-4.5.
Sustainability 13 02066 g006
Figure 7. Future precipitation change for RCP4.5 and SSP2-4.5.
Sustainability 13 02066 g007
Figure 8. Future temperature change for RCP4.5 and SSP2-4.5.
Sustainability 13 02066 g008aSustainability 13 02066 g008b
Figure 9. Drought indices for the historical period.
Sustainability 13 02066 g009
Table 1. Information of weather and streamflow stations.
Name of StationLatitudeLongitudeObservation Period
Icheon37.264127.4841984–2019
Wonbu Bridge37.163127.6341985–2019
Table 2. Station information.
Modeling
Centers
ModelsResolution
(Longitude × Latitude)
Temporal SpanModelsResolution
(Longitude × Latitude)
Temporal Span
ACCESSACCESS
1-3
1.9° × 1.2°- Historical period: 1970–2005
- Projection period:
2006–2100
ACCESS
-CM2
1.25° × 1.88°- Historical period: 1970–2014
- Projection period:
2015–2100
Table 3. Classification of drought index range [17,18,19].
Drought Index RangeClassification of Drought
SPI, SPEISDI
>2.00Extremely wetNo drought
1.50 to 1.99Very wet
1.00 to 1.49Moderately wet
0 to 0.99Near normal
−0.99 to 0Mild drought
−1.00 to −1.49Moderately dryModerate drought
−1.50 to −1.99Severely drySevere drought
<−2.00Extremely dryExtreme drought
Table 4. Soil and Water Assessment Tool (SWAT) input parameters and their ranges selected for calibration.
InputParameterDescriptionRangeFitted
MinMax
Ground
water
ALPHA_BFBaseflow alpha factor010.685
GW_DELAYGroundwater delay time0500122.50
GW_REVAPGroundwater re-evaporation coefficient0.020.20.14
GWQMNThreshold water level in shallow aquifer for baseflow050003275.00
RCHRG_DPDeep aquifer percolation fraction010.83
REVAPMNThreshold depth of water in the shallow aquifer for re-evaporation0500212.50
Hydrologic
response
unit
CANMXMaximum canopy storage01001.5
EPCOPlant uptake compensation factor010.82
ESCOSoil evaporation compensation factor010.18
SLSUBBSNAverage slope length1015049.90
BasinSFTMPSnowfall temperature−20203.80
SMFMNMelt factor for snow on December 210205.10
SMFMXMelt factor for snow on June 210203.50
SMTMPSnow melt base temperature−2020−6.60
SURLAGSurface runoff lag coefficient0.052422.68
TIMPSnow pack temperature lag factor010.83
Sub-catchmentsCH_N1Manning’s “n” value for the tributary channels0.013023.55
SoilSOL_AWCAvailable water capacity of the soil layer010.15
SOL_KSaturated hydraulic conductivity020001370.00
SOL_ZDepth from soil surface to bottom of layer0350017.50
Channel
routing
CH_K2Effective hydraulic conductivity in main channel alluvium−0.01500117.49
CH_N2Manning’s “n” value for the main channel−0.010.30.07
ManagementCN2Initial SCS runoff curve number for moisture condition Ⅱ359837.21
Table 5. Change ratios of precipitation, temperature, and flow in the historical and future value.
PeriodGCMPrecipitation–Flow–TemperatureHistorical
(1984–2019)
Near Future
(2021–2060)
Far Future
(2061–2100)
Change Ratio
(%)
NearFar
AnnualRCP4.5Prec. (mm)1342.11395.31423.64.06.1
Flow (m3/s)440.9491.9507.211.615.0
Temp. (°C)12.111.112.5−8.33.3
SSP2-4.5Prec. (mm)1342.11205.71188.5−10.2−11.4
Flow (m3/s)440.9417.2412.3−5.4−6.5
Temp. (°C)12.110.912.9−9.96.6
Spring
(Mar–May)
RCP4.5Prec. (mm)213.2334.1363.356.770.4
Flow (m3/s)183.9373.9387.3103.3110.6
Temp. (°C)11.810.111.9−14.40.8
SSP2-4.5Prec. (mm)213.2358.5358.968.268.3
Flow (m3/s)183.9468.5455.9154.8147.9
Temp. (°C)11.85.77.8−51.7−33.9
Summer
(June–August)
RCP4.5Prec. (mm)793.9650.9668.9−18.0−15.7
Flow (m3/s)965.5822.9874.4−14.8−9.4
Temp. (°C)24.323.124.1−4.9−0.8
SSP2-4.5Prec. (mm)793.9406.1388.4−48.8−51.1
Flow (m3/s)965.5525.6507.8−45.6−47.4
Temp. (°C)24.321.723.3−10.7−4.1
Autumn
(September–November)
RCP4.5Prec. (mm)262275.1267.35.02.0
Flow (m3/s)526538.4540.12.42.7
Temp. (°C)13.312.714.6−4.59.8
SSP2-4.5Prec. (mm)262224.3224.7−14.4−14.2
Flow (m3/s)526336.5340.0−36.0−35.4
Temp. (°C)13.316.919.627.147.4
Winter
(December–February)
RCP4.5Prec. (mm)73135.2124.185.270.0
Flow (m3/s)88.3232.4226.9163.2157.0
Temp. (°C)−1.4−1.6−0.614.3−57.1
SSP2-4.5Prec. (mm)73216.7216.6196.8196.7
Flow (m3/s)88.3338.4345.5283.2291.3
Temp. (°C)−1.4−0.80.6−42.9−142.9
Table 6. Number of drought occurrences in Standardized Precipitation Index (SPI), Standardized Precipitation Evapotranspiration Index (SPEI), and Streamflow Drought Index (SDI) for all durations (historical drought).
Drought IndexDurationOccurrenceModeratelySeverelyExtremely
SPI3 mon6636237
6 mon5929246
9 mon5720316
12 mon6327333
SPEI3 mon6840244
6 mon6032235
9 mon6225325
12 mon6430313
SDI3 mon6744185
6 mon6843205
9 mon5731206
12 mon6031227
Table 7. The three longest historical droughts of SPI, SPEI, and SDI according to all durations.
Drought IndexDuration
(Month)
Longest Drought Duration (Month)
Duration (Month)Year
SPI351988-02 to 1988-06, 2014-05 to 2014-09
672001-08 to 2002-02, 2014-07 to 2014-12, 2015-07 to 2016-01
9112016-08 to 2017-06
12372014-07 to 2017-07
SPEI372014-03 to 2014-09
682014-05 to 2014-12
9112016-08 to 2017-06
12372014-07 to 2017-07
SDI362014-05 to 2014-10
6112016-08 to 2017-06
9122014-06 to 2015-05
12392014-07 to 2017-09
Table 8. Minimum severities of SPI, SPEI, and SDI in near and far futures for RCP4.5 and SSP2-4.5.
Duration
(Month)
PeriodRCP4.5SSP2-4.5
SPISPEISDISPISPEISDI
3Near−1.966−1.917−2.017−2.349−2.227−2.131
Far−2.653−2.618−2.522−2.249−2.344−2.263
6Near−2.374−2.281−2.139−2.220−2.173−2.109
Far−2.940−2.809−2.911−2.280−2.351−1.993
9Near−2.132−2.132−2.132−2.232−2.238−2.199
Far−2.909−2.838−2.893−2.217−2.353−1.983
12Near−2.192−2.102−2.234−2.250−2.145−2.278
Far−3.117−3.030−2.888−2.096−2.418−2.076
Table 9. Number of drought occurrences in SPI for all durations.
DurationGCMPeriodOccurrenceModeratelySeverelyExtremely
3 monthsRCP4.5Near future7144270
Far future9866293
SSP2-4.5Near future8154207
Far future9062262
6 monthsRCP4.5Near future6950181
Far future92483113
SSP2-4.5Near future8255243
Far future9667254
9 monthsRCP4.5Near future7155133
Far future92503012
SSP2-4.5Near future8557262
Far future9663321
12 monthsRCP4.5Near future6851134
Far future90512316
SSP2-4.5Near future9151364
Far future8761233
Table 10. Number of drought occurrences in SPEI for all durations.
DurationGCMPeriodOccurrenceModeratelySeverelyExtremely
3 monthsRCP4.5Near future6543220
Far future10365344
SSP2-4.5Near future6344136
Far future10973306
6 monthsRCP4.5Near future6447161
Far future96522915
SSP2-4.5Near future5741151
Far future11365417
9 monthsRCP4.5Near future6348132
Far future95542912
SSP2-4.5Near future4834122
Far future11363464
12 monthsRCP4.5Near future6448133
Far future95562019
SSP2-4.5Near future6145124
Far future10763386
Table 11. Number of drought occurrences in SDI for all durations.
Duration
(Month)
GCMPeriodOccurrenceModeratelySeverelyExtremely
3 monthsRCP4.5Near future6239221
Far future9960309
SSP2-4.5Near future9674193
Far future9164261
6 monthsRCP4.5Near future6854113
Far future100602614
SSP2-4.5Near future8255252
Far future9866320
9 monthsRCP4.5Near future6750125
Far future89482813
SSP2-4.5Near future9866320
Far future8248331
12 monthsRCP4.5Near future6447125
Far future85462217
SSP2-4.5Near future8342374
Far future7548261
Table 12. The longest drought period of SPI, SPEI, and SDI.
Duration
(Month)
GCMPeriodThe Longest Drought Period (Month)
SPISPEISDI
3RCP4.5Near future8910
Far future141413
SSP2-4.5Near future4411
Far future578
6RCP4.5Near future101010
Far future111319
SSP2-4.5Near future71010
Far future71110
9RCP4.5Near future101015
Far future191918
SSP2-4.5Near future191520
Far future111111
12RCP4.5Near future151519
Far future202121
SSP2-4.5Near future181419
Far future121311
Publisher’s Note: MDPI stays neutral with regard to jurisdictional claims in published maps and institutional affiliations.

