A Review of Electricity Demand Forecasting in Low and Middle Income Countries: The Demand Determinants and Horizons


 ,
, 
Abstract
:1. Introduction
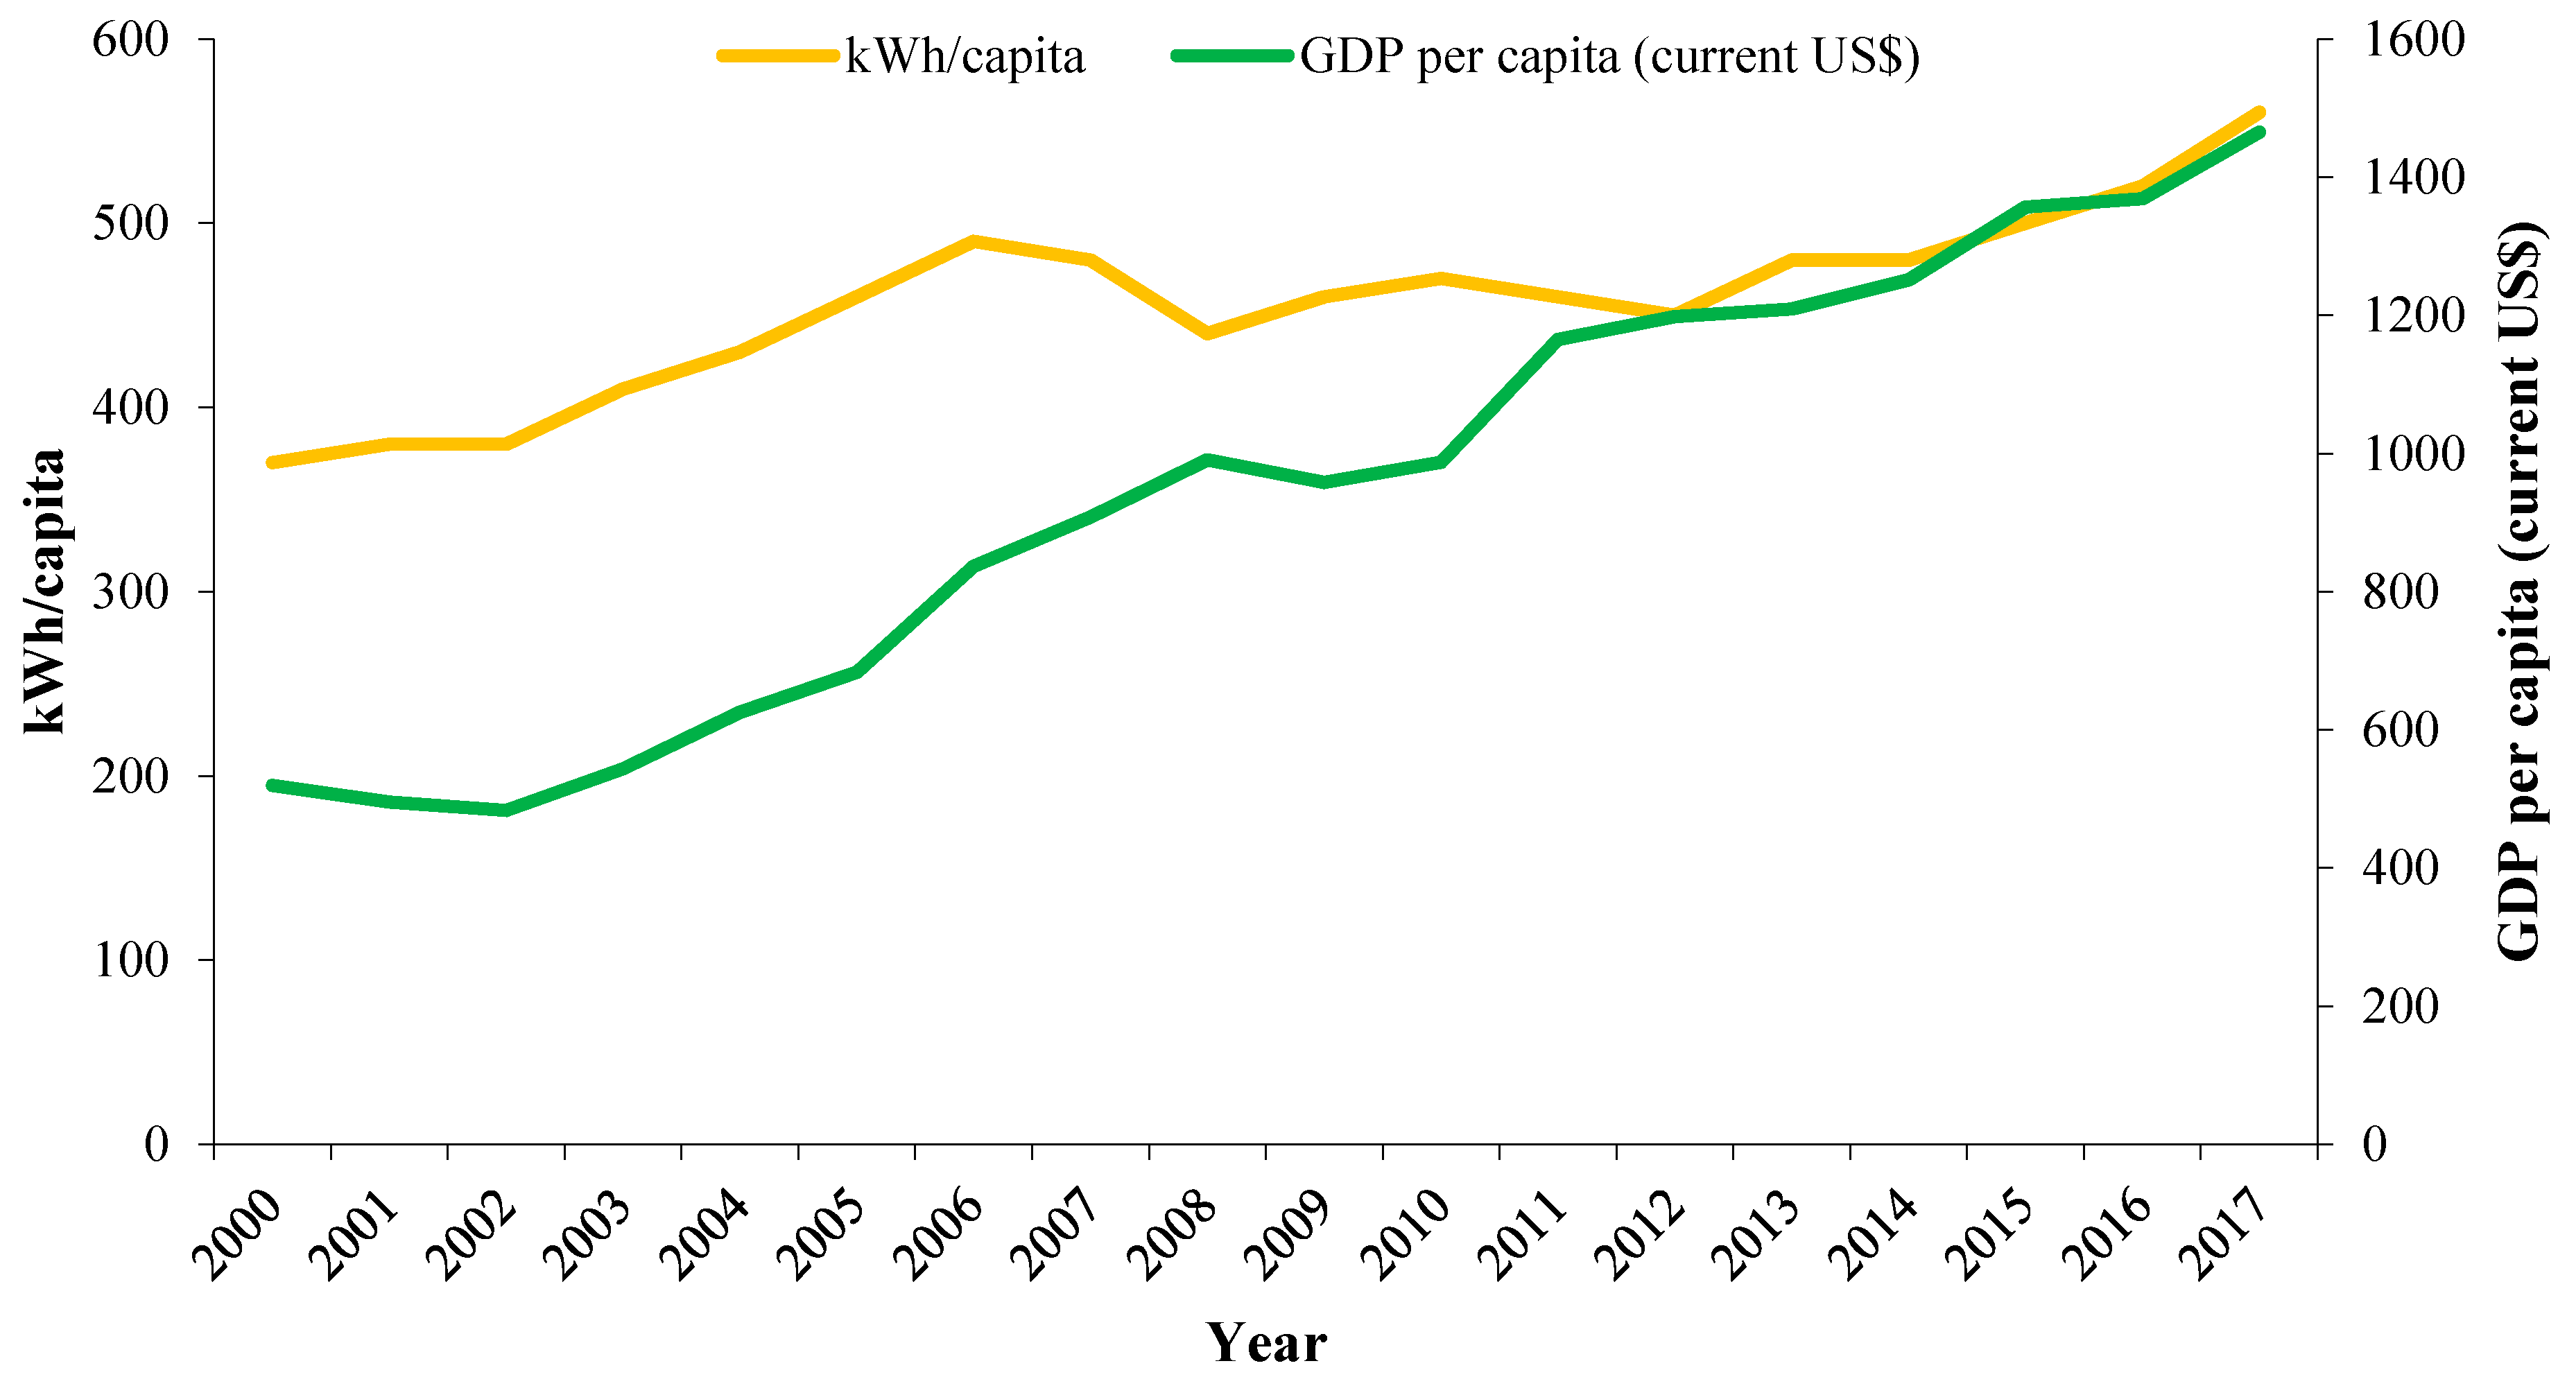
2. Importance of Load Forecasting for Pakistan—A Global Perspective
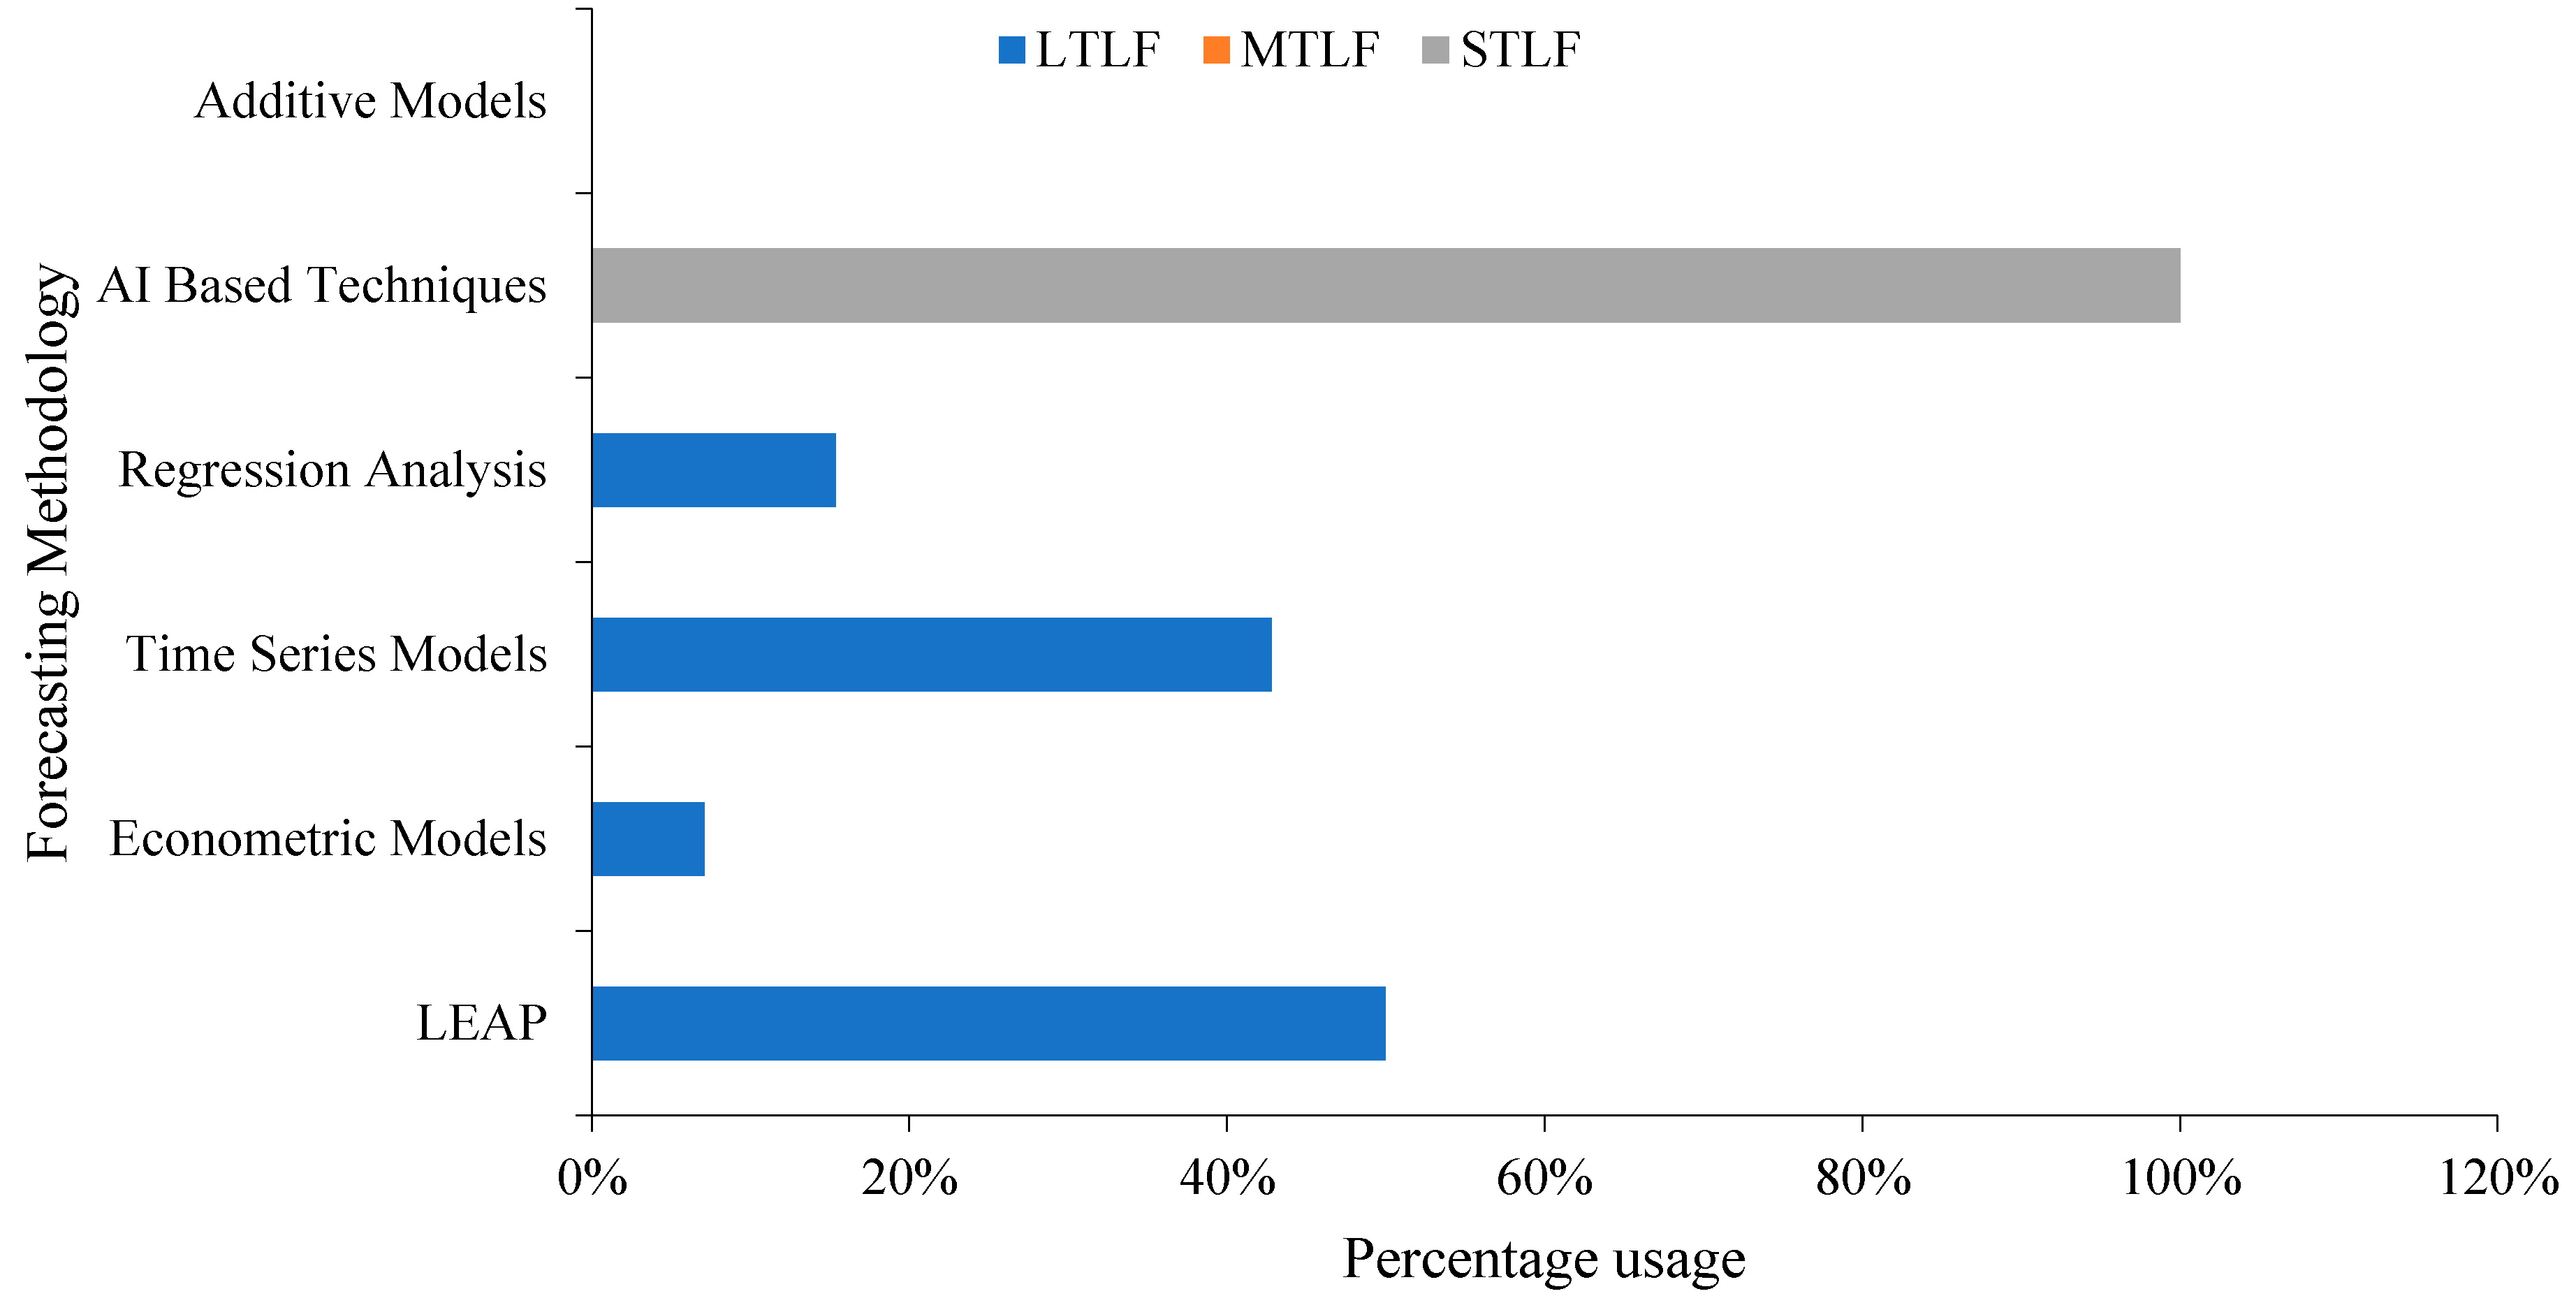
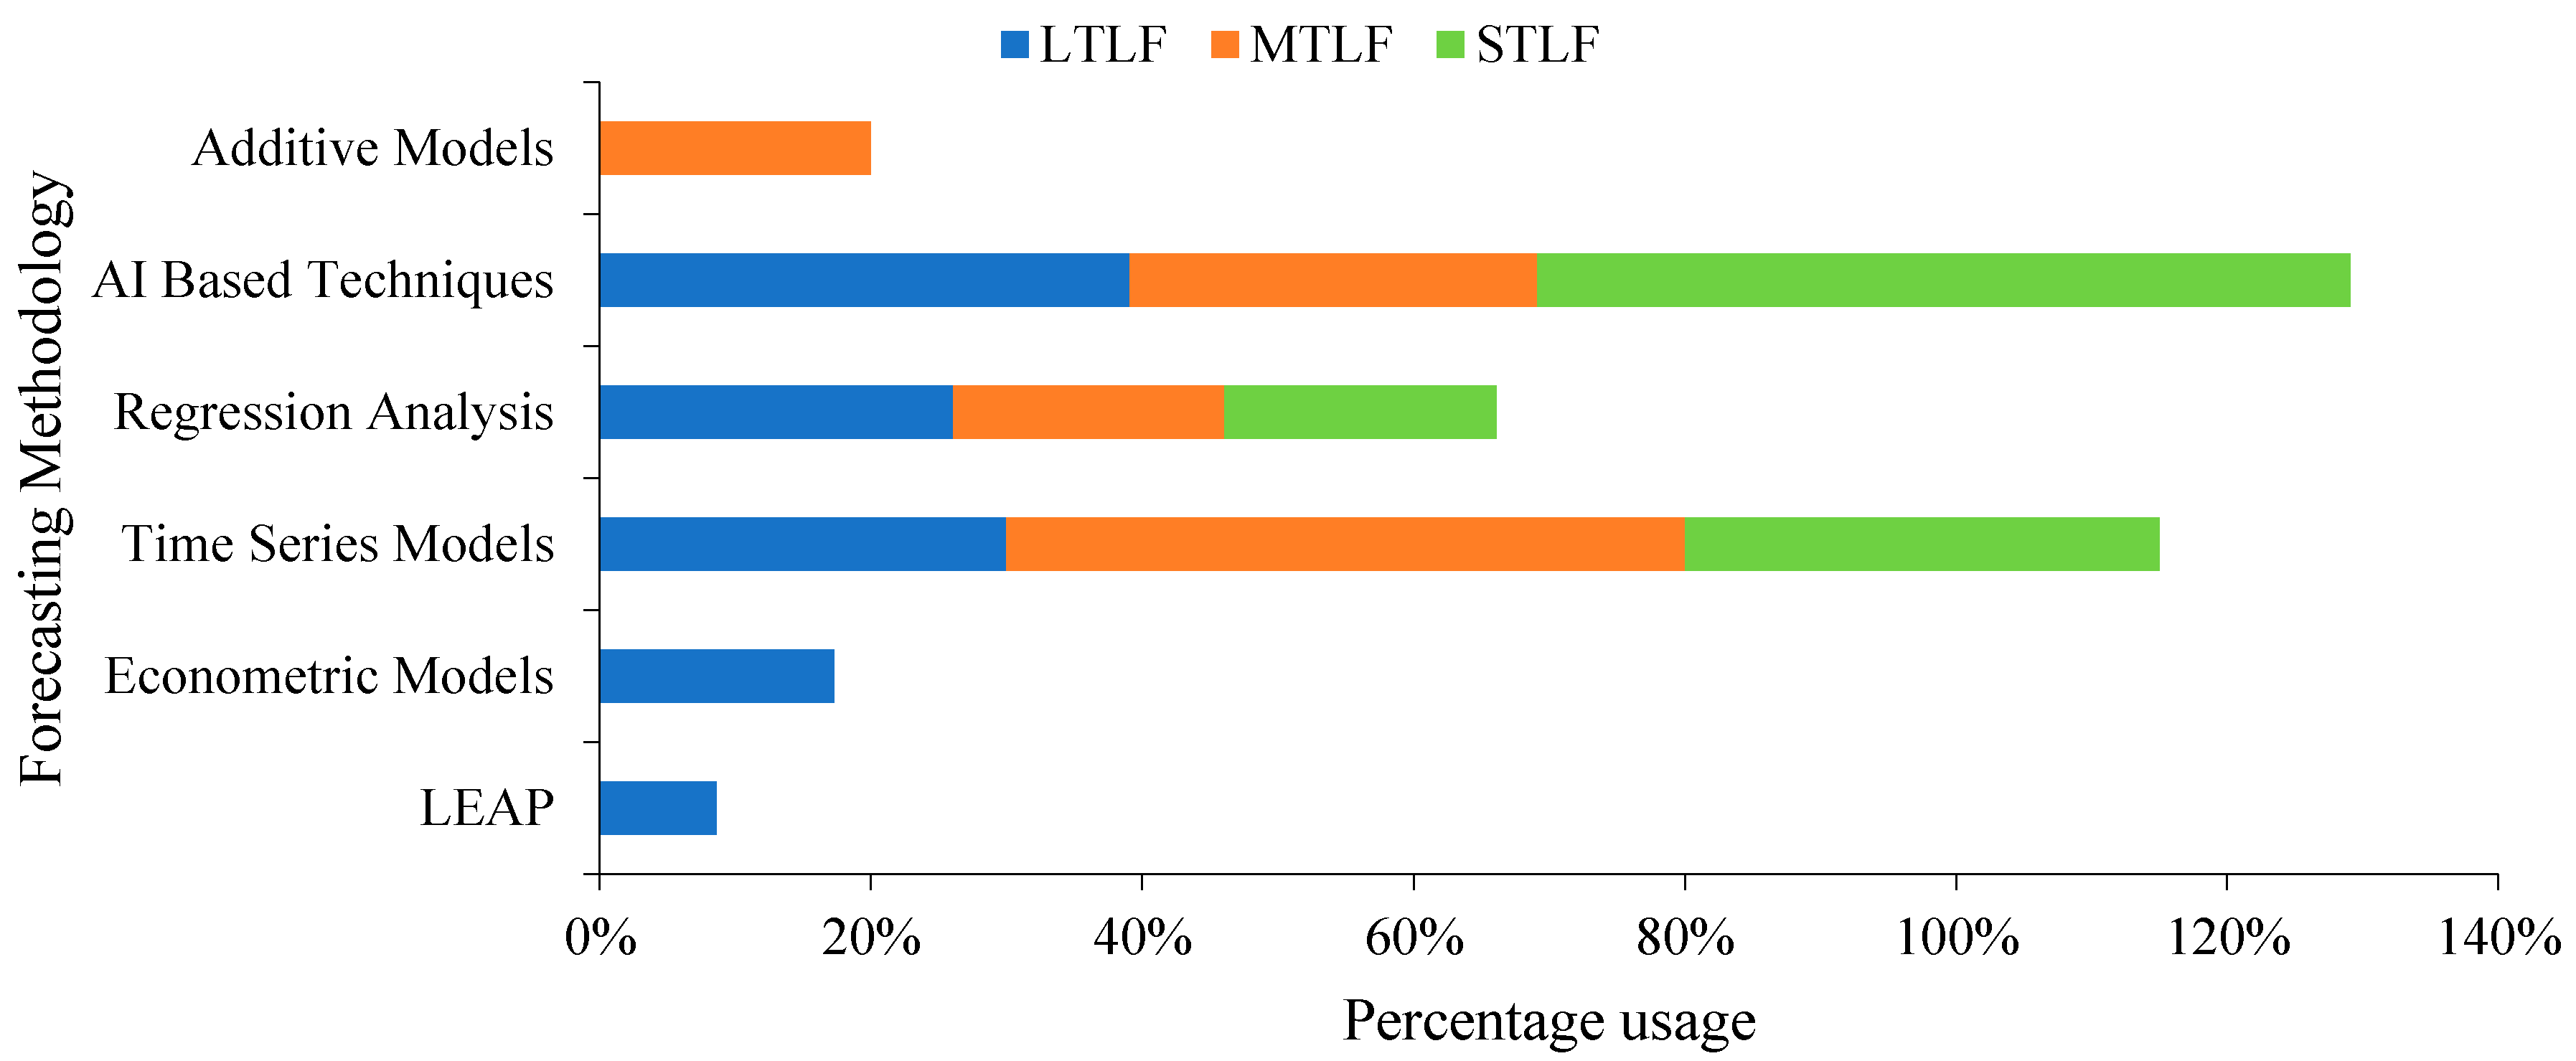
3. Forecasting Methodologies—Models and Techniques
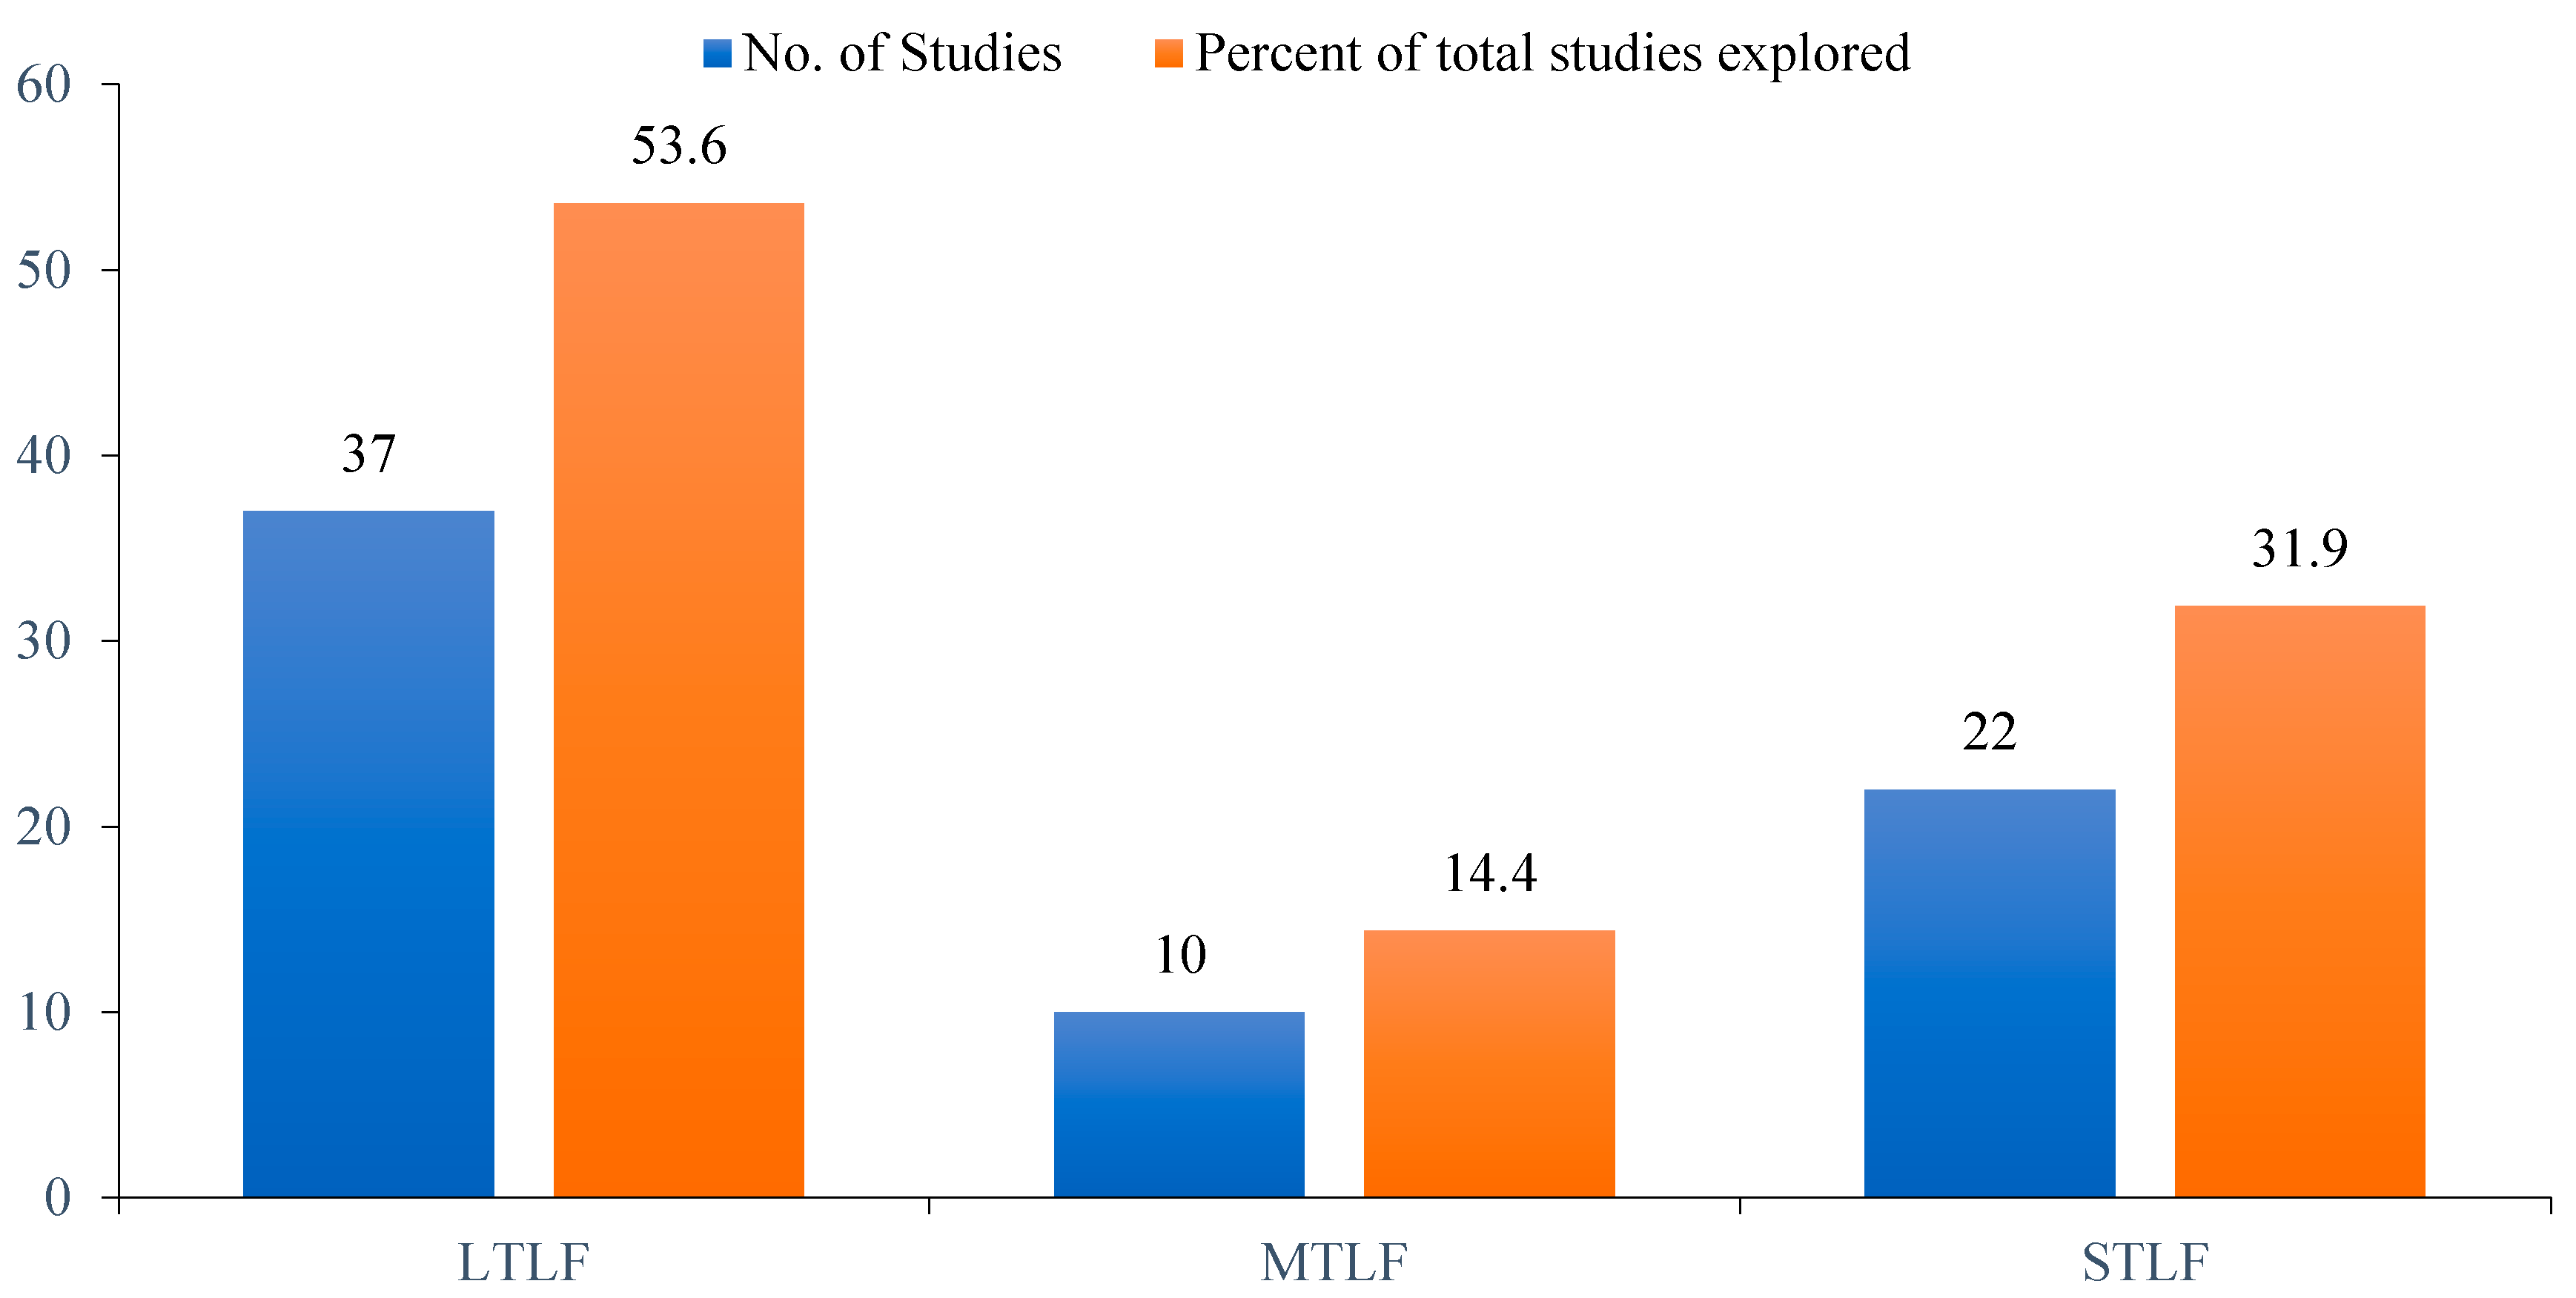
- Short term load forecasting (STLF)
- Medium term load forecasting (MTLF)
- Long term load forecasting (LTLF)
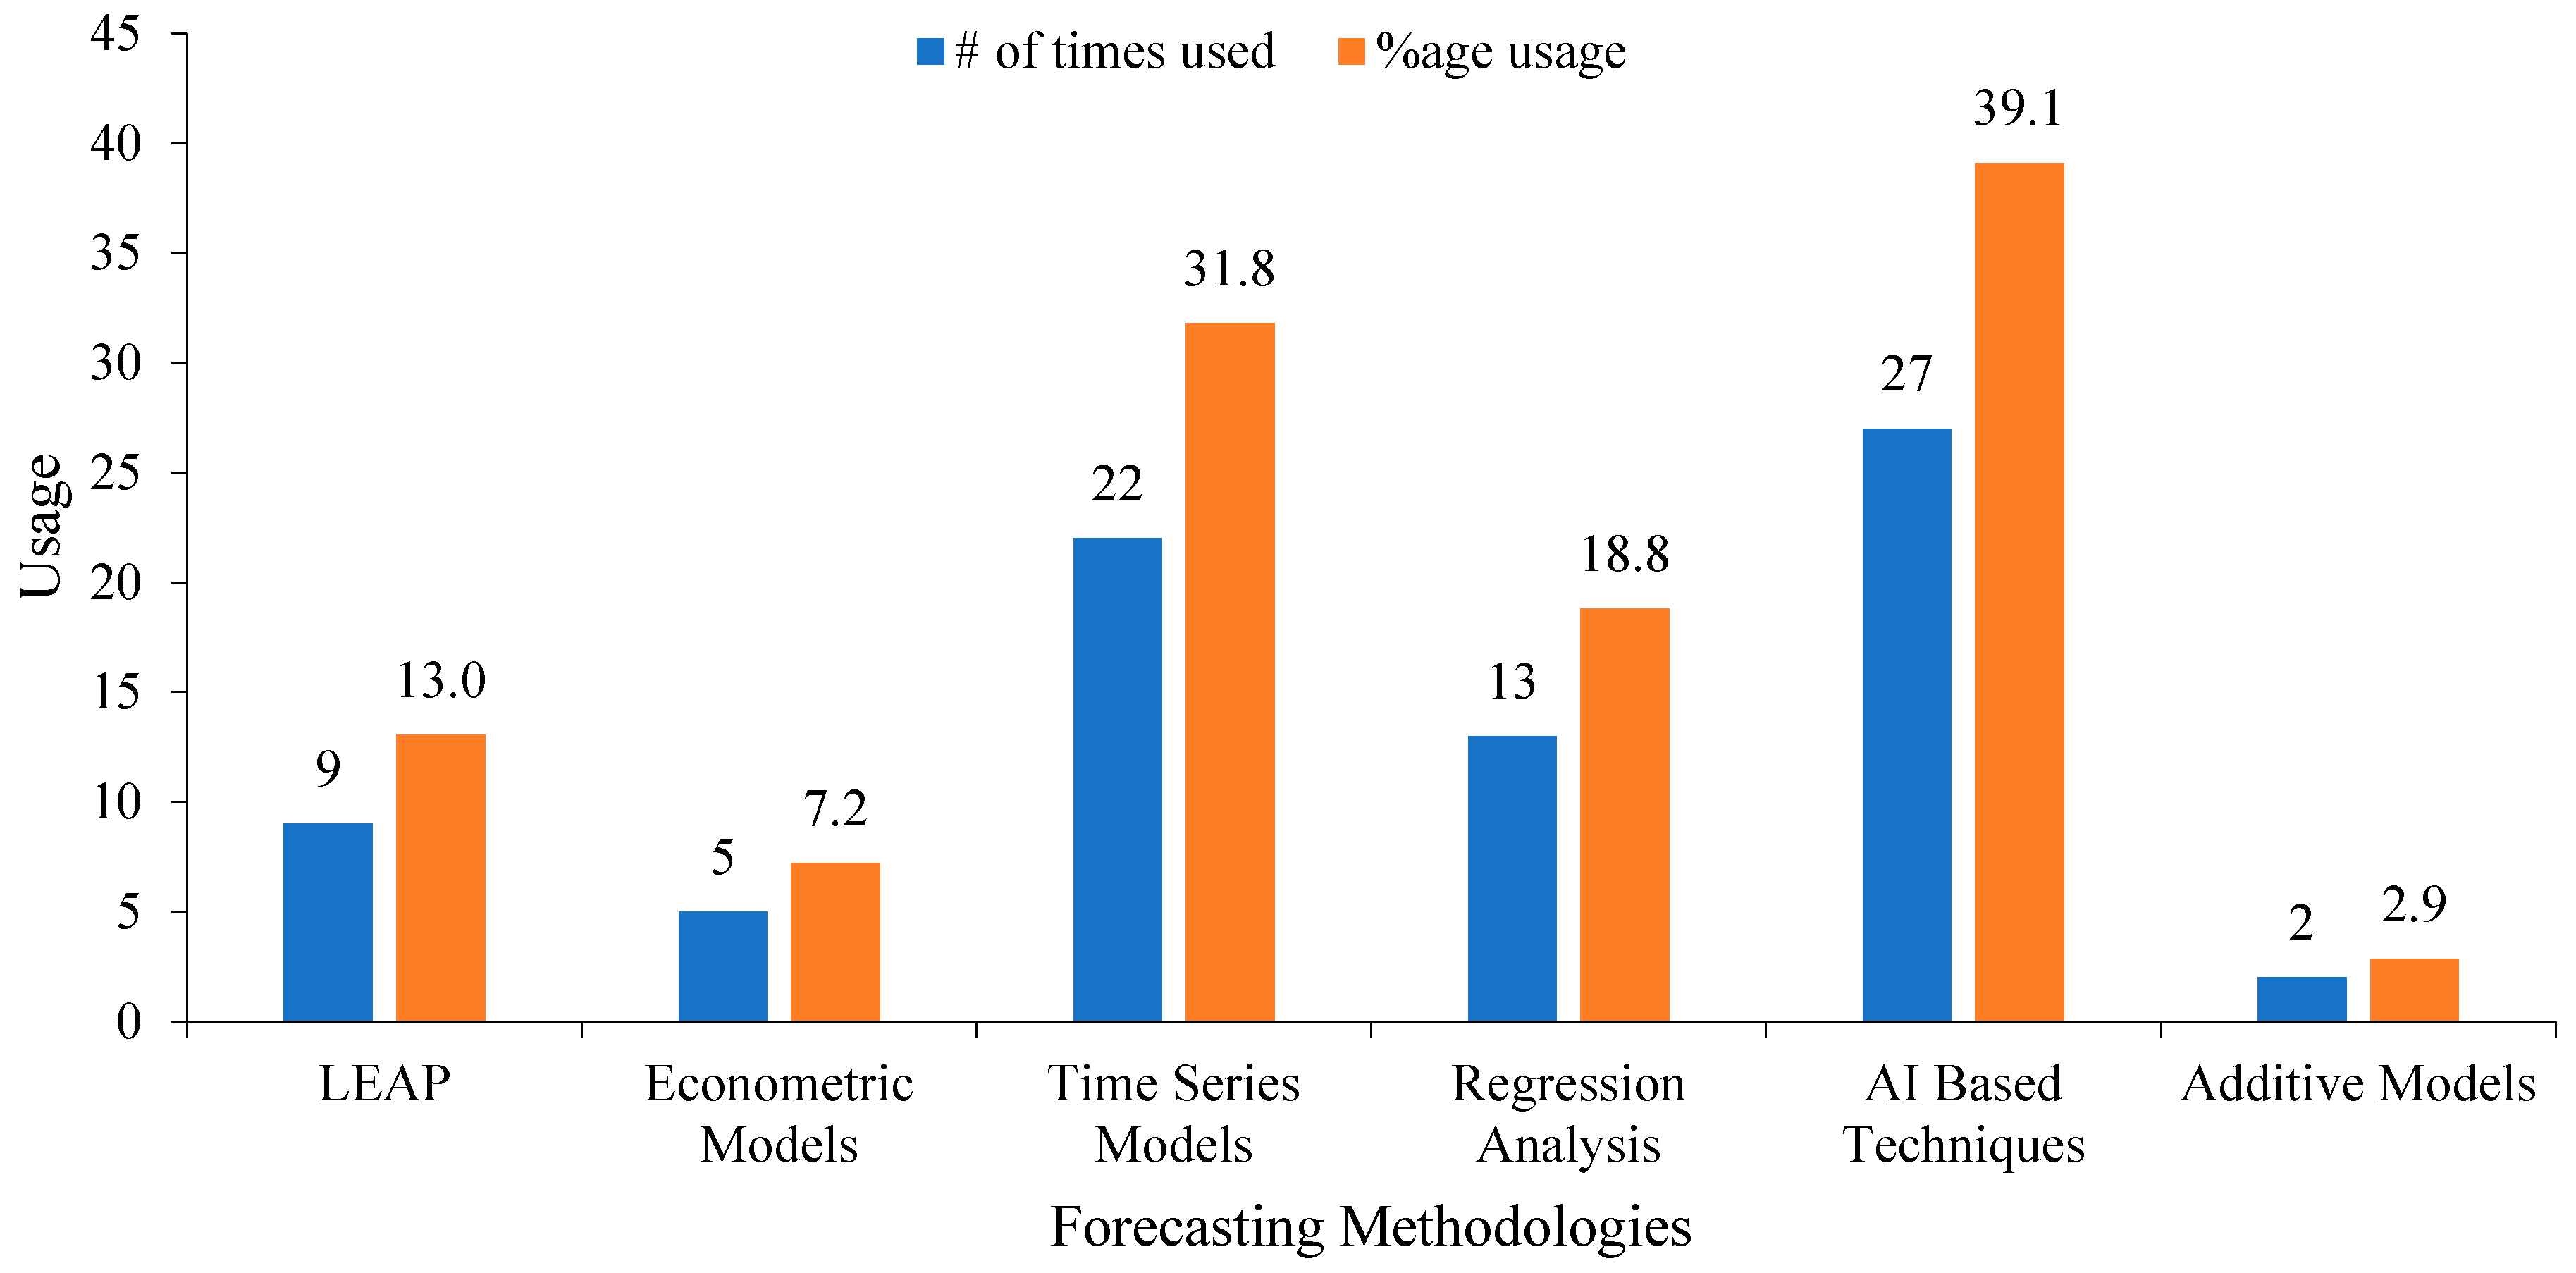
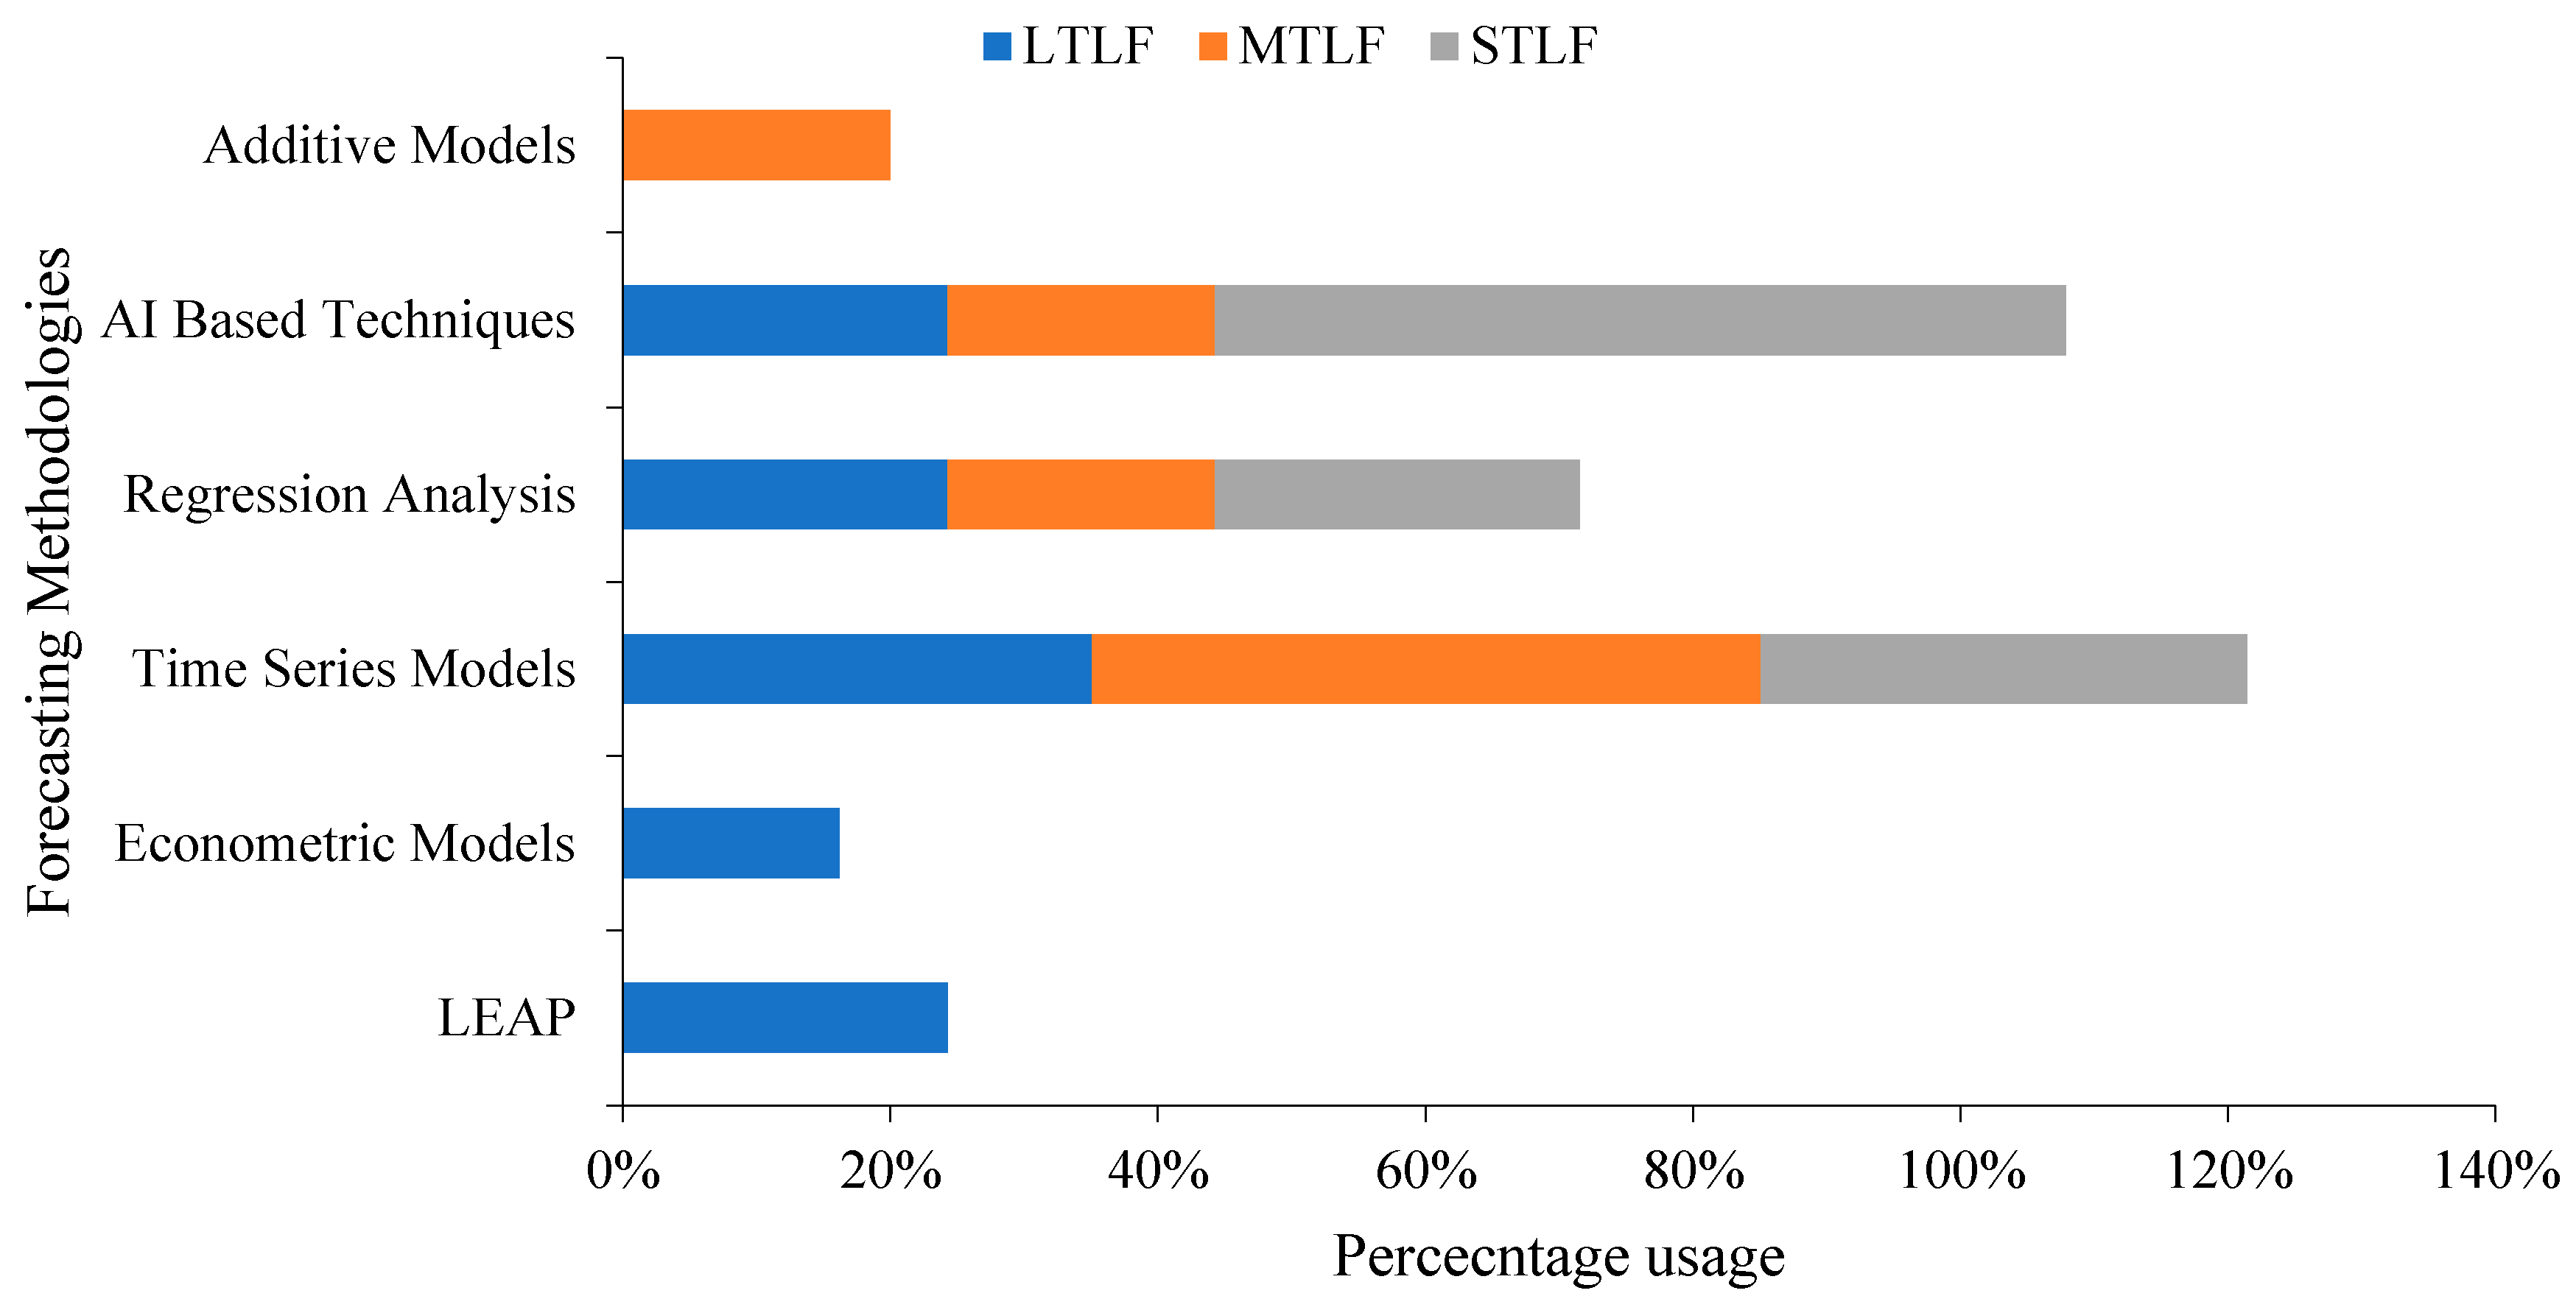
3.1. Bottom-Up Models
Long Range Energy Alternatives Planning (LEAP)
3.2. Top-Down Models
Econometric Forecast Models
3.3. Regression Analysis
3.4. Time Series Forecasting Techniques
3.4.1. ARMA/ARIMA/SARIMA
3.4.2. Exponential Smoothing
3.4.3. Some Additional Time Series Techniques
3.5. Artificial Intelligence-Based Techniques
3.6. Additive Models
4. Electricity Demand Forecasting Methodologies and Its Determinants—A Comparative Analysis
5. Conclusions
Author Contributions
Funding
Conflicts of Interest
References
- IEA. World Energy Outlook 2019; IEA: Paris, France, 2019. Available online: https://www.iea.org/reports/world-energy-outlook-2019 (accessed on 16 November 2019).
- Hong, T.; Fan, S. Probabilistic electric load forecasting: A tutorial review. Int. J. Forecast. 2016, 32, 914–938. [Google Scholar] [CrossRef]
- Web of Science [v.5.34]-Web of Science Core Collection Result Analysis. Available online: https://wcs.webofknowledge.com/RA/analyze.do?product=WOS&SID=D1nlmkZp7gsWRfth3WV&field=PY_PublicationYear_PublicationYear_en&yearSort=true (accessed on 23 January 2020).
- Son, H.; Kim, C. A deep learning approach to forecasting monthly demand for residential-sector electricity. Sustainability 2020, 12, 3103. [Google Scholar] [CrossRef] [Green Version]
- Liu, D.; Sun, K.; Huang, H.; Tang, P. Monthly load forecasting based on economic data by decomposition integration theory. Sustainability 2018, 10, 3282. [Google Scholar] [CrossRef] [Green Version]
- Low & Middle Income. Available online: https://data.worldbank.org/income-level/low-and-middle-income (accessed on 26 March 2020).
- Suganthi, L.; Samuel, A.A. Energy models for demand forecasting-A review. Renew. Sustain. Energy Rev. 2012, 16, 1223–1240. [Google Scholar] [CrossRef]
- Ahmed, S.; Nayyar, S.; Mirjat, H.; Shabbir, W.; Gordhan, K.; Walasai, D.; Sattar, A. Electricity Demand Forecasting: A Pakistans Perspective. Asian J. Eng. Sci. Technol. 2017, 2, 1–7. [Google Scholar]
- Alfares, H.K.; Nazeeruddin, M. Electric load forecasting: Literature survey and classification of methods. Int. J. Syst. Sci. 2002, 33, 23–34. [Google Scholar] [CrossRef]
- Swan, L.G.; Ugursal, V.I. Modeling of end-use energy consumption in the residential sector: A review of modeling techniques. Renew. Sustain. Energy Rev. 2009, 13, 1819–1835. [Google Scholar] [CrossRef]
- Hernandez, L.; Baladron, C.; Aguiar, J.M.; Carro, B.; Sanchez-Esguevillas, A.J.; Lloret, J.; Massana, J. A survey on electric power demand forecasting: Future trends in smart grids, microgrids and smart buildings. IEEE Commun. Surv. Tutor. 2014, 16, 1460–1495. [Google Scholar] [CrossRef]
- Yildiz, B.; Bilbao, J.I.; Sproul, A.B. A review and analysis of regression and machine learning models on commercial building electricity load forecasting. Renew. Sustain. Energy Rev. 2017, 73, 1104–1122. [Google Scholar] [CrossRef]
- Khan, A.R.; Mahmood, A.; Safdar, A.; Khan, Z.A.; Khan, N.A. Load forecasting, dynamic pricing and DSM in smart grid: A review. Renew. Sustain. Energy Rev. 2016, 54, 1311–1322. [Google Scholar] [CrossRef]
- Qamar, M.; Khosravi, A. A review on arti fi cial intelligence based load demand forecasting techniques for smart grid and buildings. Renew. Sustain. Energy Rev. 2015, 50, 1352–1372. [Google Scholar] [CrossRef]
- Kuster, C.; Rezgui, Y.; Mourshed, M. Electrical load forecasting models: A critical systematic review. Sustain. Cities Soc. 2017, 35, 257–270. [Google Scholar] [CrossRef]
- Kyriakides, E.; Polycarpou, M. Short term electric load forecasting: A tutorial. Stud. Comput. Intell. 2006, 35, 391–418. [Google Scholar] [CrossRef]
- Sangrody, H.; Zhou, N. An initial study on load forecasting considering economic factors. In Proceedings of the 2016 IEEE Power and Energy Society General Meeting (PESGM), Boston, MA, USA, 17–21 July 2016; pp. 1–5. [Google Scholar] [CrossRef] [Green Version]
- Ortega-Vazquez, M.A.; Kirschen, D.S. Economic impact assessment of load forecast errors considering the cost of interruptions. In Proceedings of the 2006 IEEE Power Engineering Society General Meeting, Montreal, QC, Canada, 18–22 June 2006. [Google Scholar] [CrossRef]
- Hafeez, A. Circular Debt in Power Sector of Pakistan: Impacts; Causes and Solutions; Amjad Hafeez MPhil in ESD University of Cambridge BSc Electrical Engineering UET Lahore: Cambridge, UK, 2019. [Google Scholar]
- Jamil, F.; Ahmad, E. The relationship between electricity consumption, electricity prices and GDP in Pakistan. Energy Policy 2010, 38, 6016–6025. [Google Scholar] [CrossRef]
- Mirza, F.M.; Fatima, N.; Ullah, K. Impact of China-Pakistan economic corridor on Pakistan’s future energy consumption and energy saving potential: Evidence from sectoral time series analysis. Energy Strateg. Rev. 2019, 25, 34–46. [Google Scholar] [CrossRef]
- Qamar Uz Zaman, C. Climate Change Profile of Pakistan (ASIAN DEVELOPMENT BANK); Asian Development Bank: Mandaluyong, Philippines, 2017; ISBN 9789292577216. [Google Scholar]
- Personal, M.; Archive, R. Electricity Demand Analysis Using Cointegration and ARIMA Modelling: A case study of Turkey; Munich Personal RePEc Archive: Munich, Germany, 2009. [Google Scholar]
- IEA Energy Atlas. Available online: http://energyatlas.iea.org/#!/tellmap/-1118783123/1 (accessed on 30 January 2020).
- GDP per Capita (current US$)-Pakistan. Available online: https://data.worldbank.org/indicator/NY.GDP.PCAP.CD?end=2018&locations=PK&start=2000 (accessed on 30 January 2020).
- National Transmission & Despatch Company Limited (NTDC) Pakistan. Available online: https://www.ntdc.com.pk/transmission (accessed on 17 May 2020).
- Ali, M.; Iqbal, M.J.; Sharif, M. Relationship between extreme temperature and electricity demand in Pakistan. Int. J. Energy Environ. Eng. 2013, 4, 1–7. [Google Scholar] [CrossRef] [Green Version]
- Rahman, S. Global climate change: Impact on pakistan’s political economy. ISSRA Pap. 2010, 2, 24–36. [Google Scholar]
- Khan, Z.A.; Jayaweera, D. Approach for forecasting smart customer demand with significant energy demand variability. In Proceedings of the 2018 1st International Conference on Power, Energy and Smart Grid (ICPESG), Mirpur Azad Kashmir, Pakistan, 9–10 April 2018; pp. 1–5. [Google Scholar]
- Al-Alawi, S.M.; Islam, S.M. Principles of electricity demand forecasting. Part 1: Methodologies. Power Eng. J. 1996, 11, 91–95. [Google Scholar] [CrossRef]
- Hong, T. Short Term Electric Load Forecasting; North Carolina State University: Raleigh, NC, USA, 2010. [Google Scholar]
- Simpson, W. Standard Approaches to Load Forecasting and Review of Manitoba Hydro Load Forecast for Needs For and Alternatives To (NFAT); University of Manitoba: Winnipeg, MB, Canada, 2014. [Google Scholar]
- Silva, F.L.C.; Souza, R.C.; Cyrino Oliveira, F.L.; Lourenco, P.M.; Calili, R.F. A bottom-up methodology for long term electricity consumption forecasting of an industrial sector-Application to pulp and paper sector in Brazil. Energy 2018, 144, 1107–1118. [Google Scholar] [CrossRef]
- Herbst, A.; Toro, F.; Reitze, F.; Jochem, E. Introduction to Energy Systems Modelling. Swiss J. Econ. Stat. 2012, 148, 111–135. [Google Scholar] [CrossRef] [Green Version]
- SEI A short history of LEAP. Available online: https://energycommunity.org/Help/Concepts/History_of_LEAP.htm (accessed on 2 October 2019).
- SEI LEAP description from SEI. Available online: https://www.energycommunity.org/default.asp?action=introduction (accessed on 2 October 2019).
- Perwez, U.; Sohail, A.; Hassan, S.F.; Zia, U. The long-term forecast of Pakistan’s electricity supply and demand: An application of long range energy alternatives planning. Energy 2015, 93, 2423–2435. [Google Scholar] [CrossRef]
- Worldbank. Pakistan-Proposed World Bank Climate Change and Environment Program 2010–2015 (Anglais); Worldbank: Washington, DC, USA, 2012. [Google Scholar]
- Mirjat, N.H.; Uqaili, M.A.; Harijan, K.; Walasai, G.D.; Mondal, M.A.H.; Sahin, H. Long-term electricity demand forecast and supply side scenarios for Pakistan (2015–2050): A LEAP model application for policy analysis. Energy 2018, 165, 512–526. [Google Scholar] [CrossRef]
- Perwez, U.; Sohail, A. Forecasting of Pakistan’s net electricity energy consumption on the basis of energy pathway scenarios. Energy Procedia 2014, 61, 2403–2411. [Google Scholar] [CrossRef] [Green Version]
- Chi, Y.; Yuan, L.; Li, H.; Zhang, Y.; Bai, G. Using LEAP model to predict energy consumption of beijing under the constraint of low-carbon economy. Ekoloji 2019, 28, 1205–1211. [Google Scholar]
- Nieves, J.A.; Aristizábal, A.J.; Dyner, I.; Báez, O.; Ospina, D.H. Energy demand and greenhouse gas emissions analysis in Colombia: A LEAP model application. Energy 2019, 169, 380–397. [Google Scholar] [CrossRef]
- Mengal, A.; Mirjat, N.H.; DasWalasai, G.; Khatri, S.A.; Harijan, K.; Uqaili, M.A. Modeling of future electricity generation and emissions assessment for Pakistan. Processes 2019, 7, 212. [Google Scholar] [CrossRef] [Green Version]
- Gul, M.; Qureshi, W.A. Long term electricity demand forecasting in residential sector of Pakistan. In Proceedings of the 2012 IEEE Power and Energy Society General Meeting, San Diego, CA, USA, 22–26 July 2012; pp. 1–7. [Google Scholar] [CrossRef]
- Sohail, S. Federal Bureau of Statistics. In Pakistan Statistical Year Book; Government of Pakistan: Islamabad, Pakistan, 2010. [Google Scholar]
- Hussain, A.; Shahid, M. The Long-term Forecast of Gilgit Baltistan (GB)’s Electricity Demand. In Proceedings of the 2018 International Conference on Power Generation Systems and Renewable Energy Technologies (PGSRET), Islamabad, Pakistan, 10–12 September 2018; pp. 1–5. [Google Scholar] [CrossRef]
- Shabbir, R.; Ahmad, S.S. Monitoring urban transport air pollution and energy demand in Rawalpindi and Islamabad using leap model. Energy 2010, 35, 2323–2332. [Google Scholar] [CrossRef]
- Malakhov, V.A. Approaches to forecasting electricity demand in Russia. Stud. Russ. Econ. Dev. 2009, 20, 153–157. [Google Scholar] [CrossRef]
- Gul, M.; Qa, S.A. Incorporating Economic and Demographic Variables for Forecasting Electricity Consumption in Pakistan. In Proceedings of the 2011 2nd International Conference on Electric Power and Energy Conversion Systems (EPECS), Sharjah, United Arab Emirates, 15–17 November 2011. [Google Scholar] [CrossRef]
- Franco, M.; Blanco, D.; Blequett, W.; Guglia, M.; Alvarado, E. Cointegration methodology and error correction model used to forecast the electricity demand of the Venezuelan electric system-Period 2004–2024. In Proceedings of the 2006 IEEE/PES Transmission & Distribution Conference and Exposition: Latin America, Caracas, Venezuela, 15–18 August 2006; pp. 1–8. [Google Scholar] [CrossRef]
- Cabral, J.D.A.; Legey, L.F.L.; Cabral, M.V.D.F. Electricity consumption forecasting in Brazil: A spatial econometrics approach. Energy 2017, 126, 124–131. [Google Scholar] [CrossRef]
- He, Y.; Jiao, J.; Chen, Q.; Ge, S.; Chang, Y.; Xu, Y. Urban long term electricity demand forecast method based on system dynamics of the new economic normal: The case of Tianjin. Energy 2017, 133, 9–22. [Google Scholar] [CrossRef]
- Mbamalu, G.A.N.; El-Hawary, M.E. Load forecasting via suboptimal seasonal autoregressive models and iteratively reweighted least squares estimation. IEEE Trans. Power Syst. 1993, 8, 343–348. [Google Scholar] [CrossRef]
- Chen, B.J.; Chang, M.W.; Lin, C.J. Load forecasting using support vector machines: A study on EUNITE Competition 2001. IEEE Trans. Power Syst. 2004, 19, 1821–1830. [Google Scholar] [CrossRef] [Green Version]
- Hong, T.; Pinson, P.; Fan, S. Global energy forecasting competition 2012. Int. J. Forecast. 2014, 30, 357–363. [Google Scholar] [CrossRef]
- Amral, N.; Özveren, C.S.; King, D. Short term load forecasting using multiple linear regression. In Proceedings of the 2007 42nd International Universities Power Engineering Conference, Brighton, UK, 4–6 September 2007; pp. 1192–1198. [Google Scholar] [CrossRef]
- Supapo, K.R.M.; Santiago, R.V.M.; Pacis, M.C. Electric load demand forecasting for Aborlan-Narra-Quezon distribution grid in Palawan using multiple linear regression. In Proceedings of the 2017 IEEE 9th International Conference on Humanoid, Nanotechnology, Information Technology, Communication and Control, Environment and Management (HNICEM), Manila, Philippines, 1–3 December 2017; pp. 1–6. [Google Scholar]
- Flores, C.E.; Phelan, P.E.; Mou, J.I.; Bryan, H. Forecasting the electricity consumption of the Mexican border states maquiladoras. Int. J. Energy Res. 2004, 28, 641–660. [Google Scholar] [CrossRef]
- Wani, T.A.; Shiraz, M. Advances in Energy and Built Environment; Springer Singapore: Singapore, 2020; Volume 36, ISBN 978-981-13-7556-9. [Google Scholar]
- Chikobvu, D.; Sigauke, C. Regression-SARIMA modelling of daily peak electricity demand in South Africa. J. Energy S. Afr. 2012, 23, 23–30. [Google Scholar] [CrossRef] [Green Version]
- Miswan, N.H.; Said, R.M.; Anuar, S.H.H. ARIMA with regression model in modelling electricity load demand. J. Telecommun. Electron. Comput. Eng. 2016, 8, 113–116. [Google Scholar]
- Uqaili, M.A.; Harijan, K. Energy, environment and sustainable development. Energy Environ. Sustain. Dev. 2012, 1–349. [Google Scholar] [CrossRef] [Green Version]
- Panklib, K.; Prakasvudhisarn, C.; Khummongkol, D. Electricity Consumption Forecasting in Thailand Using an Artificial Neural Network and Multiple Linear Regression. Energy Sources Part B Econ. Plan. Policy 2015, 10, 427–434. [Google Scholar] [CrossRef]
- Nawaz, S.; Iqbal, N.; Anwar, S. Modelling electricity demand using the STAR (Smooth Transition Auto-Regressive) model in Pakistan. Energy 2014, 78, 535–542. [Google Scholar] [CrossRef]
- Hippert, H.S.; Pedreira, C.E.; Souza, R.C. Neural networks for short-term load forecasting: A review and evaluation. IEEE Trans. Power Syst. 2001, 16, 44–55. [Google Scholar] [CrossRef]
- Madani, S.S. Electric load forecasting using an artificial neural network. Middle East J. Sci. Res. 2013, 18, 396–400. [Google Scholar] [CrossRef]
- Marwala, L.; Twala, B. Forecasting electricity consumption in South Africa: ARMA, neural networks and neuro-fuzzy systems. In Proceedings of the 2014 International Joint Conference on Neural Networks (IJCNN), Beijing, China, 6–11 July 2014; pp. 3049–3055. [Google Scholar] [CrossRef]
- Moghram, I.; Rahman, S. Analysis and Evaluation of Five Short-Term Load Forecasting Techniques. IEEE Power Eng. Rev. 1989, 9, 42–43. [Google Scholar] [CrossRef]
- Taylor, J.W.; de Menezes, L.M.; McSharry, P.E. A comparison of univariate methods for forecasting electricity demand up to a day ahead. Int. J. Forecast. 2006, 22, 1–16. [Google Scholar] [CrossRef]
- Zhang, P.G. Time series forecasting using a hybrid ARIMA and neural network model. Neurocomputing 2003, 50, 159–175. [Google Scholar] [CrossRef]
- Singh, A.K.; Ibraheem; Khatoon, S.; Muazzam, M.; Chaturvedi, D.K. Load forecasting techniques and methodologies: A review. In Proceedings of the 2012 2nd International Conference on Power, Control and Embedded Systems, Allahabad, India, 17–19 December 2012; pp. 1–10. [Google Scholar] [CrossRef]
- Ur Rehman, S.A.; Cai, Y.; Fazal, R.; Walasai, G.D.; Mirjat, N.H. An integrated modeling approach for forecasting long-term energy demand in Pakistan. Energies 2017, 10, 1868. [Google Scholar] [CrossRef] [Green Version]
- Yasmeen, F.; Sharif, M. Forecasting Electricity Consumption for Pakistan. Int. J. Emerg. Technol. Adv. Eng. 2014, 4, 496–503. [Google Scholar]
- Hussain, A.; Rahman, M.; Memon, J.A. Forecasting electricity consumption in Pakistan: The way forward. Energy Policy 2016, 90, 73–80. [Google Scholar] [CrossRef]
- Jamil, R. Hydroelectricity consumption forecast for Pakistan using ARIMA modeling and supply-demand analysis for the year 2030. Renew. Energy 2020, 154, 1–10. [Google Scholar] [CrossRef]
- Erdogdu, E. Electricity demand analysis using cointegration and ARIMA modelling: A case study of Turkey. Energy Policy 2007, 35, 1129–1146. [Google Scholar] [CrossRef] [Green Version]
- Sigauke, C.; Chikobvu, D. Prediction of daily peak electricity demand in South Africa using volatility forecasting models. Energy Econ. 2011, 33, 882–888. [Google Scholar] [CrossRef]
- Wang, Y.; Wang, J.; Zhao, G.; Dong, Y. Application of residual modification approach in seasonal ARIMA for electricity demand forecasting: A case study of China. Energy Policy 2012, 48, 284–294. [Google Scholar] [CrossRef]
- Amjady, N. Short-term hourly load forecasting using time-series modeling with peak load estimation capability. IEEE Trans. Power Syst. 2001, 16, 798–805. [Google Scholar] [CrossRef]
- Zhu, S.; Wang, J.; Zhao, W.; Wang, J. A seasonal hybrid procedure for electricity demand forecasting in China. Appl. Energy 2011, 88, 3807–3815. [Google Scholar] [CrossRef]
- Nie, H.; Liu, G.; Liu, X.; Wang, Y. Hybrid of ARIMA and SVMs for short-term load forecasting. Energy Procedia 2012, 16, 1455–1460. [Google Scholar] [CrossRef] [Green Version]
- Lu, J.-C.; Niu, D.-X.; Jia, Z.-Y. A study of short-term load forecasting based on ARIMA-ANN. In Proceedings of the 2004 International Conference on Machine Learning and Cybernetics (IEEE Cat. No.04EX826), Shanghai, China, 26–29 August 2004; pp. 26–29. [Google Scholar] [CrossRef]
- Mohamed, N.; Ahmad, M.H.; Ismail, Z. Short term load forecasting using double seasonal ARIMA model. World Appl. Sci. J. 2010, 15, 57–73. [Google Scholar]
- Rallapalli, S.R.; Ghosh, S. Forecasting monthly peak demand of electricity in India-A critique. Energy Policy 2012, 45, 516–520. [Google Scholar] [CrossRef]
- Taylor, J.W. Short-term load forecasting with exponentially weighted methods. IEEE Trans. Power Syst. 2012, 27, 458–464. [Google Scholar] [CrossRef]
- Taylor, J.W.; Mcsharry, P.E.; Member, S. Short-Term Load Forecasting Methods: An Evaluation Based on European Data. IEEE Trans. Power Syst. 2007, 22, 2213–2219. [Google Scholar] [CrossRef] [Green Version]
- Taylor, J.W. Short-term electricity demand forecasting using double seasonal exponential smoothing. J. Oper. Res. Soc. 2003, 54, 799–805. [Google Scholar] [CrossRef]
- Taylor, J.W. An evaluation of methods for very short-term load forecasting using minute-by-minute British data. Int. J. Forecast. 2008, 24, 645–658. [Google Scholar] [CrossRef]
- Medina MacAira, P.; Castro Sousa, R.; Cyrino Oliveira, F.L. Forecasting Brazils electricity consumption with Pegels Exponential Smoothing Techniques. IEEE Lat. Am. Trans. 2016, 14, 1252–1258. [Google Scholar] [CrossRef]
- Abd Jalil, N.A.; Ahmad, M.H.; Mohamed, N. Electricity load demand forecasting using exponential smoothing methods. World Appl. Sci. J. 2013, 22, 1540–1543. [Google Scholar] [CrossRef]
- Kumar, U.; Jain, V.K. Time series models (Grey-Markov, Grey Model with rolling mechanism and singular spectrum analysis) to forecast energy consumption in India. Energy 2010, 35, 1709–1716. [Google Scholar] [CrossRef]
- Briceño, H.; Rocco, C.M.; Zio, E. Singular spectrum analysis for forecasting of electric load demand. Chem. Eng. Trans. 2013, 33, 919–924. [Google Scholar] [CrossRef]
- Zhou, P.Ã.; Ang, B.W.; Poh, K.L. A trigonometric grey prediction approach to forecasting electricity demand. Energy 2006, 31, 2839–2847. [Google Scholar] [CrossRef]
- Dilaver, Z.; Hunt, L.C. Industrial electricity demand for Turkey: A structural time series analysis. Energy Econ. 2011, 33, 426–436. [Google Scholar] [CrossRef] [Green Version]
- Yasmeen, F.; Sharif, M. Functional Time series (FTS) Forecasting of Electricity Consumption in Pakistan. Int. J. Comput. Appl. 2015, 124, 15–19. [Google Scholar] [CrossRef]
- Afshar, K.; Bigdeli, N. Data analysis and short term load forecasting in Iran electricity market using singular spectral analysis (SSA). Energy 2011, 36, 2620–2627. [Google Scholar] [CrossRef]
- Solyali, D. A Comparative Analysis of Machine Learning Approaches for Short- / Long-Term Electricity Load Forecasting in Cyprus. Sustainability 2020, 12, 3612. [Google Scholar] [CrossRef]
- Hong, W.C. Chaotic particle swarm optimization algorithm in a support vector regression electric load forecasting model. Energy Convers. Manag. 2009, 50, 105–117. [Google Scholar] [CrossRef]
- Hu, R.; Wen, S.; Zeng, Z.; Huang, T. A short-term power load forecasting model based on the generalized regression neural network with decreasing step fruit fly optimization algorithm. Neurocomputing 2017, 221, 24–31. [Google Scholar] [CrossRef]
- Yu, S.; Wang, K.; Wei, Y.M. A hybrid self-adaptive Particle Swarm Optimization-Genetic Algorithm-Radial Basis Function model for annual electricity demand prediction. Energy Convers. Manag. 2015, 91, 176–185. [Google Scholar] [CrossRef]
- Gil-Vera, V.D. Forecasting Electricity Demand for Small Colombian Populations. Cuderno Act. 2015, 7, 111–119. [Google Scholar]
- Azadeh, A.; Ghaderi, S.F.; Sohrabkhani, S. A simulated-based neural network algorithm for forecasting electrical energy consumption in Iran. Energy Policy 2008, 36, 2637–2644. [Google Scholar] [CrossRef]
- Adrian, V.; Fernando, D.; Investigación, G.D.; Avanzadas, I. Short-Term Load Forecasting for Low Voltage Distribution Lines in Tucumán, Argentina; Consejo Nacional de Investigaciones Científicas y Técnicas: Buenos Aires, Argentina, 2017. [Google Scholar]
- Babich, L.; Svalov, D.; Smirnov, A.; Babich, M. Industrial Power Consumption Forecasting Methods Comparison. In Proceedings of the 2019 Ural Symposium on Biomedical Engineering, Radioelectronics and Information Technology (USBEREIT), Yekaterinburg, Russia, 25–26 April 2019; pp. 307–309. [Google Scholar] [CrossRef]
- Chaturvedi, D.K.; Sinha, A.P.; Malik, O.P. Short term load forecast using fuzzy logic and wavelet transform integrated generalized neural network. Int. J. Electr. Power Energy Syst. 2015, 67, 230–237. [Google Scholar] [CrossRef]
- Anand, A.; Suganthi, L. Forecasting of Electricity Demand by Hybrid ANN-PSO Models. Int. J. Energy Optim. Eng. 2017, 6, 66–83. [Google Scholar] [CrossRef] [Green Version]
- Bhanot, S. Long term load forecasting using K-mean clustering and ANN approach. Int. J. Adv. Res. Ideas Innov. Technol. 2018, 4, 2217–2222. [Google Scholar]
- Sulandari, W.; Subanar; Lee, M.H.; Rodrigues, P.C. Indonesian electricity load forecasting using singular spectrum analysis, fuzzy systems and neural networks. Energy 2020, 190, 116408. [Google Scholar] [CrossRef]
- Potapov, V.; Khamitov, R.; Makarov, V.; Gritsay, A.; Tyunkov, D.; Chervenchuk, I. Short-Term Forecast of Electricity Load for LLC Omsk Energy Retail Company Using Neural Network. In Proceedings of the 2018 Dynamics of Systems, Mechanisms and Machines (Dynamics), Omsk, Russia, 13–15 November 2018; pp. 1–5. [Google Scholar] [CrossRef]
- Mohamed Othman, M.S.; Johari, D.; Musirin, I.; Abdul Rahman, T.K.; Nik Ismail, N.F. Artificial neural network-based forecast for electricity consumption in Malaysia. In Proceedings of the 2010 IEEE International Conference on Power and Energy, Kuala Lumpur, Malaysia, 29 November–1 December 2010; pp. 24–28. [Google Scholar] [CrossRef]
- Dalvand, M.M.; Azami, S.B.Z.; Tarimoradi, H. Long-term load forecasting of iranian power grid using fuzzy and artificial neural networks. In Proceedings of the 2008 43rd International Universities Power Engineering Conference, Padova, Italy, 1–4 September 2008. [Google Scholar] [CrossRef]
- Yuill, W.; Kgokong, R.; Chowdhury, S.; Chowdhury, S.P. Application of adaptive neuro fuzzy inference system (ANFIS) based short term load forecasting in south african power networks. In Proceedings of the 45th International Universities Power Engineering Conference UPEC2010, Cardiff, Wales, UK, 31 August–3 September 2010; pp. 1–5. [Google Scholar]
- Kandananond, K. Forecasting electricity demand in Thailand with an artificial neural network approach. Energies 2011, 4, 1246–1257. [Google Scholar] [CrossRef]
- Mostafavi, E.S.; Mostafavi, S.I.; Jaafari, A.; Hosseinpour, F. A novel machine learning approach for estimation of electricity demand: An empirical evidence from Thailand. Energy Convers. Manag. 2013, 74, 548–555. [Google Scholar] [CrossRef]
- Günay, M.E. Forecasting annual gross electricity demand by artificial neural networks using predicted values of socio-economic indicators and climatic conditions: Case of Turkey. Energy Policy 2016, 90, 92–101. [Google Scholar] [CrossRef]
- Hamzaçebi, C.; Es, H.A.; Çakmak, R. Forecasting of Turkey’s monthly electricity demand by seasonal artificial neural network. Neural Comput. Appl. 2019, 31, 2217–2231. [Google Scholar] [CrossRef]
- Ivanov, V.V.; Kryanev, A.V.; Osetrov, E.S. Forecasting the daily electricity consumption in the Moscow region using artificial neural networks. Phys. Part. Nucl. Lett. 2017, 14, 647–657. [Google Scholar] [CrossRef]
- Khan, A.R.; Razzaq, S.; Alquthami, T.; Moghal, M.R.; Amin, A.; Mahmood, A. Day Ahead Load Forecasting for IESCO using Artificial Neural Network and Bagged Regression Tree. In Proceedings of the 2018 1st International Conference on Power, Energy and Smart Grid (ICPESG), Mirpur Azad Kashmir, Pakistan, 9–10 April 2018; pp. 1–6. [Google Scholar] [CrossRef]
- Kharal, A.Y.; Mahmood, A.; Ullah, K. Load forecasting of an educational institution using machine learning: The case of nust, islamabad. Pak. J. Sci. 2019, 71, 252–257. [Google Scholar]
- Taieb, S.B.; Huser, R.; Hyndman, R.J.; Genton, M.G. Probabilistic Time Series Forecasting with Boosted Additive Models: An Application to Smart Meter Data. Available online: https://robjhyndman.com/publications/kdd2015/ (accessed on 26 March 2020).
- Fan, S.; Hyndman, R.J. Short-term load forecasting based on a semi-parametric additive model. IEEE Trans. Power Syst. 2012, 27, 134–141. [Google Scholar] [CrossRef] [Green Version]
- Gaillard, P.; Goude, Y.; Nedellec, R. Additive models and robust aggregation for GEFCom2014 probabilistic electric load and electricity price forecasting. Int. J. Forecast. 2016, 32, 1038–1050. [Google Scholar] [CrossRef]
- Raña, P.; Vilar, J.; Aneiros, G. On the Use of Functional Additive Models for Electricity Demand and Price Prediction. IEEE Access 2018, 6, 9603–9613. [Google Scholar] [CrossRef]
- Shao, Z.; Yang, S.L.; Gao, F. Density prediction and dimensionality reduction of mid-term electricity demand in China: A new semiparametric-based additive model. Energy Convers. Manag. 2014, 87, 439–454. [Google Scholar] [CrossRef]
- Sigauke, C. Forecasting medium-term electricity demand in a South African electric power supply system. J. Energy S. Afr. 2017, 28, 54–67. [Google Scholar] [CrossRef]
- Bunnoon, P.; Chalermyanont, K.; Limsakul, C. Mid term load forecasting of the country using statistical methodology: Case study in thailand. In Proceedings of the 2009 International Conference on Signal Processing Systems, Singapore, 15–17 May 2009; pp. 924–928. [Google Scholar] [CrossRef]
- Hong, W.C. Electric load forecasting by seasonal recurrent SVR (support vector regression) with chaotic artificial bee colony algorithm. Energy 2011, 36, 5568–5578. [Google Scholar] [CrossRef]
- Velasco, L.C.P.; Villezas, C.R.; Palahang, P.N.C.; Dagaang, J.A.A. Next day electric load forecasting using Artificial Neural Networks. In Proceedings of the 2015 International Conference on Humanoid, Nanotechnology, Information Technology, Communication and Control, Environment and Management (HNICEM), Cebu City, Philippines, 9–12 December 2015; pp. 1–6. [Google Scholar] [CrossRef]
- Pao, H.T. Comparing linear and nonlinear forecasts for Taiwan’s electricity consumption. Energy 2006, 31, 2129–2141. [Google Scholar] [CrossRef]
- Kaur, A.; Nonnenmacher, L.; Coimbra, C.F.M. Net load forecasting for high renewable energy penetration grids. Energy 2016, 114, 1073–1084. [Google Scholar] [CrossRef]
- Renewable Electricity Output (% of Total Electricity Output)-Low & Middle Income. Available online: https://data.worldbank.org/indicator/EG.ELC.RNEW.ZS?locations=XO (accessed on 21 May 2020).
- Renewable, I.; Agency, E. Renewable Energy Statistics2019 Statistiques D’ Énergie Renouvelable 2019 Estadisticas Dd Energia; International Renewable Energy Agency: Masdar City, UAE, 2019; ISBN 9789292601379.


| Application | STLF | MTLF | LTLF |
|---|---|---|---|
| Energy purchasing | Yes | Yes | Yes |
| Transmission & distribution (T&D) planning | No | Yes | Yes |
| Operations | Yes | No | No |
| DSM | Yes | Yes | Yes |
| Financial planning | No | Yes | Yes |
| Forecast Horizon | Country of Study | Forecasting Methodologies | Demand Determinants Involved | Study Year | Forecast Period | Ref. No. |
|---|---|---|---|---|---|---|
| LTLF | Colombia | Long-range Energy Alternative Planning System (LEAP) | GDP, number of households, national vehicle fleet (vehicles per household) | 2018 | 2015–2030 & 2015–2050 | [42] |
| LTLF | China (Beijing) | Long-range Energy Alternative Planning System (LEAP) | Terminal energy needs, activity levels, energy intensity, departmental activity, terminal activity, energy equipment activity level, environmental emission, environmental emission factor | 2019 | 2017–2035 | [41] |
| LTLF | Turkey | Cointegration and ARIMA | Price, GDP per capita, consumption per capita | 2007 | 2005–2014 | [76] |
| LTLF | South Africa | ARMA, Neural networks and Neuro-fuzzy systems | Previous consumption data | 2014 | 1985–2011 | [67] |
| LTLF | Pakistan | Bottom up Approaches (LEAP Model) | Population, GDP, Electricity consumption per capita, GHG emissions | 2019 | 2015–2035 | [43] |
| LTLF | Pakistan | GDP, GDP growth, Population, Population growth, energy intensity growth rate | 2015 | 2011–2030 | [37] | |
| LTLF | Pakistan | income, income growth rate, population, and population growth rate, number of households, household size and GDP | 2018 | 2016–2040 | [46] | |
| LTLF | Pakistan | GDP growth trend, electricity consumers growth, fuel cost, Technology’s lifetime, Plant Capacity Factor | 2018 | 2015–2050 | [39] | |
| LTLF | Pakistan | Electric consumer growth, level of activities (number of consumers), final energy intensity (energy consumed per consumer), forecasted growth and other factors. | 2014 | 2011–2030 | [40] | |
| LTLF | Pakistan | Rate of urbanization, penetration of energy efficient devices, population growth control plan, economic growth, domestic consumption trends. Income growth. | 2012 | 2005–2030 | [44] | |
| LTLF | Pakistan | ARIMA (3,1,2), SARIMA (2, 1, 2), SMA (12), ARCH (2), GARCH (1,1) | Socioeconomic Factors, Seasonal Variations. | 2014 | 1990–2011 | [73] |
| LTLF | Pakistan | ARIMA, Holt-Winter, LEAP | Not Discussed | 2017 | 2015–2035 | [72] |
| LTLF | Pakistan | Functional Time series (FTS) | Seasonal variations, economic growth, urbanization, population growth, industrialization | 2015 | 2012–2021 | [95] |
| LTLF | Pakistan | Ordinary Least Square technique using MDEE Model & multiple linear regression Index Model | GDP, population, electricity price, previous year’s electricity demand, and the number of consumers | 2012 | 2007–2030 | [62] |
| LTLF | China | Trigonometric grey prediction approach | Not discussed | 2006 | 1981–2001 | [93] |
| LTLF | India | Grey-Markov, Grey | Not discussed | 2009 | 2005–2015 | [91] |
| LTLF | Turkey | structural time series analysis | Electricity prices | 2011 | 2010–2020 | [94] |
| LTLF | China | Econometric Model and System Dynamic Approach | Internet age, marketization reform, technological progress and consciousness of energy conservation and emission reduction. | 2017 | 2000–2050 | [52] |
| LTLF | Brazil | Spatial econometric approach using ARIMA model | Spatial Data, Past consumption, GDP, and population | 2017 | Not Provided | [51] |
| LTLF | Thailand | MLR/ANN | GDP, population | 2015 | 2010, 2015,2020 | [63] |
| LTLF | India | Regression Techniques | Net State Domestic Product (NSDP), Sector-wise Domestic Savings Household sector, Consumers, Connected Load | 2019 | 2006–2012 | [59] |
| LTLF | Philippines | Multiple Linear Regression | Historical data, number of consumers for past 5 years, development plans (commercial, industrial etc.) for next 10 years | 2017 | 2016–2025 | [57] |
| LTLF | China | Hybrid self-adaptive Particle Swarm Optimization–Genetic Algorithm–Radial Basis Function | GDP, population, industrial energy intensity, average annual temperature | 2014 | 2013–2020 | [100] |
| LTLF | India | K-mean clustering and ANN | Load data and population | 2018 | 2018–2026 | [107] |
| LTLF | India | ANN-PSO Models | Population, consumers, per capita income/GDP | 2017 | 2001–2015 | [106] |
| LTLF | Thailand | Genetic Programming and Simulated Annealing (GSA) Model | Population, gross domestic product (GDP), stock index, and total revenue from exporting industrial products | 2013 | 2004–2009 | [114] |
| LTLF | Thailand | ANN, ARIMA, MLR | Population, stock exchange index, GDP and amount of export | 2011 | 1986–2010 | [113] |
| LTLF | Turkey | ANN | Population, GDP per capita, inflation percentage, unemployment percentage, average temperature | 2015 | 2014–2028 | [115] |
| LTLF | Pakistan | STAR (Smooth Transition Auto-Regressive) Model | GDP per capita, Electricity Prices | 2014 | 1971–2012 | [64] |
| LTLF | Brazil | Bottom-Up Approach | Previous load data (1995–2015), electric consumption by process, value added of different sectors, electricity price, production and value addition forecasts until 2050 | 2017 | 2015–2050 | [33] |
| LTLF | Pakistan | Winter Holt and ARIMA | Consumption Sectors: Household, Govt. Sector, Street Lights, Commercial, Industrial, Agriculture. | 2015 | 2012–2020 | [74] |
| LTLF | Pakistan | Univariate Time Series Model, Multiple Linear Regression based Econometric Model | GDP, Income per capita and Population | 2011 | 2011–2025 | [49] |
| LTLF | Pakistan | ARIMA | Hydroelectricity consumption data, GDP, population growth rates | 2020 | 2018–2030 | [75] |
| LTLF | Russian Federation | Regression Analysis AND Econometric Models | Elasticity of GDP, electricity intensity, GDP growth rate, income growth rate, electricity prices | 2009 | N/A | [48] |
| LTLF | Venezuela | Econometric Model | GDP, Electricity price, number of consumers, aluminum and iron price, population. | 2006 | 2004–2024 | [50] |
| LTLF | Mexico | Multiple Linear Regression | Number of establishments, number of employees, number of shipments, electricity prices, natural gas prices | 2004 | 2002–2010 | [58] |
| LTLF | Islamic Republic of Iran | ANN and FL | GDP, GDP without accounting for oil, (GNP), Iranian oil price, value added of manufacturing and mining group, oil income, population consumer price index, gas consumption, electricity, water and gas supply, exchange rate, gold price | 2008 | 2008–2011 | [111] |
| MTLF | China | Residual Modification of SARIMA | GDP, generation | 2012 | Apr2010–Sept 2010, 2011–2013 | [78] |
| MTLF | India | MSARIMA | Previous loads | 2012 | April 2010–March 2011 | [84] |
| MTLF | Malaysia | Holt-Winters Taylor (HWT), Holt-Winters, modified Holt-Winters exponential smoothing | Previous load data, seasonal patterns | 2013 | 2005–2006 | [90] |
| MTLF | Thailand | MLR/ARIMA | Seasonal weather, national economic growth, monthly peak load | 2006 | 2006–2007 | [126] |
| MTLF | Turkey | Seasonal ANN | Load data and weather | 2017 | Monthly forecasts between 2015 to 2018 | [116] |
| MTLF | China | SVR (support vector regression) with chaotic artificial bee colony algorithm | Past Load Data | 2011 | Monthly forecasts from Oct 2008 to April 2009 | [127] |
| MTLF | South Africa | Generalized Additive Model | Temperature and load data | 2017 | Monthly predictions | [125] |
| MTLF | China | Semiparametric-based additive model | Meteorological and economic variables | 2014 | Monthly predictions between 2006–2011 | [124] |
| MTLF | Russian Federation | ANN (Caterpillar-SSA Method) | Load data, calendar effects (days, week, month, years) | 2017 | - | [117] |
| MTLF | Venezuela | Singular Spectrum Analysis of Time Series Data | Load data | 2013 | - | [92] |
| STLF | Islamic Republic of Iran | ARIMA | Load data, temperature data | 2001 | [79] | |
| STLF | Pakistan | ANN & Bagged Regression Tree | Weather, time factor, past load data | 2018 | [118] | |
| STLF | South Africa | SARIMA, SARIMA-GARCH, Reg-SARIMA-GARCH | Previous consumption data, Seasonality, Day of the week, month, year | 2011 | [77] | |
| STLF | South Africa | Regression-SARIMA | Previous consumption data | 2012 | [60] | |
| STLF | China | Hybrid of ARIMA and SVMs | Previous loads, day of the week, weather | 2012 | [81] | |
| STLF | China | ARIMA-ANN | Previous loads | 2004 | [82] | |
| STLF | Malaysia | Double SARIMA | Previous load data | 2010 | [83] | |
| STLF | Malaysia | Holt-Winters Taylor (HWT), Holt-Winters, modified Holt-Winters exponential smoothing | Previous load data, seasonal patterns | 2013 | [90] | |
| STLF | Indonesia | Multiple Linear Regression | Historical data, temperature data | 2007 | Forecast periods for STLF are diverse and reveal no significant information. Therefore, these time periods are not provided. | [56] |
| STLF | China | Decreasing step fruit fly optimization algorithm | Historical data, weather/temperature data | 2017 | [99] | |
| STLF | Colombia | ANN | Historical load data | 2015 | [101] | |
| STLF | India | FL and WNN | Past load data | 2014 | [105] | |
| STLF | Indonesia | Singular spectrum analysis, fuzzy systems and neural networks | Load data | 2019 | [108] | |
| STLF | Malaysia | ANN | Load data | 2010 | [110] | |
| STLF | Philippine | Fast ANN | Load data, day timings (day of week, week of month) | 2015 | [128] | |
| STLF | South Africa | Adaptive Neuro Fuzzy Inference System—ANFIS | Temperature, humidity, load data | 2010 | [112] | |
| STLF | Pakistan | XGBoost Algorithm using NN | Load data, weather data | 2019 | [119] | |
| STLF | Argentina | Radial Basis Function Neural Network, and Feed-forward Neural Network, Multi-Linear Regression | Load data, weather data (temperature etc.), days of the week/month | 2017 | [103] | |
| STLF | Russian Federation | Long short-term memory ANN, SVM regression based on radial basis functions (RBF) SVM Regression linear and ARIMA. | Load Data | 2019 | [104] | |
| STLF | Russian Federation | ANN | Load Data, calendar effects, temperature, wind speed | 2018 | [109] | |
| STLF | Islamic Republic of Iran | ANN | Load data | 2008 | [102] | |
| STLF | Islamic Republic of Iran | Singular Spectrum Analysis of Time Series Data | Load data | 2011 | [96] |
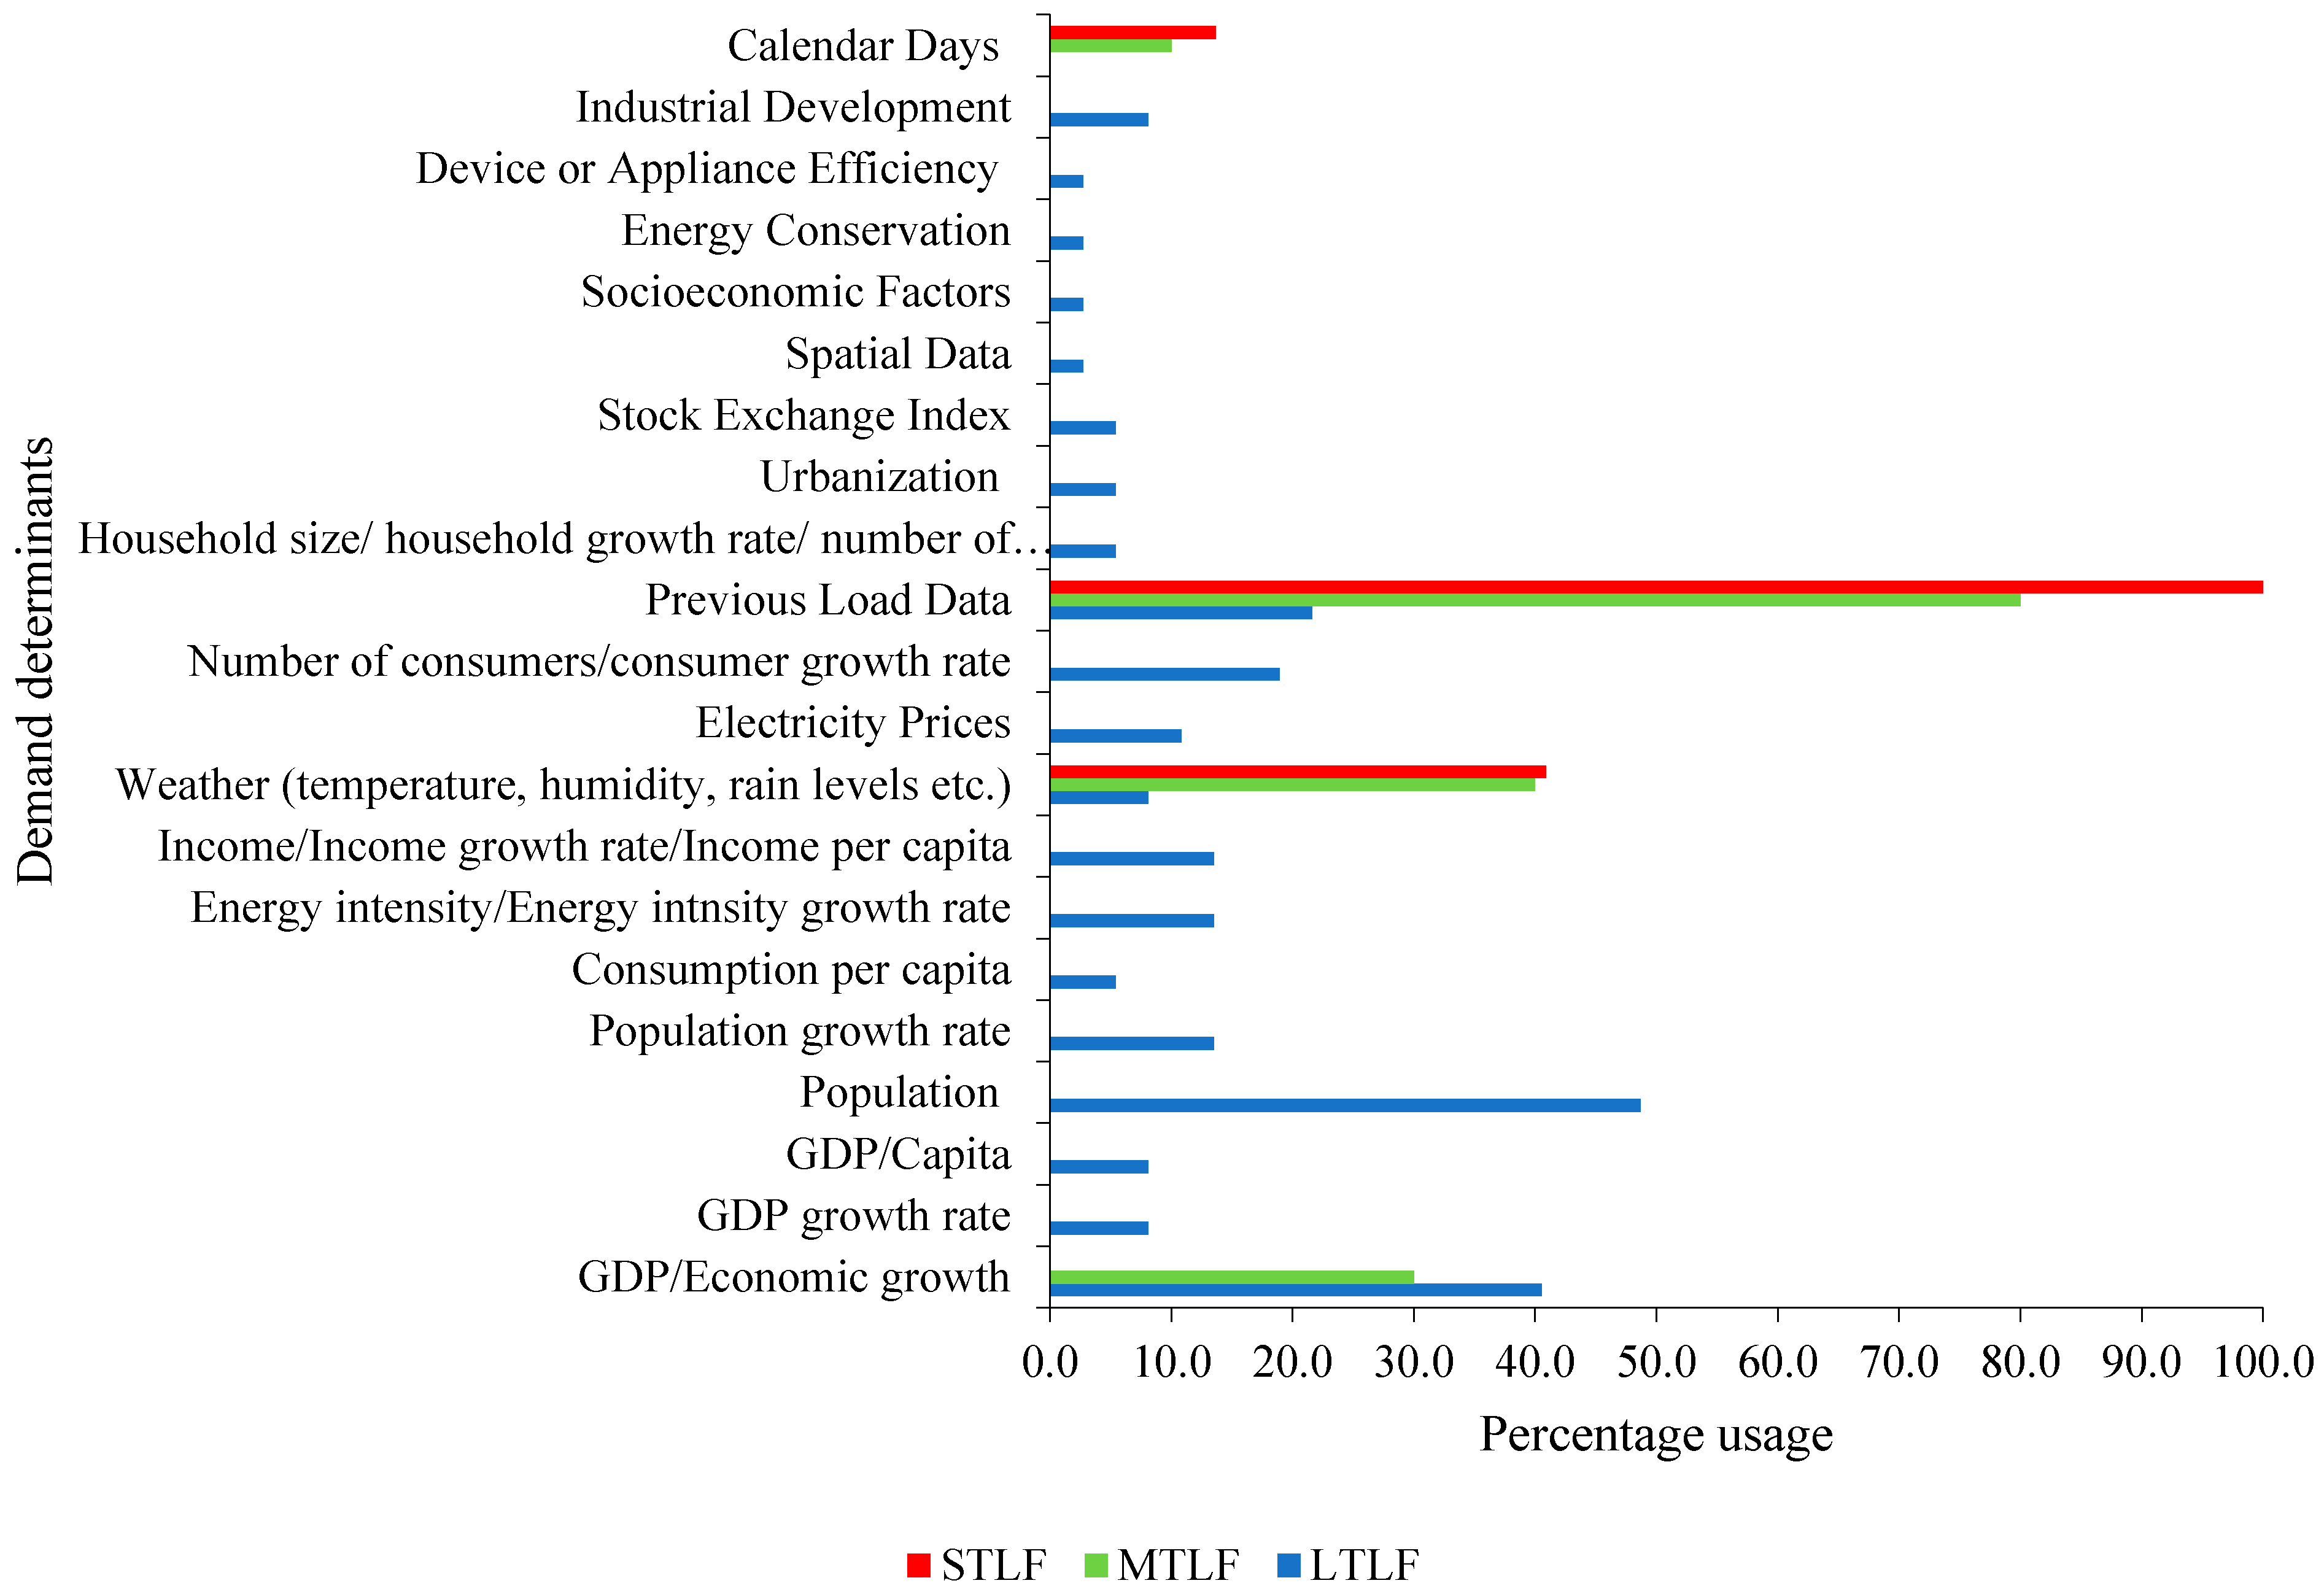
| Electricity Demand Determinants | Frequency of Occurrence | %Age Usage Over Total Studies Reviewed |
|---|---|---|
| GDP/Economic growth | 20 | 29.0 |
| GDP growth rate | 3 | 4.3 |
| GDP/capita | 3 | 4.3 |
| Population | 15 | 21.7 |
| Population growth rate | 5 | 7.2 |
| Consumption per capita/Energy intensity | 4 | 5.8 |
| Energy intensity/Energy intensity growth rate | 6 | 8.7 |
| Income/Income growth rate/Income per capita | 6 | 8.7 |
| Weather (temperature, humidity, rain levels etc.) | 21 | 30.4 |
| Electricity prices | 8 | 11.6 |
| Number of consumers/consumer growth rate | 7 | 10.1 |
| Previous load data | 37 | 53.6 |
| Household size/household growth rate/number of households | 2 | 2.9 |
| Urbanization | 2 | 2.9 |
| Stock exchange index | 2 | 2.9 |
| Spatial data | 1 | 1.4 |
| Socioeconomic factors | 1 | 1.4 |
| Energy conservation | 1 | 1.4 |
| Device or appliance efficiency | 1 | 1.4 |
| Industrial development | 5 | 7.2 |
| Calendar Effects | 4 | 5.7 |
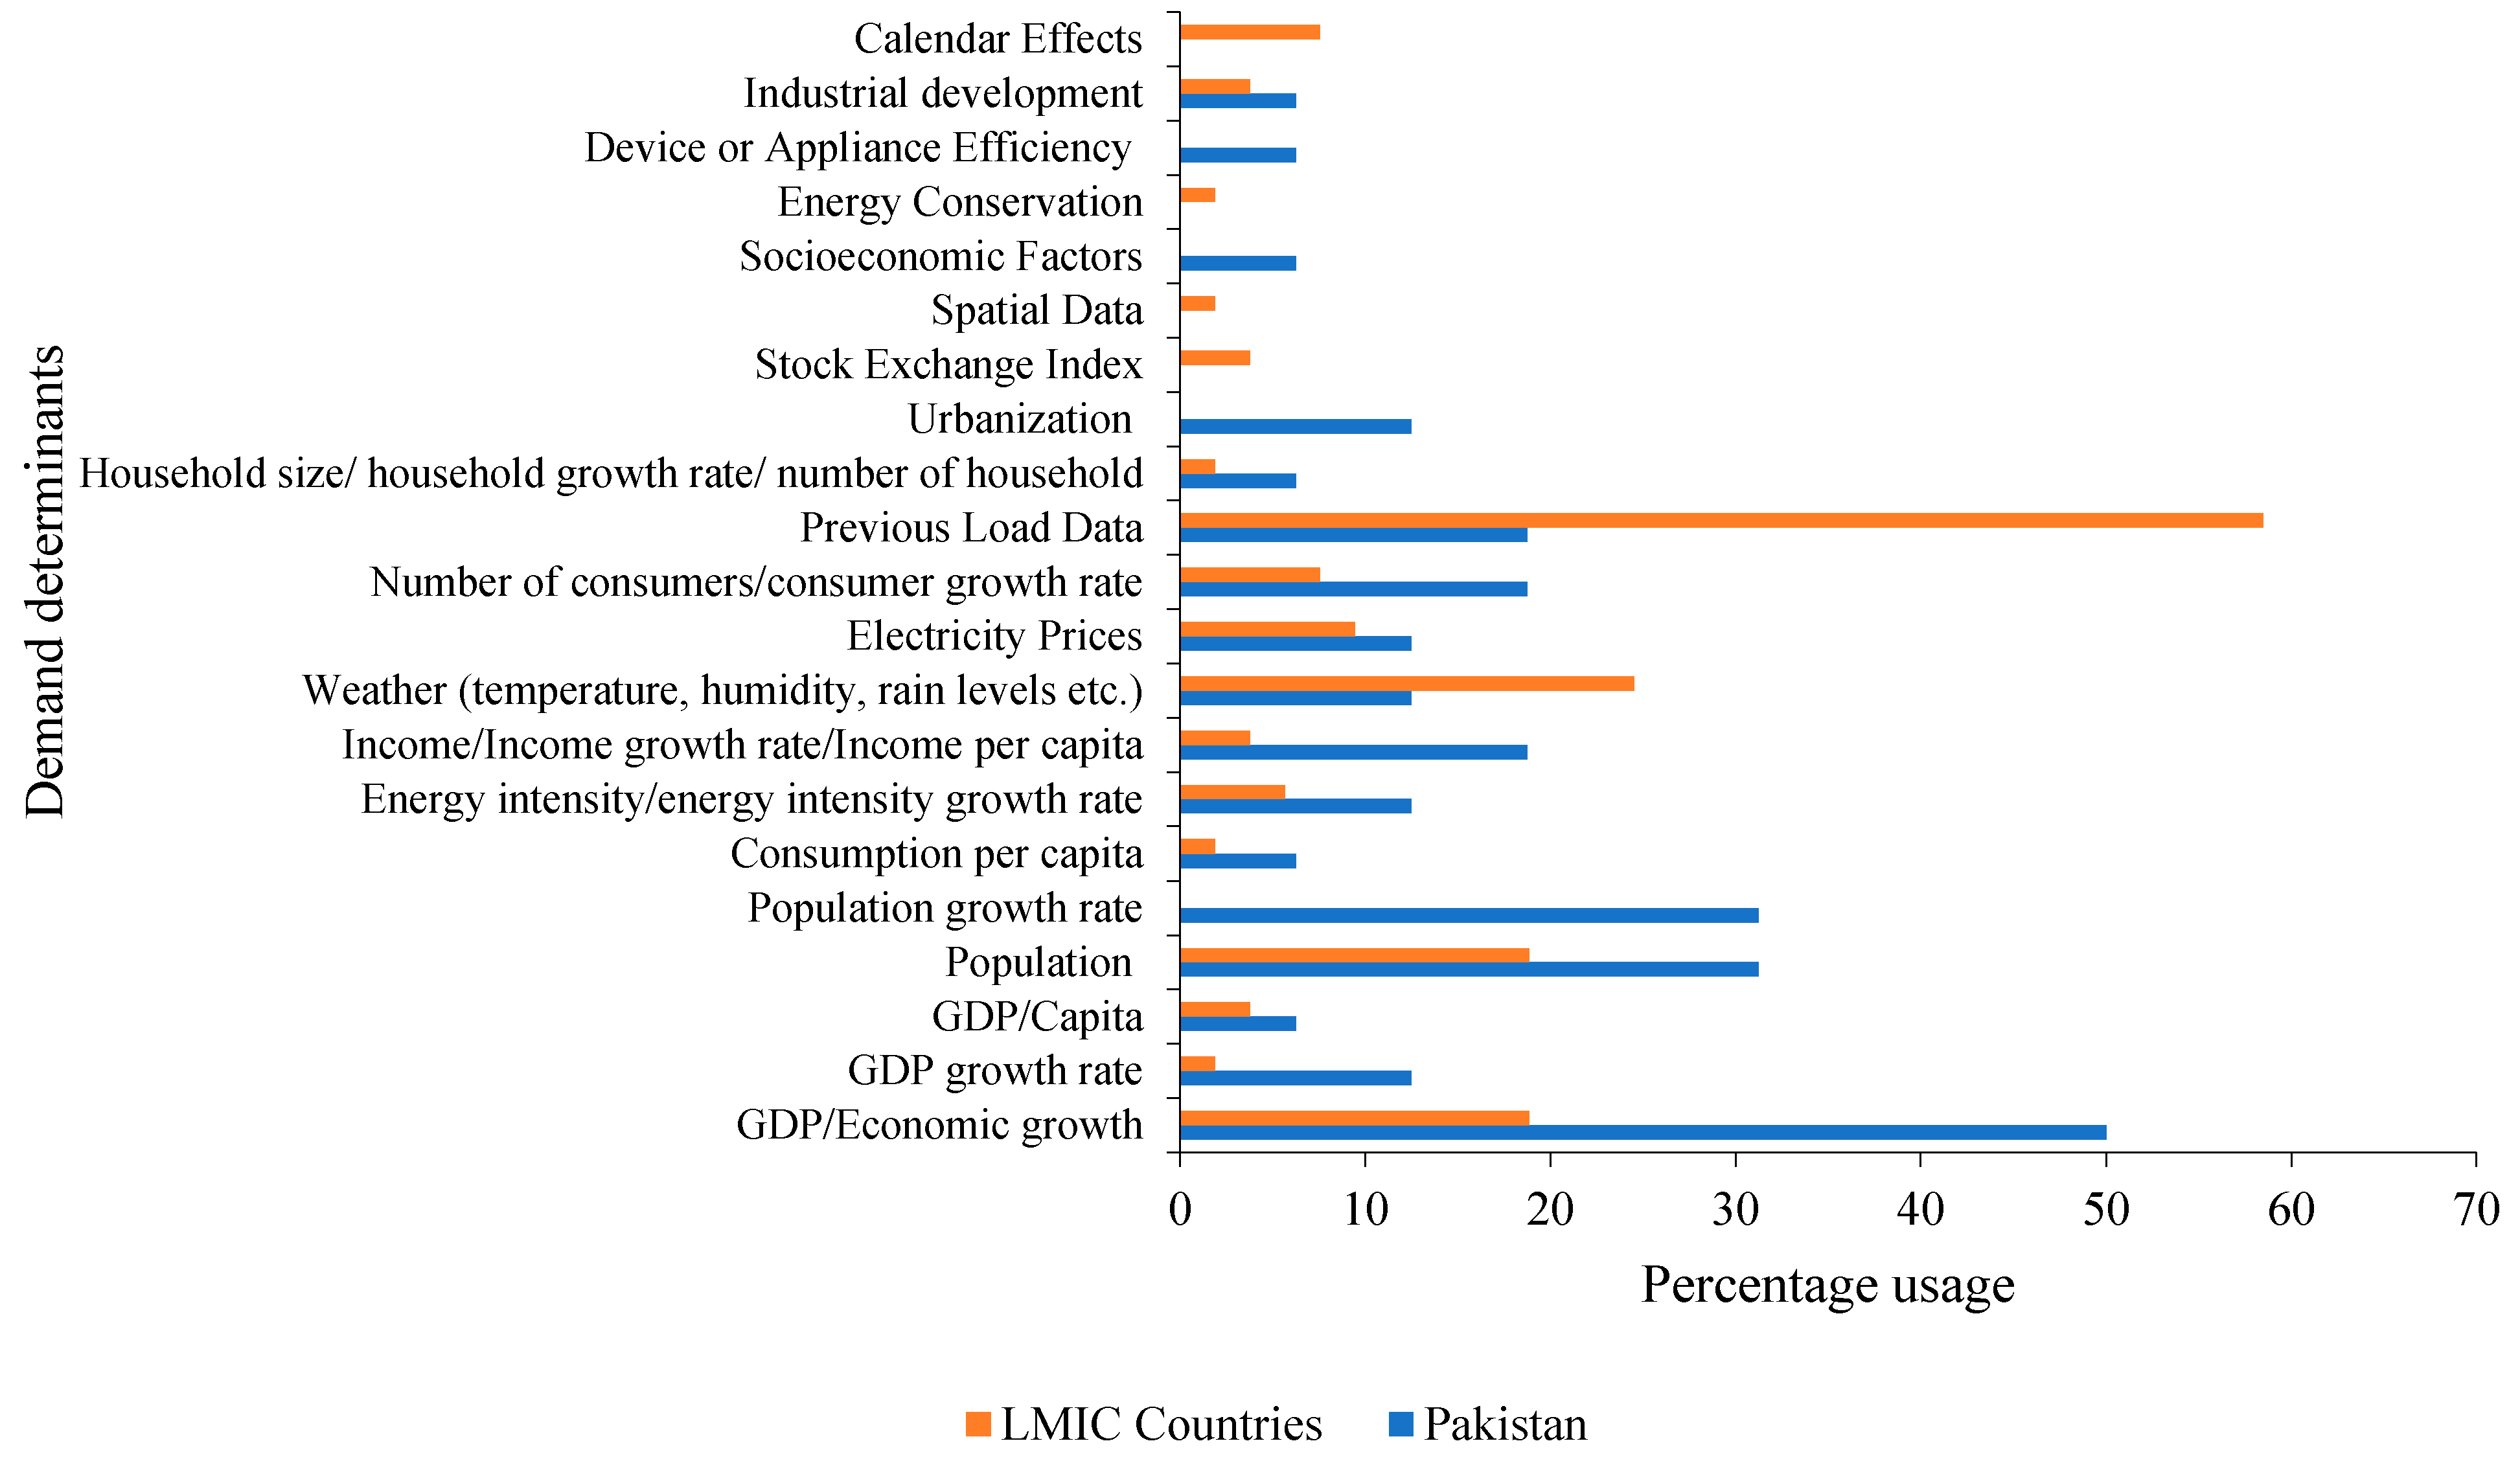
| Country Name | Variables Most Frequently Used in Forecast Models |
|---|---|
| China | Terminal energy needs, energy intensity, environmental emission factors, technological progress, energy conservation, GDP, population, weather variables, generation, load data, calendar effects, |
| India | Net State Domestic Product, sector-wise domestic savings, consumers, connected load, load data, population, consumers, per capita income/GDP |
| Pakistan | Population, GDP, per capita consumption, GHG emissions, energy intensity growth rate, income related variables, household variables, electricity consumers growth, fuel cost, technology’s lifetime, plant capacity factor, urbanization rate, energy efficiency, population growth control plan, electricity price, hydroelectricity consumption data, weather variables |
| Islamic Republic of Iran | GDP, Iranian oil price, value added of manufacturing and mining group, oil income, population consumer price index, gas consumption, electricity, water and gas supply, exchange rate, gold price, load data, weather data |
| Russian Federation | Elasticity of GDP, electricity intensity, GDP growth rate, income variables, electricity prices, load data, calendar effects, weather variables. |
| Colombia | GDP, household variables, national vehicle fleet, load data |
| Turkey | Electricity price, GDP per capita, electricity consumption per capita, load data, weather variables, population, inflation percentage, unemployment percentage, weather variables. |
| South Africa | Load data, weather variables, calendar effects |
| Argentina | Load data, weather variables, calendar effects |
| Philippine | Load data, calendar effects, number of consumers, development plans. |
| Thailand | Population, GDP, stock index, total revenue from exporting industrial products, stock exchange index, weather variables, load data |
| Venezuela | Load data |
| Malaysia | Load data, calendar effects |
| Indonesia | Load data, weather variables |
| Mexico | Number of establishments, number of employees, number of shipments, electricity prices, natural gas prices |
| Brazil | Load data, electric consumption by process, value added of different sectors, electricity price, production and value addition forecasts, spatial data, GDP, and population |
© 2020 by the authors. Licensee MDPI, Basel, Switzerland. This article is an open access article distributed under the terms and conditions of the Creative Commons Attribution (CC BY) license (http://creativecommons.org/licenses/by/4.0/).
Share and Cite
Mir, A.A.; Alghassab, M.; Ullah, K.; Khan, Z.A.; Lu, Y.; Imran, M. A Review of Electricity Demand Forecasting in Low and Middle Income Countries: The Demand Determinants and Horizons. Sustainability 2020, 12, 5931. https://doi.org/10.3390/su12155931
Mir AA, Alghassab M, Ullah K, Khan ZA, Lu Y, Imran M. A Review of Electricity Demand Forecasting in Low and Middle Income Countries: The Demand Determinants and Horizons. Sustainability. 2020; 12(15):5931. https://doi.org/10.3390/su12155931
Chicago/Turabian StyleMir, Aneeque A., Mohammed Alghassab, Kafait Ullah, Zafar A. Khan, Yuehong Lu, and Muhammad Imran. 2020. "A Review of Electricity Demand Forecasting in Low and Middle Income Countries: The Demand Determinants and Horizons" Sustainability 12, no. 15: 5931. https://doi.org/10.3390/su12155931