Youth Labor Market Integration in European Regions


1
Department of Sociology, University of Vienna, 1090 Vienna, Austria
2
Department of Sociology & GEPS, Universitat Autònoma de Barcelona, 08193 Cerdanyola del Vallès, Spain
*
Author to whom correspondence should be addressed.
Sustainability 2020, 12(9), 3813; https://doi.org/10.3390/su12093813
Submission received: 14 February 2020
/
Revised: 4 May 2020
/
Accepted: 5 May 2020
/
Published: 7 May 2020
(This article belongs to the Special Issue Trends in Emerging Markets, Globalization, Economic Development, Entrepreneurship and Management Strategies as a Result of Cross-Border Cooperation)
Abstract
:Countries’ institutional configurations and structural characteristics play an important role in shaping transitions from school to work. Recent empirical evidence shows significant regional and territorial differences in youth unemployment and labor market participation. Along this research strand, we argue in favor of a place-sensitive approach to youth labor market integration in order to address the regional disparities of young people’s opportunities. In order to investigate the synergic effect of different contextual configurations, we construct a composite measure, namely, the youth labor market integration (YLMI) index. This considers a wide range of indicators of the access, exclusion, and duration of the transition into employment at the regional level. The YLMI index allows cross-regional and longitudinal comparisons of the European Union (EU) local labor markets and youth employment opportunities.
1. Introduction
The integration of young people in the labor market has become a severe societal problem in many European countries, particularly for its long-term impact on life chances. Moreover, the overall rise in youth unemployment represents a challenge to the European Union (EU), which has launched several youth-specific policy initiatives in the last decade. The integration of young people into the labor market represents a core mission of European policy and of the European Social Fund (ESF). Recent policy initiatives, such as the Juncker Plan, the Youth Guarantee, the European Alliance for Apprenticeship, or the Smart Specialization, mirror both the growing concern and the efforts to improve skills, participation, and mobility among youths, as well as firms’ investments and training capacities.
Countries’ institutional configurations and structural characteristics matter considerably in mediating the impact of the economic cycle on youths, generating specific outcomes in terms of labor market integration [1]. However, recent empirical evidence shows significant regional and territorial differences in youth unemployment patterns [2,3], school-to-work transition outcomes, and young adults’ living conditions [4,5]. Due to the ongoing trends of rescaling in territorial governance [6] and to the persistence of spatial disparities [7,8], the internal homogeneity of transition systems at the country level cannot be taken for granted [9]. As a consequence, on the policy side, Europe-wide place-neutral or general-purpose interventions may be ineffective in addressing problems of spatially uneven youth labor market opportunities.
This article analyzes youth integration by producing a composite measure that allows for investigating territorial and long-term variations in the patterns of young people’s participation in the labor market across all European regions. To do this, we compute an indicator for measuring regional youth labor market integration (YLMI) in the EU. The YLMI index combines several indicators of the outcomes of school-to-work transitions, focusing on exclusion (i.e., NEET rates (Not in Employment, Education, or Training) and unemployment ratios), access (i.e., employment rates according to educational attainment), and duration of the transition into employment (i.e., employment rates three years after educational completion) for 281 NUTS-2 (Nomenclature of Territorial Units for Statistics) European regions during the period 2004–2018. As a result, it provides a measure of contextual regional fragilities or strengths of youth labor market integration. This is important, especially from the perspective of territorial governance. Indeed, the literature increasingly shows the relevance of both national and local contexts for the design and implementation of social policies [10,11].
In analytical terms, the added value of our contribution lies in the combination of a long-term, regional, EU-wide perspective, using a multistep methodology to provide a multidimensional measure of regional differences in youth labor market integration. The descriptive nature of this paper is theoretically driven, i.e., it wants to contribute to the literature on youth studies by providing evidence of the relevance of the territorial dimension in structuring the life chances and opportunity structures of young people [12]. In terms of policy implications, the YLMI index helps to identify benchmark regions and set policy priorities for interventions aimed at increasing cohesion and youth employment across European territories. The conditions of youths represent a key issue for European territorial cohesion and for the overall future of Europe as a sustainable polity. Therefore, the YLMI index represents a valuable tool for territorial governance, as it allows to comparatively address the issue of territorial disparities related to young people’s opportunities. Analysis of the indicators provides a comparative view of both the youth integration into the labor market at a regional level and the evolution of this integration over a time span of 14 years, which represents a critical period that encompasses the impact and the aftermath of the Great Recession.
Our results challenge the concept of Europe as a converging machine by showing the persisting paths of differentiation across regions, as well as evidence of untapped potential due to the lack of opportunities. Patterns of territorial disparities, driven by combinations of socioeconomic and geographical factors, have been spotted as reasons behind the rise in populism and anti-EU voting [12]. The rise of populism and anti-Europeanism has been described as a geography of discontent related to poor education and employment opportunities in places and regions lagging behind [13], mainly identified by middle-aged and older individuals [14,15,16]. Our analysis reveals persistent untapped regional potential expressed by the lack of youth labor market integration. In this light, the YLMI index provides valuable information for raising the awareness of policy-makers, showing the characteristics of the job market opportunities of young people, as a core group for the future of Europe. In lagging regions, the lack of employment opportunities and integration of youths trapped in “places that do not matter” could be fueling discontent, seriously undermining EU cohesion and sustainability as a polity [13].
In Section 2, we elaborate on youth labor market dynamics and on the need of place-sensitive evidence on the topic. In Section 3, we construct a composite measure of YLMI. In Section 4, we provide comparative and longitudinal evidence by analyzing the level and change of YLMI across European regions across a fourteen-year period (2005–2018). The final section, Section 5, summarizes the main results and disentangles their analytical consequences for further research.
2. Literature Review: The Need of Place-Sensitive Evidence on Youth Labor Market Integration
In contemporary societies, young people have been facing strong uncertainties in the transition into adulthood and thus to labor market entry. This is due to the intersection of multiple risk factors, including economic and demographic conditions, as well as to the institutional configuration of the education system, of the labor market, and of the welfare state. The result is a prolonged transition into adulthood [17,18], often characterized by the difficult transition from education to work, the uncertain access to material resources, and the fragility of family and social networks [19,20]. For these reasons, young people have been labeled as the “losers” of globalization processes [21]. As for labor market integration, even if they have higher educational attainment compared to previous cohorts, young people face increasing difficulties when entering the labor market. This double-skill bias [22]—or youth experience gap [23]—represents a common characteristic of postindustrial societies.
Youth disadvantage in the labor market has been widely addressed by research on school-to-work transitions [24,25]. Young people are often considered a group of outsiders [26], characterized by disadvantaged conditions and fewer opportunities when compared to insiders such as middle-aged males with full-time permanent jobs. They are usually exposed to higher risks of unemployment and precarization [27], with above-average turnover rates between jobs [28] and prolonged scarring effects on future life chances [29]. Looking at transitions in and out of employment, youths are the first-out and last-in group, and these dynamics are even more acute during economic downturns, such as the Great Recession.
At the microlevel, the outcomes of the school-to-work transition can be related, among others, to occupational status, education–job mismatch, wage and wage growth, security of employment, job and career mobility, participation in training, and job satisfaction [3,30,31]. Particularly, educational qualifications are positively associated with labor market outcomes. Higher-educated young people experience faster and smoother transitions [30]; conversely, low-educated adults without an upper-secondary degree bear a particularly high risk of labor market marginalization (e.g., [32,33]). However, the extent of their advantages and disadvantages varies considerably across countries [34,35].
The entry in the labor market is dependent upon individual decisions, but it is also shaped by the opportunities and constraints produced by economic conditions and the socioinstitutional context [36]. Besides the degree of qualification and other microlevel characteristics, cross-country differences in youth labor market integration have been linked to varying institutional arrangements, as well as to cyclical and structural factors shaping the transitions from education to work [37,38,39]. Scholars have examined the impact of various characteristics of the institutional configuration of education systems on transition outcomes, such as the degree of standardization and stratification [34,38], the centralization of the governance structure [40], and the vocational orientation [41]. Other contributions have analyzed the effect of the institutional and structural determinants of youth transition outcomes, looking at characteristics of the economic system and the labor market [1,42]. Despite common trends, it is therefore well recognized that institutional arrangements and socioeconomic features contribute to producing differences in the labor market integration of young entrants [43]. Accordingly, several authors have compared groups of countries with similar institutional arrangements that shape the passage from education to work, identifying different typologies of school-to-work transition systems or regimes, or skill formation systems [20,23,44]. These differences become evident also in the analyses of the impact of the crisis, which varies across countries as a reflection of country-specific institutional and structural features [28].
Comparative research on school-to-work transitions mostly assumes nation states as homogeneous objects of comparison. However, recent evidence also emphasizes intranational variations as an under-researched issue in the research on education–work transitions [5,9]. Due to ongoing trends of (1) rescaling in territorial governance and (2) persistence of spatial disparities, the internal homogeneity of transition systems at the country level cannot be taken for granted [4].
The first trend refers to the processes that kicked off a territorial reorganization of social policies. These rescaling dynamics changed the role of the central state and, at the same time, attributed greater relevance to subnational scales of governance [6]. Literature on multilevel governance and local service provision shows that local welfare systems gained relevance, within national frameworks, during the transformative processes that impacted industrialized countries from the 1970s onwards [45]. As a consequence, the territorial articulation of responsibilities for training and labor market policies may bring about regional differences in policy provisions and outcomes. This is particularly noticeable in federal states, as shown, for instance, by the territorial differentiation of the NEET population in Austria [46]. However, unitary states also present various degrees of jurisdictional decentralization in certain policy fields that may affect performance and provision.
The second trend refers to the persisting regional and territorial disparities in living conditions across Europe [7], marking the sharp polarization of economic growth and employment opportunities among EU regions in the last decade [8,47]. Research has shown the growing divide between privileged productive regions, normally located in the metropolitan areas of Continental and Northern Europe, and disadvantaged ones, characterized by low levels of resource efficiency and innovative capacity [13,48]. These disparities interact with the abovementioned processes of territorial reorganization of governance and social policies, deeply affecting citizens’ opportunities and social inequalities. The literature on regional economy, territorial cohesion, and governance also emphasizes how spatial disparities and regional contextual conditions have a crucial impact on shaping life chances [49]. The regional level also has a significant relevance from a policy point of view, as the EU cohesion objectives and the structural funds increasingly target European regions. The increasing inequality in socioeconomic performances represents a threat to social and political cohesion for the European Union. In this light, Atkinson et al. [50], Ranci [51], and Scandurra et al. [5] stress the importance of regional and place-based indicators in comparative research.
Several territorialized analyses have addressed regional differentiation in employment and unemployment dynamics [52,53]. Notwithstanding, comparative regional or subregional investigations on youth labor market integration have been limited. In regional economy analysis, the two subjects of regional and youth labor markets have often been considered as separate, due to limited data availability [54]. Limitations in the collection and representativeness of regional data persist, restricting the range of harmonized and comparable information at a regional level [55]. Empirical evidence addressing this gap shows significant differences across regions, confirming the relevance of investigating the subnational variations of youth labor markets [4]. These contributions consider specific aspects of school-to-work transitions, focusing mainly on measures of exclusion from the labor market, i.e., youth unemployment and NEET rates [56,57,58].
In what follows, we present a new measure of YLMI using a seminal methodology on composite indicators (CIs). Further, we investigate the evolution of youth labor market integration at a regional level in the EU, before and after the economic crisis, as well as the existence of trends of homogenization or differentiation across EU territories. Along with several contributions on school-to-work transitions [1,28,59], we consider youth integration in the labor market as the outcome of a complex mix of socioeconomic conditions and institutional factors that characterize a certain context. Future research should also focus on the nexus between the mix of socioeconomic structures and institutions, as well as the resulting outcomes in terms of youth opportunities and integration into the labor market.
By looking comparatively at the regional integration of youths into the labor market, we advance upon previous research in three ways. First, from a methodological and analytical standpoint, we combine regional, EU-wide comparative and longitudinal perspectives. We do this by using a multistep methodology to provide a multidimensional measure of regional differences in youth labor market integration. In addition to indicators of labor market exclusion, we also consider the indicators of access and duration of transitions, according to the level of educational attainment [33,60]. By doing this, the index does not limit its focus to a specific subgroup of the youth population [61]; instead, it rather considers the characteristics of the regional context where transitions to the labor market take place. Second, the descriptive nature of the paper is theoretically driven, as it contributes to the literature on youth studies by providing evidence of the relevance of the territorial dimension in structuring life chances and youth opportunities. Third, from the perspective of territorial governance and cohesion policies, we contribute to the interaction between local and general knowledge that is considered paramount in the design and delivery of place- and context-sensitive public policies for regional development [49,62,63]. The construction of an up-to-date and territorial-sensitive indicator provides meaningful contextualized evidence for policy-makers engaging with youth employment and integration.
3. Data and Methodology
The scope of the analysis delves beyond national performance evaluation to account for regional variation in YLMI. We constructed a macropanel dataset based on EUROSTAT online publicly available data, which collects information at regional and local levels for a range of labor market and socioeconomic indicators. The indicators used for constructing YLMI were retrieved from the European Union Labour Force Survey (EU-LFS), which informs about labor market dynamics in the EU. The period considered in our analysis ranges from 2005 to 2018. This encompasses 14 years, during which European labor markets underwent radical changes. The data for this study include indicators on youth labor market integration for 281 NUTS-2 regions. We considered the regions that belong to the EU-27 countries, with the addition of Norway and Switzerland.
YLMI is an aggregate indicator at the regional level that can be thought of as a combination of three underlying factors or dimensions: (i) Access to employment (i.e., youth employment rate, also accounting for differences in educational qualifications of young workers); (ii) time-to-job (i.e., duration of transition by job access); (iii) and exclusion from the labor market (i.e., NEET and unemployment rates). The index was constructed using the six observed subindicators shown in Table 1: the share of the employed population aged 20–34 that have attained ISCED 3–4 and ISCED 5–8 (International Standard Classification of Education); the share of the employed population aged 20–34 at three years after having attained, respectively, ISCED 3–4 and ISCED 5–8; the share of NEET aged 18–24; and the unemployment ratio of people aged 15–24.
The first dimension of indicators (i.e., access) refers to the match between educational qualifications and employment: By considering the highest level of education attained, we distinguished a highly qualified and tertiary-educated group (ISCED 5–8) and a medium-qualified, upper-secondary-educated group (ISCED 3–4).
The second dimension (i.e., time-to-job) represents the time needed between leaving education and gaining employment. We used the employment rate three years after educational completion for the tertiary- and upper-secondary-educated groups: this is the rate of people who, three years after the achievement of their educational qualification, gained employment. Indicators of employment according to ISCED 0–2, 3–4, and 5–8 basically account for 100% of the youth employed population. Therefore, including qualification levels ISCED 3–4 and 5–8 in the index aggregation, we were able to indirectly account also for the low-educated youth, which are usually most exposed to labor integration difficulties [35,64].
As for the third dimension (i.e., exclusion), the NEET rate is an indicator of inactivity and “joblessness” [33,59], grouping together young people that are not employed nor in formal education or training. This allows to focus on a larger group than just those unemployed, composed of young people experiencing different degrees of labor market exclusion. The rate is calculated on the total youth population and not on the youth labor force. This is an advantage, as the calculation discounts for differences in education systems that have a major impact on the employment of young people. A shortcoming of the NEET indicator is that it still groups heterogeneous categories [65] such as unemployed, disabled, monoparental mothers, etc. [66]. Therefore, we included in our analysis the youth unemployment ratio as an additional indicator of exclusion from the labor market. We used the unemployment ratio instead of the rate, because the latter does not represent a good comparative proxy due to the cross-national differences in educational programs (i.e., vocational training) and in the extent of compulsory schooling [67,68]. The ratio represents the share of unemployed youths aged 15–24 as a percentage of the total population of the same age.
As a general trend, the transition into adulthood is extending in contemporary societies [17]. Nevertheless, EU countries show considerable differences in transition duration and labor market access due to a range of factors, including the configuration of education systems, and labor market and family arrangements [69]. Therefore, the selected variables on employment cover a wide age range (20–34), starting at 20 to limit the impact of strong variations in education and Vocational Education and Training (VET) systems [4]. At the same time, exclusion-related variables, including a younger age range (i.e., 15–24 and 18–24), allow to account for outcomes of exclusion dynamics also before the age of theoretical completion of upper-secondary and tertiary educational paths. This grants the YLMI index to cover different aspects of youth integration as regional contextual characteristics.
Youth integration in the labor market is recognized as a complex process, entailing more dimensions, such as employment dynamics, education, and duration of transition, that go far beyond the limited picture provided by measures of exclusion such as unemployment or NEET rates [70]. Accordingly, the YLMI index encompasses several aspects of youth integration—on the one hand, by considering employment rates together with exclusion measures, and on the other hand, by differentiating according to educational qualifications. The indicators included account for various groups of the youth population, building a more comprehensive picture than contributions exclusively focused on the most disadvantaged or on the better-off [61]. For these very reasons, we argue that the index, despite its limitations, provides a better proxy for the analysis of the regional contexts of youth integration in the labor market.
The construction of the YLMI index followed three different steps. First, a confirmatory factor analysis was carried out. The factor loading of each observed item exceeds 0.787, accounting for 85% of their overall variance. The high loadings show that, notwithstanding a certain degree of overlapping, all variables significantly contribute to the composition of the index and to explaining the underlying variance. This allows a summary of the underlying information, as well as the interpretation of the direction and meaning of the indicator (i.e., higher or lower youth integration). Second, the Cronbach alpha test was used, the results of which reveal that the YLMI index is internally consistent (0.927). This implies that the observed items form an internally reliable scale and that the measure is highly consistent within itself. Third, the observed items were aggregated through geometric mean index number, which is a multiplicative aggregation of ratios with their importance exponents using Benefit of the Doubt (BoD) weighting. This methodology, proposed by Van Puyenbroeck and Rogge [71] and by Rogge and Self [72], is a weighted geometric average, and it has the advantage of comparing each subindicator relative to a baseline (e.g., in this case, the EU-27 average). Moreover, it combines sequence with conditional weights based on the minimum and maximum distribution. We also reverse-coded the cardinality of the youth unemployment and NEET rates to match them with the other indicators of YLMI. Summary statistics of the key variables are provided in Table 1.
A benefit of the YLMI index is that it can be obtained for most EU regions, thus producing comparable evidence. It adds to the debate on territorial governance and it also provides valuable information for policy-makers engaging with regional and cohesion policies. A high value of YLMI, close to 1, identifies better labor market integration opportunities for young people in a specific region. More specifically, it is the result of better conditions of access (given by high employment rates for upper-secondary- and tertiary-educated youths), smooth transitions to the labor market (given by high shares of employment of upper-secondary- and tertiary-educated youths three years after the completion of education), and less exclusion (given by the incidence of unemployment and NEET in the population of young people). Conversely, a low value of YLMI, close to 0, identifies a lack of opportunities for young people in a specific region, with difficulties in access (i.e., low employment rates for qualified youth), slow transitions (i.e., low employment three years after education completion), and high levels of exclusion (i.e., high values of unemployment and NEET).
A drawback of the YLMI index is that, being a regional aggregate composite indicator, it does not reveal the variation of youth labor market integration within single regions, whether by social origin, nature of education level, type of job, or precarity or migration status. Our selection of the indicators was theoretically driven, but it was also partly constrained by the limited availability of harmonized, longitudinal, and comparable data at a regional level, due to issues of statistical representativeness and changes in the NUTs classification [55]. For instance, the YLMI index does not account for atypical forms of employment, and it includes different age groups. Notwithstanding, by weighting several indicators, the YLMI index provides a multidimensional view of territorial youth integration, which is not restricted to measures of exclusion, such as unemployment and NEET rates (more commonly used in the literature on the topic).
We interpreted the YLMI values in terms of the context-related structures of the opportunities of young people [12], regarding labor market integration. This is a reasonable assumption at high spatial scales of aggregation such as NUTS-2: When aggregated across a large number of different variables (e.g., inclusion into versus exclusion from the labor market), the indicator is more likely to capture other related factors of youth regional labor market specificities such as the degree of youth precarization—which was not included as a component of the YLMI index.
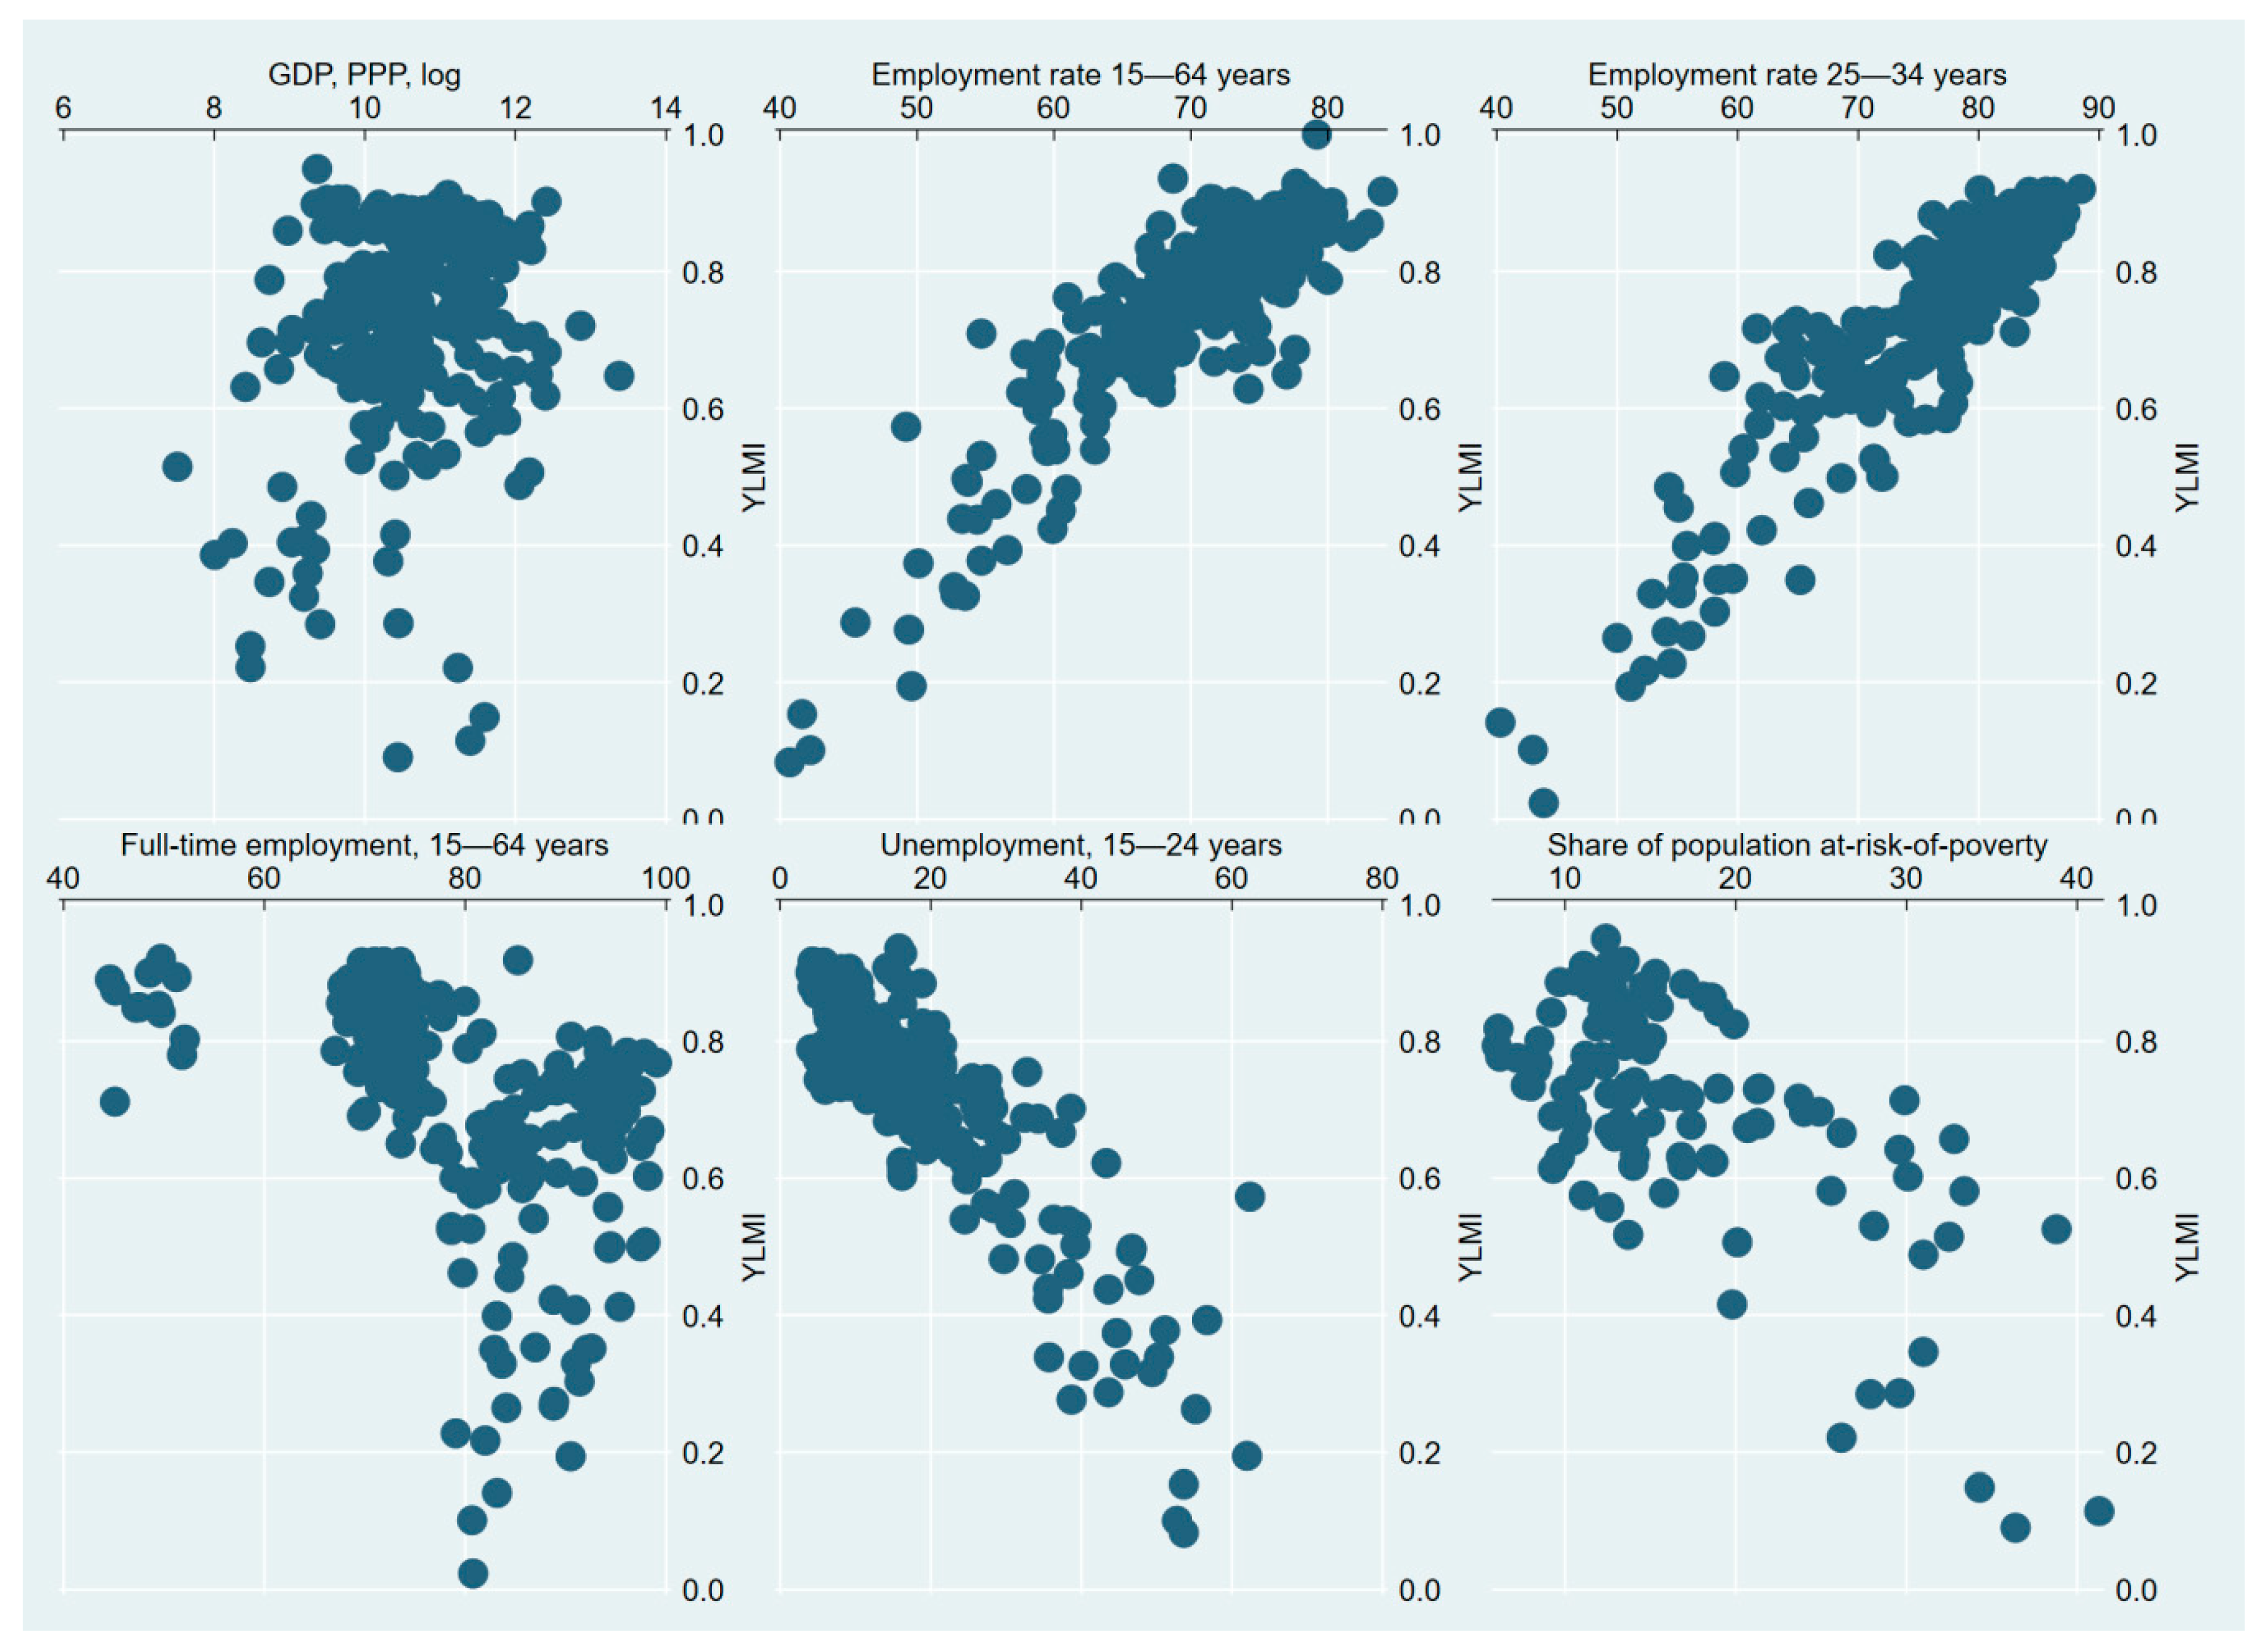
Table 2 and Figure 1 present the YLMI index, showing correlations with some widely used socioeconomic, demographic, and labor market variables. The aim is descriptive, as correlations do not give indications on the direction and explanations of the associations.
The index positively correlates with variables on economic well-being, such as the GDP (at Purchasing Power Parity (PPP) per capita), showing that competitive regional economies tend to present higher levels of youth integration. Not surprisingly, correlations are particularly pronounced with labor market indicators on employment, coherently with previous research highlighting the positive association between good overall labor market conditions and youth employment [1]. Conversely, it negatively correlates with the share of full-time employment. This shows that the index accurately mirrors the dynamics of youth integration as result of a mix of socioeconomic conditions and policy interventions. The phase of transition into the labor market is often characterized by nonstandard employment as opposed to full-time standard employment of the core of the labor force.
4. Results and Discussion: Variation of YLMI in Europe
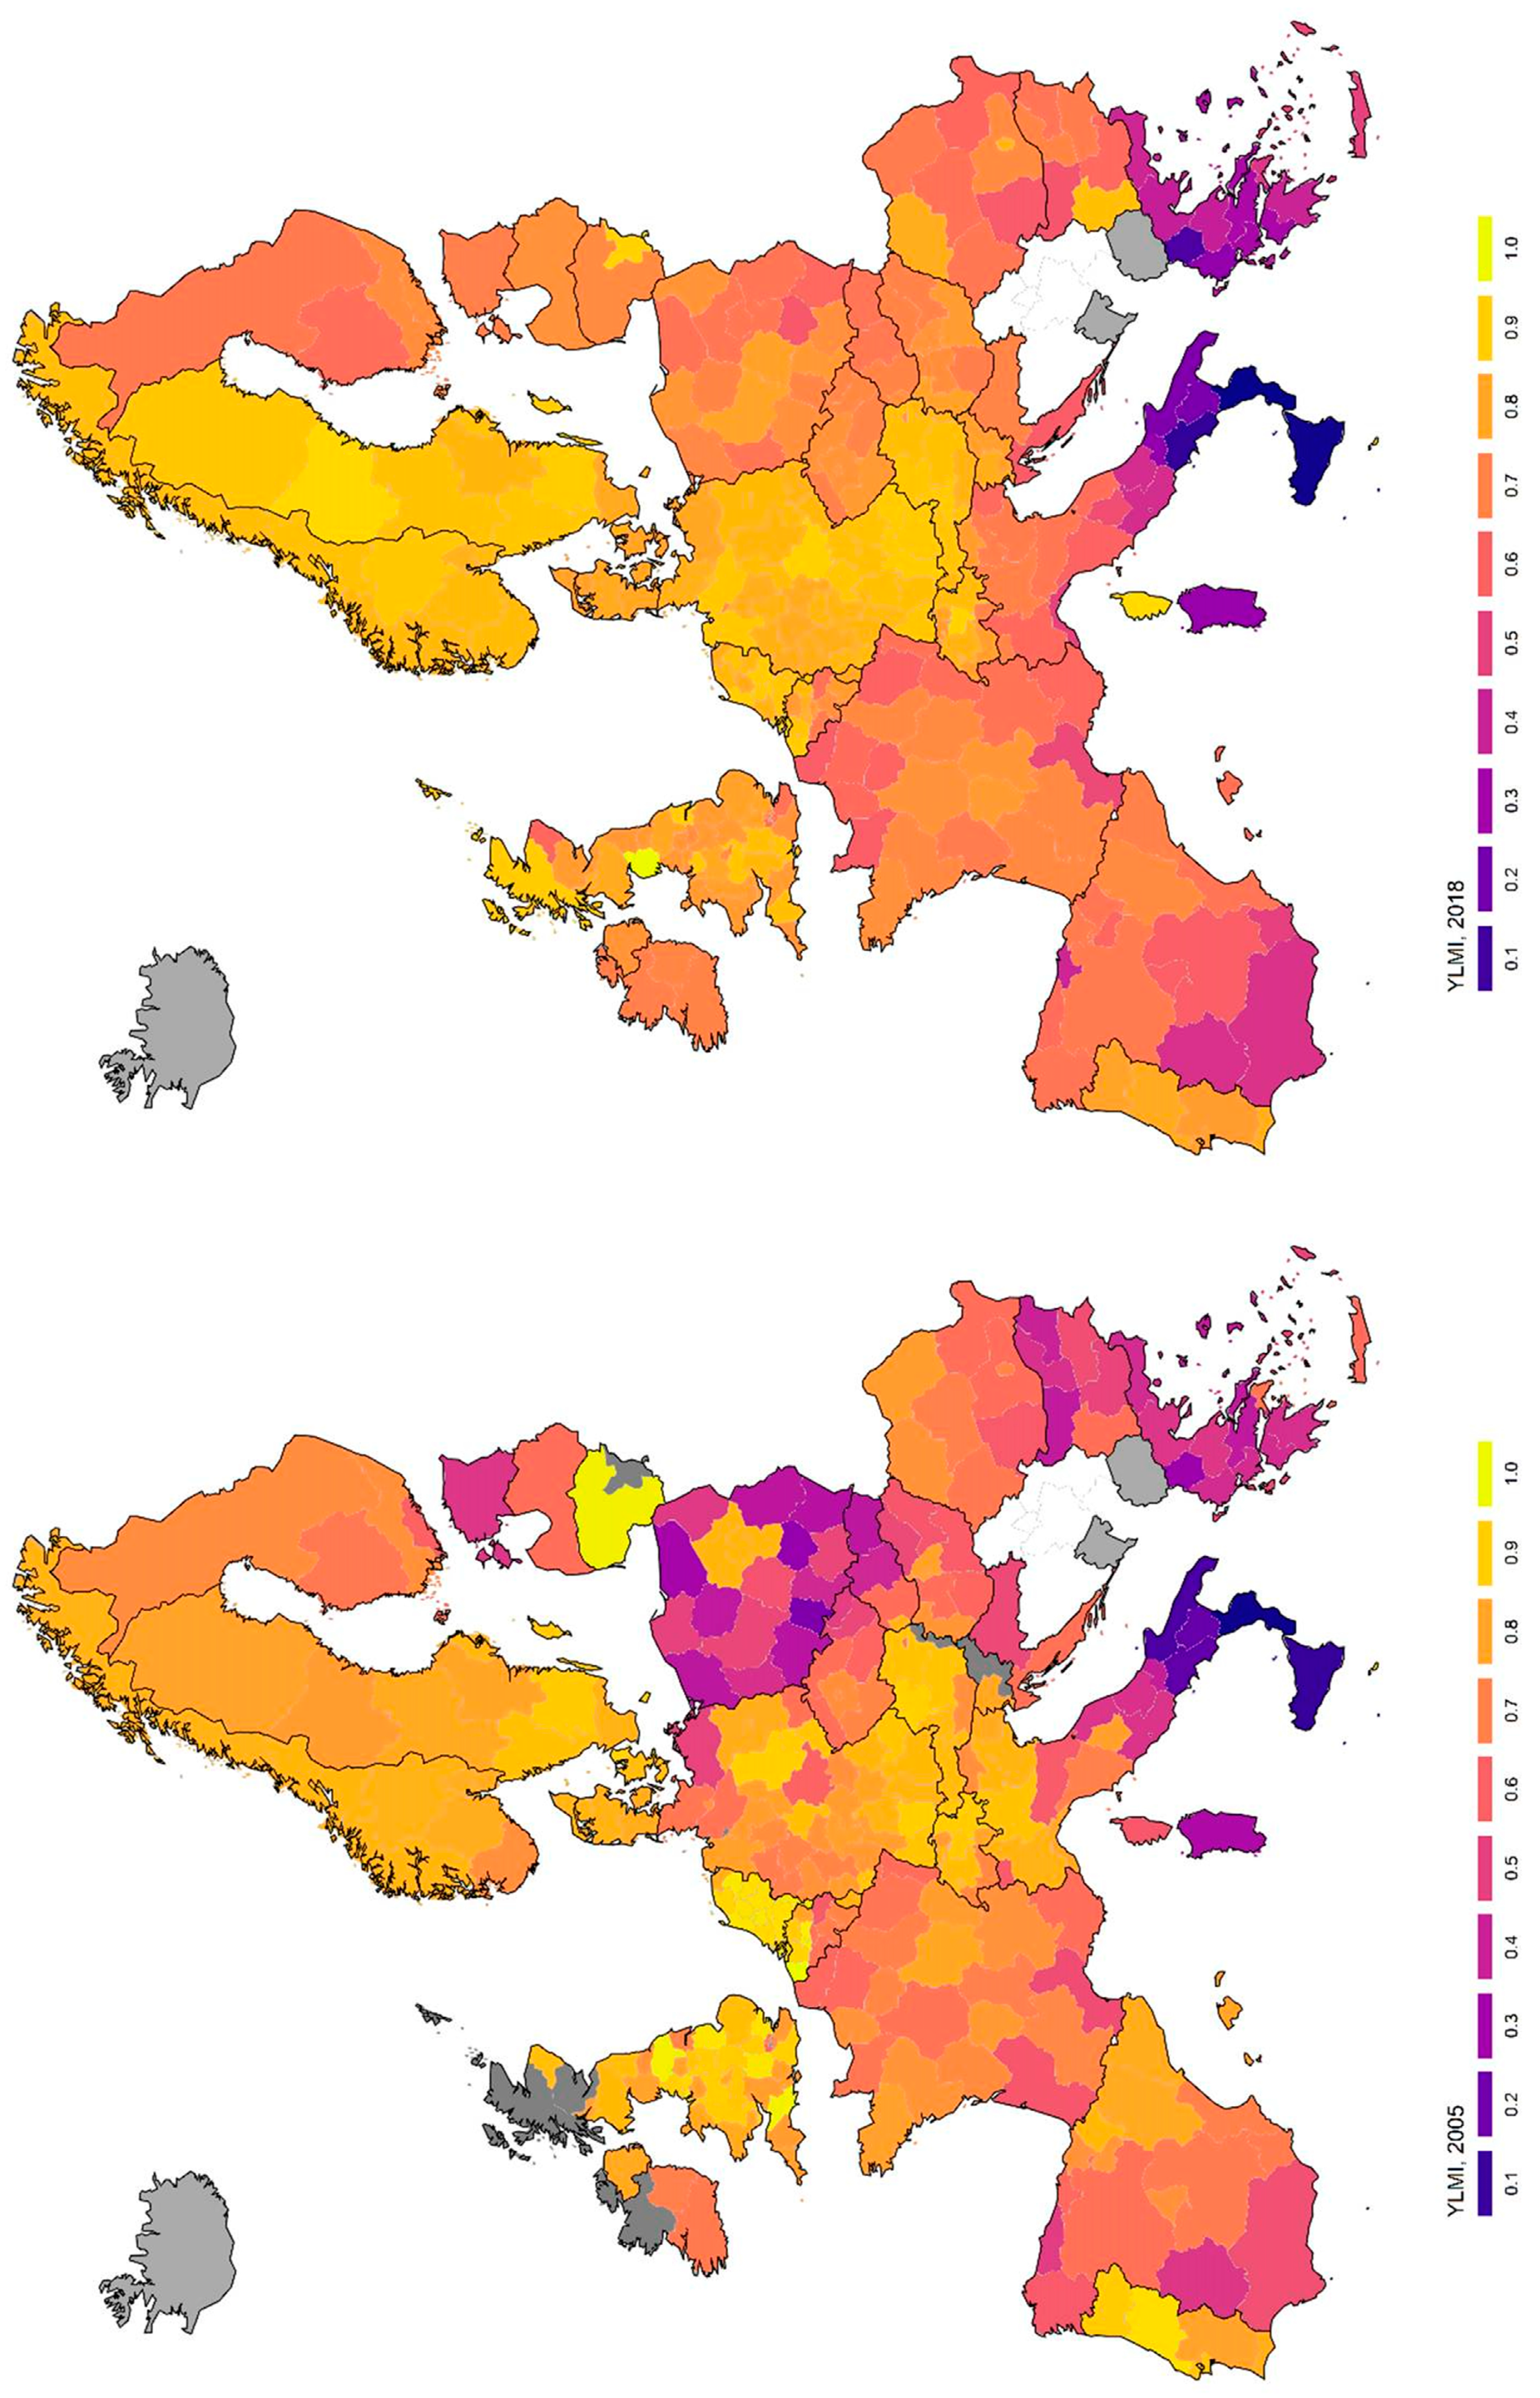
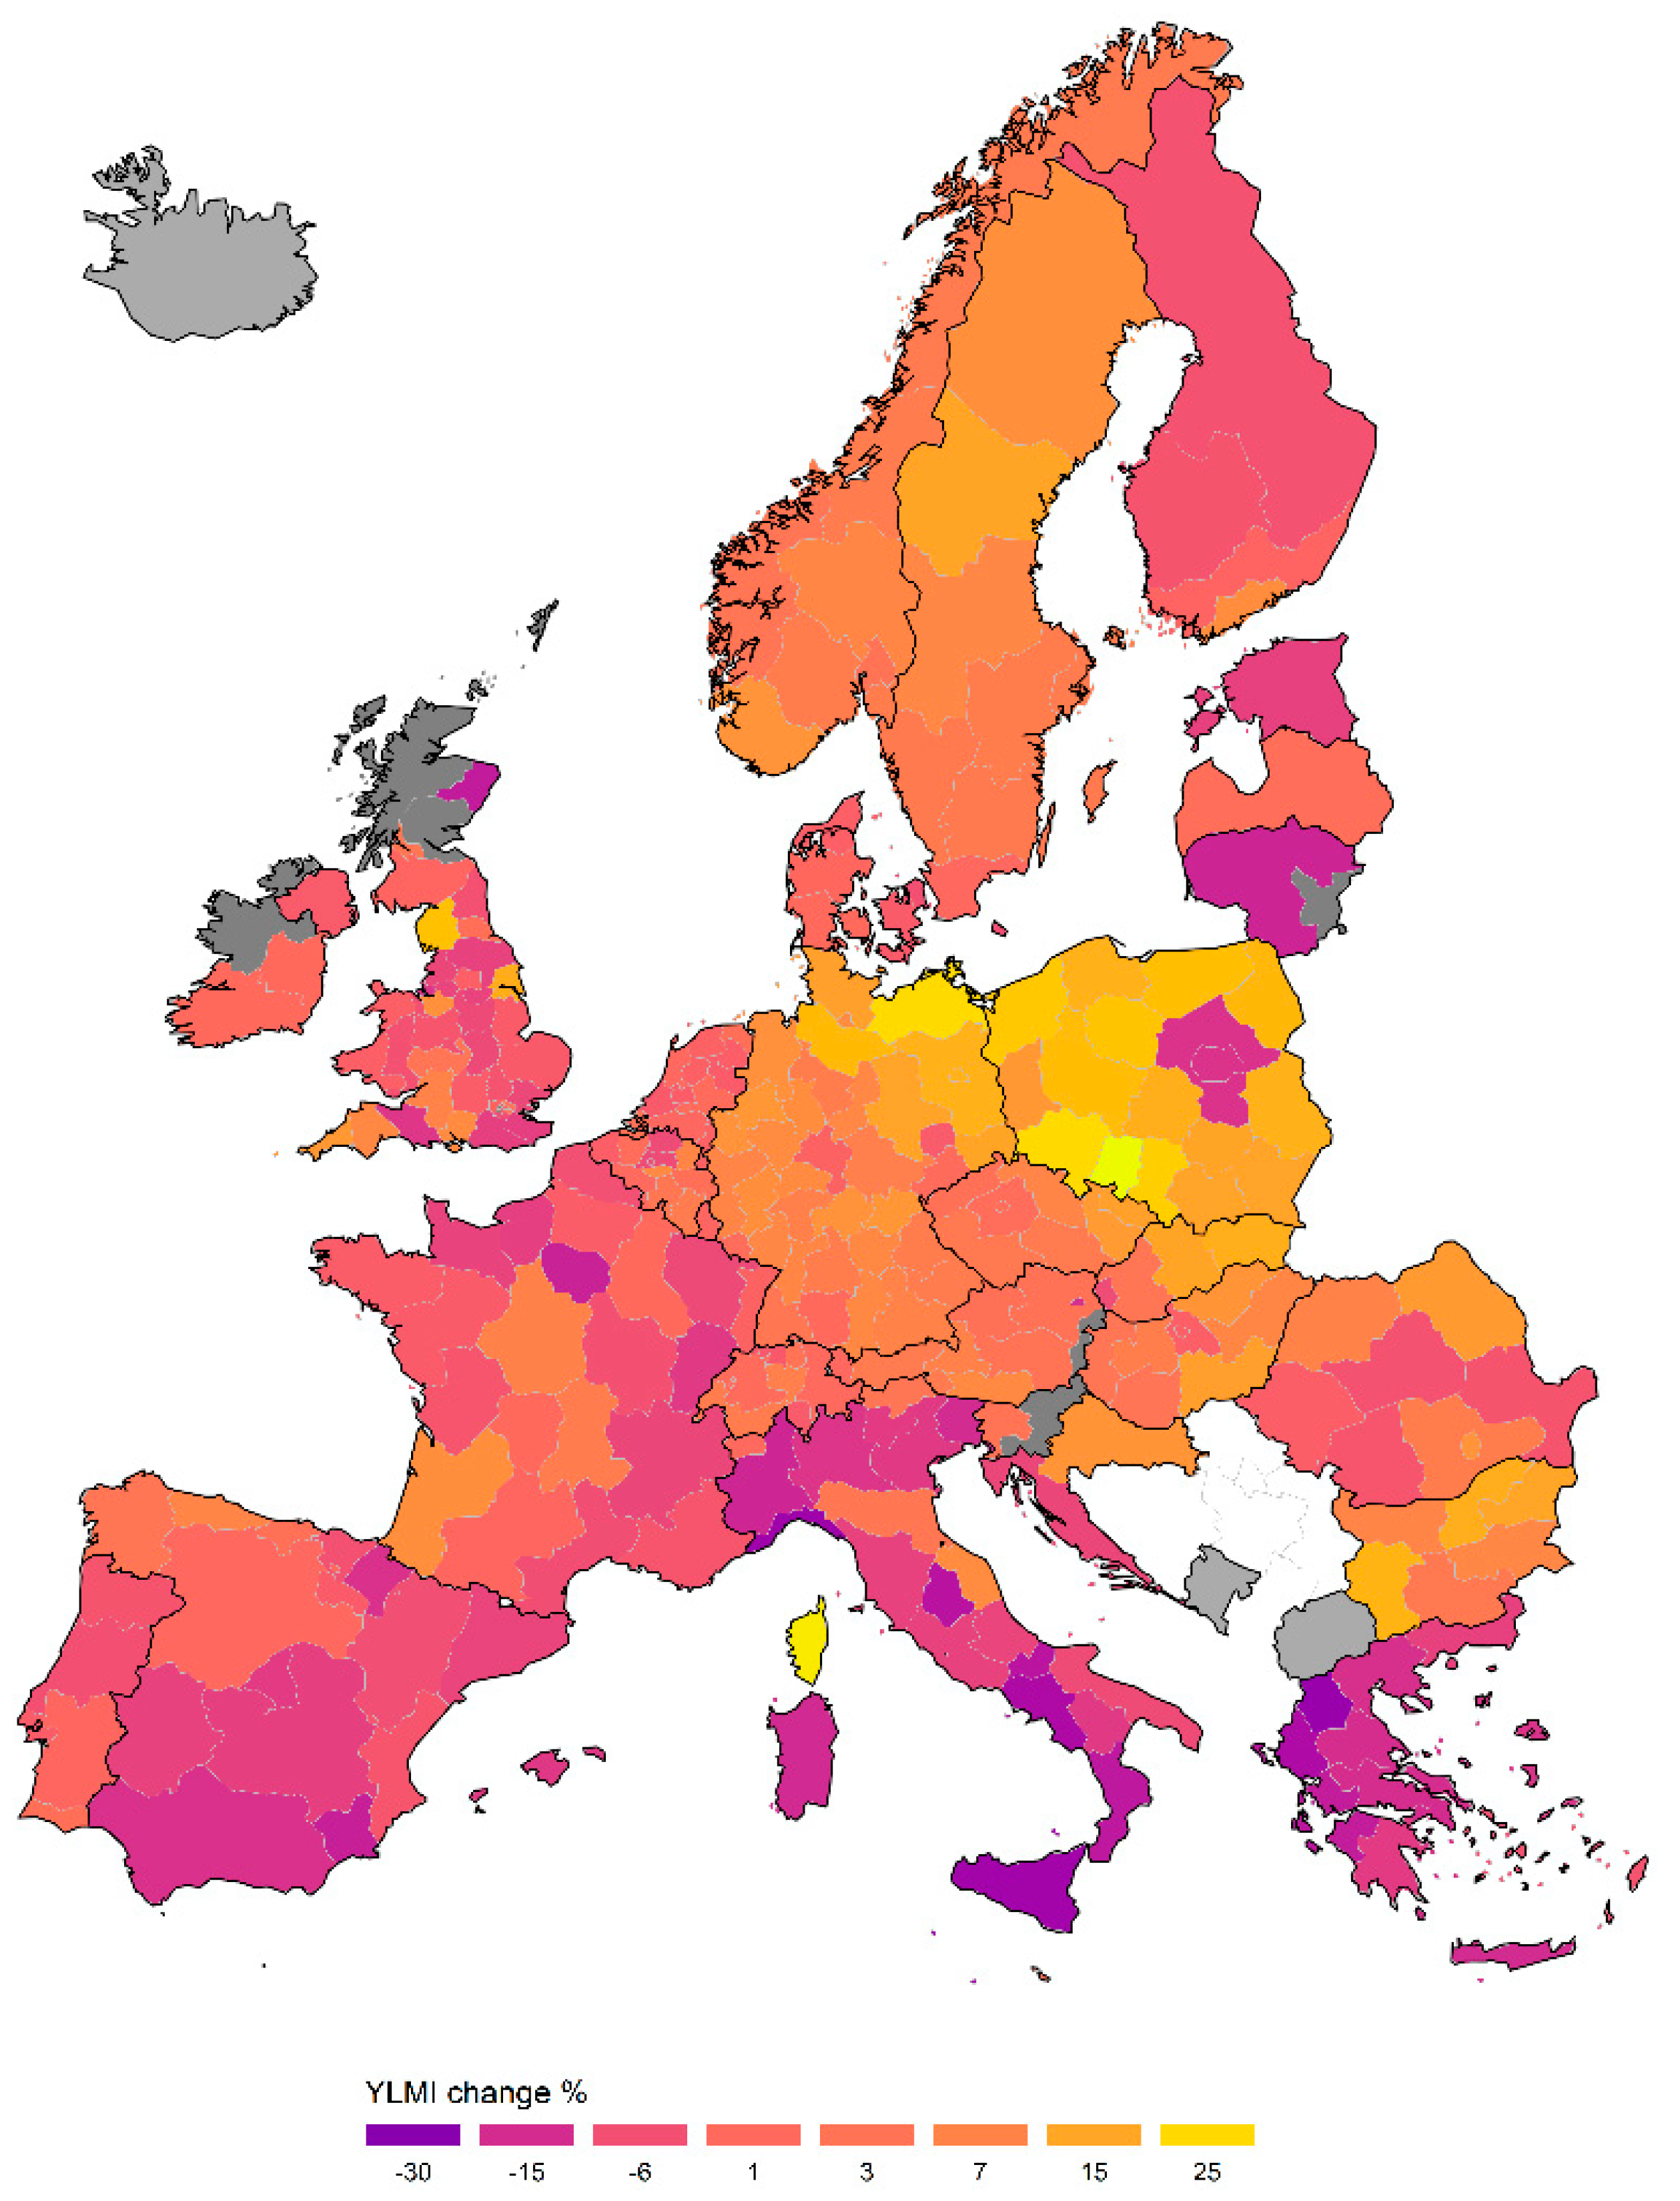
This section presents two selections of results. Figure 2 displays the full overview of the EU NUTS-2 regions’ country scores and ranks for the YLMI scores in 2005 and 2018. Table 3 presents the YLMI composite index scores for the 15 best- and worst-performing NUTS-2 regions in 2018. Figure 3 shows the change in YLMI scores between 2005 and 2018, which allows the identification of temporal patterns that characterize groups of European regions. On average, the value of YLMI increased between 2005 and 2008, and then experienced a substantial drop after 2008. Signs of recovery are to be seen only after 2012. However, the recovery in average values comes together with an increasing differentiation of trajectories among European regions from 2011 onwards.
Coherently with recent research on territorial disparities in school-to-work transition outcomes, our data show a combination of cross-country and cross-regional variations below the country level. The typologies and cross-country differences of transition regimes can explain a relevant but not exhaustive share of the variance associated with indicators of youth integration: In order to build a comprehensive picture, cross-regional differences must be addressed [4].
As for cross-country variation, the literature on the differences between the regimes of youth transitions [20] is useful for the interpretation of YLMI scores. Overall, higher scores of youth labor market integration in 2018 are observed in regions from Central–Northern Europe (especially in the Netherlands, Germany, Austria, Switzerland, Sweden, Norway, and Denmark). These countries are characterized by different institutions shaping school-to-work transitions, that seem, despite their differences, relatively efficient at easing labor market integration and limiting regional disparities. Countries such as Sweden, Denmark, and the Netherlands rely on comprehensive programs of active labor market policies within a policy ecosystem that emphasize the role of training in the connection between the education system and the labor market. In Germany and Austria, a well-developed vocational training system substantially smoothens the transition for a major share of the youth population. Conversely, at the bottom of the distribution, we mostly find regions from Southern European countries (such as Greece, Italy, and Spain). In these countries, from the Latin rim, the linkages between education and the labor market are weak and fragmented, together with disadvantaged socioeconomic conditions, especially worsening after 2008. The U.K. also displays values of YLMI well above the average, as well as some Eastern European countries—namely, Poland, Slovenia, Lithuania, the Czech Republic, and Hungary. In the U.K. and Ireland, school-to-work transitions are mainly shaped by flexible labor market arrangements, providing opportunities for youths mainly in secondary labor markets. Eastern European countries are said to present a wide array of institutional arrangements, due to the various trajectories of transition into a market economy. Within this group, Slovenia, Slovakia, the Czech Republic, and Hungary present a better profile in terms of YLMI.
Differences between countries and school-to-work transition systems are relevant but do not explain all the regional variations in YLMI. In fact, the maps show remarkable differentiations below the country level. This is especially true for southern European countries such as Italy and Spain, displaying sharp territorial disparities between the northern and southern regions. However, regional differences in youth labor market integration are also observable in countries such as France and the U.K., as well as in eastern European countries such as Poland, Romania, Bulgaria, and Hungary. These results are mirrored in Table 3, which displays, respectively, the 15 best- and worst-performing European regions in terms of their average YLMI index scores during the 2005–2018 period. Among the best-performing regions, seven are from the Netherlands, three from Austria, two from Norway and Germany, and one from Belgium. This confirms the generally good conditions for young people in Continental and Northern European countries, and also shows the existence of specifically located peaks of excellence in a comparative fashion. Among the worst performers, we notice less cross-country variation, as the regions with the lowest YLMI values are mostly located in southern Italy and Greece (respectively, seven and six regions). The very low scores of regions from the South of Italy are a sign of the extreme regional divide that characterizes the country [65]. The list is then completed by another region from southern Europe, namely, Spain, and one region from Bulgaria. All in all, the distribution of low-performing regions shows a dynamic of spatial concentration of disadvantage not only in regions, but in macro-regions (such as the South of Italy) or even countries (such as Greece). This entails a high risk of clustering of several adverse contextual conditions that combine in configurations of negative complementarities [73]. The result is the emergence of long-standing inertial trajectories, challenging to address through single or short-sighted policy interventions and reforms.
Focusing on the variation of YLMI between 2005 and 2018 (Figure 3), we can see that the regional trajectories are often even more differentiated. The impact of the crisis was especially detrimental in most regions from western and southern Europe. Regions in Greece, Spain, and Italy particularly suffered the impact of the Great Recession. In 2018, the regions in these countries displayed substantially lower values of YLMI than in 2005, showing a strong deterioration of the labor market conditions for young people. The relative drop was very high in Spain, which went from being the 17th country in Europe for YLMI country-average values to the 25th. Nonetheless, Spain, and mostly Italy, present a pronounced divide between the northern and southern regions. The fragmentation is particularly striking in the Italian case. Regions from the South of Italy, such as Sicilia, Campania, and Calabria, display extremely low scores on YLMI in 2005, and little has changed over the following 14 years, thus structuring a long-term lack of opportunities for young people, due to reinforcing negative complementarities between structural economic conditions and institutional fragmentation [73]. In this picture, Puglia represents a notable exception, being one of the very few Italian regions with a relevant increase of YLMI score compared to 2005. Conversely, the North Italian regions that show a high level of youth integration in 2005, in 2018 still show signs of struggle to recover after the crisis. Additionally, several Greek and southwest Spanish regions have also experienced a drop in YLMI scores over time, being strongly hit by the crisis. However, struggling with youth labor market integration is not to be considered only a Mediterranean or southern European issue. Some U.K., French, Danish, and Finnish regions have also experienced a drop in YLMI scores in the last 14 years, while most regions in Sweden maintained their previous levels, as is the case for regions in Austria, Belgium, the Netherlands, and Switzerland as well.
The map in Figure 3 also shows that the integration of young people into the labor market has remained constant or has even improved since 2005 in some central and eastern European countries and regions. In 2018, the YLMI values show, for instance, moderate to steady increases for regions of Germany, Hungary, Poland, the Czech Republic, Slovakia, and Bulgaria due to different trajectories, but an overall improvement of conditions compared to 2005, and a somehow minor impact of the Great Recession on YLMI. For instance, Germany went from being the 10th country in Europe for YLMI values to the 2nd, Hungary from 19th to 9th, and Poland from 25th to 16th. In Germany, the trajectory of the southern and western regions is coherent with the overall change in the labor market and economic conditions of the country, with substantial improvements in the integration of young people between 2005 and 2018; while eastern regions show more differentiated trajectories. In the decade following reunification, Germany suffered increasing unemployment, especially for young people, thus being labeled as the “Sick Man of Europe.” Fifteen years later, its conditions changed to those of “Economic Superstar,” due to a combination of factors: Gains in economic competitiveness with respect to other countries in the Eurozone, the flexibility of the German systems of industrial relations [74], and also the ambiguous social effects of controversial labor market reforms [75]. Even more striking are changes in the trajectories of Polish, Slovakian. and Hungarian regions. Notwithstanding the negative impact of the crisis in 2008–2009 [76], these territories displayed high relative improvements of the YLMI index in 2018. Of course, the explanation could again be related to several factors. Economic growth in newer EU member states goes with growing internal and regional polarization, especially between booming regional capitals and disadvantaged peripheries [48]. Also, East to West labor mobility and brain-drain outflows of qualified young people are part of the picture. As noted by Andor [77], these factors create combinations and differences among eastern European countries and, as shown by the YLMI index, eastern regions. This is important for a correct interpretation of the index: As a contextual measure, it is affected by migration outflows, because they reduce regional job competition among youths, therefore resulting in some relative improvements of youth employment conditions in the regional labor market.
The above reported descriptive data show the relevance of the variation of YLMI both among countries and across regions throughout Europe, meaning that country-level explanations cannot comprehensively account for subnational variation. The YLMI index highlights internal disparities and long-term trajectories within European countries, and identifies the most dynamic and lagging regions in Europe in terms of employment opportunities and disadvantages for young people.
5. Conclusions
The integration of young people in the labor market represents a core mission of European policy and of the European Social Fund (ESF). Recent policy initiatives, such as the Juncker Plan, the Youth Guarantee (YG), the European Alliance for Apprenticeship, or the Smart Specialization, mirror both the growing concern and the effort to improve skills, participation, and mobility among youths, as well as firms’ investments and training capacities. In this context, the importance of place-sensitive measures is gaining increasing recognition [62,78], as European-wide place-neutral or general-purpose interventions may prove ineffective in addressing problems of spatially uneven youth labor market integration (YLMI). A relevant example is the YG, which funds initiatives to support youth employment in regions with over 25% youth unemployment. On this basis, it then addresses the national level, as eligible countries present their own national plans [79,80,81]. Regions play an important role in the provision of youth policy, although YG funds and measures are, in many countries, centrally distributed. Moreover, many regions that have suffered a constant economic downturn or are strongly hit by youth unemployment may lack the administrative capacity [82] to absorb EU funds and to effectively implement measures designed to target youth integration [83,84]: The extreme case of Italy shows that the implementation of YG was not effective in targeting regional differentiation. Similar conclusions can be hypothesized by looking at other countries that have seen their regional and local differentiation widening in recent years. If it is true that the territorial issue is gaining relevance in the policy agenda, territorial disparities continue to represent a crucial challenge to be addressed by the EU and its member states, as witnessed by various recent contributions [49,63,85,86] also concerning young people [11]. Moreover, across EU member states, political responsibility for youth policy-making is typically situated at different territorial levels. In several countries, regions are key actors in cohesion policy and have political responsibility and various degrees of autonomy in education and labor market integration. In light of this, in this contribution we propose a composite measure of youth labor market integration, based on updated regional social data, which might help to contextualize policy efforts. Future research should also focus on investigating how specific combinations of socioeconomic structures and institutions result in the regionally differentiated outcomes of integration that we documented through the YLMI index.
Our results show that the variation in youth labor market integration is pronounced not only across countries, but also across regions, confirming that homogeneity below the national level cannot be taken for granted and should be considered when designing youth and territorial policies. This mirrors the extension of differences in the structures of opportunities with potential impact on the life course of young people. Continental and northern European regions display more favorable conditions for the integration of youths in the labor market, while sharp difficulties in integration mark the performance of southern European regions. Given this general framework, though, a subnational focus allows to detect and observe the specific regional patterns within countries. For instance, the distribution of the YLMI index and its development over time shows strongly divergent regional trajectories in Italy and Spain, but also countries such as the U.K., Germany, and several new eastern EU members display significant levels of subnational differentiation in the last 14 years. This index provides empirical evidence to highlight these differences that we interpret as contextual characteristics related to youth integration and opportunities in a given region. As in the case of eastern European regions, more in-depth regional and subnational analyses are then necessary to disentangle the combination of specific factors and determinants that lie behind higher or lower levels of youth integration in the labor market.
We are aware of the fact that our study presents some limitations. First, the YLMI index is based on aggregate measures at a regional level, and not on individual microdata. Therefore, it refers to characteristics of the context in terms of youth integration. Second, the availability of harmonized, long-term, and comparable data at a regional level are still limited due to issues of statistical representativeness and changes in the NUTS classification. This restricts the range of available indicators to be used as proxies of the different dimensions of youth labor market integration; for instance, the YLMI index does not account for atypical forms of employment.
The evidence presented regarding YLMI, however, also has positive aspects beyond the ones discussed so far. For instance, it challenges the concept of Europe as a converging machine [87,88] by showing the persisting paths of differentiation across regions, as well as evidence of untapped potential due to the lack of opportunities. As far as young people are concerned, the European Union has experienced more than a decade of territorial polarization. In more divided countries, regional disparities in opportunities are likely to reproduce and even increase inequalities. The dream of the EU as a converging machine has been clearly overcome. This point is particularly relevant, given the fact that patterns of territorial disparities, driven by combinations of socioeconomic and geographical factors, have been identified as possible reasons behind the rise in populism and anti-EU voting [14]. Going beyond the identification of the profile of anti-system supporters as being older, working-class, white voters with few qualifications and low income [89], recent evidence suggests that the anti-EU voting is a sign of the revenge of places that do not matter, affected by long-term economic decline and a lack of education and employment opportunities [13]. In this light, the YLMI index provides valuable information for policy-makers: Strong differences in youth integration across Europe and within countries might show the characteristics of a potential geography of discontent specifically related to young people and, therefore, to the future of Europe. The lack of employment opportunities and integration of youth trapped in places that do not matter could be fueling present and future discontent.
We have shown that territorial youth labor market integration is one of the most relevant urgencies for EU cohesion policy, as young people represent one of the groups that bear the main costs of the Great Recession. In deprived regions, the persistence of disadvantaged contextual conditions that we documented may very well turn to inertial traps, as limited administrative and institutional capacities may hinder the effectiveness of policy solutions [84]. In the case of young people, this would translate into place-sensitive and targeted, and perhaps asymmetrical, interventions aimed at compensating inequalities, thus fostering a better matching between skills and employment in order to shorten the school-to-work transitions and to improve the link between education and the labor market.
Policies targeting youth integration in the labor market at the national level should be integrated within a multilevel governance structure, providing regions with the necessary flexibility to tackle subnational variations and to attain more spatially just outcomes. However, this devolution might also bear the risk of fostering and consolidating regional disparities. What we need is a form of active subsidiarity in which interventions are structured across jurisdictions aiming at granting equal opportunities vis-à-vis unequal socioeconomic contexts. A calibrated distribution of regulatory competencies, adequate resources, and degrees of freedom tempered by mechanisms of controls is therefore required. These conditions would allow context-specific adaptation in a frame that attempts to equalize opportunity structures for youths. This would also involve a stronger leap in innovation and social policy, calling for a jump of scales in governance level from the local toward the national or the EU level.
EU cohesion policy is challenged by persisting high levels of territorial disparities, in a moment when the voice of the regions should play a central role in the sustainability of the EU project. The need for creating an EU multilevel governance system in the definition and targeting of investment decisions seems to be a pressing issue that cannot be postponed without serious consequences for EU citizens and territories.
Author Contributions
The three authors contributed equally to the present paper. Each phase of the paper development was discussed and worked on by all authors. All authors have read and agreed to the published version of the manuscript.
Funding
This research received no external funding, but it should be acknowledged that it builds upon ideas and data collected in the following Projects: (1) “Young AduLLLt – Policies Supporting Young People in their Life Course. A Comparative Perspective of Lifelong Learning and Inclusion in Education and Work in Europe” (2) “COHSMO. Inequality, Urbanization and Territorial Cohesion: Developing the European Social Model of Economic Growth and Democratic Capacity”. Both projects were funded by the European Union’s Horizon 2020 research and innovation Programme. Rosario Scandurra also acknowledges the support of the Juan de la Cierva Grants Programme (Ref. FJCI-2016-28588). The APC was funded by the University of Vienna.
Conflicts of Interest
The authors declare no conflicts of interest with respect to the research, authorship, and/or publication of this article.
References
- De Lange, M.; Gesthuizen, M.; Wolbers, M.H.J. Youth Labour Market Integration Across Europe. Eur. Soc. 2014, 16, 194–212. [Google Scholar] [CrossRef]
- Eichhorst, W.; Hinte, H.; Rinne, U. Youth Unemployment in Europe: What to Do about It? IZA: Bonn, Germany, 2013. [Google Scholar]
- Caroleo, F.E.; Demidova, O.; Marelli, E.; Signorelli, M. Young People and the Labour Market. A Comparative Perspective; Routledge: London, UK, 2017. [Google Scholar]
- Scandurra, R.; Cefalo, R.; Kazepov, Y. School to work outcomes during the Great Recession, is the regional scale relevant for young people’s life chances? J. Youth Stud. 2020. [Google Scholar] [CrossRef] [Green Version]
- Scandurra, R.; Hermannsson, K.; Cefalo, R. Assessing young adults living conditions across Europe using harmonised quantitative indicators: Opportunities and risks for policy makers. In Lifelong Learning Policies for Young Adults in Europe. Navigating between Knowledge and Economy; Pareira do Amaral, M., Rambla, X., Kovacheva, S., Eds.; Policy Press: Bristol, UK, 2020; pp. 171–198. [Google Scholar]
- Kazepov, Y. (Ed.) Rescaling Social Policies: Towards Multilevel Governance in Europe; Ashgate Publishing: Fernham, UK, 2010. [Google Scholar]
- Dijkstra, L. My Region, my Europe, Our Future. Seventh Report on Economic, Social and Territorial Cohesion; Publications Office of the European Union: Luxembourg, 2017. [Google Scholar]
- Iammarino, S.; Rodriguez-Pose, A.; Storper, M. Regional inequality in Europe. Evidence, theory and policy implications. J. Econ. Geogr. 2018, 53, 898–924. [Google Scholar] [CrossRef]
- Raffe, D. Explaining national differences in education-work transitions: Twenty years of research on transition systems. Eur. Soc. 2014, 16, 175–193. [Google Scholar] [CrossRef]
- Kazepov, Y.; Ranci, C. Is every country fit for social investment? Italy as an adverse case. J. Eur. Soc. Policy 2017, 27, 90–104. [Google Scholar] [CrossRef]
- Parreira do Amaral, M.; Kovacheva, S. (Eds.) Lifelong Learning Policies for Young Adults in Europe: Navigating between Knowledge and Economy; Policy Press: Bristol, UK, 2020. [Google Scholar]
- Roberts, K. Opportunity structures then and now. J. Educ. Work 2009, 22, 355–368. [Google Scholar] [CrossRef]
- Rodríguez-Pose, A. The revenge of the places that don’t matter (and what to do about it). Camb. J. Reg. Econ. Soc. 2018, 11, 189–209. [Google Scholar] [CrossRef]
- Dijkstra, L.; Poelman, H.; Rodríguez-Pose, A. The geography of EU discontent. Reg. Stud. 2019, 1–17. [Google Scholar] [CrossRef]
- Antonucci, L.; Horvath, L.; Kutiyski, Y.; Krouwel, A. The malaise of the squeezed middle: Challenging the narrative of the ‘left behind’ Brexiter. Compet. Chang. 2017, 21, 211–229. [Google Scholar] [CrossRef] [Green Version]
- Becker, S.O.; Fetzer, T.; Novy, D. Who voted for Brexit? A comprehensive district-level analysis. Econ. Policy 2017, 32, 601–650. [Google Scholar] [CrossRef] [Green Version]
- Arnett, J.J. (Ed.) The Oxford Handbook of Emerging Adulthood; Oxford University Press: Oxford, UK, 2015. [Google Scholar]
- Grosemans, I.; Hannes, K.; Neyens, J.; Kyndt, E. Emerging Adults Embarking on Their Careers: Job and Identity Explorations in the Transition to Work. Youth Soc. 2018. [Google Scholar] [CrossRef]
- Blossfeld, H.P.; Hofäcker, D. Globalization, Rising Uncertainty and Life Courses in Modern Societies. A Summary of Research Findings and Open Research Questions. Sociol. Lavoro 2014, 136, 16–33. [Google Scholar] [CrossRef]
- Walther, A. Support across life course regimes. A comparative model of social work as construction of social problems, needs, and rights. J. Soc. Work 2017, 17, 277–301. [Google Scholar]
- Buchholz, S.; Hofäcker, D.; Mills, M.; Blossfeld, H.P.; Kurz, K.; Hofmeister, H. Life Courses in the Globalization Process: The Development of Social Inequalities in Modern Societies. Eur. Sociol. Rev. 2009, 25, 53–71. [Google Scholar] [CrossRef]
- Ryan, P. Youth Employment Problems and School-to-Work Institutions in Advanced Economies. In Young Workers in the Global Economy. Job Challenges in North America, Europe and Japan; De Freitas, G., Ed.; Edward Elgar: Cheltenham, UK, 2008; pp. 137–160. [Google Scholar]
- Pastore, F. The Youth Experience Gap. Explaining National Differences in the School-to-Work Transition; Springer: Cham, Switzerland, 2015. [Google Scholar]
- Smyth, E.; Gangl, M.; Raffe, D.; Hannan, D.F.; McCoy, S. A Comparative Analysis of Transitions from Education to Work in Europe (CATEWE); Final Report; ESRI: Dublin, Ireland, 2001. [Google Scholar]
- Coppola, G.; O’Higgins, N. (Eds.) Youth and the Crisis. Unemployment, Education and Health in Europe; Routledge: London, UK, 2016. [Google Scholar]
- Lindbeck, A.; Snower, D.J. Insiders versus outsiders. J. Econ. Perspect. 2001, 15, 165–188. [Google Scholar] [CrossRef] [Green Version]
- Kalleberg, A.L. Precarious work, insecure workers: Employment relations in transition. Am. Sociol. Rev. 2009, 74, 1–22. [Google Scholar] [CrossRef] [Green Version]
- Piopiunik, M.; Ryan, P. Improving the Transition between Education/training and the Labour Market: What Can We Learn from Various National Approaches? Report for the European Commission, Analytical Report n. 13; EENEE: Munich, Germany, 2012. [Google Scholar]
- Bell, D.N.; Blanchflower, D.G. Young people and the Great Recession. Oxf. Rev. Econ. Policy 2011, 27, 241–267. [Google Scholar] [CrossRef] [Green Version]
- Zamfir, A.; Militaru, E.; Mocanu, C.; Lungu, E.O. School-to-work transition of higher education graduates in four European countries. Comp. A J. Comparat. Int. Educ. 2020, 50, 36–52. [Google Scholar] [CrossRef]
- Wolbers, M.H. Pattern of Labour Market Entry: A Comparative Perspective on School-to-Work Transitions in 11 European Countries. Acta Sociol. 2007, 50, 189–210. [Google Scholar] [CrossRef] [Green Version]
- Abrassart, A. Cognitive skills matter: The employment disadvantage of low-educated workers in comparative perspective. Eur. Sociol. Rev. 2013, 29, 707–719. [Google Scholar] [CrossRef] [Green Version]
- Quintini, G.; Martin, J.P.; Sébastien, M. The Changing Nature of the School-to-Work Transition Process in OECD Countries; IZA Discussion Paper 2582; IZA: Bonn, Germany, 2007. [Google Scholar]
- Bol, T.; Van de Werfhorst, H.G. Educational systems and the trade-off between labor market allocation and equality of educational opportunity. Comparat. Educ. Rev. 2013, 57, 285–308. [Google Scholar] [CrossRef] [Green Version]
- Gesthuizen, M.; Solga, H.; Kunster, R. Context matters: Economic marginalization of low educated workers in cross national perspective. Eur. Sociol. Rev. 2011, 27, 264–280. [Google Scholar] [CrossRef]
- Malo, M.A.; Mìnguez, M. (Eds.) European Youth Labour Markets; Springer: Cham, Switzerland, 2018. [Google Scholar]
- Brzinsky-Fay, C. The interplay of educational and labour market institutions and links to relative youth unemployment. J. Eur. Soc. Policy 2017, 27, 346–359. [Google Scholar] [CrossRef]
- Allmendinger, J. Educational systems and labor market outcomes. Eur. Sociol. Rev. 1989, 5, 231–250. [Google Scholar] [CrossRef]
- O’Higgins, N.; Pica, G. Complementarities between Labour Market Institutions and Their Causal Impact on Youth Labour Market Outcomes; Employment Working Paper no. 224; ILO: Geneva, Switzerland, 2017. [Google Scholar]
- Moser, W.; Lindinger, K.; Hannes, C. Early school leaving in Austria-The role of education system, and of migration background. Osterreichische Z. Soziol. 2016, 41, 125–146. [Google Scholar] [CrossRef]
- Eichhorst, W.; Rodríguez-Planas, N.; Schmidl, R.; Zimmermann, K.F. A road map to vocational education and training in industrialized countries. ILR Rev. 2015, 68, 314–337. [Google Scholar] [CrossRef]
- Erlinghagen, M. Employment and its institutional contexts. KZfSS Kölner Z. Soziol. Sozialpsychol. 2019, 71, 221–246. [Google Scholar] [CrossRef]
- Raffe, D. The concept of transition system. J. Educ. Work 2008, 21, 277–296. [Google Scholar] [CrossRef] [Green Version]
- Busemeyer, M.R.; Trampusch, C. (Eds.) The Political Economy of Collective Skill Formation; Oxford University Press: Oxford, UK, 2012. [Google Scholar]
- Andreotti, A.; Mingione, E.; Polizzi, E. Local welfare systems: A challenge for social cohesion. Urban Stud. 2012, 49, 1925–1940. [Google Scholar] [CrossRef]
- Tamesberger, D.; Bacher, J. NEET youth in Austria. A typology including socio-demography, labour market behaviour and permanence. J. Youth Stud. 2014, 17, 1239–1259. [Google Scholar] [CrossRef]
- Fratesi, U.; Rodríguez-Pose, A. The crisis and regional employment in Europe: What role for sheltered economies? Camb. J. Reg. Econ. Soc. 2016, 9, 33–57. [Google Scholar] [CrossRef]
- ESPON. Inner peripheries in Europe—Possible development strategies to overcome their marginalising effects. In European Observation Network for Territorial Development and Cohesion; ESPON: Long Beach, CA, USA, 2018. [Google Scholar]
- Barca, F. An Agenda for a Reformed Cohesion Policy. A Place-Based Approach to Meeting European Union Challenges and Expectations; Independent report prepared at the request of Danuta Hübner; Commissioner for Regional Policy: Brussels, Belgium, 2009. [Google Scholar]
- Atkinson, A.; Cantillon, B.; Marlier, E.; Nolan, B. Social Indicators: The EU and Social Inclusion; Oxford University Press: Oxford, UK, 2002. [Google Scholar]
- Ranci, C. Social Vulnerability in Europe. The New Configuration of Social Risks; Palgrave Macmillan: New York, NY, USA, 2010. [Google Scholar]
- Elhorst, J.P. The mystery of regional unemployment differentials: Theoretical and empirical explanations. J. Econ. Surv. 2003, 17, 709–748. [Google Scholar] [CrossRef]
- Marelli, E.; Patuelli, R.; Signorelli, M. Regional unemployment in the EU before and after the global crisis. Post Communist Econ. 2012, 24, 155–175. [Google Scholar] [CrossRef] [Green Version]
- Perugini, C.; Signorelli, M. Youth Labour Market Performance in European Regions. Econ. Change Restruct. 2010, 43, 151–185. [Google Scholar] [CrossRef]
- Pop, A.; Kotzamanis, B.; Muller, E.; McGrath, J.; Walsh, K.; Peters, M.; Girejko, R.; Dietrich, C. YUTRENDS—Youth Unemployment: Territorial Trends and Regional Resilience; ESPON: Luxemburg, 2019. [Google Scholar]
- Bruno, G.S.F.; Marelli, E.; Signorelli, M. The Rise of NEET and Youth Unemployment in EU Regions after the Crisis. Comparat. Econ. Stud. 2014, 56, 592–615. [Google Scholar] [CrossRef]
- Möller, J. Youth Unemployment in Europe from a Regional Perspective. CESifo Forum 2017, 18, 11–18. [Google Scholar]
- Rios, V. What drives unemployment disparities in European regions? A dynamic spatial panel approach. Reg. Stud. 2017, 51, 1599–1611. [Google Scholar] [CrossRef]
- Caroleo, F.E.; Rocca, A.; Mazzocchi, P.; Quintano, C. Being NEET in Europe Before and After the Economic Crisis: An Analysis of the Micro and Macro Determinants. Soc. Indic. Res. 2020. [Google Scholar] [CrossRef]
- Müller, W. Education and Youth Integration into European Labour Markets. Int. J. Comparat. Sociol. 2005, 46, 461–485. [Google Scholar] [CrossRef]
- MacDonald, R. Youth transitions, unemployment and underemployment: Plus ça change, plus c’est la même chose? J. Sociol. 2011, 47, 427–444. [Google Scholar] [CrossRef] [Green Version]
- Barca, F.; McCann, P.; Rodríguez-Pose, A. The case for regional development intervention: Place-based versus place-neutral approaches. J. Reg. Sci. 2012, 52, 134–152. [Google Scholar] [CrossRef]
- Bôhme, K.; Gloersen, E. Territorial Cohesion Storylines: Understanding a Policy Concept. Spat. Foresight Brief. 2011, 1. [Google Scholar]
- Heisig, J.P.; Gesthuizen, M.; Solga, H. Lack of skills or formal qualifications? New evidence on cross-country differences in the labor market disadvantage of less-educated adults. Soc. Sci. Res. 2019, 83, 102314. [Google Scholar] [CrossRef] [PubMed] [Green Version]
- Sergi, V.; Cefalo, R.; Kazepov, Y. Young people’s disadvantage on the labour market in Italy: Reframing the NEET category. J. Mod. Ital. Stud. 2018, 2, 41–60. [Google Scholar] [CrossRef]
- Furlong, A. Not a Very NEET Solution: Representing Problematic Labour Market Transitions among Early School-Leavers. Work Employ. Soc. 2006, 20, 553–569. [Google Scholar] [CrossRef]
- Bacher, J.; Koblbauer, C.; Leitgöb, H.; Tamesberger, D. Small Differences Matter: How Regional Distinctions in Educational and Labour Market Policy Account for Heterogeneity in NEET-Rates. J. Labour Mark. Res. 2017, 51. [Google Scholar] [CrossRef] [Green Version]
- Tamesberger, D. Can Welfare and Labour Market Regimes Explain Cross-Country Differences in the Unemployment of Young People During the Crisis? Int. Labour Rev. 2017, 156, 443–464. [Google Scholar] [CrossRef]
- Pastore, F.; Zimmermann, K. Understanding school-to-work transitions. Int. J. Manpow. 2019, 40, 374–378. [Google Scholar] [CrossRef]
- Reyneri, E.; Pintaldi, F. Dieci Domande su un Mercato del Lavoro in Crisi; Il Mulino IT: Bologna, Italy, 2013. [Google Scholar]
- Van Puyenbroeck, T.; Rogge, N. Geometric mean quantity index numbers with Benefit-of-the-Doubt weights. Eur. J. Oper. Res. 2017, 256, 1004–1014. [Google Scholar] [CrossRef]
- Rogge, N.; Self, R. Measuring regional social inclusion performances in the EU: Looking for unity in diversity. J. Eur. Soc. Policy 2019, 29, 325–344. [Google Scholar] [CrossRef]
- Cefalo, R.; Kazepov, Y. Investing over the life course: The role of lifelong learning in a social investment strategy. Stud. Educ. Adults 2018, 50, 203–218. [Google Scholar] [CrossRef]
- Dustmann, C.; Fitzenberger, B.; Schönberg, U.; Spitz-Oener, A. From Sick Man of Europe to Economic Superstar: Germany’s Resurgent Economy. J. Econ. Perspect. 2014, 28, 167–188. [Google Scholar] [CrossRef] [Green Version]
- Knuth, M. Labor market reforms and labor market performance in Germany. Int. Labor Brief. 2016, 14, 18–35. [Google Scholar]
- Székely, I.P. What difference has the EU made to the convergence process? Facets of the Faces of Convergence. In Faces of Convergence; Székely, I.P., Ed.; WIIW: Vienna, Austria, 2016; pp. 1–4. [Google Scholar]
- Andor, L. Fifteen Years of Convergence: East-West Imbalance and What the EU Should Do About it. Intereconomics 2019, 54, 18–23. [Google Scholar] [CrossRef] [Green Version]
- Di Cataldo, M.; Rodríguez-Pose, A. What drives employment growth and social inclusion in the regions of the European Union? Reg. Stud. 2017, 51, 1840–1859. [Google Scholar] [CrossRef]
- Escudero, V.; López, M.E. The European Youth Guarantee a Systematic Review of Its Implementation Across Countries; ILO Working Papers; International Labour Office: Geneva, Switzerland, 2017. [Google Scholar]
- European Commission. First Results of the Youth Employment Initiative. A Final Report to DG Employment, Social Affairs and Inclusion of the European Commission; Publications Office of the European Union: Luxembourg, 2017. [Google Scholar]
- Tosun, J.; Treib, O.; De Francesco, F. The impact of the European Youth Guarantee on active labour market policies: A convergence analysis. Int. J. Soc. Welfare 2019, 28, 358–368. [Google Scholar] [CrossRef]
- Heidbreder, E.G. Administrative Capacities in the EU. The Problem-Solving Capacity of the Modern State Governance Challenges and Administrative Capacities; Hertie Governance Report; Oxford University Press: Oxford, UK, 2014. [Google Scholar]
- Escudero, V.; Kühn, S.; Mourelo, E.L.; Tobin, S. Youth Labour Market Prospects and Recent Policy Developments. In European Youth Labour Markets; Malo, M.A., Mìnguez, A.M., Eds.; Springer: Cham, Switzerland, 2018; pp. 7–26. [Google Scholar]
- Pastore, F. Why so slow? The school-to-work transition in Italy. Stud. High. Educ. 2019, 44, 1358–1371. [Google Scholar] [CrossRef] [Green Version]
- European Commission. Cohesion Policy at Work, The 7th Report on Economic, Social and Territorial Cohesion; Publications Office of the European Union: Luxembourg, 2017. [Google Scholar]
- Storper, M. Separate Worlds? Explaining the Current Wave of Regional Economic Polarization. J. Econ. Geogr. 2018, 18, 247–270. [Google Scholar] [CrossRef]
- Gill, I.S.; Raiser, M. Golden Growth: Restoring the Lustre of the European Economic Model; Overview; World Bank Group: Washington, DC, USA, 2012. [Google Scholar]
- Ridao-Cano, C.; Bodewig, C. Growing United: Upgrading Europe’s Convergence Machine; Overview; World Bank Group: Washington, DC, USA, 2018. [Google Scholar]
- Goodwin, M.J.; Heath, O. The 2016 referendum, Brexit and the left behind: An aggregate-level analysis of the result. Political Q. 2016, 87, 323–332. [Google Scholar] [CrossRef]
Figure 1.
Matrix scatterplots of YLMI with selected economic, labor market, and education indicators. Source: Authors’ own elaboration on Eurostat data.
Figure 1.
Matrix scatterplots of YLMI with selected economic, labor market, and education indicators. Source: Authors’ own elaboration on Eurostat data.

Figure 2.
YLMI in 2005 and 2018: YLMI composite index scores for the European Union (EU) NUTS-2 regions. Source: Authors’ own elaboration on Eurostat data.
Figure 2.
YLMI in 2005 and 2018: YLMI composite index scores for the European Union (EU) NUTS-2 regions. Source: Authors’ own elaboration on Eurostat data.

Figure 3.
YLMI changes between 2005 and 2018: YLMI composite index scores for the EU NUTS-2 regions. Source: Authors’ own elaboration on Eurostat data.
Figure 3.
YLMI changes between 2005 and 2018: YLMI composite index scores for the EU NUTS-2 regions. Source: Authors’ own elaboration on Eurostat data.


Table 1.
Summary statistics of the observed variables (subindicators) of youth labor market integration (YLMI), European Union (EU) NUTS-2 regions. Source: Authors’ own elaboration on Eurostat data. SD, standard deviation.
Table 1.
Summary statistics of the observed variables (subindicators) of youth labor market integration (YLMI), European Union (EU) NUTS-2 regions. Source: Authors’ own elaboration on Eurostat data. SD, standard deviation.
| Indicators | Age Reference | Dimension | Mean | SD | Min | Max |
|---|---|---|---|---|---|---|
| Employment Rate, ISCED 3–4 | 20–34 years | Access | 77.04 | 9.45 | 32.1 | 100 |
| Employment Rate, ISCED 5–8 | 20–34 years | Access | 84.98 | 8.90 | 38.9 | 100 |
| Employment Rate After 3 Years, ISCED 3–4 | 20–34 years | Time-to-job | 68.03 | 16.44 | 15 | 100 |
| Employment Rate After 3 Years, ISCED 5–8 | 20–34 years | Time-to-job | 79.91 | 13.42 | 24.8 | 100 |
| Youth Unemployment Ratio | 15–24 years | Exclusion | 21.73 | 12.15 | 3.4 | 79.2 |
| NEET Rate | 18–24 years | Exclusion | 12.06 | 5.69 | 2 | 42.6 |
Table 2.
Correlation matrix of YLMI with selected economic, labor market, demographic, and education indicators. Source: Authors’ own elaboration on Eurostat data. GDP, gross domestic product.
Table 2.
Correlation matrix of YLMI with selected economic, labor market, demographic, and education indicators. Source: Authors’ own elaboration on Eurostat data. GDP, gross domestic product.
| YLMI | GDP, PPP | Employment 15–64 | Employment 25–34 | Employment 20–64 | At Risk of Poverty | Full-Time Job 15–64 | Tertiary-Educated 25–64 | Population 30–34 | |
|---|---|---|---|---|---|---|---|---|---|
| YLMI | 1 | ||||||||
| GDP, PPP | 0.3964 | 1 | |||||||
| Employment 15–64 (%) | 0.8419 | 0.5134 | 1 | ||||||
| Employment 25–34 (%) | 0.8491 | 0.4045 | 0.8179 | 1 | |||||
| Employment 20–64 (%) | 0.8472 | 0.528 | 0.9922 | 0.8123 | 1 | ||||
| At risk of poverty (%) | –0.5805 | –0.6249 | –0.7139 | –0.6335 | –0.7005 | 1 | |||
| Full-time job 15–64 (%) | –0.5026 | –0.5405 | –0.6139 | –0.548 | –0.5718 | 0.2637 | 1 | ||
| Tertiary-educated 25–64 (%) | 0.3044 | 0.5019 | 0.4018 | 0.3062 | 0.3714 | –0.3455 | –0.3347 | 1 | |
| Population 30–34 (%) | –0.145 | 0.097 | –0.374 | –0.291 | –0.355 | –0.051 | 0.557 | 0.034 | 1 |
Table 3.
Average of the YLMI composite index scores for the 15 best- and worst-performing NUTS-2 regions in the period 2005–2018, as well as the variation over the period and the score in 2018. Source: Authors’ own elaboration on Eurostat data.
Table 3.
Average of the YLMI composite index scores for the 15 best- and worst-performing NUTS-2 regions in the period 2005–2018, as well as the variation over the period and the score in 2018. Source: Authors’ own elaboration on Eurostat data.
| EU Region | Country | YLMI 2018 | YLMI Var. 2018–2005 | YLMI Avg. 2005–2018 | |
|---|---|---|---|---|---|
| NL31 | Utrecht | Netherlands | 0.863 | −0.055 | 0.968 |
| NL34 | Zeeland | Netherlands | 0.900 | −0.019 | 0.959 |
| NL41 | Noord-Brabant | Netherlands | 0.880 | −0.057 | 0.956 |
| NL22 | Gelderland | Netherlands | 0.894 | −0.046 | 0.956 |
| NO06 | Trøndelag | Norway | 0.872 | 0.031 | 0.943 |
| NO01 | Oslo og Akershus | Norway | 0.830 | 0.011 | 0.939 |
| NL32 | Noord-Holland | Netherlands | 0.893 | −0.057 | 0.939 |
| NL21 | Overijssel | Netherlands | 0.849 | −0.088 | 0.939 |
| AT31 | Oberösterreich | Austria | 0.886 | −0.019 | 0.938 |
| AT33 | Tirol | Austria | 0.878 | 0.023 | 0.938 |
| DE21 | Oberbayern | Germany | 0.892 | 0.043 | 0.938 |
| DE14 | Tübingen | Germany | 0.866 | −0.035 | 0.935 |
| BE25 | Prov. West-Vlaanderen | Belgium | 0.898 | −0.102 | 0.935 |
| NL13 | Drenthe | Netherlands | 0.871 | −0.088 | 0.934 |
| AT32 | Salzburg | Austria | 0.891 | 0.039 | 0.933 |
| ES61 | Andalucía | Spain | 0.452 | −0.082 | 0.428 |
| EL51 | Anatoliki Makedonia T. | Greece | 0.411 | −0.009 | 0.422 |
| EL63 | Dytiki Ellada | Greece | 0.317 | −0.103 | 0.414 |
| EL65 | Peloponnisos | Greece | 0.402 | −0.023 | 0.402 |
| ITF2 | Molise | Italy | 0.266 | −0.112 | 0.393 |
| EL54 | Ipeiros | Greece | 0.267 | −0.149 | 0.377 |
| EL64 | Sterea Ellada | Greece | 0.321 | −0.038 | 0.360 |
| EL53 | Dytiki Makedonia | Greece | 0.122 | −0.151 | 0.322 |
| ITG2 | Sardegna | Italy | 0.279 | −0.034 | 0.314 |
| BG31 | Severozapad | Bulgaria | 0.561 | 0.196 | 0.298 |
| ITF5 | Basilicata | Italy | 0.211 | 0.059 | 0.296 |
| ITF4 | Puglia | Italy | 0.222 | 0.122 | 0.236 |
| ITF3 | Campania | Italy | 0.077 | −0.067 | 0.120 |
| ITF6 | Calabria | Italy | 0.019 | 0.013 | 0.098 |
| ITG1 | Sicilia | Italy | 0.028 | −0.039 | 0.076 |
© 2020 by the authors. Licensee MDPI, Basel, Switzerland. This article is an open access article distributed under the terms and conditions of the Creative Commons Attribution (CC BY) license (http://creativecommons.org/licenses/by/4.0/).
Share and Cite
MDPI and ACS Style
Cefalo, R.; Scandurra, R.; Kazepov, Y. Youth Labor Market Integration in European Regions. Sustainability 2020, 12, 3813. https://doi.org/10.3390/su12093813
AMA Style
Cefalo R, Scandurra R, Kazepov Y. Youth Labor Market Integration in European Regions. Sustainability. 2020; 12(9):3813. https://doi.org/10.3390/su12093813
Chicago/Turabian StyleCefalo, Ruggero, Rosario Scandurra, and Yuri Kazepov. 2020. "Youth Labor Market Integration in European Regions" Sustainability 12, no. 9: 3813. https://doi.org/10.3390/su12093813
Note that from the first issue of 2016, this journal uses article numbers instead of page numbers. See further details here.