Expert Consensus Versus Statistical Techniques in the Delimitation of Tourism Destinations


1
Chair in Tourism CajaCanarias-Ashotel, University of La Laguna, 38200 La Laguna, Spain
2
Department of Applied Economics and Quantitative Methods, University of La Laguna, 38200 La Laguna, Spain
*
Author to whom correspondence should be addressed.
Sustainability 2020, 12(6), 2540; https://doi.org/10.3390/su12062540
Submission received: 29 February 2020
/
Revised: 16 March 2020
/
Accepted: 18 March 2020
/
Published: 24 March 2020
(This article belongs to the Section Sustainable Urban and Rural Development)
Abstract
:Delimitation of the boundaries of local tourism destinations has been proposed as a useful tool to obtain spatially-detailed statistical information to improve their decision-making and management. In the case of the Canary Islands, a leading tourism region, expert consensus supported by criteria based on supply characteristics has been used to set the boundaries of local destinations. This paper aims to analyse the characteristics of these established local destinations and test if statistical methods may provide better or different results than expert consensus from the perspective of destinations’ internal homogeneity and the differences between them. After applying descriptive and analytical statistical methods, the results confirm the evidence found in other delimitation exercises in social sciences. The consensus of experts, or subjectivity, provides consistent results that are, by and large, confirmed by statistical analysis. While statistical methods can provide new insights for delimitation, pure statistical methods can sometimes be misleading if stakeholders’ knowledge is not considered.
1. Introduction
This article is the result of a research problem that is becoming increasingly relevant in the field of tourism. It concerns the measurement of tourism at a local level for decision making. The contribution of the local focus in tourism has been addressed by researchers such as Dredge [1], Lew and Mckercher [2], and Pearce [3], who highlight the importance of the local destination as a unit of analysis. In fact, Candela and Figini [4]) consider the tourism destination as the most relevant concept in tourism economics.
Tourism is an activity with a high spatial concentration of supply. However, this does not give it a distinctive character with respect to other economic activities. In fact, an analysis carried out by the World Travel and Tourism Council (WTTC) [5] shows that the concentration of establishments in the tourism industry in the United Kingdom is, in fact, lower than in other activities such as the automobile industry or financial services. What is particularly characteristic and singular of tourism is that demand is concentrated. A significant part of tourism consumption is carried out in areas with a high concentration of tourism activities, i.e., tourism destinations, where supply and demand converge in a specific territory. The recent debate on overtourism [6] sets the focus on the identification of these local areas from which information for sustainable management and planning is lacking.
In this way, in tourism, not only do companies compete, but so do destinations [4] and, as a consequence, the management of tourism destinations through destination management organizations is one of the determinants of competitiveness. In addition, in the current context of competition, increasingly based on innovation and knowledge, the role of statistical information is central to making the right decisions at the right time [7].
Despite the relevance of destination design for planning in tourism, there are very few studies in which methodologies are proposed and results are provided on the identification and delimitation of tourism destinations at a local scale. However, some time ago, the UNWTO [8] had already highlighted the importance of delimiting tourism destinations. The causes of this anomalous lack of analysis can be diverse. On the one hand, it is likely the origin lies in the divergence of interests between academia and decision-makers at the local scale. On the other hand, the development of tourism statistics at an international level has been conditioned by a macro vision, the country level, which has limited the expansion of statistics at the subnational and, particularly, at the local scale. However, the delimitation of functional areas in social sciences is a field with over four decades of research, from the outstanding contribution of Suttles [9] to the later contributions of Flowerdew et al. [10], Coulton et al. [11], and Cutchin et al. [12]. This delimitation research has been a relevant frame of reference for this study.
One of the few references on delimitation in the field of tourism is the research carried out by Hernández-Martín et al. [13]. The authors developed a methodology for the delimitation of local tourism destinations; these areas were identified based on the consensus of experts in tourism supported by some criteria. This methodology was first applied and checked in the tourism municipalities of Adeje and Arona, in the south of Tenerife, Canary Islands. It has been used since 2015 by the Institute of Statistics of the Canary Islands (ISTAC) that produces regular statistical information for 47 micro-destinations or local destinations.
This article aims to statistically test the results obtained by defining tourism local destinations used by ISTAC [13], as well as proposing some changes in their delimitation, if necessary. These authors define a local tourism destination as “a spatial unit of statistical analysis characterized by a high density of typical tourism establishments, homogeneous statistical tourism information, and a spatial continuity”.
The article is organized as follows. The academic literature is reviewed in the next section. Subsequently, the methodology employed for the statistical analysis of local destinations is explained. The following section is devoted to the statistical techniques used in the identification of tourism areas. After this, the results obtained for the municipalities of Adeje and Arona, in the South of Tenerife, are explained. Finally, we hold a discussion of the results and highlight the main conclusions.
2. Research Foundations
This research includes two main topics: Tourism destinations as a unit of analysis and the delimitation of functional areas for both tourism purposes and in social sciences in general.
2.1. Tourism Destinations as Units of Analysis
In order to define the concept of a local tourism destination or tourism micro-destination, we must first define what a tourism destination is. This is not a simple task if we bear in mind that, despite being one of the main concepts in tourism analysis, researchers and tourism organizations have not yet agreed on its definition [4,14]. The use of the term destination in the International Recommendations for Tourism Statistics [15] does not provide much support to clarify the precise scope of the concept, simply identifying the main destination of the trip as the place where tourists pass the most of their time.
Many researchers in the field of tourism define a destination as a mere geographical area (a city, a region, or a country) that is the main objective of the visitor [16,17]. Other studies go further and include in their definitions resources and tourism supply. Kim [18] considers a destination as a unique complex product that contains climatic conditions, infrastructures, superstructure, services, nature, and culture. Along the same lines, Buhalis [19], Cooper et al. [20], Murphy, Pritchard, and Smith [21] have defined a destination as an amalgam of products, services, and facilities available in one place, which are designed to meet tourists’ needs. Gunn and Var [22] highlight the relevance of visitor attractions and activities at a destination (Table 1).
Tourism experiences have also played an important role in defining a tourism destination. Bornhorst, Ritchie, and Sheehan [23] define a destination as a " geographical region which contains a sufficiently critical mass or cluster of attractions so as to be capable of providing tourists with experiences that attract visitors to the destination for tourism purposes". Similarly, Murphy et al. [21] and Buhalis [19] consider that a destination is a combination of tourism products that offer tourists an integrated experience of the area visited.
Other researchers emphasize that destinations are networks by nature, open systems where different stakeholders interact. Destinations, under this approach, can be seen as clusters or industrial districts [4,24,25,26]. Along the same lines, Jackson and Murphy [27] describe a destination as a conglomerate of competing and collaborating companies, generally working together in an associated way in an attempt to successfully promote the destination.
A destination is increasingly recognized as a perceptual concept that is related to tourists’ subjectivity [19]. For tourists, a destination can be a city, a country, or a continent, or simply the hotel or the ship where they stay or take a cruise. Certain famous attractions (Disney World, the Palace of Versailles, or the Inca Ruins of Machu Picchu) can provide those who visit them with such experiences that they can be considered a destination in themselves [23]. In summary, a destination can be defined at any scale, be it a country or a region, a town or a city, or even a tourist attraction [28].
So far, few authors have addressed the definition of destination from a local perspective. Dredge [1] refers to this type of tourism area as a sub-destination; the United Nations World Tourism Organization [28] and Lew and McKercher [2] use the concept of local destination; and INRouTe and UNWTO [29] refer to this type of area as a local micro destination.
Lew and McKercher [2] consider that a local destination can be defined as "the area containing the products and activities that could normally be consumed in a day trip from the heart of the destination and that are normally promoted by the destination as part of its overall suite of products". Dredge [1] goes further and addresses the question of the existence of destinations within destinations, defining local sub-destinations as clusters of attractions and services. Likewise, the UNWTO [28] considers that local destinations can be joined to form larger destinations. The importance of tourism analysis at the local level has also been highlighted by Weidenfeld et al. [30], who point out that the study of clusters in tourism has been approached from a macro-regional level and not from within a local tourism production system where companies create synergies. In summary, the concept of destination at a local scale is not sufficiently clear, and as a consequence, delimiting local destinations is far from being an easy task. However, it is a very necessary one for statistical purposes related to decision making for sustainability and planning purposes, particularly if we work under the assumption that tourism areas, even within a municipality, can vary greatly in their tourist indicators and attributes.
In this study, the concept of local destination is defined as a small functional area that is highly dependent on tourism. This unit is composed of a wide range of tourist facilities and has a distinct image and tourist typology (tourism products). A local destination must also be a useful individual unit for decision-making in tourism management and planning. For a more operational definition, it can be said that a micro-destination or a local tourism destination is a spatial unit of statistical analysis characterized by a high density of establishments from tourism characteristic industries, homogeneous tourism statistical information, and spatial continuity [13].
2.2. Delimiting Functional Areas in Social Sciences
To the extent that this study aims to contribute to methodological developments in the delimitation of local tourism destinations, it is necessary to provide a synthesis of previous research on a similar problem, although with other purposes. In the scientific literature on the delimitation of geographical areas in the field of social sciences, there are not many studies that have identified internally homogeneous areas in terms of certain characteristics, but heterogeneous with respect to adjacent areas. However, in some specific disciplines, there is a certain tradition of delimitation of such functional geographic areas.
These initiatives have been accomplished mainly in the fields of sociology, public health, urban planning, and geography and have delimited areas within cities, in some cases neighbourhoods, for certain research purposes. These functional areas have been identified in the literature based on nine main criteria: The most repeated is subjectivity and consensus, both of the authorities and of local stakeholders [9,10,11,31], followed by physical and social barriers [9,10,12,31], pre-established limits [9,32], homogeneity of population or household characteristics [10,31,33,34], land use [1,9,12], research purposes [1,10,32], size [10,35,36], and spatial continuity [10,12,31].
In the literature on defining and delimiting neighbourhoods, there are multiple trends and methods. Deng [37] identified six categories in which neighbourhood identification and delineation methods are grouped by: perceptual-based methods, which delineate neighbourhoods based on residents’ mental maps; the physical limits, that is, geographical features, streets, etc.; inference; pre-existing zones, such as census blocks, administrative or electoral districts, municipalities, etc.; and aggregate limits and automated zone design, which involves the automation of the neighbourhood delimitation process through criteria specified by stakeholders. In this work, we follow Deng [37] in highlighting the importance in the literature of methods based mainly on perception, in pre-existing zones and in the design of automated zones, as well as in the combination of several of them. We also consider methods that focus on different attributes of local population, households, etc., as well as those that focus on the social relationships that occur in the territory.
Regarding methods of delimitation of neighbourhoods based on attributes, it is worth mentioning the contribution of Galster [38], who defined the neighbourhood as a set of spatial attributes associated with residence groupings, sometimes together with other land uses. Spielman and Logan [34] conceptualized neighbourhood in terms of space and social composition, defining it as a contiguous territory characterized by a bundle of social attributes that distinguish it from the surrounding areas. They specified that the boundaries of neighbourhoods are defined by changes in the set of attributes between adjacent territories. In contrast to the vast majority of works on neighbourhood delimitation, the authors considered that neighbourhoods were not mutually exclusive, that is, one location could be in several neighbourhoods at the same time. The authors defined the neighbourhood from its core to its edges, where the central areas belonged unequivocally to a single thematic unit, but the marginal areas were often associated with multiple thematic units. Other research into neighbourhood delimitation emphasizes social relations. Hipp, Faris, and Boessen [39] created neighbourhoods based on social ties density and physical distance among adolescents, obtaining networks that show considerable spatial continuity.
Numerous authors highlighted, when identifying neighbourhoods, the importance of mental maps that are made by neighbours, that is, by subjectivity. In this sense, Chaskin [32] considered that neighbourhoods are recognizable and definable, but that the delimitation of their borders is a negotiated and imperfect process, and is often influenced by political considerations. For the author, neighbourhoods are spatial constructions that give rise to spatial units where residents share certain circumstances. In the paper, Chaskin considered that neighbourhoods’ boundaries are drawn by individuals; how they move and relate to their environment, and mental maps that they build from this. The construction of these mental maps is influenced by different aspects, such as: physical elements of the city, built roads (streets, public transportation routes, etc.), and physical barriers (walls, viaducts, rivers); and social and functional elements (demography, presence of important institutions, perception of safety or risk, and relative location and functional opportunities). According to the author, the construction of these limits depends on the degree of importance that each individual gives to the characteristics that define the neighbourhood. In this research, four particularly important dimensions were identified: the neighbourhood as a spatial unit where multiple activities occur; the neighbourhood as a set of social relationships; the neighbourhood defined by its relation to one or more activities; and the neighbourhood as a symbolic unit with a name and a recognized identity.
There are different studies that compared neighbourhoods identified by subjectivity or mental maps of individuals, with other areas generated automatically by computer software used in the application of certain methodologies. Haynes, Daras, Reading, and Jones [40] compared 101 areas designed automatically by technicians from the City of Bristol (England) with those resulting from residents’ subjectivity. In 1994, the Planning Department of Bristol City Council divided the city into 101 small areas and, after many consultations, agreed that they best represented local communities. These areas were the result of adding several census districts, so that they would optimize social and environmental characteristics homogeneity, meeting a minimum population threshold. The authors affirmed that, although automated design of zones is apparently objective, actually, each new delimited zone is the result of the application of a set of criteria specified by the researcher, so, far from defining an optimal set of neighbourhoods, this method offered an infinite number of possibilities. This paper concluded that the areas generated by means of computer programming can be approximated, once the appropriate rules have been identified, to those resulting from the application of local knowledge and consultation.
Another study in which authors identified neighbourhoods automatically was carried out by Clapp and Wang [36] within the framework of research into real estate markets. In this work, the authors defined neighbourhoods as geographic areas that contain similar populations and real estate markets with a certain degree of homogeneity. They identified the optimal number of neighbourhoods through a hedonic model that used information relating to individual home sale transactions and the addresses of these dwellings. They applied the criteria of identification of submarkets of Goodman [41] to the case of neighbourhood delimitation. These criteria are homogeneity, similarity in some important dimension like housing and/or demographic characteristics; parsimony, in a given area where the least number of possible neighbourhoods is preferred; and contiguity.
Similarly, Cutchin et al. [12] used a theoretically informed combination of qualitative GIS and field observations to estimate neighbourhood boundaries in Texas City, Texas, using an innovative methodology to address this problem, termed the method of Socio-spatial neighbourhood estimation (SNEM). As a result, they concluded that the SNEM approach to operationalization could improve neighbourhood-based inferences.
The literature contains a variety of research that uses pre-existing areas for new neighbourhood creation. An example is the work of Riva et al. [33], who evaluated the strength of census districts as units of analysis in the field of public health, more specifically in measuring the potential of active life. These areas should be homogeneous with regard to socioeconomic conditions but heterogeneous with respect to other environmental characteristics. From the data available at the lowest level of the census area, homogenous zones were designed according to three indicators of active life potential, that is, population density, land use mix, and accessibility to services. These zones were the result of grouping census areas into seven groups or types of environment.
In this context, Coulton et al. [11] used neighbourhood units based on maps drawn by residents and compared the results with neighbourhood census definitions. This study found that research based solely on neighbourhoods defined by census may not properly consider the effects of neighbourhoods, as the actual conditions affecting residents are not accurately represented within the census boundaries.
Many authors consider that defining and identifying neighbourhoods must take into account multiple factors. In this sense, Milbrath and DeGuzman [42], who analysed the evolution of the neighbourhood concept from the perspective of nursing research, stated that in order to identify neighbourhoods, an integrated approach should be adopted that considers geographic characteristics, political influences, interactions, and group identity.
As in our research, many studies define neighbourhoods for statistical purposes. This is the case of Flowerdew et al. [10], who built a zonal system for the publication of statistics at the neighbourhood scale in Scotland. For the construction of these zones, they used the following criteria: population size, compactness of their shape, population homogeneity in terms of social and economic variables, and elements of the physical and social environment that can affect the degree of significance of the zones for the local population. The need for human intervention was highlighted given the subjective nature of the areas identified therein. In that research, a consultation process was carried out to consider local authorities’ opinions. The consultation consisted of sending the draft of the zones identified to these authorities for comments and suggestions. The authorities then proposed specific changes, some important, sometimes suggesting their own areas. Changes that did not violate the principles used were incorporated.
However, there are few zoning examples in the literature related to tourism. In this sense, it is worth highlighting the contributions of Dredge [1], who dealt with tourism destination spatial design; Vasiliadis and Kobotis [43], who analysed tourist attraction groupings in Macedonia; and Chhetri and Arrowsmith [44], who identified areas with high recreational potential in Australia. Lew and Mckercher [2] or Pearce [3,45] also highlighted the importance of local destinations as units of analysis in tourism. In addition, Hernández-Martín et al. [13] developed a methodology for the delimitation of local tourism destinations.
Dredge [1] addressed destination spatial design and tried to improve the conceptualization of basic elements of destination regions using modelling based on existing models and concepts. This research integrated tourism into land use planning. The research was carried out at a local or regional level, a difference in market-oriented tourism planning that is generally done at a regional or higher scale. This work proposed a spatial model for planning and design of destination regions. It was intended to be applicable to different destinations and scales. This planning and design model consisted of a destination region, source markets, nodes, districts, circulation routes, and footbridges.
Blasco et al. [35] proposed a method to identify alternative tourism areas based on consumption. This method combined geographic information systems with hierarchical clustering techniques, based on space-time distance, in the Pyrenees. With the proposed method, larger areas were divided into small local tourism destinations, which might otherwise be difficult to detect. It was argued that these smaller areas have a range of distances within the destination, which, in the context of the development of tourism in mountain regions, are better adapted to the hub-and-spoke mobility pattern.
2.3. Delimiting Local Tourism Destinations in the Canary Islands
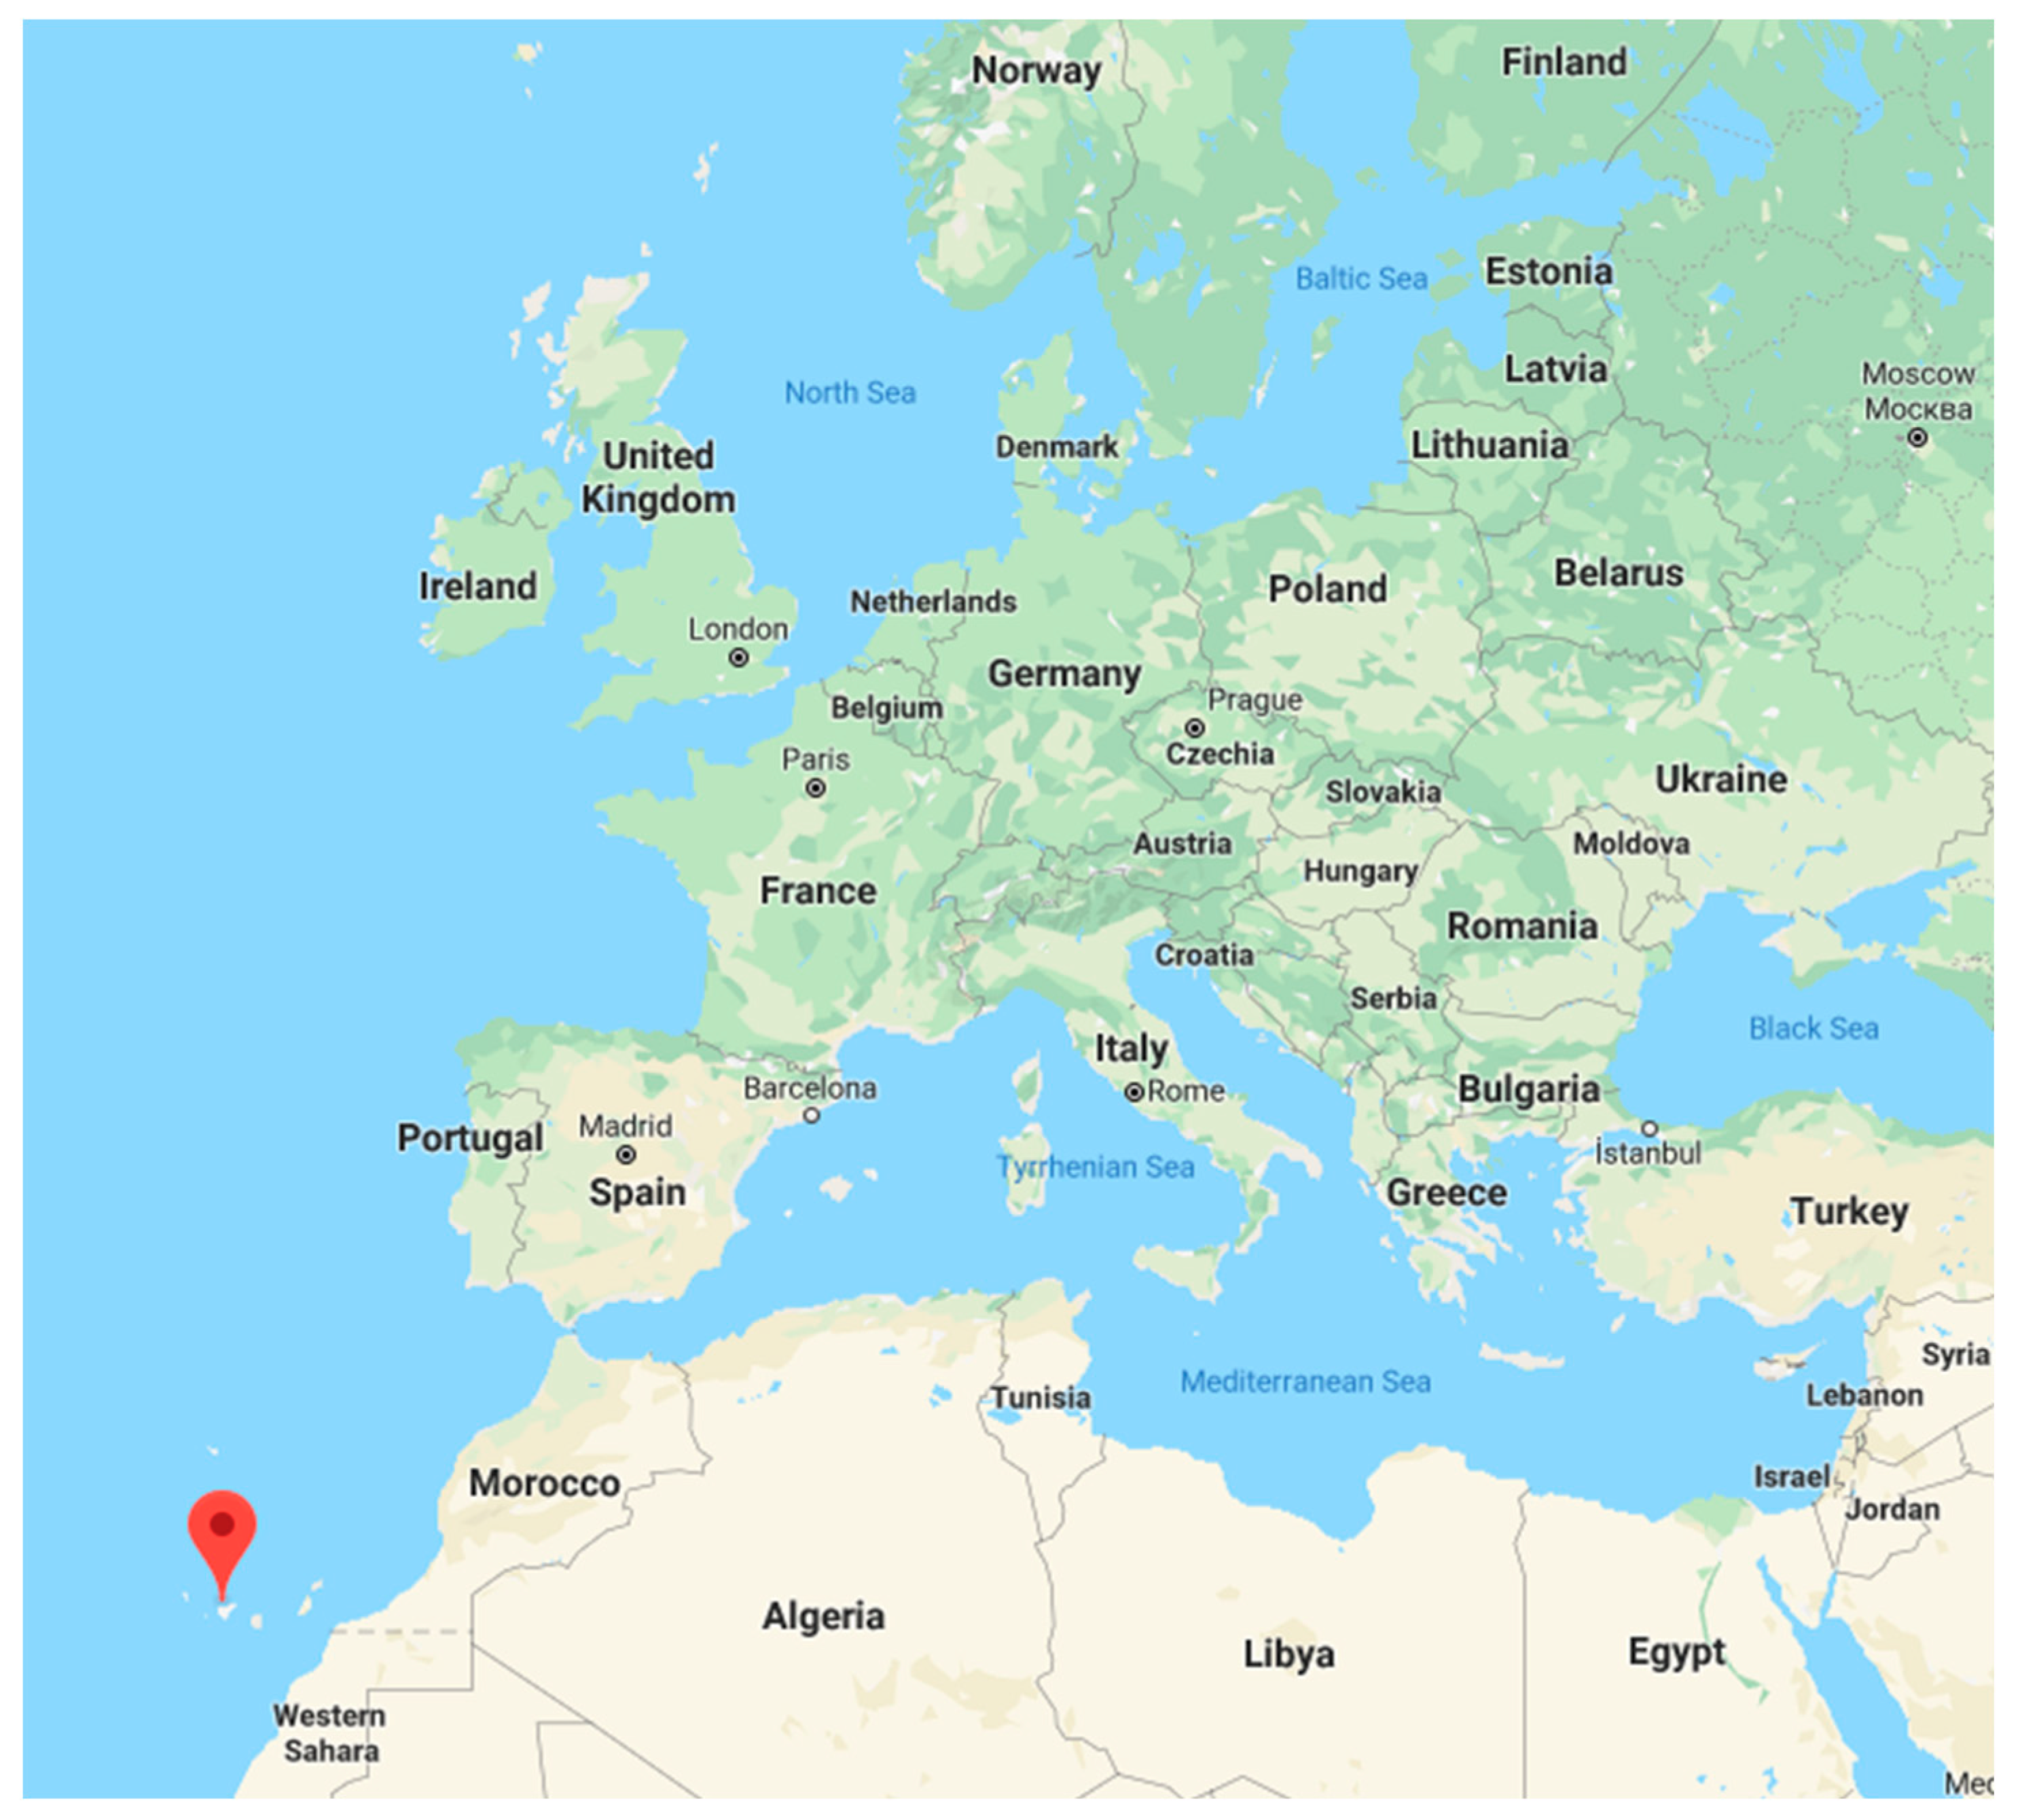
As can be seen throughout the previous subsection, there are multiple examples of delimitation of functional areas with specific purposes in different branches of the social sciences. All these references help to design the criteria and methodology used to identify local tourism destinations, as well as geospatial statistical techniques to determine the internal characteristics of the identified areas. This paper statistically tests the results obtained by defining tourism local destinations in the Canary Islands, as well as proposing some changes in their delimitation, if necessary. The Canary Islands is a leading tourism region within the European Union that receives around 15 million visitors every year. The islands’ tourism development is dependent on their mild weather throughout the year, with low seasonal variations, and they are located in the Atlantic Ocean, close to the African Coast, as shown in Figure 1.
The tourism functional areas already defined in the Canary Islands for statistical purposes are based on the consensus of experts in tourism supported by criteria on the characteristics of tourism supply in general and accommodation in particular. These experts rely on the relevance of statistical information that helps them make informed decisions about the boundaries of these functional areas. This consensus has solid foundations in the prior knowledge of these experts to give rise to new robust functional areas, which have the support of stakeholders involved in their identification. The aforementioned experts based their proposal on six main criteria for delimiting local tourism destinations. These criteria [13] were: (1) concentration of establishments from tourism characteristic industries; (2) homogeneity of tourism typologies and tourism supply; (3) stability of boundaries over time; (4) dynamism and flexibility; (5) feasibility and relevance; (6) public and private support.
These criteria were applied in a sequential process over three phases. Firstly, tourism areas were delimited in a process in which the objective was to distinguish between tourism areas and either non-tourist areas or areas where tourism concentration or density was low. Secondly, each tourism area generated one or several local destinations, which depended on the possibility of splitting them into more than one relevant, viable, and differentiated micro-destination. Therefore, a continuous tourism area can include one or more local tourism destinations. The basic criterion to delimit tourism areas is the concentration of tourism characteristic activities, while the basic criterion to split a tourism area is the homogeneity of tourism products and tourism supply in each micro-destination. Finally, the local destinations obtained must be checked to analyse if they fulfil the next four criteria: stability, dynamism-flexibility, feasibility-relevance, and support. If they do not fulfil these requirements, the process of delimitation must start again from the beginning.
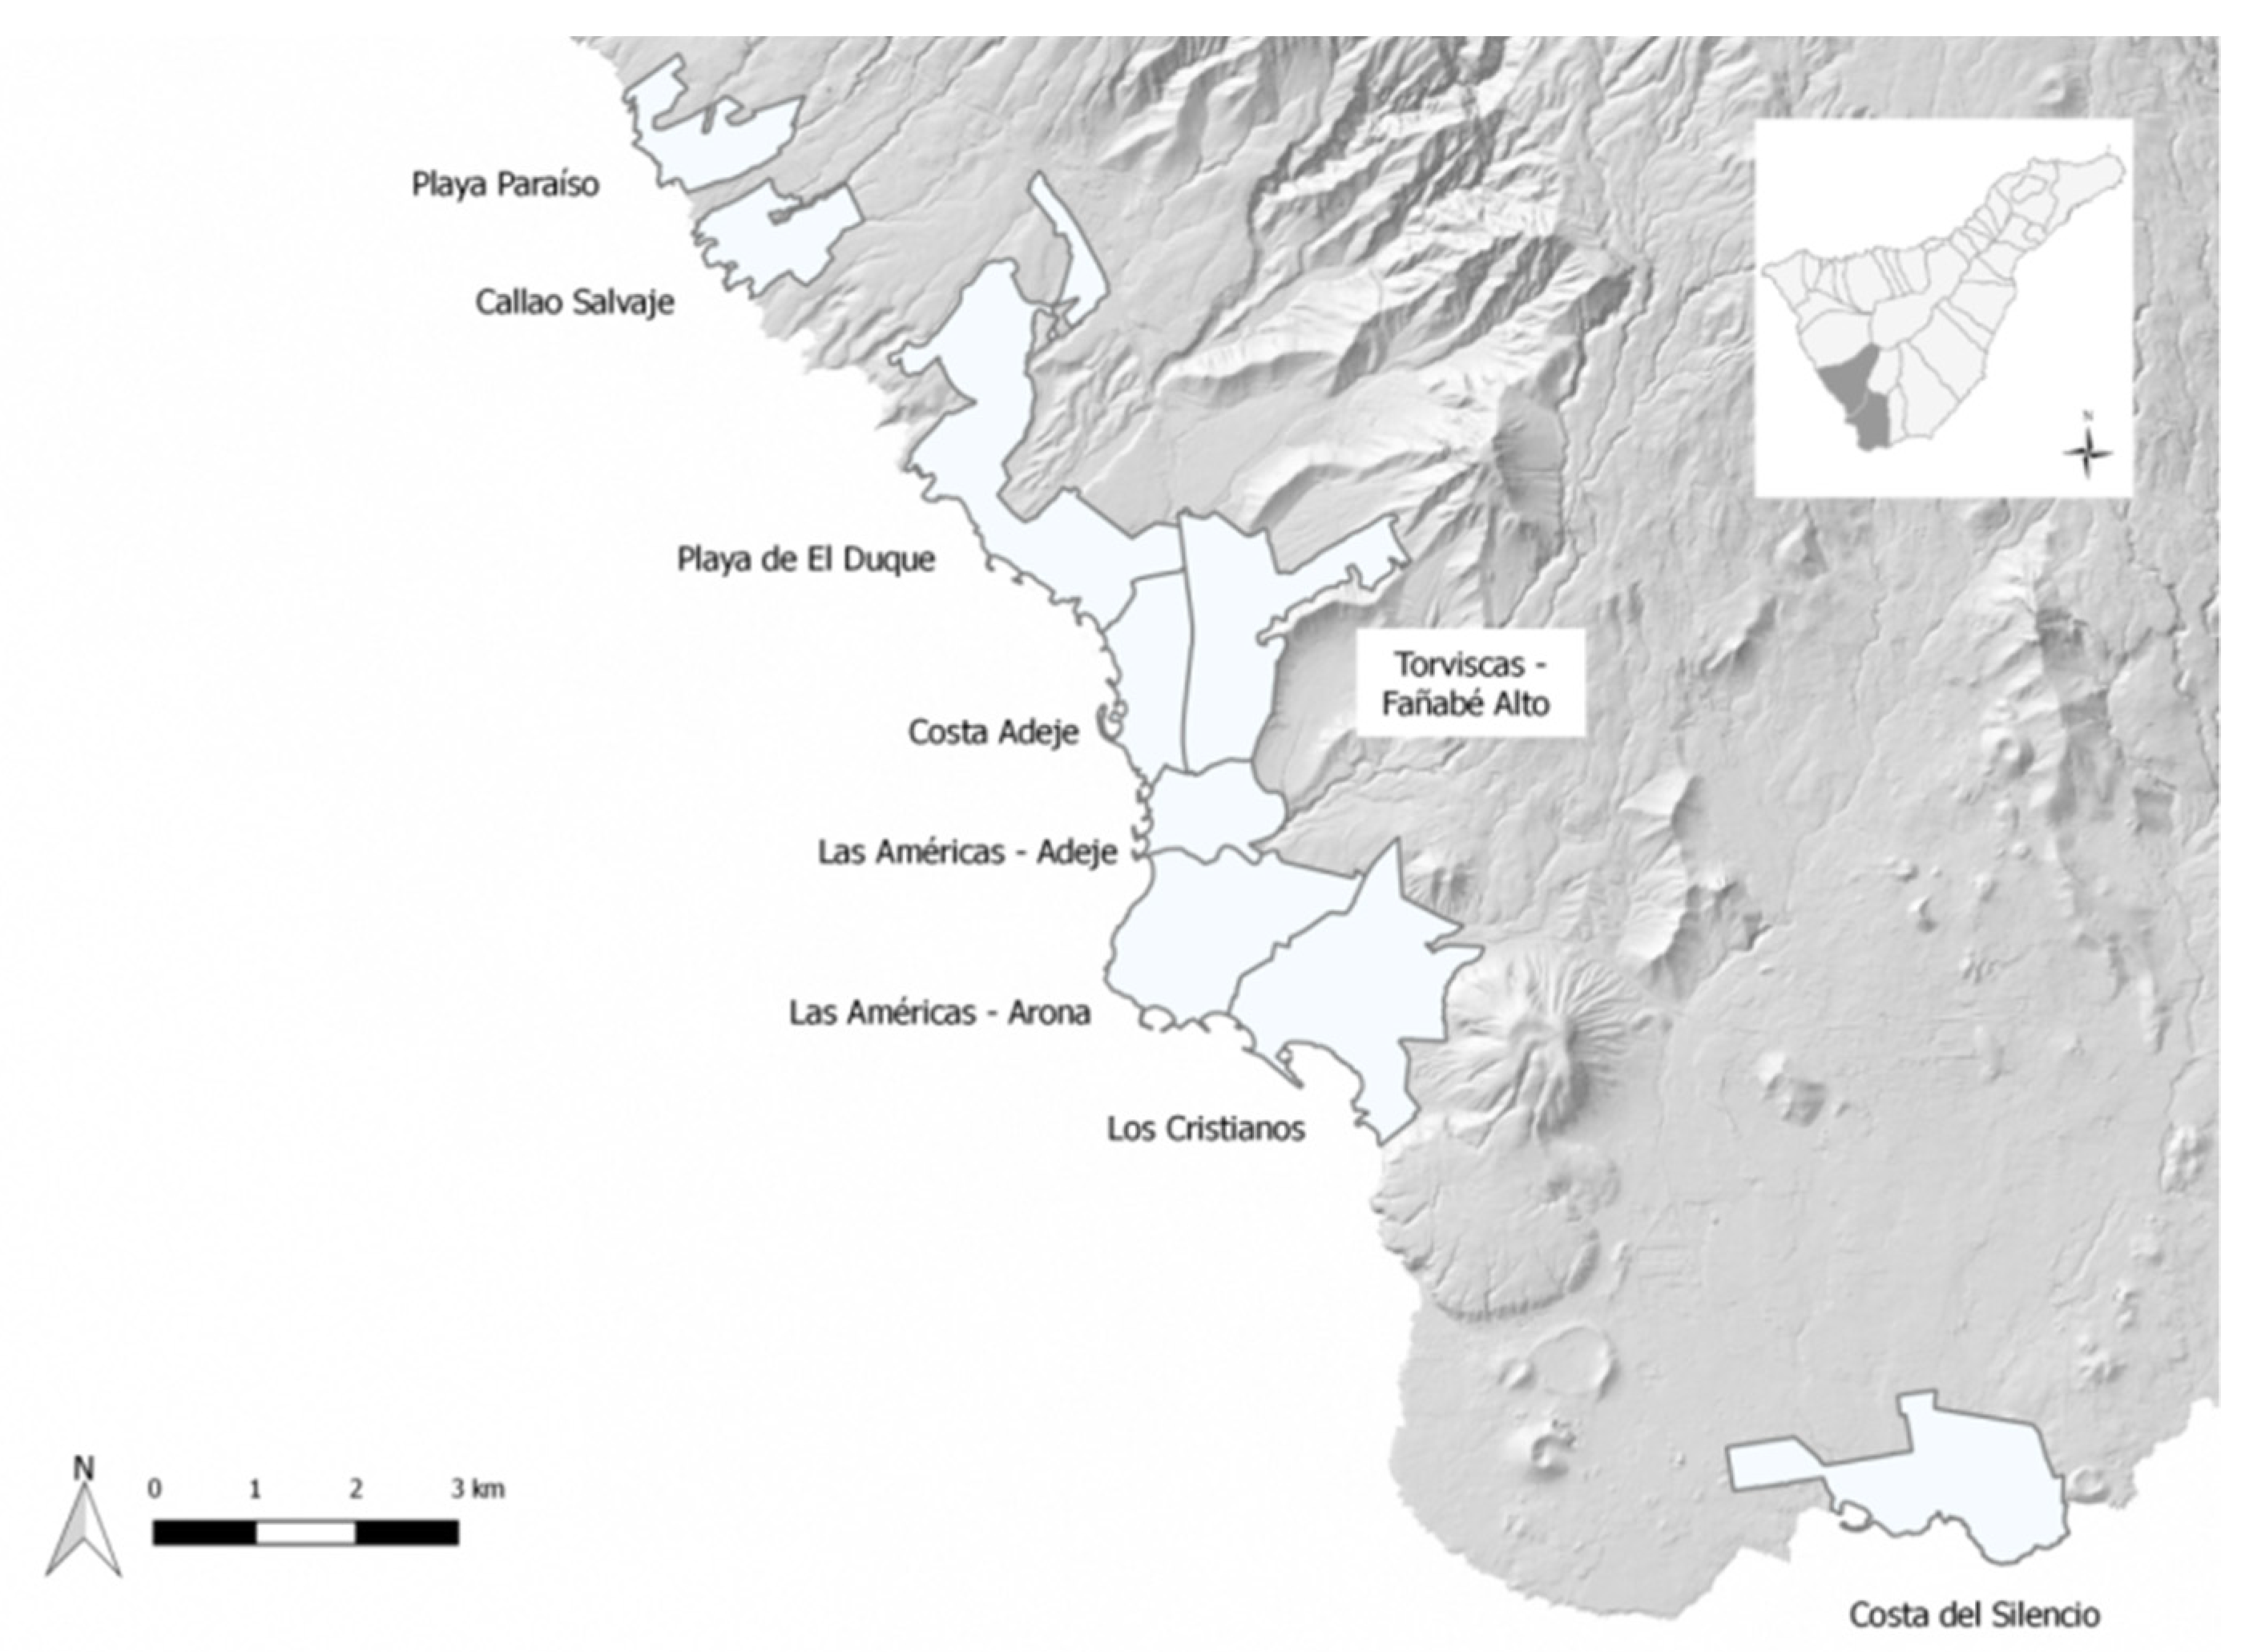
After the application of this methodology, from expert consensus, in the municipalities of Adeje and Arona in the South of Tenerife, nine tourism local destinations were identified (Figure 2). These areas are, from north to south: Callao Salvaje, Playa Paraíso, Playa de El Duque, Costa Adeje, Torviscas and Fañabé Alto, Las Américas—Adeje, Las Américas—Arona, Los Cristianos, and Costa del Silencio.
For these local tourism destinations, a series of indicators were obtained. The results highlight the differences in the figures of each of the local destinations, even in the case of bordering areas. It can also be observed that the municipal averages are often far different from the figures of these smaller areas. This is clear in Table 2, below. Since 2015, the Canary island Statistical Office (ISTAC) has published tourism indicators for these Canary Island local tourism destinations.
As stated previously, in this study, we statistically analyse local tourism destinations delimited in the Canary Islands [13] to check if these areas identified by experts meet key criteria, mainly the criteria of internal homogeneity.
3. Methodology
This study examines the degree of homogeneity of the identified local destinations regarding certain characteristics, and alternative grouping proposals are made, if necessary. To do this, a geo-referenced database has been created that contains, among other things, the following information for tourism accommodation establishments in the Canary Islands: the age of the establishments; there is no variable that defines the construction model in itself, but based on the available data, it has been considered appropriate to use the surface area of the plot, the built or constructed area, and the number of floors as indicators of the building model of the accommodation establishments; the typology, which is a nominal variable, coded as 1 if the establishment is a hotel and as 2 if it is an apartment; and category is an ordinal variable that goes from 1 to 5, depending on the star rating of the establishment.
With these data for each establishment, a georeferenced database with information for 1,821 tourism accommodation establishments in the Canary Islands has been obtained. To simplify the explanation of the process and the results obtained, from now on, we will focus again on the municipalities of Adeje and Arona, in the south of Tenerife. In 2016, these municipalities contained 224 tourism accommodation establishments (hotels and apartments), with 94,251 bed-places.
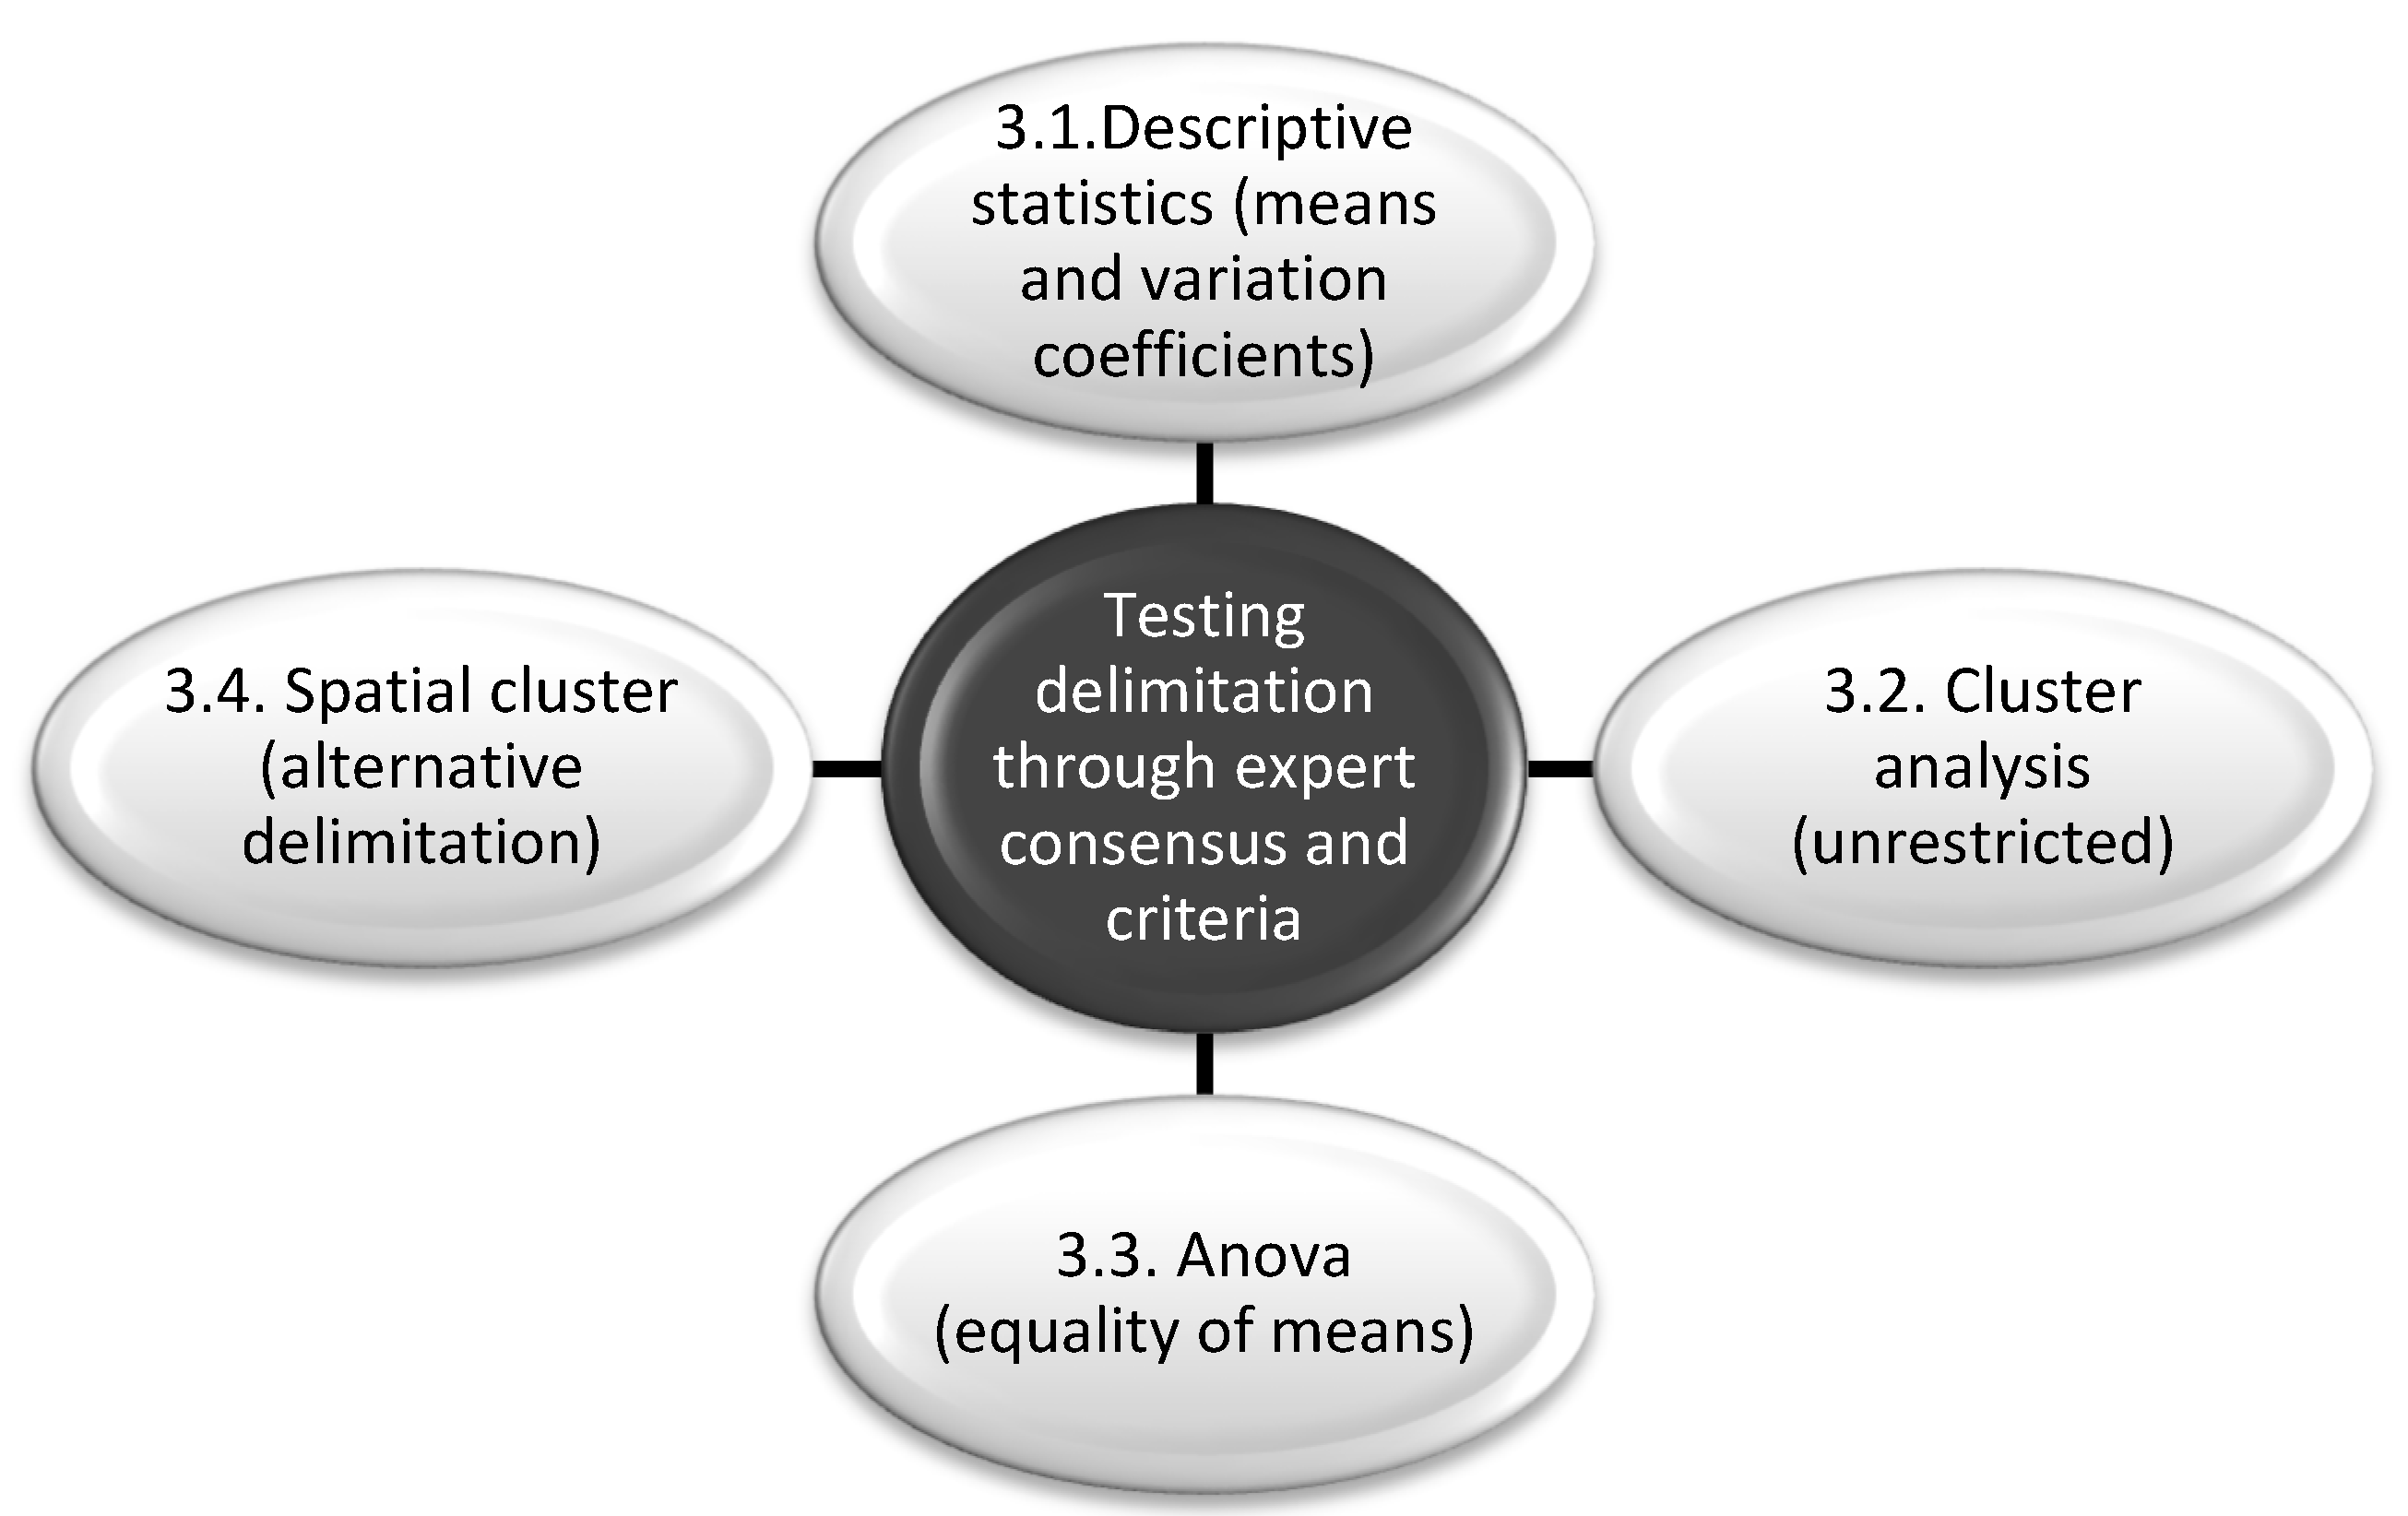
In this study, four types of statistical analyses were performed (Figure 3). First, a descriptive statistical analysis of the characteristics of the accommodation establishments of the local destinations identified from expert consensus was carried out. This was performed for both establishments and beds. Using bed-places prevents small establishments from weighing the same in the results as other larger ones. Thus, a cluster analysis was completed to group the accommodation establishments according to their characteristics. Thirdly, different ANOVA analyses of variance were carried out to determine if the geographical groupings have a particular behaviour, at the same time as comparing the degree of homogeneity of the groupings. Finally, different spatial analyses of the data were performed, which provided a better understanding of the behaviour of the characteristics of the establishments in the territory, the presence of clusters and atypical spatial values, and new proposals for proximal groupings.
3.1. Descriptive Statistical Analyses
To understand the data better, a comparative analysis of the means of the quantitative variables of the data set was performed. These variables were age, built area, plot area, and number of floors. To do this, the statistical program SPSS (IBM SPSS Statistics 21) was used. This analysis shows the main characteristics of the variables (range, mean, standard deviation, variance, coefficient of variation, etc.). The studies were carried out at the municipal level and for the local destinations used by ISTAC. First, the data for accommodation establishments were analysed, and then an analysis was made of the bed-places of each establishment. Subsequently, the results of the analyses for establishments and for bed-places were compared. The variation coefficient of each of the analysed areas was given special importance, since this coefficient measures the relative dispersion of the variables in the data set. The result indicates the dispersion of the values of the variable for each establishment with respect to the means of all the establishments of the analysed area.
For the qualitative variables (typology and category), a study of their weight was conducted in each municipality and in the different local destinations. The objective of this analysis was to verify if the identified areas had the same composition as the municipality to which they belong, or if, on the contrary, they had different patterns in terms of the category and type of their accommodation establishments. This study was carried out again for accommodation establishments and for their bed-places.
To finalize this part of the methodology, a bilateral correlation analysis for the quantitative variables was conducted, using Pearson’s correlation coefficient. The correlation coefficient examines the strength with which two variables are associated [46]. Although there is no consensus regarding the coefficient cut-off values, it is generally accepted that absolute values below 0.3 suggest a weak relationship, and above 0.7 a strong relationship [47]. If some of the variables in the database were highly correlated, it would be possible to eliminate some of them.
3.2. Cluster Analysis
Among existing classification methods and algorithms, we chose to perform a non-hierarchical cluster analysis. The main reason for conducting a non-hierarchical cluster analysis (specifically iterative partitioning) is that these methods are the most recommended when large data files have to be processed (since the hierarchical method, due to the laboriousness of its calculations, is not practical in these cases). This is very important for this research, given that when using accommodation places, a database with 94,251 bed-places becomes available, which makes it complex to execute the calculations by means of hierarchical methods. In addition to iterative partitioning methods, by iterating the classification process several times, possible errors can be corrected that may occur in the initial classification of cases. Among the existing iterative partitioning clustering algorithms, we have chosen to use the k-means algorithm [48], which is the most used in this category [49], employing the statistical analysis software SPSS 21.
Using a non-hierarchical cluster analysis such as the k-means entails the obligation to choose the number of groups in which the cases in the data set are to be classified. To determine the appropriate number of clusters for the analysis, there are two alternatives to opt for; either the one determined by the analysis or the one set by the researchers.
In the case of Adeje and Arona, four cluster analysis options have been performed, depending on the variables used. Option 1 is a grouping based on age, built area, plot area, and the number of floors in each establishment. Option 2 incorporates, in addition to the variables of Option 1, the type and category of the establishments. Option 3 adds to the variables of Option 1 the X and Y coordinates of each establishment in order to add the geographical distance as a condition of the classification. And finally, Option 4 incorporates all the variables contemplated in the previous options, that is to say, age, built area, plot area, number of floors, typology, category, and X and Y coordinates.
To conduct the cluster analysis, the database with the Adeje and Arona accommodation establishments and their characteristics was analysed with the SPSS statistical software. Once the database was configured, the cases (establishments) were weighted by the number of accommodation bed-places in each of the establishments. In this way, instead of 224 cases we had 94,251. The information of the establishments to which they belong was assigned to these cases.
3.3. Analysis of Variance: ANOVA
The ANOVA analysis of variance is a set of statistical models and their associated procedures, in which the variance is divided into different components by different explanatory variables. The initial variance analysis techniques were developed by Fisher [50].
This analysis of variance compares means of more than two groups at the same time and determines if different treatments show significant differences or, on the contrary, it can be assumed that their population means do not differ. In the ANOVA test, comparisons are always bilateral because it is studied globally if the groups have different means, and not if one group has a lower or greater average than another individually. If the null hypothesis is rejected, it can be affirmed that at least two groups have different means, but it is not possible to know which groups these are.
The variability or total variance of a data set can be broken down into: variance between groups, which measures the variability between the means of each group with respect to the overall average of all observations; and variance within the groups, which measures the variability of each observation with respect to the average of a group (often under the name of residual variance, error, or intra-group variance). Therefore, total variance is equal to the variance between groups plus variance within the groups. The effect is divided due to the membership of the groups (variance between groups) with respect to the dispersion due to chance or random error (variance within groups). The quotient between these terms is called F, or F of Fisher-Snedecor.
With this analysis, the degree of homogeneity of different groupings can be compared that have so far been carried out with the data set. Specifically, the homogeneity of the municipalities of Adeje and Arona and of the local tourism destinations used by ISTAC can be observed. Since there are 94,251 cases, when working with bed-places, the resulting groups are large enough not to take into account possible problems of non-normality of the sample.
3.4. Spatial Data Analysis
At this point, the spatial analysis of the characteristics of Adeje and Arona establishments is addressed. So far, the statistical analyses specified in the methodology have not taken into account that the data and bed-places have a specific location, and that they are grouped with other establishments or places to form new areas. In this section, a grouping of tourism accommodation establishments was conducted using a type of cluster analysis to which certain spatial restrictions are added: spatial data analysis.
This spatial data analysis was performed using the spatial statistics tool available in ArcGIS 10.1 (geographic information system software produced and marketed by ESRI): the grouping analysis. This tool performs a classification procedure that attempts to find natural spatial clusters in the data. Given a number of groups to create, it looks for a solution that maximizes the similarity between all the entities belonging to each group, and at the same time, maximizes the difference between the groups. This similarity or difference is based on a set of attributes of the entities provided by the researcher, and on spatial properties, for which the algorithm uses a connectivity tree (minimum expansion tree) to find natural clusters. When executing the Grouping Analysis, an R2 value is calculated for each variable. The R2 value indicates how much of the variation of the original data of the variable was maintained after the grouping process. The variable with a higher R2 divides the entities into groups more effectively.
A Clustering Spatial Analysis was carried out for 224 tourism accommodation establishments in Adeje and Arona. Similar to the process in the cluster analysis of the previous section, the characteristics of each establishment have been selected as analytical fields: age, built area, plot area, and number of floors. On this occasion, in addition, since the tool does not allow weighting the cases by the number of bed-places in each establishment, this variable has also been introduced as an analytical field, so that, in this way, the number of bed-places in each establishment is included in the grouping of establishments.
Regarding the number of groups in which to classify the Adeje and Arona establishments, nine groups have been chosen, given that the objective of this analysis is to verify whether this method confirms the delimitation of tourism local destinations currently used by ISTAC. In any case, the tool is set to provide the optimal number of groups according to the pseudo statistical index F [51]).
Since it is intended to obtain proximal groups, that is to include nearby establishments in the territory, a spatial restriction has been set that influences the way in which the housing establishments are grouped. Specifically, the K-Nearest Neighbours method has been used [52], which is a supervised classification method.
4. Results
In this section, the main results obtained after applying the different statistical techniques listed above are detailed. These are divided into descriptive statistical analysis results, cluster analysis of the accommodation bed-places results, ANOVA variance analysis results, and spatial data analysis results.
4.1. Descriptive Statistical Analysis
As already mentioned in the methodology, the descriptive statistical analysis consists of a mean comparison analysis and a correlation analysis. These analyses were performed for accommodation establishments and for their bed-places. The comparison analysis of means provides a large amount of information to better understand the composition of the municipalities of Adeje and Arona, and their local tourism destinations, in terms of the characteristics of their tourism accommodation establishments. In this section, we will focus on a specific indicator: the coefficient of variation.
This analysis indicates, in the case of the municipality of Adeje (Figure 4), that the coefficients of variation of the variables of age, built area, plot area, and number of floors are always lower for local tourism destinations in Adeje than for the municipality as a whole, except in the case of Playa Paraíso. This is a territorially isolated area that contains six accommodation establishments with very heterogeneous attributes with respect to the variables under study. Thus, it confirms that the delimited local destinations turn out to be, generally, more homogeneous than the municipality.
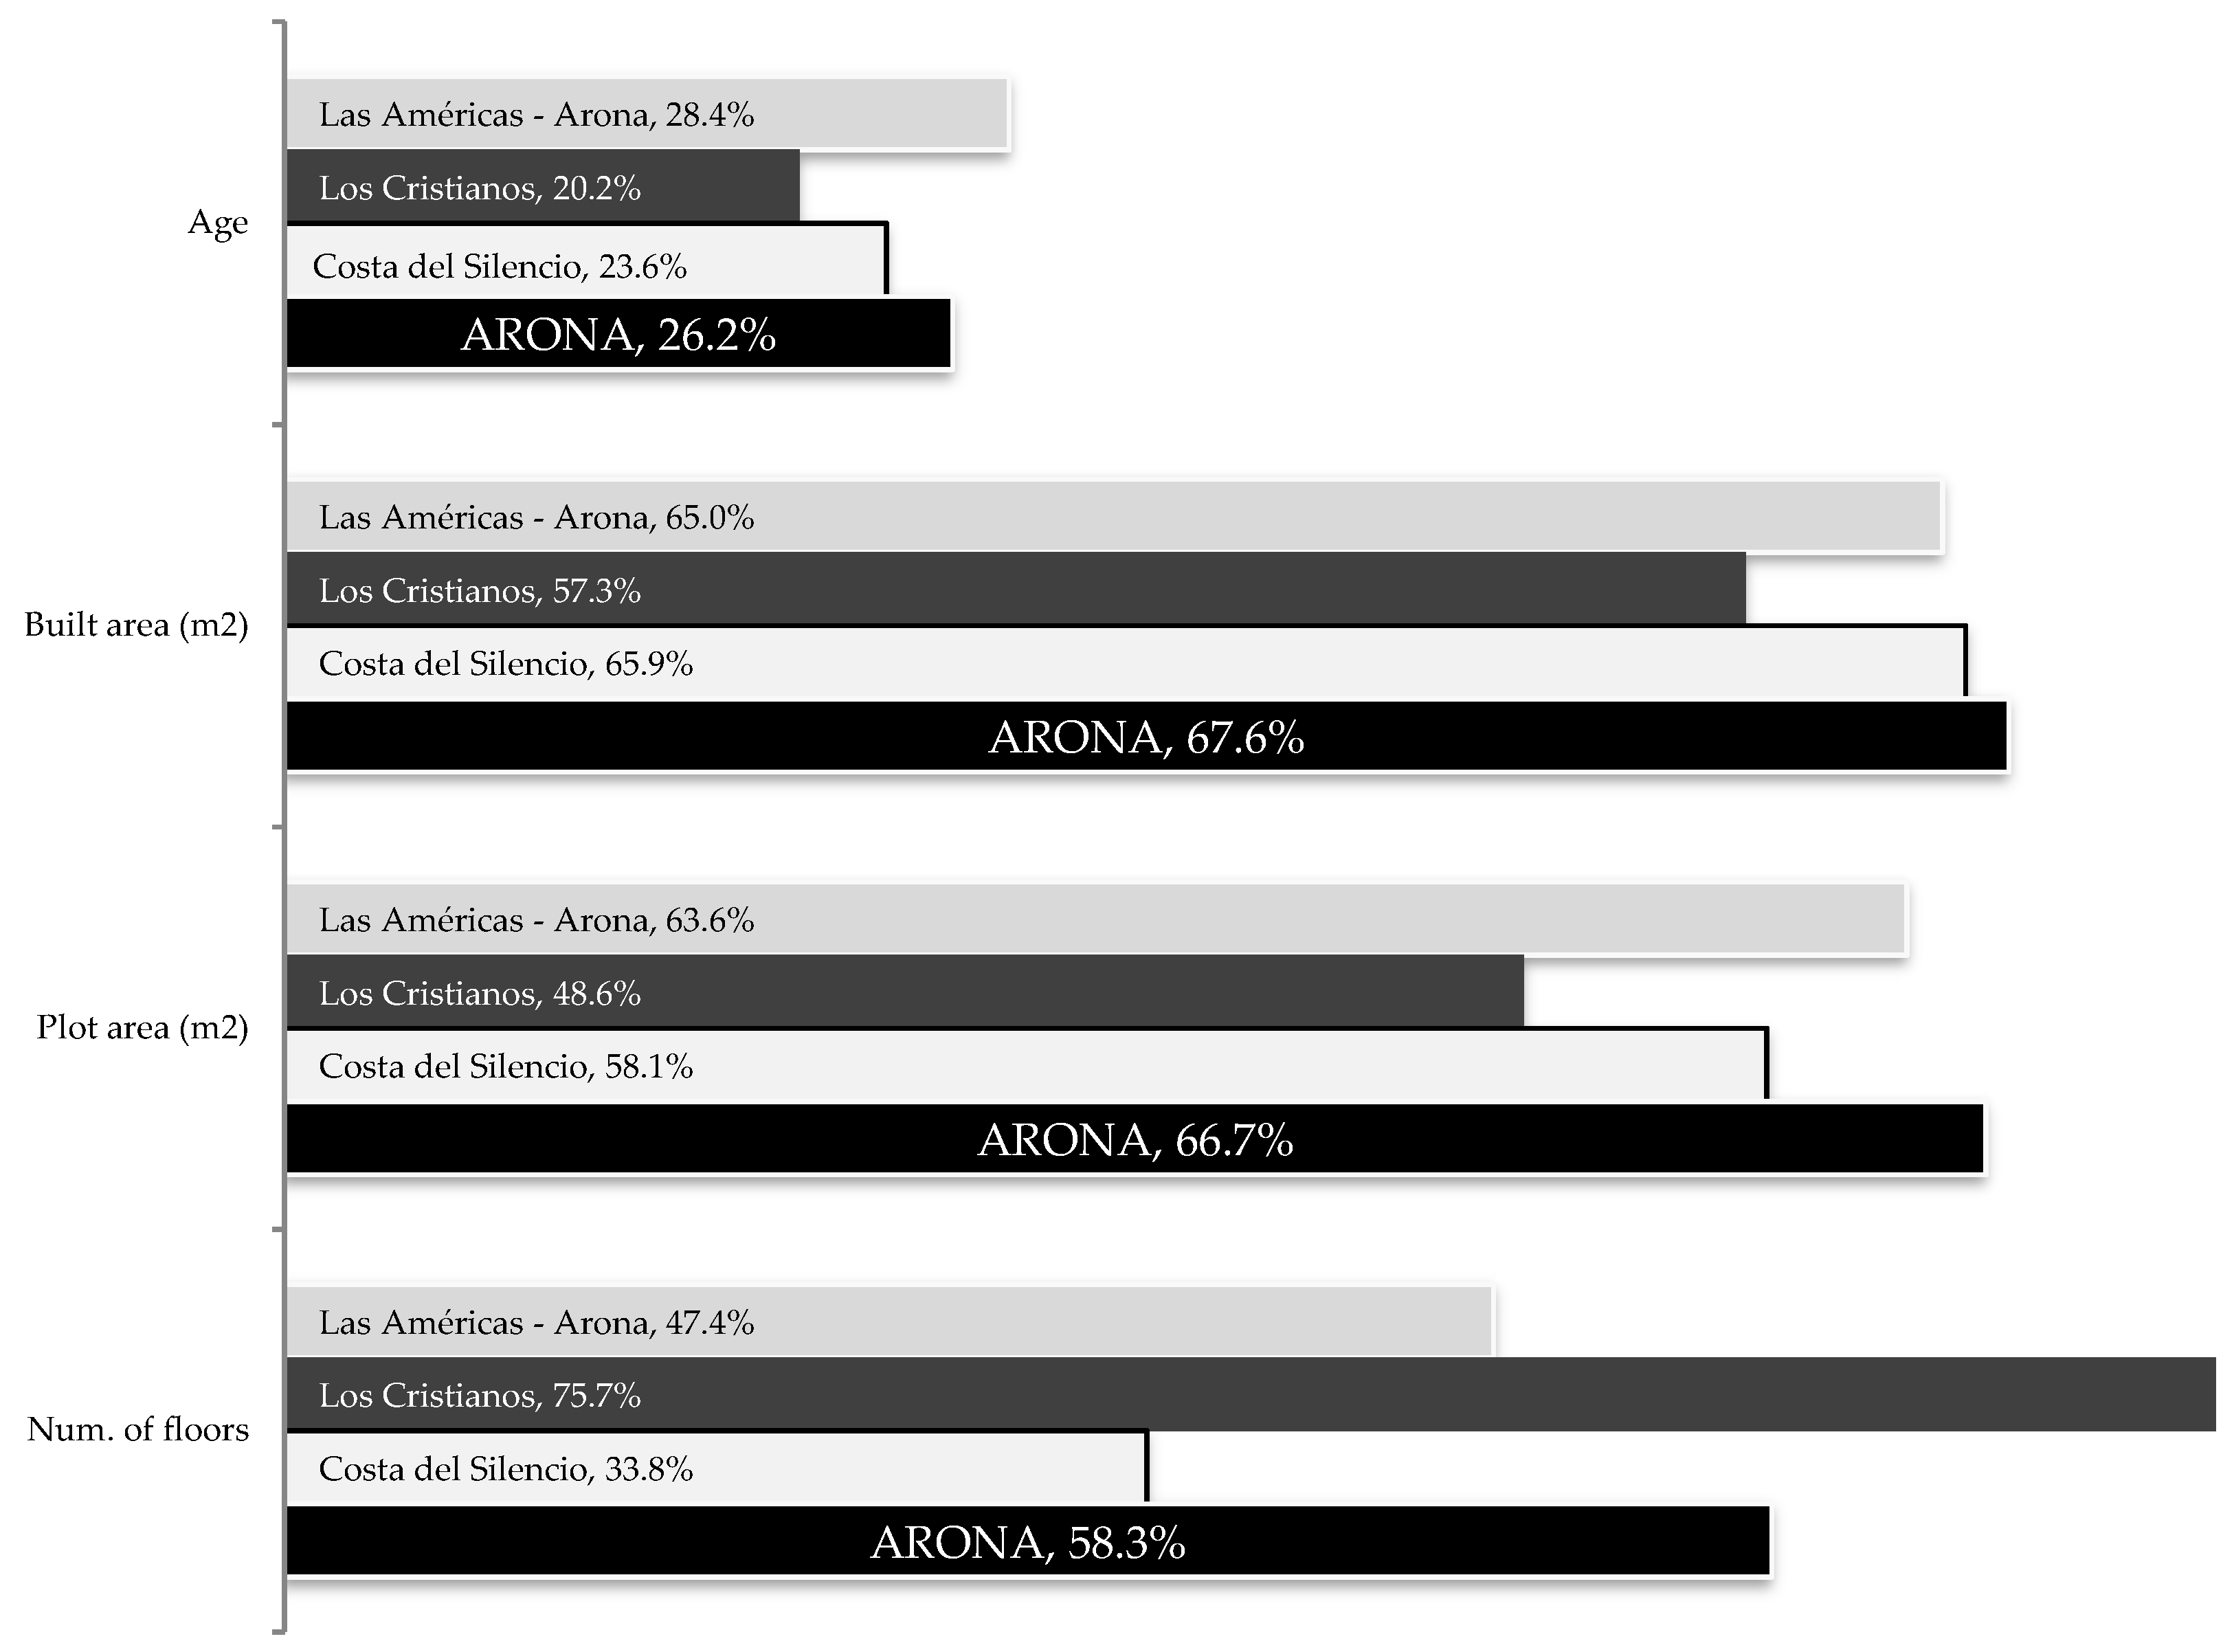
In the case of Arona (Figure 5), we also find that, out of the four quantitative variables under study, bed-places of the municipality have more dispersion than bed-places of local destinations, except in two cases. The age variable is somewhat more dispersed with respect to its average in Las Américas—Arona than in Arona as a whole. Moreover, in number of floors, Los Cristianos has a coefficient of variation higher than the municipality, which reflects that this local destination is very heterogeneous with respect to the number of floors of its establishments, with the average data of floors being less representative for this area than for the entire municipality and for the rest of local destinations.
This analysis shows that, in general, the municipalities of Adeje and Arona show more dispersion than their local destinations with respect to the variables of age, plot area, and number of floors in each establishment. This premise is not always fulfilled for some variables; some local destinations show more dispersion than the municipality. This happens in the isolated local destinations of Callao Salvaje, Playa Paraíso, and Costa del Silencio. These areas are somewhat internally heterogeneous in the results of some variables. This could be explained because their delimitation has been more affected by their geographical separation from other areas than by the characteristics of their establishments.
The analysis of the distribution of the typology and category of accommodation establishments in Adeje and Arona and in their local destinations highlights again that the delimited areas are very different from the municipalities to which they belong. In addition, it is observed again how these differences also occur among the identified local destinations (see Table 3).
Within the descriptive analysis of the characteristics of the accommodation bed-places of Adeje and Arona, a correlation analysis was carried out. When performing the correlation analysis, all variables become bilaterally correlated, as can be seen in Table 4. For bed-places, the correlations between variables are significant (p < 0.01), but their value never exceeds 0.7, so there is no strong correlation between variables. The age, built area, plot area, and number of floors of the establishments to which the accommodation bed-places under study belong are positively correlated. This relation is weak, according to the commonly accepted cut-off values (Pearson’s correlation coefficient, r < 0.7), for all the combinations, except for the case of the relation of the built area with the plot area, which, although it is very high, is not as strong.
It is normal that the variables age, plot area, built area, and number of floors are correlated, considering that they define, to a large extent, the establishment’s architectural design. Taking into account that this relationship is not considered as strong, according to normally accepted standards, it has been decided to continue performing the analyses of this section using the four variables.
4.2. Cluster Analysis
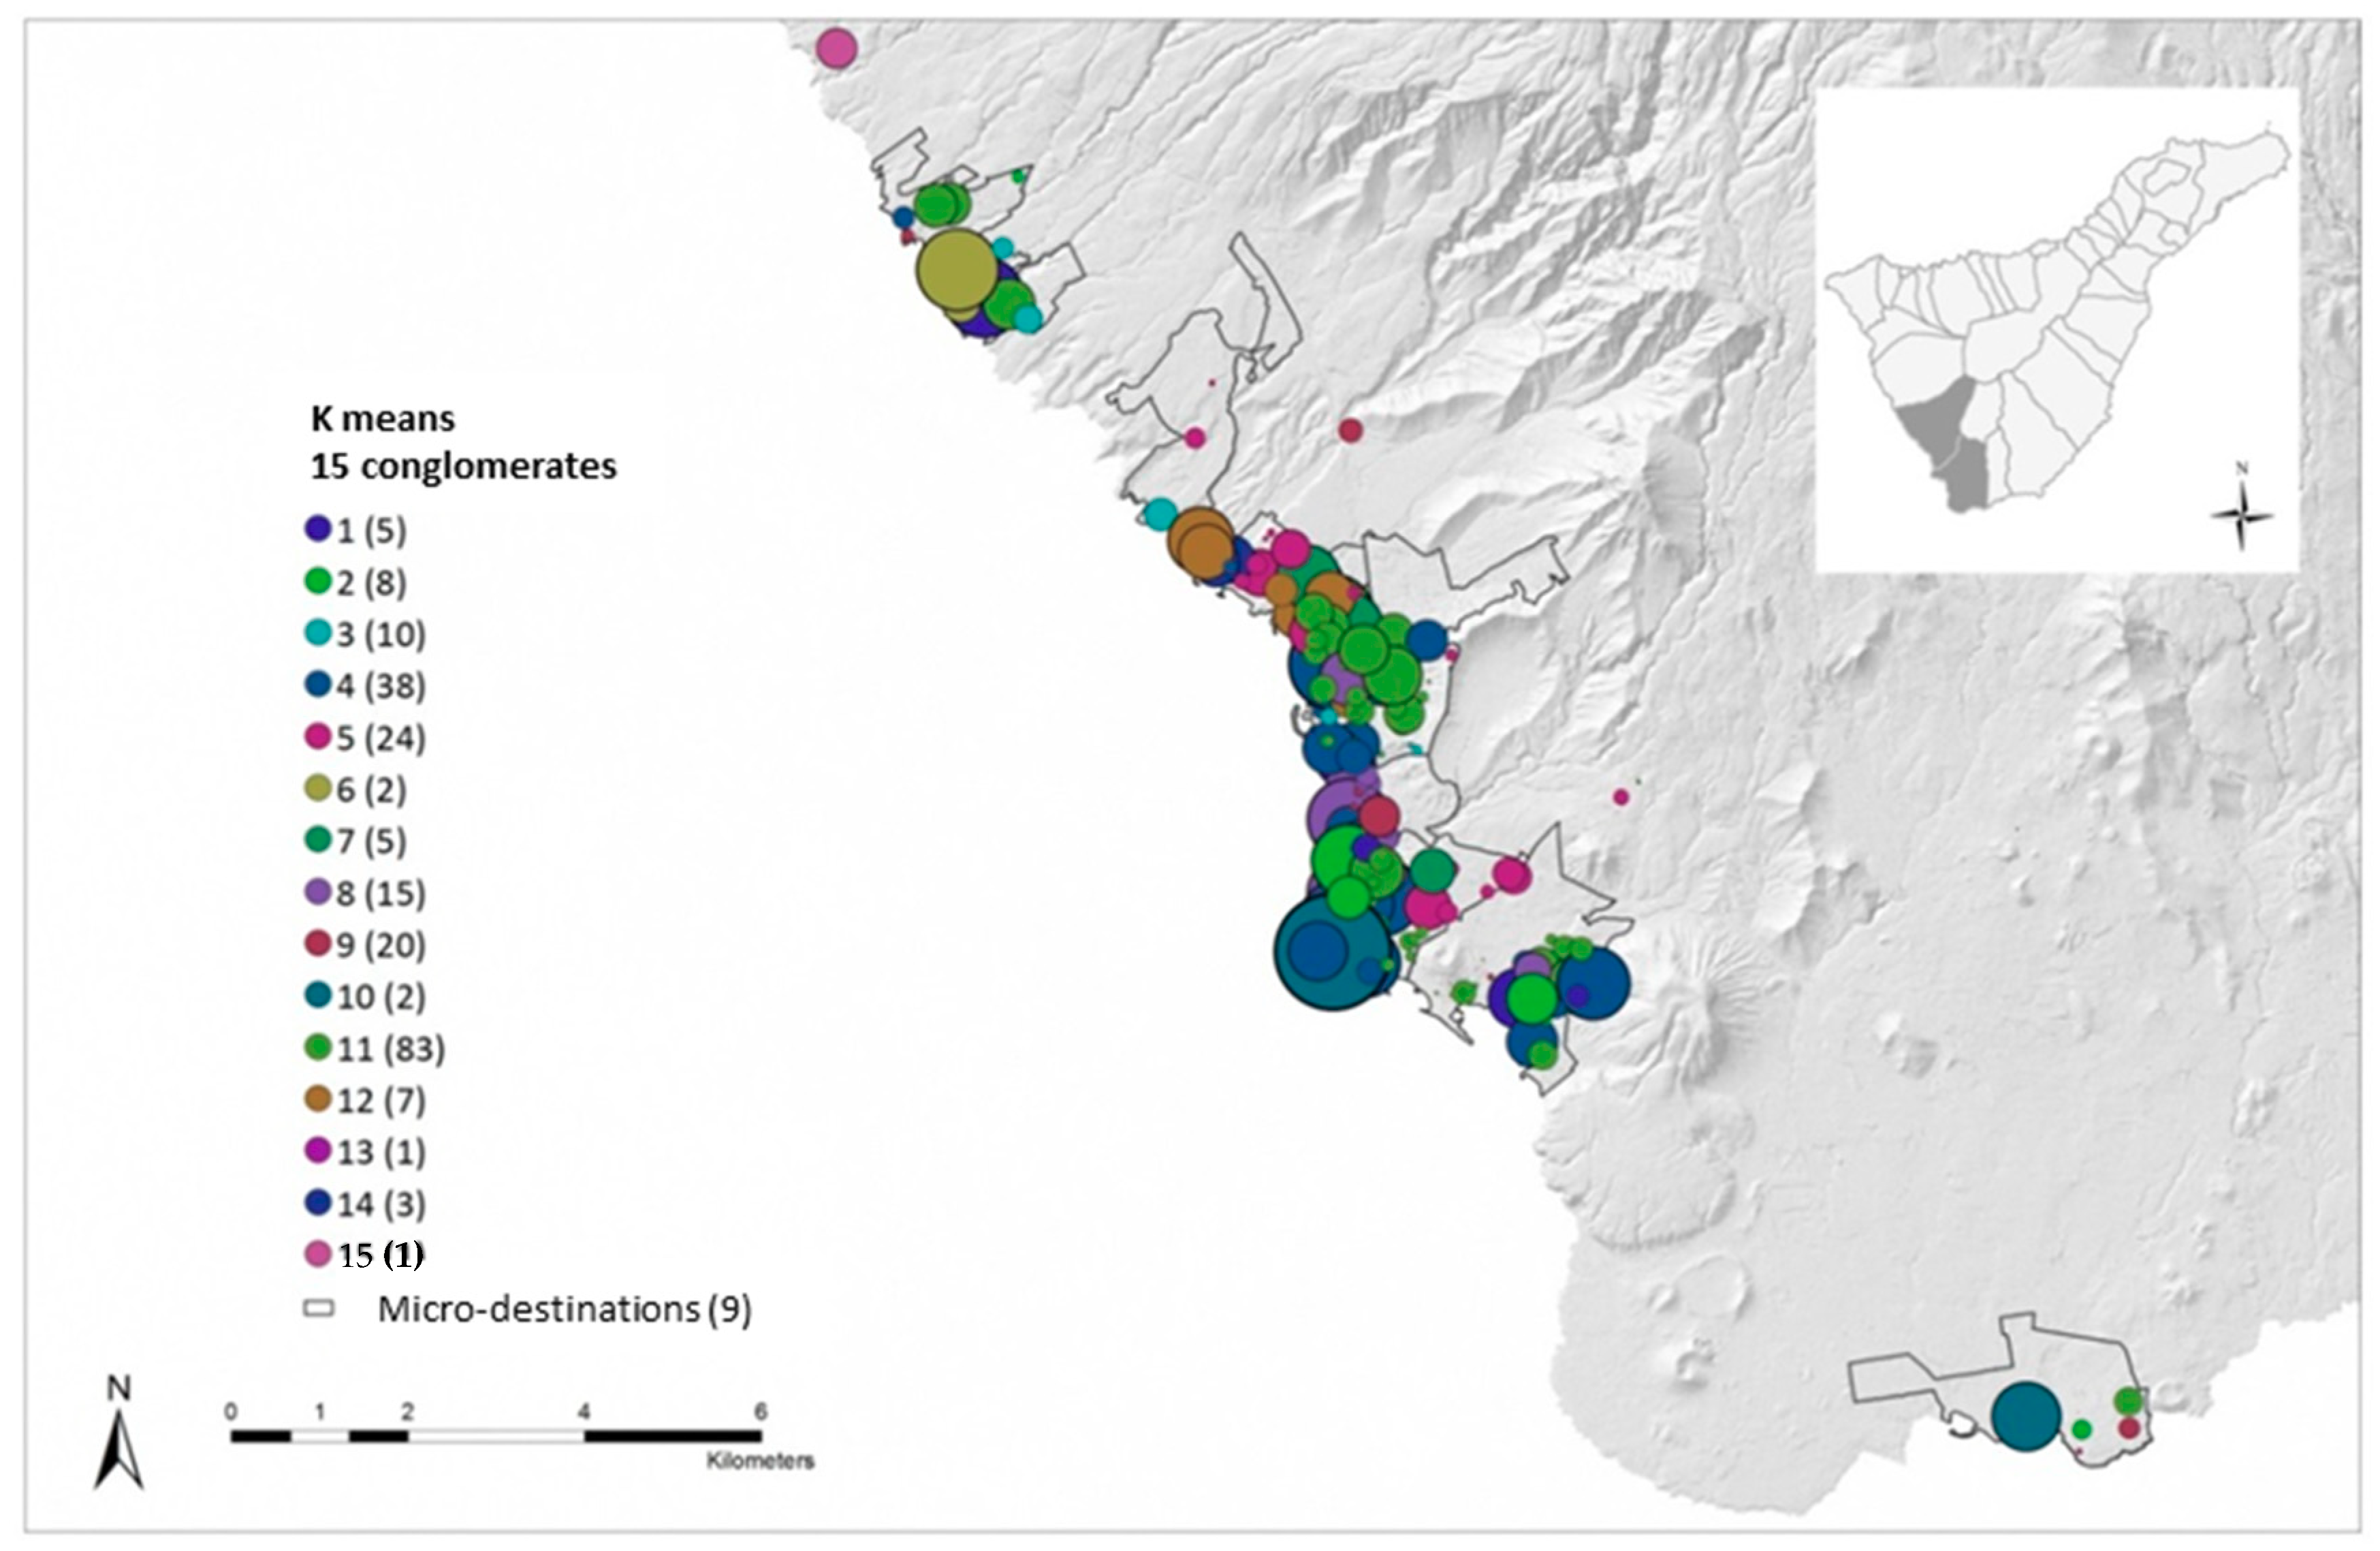
As explained in the methodology, four cluster analysis options were carried out. A subsequent ANOVA analysis showed that Option 1 is the one that produces groups with the lowest average internal variance, that is, the most homogeneous clusters. This option consists of a k-means cluster analysis that classifies Adeje and Arona accommodation places in 15 types of establishments that have similar characteristics using, as classification variables (previously standardized), age, built area, plot area, and the number of floors. This information has been weighted by the average number of bed-places in each establishment.
To choose the number of groups in which to classify the data, 24 tests have been performed. In the first one, the cases have been classified into two groups, in the second into three groups, and so on until test 24, where the cases are classified into 25 groups. It has been considered that identifying more than 25 types of tourism accommodation would make the analysis, and the possible conclusions drawn from it, too complex. Since the objective of the k-means algorithm is to minimize the distances within the clusters while maximizing the distances between clusters, two indicators have been calculated for each of the tests: On the one hand, the sum of the internal distances of the groups created (distance from each establishment to the centroid); and, on the other hand, the average of the distances between the centres of the final conglomerates. In this way, it has been determined that the number of clusters that minimizes the distances within the clusters while maximizing the distances between the clusters is 15.
This analysis has verified that each local destination delimited by the consensus of experts contains quite diverse establishments, given that each of these areas includes a certain variety in the colour (type) of the establishments referenced, as can be seen in Figure 6.
After carrying out this analysis of k-means’ conglomerates, it can be seen that the local destinations are not homogeneous areas because they normally contain different types of accommodation. What can be affirmed is that they are units that are different from each other in terms of the combination of accommodation establishments they contain, as Table 5 shows.
4.3. Analysis of Variance: ANOVA
As explained in the methodology, at this point an ANOVA analysis of variance was carried out at the municipal scale, and after, at the local tourism destination scale. The analysis of the variables is typified and weighted by bed-places: age, plot area, built area, and number of floors. The results at a municipal scale, shown in Table 6, include the F statistic, and their significance.
The first conclusion drawn from this analysis is that the null hypothesis of equality of means of the ANOVA is rejected given that the level of significance of the F statistic is less than 0.05 for all the variables. This implies that Adeje and Arona’s establishments have different mean values for the variables under study. The second conclusion that is very useful for this study is that the internal variance of the groups for each of the four variables under study has an average of 0.858.
Afterwards, the ANOVA analysis was repeated to determine if the average values of the local destinations differ among themselves, as can be seen in Table 7, and to check the degree of homogeneity of these areas. From this new analysis, two main conclusions are drawn. First, given that the p-value of the F statistic is less than 0.05, the null hypothesis of equality of means is rejected, that is, at least one of the local destinations has a different mean compared to the rest. Second, it can be stated that local destinations are more homogeneous than municipalities, given that the average of the internal variances of the variables under study, for the functional areas identified, is lower than the average of the variances of the same variables for Adeje and Arona municipalities. However, the degree of homogeneity of the local destinations has turned out to be lower than initially expected.
4.4. Spatial Data Analysis
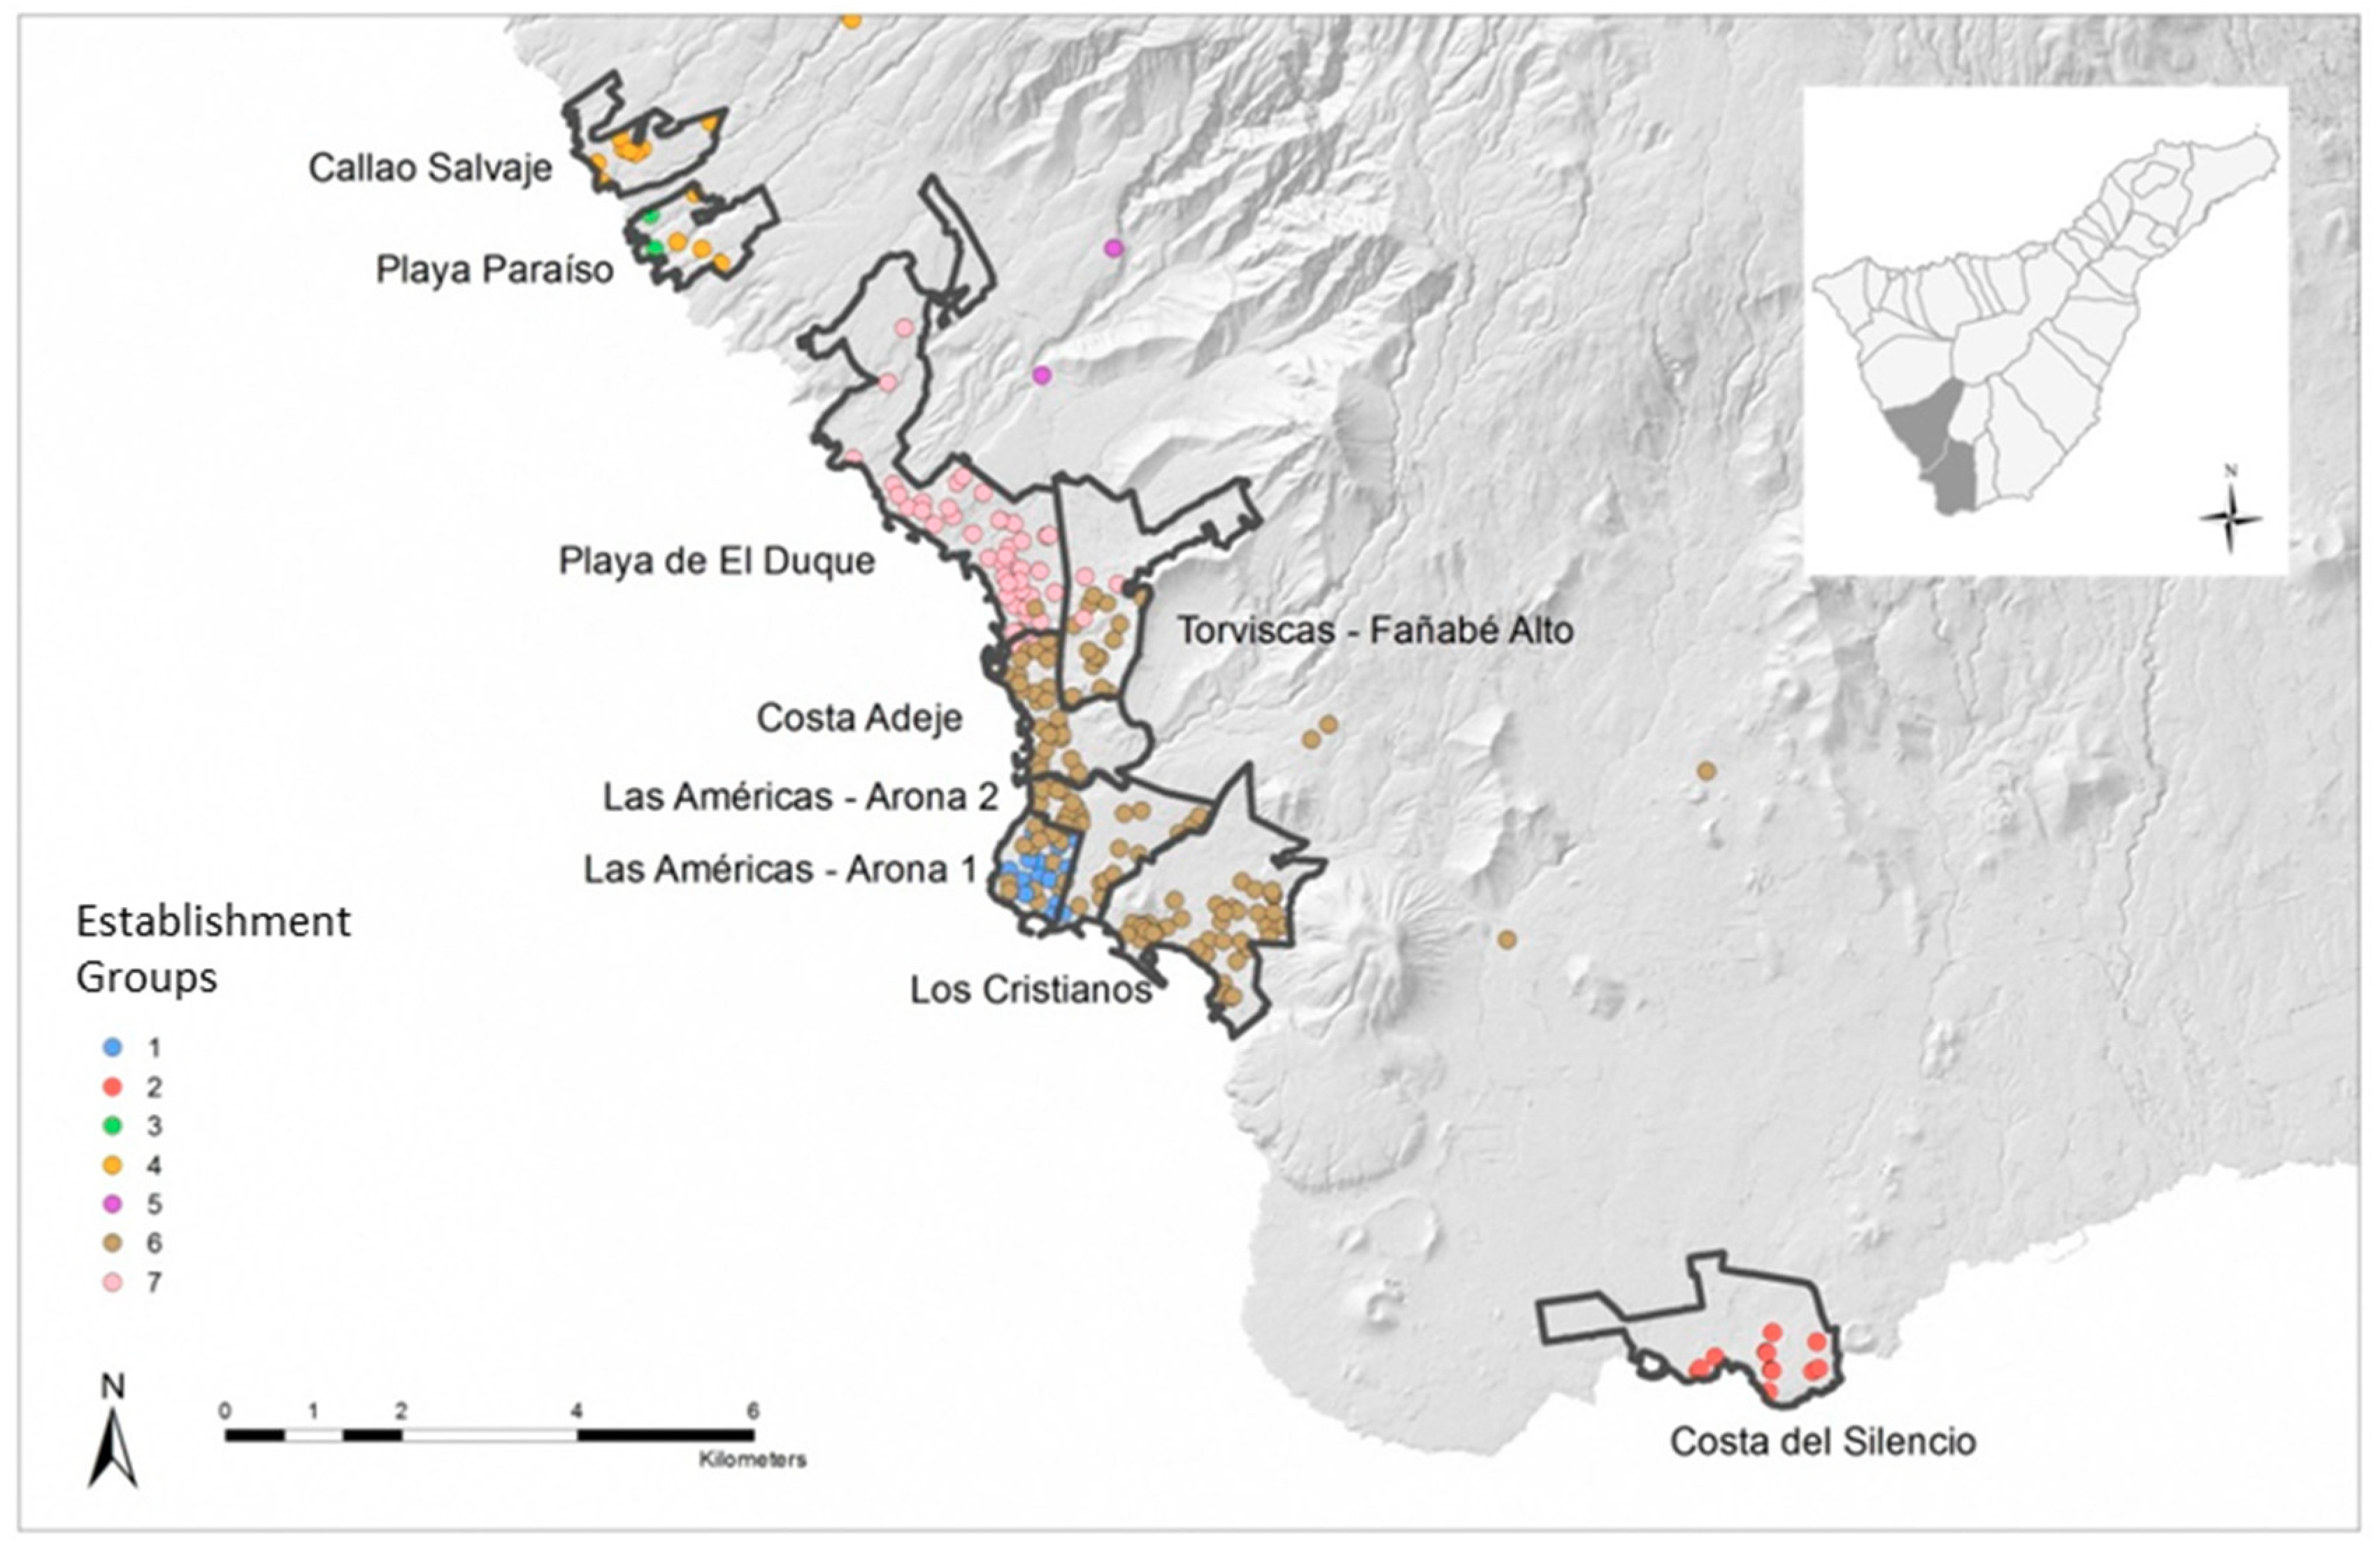
A grouping analysis has been applied to the accommodation establishments of Adeje and Arona. This analysis groups the establishments according to their age, plot area, built area, number of floors, and number of bed-places, spatially restricted by the nearest K neighbour algorithm, classifying the 224 establishments of Adeje and Arona into seven groups. That is to say, the analysis classifies the establishment of Adeje and Arona into seven spatially continuous groups. It was the algorithm itself that determined that the optimum number of groups in which to classify the 224 establishments is seven. From its application, the grouping proposal shown in Figure 7 is obtained, where the grouping analysis classifies the establishments, assigning the same colour to the accommodation of the same group.
Results of the grouping analysis confirm the delimitation of some of the local destinations identified from expert consensus in the municipalities of Adeje and Arona currently used by ISTAC. But, at the same time, they suggest certain changes in others. Below, a series of changes based on the results of this analysis are proposed, then the homogeneity of the identified areas is compared with that of the micro-destinations proposed by experts to check if this statistical tool can improve the delimitation.
The grouping analysis tool suggests unifying Callao Salvaje and Playa Paraíso, leaving out two Playa Paraíso establishments that do not share characteristics with the rest. This tool only takes into account the characteristics that we have assigned for each establishment, without considering physical barriers or other types of territorial disconnections. In this case, although the cluster analysis recommends unifying both local destinations, there are other factors to consider in addition to the variables analysed. Specifically, between Callao Salvaje and Playa Paraíso there is a large agricultural area with banana plantations, which completely separates both areas. For this reason, we still consider it appropriate to maintain the current delimitation that identifies two different local destinations: Callao Salvaje and Playa Paraíso.
Regarding Playa de El Duque, the grouping analysis proposes that this micro-destination can be extended to cover approximately half of Costa Adeje, and even part of Torviscas and Fañabé Alto. Again, the software ignores the fact that that Torviscas and Fañabé Alto has a very solid lower limit, because it is separated from Playa de El Duque and Costa Adeje by a motorway, which we consider to be a strong barrier to separate these tourism destinations. However, we do accept the possibility of moving the line that separates Playa de El Duque from Costa Adeje further south as the analysis proposes.
The grouping analysis creates a very large group of establishments, Group 6. This group unifies Torviscas and Fañabé Alto, part of Costa Adeje, Las Américas—Adeje, and part of Las Americas—Arona and Los Cristianos. As mentioned in the previous paragraph, the area of Torviscas and Fañabé Alto is separated from the rest by a motorway, so we do not consider it appropriate to modify its limits. However, it has been decided to unify the remaining part of Costa Adeje with Las Américas—Adeje, in a new area that has been called Costa Adeje in its entirety. This area extends until reaching the municipal limit in order to still make comparisons with the municipality possible.
As for Las Américas—Arona, it has been decided to divide it into two, separating the establishments of Group 1 from those of Group 6, as the analysis indicates. Although the tool would link part of the establishments of Las Américas—Arona with Los Cristianos, in this research we consider that they are two areas with sufficient distinctions as entities, and that they contain more than enough establishments to continue being considered separately. Finally, the grouping analysis identifies a group of establishments that completely coincides with Costa del Silencio, so no change is proposed.
After considering the results of the grouping analysis tool, and adding researchers’ criteria, some changes are proposed in the delimitation of local tourism destinations obtained from the consensus of experts. This new proposal is depicted in Figure 8.
After completing the redesign of the local destinations, it was examined whether the new delimitation increases the homogeneity of the resulting areas. An ANOVA variance analysis was carried out for the proposal of local destinations resulting from the grouping analysis, based on the variables of age, built area, plot area, and number of floors (previously standardized). Then, it was compared with the ANOVA results for the local destinations identified by experts. It was observed that the average of the internal variance of the local destinations is 0.717. When performing the analysis of ANOVA variances for the proposal of new areas resulting from cluster analysis, the new delimitation presents a mean of the internal variance of the groups of 0.726, a very similar figure, though slightly higher than that of the micro-destinations delimited through expert consensus.
Thus, it is concluded that the grouping analysis—to which certain researcher criteria have been added through their knowledge of the area, such as the inclusion of physical barriers, administrative limits, etc.—cannot identify more homogeneous areas than those identified by experts from their knowledge of the subject, paying special attention to the characteristics of the accommodation supply, particularly to the age, construction model, category, and typology.
5. Discussion and Conclusions
The pioneering identification of local destinations in the Canary Islands through expert consensus supported by indicators has used criteria of tourism supply, specifically, accommodation establishments, paying special attention to their age, construction model, type, and category. This delimitation has been tested through a statistical analysis in which univariate, multivariate, and spatial analysis methods have been used. This made it possible to verify that, in the case of this study—and perhaps this conclusion could be extrapolated—the expert consensus delimitation offers very consistent results, which are largely confirmed by statistical analysis.
These results are in line with the literature on functional zoning and spatial delimitation in social sciences, where the consensus of authorities and local stakeholders is considered the most common and powerful tool for establishing boundaries in neighbourhoods and functional zones [9,10,11,31]. The evidence from applying statistical methods to analyze tourism establishments also highlights greater coherence in results when using establishments weighted by their bed-places as a unit of analysis instead of just using the establishment. In addition, we have obtained support for using a combination of methods. Specifically, we have found that a mix between statistical analyses and expert consensus can enhance the delimitation process by providing useful insights that feedback to each other. Haynes et al. [40] also pointed out that automated zone design uses variables defined by researchers, which always introduces some degree of subjectivity into the process. These authors found, in line with our contribution, a high degree of similarity between machine-generated zones and local knowledge or subjectivity. Finally, our results show that pure statistical methods can, in some circumstances, be misleading and are not recommended for establishing zones for social purposes, as seen in the literature on neighbourhoods.
The statistical analysis carried out on the local destinations previously identified by expert criteria has been able to verify that the local tourism destinations are more homogeneous than the municipalities to which they belong. Even so, despite having been considered as functional areas by the experts, these areas still maintain a relatively significant degree of internal heterogeneity. Each local destination contains several types of establishments, but this composition varies greatly between each of the areas. This leads us to conclude that the delimited local destinations are relatively heterogeneous internally, but this heterogeneity presents differential characteristics in each local destination.
This research confirms that local tourism destinations, for which the Canary Islands Statistics Office is publishing statistical information, have a high degree of coherence, despite their internal heterogeneity. No statistical indications of the need for significant changes in the existing delimitation have been detected in the analysis. Therefore, this research confirms the coherence of the Canary Islands tourism statistics system at the local destination scale.
This research contributes to the literature related to tourism destination management through the analysis of the coherence of delimited local tourism destinations, which will allow destination managers to make a better diagnosis and more accurate decisions. The research also adds to the academic literature on the delimitation of functional areas in the field of tourism by providing a statistical test of the results achieved. Although the academic literature on delimitation is relatively abundant in studies of sociology, public health, urban planning, or studies on crime, etc., until now, in the field of tourism, there have hardly been any initiatives along these lines.
The research has also made it possible to verify that the analysis of tourism destinations through tourism accommodation bed-places offers more coherent results than the analysis through accommodation establishments. The high heterogeneity that exists between establishments, particularly in terms of size, can generate important biases in the results that are solved, to a large extent, using bed-places instead of accommodation establishments as a unit of analysis.
The local tourism destinations identified have turned out to be more heterogeneous than initially expected, but it should be noted that this heterogeneity is different in each case. Thus, it can be concluded that, although heterogeneous, the micro-destinations are very different from each other, depending on the characteristics of the accommodation supply they contain.
The use of statistical techniques is a fundamental support in the process of delimiting local destinations, but it is not capable of replacing expert criteria, at least in the case of our study. Statistical technique results, for an alternative delimitation, have not been better than the areas identified by expert consensus. These statistical techniques also have the weakness of not identifying the physical barriers that condition the tourism models that are developed in the territory and clearly separate some tourism areas from others.
The statistical indicators used to test the previously identified areas (age, built area, plot area, number of floors, typology, category, and X and Y coordinates) are very likely not sufficient to reflect the complexity of the tourism model from a supply perspective. This may be one reason why a statistical test of the characteristics of the areas delimited by the consensus of experts, as well as the search for an alternative delimitation from the cluster analysis and the spatial data analysis, do not provide alternative results to those previously obtained.
The use of supply criteria and accommodation establishments (and their bed-places) as a starting point for the delimitation, are supported by the greater stability of their characteristics (by tourism seasons and long-term) compared to statistical information from a demand perspective. However, once this analysis is concluded on the supply side, it could be relevant to carry out further research based on demand indicators, although it is likely that there will be a considerable relationship between the characteristics of supply and demand in each area.
The application of this methodology to the Canary Islands has been possible given the quality and quantity of tourism statistics, thanks to the work of ISTAC. In fact, this process of delimitation uses pre-existing information that has been reorganized with the help of geolocation. In addition, it is important to highlight that the development of this research has been supported by the census character of the accommodation surveys carried out by the Canary Institute of Statistics.
Author Contributions
Conceptualization, Y.R.-R. and R.H.-M.; methodology, Y.R.-R. and R.H.-M.; investigation, Y.R.-R. and R.H.-M.; data curation, Y.R.-R. and R.H.-M.; writing—original draft preparation, Y.R.-R. and R.H.-M.; writing—review and editing, Y.R.-R. and R.H.-M.
Funding
This research received no external funding.
Acknowledgments
The authors acknowledge the Institute of Statistics of the Canary Islands for providing the data and supporting this research.
Conflicts of Interest
The authors declare no conflict of interest.
References
- Dredge, D. Destination place planning and design. Ann. Tour. Res. 1999, 26, 772–791. [Google Scholar] [CrossRef]
- Lew, A.; McKercher, B. Modeling tourist movements: A local destination analysis. Ann. Tour. Res. 2006, 33, 403–423. [Google Scholar] [CrossRef]
- Pearce, D.G. Tourism in Paris studies at the microscale. Ann. Tour. Res. 1999, 26, 77–97. [Google Scholar] [CrossRef]
- Candela, G.; Figini, P. The Economics of Tourism Destinations; Springer: Berlin/Heidelberg, Germany, 2012. [Google Scholar]
- World Travel and Tourism Council (WTTC). The Comparative Economic Impact of Travel & Tourism; Oxford Economics: London, UK, 2012. [Google Scholar]
- United Nations World Tourism Organization (UNWTO). ‘Overtourism’?—Understanding and Managing Urban Tourism Growth Beyond Perceptions; UNWTO: Madrid, Spain, 2018. [Google Scholar]
- Sheehan, L.; Vargas-Sánchez, A.; Presenza, A.; Abbate, T. The use of intelligence in tourism destination management: An emerging role for DMOs. Int. J. Tour. Res. 2016, 18, 549–557. [Google Scholar] [CrossRef]
- United Nations World Tourism Organization (WTO). Indicators of Sustainable Development for Tourism Destinations: A Guidebook; UNWTO: Madrid, Spain, 2004. [Google Scholar]
- Suttles, G.D. The Social Construction of Communities; University of Chicago Press: Chicago, IL, USA, 1972. [Google Scholar]
- Flowerdew, R.; Feng, Z.; Manley, D. Constructing data zones for Scottish neighbourhood statistics. Comput. Environ. Urban Syst. 2007, 31, 76–90. [Google Scholar] [CrossRef]
- Coulton, C.J.; Korbin, J.; Chan, T.; Su, M. Mapping residents’ perceptions of neighbourhood boundaries: A methodological note. Am. J. Community Psychol. 2001, 29, 371–383. [Google Scholar] [CrossRef]
- Cutchin, M.P.; Eschbach, K.; Mair, C.A.; Ju, H.; Goodwin, J.S. The socio-spatial neighbourhood estimation method: An approach to operationalizing the neighbourhood concept. Health Place 2011, 17, 1113–1121. [Google Scholar] [CrossRef] [Green Version]
- Hernández-Martín, R.; Simancas-Cruz, M.R.; González-Yanes, J.A.; Rodríguez-Rodríguez, Y.; García-Cruz, J.I.; González-Mora, Y.M. Identifying micro-destinations and providing statistical information: A pilot study in the Canary Islands. Curr. Issues Tour. 2016, 19, 771–790. [Google Scholar] [CrossRef]
- Saraniemi, S.; Kylänen, M. Problematizing the concept of tourism destination: An analysis of different theoretical approaches. J. Travel Res. 2011, 50, 133–143. [Google Scholar] [CrossRef]
- United Nations. International Recommendations for Tourism Statistics 2008; United Nations, Department of Economic and Social Affairs: New York, NY, USA; Statistical Division Staff: New York, NY, USA, 2010. [Google Scholar]
- Bull, A. The Economics of Travel and Tourism; Longman Cheshire Pty Ltd.: Melbourne, Australia, 1991. [Google Scholar]
- Nadeau, J.; Heslop, L.; O’Reilly, N.; Luk, P. Destination in a country image context. Ann. Tour. Res. 2008, 35, 84–106. [Google Scholar] [CrossRef]
- Kim, H.-B. Perceived attractiveness of Korean destinations. Ann. Tour. Res. 1998, 25, 340–361. [Google Scholar]
- Buhalis, D. Marketing the competitive destination of the future. Tour. Manag. 2000, 21, 97–116. [Google Scholar] [CrossRef] [Green Version]
- Cooper, C. Tourism: Principles and Practice; Pearson Education: Harlow, UK, 2008. [Google Scholar]
- Murphy, P.; Pritchard, M.P.; Smith, B. The destination product and its impact on traveller perceptions. Tour. Manag. 2000, 21, 43–52. [Google Scholar] [CrossRef]
- Gunn, C.A.; Var, T. Tourism Planning: Basics, Concepts, Cases; Psychology Press: Hove, UK, 2002. [Google Scholar]
- Bornhorst, T.; Ritchie, J.B.; Sheehan, L. Determinants of tourism success for DMOs & destinations: An empirical examination of stakeholders’ perspectives. Tour. Manag. 2010, 31, 572–589. [Google Scholar]
- Baggio, R.; Cooper, C. Knowledge transfer in a tourism destination: The effects of a network structure. Serv. Ind. J. 2010, 30, 1757–1771. [Google Scholar] [CrossRef]
- Rodríguez-Díaz, M.; Espino-Rodríguez, T.F. A model of strategic evaluation of a tourism destination based on internal and relational capabilities. J. Travel Res. 2008, 46, 368–380. [Google Scholar] [CrossRef]
- Scott, N.; Cooper, C.; Baggio, R. Destination networks: Four Australian cases. Ann. Tour. Res. 2008, 35, 169–188. [Google Scholar] [CrossRef]
- Jackson, J.; Murphy, P. Clusters in regional tourism An Australian case. Ann. Tour. Res. 2006, 33, 1018–1035. [Google Scholar] [CrossRef]
- United Nations World Tourism Organization (UNWTO). A Practical Guide to Tourism Destination Management; UNWTO: Madrid, Spain, 2007. [Google Scholar]
- International Network on Regional Economics, Mobility and Tourism (INRouTe); United Nations World Tourism Organization (UNWTO). A Closer Look at Tourism: Sub-National Measurement and Analysis—Towards a Set of UNWTO Guidelines; UNWTO: Madrid, Spain, 2012. [Google Scholar]
- Weidenfeld, A.; Butler, R.; Williams, A.W. The role of clustering, cooperation and complementarities in the visitor attraction sector. Curr. Issues Tour. 2011, 14, 595–629. [Google Scholar] [CrossRef] [Green Version]
- Sampson, R.J.; Raudenbush, S.W.; Earls, F. Neighbourhoods and violent crime: A multilevel study of collective efficacy. Science 1997, 277, 918–924. [Google Scholar] [CrossRef]
- Chaskin, R.J. Perspectives on neighbourhood and community: A review of the literature. Soc. Serv. Rev. 1997, 71, 521–547. [Google Scholar] [CrossRef]
- Riva, M.; Apparicio, P.; Gauvin, L.; Brodeur, J.-M. Establishing the soundness of administrative spatial units for operationalising the active living potential of residential environments: An exemplar for designing optimal zones. Int. J. Health Geogr. 2008, 7, 43. [Google Scholar] [CrossRef] [PubMed] [Green Version]
- Spielman, S.E.; Logan, J.R. Using high-resolution population data to identify neighbourhoods and establish their boundaries. Ann. Assoc. Am. Geogr. 2013, 103, 67–84. [Google Scholar] [CrossRef] [PubMed]
- Blasco, D.; Guia, J.; Prats, L. Tourism destination zoning in mountain regions: A consumer-based approach. Tour. Geogr. 2014, 16, 512–528. [Google Scholar] [CrossRef]
- Clapp, J.M.; Wang, Y. Defining neighbourhood boundaries: Are census tracts obsolete? J. Urban Econ. 2006, 59, 259–284. [Google Scholar] [CrossRef]
- Deng, Y. Challenges and complications in neighborhood mapping: from neighborhood concept to operationalization. J. Geogr. Syst. 2016, 18, 229–248. [Google Scholar] [CrossRef]
- Galster, G.C. On the nature of neighbourhood. Urban Stud. 2001, 38, 2111–2124. [Google Scholar] [CrossRef]
- Hipp, J.R.; Faris, R.W.; Boessen, A. Measuring ‘neighbourhood’: Constructing network neighbourhoods. Soc. Netw. 2012, 34, 128–140. [Google Scholar] [CrossRef] [Green Version]
- Haynes, R.; Daras, K.; Reading, R.; Jones, A. Modifiable neighbourhood units, zone design and residents’ perceptions. Health Place 2007, 13, 812–825. [Google Scholar] [CrossRef]
- Goodman, A.C. Housing submarkets within urban areas: Definitions and evidence. J. Reg. Sci. 1981, 21, 175–185. [Google Scholar] [CrossRef]
- Milbrath, G.R.; DeGuzman, P.B. Neighbourhood: A Conceptual Analysis. Public Health Nurs. 2015, 32, 349–358. [Google Scholar] [CrossRef] [PubMed]
- Vasiliadis, C.H.A.; Kobotis, A. Spatial analysis—An application of nearest-neighbour analysis to tourism locations in Macedonia. Tour. Manag. 1999, 20, 141–148. [Google Scholar] [CrossRef]
- Chhetri, P.; Arrowsmith, C. GIS-Based modelling of recreational potential of nature-based tourist destinations. Tour. Geogr. 2008, 10, 233–257. [Google Scholar] [CrossRef]
- Pearce, D.G. An integrative framework for urban tourism research. Ann. Tour. Res. 2001, 28, 926–946. [Google Scholar] [CrossRef]
- Li, G. Statistical testing techniques. In Handbook of Research Methods in Tourism-Quantitative and Qualitative Approaches; Dwyer, L., Gill, A., Seetaram, N., Eds.; Edward Elgar Publishing: Cheltenham, UK, 2012; pp. 13–30. [Google Scholar]
- Grimm, L.G. Statistical Applications for the Behavioral Sciences; Wiley: New York, NY, USA, 1993. [Google Scholar]
- Hartigan, J.A.; Wong, M.A. Algorithm AS 136: A k-means clustering algorithm. J. R. Stat. Soc. Ser. C Appl. Stat. 1979, 28, 100–108. [Google Scholar] [CrossRef]
- Brida, J.G.; Disegna, M.; Scuderi, R. Visitors of two types of museums: A segmentation study. Expert Syst. Appl. 2013, 40, 2224–2232. [Google Scholar] [CrossRef] [Green Version]
- Fisher, R.A. The Genetical Theory of Natural Selection: A Complete Variorum Edition; Oxford University Press: Oxford, UK, 1930. [Google Scholar]
- Caliński, T.; Harabasz, J. A dendrite method for cluster analysis. Commun. Stat. 1974, 3, 1–27. [Google Scholar]
- Fix, E.; Hodges, J.L., Jr. Discriminatory Analysis-Nonparametric Discrimination: Consistency Properties; DTIC Document: Randolph Filed, TX, USA, 1951. [Google Scholar]
Figure 1.
Location of the Canary Islands. Source: Google Maps.

Figure 2.
Local tourism destinations in Adeje and Arona (South Tenerife). Source: Canary Islands Statistical Office (ISTAC).
Figure 2.
Local tourism destinations in Adeje and Arona (South Tenerife). Source: Canary Islands Statistical Office (ISTAC).

Figure 3.
Outline of the methods used.

Figure 4.
Variation coefficients according to variables and units of analysis in Adeje bed-places. Source: Head Office of Land Registry.
Figure 4.
Variation coefficients according to variables and units of analysis in Adeje bed-places. Source: Head Office of Land Registry.

Figure 5.
Variation coefficients according to variables and units of analysis in Arona bed-places. Source: Head Office of Land Registry.
Figure 5.
Variation coefficients according to variables and units of analysis in Arona bed-places. Source: Head Office of Land Registry.

Figure 6.
Results of the k-means cluster analysis for Adeje and Arona bed-places.

Figure 7.
Grouping analysis results. Prepared by authors using ArcGIS.

Figure 8.
Proposal to modify local destinations according to the results of the grouping analysis. Author prepared using ArcGIS.
Figure 8.
Proposal to modify local destinations according to the results of the grouping analysis. Author prepared using ArcGIS.


Table 1.
Summary of literature on tourist destinations based on the focus of the concept of destination used.
Table 1.
Summary of literature on tourist destinations based on the focus of the concept of destination used.
| Focus | Authors/Works |
|---|---|
| Geographic aspects | Bull [16]; Nadeau et al. [17] |
| Resources and tourism supply | Kim [18]; Buhalis [19]; Cooper et al. [20]; and Murphy et al. [21] |
| Attractions | Gunn and Var [22] |
| Tourist experiences | Bornhorst et al. [23]; Murphy et al. [21]; and Buhalis [19] |
| Network nature | Baggio and Cooper [24]; Candela and Figini [4]; Rodríguez-Díaz and Espino-Rodríguez [25]; Scott et al. [26]; and Jackson and Murphy [27] |
| Tourist subjectivity | Buhalis [19]; Bornhorst et al. [23]; and UNWTO [28] |
Prepared by authors.
Table 2.
Tourism statistics for local destinations in 2016.
| Average Length of Stay | Occupancy Rate | Average Daily Rate (ADR) | Revenue Per Available Room (RevPAR) | |
|---|---|---|---|---|
| Adeje | 8.1 | 80.4% | 93.61 € | 83.08 € |
| Callao Salvaje | 8.3 | 61.9% | 60.60 € | 52.12 € |
| Playa Paraíso | 7.2 | 84.9% | 90.90 € | 84.36 € |
| Playa de El Duque | 8.0 | 85.9% | 143.65 € | 127.09 € |
| Costa Adeje | 8.4 | 83.2% | 77.14 € | 69.89 € |
| Torviscas and Fañabé Alto | 7.9 | 72.8% | 55.25 € | 46.29 € |
| Las Américas—Adeje | 7.9 | 77.2% | 79.33 € | 69.63 € |
| Arona | 8.3 | 73.8% | 77.94 € | 66.47 € |
| Las Américas—Arona | 8.3 | 78.1% | 80.75 € | 70.24 € |
| Los Cristianos | 8.4 | 65.4% | 71.90 € | 58.98 € |
| Costa del Silencio | 8.2 | 64.9% | 69.69 € | 56.44 € |
Source: Tourism Accommodation Survey, ISTAC.
Table 3.
Weight of accommodation establishments according to typology and category.
| Typology | Category | ||||||
|---|---|---|---|---|---|---|---|
| Hotels | Apart. | 1 * | 2 * | 3 * | 4 * | 5 * | |
| ADEJE | 71.0% | 29.0% | 2.8% | 12.7% | 30.8% | 42.7% | 10.9% |
| Callao Salvaje | 24.9% | 75.1% | 0.0% | 49.8% | 42.7% | 7.5% | 0.0% |
| Costa Adeje | 68.1% | 31.9% | 3.2% | 6.5% | 32.4% | 57.9% | 0.0% |
| Las Américas–Adeje | 70.0% | 30.0% | 0.0% | 25.3% | 24.6% | 50.1% | 0.0% |
| Playa Paraíso | 92.8% | 7.2% | 0.0% | 7.2% | 43.8% | 36.6% | 12.4% |
| Playa de El Duque | 91.4% | 8.6% | 0.0% | 0.0% | 18.0% | 39.9% | 42.1% |
| Torviscas and Fañabé Alto | 41.2% | 58.8% | 12.9% | 41.7% | 34.6% | 10.8% | 0.0% |
| ARONA | 26.9% | 73.1% | 8.3% | 12.0% | 46.2% | 29.1% | 4.3% |
| Costa del Silencio | 13.8% | 86.2% | 11.5% | 30.5% | 58.0% | 0.0% | 0.0% |
| Las Américas–Arona | 59.0% | 41.0% | 3.6% | 8.0% | 43.9% | 37.8% | 6.6% |
| Los Cristianos | 26.9% | 73.1% | 18.2% | 17.8% | 49.3% | 14.6% | 0.0% |
Source: Head Office of Land Registry. * Is the star rating.
Table 4.
Bilateral correlations between variables (bed-places).
| Age | Built Area | Plot Area | Floors | |
|---|---|---|---|---|
| Age | 1 | −0.282 ** | −0.179 ** | 0.223 ** |
| Built area | −0.282 ** | 1 | 0.678 ** | 0.241 ** |
| Plot area | −0.179 ** | 0.678 ** | 1 | 0.060 ** |
| Floors | 0.223 ** | 0.241 ** | 0.060 ** | 1 |
** Correlation is significant at the 0.01 level (bilateral).
Table 5.
Results of k-means cluster analysis for 15 conglomerates for Adeje and Arona bed-places. Percentages with respect to each local tourism destination.
Table 5.
Results of k-means cluster analysis for 15 conglomerates for Adeje and Arona bed-places. Percentages with respect to each local tourism destination.
| Local Destination | 1 | 2 | 3 | 4 | 5 | 6 | 7 | 8 | 9 | 10 | 11 | 12 | 13 | 14 | 15 | N |
|---|---|---|---|---|---|---|---|---|---|---|---|---|---|---|---|---|
| Playa Paraíso | 26.5% | 16.7% | 39.5% | 17.3% | 100% | |||||||||||
| Callao Salvaje | 7.5% | 13.4% | 8.2% | 70.8% | 100% | |||||||||||
| Playa de El Duque | 8.6% | 8.6% | 20.7% | 14.4% | 4.9% | 30.8% | 12.0% | 100% | ||||||||
| Costa Adeje | 4.5% | 7.0% | 32.1% | 5.4% | 5.3% | 4.2% | 35.2% | 6.1% | 0.3% | 100% | ||||||
| Torviscas and Fañabé Alto | 4.5% | 23.6% | 3.2% | 68.8% | 100% | |||||||||||
| Las Américas–Adeje | 13.1% | 70.5% | 16.4% | 100% | ||||||||||||
| Las Américas–Arona | 1.6% | 6.5% | 1.0% | 40.2% | 9.9% | 4.0% | 5.7% | 1.5% | 6.5% | 23.1% | 100% | |||||
| Los Cristianos | 10.5% | 6.5% | 29.2% | 5.9% | 2.3% | 45.6% | 100% | |||||||||
| Costa del Silencio | 13.3% | 8.4% | 15.5% | 44.5% | 18.3% | 100% | ||||||||||
| Resto de Adeje | 18.3% | 31.2% | 1.7% | 48.7% | 100% | |||||||||||
| Resto de Arona | 100% | 100% | ||||||||||||||
| Total | 4.1% | 3.3% | 4.0% | 26.1% | 7.4% | 1.9% | 4.2% | 7.4% | 2.7% | 3.0% | 24.2% | 9.5% | 0.0% | 1.6% | 0.7% | 100% |
Note: figures are highlighted in bold when a large share of a local destination lies inside a cluster; prepared by authors.
Table 6.
Results of ANOVA. Municipalities.
| F | Sig. | ||
|---|---|---|---|
| Age (Z score) | Inter- groups | 5300.872 | 0.000 |
| Built area (Z score) | Inter- groups | 61.925 | 0.000 |
| Plot area (Z score) | Inter- groups | 1045.822 | 0.000 |
| Floors (Z score) | Inter- groups | 3.956 | 0.047 |
| Mean of the internal variance of the groups | 0.858 | ||
Prepared by authors using IBM SPSS Statistics 21.
Table 7.
Results of ANOVA. Local destinations.
| F | Sig. | ||
|---|---|---|---|
| Age (Z score) | Inter- groups | 5830.555 | 0.000 |
| Built area(Z score) | Inter- groups | 1785.705 | 0.000 |
| Plot area (Z score) | Inter- groups | 3046.815 | 0.000 |
| Floors (Z score) | Inter- groups | 1150.211 | 0.000 |
| Mean of the internal variance of the groups | 0.717 | ||
Prepared by authors using IBM SPSS Statistics 21.
© 2020 by the authors. Licensee MDPI, Basel, Switzerland. This article is an open access article distributed under the terms and conditions of the Creative Commons Attribution (CC BY) license (http://creativecommons.org/licenses/by/4.0/).
Share and Cite
MDPI and ACS Style
Rodríguez-Rodríguez, Y.; Hernández-Martín, R. Expert Consensus Versus Statistical Techniques in the Delimitation of Tourism Destinations. Sustainability 2020, 12, 2540. https://doi.org/10.3390/su12062540
AMA Style
Rodríguez-Rodríguez Y, Hernández-Martín R. Expert Consensus Versus Statistical Techniques in the Delimitation of Tourism Destinations. Sustainability. 2020; 12(6):2540. https://doi.org/10.3390/su12062540
Chicago/Turabian StyleRodríguez-Rodríguez, Yurena, and Raúl Hernández-Martín. 2020. "Expert Consensus Versus Statistical Techniques in the Delimitation of Tourism Destinations" Sustainability 12, no. 6: 2540. https://doi.org/10.3390/su12062540
Note that from the first issue of 2016, this journal uses article numbers instead of page numbers. See further details here.