Article

An Experimental Approach to Understanding the Impacts of Monitoring Methods on Use Intentions for Autonomous Vehicle Services: Survey Evidence from Japan

1
Japan Transport and Tourism Research Institute, 3-18-19 Toranomon, Minato-ku, Tokyo 105-0001, Japan
2
School of Environment and Society, Tokyo Institute of Technology, 2-12-1 O-okayama, Meguro-ku, Tokyo 152-8552, Japan [email protected] (Y.K.), [email protected] (D.F.)
*
Author to whom correspondence should be addressed.
Sustainability 2020, 12(6), 2157; https://doi.org/10.3390/su12062157
Submission received: 27 January 2020 / Revised: 27 February 2020 / Accepted: 9 March 2020 / Published: 11 March 2020

Abstract

:
Safety guidelines for autonomous vehicles (AVs) in many regions or countries require AV service providers to have the means to communicate with vehicles and the ability to stop them safely in case of emergencies. The transition to full deployment of AV services is dependent on more advanced monitoring methods. This study uses a survey of approximately 2000 residents of Japanese cities to investigate how monitoring methods affect their intentions to use these services. In particular, the survey is designed to understand how individuals react to unattended operations and remote monitoring in road passenger services including buses and taxis; the survey includes direct questions about intentions to use autonomous buses and taxis and a stated choice experiment based on the respondents’ preferences over their current mode of transportation and autonomous taxis. The results show that monitoring methods have mixed impacts. On one hand, monitoring could affect the general acceptance of AV services. The difference in the overall resistance to using these services is particularly large between the onboard human and remote monitoring options. Individuals tend to express stronger resistance to more advanced remote monitoring. On the other hand, the stated choice results show that the effects of these monitoring factors could be less significant in the actual settings of transportation mode choices; the effects of travel cost and time factors are likely to be more significant. These results suggest that when individuals consider AVs in the context of real-world decisions, their resistance to new technologies is diminished in comparison to their responses to abstract questions.

1. Introduction

Many mobility service projects using autonomous vehicles (AVs) have been launched worldwide and are currently between the field-testing and early stage introductory phases. For instance, large technology companies and car manufacturers have begun preparing for large-scale deployments of autonomous taxis and ride-hailing services, and such a service has begun in a US city with emergency drivers onboard [1,2]. Transit operators in Japan are developing fixed-route services using autonomous buses [3]. The Japanese government has plans to achieve Level 4 deployment of AV services by around 2020 in specific areas [4]—that is, deployment without emergency drivers. SAE (SAE, J3016) Autonomy Level 1 refers to steering or brake/acceleration support. Level 2 refers to steering and brake/acceleration support. A Level 3 self-driving system can monitor the driving environment in a limited space or under special circumstances but requires a driver onboard to take over the control when the system cannot execute a task. Level 4 or 5 self-driving systems require no human interventions.
At the same time, many companies are involved in developing remote monitoring/control systems for AVs. These systems make it possible to monitor vehicles and, if necessary, execute driving tasks remotely using telecommunication [5]. These systems can be deployed in AV services; AV safety guidelines in many regions or countries require AV service providers to have the means to communicate with vehicles and the ability to stop them safely in case of emergencies (see references [6,7] for Japan). The safety guidelines in Japan fall under the nationwide agenda of the general policy for establishing a legal system concerning AVs and were made public in 2018. This policy aims to establish the legal system during the “transition period” between 2020 and 2025, wherein conventional and autonomous fleets will co-exist on public roads, but with the former dominating the latter. It covers every legal issue, such as vehicles’ safety standards, road traffic rules, and liabilities [6].
The monitoring of AVs in mobility services is a critical issue in the establishment of their institutional/regulatory framework and large-scale deployment. Although the safe operation of conventional buses and taxis is ensured primarily by drivers, this situation dramatically changes in AV services. One of the related institutional challenges is establishing emergency management schemes for these new services. Further, monitoring AVs is a concern for potential service providers as it could increase their costs; for instance, introducing autonomous buses and taxis without onboard attendants and increasing the number of vehicles that can be managed by a remote operator avoids labor costs for monitoring vehicles. In sum, the transition to full deployment of AV services is dependent on more advanced AV monitoring; this requires an understanding of the related technology risks as well as user acceptance. However, the impact of AV monitoring on user acceptance remains unclear.
We hypothesize that the approach to AV monitoring is a significant determinant of user acceptance of AV services due to the following reason. Many studies have highlighted the link between concerns about general safety and the acceptance of AVs in addition to other factors (for a review, see Gkartzonikas and Gkritza [8]). For instance, perceived usefulness has the strongest effect on consumers’ intention to use AVs, while perceived trust factors, such as safety concerns, are the second most important determinant [9]. In particular, passengers’ experiences relating to the safety and security of public transit vehicles can be divided into three categories [10]: traffic safety pertains to the risks outside the vehicle (e.g., traffic accidents), in-vehicle security involves the fear of crime and the perceived sense of safety in a vehicle, and emergency management refers to the measures to address problems that might occur during the vehicle’s operation (e.g., emergency stop and evacuation guidance for passengers and ensuring safety in accidents). In this study, we focus on AV services’ monitoring methods that might particularly affect individuals’ perceptions of emergency management and eventually be a determinant of user acceptance of AV services.
To investigate the influence of monitoring methods on intentions to use AV services, we survey approximately 2000 residents of Japanese cities. The survey includes direct questions about the respondents’ intentions to use autonomous buses and taxis and a stated choice experiment based on their current mode of transportation and autonomous taxis. The considered conceptual methods of monitoring AVs are the onboard human and the two types of remote monitoring options. Note that this study investigates the intention to use AV services, not privately owned AVs.
The rest of this study is structured as follows. The next section reviews the literature on stated preferences toward intentions to use AVs. The third section describes the different methods of monitoring AV services. The fourth section presents the study’s methodology, including the survey design and administration, descriptive statistics for the data, and the specification of the model for the stated preference (SP) data obtained in the survey. The fifth section presents the results based on the direct questions and on the model estimation with SP data. The final section discusses these results and suggests directions for future research.

2. Literature Review

Efforts have been made to understand intentions to use AVs with the SP method. SP data are collected in experimental situations where respondents are presented with hypothetical choice situations [11,12]. Because AVs are still in the field-testing or early stage introductory phase, interviewing individuals about their intention to use AVs is based on what is essentially a hypothetical situation. However, these choice situations are familiar and realistic because they involve the use of transportation modes.
In a stated choice experiment for eliciting preferences over AVs, an individual is required to choose a preferred mode for traveling to his/her destination considering travel time, costs, and other factors from a range of available travel modes. For instance, Krueger et al. [13] investigated individuals’ preferences for autonomous taxis with a sample of 435 individuals in Australia; respondents were asked to specify a recent trip they had taken and then asked to choose a preferred mode of travel from among three options: the actual mode they had used and autonomous taxis with and without ride-sharing. Studying AV last-mile services for regional train trips, Yap et al. [14] analyze the stated preferences of a sample of 1149 individuals in the Netherlands. Haboucha et al. [15] analyzed the stated preferences for commuting by private cars, privately owned AVs, and autonomous taxis (with/without ride-sharing) within a sample of 721 individuals living in Israel and North America. These studies suggest attitudinal and psychological factors as a determinant of intentions to use AVs as well as travel time and costs. Such factors include trust in AVs, modality styles, attitudes toward driving, and environmental concerns. None of these studies have examined the impact of AV monitoring.
More recent studies have used the SP method for testing hypotheses related to AVs. Steck et al. [16] estimated changes in the value of travel time savings (VTTSs) for commuting due to vehicle automation with a sample of 172 individuals in Germany. Their respondents were required to watch a video familiarizing them with the appearance of privately owned AVs and autonomous taxis; they then conducted a choice experiment. The results revealed a 30% decrease in the VTTSs for private car users with vehicle automation; the resulting VTTSs for private AV use are the same as those for public transit use. Kolarova et al. [17] found a 41% VTTS reduction in car commute trips but not in leisure/shopping trips using a similar setting with a sample of 511 individuals in Germany. Correia et al. [18] reported a 26% VTTS reduction due to vehicle automation for car drivers if they worked in the vehicle using a choice experiment with a sample of 500 individuals in the Netherlands. Finally, Lavieri and Bhat [19] analyzed the willingness to share rides with strangers in AV services using a choice experiment with a sample of 1607 commuters in the Dallas-Fort Worth-Arlington metropolitan area. They found that individuals are less sensitive to the presence of strangers in commute trips than in leisure trips.
In this study, we use a survey to extend SP-based analyses of the intention to use AVs to incorporate a critical issue in the deployment of AV services. Our survey has two technical characteristics. First, it covers individuals who are randomly chosen to represent the general public, which is similar to the studies reviewed above. This sampling strategy allows the inclusion of those with minimal interest in AVs. Although there have been numerous surveys worldwide of those who have ridden in AVs (e.g., Nordhoff et al. [20], Madigan et al. [21], Salonen [10], Xu et al. [22]), Nordhoff et al. [20] point out their limitations, such as selection bias, and recommend the use of larger samples that are representative of the entire population and/or in naturalistic rather than trial-based settings for future research. Second, our survey provides respondents with information on state-of-the-art legal developments pertaining to AVs, both current and anticipated by 2025. This approach is likely to reduce possible biases that may affect surveys of respondents who have never ridden in AVs and increase the validity of the results.

3. Monitoring in AV Services

The safety monitoring of motor-vehicle transportation services (e.g., buses, taxis, and trucks) could change drastically once AVs are introduced in these services. In the current Japanese regulation for conventional services, an operation manager holding the corresponding national license is required for the management of a specific number of vehicles in every operator’s office. The operation manager is responsible for supervising drivers, for instance, by conducting checks on fatigue and health conditions [23]. Additionally, bus and taxi drivers need a specific commercial license to ensure safety, and further safety reviews are conducted when drivers own their taxis. This current regulation implies that drivers, backed up by operation managers, are primarily responsible for ensuring safe operations.
In this study, we present survey respondents with three conceptual types of monitoring of AV services that are based on our discussions with system developers and potential service providers. As we found out from three system developers and seven potential service providers in Japan, remote controlled tasks are not necessarily undertaken before emergency help is dispatched to the site; the skills and official qualifications required to complete them safely need further discussions. In most cases, remote monitoring staff is required in the deployment and follows the related manual. Insurance companies partly cooperate with service providers in these emergency management procedures.
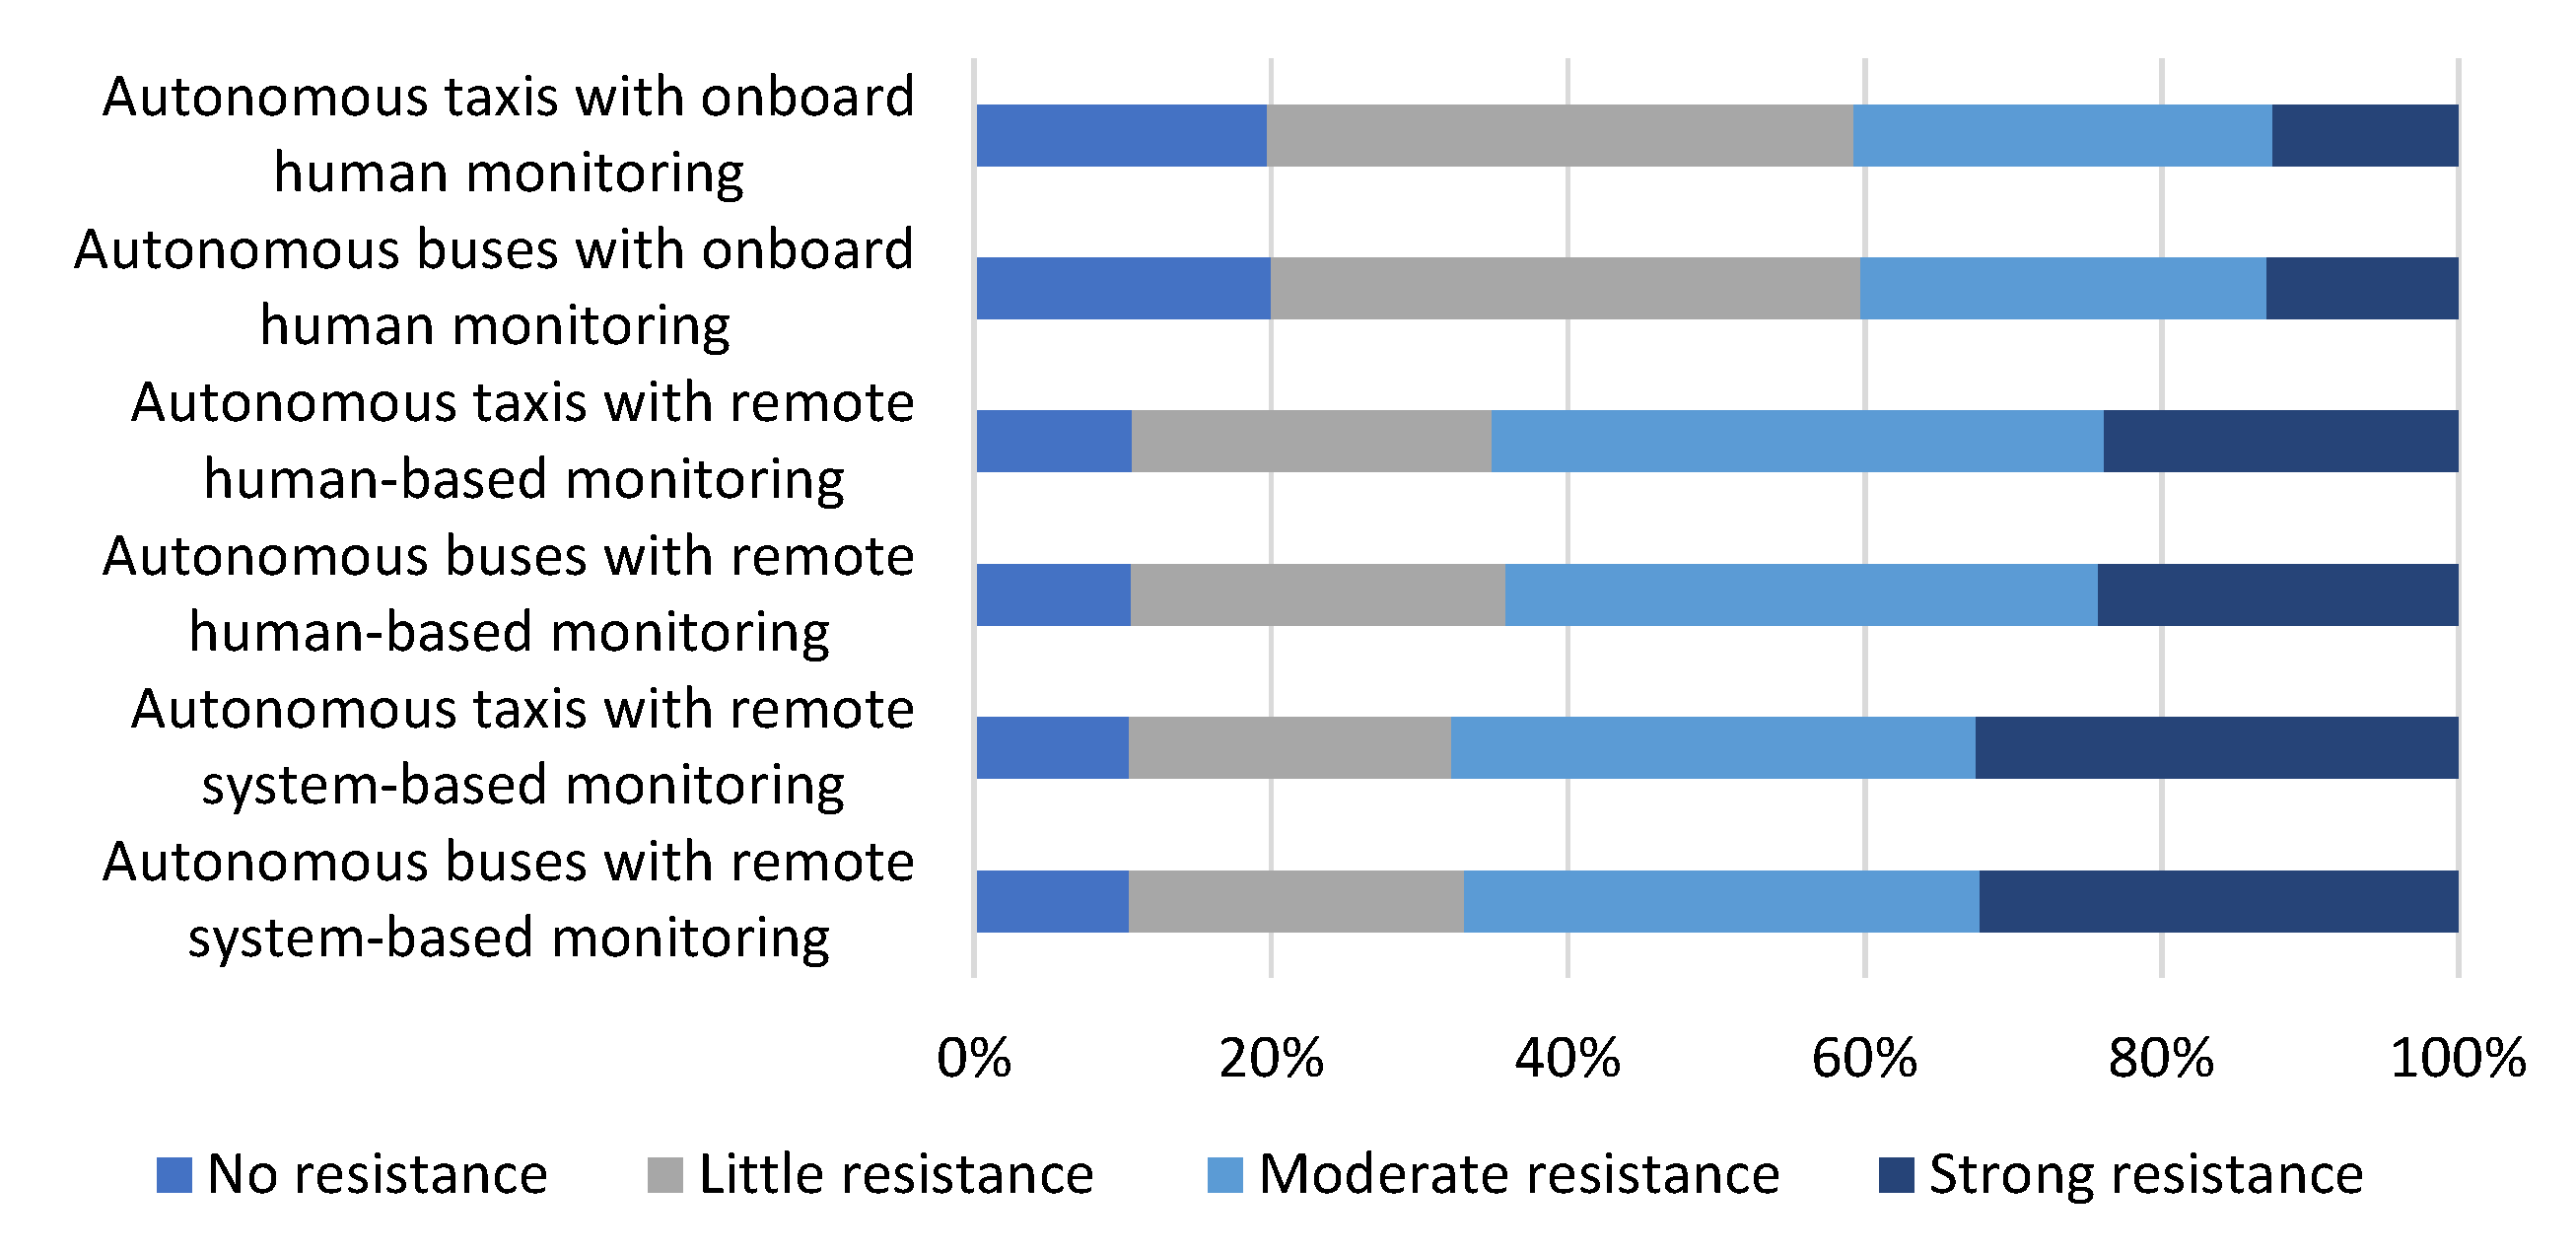
  • Onboard human monitoring: Passengers are accompanied by an attendant. The attendant monitors events occurring inside and outside the vehicle in addition to the vehicle operation. In emergencies, the attendant directs and stops the vehicle.
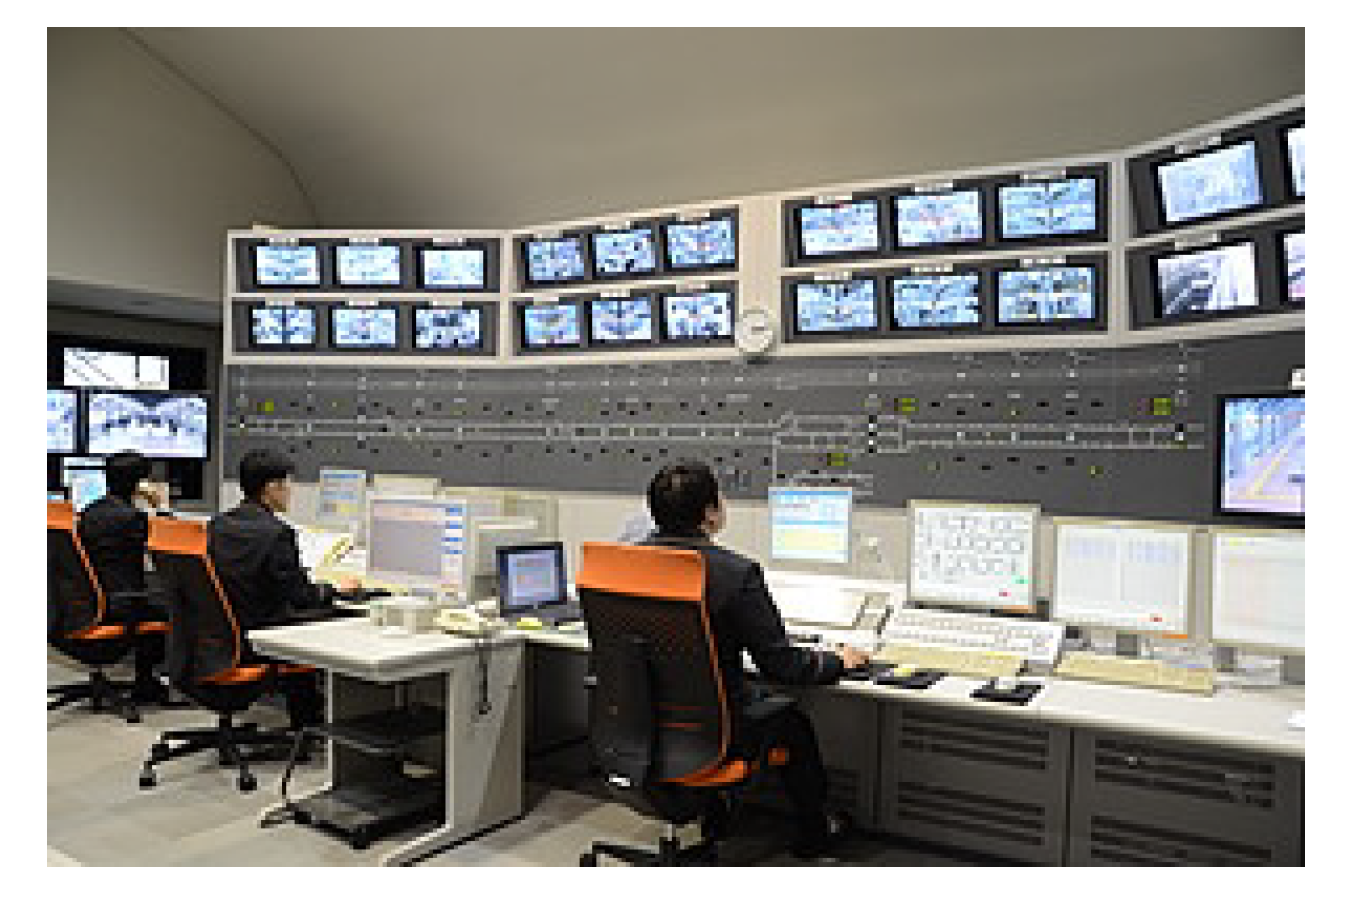
  • Remote human-based monitoring: Passengers ride unaccompanied, and an operator remotely monitors events occurring inside and outside the vehicle in addition to the vehicle operation. In emergencies, the remote operator directs and stops the vehicle. See Figure 1 for an illustration.
  • Remote system-based monitoring: Passengers ride unaccompanied, and a computer system monitors events occurring inside and outside the vehicle in addition to the vehicle operation. When the system detects an emergency, a remote human operator directs and stops the vehicle. See Appendix A for more information. This method implies the minimal intervention of humans for monitoring AVs.
As the three explanations show, each monitoring type features a unique approach to monitoring the operations of AV services and dealing with emergencies. It should be noted that technical issues unrelated to safety and security could also affect the monitoring method used in practice. For instance, monitoring may also involve customer service (e.g., fare collection) or communications with disabled passengers. (As we found out from potential service providers, technical solutions to some of these issues are already addressed in the deployment without onboard attendants.)

4. Method

4.1. Survey Design

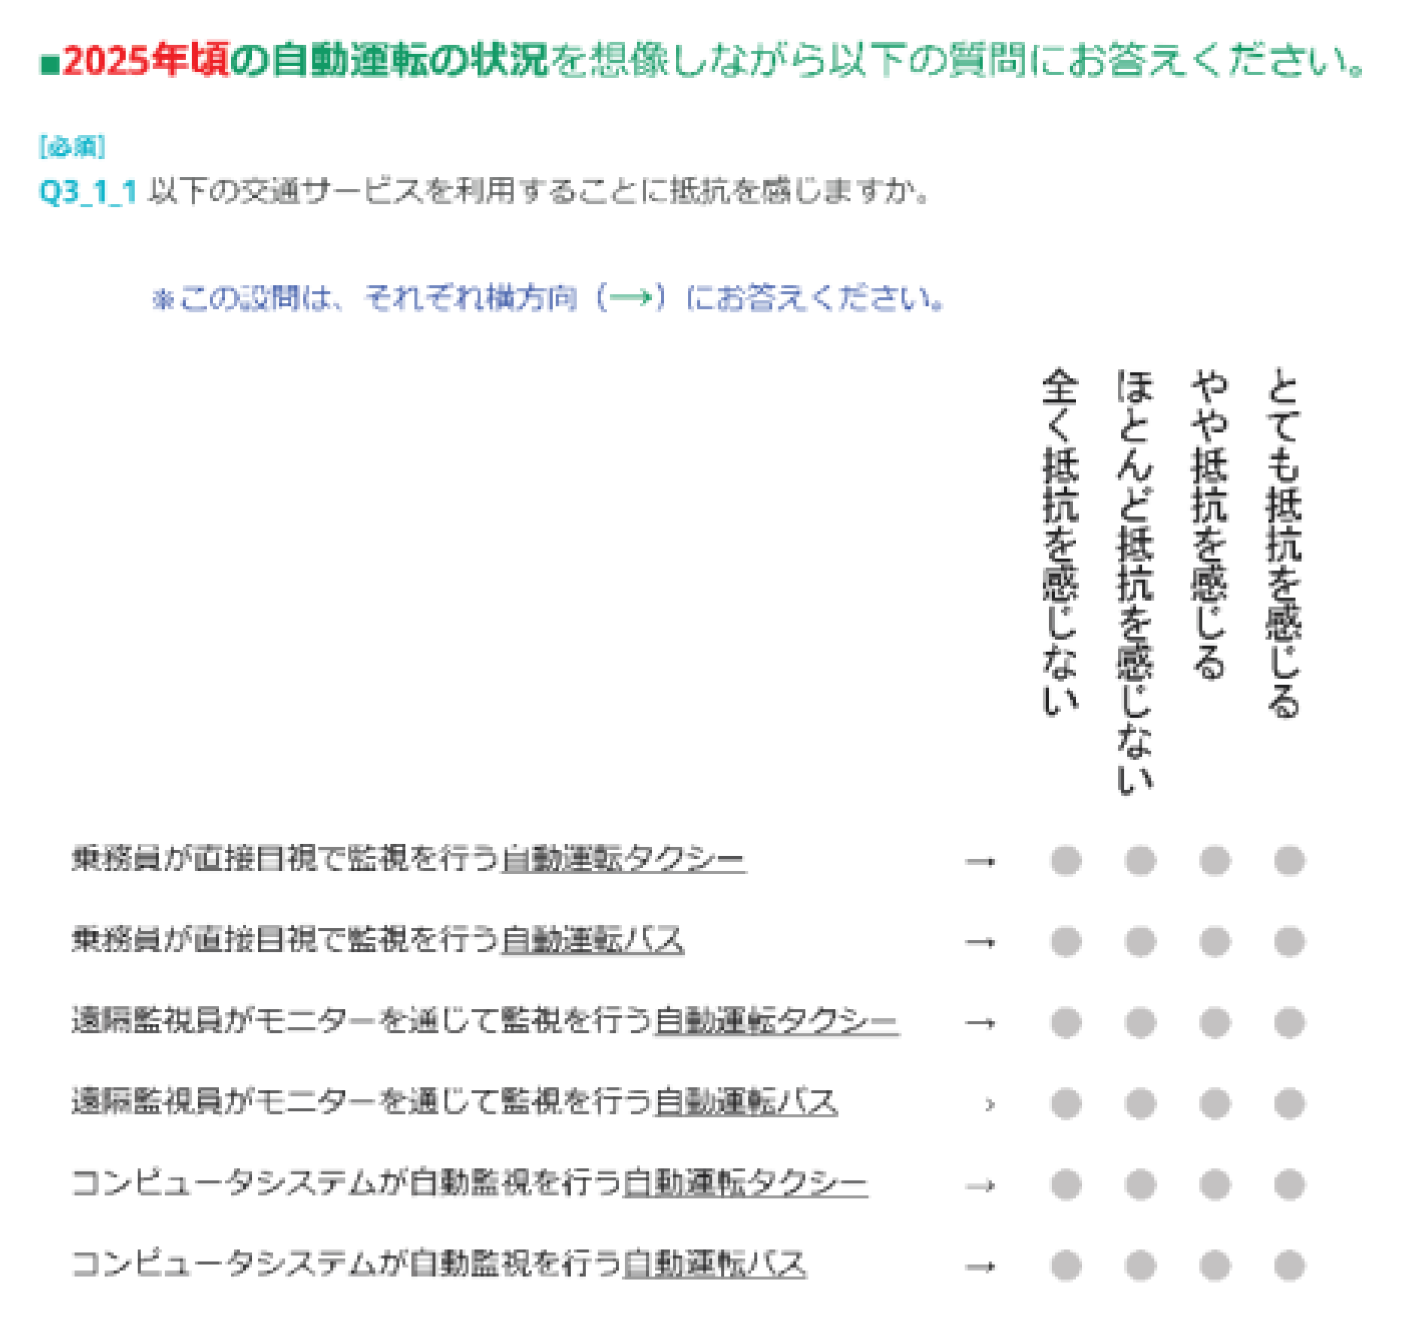
4.1.1. Questionnaire Items

A web-based questionnaire survey is utilized in this study. The questionnaire items are as follows: (1) perception of transportation technology and experiences of riding in AVs and using ride-sharing/hailing service, (2) details of a recent trip (described below), (3) a direct question on the intention to use autonomous buses and taxis, (4) a stated choice experiment on the intention to use autonomous taxis based on the recent trip, (5) attitudes toward risks and new goods and services, and (6) individual and household socioeconomic characteristics. This survey’s original questionnaire sheet relating to information provision on AVs and items (3) and (4) is attached in Appendix A and Appendix B.

4.1.2. Information Provision

First, we briefly present respondents with information on autonomy levels (SAE, J3016) and the current market penetration of Level 1/2 technologies. We also present the Japanese government’s 2025 targets for the use of privately owned AVs. The government has aimed to help deploy Level 3 and 4 private cars on expressways beginning in 2020 and 2025, respectively. We also explain that “these cars are expected to be required to satisfy safety guidelines prepared for AVs (as a vehicle).”
Second, we present the Japanese government’s targets for the use of autonomous buses and taxis. The government anticipates deployment of these services in a limited number of areas by 2020 and in more than 100 areas by 2030. We also present a field-test case of autonomous taxis on Tokyo’s public roads. This is followed by an explanation of the three monitoring methods (as discussed in the previous section) accompanied with illustrations.
Then, we ask respondents to rate their resistance to AVs on a four-point Likert scale in response to the direct question: “How much resistance do you have to using autonomous buses and taxis monitored under each method?” This question is followed by a stated choice experiment.

4.1.3. Design of Stated Choice Experiment

Our stated choice experiment focuses on each respondent’s recent trip. It is structured as follows: we first explain the definition of a trip using a figure and ask the number of trips taken on the most recent day the respondent had a trip. Next, one trip is randomly chosen (by the survey system) from among the reported trips, and this trip is treated as the reference trip in the choice experiment. We then ask the details of this trip, including in-vehicle time, total wait and transfer time (if any), time required to get to a station (if any), travel costs (i.e., fares, season ticket use, and tolls, if any), places of origin and destination, and travel distance. If the respondent cannot recall the distance, he/she is required to measure the shortest car travel distance between the origin and destination points using the Google Maps service, whose link is provided.
In the choice experiment, each respondent is required to rate his/her preference over the actual mode of travel (Alternative 1) and autonomous taxis (Alternative 2) for his/her recent trip on a four-point Likert scale. Each respondent considers travel attributes of these two modes while rating his/her preference in this experiment. The attributes of autonomous taxis are travel costs (per capita), in-vehicle time, wait time, and the monitoring method. The actual mode’s attributes are travel costs (applicable only to public transit users), in-vehicle time, and other time, such as total wait and transfer time and time required to get to a station (applicable only to public transit users). The response options are Response 1—“I will choose Alternative 1,” Response 2—“I may choose Alternative 1,” Response 3—“I may choose Alternative 2,” and Response 4—“I will choose Alternative 2” in order to account for uncertainty about the decision.
The attributes of autonomous taxis are customized for each individual and presented to him/her in the choice experiment. First, the current taxi fare is computed as the “recent trip’s distance” multiplied by the “current taxi fare per capita per km (in the respondent’s city).” The current in-vehicle time is computed as the “recent trip’s distance” divided by the “current average taxi (car) travel speed (in the respondent’s city).” Abe [24] provides a summary of the current taxi fares and travel speeds in nine Japanese city categories that is used for these calculations. Current taxi fares per capita are obtained by dividing taxi fares by the average occupancy. Second, the attributes of autonomous taxis are computed by multiplying these base values by a specified percentage. Table 1 presents the percentages used to compute the travel costs and time attributes of autonomous taxis. It is estimated that taxi operating costs will be reduced to approximately 30% of their current level in the final phase of vehicle automation in Japanese cities [24]. Given the assumption of a small profit margin [24], Table 1 employs this value to compute autonomous taxi fares along with cost estimates of 50% and 70% that reflect the period of transition to the final phase. We also vary the percentage by which in-vehicle time is reduced by autonomous taxis, as shown in Table 1. We do not have a robust basis for assumptions about the level of this reduction; instead, it is possible that in-vehicle time might not change considerably. The percentages of in-vehicle time reduction shown in Table 1 are drawn from our calibrated results after a pre-test of this choice experiment. The in-vehicle time in autonomous taxis will include the actual car travel time for most respondents. Third, Table 1 shows that wait times for autonomous taxis are set at 2 min, 6 min, and 10 min. The definition of wait times is not provided to respondents. These values are based on those used in the previous SP studies reviewed in Section 2. Note that individuals’ activities while waiting for a taxi might depend on the place/origin of the trip and other factors. The assumption of autonomous taxis’ wait times may need improvement in future SP studies. Fourth, Table 1 also shows that the monitoring methods are those defined in the previous section. In summary, every attribute of autonomous taxis has three levels.
Finally, respondents are required to conduct three repeated choices in which each choice set has different levels of the attributes for autonomous taxis. Further, respondents are randomly assigned to one of nine blocks when they begin the questionnaire, and each block has a different choice set. An R package [25] is used to produce choice sets for the nine blocks based on the orthogonal main-effect arrays. Our online choice experiment form (shown in Appendix B) was developed by a professional online survey company, and it was optimized for viewing on PCs, tablets, and smartphones. Pre-tests of this choice experiment were conducted by the company as well as our survey team.

4.1.4. Attitudes, Perception, and Experience

As for questionnaire items regarding attitudes, “attitudes toward risk” are measured by three questions and “attitudes toward new goods and services” are measured by five. Respondents answer each question on a four-point scale regarding “attitudes toward risk” and a five-point scale regarding “attitudes toward new goods and services,” and the sum of responses over the related questions comprises each attitudinal score. Respondents are then assigned to one of three groups representing levels of the attitudinal score. Variables indicating group membership are used in the model to be estimated. Note that this study employs the questions used in Akuto [26] for measuring each attitudinal variable.
This procedure is also applied to create variables measuring the perception of transportation technology (based on five related questions on a four-point scale) and experiences of using ride-sharing/hailing service (based on three related questions on a four-point scale). Experiences of riding in AVs are represented by a dichotomous variable indicating whether the respondent has ridden in AVs or not.

4.2. Survey Administration

We conducted a web-based questionnaire survey of individuals aged 20 to 74 living in Japanese cities. The target cities were selected to include every city type nationwide and matched those included in the National Person Trip Survey in Japan. This national travel survey is conducted to create a representative sample of the travel behavior of individuals who live in Japanese cities after clustering these cities. The sampling frame covered 85% of the nation’s population. The sample for our survey represents the distributions of the population across these city types.
Our survey’s participants were recruited from a panel constructed by the professional online survey service in January 2019. The invitation to our survey was sent on both weekdays and weekends to achieve greater variation in the respondents’ recent trips. On these trip days, no large snowfalls were observed in urban areas nationwide, and the impacts of sudden weather changes could be minimal.

4.3. Sample and Descriptive Statistics

Of the 1962 individuals who responded to the survey, 48.3% identified a weekday trip as their most recent and the rest identified a Saturday/Sunday or holiday trip. The results we present for the direct question on the intention to use autonomous buses and taxis are drawn from this group of respondents.
For the SP analysis, we use a sample of 1663 individuals and 4989 stated choice observations (i.e., 1663 individuals x 3 repeated choices) derived by screening the recent trip responses. From the original sample of 1962 individuals, 299 recent trip responses were excluded for the following reasons: (1) the trips were either too short or too long in distance or time (i.e., 100m or shorter, 50km or longer, four hours or more in-vehicle times, and two hours or more other times); (2) the trips were irregular (i.e., 10km or longer on foot/by cycling); and/or (3) the trips’ in-vehicle times were either too short or long compared to alternative’s (autonomous taxi) time (i.e., a ratio of 1/2.5 or smaller or a ratio of 2.5 or higher).
Table 2 shows the descriptive statistics for the respondents’ characteristics. The shares of the age and gender groups are not representative of the population. Thus, they are adjusted to represent the population in terms of shares of gender and age groups (by weighting) when the results of the direct question are presented.
Table 3 shows the descriptive statistics for the characteristics of the respondents’ recent trips. The travel costs for car/motorbike trips need to be estimated for the use in the analysis with SP data because respondents did not provide this information. Here we assume a cost of JPY6.75 per kilometer for car trips and JPY4.5 per kilometer for motorbike trips. Any reported tolls are added to these per kilometer charges. Further, season ticket use is considered for rail/bus trips in the analysis with SP data. Here we assume that the average discounts for season tickets are 40% for rail and 30% for buses; these discounts are applied to reported regular fares if the respondent used a season ticket in his/her recent trip.
Finally, the shares of observations for each choice are 67.2% for Response 1 (“I will choose Alternative 1 = actual mode of travel”), 26.2% for Response 2 (“I may choose Alternative 1”), 5.3% for Response 3 (“I may choose Alternative 2 = autonomous taxis”), and 1.3% for Response 4 (“I will choose Alternative 2”).

4.4. Behavioral Model Specification

We estimate a panel mixed ordered logit (OL) model using SP data obtained from the stated choice experiment to understand the impact of monitoring methods on the intention to use autonomous taxis. A mixed model can capture the heterogeneity of individual preferences, such as differences in the value of time, while a panel mixed model accounts for the repeated choice situations for each individual in the parameter estimation.
In our OL model, the responses of each individual are ordered on a four-point scale ranging from Response 1 (“I will choose Alternative 1”) to Response 4 (“I will choose Alternative 2”). The utility of individual n is specified as: U n = β n X n + ε n , where X n is a vector of observed variables, such as the difference in the travel attribute (e.g., cost and time) between two alternatives, β n is a vector of these variables’ coefficients, and ε n is a random term with a logistic distribution. The OL probabilities of choosing Responses 1, 2, 3, and 4 (conditional on β n ) are obtained as follows:
L n , 1 = e k 1 β n X n 1 + e k 1 β n X n , L n , 2 = e k 2 β n X n 1 + e k 2 β n X n e k 1 β n X n 1 + e k 1 β n X n , L n , 3 = e k 3 β n X n 1 + e k 3 β n X n e k 2 β n X n 1 + e k 2 β n X n , and L n , 4 = 1 e k 3 β n X n 1 + e k 3 β n X n ,
where L n , i is the OL probability of choosing Response i and k 1 , k 2 , and k 3 are a threshold of the utility level between choosing Responses 1 and 2, Responses 2 and 3, and Responses 3 and 4, respectively. Note that k 1 < k 2 < k 3 .
The mixed OL model allows the coefficients β to vary across individuals with density f ( β | θ ) . In this study, f ( β | θ ) is specified as normal, where θ refers to the parameters, including the mean and standard deviation of β ; θ then needs to be estimated. Further, the specification allows the coefficients to vary across individuals while remaining constant over choice situations for each individual (Train, 2009). In this study, we have three repeated choices for each individual, and then we have the joint probability of choosing a sequence of three responses:
P n , { i 1 , i 2 , i 3 } = L n , i 1 L n , i 2 L n , i 3 f ( β | θ ) d β ,
where L n , i t is the conditional OL probability of choosing Response i t in choice situation t , in which the random term in the corresponding utility is independent across choice situations.
Finally, the parameters are estimated with the maximum simulated likelihood approach. In this study, the number of draws to be averaged is set at 300 for obtaining each P n , { i 1 , i 2 , i 3 } . A simulated log likelihood, S L L , of the joint probabilities is obtained as follows:
L L = n = 1 N { i 1 , i 2 , i 3 } d n , { i 1 , i 2 , i 3 } ln P ˇ n , { i 1 , i 2 , i 3 } ,
where P ˇ n , { i 1 , i 2 , i 3 } is the simulated probability corresponding to P n , { i 1 , i 2 , i 3 } and N is the number of respondents. d n , { i 1 , i 2 , i 3 } = 1 if individual n chooses a sequence of responses { i 1 , i 2 , i 3 } and zero otherwise. The number of all possible combinations of this sequence is 12 (4 responses × 3 choices).

5. Results

5.1. Results of Direct Questioning

Figure 2 and Figure 3 show the results for the direct question about the intention to use autonomous buses and taxis. Figure 2 shows the results of responses to the original six items (i.e., two modes × three monitoring methods). A chi-squared test indicates that the distribution of responses to each monitoring method is not significantly different at the 10% level between using autonomous buses and taxis. Meanwhile, within the same mode of travel (i.e., autonomous buses or taxis), the distribution of responses varies significantly (p < 0.01, according to a chi-squared test) for every pair of different monitoring methods.
Figure 3 shows the sum of responses on autonomous buses and those on autonomous taxis for each monitoring method. This figure shows that 41% of respondents express a moderate/strong resistance to using autonomous buses/taxis with onboard human monitoring, while 65% and 67% express this level of resistance with remote human-based and system-based monitoring, respectively. Thus, the difference in the overall resistance is large between onboard human and remote monitoring. Additionally, 24% of respondents express strong resistance to remote human-based monitoring, while 32% express strong resistance to remote system–based monitoring. Thus, more individuals express strong resistance to more advanced remote monitoring.

5.2. Results of Model Estimation with SP Data

Table 4 shows the results of the OL and panel mixed OL model estimations with SP data. Models 1 and 2 incorporate a variable indicating remote monitoring (i.e., remote human-based and system-based monitoring). Models 3 and 4 incorporate a variable indicating remote monitoring that is system-based. While our preferred models are the panel mixed OL models (Models 2 and 4), OL model (Models 1 and 3) results are also presented to support the overall robustness of the results of Models 2 and 4. We assume that in the panel mixed OL models travel time coefficients are distributed normally among the population, and the two cut-off values are distributed normally as well.
Table 4 shows that the two monitoring variables have no significant effect on intentions to use autonomous taxis in any of the models. Further, Table 5 examines the sensitivity of this finding by estimating a panel mixed OL model with different specifications of the monitoring variables, where all of the other variables are the same as those used in Models 2 and 4. Table 5 still shows that introducing the remote/remote human-based/remote system-based monitoring variables has no significant effects at the 5% level in any of the models estimated.
Table 4 also shows the effects of other variables. Travel cost and time variables have significant effects on the intention to use autonomous taxis in all of the models. Although the purpose of the recent trip does not significantly affect the intention to use autonomous taxis, travel mode affects it. In particular, current bus and taxi users are more likely to use autonomous taxis compared to those who walk or use rail, cars, or bicycles; motorbike users express the least willingness (in all of the models in Table 4). Finally, few socio-economic attributes have significant effects in the panel mixed OL models (Models 2 and 4), while some of the perception, experience, and attitudinal variables have strongly significant effects. For instance, those who have used a ride-hailing service tend to be more willing to use autonomous taxis.

6. Discussion and Conclusions

This study examined the impacts of monitoring methods on the intention to use AV services. The choice experiment was designed to understand how individuals would react to possible advances in monitoring methods of road passenger services including buses and taxis. A survey of approximately 2000 residents of Japanese cities showed mixed impacts of monitoring methods on the usage intentions. The direct question results implied that introducing remote monitoring may decrease the general intention to use autonomous buses and taxis, supporting our hypothesis that the monitoring method is a significant predictor of user acceptance of these services. This finding is consistent with previous studies showing that autonomous buses and taxis without a backup driver/attendant could reduce the intention to use such services [27,28]. Our study further demonstrated that how AVs are remotely monitored could also determine user acceptance. Meanwhile, the stated choice results implied that the effects of these monitoring factors could be less significant in the actual setting of transportation mode choices, given potentially large variations in monitoring’s implementation. In sum, the results showed individuals’ increased general resistance to more advanced monitoring as well as the possibility that such resistance could be moderated in actual daily travel decisions. These results were predicated on respondents being sufficiently informed as our survey included the state-of-the-art knowledge on AVs.
Respondents’ perception of the monitoring methods and their trust in traditional transportation services could affect the results. Originally, our research was designed to capture individuals’ perceptions of emergency management in AV services or the measures to address problems that might occur in their operations. Our survey’s explanation of each monitoring type highlighted its conceptual approach and how it deals with emergencies. More specifically, our survey presented respondents with a situation where current bus and taxi drivers’ tasks in an emergency situation were replaced by a remote system and provided without an attendant inside the vehicle. Our results revealed how individuals would react to this replacement or the unattended operations and remote monitoring in road passenger services including buses and taxis. Given the design of our experiment and the information provided within the survey, our respondents considered the general traffic safety and in-vehicle security conditions of AV services as being nearly equivalent to that of conventional buses and taxis. For instance, general in-vehicle security (e.g., risk of crime) conditions might be degraded by the introduction of remote monitoring, particularly for autonomous buses. Nevertheless, Figure 2 showed no significant differences between the resistance levels to using autonomous buses and taxis monitored by each method, implying that our respondents hardly regarded this change as a new risk. Furthermore, the monitoring variable may not strongly correlate with perception of general traffic safety (e.g., traffic accidents) conditions in such services as the autonomy levels are assumed to be the same across all the monitoring methods. Finally, trust in traditional transportation services depends on the region investigated; however, we could not indicate the level in this trust for Japan due to a lack of evidence and future related studies need to incorporate this issue.
The study does have some limitations. In particular, the estimated impacts of the monitoring methods from the choice experiment reflect their importance relative to other travel attributes. This research design was primarily based on a supply-side concern for Level 4 operations of such services. However, this design did not directly address the detailed process regarding individuals’ perceptions of the monitoring methods; instead, our understanding of this process was developed indirectly through our interpretations of the results. This study is still an initial exploration into that impact, and future studies can focus more on such a detailed process. At the least, this study might highlight monitoring methods as a relevant factor for understanding user acceptance of such services.
The study also suggests new directions for future research. First, emerging regulatory and technical issues of AVs should be incorporated into the design of research about potential users. Addressing them in the framework of user perception and behavior is a challenging task but one that can fill a knowledge gap and inform policymakers. Second, another potential topic for future studies could be a comparative perspective on the acceptance of different automated passenger services. For example, Fraszczyk and Mulley [29] analyzed public perceptions of driverless train operations (with attendants) and unattended train operation. Third, testing critical AV issues in a choice setting might yield real-world results that could identify the contributions of specific factors relative to classic attributes, such as time and costs. In this case, however, we observed an imbalance where the existing modes of travel were preferred in many cases. Therefore, future studies might identify settings where AV services can be a more competitive option, such as an access/egress mode for transit stations. Additionally, our stated choice experiment may not necessarily incorporate many detailed issues in actual travel conditions. One reason for this is that this study analyzed AV services that can be applied to diverse travel needs. An assumption of specific applications of AV services may also overcome this limitation. Finally, AV information provided to respondents is different between AV studies using SP methods and the effect of this difference might not be well known.

Author Contributions

Conceptualization, R.A. and D.F.; formal analysis—R.A. and Y.K.; funding acquisition, R.A. and D.F.; Investigation, R.A., Y.K., and D.F.; Methodology, R.A., Y.K., and D.F.; Project administration, R.A. and D.F.; Software, R.A., Y.K., and D.F.; Supervision, R.A. and D.F.; Validation, R.A. and Y.K.; Visualization, R.A. and Y.K.; Writing—original draft, R.A.; Writing—review and editing, R.A. and D.F. All authors have read and agreed to the published version of the manuscript.

Funding

This work was supported in part by JSPS KAKENHI Grant Number JP18K13854 and 17K18949 and also by the Japan Research Center for Transport Policy.

Conflicts of Interest

The authors declare no conflict of interest.

Appendix A. Questionnaire Sheet Relating to Information Provision on AVs

Please read the following explanation first.
-
Vehicles with “technology to support drivers” such as adaptive cruise control are already on the market. However, this technology alone requires drivers to steer, brake, or accelerate as needed to maintain safety.
-
In the near future, it is expected that vehicles with “advanced automated driving technology*” will be able to run on public roads. This is a technology in which sensors (e.g., LiDARs, cameras, and GPS) installed in the vehicle recognize its surrounding environment and the vehicle runs automatically. In this technology, since the automated driving system mainly controls the vehicle, the rider does not have to steer, brake, or accelerate.
*
Corresponds to Level 4 or 5 of driving automation in the definition of the SAE International.
Next, please read the explanation of the situation of automated driving around 2025.
Figure A1. Information provision on AVs. Note: original text is in Japanese.
Sustainability 12 02157 g0a1

Appendix B. Questionnaire Sheet Relating to Items (3) and (4)

Figure A2. Direct questioning. Note: the explanation reads “Assuming the situation of automated driving around 2025. How much resistance do you have to using the following transportation services?” See Figure 2 for the results.
Sustainability 12 02157 g0a2
Figure A3. Stated choice experiment. Note: the explanation reads “Assuming that one of the following two modes can be used for the x purpose of the y-th trip among all the trips you mentioned earlier.” The attributes are “Travel cost per capita,” “In-vehicle time,” “Other time (e.g., wait time and time required to get to a station),” and “Methods for ensuring safety in operations (Alternative 2 only).” The alternatives are “Alternative 1: current mode” and “Alternative 2: autonomous taxi.” The question reads “Which mode would you rather use?” The response options are “I will choose Alternative 1,” “I may choose Alternative 1,” “I may choose Alternative 2,” and “I will choose Alternative 2.”.
Sustainability 12 02157 g0a3

References

  1. Sage, A. Waymo Unveils Self-Driving Taxi Service in Arizona for Paying Customers. Reuters, 5 December 2018. Available online: https://www.reuters.com/article/us-waymo-selfdriving-focus/waymo-unveils-self-driving-taxi-service-in-arizona-for-paying-customers-idUSKBN1O41M2 (accessed on 16 July 2019).
  2. Tajitsu, N. Easy Ride Trial to Mark Nissan’s First Stop on Road to Taxi Services. Reuters, 23 February 2018. Available online: https://www.reuters.com/article/us-nissan-selfdriving/easy-ride-trial-to-mark-nissans-first-stop-on-road-to-taxi-services-idUSKCN1G70BP (accessed on 9 August 2018).
  3. Japan Automotive Daily. Odakyu Group, SB Drive Tie Up in Effort to Commercialize Self-Driving Buses, 8 June 2018. Available online: https://www.japanautomotivedaily.com/2018/06/08/odakyu-group-sb-drive-tie-up-in-effort-to-commercialize-self-driving-buses (accessed on 9 August 2018).
  4. Cabinet Office. SIP-Adus. The Government of Japan. Available online: http://en.sip-adus.go.jp/rd (accessed on 9 August 2018).
  5. Ministry of Land, Infrastructure, Transport and Tourism (MLIT). Necessary Procedure for Public Road Experiments of the Remote-Type Autonomous Driving System. Available online: https://www.mlit.go.jp/report/press/jidosha07_hh_000271.html (accessed on 26 June 2019). (In Japanese).
  6. Cabinet Secretariat. General Policy for Establishing a Legal System Concerning Autonomous Vehicles. The Government of Japan. Available online: https://www.kantei.go.jp/jp/singi/it2/kettei/pdf/20180413/auto_drive.pdf (accessed on 9 August 2018). (In Japanese).
  7. Ministry of Land, Infrastructure, Transport and Tourism (MLIT). Safety Guidelines for Autonomous Vehicles. Available online: http://www.mlit.go.jp/report/press/jidosha07_hh_000281.html (accessed on 21 February 2019). (In Japanese).
  8. Gkartzonikas, C.; Gkritza, K. What have we learned? A review of stated preference and choice studies on autonomous vehicles. Transp. Res. Part C Emerg. Technol. 2019, 98, 323–337. [Google Scholar] [CrossRef]
  9. Panagiotopoulos, I.; Dimitrakopoulos, G. An empirical investigation on consumers’ intentions towards autonomous driving. Transp. Res. Part C Emerg. Technol. 2018, 95, 773–784. [Google Scholar] [CrossRef]
  10. Salonen, A.O. Passenger’s subjective traffic safety, in-vehicle security and emergency management in the driverless shuttle bus in Finland. Transp. Policy 2018, 61, 106–110. [Google Scholar] [CrossRef]
  11. Train, E.T. Discrete Choice Methods with Simulation, 2nd ed.; Cambridge University Press: New York, NY, USA, 2009. [Google Scholar]
  12. Louviere, J.J.; Hensher, D.A.; Swait, J.D. Stated Choice Methods: Analysis and Application; Cambridge University Press: Cambridge, UK, 2000. [Google Scholar]
  13. Krueger, R.; Rashidi, T.H.; Rose, J.M. Preferences for shared autonomous vehicles. Transp. Res. Part C Emerg. Technol. 2016, 69, 343–355. [Google Scholar] [CrossRef]
  14. Yap, M.D.; Correia, G.; van Arem, B. Preferences of travellers for using automated vehicles as last mile public transport of multimodal train trips. Transp. Res. Part A Policy Pract. 2016, 94, 1–16. [Google Scholar] [CrossRef] [Green Version]
  15. Haboucha, C.J.; Ishaq, R.; Shiftan, Y. User preferences regarding autonomous vehicles. Transp. Res. Part C Emerg. Technol. 2017, 78, 37–49. [Google Scholar] [CrossRef]
  16. Steck, F.; Kolarova, V.; Bahamonde-Birke, F.; Trommer, S.; Lenz, B. How Autonomous Driving May Affect the Value of Travel Time Savings for Commuting. Transp. Res. Rec. 2018, 2672, 11–20. [Google Scholar] [CrossRef] [Green Version]
  17. Kolarova, V.; Steck, F.; Bahamonde-Birke, F.J. Assessing the effect of autonomous driving on value of travel time savings: A comparison between current and future preferences. Transp. Res. Part A Policy Pract. 2019, 129, 155–169. [Google Scholar] [CrossRef]
  18. Correia, G.H.; de, A.; Looff, E.; van Cranenburgh, S.; Snelder, M.; van Arem, B. On the impact of vehicle automation on the value of travel time while performing work and leisure activities in a car: Theoretical insights and results from a stated preference survey. Transp. Res. Part A Policy Pract. 2019, 119, 359–382. [Google Scholar] [CrossRef] [Green Version]
  19. Lavieri, P.S.; Garikapati, V.M.; Bhat, C.R.; Pendyala, R.M.; Astroza, S.; Dias, F.F. Modeling Individual Preferences for Ownership and Sharing of Autonomous Vehicle Technologies. Transp. Res. Rec. 2017, 2665, 1–10. [Google Scholar] [CrossRef] [Green Version]
  20. Nordhoff, S.; de Winter, J.; Kyriakidis, M.; van Arem, B.; Happee, R. Acceptance of Driverless Vehicles: Results from a Large Cross-National Questionnaire Study. J. Adv. Transp. 2018, 2018, 1–22. [Google Scholar] [CrossRef] [Green Version]
  21. Madigan, R.; Louw, T.; Wilbrink, M.; Schieben, A.; Merat, N. What influences the decision to use automated public transport? Using UTAUT to understand public acceptance of automated road transport systems. Transp. Res. Part F Traffic Psychol. Behav. 2017, 50, 55–64. [Google Scholar] [CrossRef]
  22. Xu, Z.; Zhang, K.; Min, H.; Wang, Z.; Zhao, X.; Liu, P. What drives people to accept automated vehicles? Findings from a field experiment. Transp. Res. Part C Emerg. Technol. 2018, 95, 320–334. [Google Scholar] [CrossRef]
  23. The National Examination Center for Motor Vehicle Operation Manager (NECO). Motor Vehicle Operation Manager. Available online: https://www.unkan.or.jp/about.html> (accessed on 26 June 2019). (In Japanese).
  24. Abe, R. Introducing autonomous buses and taxis: Quantifying the potential benefits in Japanese transportation systems. Transp. Res. Part A Policy Pract. 2019, 126, 94–113. [Google Scholar] [CrossRef]
  25. Aizaki, H. Basic Functions for Supporting an Implementation of Choice Experiments in R. J. Stat. Soft. 2012, 50, 1–24. [Google Scholar] [CrossRef] [Green Version]
  26. Akuto, H. Handbook of Social Survey; Nikkei Publishing: Tokyo, Japan, 1987. (In Japanese) [Google Scholar]
  27. Dong, X.; DiScenna, M.; Guerra, E. Transit user perceptions of driverless buses. Transportation 2019, 46, 35–50. [Google Scholar] [CrossRef]
  28. Nielsen, T.A.S.; Haustein, S. On sceptics and enthusiasts: What are the expectations towards self-driving cars? Transp. Policy 2018, 66, 49–55. [Google Scholar] [CrossRef] [Green Version]
  29. Fraszczyk, A.; Mulley, C. Public Perception of and Attitude to Driverless Train: A Case Study of Sydney, Australia. Urban Rail Transit 2017, 3, 100–111. [Google Scholar] [CrossRef] [Green Version]
Figure 1. Image of remote human-based monitoring. Source: Yurikamome, Inc. (Tokyo, Japan) provides an automated guideway transit service with unattended train operations. This image is used with permission.
Sustainability 12 02157 g001
Figure 2. Results of direct questioning (responses to original six items). Note: Respondents are those who are 20 to 74 years old living in Japanese cities. Shares of gender and age groups are adjusted to represent the population. n = 1962.
Sustainability 12 02157 g002
Figure 3. Results of direct questioning (sum of responses on autonomous buses and those on autonomous taxis for each monitoring method). Note: Respondents are those who are 20 to 74 years old living in Japanese cities. Shares of gender and age groups are adjusted to represent the population. n = 1962.
Sustainability 12 02157 g003
Table 1. Levels of attributes.
AttributeLevels of Alternative 2 (Autonomous Taxi)
Travel cost per capita30%|50%|70% × current taxi fare (per capita)
In-vehicle time50%|70%|100% × current taxi (car) travel time
Other time (e.g., wait time and time required to get to a station)2 min|6 min|10 min
Monitoring method (Alternative 2 only)Onboard human|Remote human-based|Remote system-based
Table 2. Descriptive statistics of respondents.
VariablePercentage
(n = 1962, Original Sample)
Percentage
(n = 1663, Sample in Analysis with SP Data)
Age
20–241.5%1.3%
25–3411.7%12.4%
35–4423.2%23.0%
45–5430.2%30.1%
55–6422.4%22.3%
65–7411.0%10.9%
Female38.5%39.5%
Household income (JPY)
0–2 million6.3%6.3%
2.01–4 million17.0%16.6%
4.01–6 million20.8%21.6%
6.01–8 million16.8%16.7%
8.01–10 million10.5%10.7%
10.01–12 million7.7%7.6%
12.01+ million5.2%4.9%
Unknown15.7%15.5%
Car driving license holder91.2%91.2%
Experience of riding in AVs1.1%1.1%
Table 3. Descriptive statistics of recent trips (n = 1663).
VariableAverageMin.Max.
Cost (JPY)138.702256
Total time (min)26.11250
In-vehicle time (min)22.51240
Distance (km)9.40.150
ModePercentage
Rail15.9%
Bus2.9%
Car57.7%
Motorbike2.4%
Taxi0.5%
Bicycle9.0%
Walk11.6%
Purpose
Commuting23.0%
Business6.7%
Shopping26.8%
Social, entertainment, eating, and recreation9.8%
Other private purposes13.3%
Returning home20.3%
Note: — = not defined.
Table 4. Estimation results of models for intention-to-use autonomous taxis.
Explanatory VariableModel 1: OLModel 2: Panel Mixed OLModel 3: OLModel 4: Panel Mixed OL
Coef.t−statCoef.t−statCoef.t−statCoef.t−stat
Travel cost (10−2 JPY)−0.017(−6.4)−0.066(−6.9)−0.017(−6.5)−0.066(−7.5)
In−vehicle time (10−1 min)−0.048(−3.0)−0.129(−1.9)−0.048(−3.0)−0.129(−1.9)
Std. dev. 0.513(6.4) 0.511(6.5)
Other time (10−1 min) −0.246(−7.9)−0.375(−3.7)−0.246(−7.9)−0.376(−3.7)
Std. dev. 0.766(3.9) 0.767(4.0)
Derived VTTS
In−vehicle time (JPY/min)28.119.628.119.5
Other time (JPY/min)144.456.8144.556.9
Monitoring method (ref. = “onboard human”)
“Remote”−0.05(−0.8)−0.10(−0.9)
“Remote system−based” −0.05(−0.8)−0.11(−1.0)
Recent trip (ref. = returning home and rail)
Commuting−0.12(−1.2)0.05(0.1)−0.12(−1.2)0.05(0.2)
Business−0.12(−0.8)0.42(0.6)−0.12(−0.8)0.42(1.0)
Shopping−0.04(−0.5)0.17(0.5)−0.04(−0.5)0.17(0.6)
Social, entertainment, eating, and recreation0.14(1.2)−0.19(−0.4)0.14(1.2)−0.19(−0.5)
Other private purposes−0.16(−1.4)0.10(0.3)−0.16(−1.4)0.11(0.3)
Bus0.81(4.2)1.81(3.4)0.81(4.2)1.80(4.1)
Car0.15(1.5)−0.07(−0.2)0.15(1.5)−0.07(−0.3)
Taxi3.21(8.5)2.80(3.4)3.21(8.1)2.79(5.0)
Motorbike−0.44(−1.9)−1.82(−2.3)−0.44(−2.0)−1.82(−2.4)
Bicycle−0.13(−0.9)−0.86(−1.5)−0.13(−0.9)−0.87(−1.9)
Walk−0.10(−0.8)−0.72(−1.5)−0.10(−0.8)−0.73(−2.0)
Individual/HH attributea
Age_25–34−0.13(−0.4)−0.28(−0.2)−0.13(−0.4)−0.28(−0.6)
Age_35–44−0.39(−1.1)−0.72(−0.6)−0.39(−1.2)−0.72(−1.5)
Age_45–54−0.45(−1.3)−0.77(−0.6)−0.45(−1.4)−0.78(−1.7)
Age_55–64−0.36(−1.0)−0.93(−0.7)−0.36(−1.1)−0.93(−2.1)
Age_65–74−0.26(−0.7)−0.94(−0.7)−0.26(−0.8)−0.94(−2.2)
Female−0.09(−1.2)−0.35(−1.2)−0.09(−1.2)−0.34(−1.5)
Income_2–40.28(2.6)0.55(1.3)0.27(2.7)0.55(1.6)
Income_4–60.17(1.8)−0.01(−0.0)0.17(1.8)−0.01(−0.0)
Income_6–80.02(0.2)−0.11(−0.3)0.02(0.2)−0.11(−0.3)
Income_8–100.22(1.8)0.47(0.9)0.22(1.9)0.47(1.2)
Income_10–120.29(2.1)0.35(0.7)0.28(2.1)0.35(0.8)
Income_12+0.33(2.1)0.53(1.1)0.33(2.2)0.52(1.1)
Car license holder−0.09(−0.8)−0.50(−1.2)−0.09(−0.8)−0.50(−1.5)
Perception (P), experience (E), attitude (A)b
P_trans. tech._medium0.21(2.9)0.44(1.8)0.21(2.9)0.44(1.9)
P_trans. tech._high0.09(0.6)−0.19(−0.3)0.09(0.7)−0.19(−0.5)
E_AV ride 0.59(2.0)0.48(0.4)0.59(2.1)0.49(0.5)
E_ride−sharing_medium0.40(2.6)1.60(4.2)0.40(2.7)1.61(4.3)
E_ride−sharing_high0.33(1.1)−0.09(−0.1)0.33(1.1)−0.11(−0.1)
A_risk averse_medium−0.35(−4.3)−0.50(−1.8)−0.35(−4.3)−0.50(−1.9)
A_risk averse_high−0.64(−7.1)−0.43(−1.4)−0.64(−7.1)−0.43(−1.4)
A_like new_medium0.20(−2.4)0.25(−0.7)0.20(−2.4)0.26(−1.0)
A_like new_high0.82(−6.7)1.23(−2.1)0.82(−6.8)1.24(−3.2)
Threshold
k 1 −3.52(−8.1)−3.26(−1.6)−3.54(−8.9)−3.28(−13.9)
k 2 0.56(8.4)−0.15(−0.9)0.56(8.4)−0.16(−1.0)
Std. dev. 1.05(11.5) 1.05(12.2)
k 3 0.73(26.6)0.57(6.4)0.73(26.6)0.57(6.3)
Std. dev. 1.64(14.6) 1.64(14.6)
No. of obs.4989498949894989
Log likelihood at convergence−3924−2877−3924−2877
Adjusted McFadden’s R20.1670.3030.1700.303
* p < 0.1; ** p < 0.05; *** p < 0.01, a Reference categories = “Age_20–24,” “HH income_0–2,” and “HH income_unknown”. b Reference categories = “P_trans. tech._low,” “E_ride-sharing_low,” “A_risk averse_low,” and “A_like new_low”. — = not defined.
Table 5. Sensitivity of effects of monitoring variables.
Specification of Monitoring VariableResults of Model Estimation: Effect of Monitoring Variable
Only “Remote” (human + system-based) is used.Random coefficientNot significant at the 10% level
Not random Not significant at the 10% level
Only “Remote system-based” is used.Random coefficientStd. dev. of the coefficient is significant at the 10% level
Not random Not significant at the 10% level
“Remote human-based” and “remote system-based” are used.Random coefficientNot significant at the 10% level
Not random Not significant at the 10% level
Note: Panel mixed OL models are estimated with different specifications of monitoring variables, where all other variables remain the same with those used in Models 2 and 4.

