Distribution Kinetics of Rare Earth Elements in Copper Smelting
by
 , , , and
Lassi Klemettinen
1,* ,
,
Riina Aromaa
1,
Anna Dańczak
1,
Hugh O’Brien
2,
Pekka Taskinen
1 and
Ari Jokilaakso
1 1
Department of Chemical and Metallurgical Engineering, School of Chemical Engineering, Aalto University, 02150 Espoo, Finland
2
Geological Survey of Finland, Vuorimiehentie 2, 02150 Espoo, Finland
*
Author to whom correspondence should be addressed.
Sustainability 2020, 12(1), 208; https://doi.org/10.3390/su12010208
Submission received: 30 November 2019
/
Revised: 19 December 2019
/
Accepted: 20 December 2019
/
Published: 25 December 2019
(This article belongs to the Special Issue Sustainable Development and Recycling of Rare Earth Resources)
Abstract
:The use of rare earth elements (REEs) is increasing, mainly due to the growing demand for electric vehicles and new applications in green technology. This results in annual growth of the in-use REE stocks and the amount of End-of-Life (EoL) products containing REEs. REEs are considered critical elements by the EU, mainly because the rest of the world is dependent on China’s supply. Recycling of REEs can help alleviate the criticality of REEs, however, no REEs are currently functionally recycled. In this study, the time-dependent behavior of REEs in copper matte-slag system in primary copper smelting conditions was investigated experimentally at a laboratory scale. Lanthanum and neodymium were chosen to represent all REEs, as they are generally found in the highest concentrations in EoL products, and because REEs all have similar chemical behavior. The experiments were conducted as a function of time in air and argon atmospheres. SEM-EDS, EPMA and LA-ICP-MS methods were used for sample characterization. The results of this work indicate that the REEs strongly favor the slag and the deportment to the slag begins almost instantly when the system reaches high temperatures. With increasing contact times, the REEs distribute even more strongly into the slag phase, where they may be recovered and recycled, if their concentrations are sufficiently high and a suitable hydrometallurgical process can be found.
1. Introduction
Rare earth elements (REEs) are a group of 17 elements (lanthanide elements plus scandium and yttrium) which have similar physical properties and are often found in the same ores and deposits. REEs belong to the EU (European Union) list of critical raw materials (CRMs) [1], which are raw materials that reach or exceed thresholds for both economic importance and supply risk. CRMs are particularly important for high tech products and emerging innovations. According to the EU commission, technological progress and quality of life rely on the access to a growing number of raw materials, particularly CRMs [2].
During recent years, technological innovations have resulted in multiple applications using REEs: magnets (wind turbines, hybrid and electric vehicles, hard discs, magnetic resonance imaging, speakers, magnetic cooling), battery alloys (alloys for steel and iron casting, super alloys, fuel cells, H2-storage), phosphors and luminescence (energy efficient lighting, liquid crystal and plasma displays, lasers), catalysts (automotive catalysts, catalysts in refining and chemical processing, diesel additives), glass, polishing and ceramics (polishing compounds, coloring and decoloring agents in glass, stabilizers in ceramics, ceramic capacitors, ultraviolet adsorption) [3]. REEs are currently irreplaceable in wind turbines, electric vehicles, energy efficient lighting, and therefore are relevant for climate change and for protecting the environment [2]. As a result, there are serious concerns that the demand for some individual rare earth elements, such as neodymium, praseodymium, dysprosium, terbium, lanthanum, yttrium, and europium, will exceed current supply within a few years [4].
REE reserves worldwide were estimated as 120 million tons of REOs (rare earth oxides) [5]. The supply balance is complicated by the fact that China, the world’s largest rare earth producer, operates export quotas for these products [6]. Furthermore, these quotas are frequently adjusted, increasing the unpredictability of the market [4].
Secondary raw materials, such as WEEE (waste electrical and electronic equipment), can be used as sources for REEs in order to support the REEs supply chain [7]. It has been estimated that the global volume of WEEE is currently around 50 million tons per annum [8]. In Europe alone, the amount of WEEE generated is about 12 million tons per year and it is expected to increase in the coming decades at a rate of at least 4% per annum [9]. Despite the enormous amounts of WEEE, the recycling of REEs is currently very limited; less than 1% of all REEs are recycled [8,10]. Much research on REE recycling has been conducted during the last years, but very few efforts have moved beyond lab-scale tests. [8]. The available recycling technologies are mostly limited to permanent magnets [11,12,13] and polishing compounds [8], as well as smaller amounts from batteries [14,15] and fluorescent lamps [16].
Ni-MH (nickel metal hydride) batteries, which are used in portable devices [17] and hybrid electric vehicles (HEVs) [18], are one of the most important applications for REEs. The number of HEVs sold globally has been growing steadily, and the in-use stocks of Ni-MH batteries are significant and growing as more HEVs are taken into use. The most valuable Ni-MH battery elements are Ni (25–46 wt%), Co (2.5–4.3 wt%), La (1.4–6.6 wt%), and Nd (0.9–4.1 wt%) [17].
In recent years, great efforts have been made to develop REE recycling methods, as described in many review works [7,17,19,20]. Pyrometallurgical and hydrometallurgical processes can be used separately or together to recover rare earths from spent battery scrap [21]. However, designing a recycling process only for one type of battery may be technically difficult and economically impractical [22]. Waste Ni-MH batteries, together with other types of batteries, are thus mostly used in the industry as secondary raw materials in primary processes where the intention is to recover only the main base metals [23]. Therefore, this route is not yet developed for REEs recovery, as these metals deport to the slag phase, due to the high stability of REOs [24,25].
The current state of the art in battery recycling is to utilize high temperature pyrometallurgical processes, using fluxes as REEs oxidants and collectors [24]. The use of different slag-forming agents (e.g., CaO-CaF2, CaF2, CaO-SiO2, SiO2, B2O3, FeO-B2O3) has been investigated [21,24,26]. In high temperature fluxing processes, almost all REEs distribute to the oxide phase whereas Ni and Co deport to the metal phase. REOs can be further separated from the slag by applying hydrometallurgical techniques [26].
In order to optimize and improve these high temperature processes, basic knowledge about REEs distribution equilibria and reaction mechanisms is required. Problematically, thermodynamic data governing rare earth element/oxide systems are very limited.
The reaction mechanisms in matte smelting can be divided into two major parts: oxidation of chalcopyrite into matte and subsequent slag formation [27]. Data regarding the reaction sequences and the physical processes involved in matte-slag system must be provided before proceeding to formulation of any kinetic rate equations. Fagerlund and Jalkanen [28] performed the first studies considering the elaboration of reaction sequences in matte-slag separation processes. Guntoro et al. [27] continued the investigations on copper matte-slag reaction sequences and separation processes in matte smelting. In their study, mass transport phenomena appeared to be the limiting factor in matte-slag reactions. Mass transport limits formation of slag in the air atmosphere system, while in an inert atmosphere, oxygen mass transport limits the magnetite forming reactions. It was also concluded that separation of matte and slag ceased after 10 min of contact time at 1300 °C in inert gas. After 10 min, it was already possible to estimate the final elemental contents of the matte phase [27].
Data regarding the time-dependent behavior of trace elements in copper flash smelting conditions are very limited. Wan et al. [29] investigated the behavior of major elements as well as trace elements found in printed circuit boards (PCBs) as a function of time in laboratory-scale experiments simulating flash smelting process conditions. There are no available data about the time-dependent behavior of REEs in copper matte smelting.
The most relevant thermodynamic study of the equilibrium behavior of neodymium in copper matte smelting conditions was conducted by Tirronen et al. [23]. They investigated the distributions and deportments of battery elements in copper converting between temperatures 1200 and 1275 °C and oxygen partial pressure range from 10−8 to 10−6.5 atm. It should be noted that in the study of Tirronen et al. [23], the concentrations of Nd in the copper alloy were under the detection limits of EPMA (electron probe micro-analysis), which was the only analytical method available for the copper matte phase.
The goal of this study was to experimentally determine the time dependency of REE distribution in the settler of a copper flash smelting furnace. Several REEs can be found in batteries and are used in various green energy applications, but only two were chosen in this study since the behavior of the REEs should be very similar due to the high stability of their oxides. Lanthanum was chosen based on the fact that it represents most of the REEs contained in Ni-MH batteries. Neodymium was chosen because of its widespread use in batteries, permanent magnets, and other high tech applications. The latter includes printed circuit boards, some of which, when scrapped, are recycled in the copper smelting process. The results of the experiments presented here can thus be applied to the recycling of several REE-containing scraps. In order to simulate different conditions in the flash smelting furnace settler, the experiments were conducted in air and argon atmospheres. The experimental temperature was selected as 1300 °C, which is in the same range of temperatures used in industrial processes.
2. Materials and Methods
In our study, a LTF 16/450 single phase vertical tube furnace (Lenton, Hope Valley, UK) was used in all experiments. The furnace was equipped with an alumina working tube (35 mm ID, Frialit AL23, Friatec AG, Mannheim, Germany). Four silicon carbide heating elements were positioned near the working tube. The crucible-sample assembly was raised to the hot zone by pulling a platinum-rhodium wire from the top of the furnace. Details of the experimental set-up and a schematic of the furnace have been presented previously [29,30].
2.1. Raw Materials and Sample Preparation
The raw materials for the experiments were synthetic silica-magnetite mixture, industrial copper concentrate, as well as neodymium and lanthanum oxides. The synthetic silica-magnetite mixture was prepared from hematite (Alfa Aesar, Kandel, Germany, 99.99% purity) and silica (Umicore, Balzers, Liechtenstein, 99.99% purity) powders. The starting mixture, with a mass ratio of 65 wt% Fe2O3 and 35 wt% SiO2, was ground in a mortar until fine and homogeneous. The ground mixture was annealed at 1300 °C in air atmosphere for 8 h. After slow quenching to room temperature, the mixture was composed mostly of solid silica and magnetite. The obtained chemical composition corresponds to the chemical compounds available on top of the slag bed in copper flash furnace after concentrate oxidation in the reaction shaft [31]. It was expected that the solid synthetic silica-magnetite mixture, in contact with the sulfide phase from the concentrate, would form a liquid fayalite slag phase.
The industrial copper concentrate was acquired from Boliden Harjavalta. Chemical composition of the concentrate, presented in Table 1, was analyzed with X-ray fluorescence (XRF) spectrometry. The equipment used was Axios Max wavelength dispersive XRF (Malvern Panalytical B.V., Almelo, The Netherlands). The sample for XRF analysis was prepared by mixing 20 g of the concentrate and 1 g of binder (PE-190, Herzog, Osnabrück, Germany). The mixture was ground until homogeneous and pressed into a button. Depending on the element analyzed, the XRF voltage of 25, 50 or 60 kV, and the current of 160, 80 or 66 mA, respectively, were used in the analysis. Chemically analyzed standard materials (optimized for copper sulfide analyses) were used for calibration.
Pure La2O3 (Alfa Aesar, Kandel, Germany, 99.9%) and Nd2O3 (Sigma-Aldrich, St. Louis, MO, USA, 99.99%) powders were used as the source of REOs in the experiments. The experiments were conducted in air and argon atmospheres. In the case of experiments in argon atmosphere, the working tube was plugged and the argon (99.999% purity, AGA Linde, Espoo, Finland) flow rate was approximately 450 mL/min (controlled with a rotameter). For the experiments conducted in air atmosphere, the bottom of the furnace was left unplugged and the work tube was filled with air from the surrounding atmosphere.
The silica-magnetite mixture to copper concentrate mixing ratio was set to 1.116 based on previous studies [27,29]. However, in comparison to previous investigations, the concentrate used in our study contained much more zinc. The Fe/SiO2 flux ratio was approximately 1.88, which corresponds to the orthosilicate composition, shown to be effective for minimizing the trace element losses into the slag [32]. The amounts of La and Nd oxides added to the mixture were both 5% of the mass of the concentrate. The silica-magnetite, copper concentrate, and REO powders were mixed thoroughly and ground in a mortar until homogenous. Approximately 0.5 g of the prepared mixture was placed into each cone shaped silica crucible (15/12 mm OD/H, Finnish Special Glass, Espoo, Finland). All experiments had identical starting material mixtures.
The contact times, i.e., durations that the sample was kept in the experimental temperature, were chosen as 10, 20, 30, 60, 150, and 300 s in air atmosphere, and all experiments were repeated three times. For the experiments conducted in argon, the contact times were 5, 10, 20, and 40 min, and two experimental series were conducted. After the desired contact time was reached, the samples were rapidly quenched in an ice-water mixture. After drying, the samples were cast into epoxy resin, and ground and polished using metallographic wet sample preparation techniques. The polished sections were coated with carbon for subsequent SEM-EDS and EPMA analyses.
2.2. Sample Characterization
The sample microstructures and preliminary phase compositions were analyzed with Mira 3 scanning electron microscope (SEM, Tescan, Brno, Czech Republic) and an UltraDry silicon drift energy dispersive X-ray spectrometer (EDS) (Thermo Fisher Scientific, Waltham, MA, USA) coupled to NSS microanalysis software (Thermo Fisher Scientific, Waltham, MA, USA). The acceleration voltage was 15 kV and the beam current on the sample surface was approximately 11 nA. The utilized standards were Cu Kα (Cu), Fe Kα (hematite), and O Kα (quartz), S Kα (marcasite), Si Kα (quartz). La and Nd were analyzed using only the internal standards of the NSS software, since their actual concentrations were analyzed subsequently using EPMA (for slag) and LA-ICP-MS (for matte). Samples from experiments conducted in air with a contact time of 10 s were analyzed using only EDS because there was no liquid slag present in such short experiments, only solid magnetite and silica grains. Evidence of matte formation was observed already in runs as short as 10 s. For the matte phase, the major element (Cu, Fe, and S) concentrations were analyzed only with EDS in this work.
The chemical composition of the slag phase was investigated with electron probe micro-analysis (EPMA) housed at Geological Survey of Finland (GTK). A Cameca SX100 microprobe equipped with five wavelength dispersive spectrometers (WDS, Cameca SAS, Gennevilliers, France) was used in the analyses. An accelerating voltage of 20 kV was applied. The beam current was 60 nA and the beam diameter was 50–100 µm depending on the size of the target available for the beam. The analyzed elements, X-ray lines, and standards used were Si Kα (quartz), Mg Kα (diopside), Fe Kα and O Kα (hematite), La Lα (monazite), Nd Lα (Nd-phosphate), Pb Lα (galena), Cu Kα (Cu), Zn Kα (sphalerite), and S Kα (pentlandite). The copper standard was 100 wt% pure metal, neodymium phosphate was a synthetic phosphate, and the others were naturally occurring minerals. The average detection limits of the analyzed elements have been summarized in Table 2.
In the case of experiments in air atmosphere, two samples out of three experiments conducted for each contact time (excluding the 10 s samples) were analyzed with EPMA. For the experiments in argon atmosphere, both samples for each contact time were analyzed with this technique.
The concentrations of lanthanum and neodymium in the sulfide matte were below the detection limits of EPMA, and therefore the matte phase was analyzed with laser ablation-inductively coupled plasma-mass spectrometry (LA-ICP-MS). The two best samples out of the three experiments conducted in air for all contact times, excluding the 10 s samples, were analyzed. For the argon atmosphere experiments, all the experimental charges were analyzed by LA-ICP-MS.
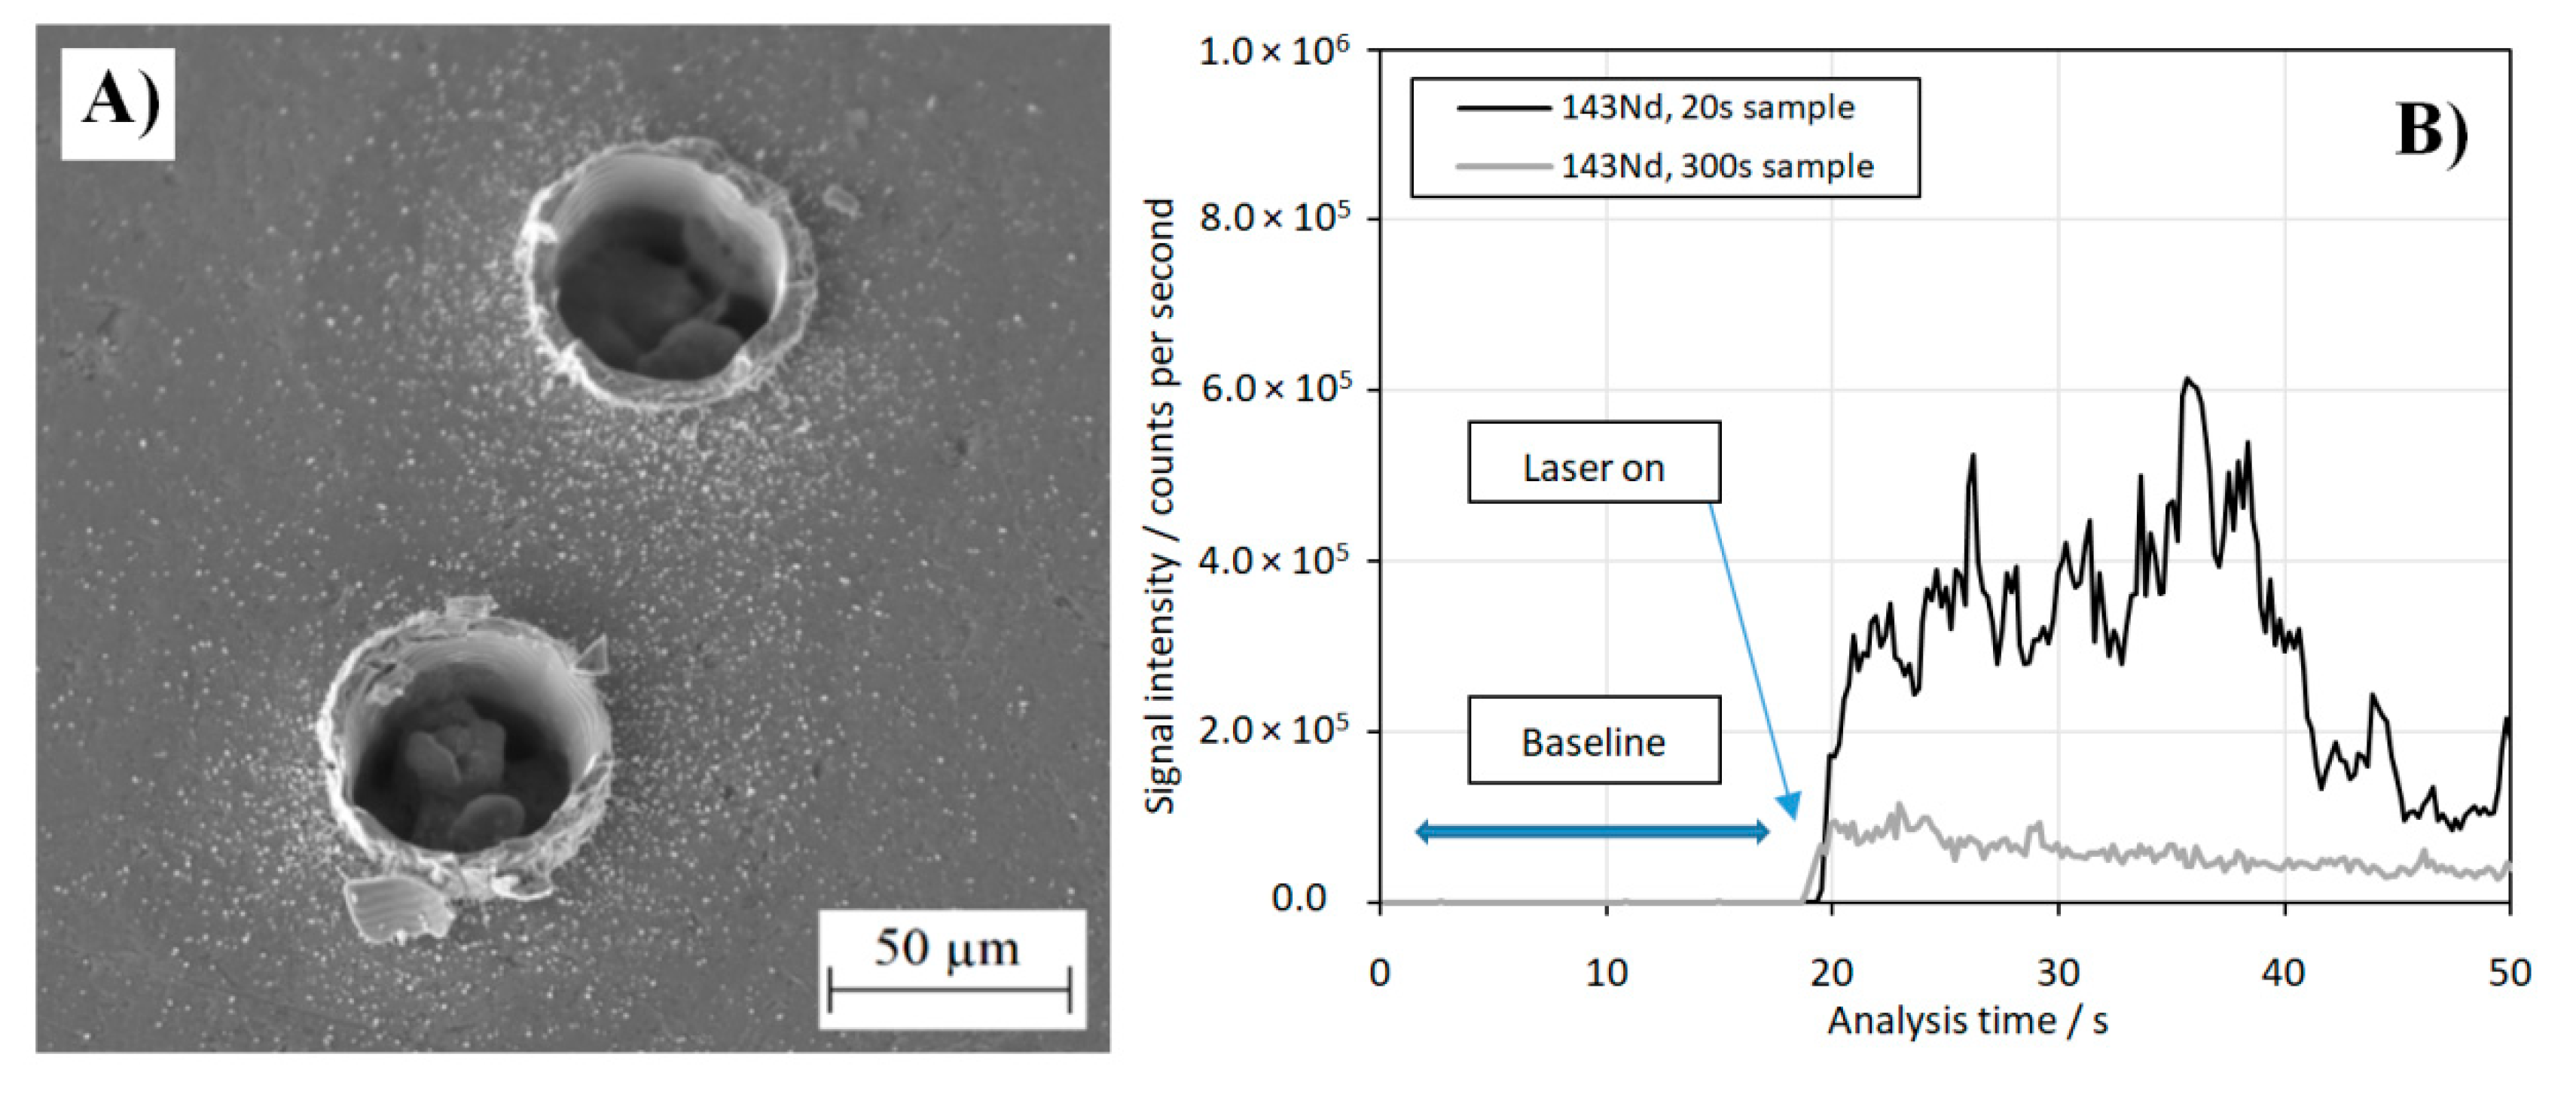
The equipment, housed at GTK, was a Photon Machines Analyte Excite laser ablation system with 193 nm wavelength 4 ns ArF excimer laser (Teledyne CETAC Technologies, Omaha, NE, USA) coupled to a NuAttoM single collector sector field ICP-MS (Nu Instruments Ltd., Wrexham, UK). A laser spot size of 50 µm and a laser firing frequency of 10 Hz were selected. The energy was set to 38% of 4 mJ, resulting in a fluence of 2.5 J/cm2 on the sample surface. The analysis procedure consisted of 5 pre-ablation pulses to remove the conductive carbon coating and possible other contaminants from the surface, followed by 20 s pause, 20 s gas background analysis, and 350 pulses of sample analysis. Figure 1A shows a SEM image of two laser ablation pits in the copper matte phase.
For the copper matte analyses, USGS GSD-2G glass (U.S. Geological Survey, Denver, CO, USA) [33] was used as the external standard material. It is a silicate glass, which makes it a non-ideal matrix-matched standard for sulfides. However, since the elements of interest in this work were lanthanum and neodymium, which are not commonly found in sulfide reference materials, this silicate was selected. The hardware conditions and analysis quality were monitored by analyzing USGS GSE-2G (U.S. Geological Survey, Denver, CO, USA) [33] and USGS MASS-1 (U.S. Geological Survey, Denver, CO, USA) [34] reference materials as unknowns. 59Co isotope was analyzed throughout the series for investigating how well the GSD silicate glass reproduces the concentration values in MASS-1 sulfide. The obtained concentration of cobalt was consistently very close to the reported value [34], which indicates that the GSD glass was adequate as an external standard for sulfide analyses. For the internal standardization, 57Fe with concentration values obtained from EDS was used.
The mass spectrometer was operated in FastScan mode with low resolution (ΔM/M = 300) for maximum sensitivity. Data reduction was performed with Glitter software (ARC National Key Centre for Geochemical Evolution and Metallogeny of Continents (GEMOC) and CSIRO Exploration and Mining, Sydney, Australia; version 4.4.4) [35]. For lanthanum, the only stable isotope 139La was analyzed, and for neodymium, isotopes 143,145,146Nd were analyzed. All of these isotopes should be interference-free with the used standard materials and sample matrix, and therefore any of the Nd isotopes could be used for concentration quantifications; in this study, the 143Nd isotope was chosen. The obtained detection limits have been collected in Table 2, and all the primary elemental concentration data has been collected in Appendix A, Table A1, Table A2, Table A3, Table A4, Table A5, Table A6, Table A7 and Table A8.
The time-resolved analysis signals obtained from LA-ICP-MS showed homogeneous concentrations of La and Nd in the ablated areas in some samples, and rather heterogeneous concentrations in others. In general, concentrations became more homogeneous as the high-temperature contact time in the furnace increased. Two examples of the analytical signals are shown in Figure 1B. These signals illustrate the level of Nd heterogeneity after 20 s, as well as the decrease in the concentration of neodymium in the matte phase as run time was increased. For concentration quantifications, the parts of the analysis signals that were free of inclusions and other heterogeneities were used whenever possible.
3. Results and Discussion
3.1. Sample Microstructures in Air and Argon Atmospheres
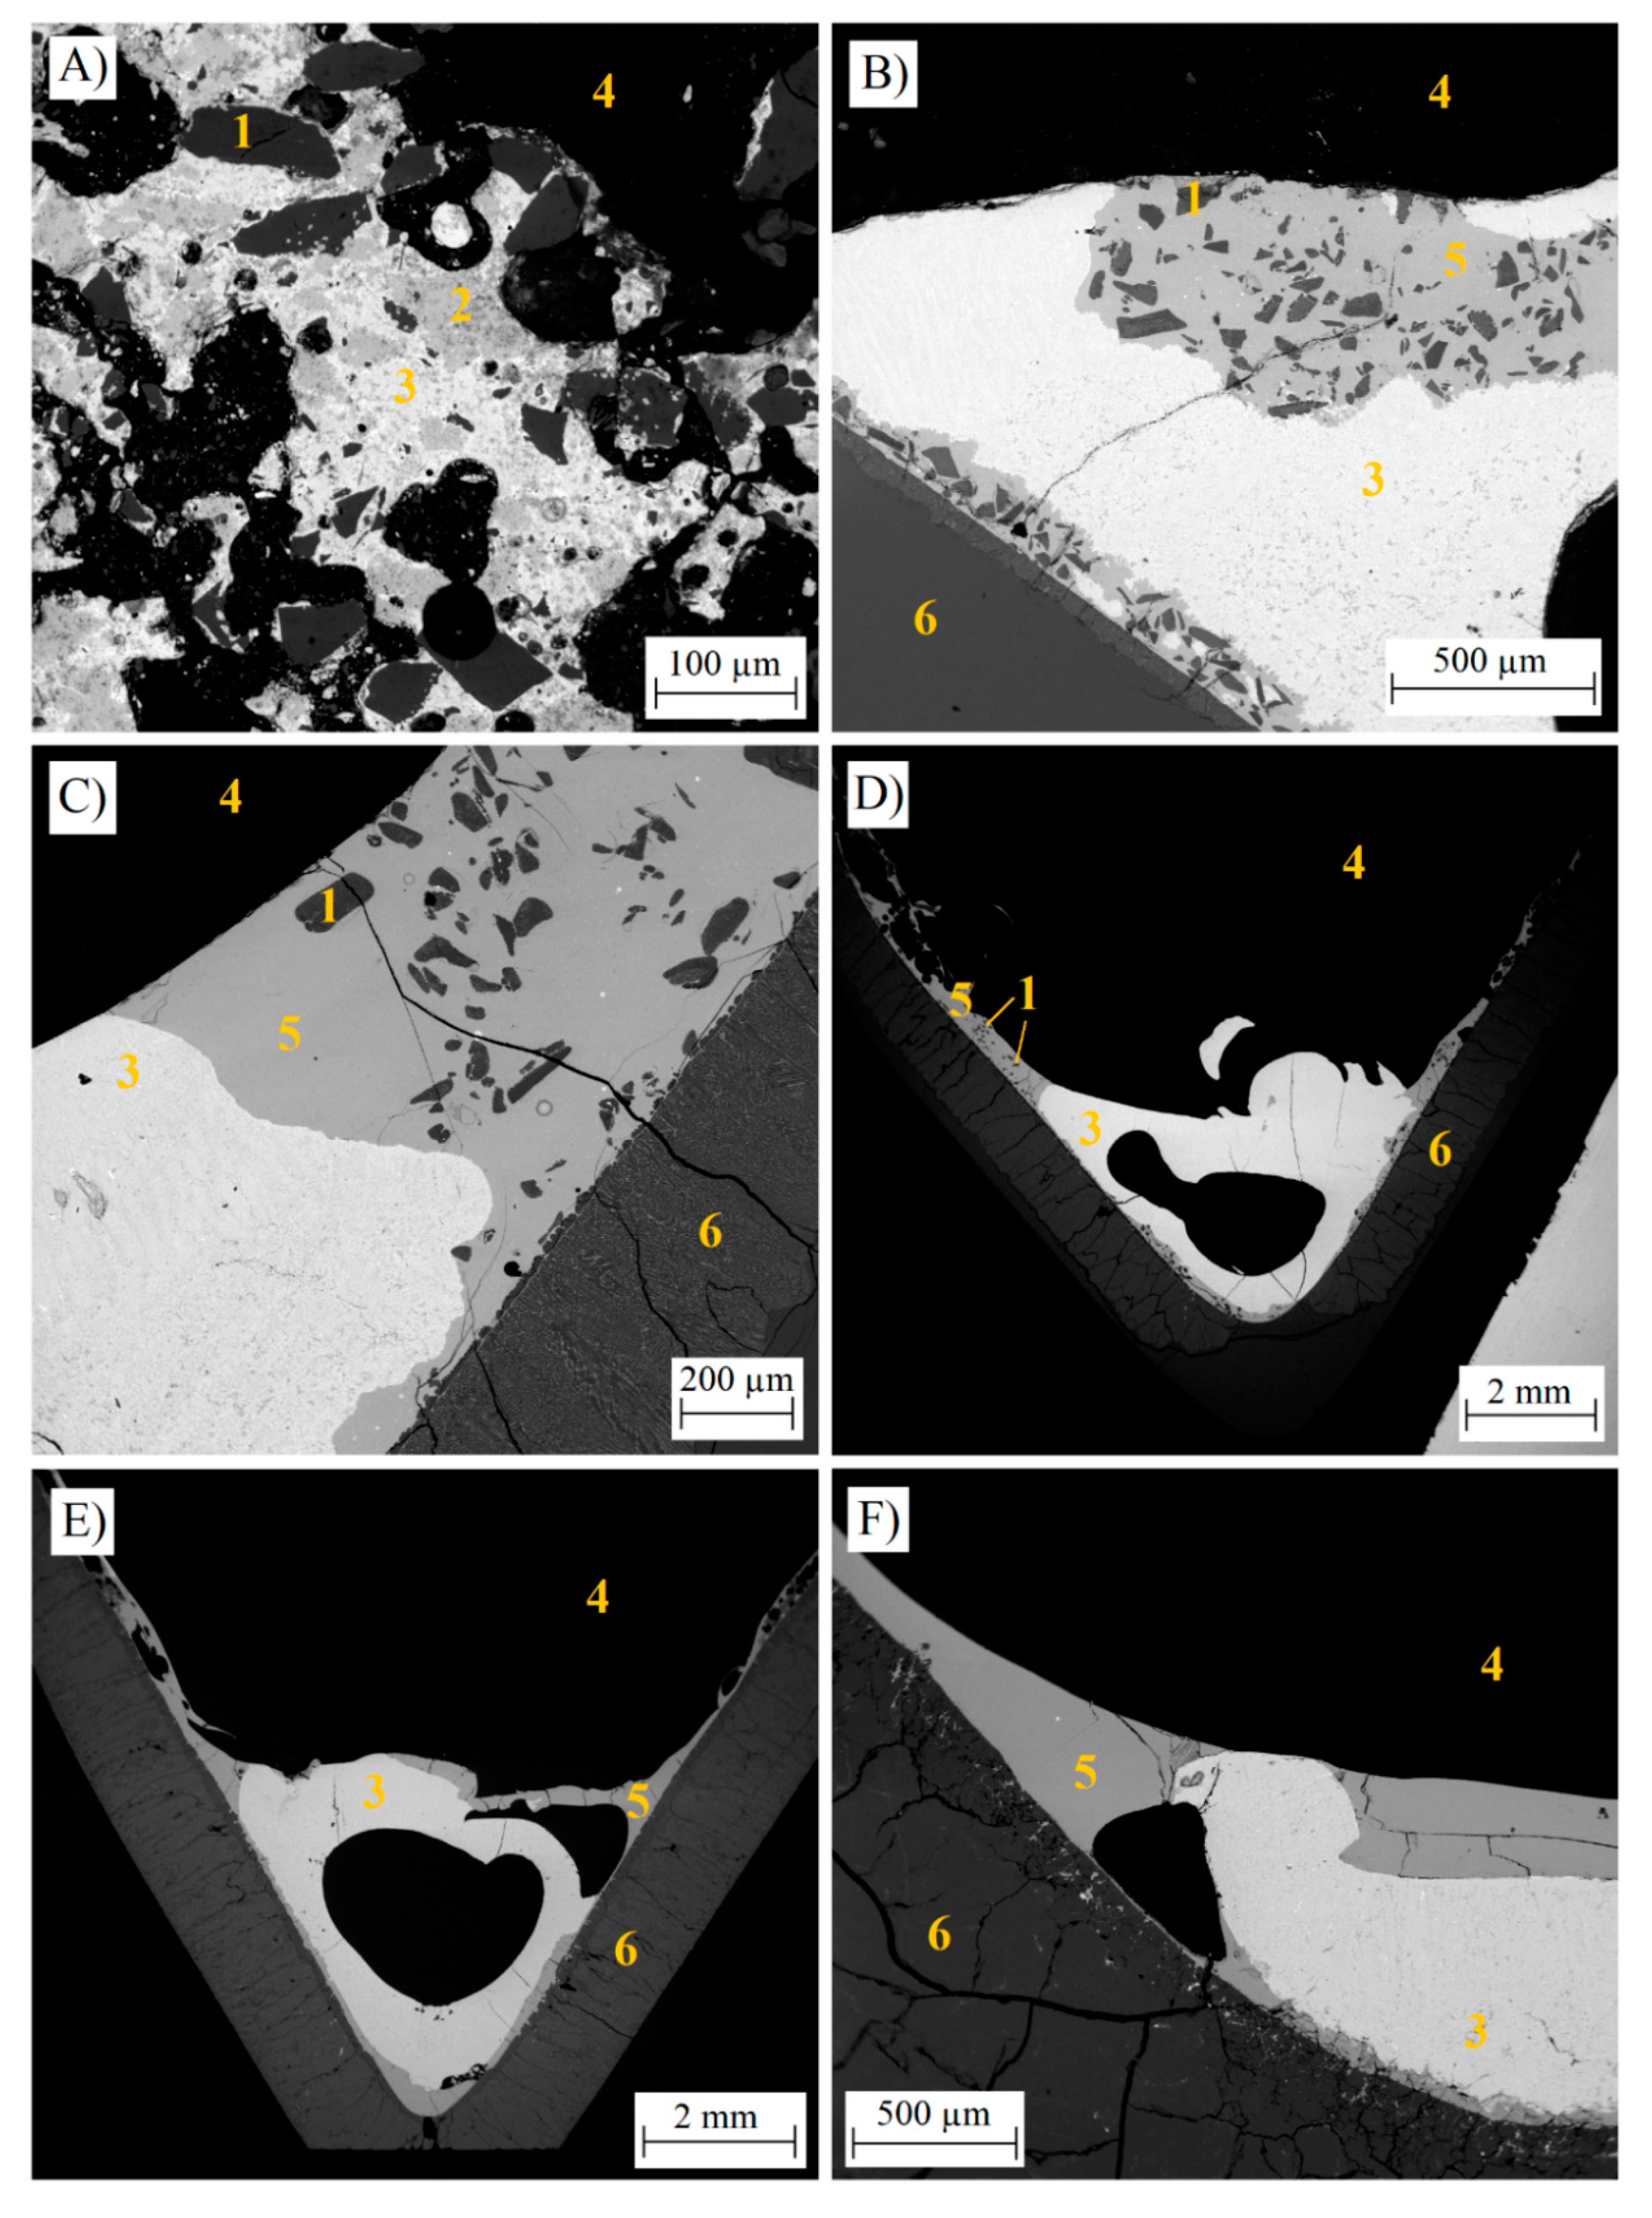
SEM-backscattered electron micrographs of samples after different contact times in air are shown in Figure 2A–F. After 10 s contact time in air, the structure of the sample was very heterogeneous. The liquid fayalite slag did not start forming yet, instead separate silica and iron oxide grains were observed dispersed throughout the samples. The copper concentrate had only partially started to melt. After 20 s contact time, the structure of the sample was already better defined. Separate areas of matte and liquid slag were observed, but their separation within the sample was still quite random and the settling process had just begun. The slag phase was still forming, and large grains of unreacted silica were observed. Large droplets of matte were found in the slag and segregated iron oxide was observed in the matte phase. When the contact time was further increased, the separation of slag and matte, as well as the settling of the matte phase, proceeded. The unreacted silica particles gradually dissolved in the liquid slag domain, therefore increasing the slag volume. A wide reaction layer of the slag penetrating the silica crucible can be observed in Figure 2C–F. The sample microstructure did not change significantly when the contact time was increased from 150 s to 300 s in air. The formation and separation of the phases progressed mainly as reported by Guntoro et al. [27] and Wan et al. [29]. After longer contact times, the slag was relatively homogeneous, but iron oxide and copper-rich segregations were still observed in the matte.
Guntoro et al. [27] also reported that the sulfide matte disappeared at 300 s contact time. They stated that all sulfides had oxidized to their respective oxides. Our findings do not support this statement; the experiment with 300 s contact time in air atmosphere was repeated three times and the matte phase was clearly visible in all three samples (one of them shown in Figure 2F). It can be concluded that in the work of Guntoro et al. [27], the matte phase was part of the system even after 300 s, but due to the small sample size and sample preparation method, they just did not find the matte droplet.
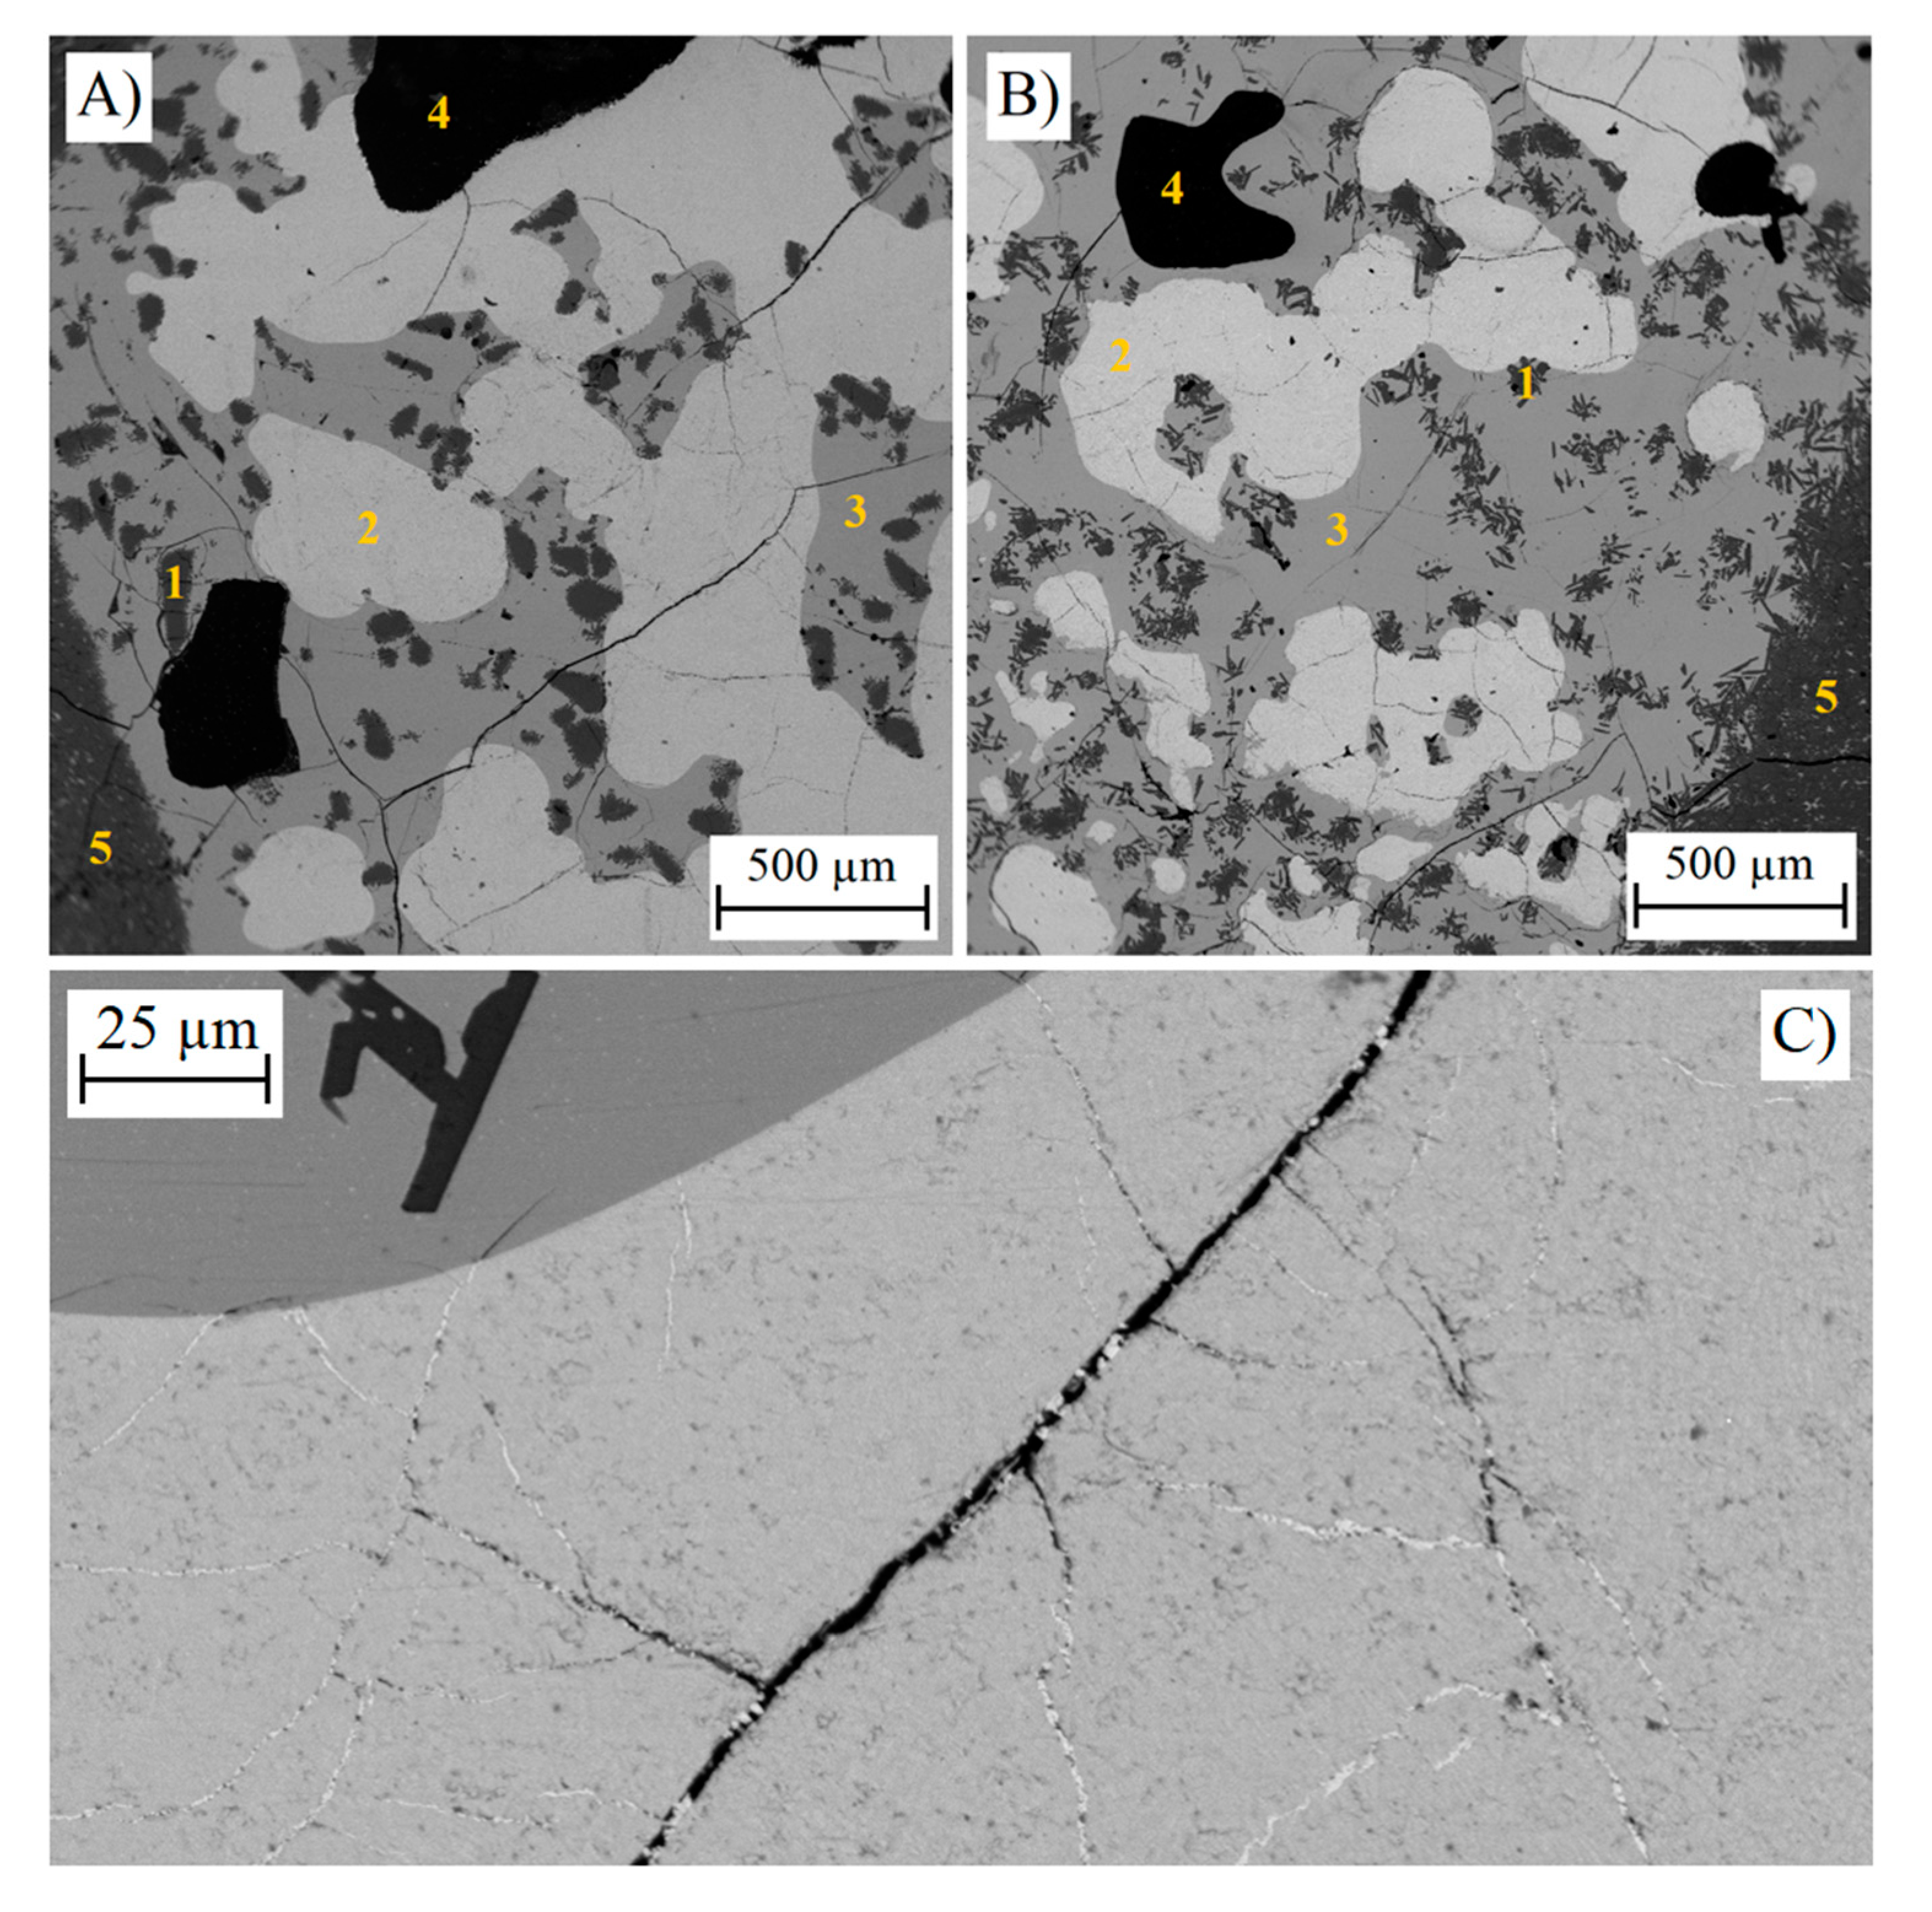
The microstructures of all samples in argon atmosphere were similar with distinct differences to the air atmosphere experiments. Both copper matte and fayalite slag phases were clearly observed with all contact times. Undissolved silica was also detected in the slag phase at all contact times. However, the shape of these silica crystals changed as the time was increased, from angular to needle-like, as shown in Figure 3. This indicates the formation of secondary silica in the system. Small droplets of copper matte could be seen in the slag phase with higher magnification, and small veins with high copper content were visible in the copper matte. Low-magnification SEM micrographs of samples after 5 and 40 min of contact time are shown in Figure 3A,B, respectively. Figure 3C shows the copper-rich veins in the matte.
3.2. Behavior of Major Components in Matte and Slag
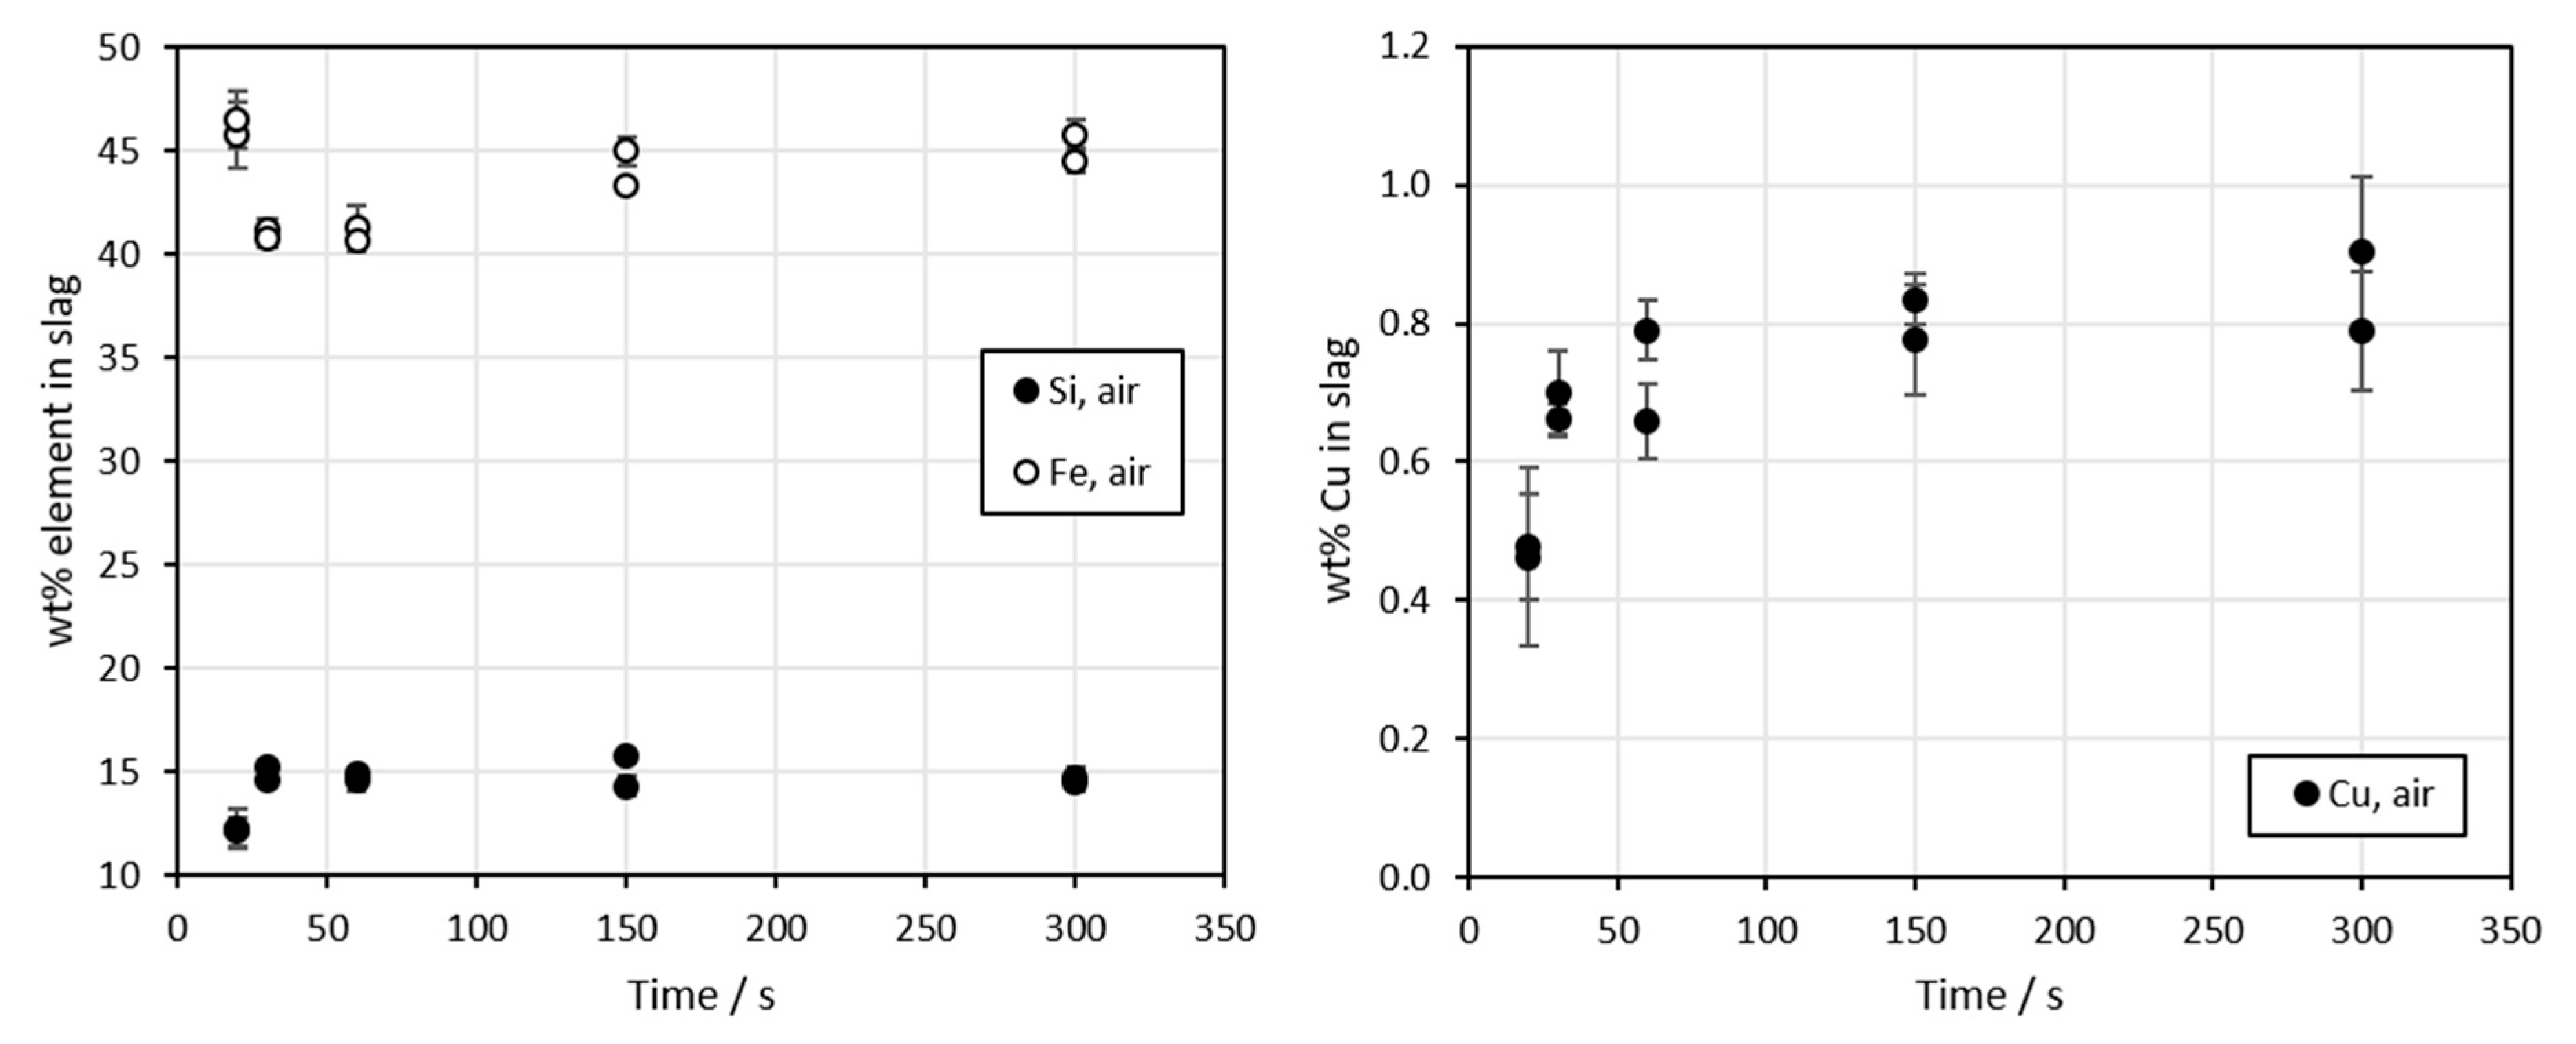
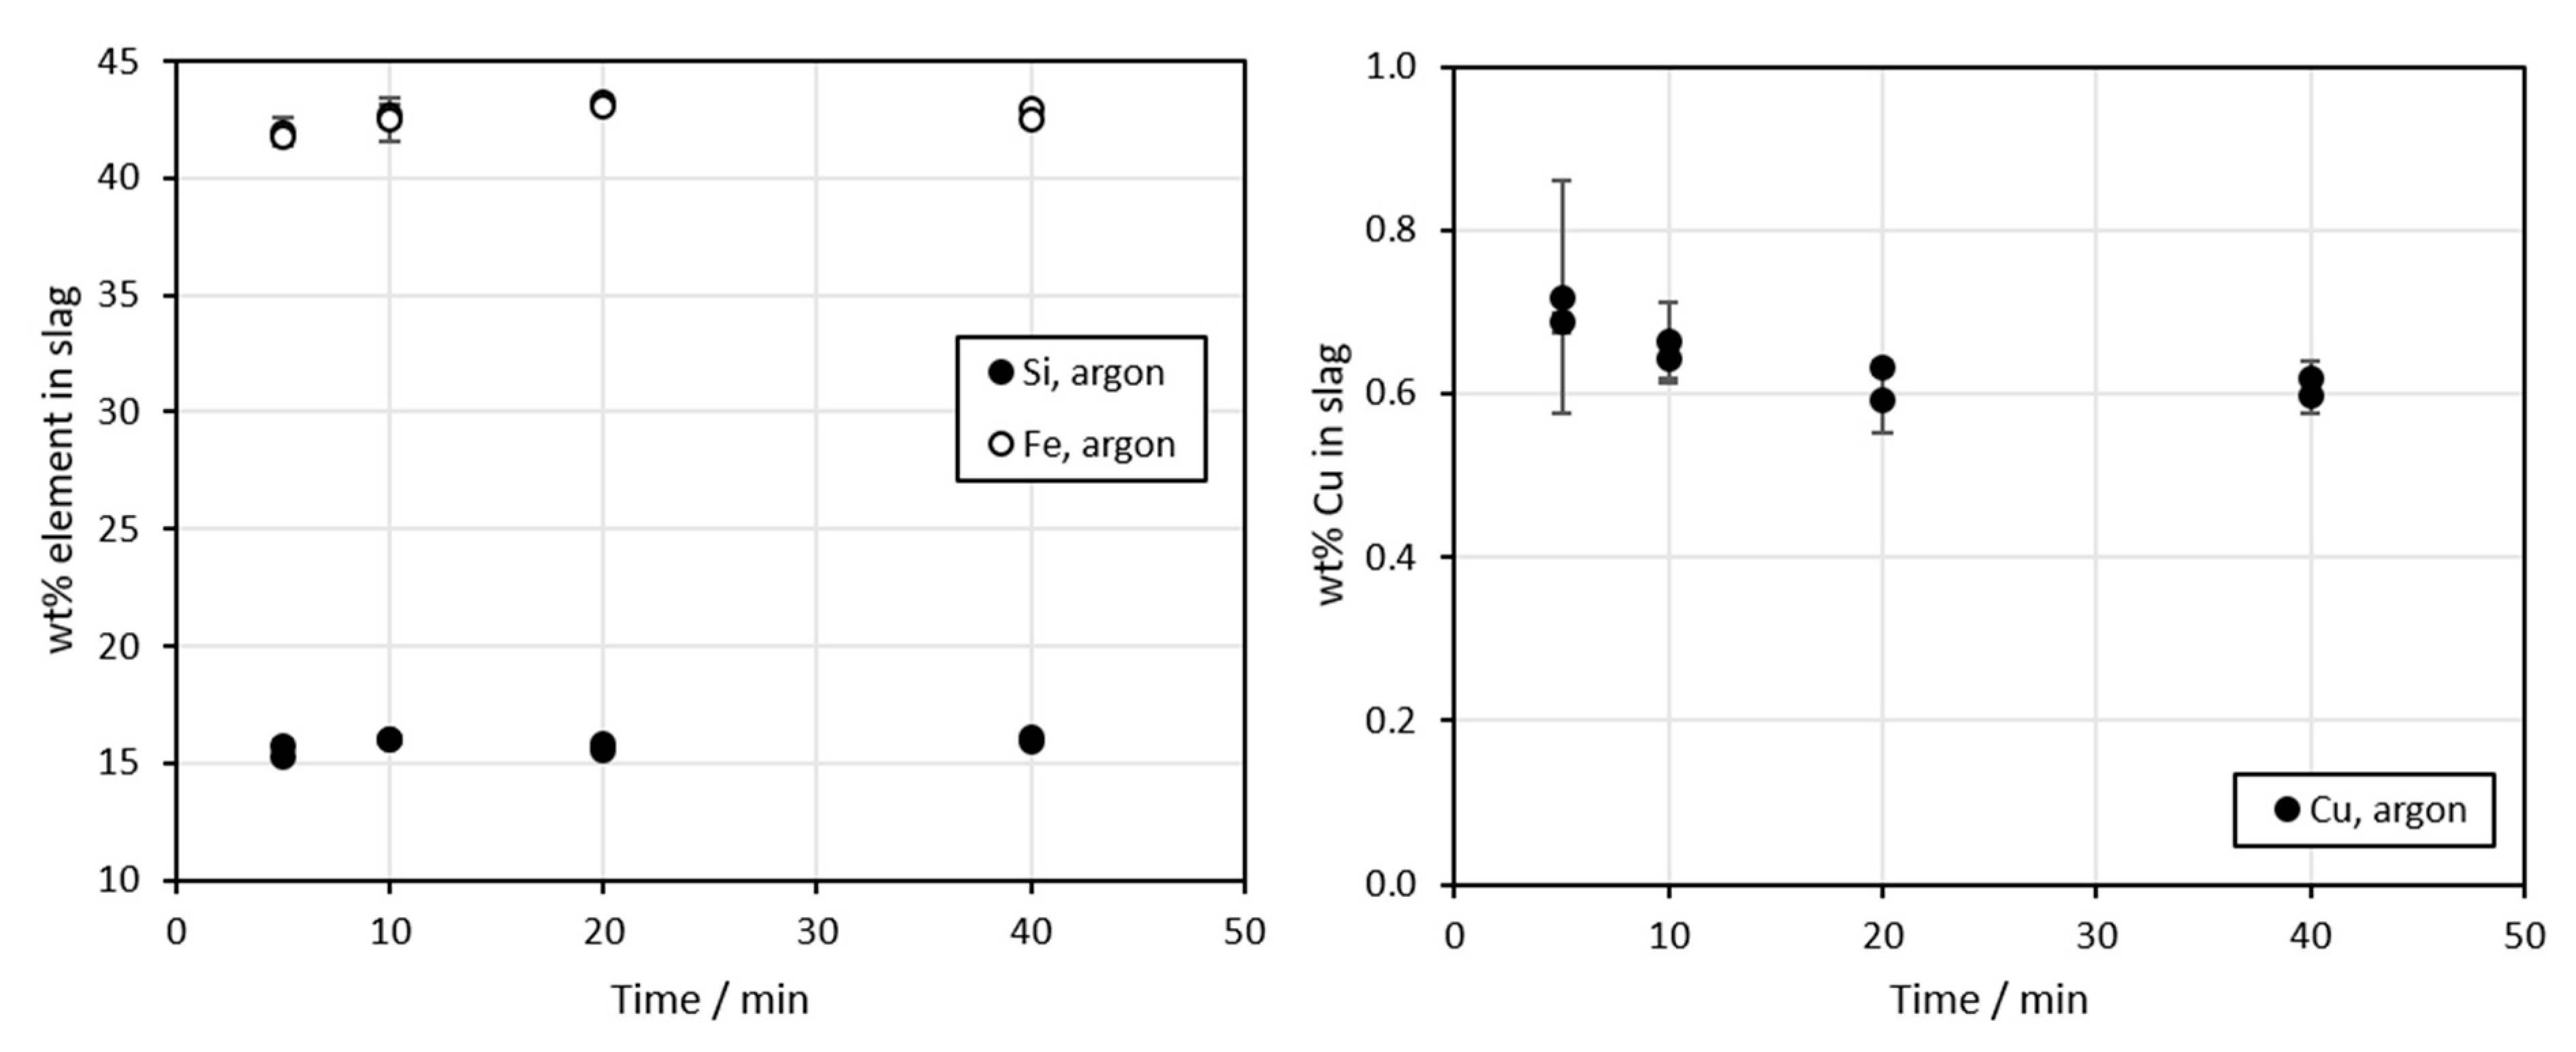
Figure 4 and Figure 5 show the concentrations of silicon, iron, and copper in molten slag as a function of contact time in air and argon atmospheres, respectively. It is evident that in air atmosphere, the concentrations of the major elements Fe and Si in the slag are changing until 150 s contact time, and become relatively stable after that. The copper concentration in the slag also seems to increase until 150 s time, and stabilizes after that. For the experiments conducted in inert argon atmosphere, the changes in composition were smaller. This was most likely due to the absence of free oxygen and longer contact times. The results presented in Figure 5 correspond to the microstructures shown in Figure 3; no major changes occurred as the contact time was increased.
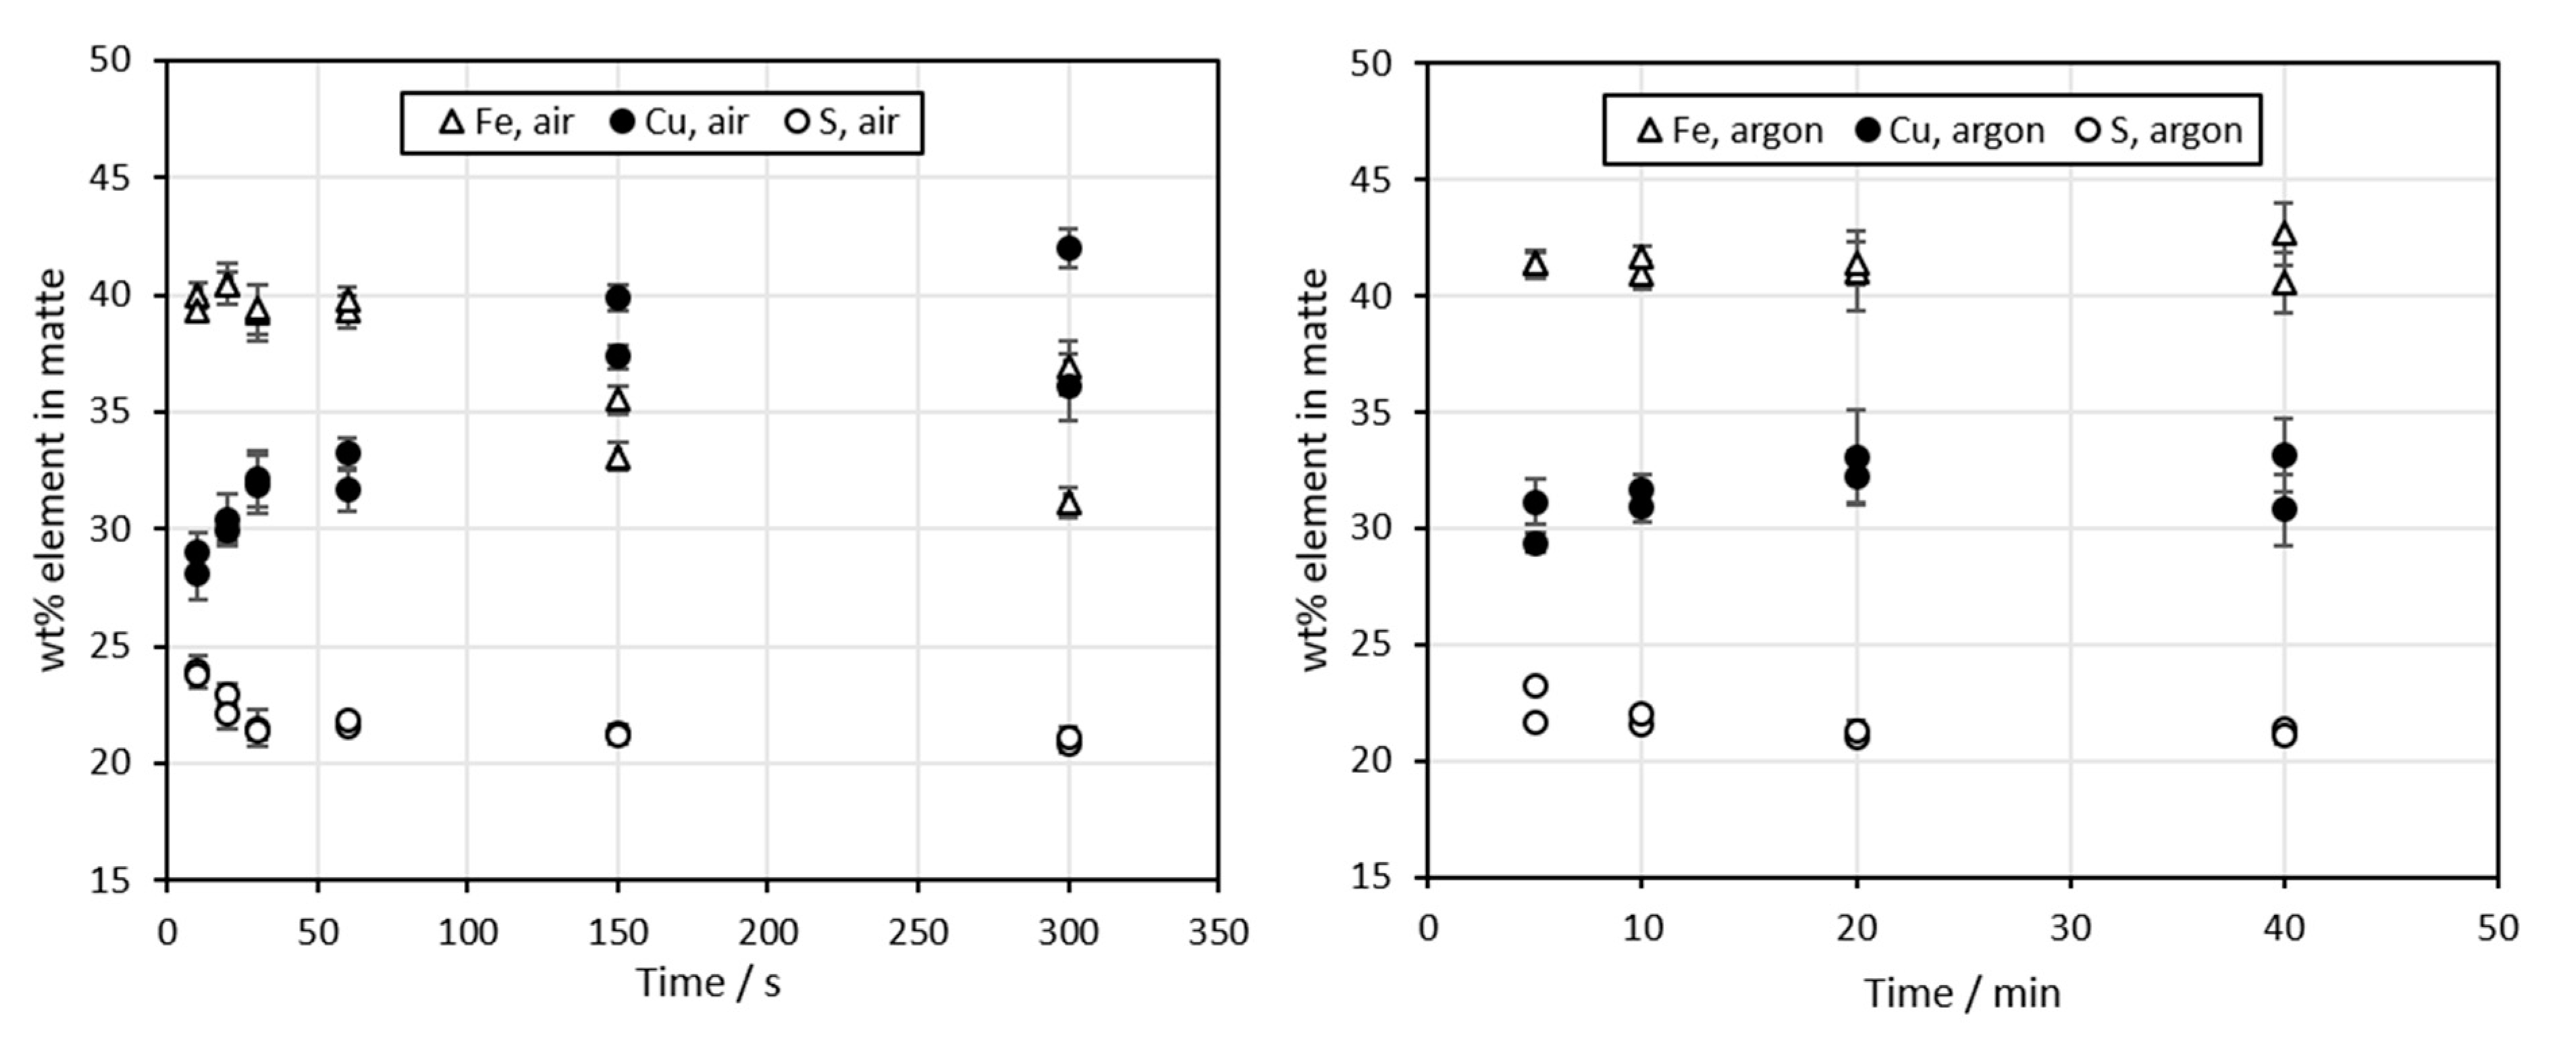
The concentrations of major elements in matte are shown in Figure 6. In air atmosphere, the concentration of copper increased to approximately 40 wt% after 300 s. Correspondingly, the concentration of iron decreased from 40 wt% to below 35 wt%. In the previous studies by Wan et al. [29] and Guntoro et al. [27], the copper grade increased significantly more with the same contact times. However, the concentrate used was different.
3.3. Behavior of Lanthanum and Neodymium
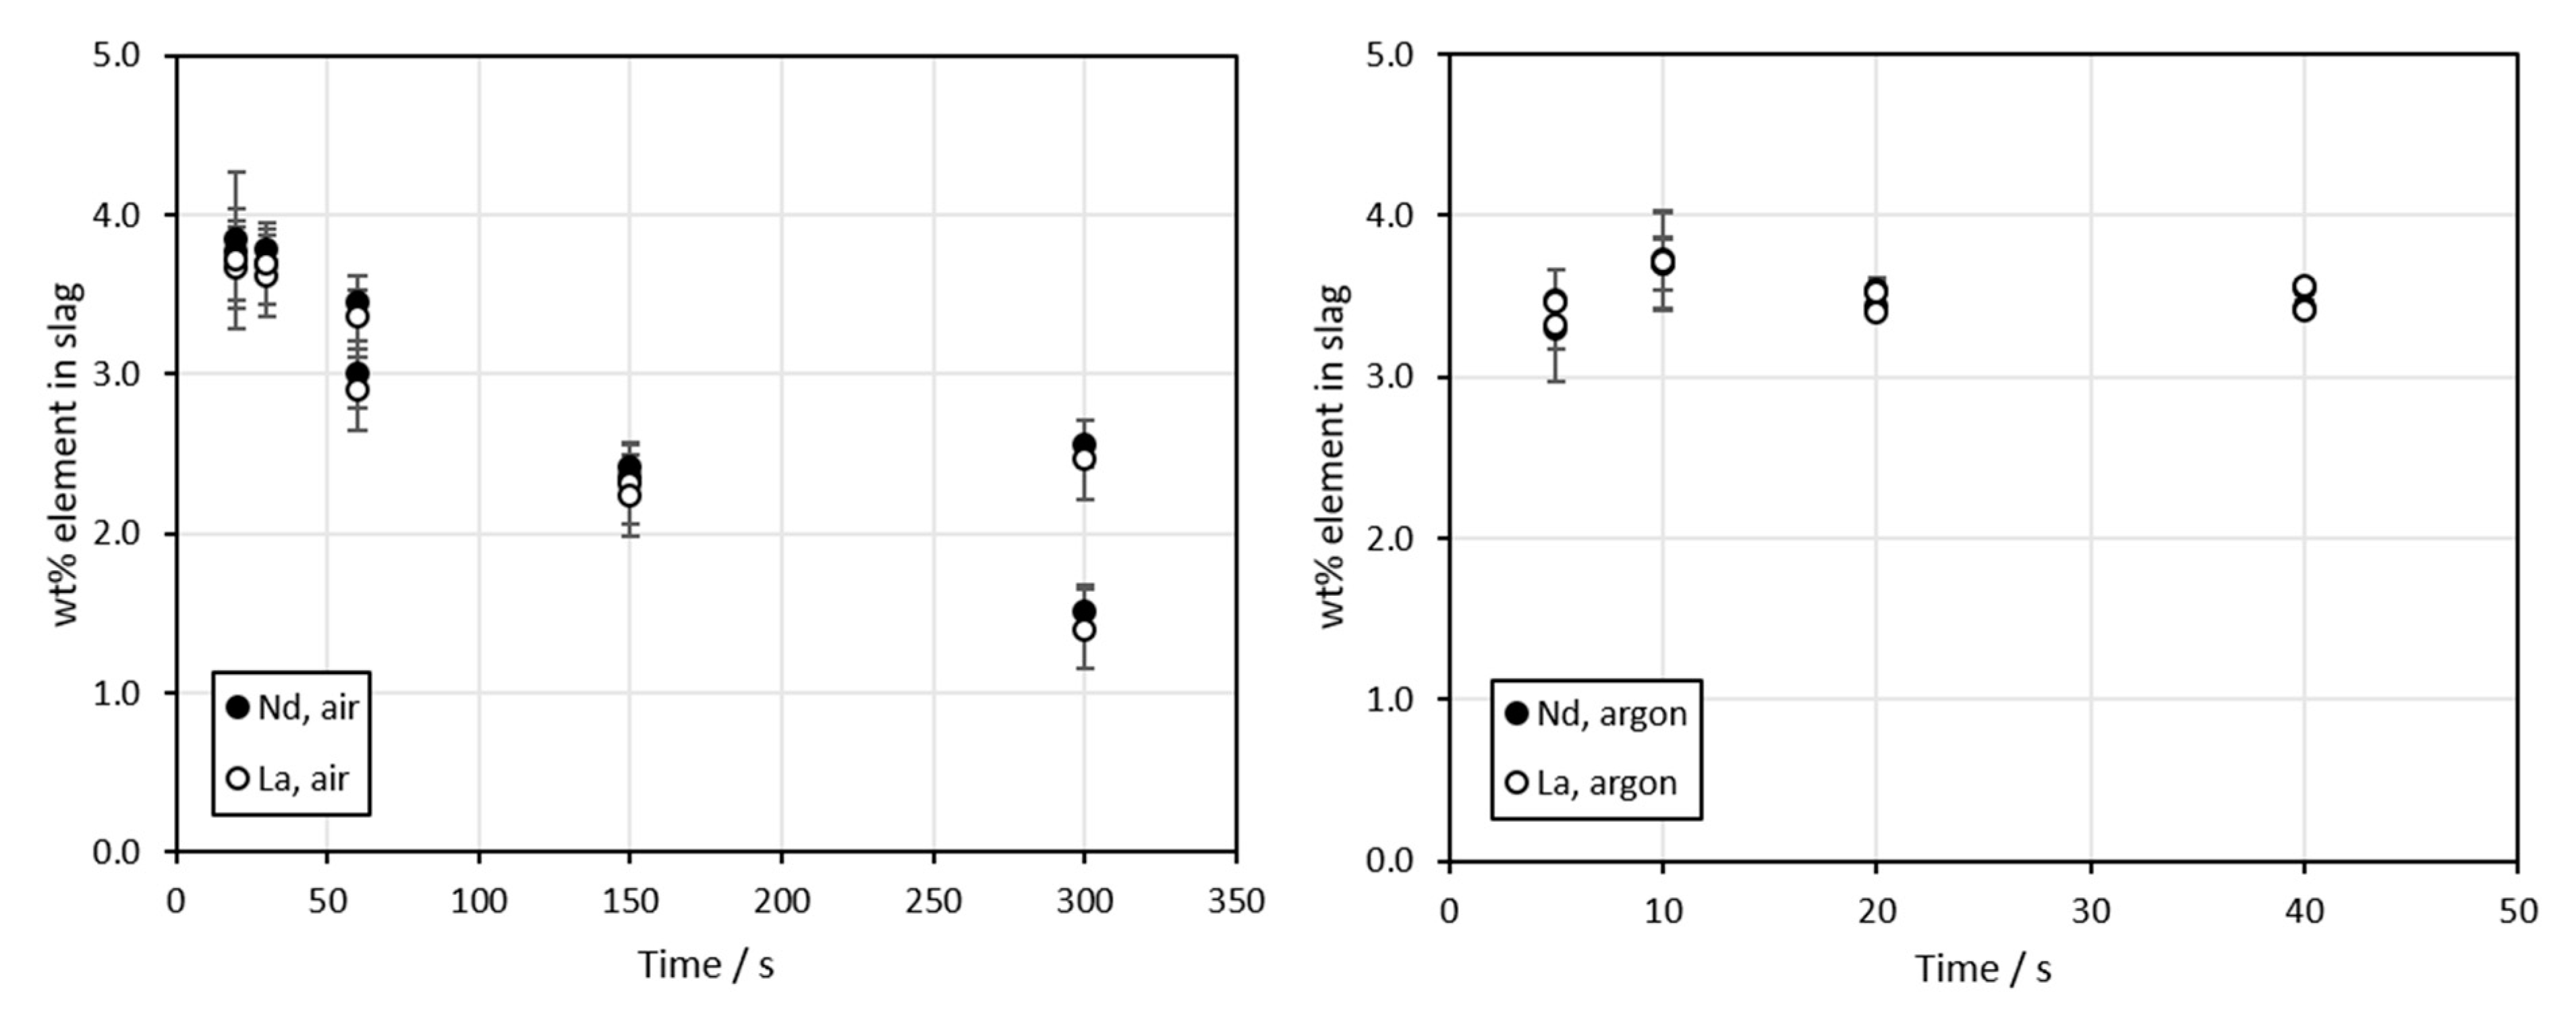
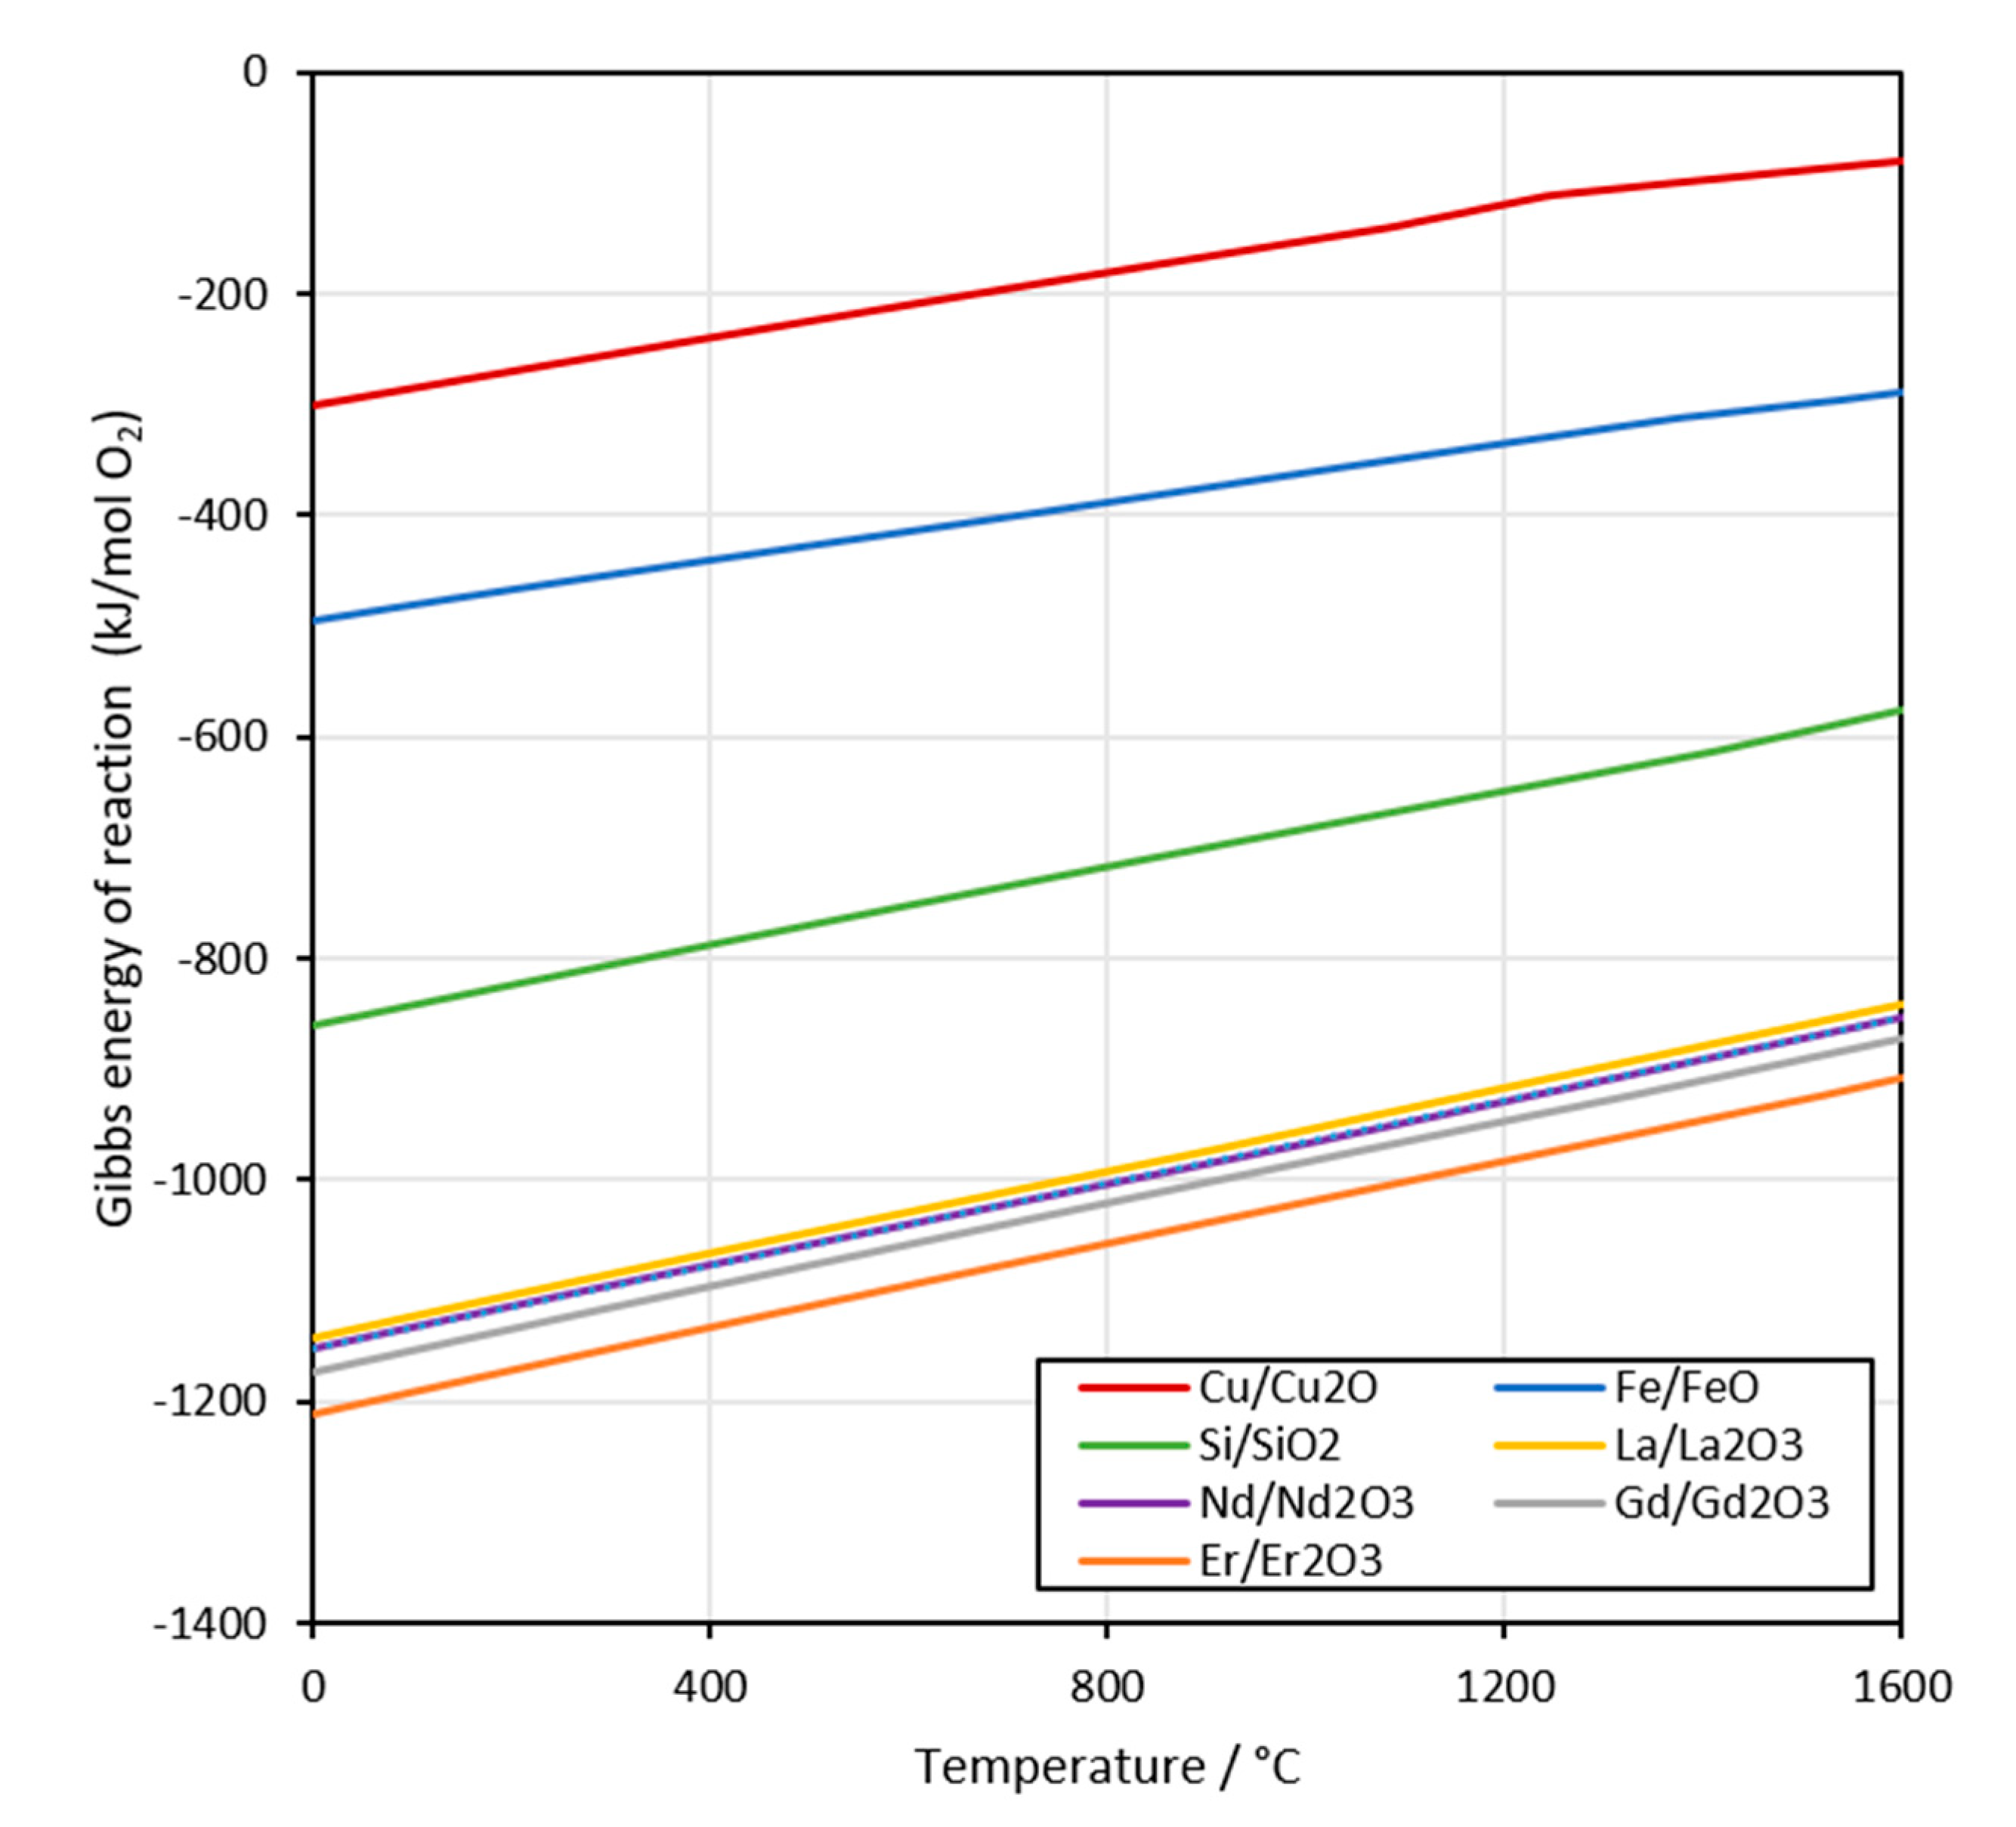
The concentrations of La and Nd in slag as a function of time are shown in Figure 7. It is evident from the results that the two REEs behave in the exact same manner, which confirms the thermodynamic calculations (available in Appendix B, Figure A1) regarding the stability of their oxides. In air atmosphere, the concentrations decreased as a function of time, which can be explained by the increasing slag volume as the time was increased (Figure 2B–F). However, for the argon experiments, the concentrations of REEs remain relatively stable, supporting the microstructural observations as well as the major element concentration results (Figure 5 and Figure 6 ).
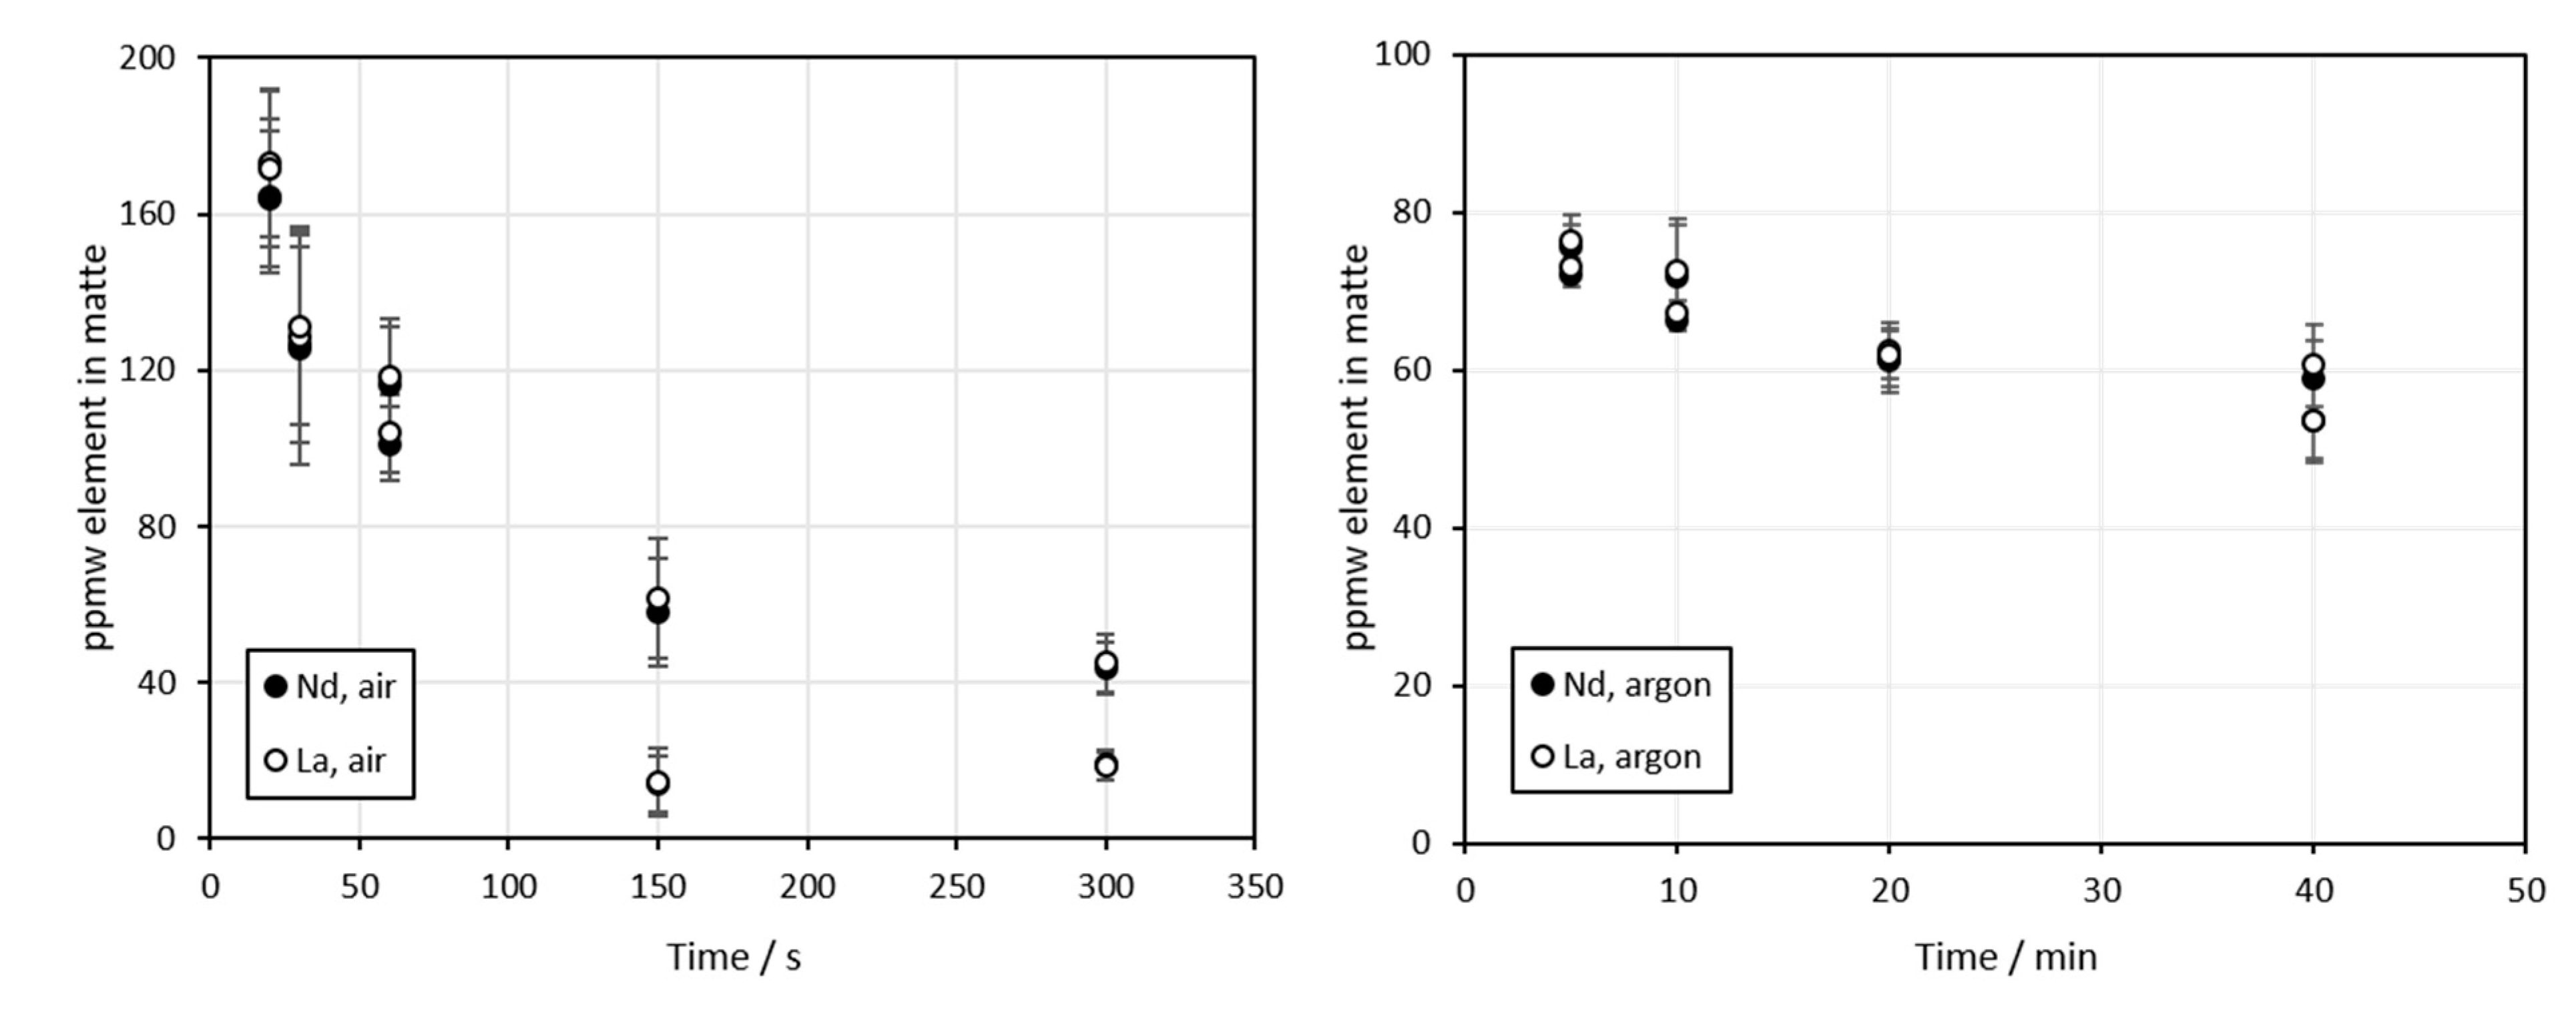
Figure 8 presents the concentrations of La and Nd in the copper sulfide matte as a function of time. The concentrations decreased from approximately 170 ppmw to around 35 ppmw as the time was increased from 20 to 300 s in air. In argon experiments, the decrease was less significant, and the final concentration after 300 s contact time was approximately double that in the air atmosphere.
The distribution coefficients (wt% element in matte/wt% element in slag) of La and Nd are drawn in Figure 9. As the contact time increased, the distribution coefficient value decreased, indicating a stronger deportment to the slag. However, even with the 20 s contact time in air atmosphere, the value of the distribution coefficient was approximately 0.004, which means that more than 99% of La and Nd distributed to the slag phase almost immediately as the system reached the experimental temperature (1300 °C). The values for one experiment at 150-s contact time seem to be outliers. For this experiment, the REE concentrations in slag followed the trend, but the concentrations in matte were significantly lower than in the duplicate sample. After 150 s, the reactions were still progressing, the sample was not in equilibrium, and the phases were not completely homogeneous, so most likely the areas of matte analyzed with LA-ICP-MS were somehow depleted of the rare earths.
An equilibrium distribution coefficient for neodymium between copper matte and iron silicate slag, obtained by Tirronen et al. [23] at 1275 °C and 78.6 wt% Cu in matte, was plotted in Figure 9, left side, for comparison. The actual value may be lower, since the concentration of Nd in matte was analyzed only with EPMA, and it was below the detection limit of this technique. However, when comparing our results to the ones obtained by Tirronen et al. [23], it seems that the equilibrium value was reached even with relatively short contact times.
4. Conclusions
No previous data exists on the kinetic behavior of rare earth elements in copper flash smelting conditions. In this study, the behavior of La and Nd was studied in laboratory-scale experiments. The conditions were chosen to represent those of copper flash smelting. The experimental temperature was 1300 °C, and the samples were reacted in air and argon atmospheres. The contact times in air were between 10 and 300 s, while the contact times in argon, where the slag acted as the only source of oxygen, were between 5 and 40 min. It should be noted that the residence time of the slag in an industrial copper flash smelting furnace settler is typically some hours. The visual and compositional analyses of the samples were performed with SEM-EDS, EPMA and LA-ICP-MS methods.
Based on the present results, REEs strongly prefer the slag over the sulfide matte, as expected by previous studies and thermodynamic calculations. Based on the new experimental data obtained in this study, this deportment to the slag phase occurs almost instantly as the system reaches high temperatures in copper matte smelting conditions. The concentrations of REEs remaining in the matte after the longest contact times in both air and argon atmospheres were negligible compared to the concentrations in the slag. The distribution coefficient values obtained indicate that with increasing contact times, REEs distribute increasingly to the slag. The distribution coefficient values calculated from samples contacted in air atmosphere were compared to equilibrium distribution coefficient values from an earlier study. The comparison indicates that the distribution coefficients of REEs likely approached or reached equilibrium values even with the relatively short experimental times used in this study. This was somewhat unexpected, and it seems that the minor element distributions may reach equilibrium even faster than the major elements in the system.
As mentioned in the introduction, the state-of-the-art method for recycling REEs is currently to flux them to the slag during pyrometallurgical processing, and then extract them from the slag with hydrometallurgical methods. The results of this study indicate that the commonly used iron silicate slag acts as an effective collector of REEs. If the slag volumes are not too large, the REE concentrations are sufficient, and suitable (and economically viable) hydrometallurgical techniques exist, the REEs could be recovered from the iron silicate slag produced from primary copper smelting with secondary raw materials in the feed mixture, and thus functionally recycled. However, the high concentration of iron in the slag may cause issues in the hydrometallurgical process and lead to impure products [13,21].
The aim in the future is to formulate kinetic rate equations describing the behavior of trace elements in copper smelting conditions based on the experimental results of this work, as well as currently unpublished results for the behavior of precious metals, lithium, cobalt, arsenic, antimony, and bismuth. These rate equations will be used as user-defined functions for improved modelling of the time-dependent flash smelting furnace settler processes.
Author Contributions
Conceptualization, L.K., P.T., and A.J.; Data curation, L.K. and R.A.; Formal analysis, L.K. and R.A.; Funding acquisition, L.K. and A.J.; Investigation, R.A.; Methodology, L.K. and A.J.; Project administration, A.J.; Resources, H.O. and A.J.; Software, L.K. and H.O.; Supervision, L.K. and A.J.; Validation, L.K., R.A., and H.O.; Visualization, L.K., R.A., and A.D.; Writing—original draft, L.K. and A.D.; Writing—review and editing, R.A., H.O., P.T., and A.J. All authors have read and agreed to the published version of the manuscript.
Funding
The experimental work was conducted in the Business Finland funded SYMMET project (grant no 3891/31/2018). The support from BATCircle (Finland-based Circular Ecosystem of Battery Metals) project is also acknowledged. L.K. is grateful for the Finnish Steel and Metal Producers’ Fund for a doctoral study grant. L.K. paid the APC with a grant from Walter Ahlström Foundation.
Acknowledgments
The work of Lassi Pakkanen at Geological Survey of Finland regarding the EPMA analyses is highly appreciated. This study utilized the Academy of Finland’s RawMatTERS Finland Infrastructure (RAMI), based jointly at Aalto University, GTK Espoo, and VTT Espoo.
Conflicts of Interest
The authors declare no conflict of interest. The funders had no role in the design of the study; in the collection, analyses, or interpretation of data; in the writing of the manuscript, or in the decision to publish the results.
Appendix A

Table A1.
Average concentrations of different elements in copper sulfide matte in air atmosphere. The concentrations obtained from LA-ICP-MS represent the elemental concentrations, not the concentrations of the isotopes. These have been calculated by the Glitter software, according to natural abundances of the isotopes.
| Averages, Air Atmosphere | |||||||||
|---|---|---|---|---|---|---|---|---|---|
| EDS, wt% | LA-ICP-MS, ppmw | ||||||||
| Time/s | Fe | Cu | S | 66Zn | 68Zn | 139La | 143Nd | 145Nd | 146Nd |
| 10 | 40.0 | 28.0 | 23.9 | ||||||
| 10 | 39.3 | 29.0 | 23.7 | ||||||
| 20 | 40.5 | 30.4 | 22.9 | 27,126.0 | 22,423.2 | 173.0 | 163.8 | 162.4 | 164.4 |
| 20 | 40.5 | 29.9 | 22.1 | 30,209.7 | 23,549.1 | 171.8 | 164.6 | 163.9 | 164.6 |
| 30 | 39.3 | 31.9 | 21.5 | 23,991.7 | 19,776.3 | 128.7 | 125.4 | 123.9 | 126.7 |
| 30 | 39.4 | 32.1 | 21.4 | 26,786.4 | 21,091.2 | 131.4 | 126.7 | 125.6 | 125.7 |
| 60 | 39.3 | 33.2 | 21.6 | 21,450.7 | 18,066.0 | 104.0 | 101.1 | 101.2 | 102.9 |
| 60 | 39.8 | 31.7 | 21.8 | 22,699.5 | 18,153.5 | 118.2 | 116.5 | 115.5 | 117.0 |
| 150 | 33.1 | 39.8 | 21.3 | 17,828.4 | 13,816.9 | 61.7 | 58.1 | 58.4 | 58.6 |
| 150 | 35.5 | 37.3 | 21.2 | 18,822.6 | 15,117.7 | 14.5 | 14.1 | 14.4 | 14.3 |
| 300 | 31.2 | 42.0 | 20.8 | 15,399.2 | 12,156.4 | 45.0 | 43.7 | 43.5 | 43.7 |
| 300 | 36.9 | 36.1 | 21.1 | 16,175.5 | 12,795.9 | 18.6 | 18.9 | 18.9 | 18.6 |
Table A2.
Standard deviations of different element concentrations in copper sulfide matte in air atmosphere.
Table A2.
Standard deviations of different element concentrations in copper sulfide matte in air atmosphere.
| Standard Deviations, Air Atmosphere | |||||||||
|---|---|---|---|---|---|---|---|---|---|
| EDS, wt% | LA-ICP-MS, ppmw | ||||||||
| Time/s | Fe | Cu | S | 66Zn | 68Zn | 139La | 143Nd | 145Nd | 146Nd |
| 10 | 0.5 | 1.1 | 0.7 | ||||||
| 10 | 0.4 | 0.9 | 0.3 | ||||||
| 20 | 0.9 | 1.1 | 0.5 | 927.2 | 822.5 | 19.1 | 17.5 | 17.2 | 17.5 |
| 20 | 0.5 | 0.4 | 0.6 | 1257.9 | 1172.0 | 20.0 | 19.7 | 19.3 | 19.0 |
| 30 | 1.2 | 1.2 | 0.8 | 624.9 | 518.6 | 26.9 | 29.4 | 28.4 | 29.7 |
| 30 | 1.1 | 1.2 | 0.4 | 941.4 | 752.9 | 25.5 | 25.0 | 24.7 | 25.0 |
| 60 | 0.7 | 0.6 | 0.2 | 983.3 | 867.8 | 10.0 | 9.4 | 9.3 | 9.1 |
| 60 | 0.6 | 0.9 | 0.3 | 1069.5 | 854.2 | 14.9 | 14.7 | 14.3 | 14.4 |
| 150 | 0.6 | 0.5 | 0.3 | 456.5 | 285.9 | 15.2 | 13.9 | 14.2 | 13.9 |
| 150 | 0.6 | 0.5 | 0.4 | 847.9 | 728.4 | 8.6 | 7.2 | 7.6 | 7.6 |
| 300 | 0.6 | 0.8 | 0.3 | 402.6 | 311.5 | 7.2 | 6.6 | 6.4 | 6.6 |
| 300 | 1.1 | 1.4 | 0.4 | 571.8 | 417.6 | 3.5 | 3.6 | 3.4 | 3.5 |
Table A3.
Average concentrations of different elements in copper sulfide matte in argon atmosphere.
| Averages, Argon Atmosphere | |||||||||
|---|---|---|---|---|---|---|---|---|---|
| EDS, wt% | LA-ICP-MS, ppmw | ||||||||
| Time/min | Fe | Cu | S | 66Zn | 68Zn | 139La | 143Nd | 145Nd | 146Nd |
| 5 | 41.4 | 31.1 | 21.6 | 10,372.2 | 8024.5 | 73.2 | 71.9 | 71.2 | 72.2 |
| 5 | 41.4 | 29.4 | 23.2 | 8398.3 | 6255.1 | 76.5 | 75.5 | 74.7 | 75.2 |
| 10 | 40.9 | 31.7 | 21.5 | 1024.6 | 793.7 | 67.2 | 66.2 | 67.3 | 66.2 |
| 10 | 41.7 | 30.9 | 22.0 | 1545.6 | 1227.4 | 72.5 | 71.8 | 71.9 | 72.7 |
| 20 | 41.1 | 33.1 | 21.0 | 196.7 | 148.7 | 62.4 | 61.4 | 62.0 | 62.4 |
| 20 | 41.4 | 32.2 | 21.2 | 396.5 | 302.2 | 61.9 | 61.2 | 60.5 | 62.1 |
| 40 | 42.7 | 30.8 | 21.3 | 17.9 | 13.4 | 53.7 | 53.6 | 53.5 | 53.2 |
| 40 | 40.6 | 33.2 | 21.1 | 21.3 | 16.0 | 60.5 | 59.0 | 59.7 | 59.0 |
Table A4.
Standard deviations of different element concentrations in copper matte in argon atmosphere.
Table A4.
Standard deviations of different element concentrations in copper matte in argon atmosphere.
| Standard Deviations, Argon Atmosphere | |||||||||
|---|---|---|---|---|---|---|---|---|---|
| EDS, wt% | LA-ICP-MS, ppmw | ||||||||
| Time/min | Fe | Cu | S | 66Zn | 68Zn | 139La | 143Nd | 145Nd | 146Nd |
| 5 | 0.6 | 1.0 | 0.2 | 507.9 | 468.7 | 0.9 | 1.4 | 1.3 | 1.5 |
| 5 | 0.5 | 0.4 | 0.1 | 355.3 | 266.7 | 3.1 | 2.8 | 2.9 | 1.9 |
| 10 | 0.6 | 0.7 | 0.2 | 12.5 | 10.2 | 1.6 | 1.1 | 0.6 | 1.3 |
| 10 | 0.5 | 0.6 | 0.3 | 130.2 | 106.6 | 6.6 | 6.7 | 7.0 | 6.1 |
| 20 | 1.7 | 2.0 | 0.3 | 18.0 | 12.9 | 3.6 | 3.4 | 3.5 | 3.3 |
| 20 | 0.9 | 1.1 | 0.5 | 80.2 | 63.6 | 4.0 | 4.0 | 4.7 | 4.3 |
| 40 | 1.3 | 1.5 | 0.2 | 0.8 | 0.5 | 5.3 | 5.0 | 5.0 | 4.5 |
| 40 | 1.3 | 1.6 | 0.3 | 0.9 | 0.9 | 5.3 | 4.7 | 5.3 | 4.9 |
Table A5.
Average concentrations of different elements in slag in air atmosphere.
| Averages, Air Atmosphere (EPMA, wt%) | ||||||||
|---|---|---|---|---|---|---|---|---|
| Time/s | O | Si | Fe | Cu | S | Zn | La | Nd |
| 20 | 30.6 | 12.1 | 45.8 | 0.5 | 1.1 | 2.1 | 3.7 | 3.8 |
| 20 | 29.8 | 12.3 | 46.5 | 0.5 | 0.8 | 2.1 | 3.7 | 3.8 |
| 30 | 31.3 | 14.6 | 41.2 | 0.7 | 2.1 | 2.3 | 3.6 | 3.7 |
| 30 | 30.6 | 15.3 | 40.8 | 0.7 | 2.2 | 2.5 | 3.7 | 3.8 |
| 60 | 32.5 | 14.6 | 41.3 | 0.8 | 2.2 | 2.4 | 2.9 | 3.0 |
| 60 | 31.9 | 14.9 | 40.7 | 0.7 | 2.3 | 2.4 | 3.4 | 3.5 |
| 150 | 31.6 | 15.7 | 43.3 | 0.8 | 1.5 | 2.0 | 2.3 | 2.4 |
| 150 | 31.4 | 14.3 | 45.0 | 0.8 | 1.3 | 2.4 | 2.2 | 2.4 |
| 300 | 31.0 | 14.7 | 44.5 | 0.8 | 1.8 | 2.0 | 2.5 | 2.6 |
| 300 | 31.3 | 14.5 | 45.8 | 0.9 | 2.5 | 1.9 | 1.4 | 1.5 |
Table A6.
Standard deviations of different element concentrations in slag in air atmosphere.
| Standard Deviations, Air Atmosphere (EPMA, wt%) | ||||||||
|---|---|---|---|---|---|---|---|---|
| Time/s | O | Si | Fe | Cu | S | Zn | La | Nd |
| 20 | 0.6 | 0.7 | 1.6 | 0.1 | 0.5 | 0.4 | 0.5 | 0.5 |
| 20 | 0.6 | 1.0 | 1.4 | 0.1 | 0.6 | 0.3 | 0.2 | 0.2 |
| 30 | 0.3 | 0.3 | 0.5 | 0.1 | 0.2 | 0.2 | 0.1 | 0.1 |
| 30 | 0.2 | 0.3 | 0.5 | 0.0 | 0.1 | 0.1 | 0.1 | 0.1 |
| 60 | 0.9 | 0.5 | 1.1 | 0.0 | 0.5 | 0.1 | 0.2 | 0.2 |
| 60 | 0.3 | 0.1 | 0.3 | 0.1 | 0.1 | 0.0 | 0.1 | 0.1 |
| 150 | 0.9 | 0.4 | 0.2 | 0.0 | 0.8 | 0.2 | 0.1 | 0.1 |
| 150 | 0.8 | 0.4 | 0.7 | 0.1 | 0.7 | 0.1 | 0.1 | 0.1 |
| 300 | 0.3 | 0.5 | 0.5 | 0.1 | 0.5 | 0.0 | 0.1 | 0.1 |
| 300 | 0.4 | 0.5 | 0.7 | 0.1 | 0.4 | 0.1 | 0.2 | 0.2 |
Table A7.
Average concentrations of different elements in slag in argon atmosphere.
| Averages, Argon Atmosphere (EPMA, wt%) | ||||||||
|---|---|---|---|---|---|---|---|---|
| Time/min | O | Si | Fe | Cu | S | Zn | La | Nd |
| 5 | 31.2 | 15.7 | 42.0 | 0.7 | 2.4 | 0.9 | 3.3 | 3.3 |
| 5 | 31.6 | 15.2 | 41.8 | 0.7 | 2.4 | 1.0 | 3.5 | 3.5 |
| 10 | 30.7 | 16.0 | 42.7 | 0.6 | 2.2 | 0.1 | 3.7 | 3.7 |
| 10 | 30.7 | 16.0 | 42.5 | 0.7 | 2.1 | 0.2 | 3.7 | 3.7 |
| 20 | 30.9 | 15.8 | 43.2 | 0.6 | 2.1 | 0.0 | 3.5 | 3.5 |
| 20 | 31.4 | 15.5 | 43.1 | 0.6 | 2.1 | 0.0 | 3.4 | 3.4 |
| 40 | 31.2 | 15.9 | 42.9 | 0.6 | 2.1 | 0.0 | 3.4 | 3.4 |
| 40 | 31.4 | 16.1 | 42.5 | 0.6 | 2.0 | 0.0 | 3.6 | 3.6 |
Table A8.
Standard deviations of different element concentrations in slag in argon atmosphere.
| Standard Deviations, Argon Atmosphere (EPMA, wt%) | ||||||||
|---|---|---|---|---|---|---|---|---|
| Time/min | O | Si | Fe | Cu | S | Zn | La | Nd |
| 5 | 0.5 | 0.3 | 0.6 | 0.1 | 0.2 | 0.1 | 0.3 | 0.1 |
| 5 | 0.3 | 0.1 | 0.2 | 0.0 | 0.0 | 0.0 | 0.0 | 0.0 |
| 10 | 0.3 | 0.2 | 0.5 | 0.0 | 0.1 | 0.0 | 0.2 | 0.2 |
| 10 | 0.3 | 0.3 | 0.9 | 0.0 | 0.2 | 0.0 | 0.3 | 0.3 |
| 20 | 0.2 | 0.3 | 0.3 | 0.0 | 0.0 | 0.0 | 0.1 | 0.1 |
| 20 | 0.2 | 0.1 | 0.1 | 0.0 | 0.1 | 0.0 | 0.0 | 0.0 |
| 40 | 0.3 | 0.3 | 0.2 | 0.0 | 0.0 | 0.0 | 0.0 | 0.1 |
| 40 | 0.3 | 0.1 | 0.3 | 0.0 | 0.1 | 0.0 | 0.0 | 0.0 |
Appendix B
Figure A1.
An Ellingham diagram for Cu2O, FeO, SiO2, La2O3, Nd2O3, Gd2O3, and Er2O3. Calculated with HSC Chemistry, version 6.12.
Figure A1.
An Ellingham diagram for Cu2O, FeO, SiO2, La2O3, Nd2O3, Gd2O3, and Er2O3. Calculated with HSC Chemistry, version 6.12.

References
- Study on the Review of the List of Critical Raw Materials–Final Report; Publications Office of the European Union: Luxembourg, 2017. Available online: https://op.europa.eu/en/publication-detail/-/publication/08fdab5f-9766-11e7-b92d-01aa75ed71a1 (accessed on 23 December 2019).
- Report on Critical Raw Materials and the Circular Economy; Publications Office of the European Union: Luxembourg, 2018. Available online: http://publications.europa.eu/resource/cellar/d1be1b43-e18f-11e8-b690-01aa75ed71a1.0001.01/DOC_1 (accessed on 23 December 2019).
- Schüler, D.; Buchert, M.; Liu, R.; Dittrich, S.; Merz, C. Study on Rare Earths and Their Recycling. Öko-Institut e.V. 2011. Available online: http://www.oeko.de/oekodoc/1112/2011-003-en.pdf (accessed on 18 November 2019).
- Layman’s Report-Solvay “LOOP” Project-LIFE11/ENV/FR/00744: An Innovative Process of Rare Earth Recycling from Used Fluorescent Lamps. 2014. Available online: https://www.solvay.com/sites/g/files/srpend221/files/2018-07/solvay-loop-project-de-en.pdf (accessed on 18 November 2019).
- Gambogi, J. Rare Earth Statistic and Information, U.S. Geological Survey, Mineral Commodity Summaries, February 2019. Available online: https://prd-wret.s3-us-west-2.amazonaws.com/assets/palladium/production/atoms/files/mcs-2019-raree.pdf (accessed on 16 October 2019).
- Barakos, G.; Gutzmer, J.; Mischo, H. Strategic evaluations and mining process optimization towards a strong global REE supply chain. J. Sustain. Min. 2016, 15, 26–35. [Google Scholar] [CrossRef] [Green Version]
- Binnemans, K.; Jones, P.T.; Blanpain, B.; van Gerven, T.; Yang, Y.; Walton, A.; Buchert, M. Recycling of rare earths: A critical review. J. Clean. Prod. 2013, 51, 1–22. [Google Scholar] [CrossRef]
- Tsamis, A.; Coyne, M. Recovery of Rare Earths from Electronic Wastes: An Opportunity for High-Tech SMEs. Directorate General for Internal Policies Policy Department A: Economic and Scientific Policy. 2015. Available online: https://www.europarl.europa.eu/RegData/etudes/STUD/2015/518777/IPOL_STU(2015)518777_EN.pdf (accessed on 18 November 2019).
- Baldé, C.P.; Forti, V.; Gray, V.; Kuehr, R.; Stegmann, P. The Global E-Waste Monitor–2017, United Nations University (UNU), International Telecommunication Union (ITU) & International Solid Waste Association (ISWA), Bonn/Geneva/Vienna. Available online: https://www.itu.int/en/ITU-D/Climate-Change/Documents/GEM%202017/Global-E-waste%20Monitor%202017%20-%20Executive%20Summary.pdf (accessed on 23 December 2019).
- Tanaka, M.; Oki, T.; Koyama, K.; Narita, H.; Oishi, T. Recycling of rare earths from scrap. In Handbook on the Physics and Chemistry of Rare Earths; Bunzli, J.C.G., Pecharsky, V.K., Eds.; Elsevier: Amsterdam, The Netherlands, 2013; Volume 43, Chapter 255; pp. 159–212. [Google Scholar] [CrossRef]
- Baba, K.; Hiroshige, Y.; Nemoto, T. Rare-earth Magnet Recycling. Hitachi Rev. 2013, 62, 452–455. [Google Scholar]
- Zakotnik, M.; Tudor, C.O. Commercial-scale recycling of NdFeB-type magnets with grain boundary modification yields products with ‘designer properties’ that exceed those of starting materials. Waste Manag. 2015, 44, 48–54. [Google Scholar] [CrossRef] [PubMed]
- Liu, F.; Porvali, A.; Halli, P.; Wilson, B.; Lundström, M. Comparison of Different Leaching Media and Their Effect on REEs Recovery from Spent Nd-Fe-B Magnets. JOM 2019. [Google Scholar] [CrossRef] [Green Version]
- Honda Motor Co. Ltd. Honda to Reuse Rare Earth Metal Extracted from Nickel-metal Hydride Batteries in Hybrid Vehicles for the Motors for Hybrid Vehicle Motors. Available online: https://hondanews.eu/eu/en/cars/media/pressreleases/2759/honda-to-reuse-rare-earth-metal-extracted-from-nickel-metal-hydride-batteries-in-hybrid-vehicles-for (accessed on 18 November 2019).
- Umicore Battery Recycling Process. Available online: https://csm.umicore.com/en/recycling/battery-recycling/our-recycling-process (accessed on 18 November 2019).
- Gambogi, J. Rare Earths, Mineral Commodity Summaries 2015, U.S. Geological Survey. Available online: https://www.fairphone.com/wp-content/uploads/2016/01/mcs2015.pdf (accessed on 23 December 2019).
- Espinosa, D.C.R.; Mansur, M.B. Recycling batteries. Waste Electrical and Electronic Equipment (WEEE) Handbook. Woodhead Publishing Series in Electronic and Optical Materials: Number 30. Goodship, V., Stevels, A., Eds.; 2012. Chapter 17. pp. 365–384. Available online: https://doi.org/10.1016/B978-0-08-102158-3.00014-8 (accessed on 23 December 2019).
- Shin, S.M.; Shin, D.J.; Jung, G.J.; Kim, Y.H.; Wang, J.P. Recovery of electrodic powder from spent Nickel-Metal-Hydride batteries (NiMH). Arch. Metall. Mater. 2015, 60, 1139–1143. [Google Scholar] [CrossRef]
- Bernardes, A.M.; Espinosa, D.C.R.; Tenório, J.A.S. Recycling of batteries: A review of current processes and technologies. J. Power Sources 2004, 130, 291–298. [Google Scholar] [CrossRef]
- Sullivan, J.L.; Gaines, L. A Review of Battery Life-Cycle Analysis: State of Knowledge and Critical Needs, Report of U.S. Department of Energy ANL/ESD/10-7 (2010). Available online: https://publications.anl.gov/anlpubs/2010/11/68455.pdf (accessed on 18 November 2019).
- Müller, T.; Friedrich, B. Development of a recycling process for nickel-metal hydride batteries. J. Power Sources 2006, 158, 1498–1509. [Google Scholar] [CrossRef]
- Haque, N.; Hughes, A.; Lim, S.; Vernon, C. Rare Earth Elements: Overview of Mining, Mineralogy, Uses, Sustainability and Environmental Impact. Resources 2014, 3, 614–635. [Google Scholar] [CrossRef] [Green Version]
- Tirronen, T.; Sukhomlinov, D.; O’Brien, H.; Taskinen, P.; Lundström, M. Distributions of lithium-ion and nickel-metal hydride battery elements in copper converting. J. Clean. Prod. 2017, 168, 399–409. [Google Scholar] [CrossRef]
- Tang, K.; Ciftja, A.; Martinez, A.M.; Van Der Eijk, C. Recycling the Rare Earth Elements from Waste NiMH Batteries and Magnet Scraps by Pyrometallurgical Processes. In Proceedings of the First International Symposium on Development of Rare Earths, Baotou, China, 8–12 August 2014. [Google Scholar] [CrossRef]
- Sun, T.; Kennedy, M.W.; Yurramendi, L.; Aldana, J.L.; Del Rio, C.; Arnout, S.; Tranell, G.; Aune, R.E. Pyrometallurgical Treatment of Apatite Concentrate with the Objective of Rare Earth Element Extraction: Part I. J. Sustain. Metall. 2017, 3, 829–845. [Google Scholar] [CrossRef] [Green Version]
- Jiang, Y.-J.; Deng, Y.-C.; Bu, W.-G. Pyrometallurgical Extraction of Valuable Elements in Ni-Metal Hydride Battery Electrode Materials. Metall. Mater. Trans. B 2015, 46, 2153–2157. [Google Scholar] [CrossRef]
- Guntoro, P.I.; Jokilaakso, A.; Hellstén, N.; Taskinen, P. Copper matte-slag reaction sequences and separation processes in matte smelting. J. Min. Metall Sect. B Metall. 2018, 54, 301–311. [Google Scholar] [CrossRef] [Green Version]
- Fagerlund, K.O.; Jalkanen, H. Microscale simulation of settler processes in copper matte smelting. Metall. Mater. Trans. B 2000, 31, 439–451. [Google Scholar] [CrossRef]
- Wan, X.; Jokilaakso, A.; Iduozee, I.; Eric, H.; Latostenmaa, P. Experimental research on the behavior of WEEE scrap in flash smelting settler with copper concentrate and synthetic slag. In Proceedings of the EMC 2019, Düsseldorf, Germany, 23–26 June 2019; Volume 3, pp. 1137–1150, ISBN 978-3-940276-89-6. [Google Scholar]
- Wan, X.; Jokilaakso, A.; Fellman, J.; Klemettinen, L.; Marjakoski, M. Behavior of Waste Printed Circuit Board (WPCB) Materials in the Copper Matte Smelting Process. Metals 2018, 8, 887. [Google Scholar] [CrossRef] [Green Version]
- Jokilaakso, A.; Suominen, R.; Taskinen, P.; Lilius, K. Oxidation of chalcopyrite in simulated suspension smelting. Trans IMM Sect. C 1991, 100, C79–C90. [Google Scholar]
- Hellstén, N.; Klemettinen, L.; Sukhomlinov, D.; O’Brien, H.; Taskinen, P.; Jokilaakso, A.; Salminen, J. Slag Cleaning Equilibria in Iron Silicate Slag–Copper Systems. J. Sustain. Metall. 2019, 5, 463–473. [Google Scholar] [CrossRef] [Green Version]
- Jochum, K.; Willbold, M.; Raczek, I.; Stoll, B.; Herwig, K. Chemical Characterisation of the USGS Reference Glasses GSA-1G, GSC-1G, GSD-1G, GSE-1G, BCR-2G, BHVO-2G and BIR-1G Using EPMA, ID-TIMS, ID-ICP-MS and LA-ICP-MS. Geostand. Geoanal. Res. 2005, 29, 285–302. [Google Scholar] [CrossRef]
- Wilson, S.; Ridley, W.; Koenig, A. Development of sulfide calibration standards for the laser ablation inductively-coupled plasma mass spectrometry technique. J. Anal. At. Spectrom. 2002, 17, 406–409. [Google Scholar] [CrossRef]
- van Achterberg, E.; Ryan, C.; Jackson, S.; Griffin, W. Data reduction software for LA-ICP-MS. In Laser Ablation ICP-MS in the Earth Sciences-Principles and Applications; Mineralogical Association of Canada Short Course Series; Mineralogical Association of Canada: St. John, NL, USA, 2001; Volume 29, pp. 239–243. [Google Scholar]
Figure 1.
(A): SEM-secondary electron image of laser pits in matte phase. (B): Time-resolved analysis signals for neodymium (143Nd) of the LA-ICP-MS measurements on the copper sulfide mattes of samples contacted in air for 20 s and 300 s at 1300 °C.
Figure 1.
(A): SEM-secondary electron image of laser pits in matte phase. (B): Time-resolved analysis signals for neodymium (143Nd) of the LA-ICP-MS measurements on the copper sulfide mattes of samples contacted in air for 20 s and 300 s at 1300 °C.

Figure 2.
SEM-BSE images of sample microstructures after different contact times in air atmosphere. (A): 10 s, (B): 20 s, (C): 30 s, (D): 60 s, (E): 150 s, (F): 300 s. The numbers in figures A and C denote the different phases and parts of the samples—1: solid silica, 2: solid iron oxide, 3: copper sulfide matte, 4: epoxy, 5: liquid slag, 6: silica crucible.

Figure 3.
SEM-BSE images of samples reacted in argon atmosphere. (A): 5 min contact time, (B): 40 min, (C): copper-rich veins in the matte after 20 min. The microstructures remain relatively similar as the time is increased. The numbers denote 1: solid silica, 2: copper sulfide matte, 3: liquid slag, 4: epoxy, 5: silica crucible.

Figure 4.
Concentrations of Si, Fe, and Cu in slag in air atmosphere as a function of time.

Figure 5.
Concentrations of Si, Fe, and Cu in slag in argon atmosphere.

Figure 6.
Concentrations of main components Fe, Cu, and S in copper matte in air and argon atmospheres.
Figure 6.
Concentrations of main components Fe, Cu, and S in copper matte in air and argon atmospheres.

Figure 7.
Concentrations of La and Nd in slag as a function of time.

Figure 8.
Concentrations of La and Nd in matte as a function of time.

Figure 9.
Distribution coefficients of La and Nd in air and argon atmospheres. The value from an equilibrium study by Tirronen et al. [23] (equilibration time 45 min = 2700 s) has been plotted for comparison.
Figure 9.
Distribution coefficients of La and Nd in air and argon atmospheres. The value from an equilibrium study by Tirronen et al. [23] (equilibration time 45 min = 2700 s) has been plotted for comparison.

Table 1.
Elemental composition of the concentrate in wt%, analyzed by XRF.
| S | Fe | Cu | Zn | SiO2 | Pb | CaO | Cr | Ni | As |
|---|---|---|---|---|---|---|---|---|---|
| 33.17 | 27.36 | 27.34 | 3.77 | 2.53 | 0.13 | 0.09 | 0.012 | 0.004 | 0.026 |
Table 2.
EPMA and LA-ICP-MS detection limits in ppmw (parts per million by weight).
| O | Si | S | Fe | Cu | La | Nd | |
|---|---|---|---|---|---|---|---|
| EPMA (slag) | 1008 | 220 | 135 | 253 | 310 | 281 | 146 |
| LA-ICP-MS (matte) | 8.0 | 1.5 | 0.001 | 0.006 |
© 2019 by the authors. Licensee MDPI, Basel, Switzerland. This article is an open access article distributed under the terms and conditions of the Creative Commons Attribution (CC BY) license (http://creativecommons.org/licenses/by/4.0/).
Share and Cite
MDPI and ACS Style
Klemettinen, L.; Aromaa, R.; Dańczak, A.; O’Brien, H.; Taskinen, P.; Jokilaakso, A. Distribution Kinetics of Rare Earth Elements in Copper Smelting. Sustainability 2020, 12, 208. https://doi.org/10.3390/su12010208
AMA Style
Klemettinen L, Aromaa R, Dańczak A, O’Brien H, Taskinen P, Jokilaakso A. Distribution Kinetics of Rare Earth Elements in Copper Smelting. Sustainability. 2020; 12(1):208. https://doi.org/10.3390/su12010208
Chicago/Turabian StyleKlemettinen, Lassi, Riina Aromaa, Anna Dańczak, Hugh O’Brien, Pekka Taskinen, and Ari Jokilaakso. 2020. "Distribution Kinetics of Rare Earth Elements in Copper Smelting" Sustainability 12, no. 1: 208. https://doi.org/10.3390/su12010208
Note that from the first issue of 2016, this journal uses article numbers instead of page numbers. See further details here.