Article

Seeing Sustainability from Space: Using Earth Observation Data to Populate the UN Sustainable Development Goal Indicators

1
Centre for Environment and Sustainability, University of Surrey, Guildford GU2 7XH, UK
2
Environment Department, National Physical Laboratory, Teddington TW11 0LW, UK
*
Author to whom correspondence should be addressed.
Sustainability 2019, 11(18), 5062; https://doi.org/10.3390/su11185062
Submission received: 30 July 2019 / Revised: 9 September 2019 / Accepted: 10 September 2019 / Published: 16 September 2019
(This article belongs to the Section Environmental Sustainability and Applications)

Abstract

:
In 2015, member countries of the United Nations adopted the 17 Sustainable Development Goals (SDGs) at the Sustainable Development Summit in New York. These global goals have 169 targets and 232 indicators based on the three pillars of sustainable development: economic, social, and environmental. However, substantial challenges remain in obtaining data of the required quality and quantity to populate these indicators efficiently. One promising and innovative way of addressing this issue is to use Earth observation (EO). The research reported here updates our original work to develop a Maturity Matrix Framework (MMF) for assessing the suitability of EO-derived data for populating the SDG indicators, with a special focus on those indicators covering the more social and economic dimensions of sustainable development, as these have been under-explored in terms of the contribution that can be made by EO. The advanced MMF 2.0 framework set out in this paper is based on a wide consultation with EO and indicator experts (semi-structured interviews with 38 respondents). This paper provides detail of the evolved structure of MMF 2.0 and illustrates its use for one of the SDG indicators (Indicator 11.1.1). The revised MMF is then applied to published work covering the full suite of SDG indicators and demonstrates that EO can make an important contribution to providing data relevant to a substantial number of the SDG indicators.

1. Introduction

The United Nations (UN) 2030 Agenda for Sustainable Development comprises 17 Sustainable Development Goals (SDGs), with 169 targets and 232 associated indicators. The United Nations Statistics Division (UNSD) created the Inter-Agency Expert Group for the SDGs (IAEG-SDGs), which interacts with National Statistical Offices (NSOs) and provides strategies for countries to implement the SDGs and to report on progress towards the targets [1]. The Global Indicator Framework of 232 indicators was officially adopted by the UN Statistical Commission at the 48th session in March 2015. The IAEG-SDGs has classified the indicators into three tiers based on the methodology and level of data available as follows:
  • Tier I: Established methodology and data are widely available to populate the indicator.
  • Tier II: Established methodology but data are not collected regularly by the countries
  • Tier III: No established methodology to collect the required data.
IAEG-SDGs regularly reviews the Global Indicator Framework to add more indicators if needed or to update the status of the Tier classification and metadata of the indicator. There are multiple sources of data to populate and sustain the SDG indicators, including new technologies which aim to replace costly traditional approaches (e.g., replacing surveys with more affordable approaches that can provide repeated coverage and real-time information) [2]. However, substantial challenges remain in obtaining enough data of the required quality, especially in developing countries, to populate the SDG indicators. As of April 2017, reports show that two-thirds of the progress towards the associated targets and indicators remained unmonitored [2]. Indeed, it could be argued that there is a serious lack of data: “too many countries still have poor data, data arrives too late and too many issues are still barely covered by existing data” [3].
One option to help provide the required data for the SDG indicators is to use Earth Observation (EO) via satellites, although this can be expensive, especially for higher-resolution data. However, free historical and current access to EO data has been offered by space agencies such as ESA and NASA for more than ten years [4,5]. Likewise, considerable efforts have been made by many organisations to provide continuous Big Earth Data integrated into available systems and solutions via Data Hubs (e.g., Copernicus Open Access Hub, Earth Explorer, EUMETSAT Data Centre), Data Cubes (Digital Earth Australia, Earth Server, Swiss Data Cube) and Open Sources (Google Earth Engine, Amazon Web Services, ESA U-TEP). Whilst such raw data is becoming more readily available, specialists are still often required to process and interpret them accordingly, although some providers (e.g., Google Earth Engine) have started to offer pre-processed EO data in a more user-friendly manner known as “analysis ready data” [6]. The intention is to enhance the usage of such data but also to be able to monitor the SDGs on a continuous basis and report progress or regress in all member countries to support the principle of ‘leave no one behind’ at the heart of the SDGs.
Moreover, monitoring systems to assess the Essential Variables (EVs) of climate, biodiversity, and oceans, as well as for the SDG indicators are becoming important for tracking progress and better informing policy [7]. EVs have become important concepts within many communities as a means to identify those variables that define the state of Earth systems and monitor important changes. GEOEssential Hub is a platform dedicated to mainstreaming workflows bridging data sources with environment policy indicators via EVs [8]. Such an approach would help identify substantial gaps and needs in environmental policy and eventually provide a useful means for deriving policy-relevant indicators.
The UN Global Working Group (GWG) on Big Data for Official Statistics has established pilot projects focused on how EO satellite data can support some SDG indicators [9] using best practices for big data interoperability, access, and analytics. This has been achieved through emerging collaboration between institutions such as the Group on Earth Observation (GEO), National Administrative Department of Statistics (DANE), Australian Bureau of Statistics (ABS), Australia, National Institute of Statistics and Geography (INEGI) in Mexico and Google. As noted by the UN Global Working Group on Big Data: “Satellite imagery has significant potential to provide a more timely statistical output, to reduce the frequency of surveys, to reduce respondent burden and other costs and to provide data at a more disaggregated level for informed decision making” [10].
GEO and its space-agency arm, the Committee on Earth Observation Satellites (CEOS), have presented an initial view [11,12] on how EO can support SDG indicators and has endorsed the potential of EO to advance the UN 2030 Agenda. Moreover, the latest report released by ESA [13] provides several best-practice examples on the role of EO data to support to the national progress on the SDG indicators. The Global Human Settlement Layer (GHSL) and the World Settlement Footprint 2015 (WSF2015) have recently used EO to create new data on human settlements. The platform provides data on the area, shape, imperviousness, greenness, pattern, and network of settlements generated at a 10 m spatial resolution based on both optical (Landsat-8) and radar (Sentinel-1) imagery. When these data are combined with information on population, they constitute a major source of data to inform the SDG indicator 11.3.1 on land consumption rate [13]. Also, the Applied Sciences Program within NASA Earth Science has been implementing projects in collaboration with institutions and organisations such as CEOS and GEO, promoting innovation and practical uses of satellite imagery. Some of the projects within this programme cover disasters monitoring (acting in a near real-time), water quality management, health (e.g., malaria early warning), U.S. Drought Monitor, fisheries management, air quality (e.g., BlueSky emissions assessment and AIRNow systems) and wildfire (e.g., BlueSky for smoke management).
For instance, LandScan 2004 estimates population size and density informed by both, survey data and night-time and daytime satellite data [14]. Night-time light images can also provide data relevant to indicators covering Gross Domestic Product (GDP) [15,16], infant mortality [17,18], school attendance [18], poverty [19,20], electricity consumption [21], rural population estimation [22], urbanisation [23,24], illegal fishing activities [25], evaluation of human rights [26], corruption [27], incidence of breast cancer [28] and inequality [20].
Given the wide diversity of SDG indicators, spanning many environmental, economic and social domains and with many of them having more than one component (e.g., a numerator and denominator), what is required is a framework that assesses the “fitness for purpose” of EO to provide data to populate these indicators either in full or in part against different criteria. In [29], we presented an initial version of a ‘Maturity Matrix Framework’ (MMF) (henceforth referred to as MMF 1.0) designed to evaluate the usefulness of EO to help populate the SDG indicators. This was based on a set of assumptions developed by the authors without a wider consultation with experts in the EO and indicator arenas. Another recent initiative supported by ESA is due to be published in a report entitled “View from the sky—The contribution of EO to SDGs and selected indicators” [30].
Taking into consideration the rapid development of the wide range of SDG indicators and EO technologies, a wider engagement with the community of experts both in EO and in indicators [31] would be a valuable element supporting development of a fully comprehensive, transparent and robust framework. This has been undertaken in the present research which presents an advanced version of the MMF for EO for the SDGs, henceforth referred to as MMF 2.0. It is a major evolution of MMF 1.0, developed on the basis of feedback from the expert consultations and other adaptations.
This paper sets out the methodology used to evolve MMF 2.0 via semi-structured, expert interviews and details how these were used to influence the MMF 2.0 components and the scoring system applied. A worked example based on SDG indicator 11.1.1 is given. The results of applying the MMF 2.0 framework to more than 70 published studies are presented as a ‘dashboard’, in order to give a systematic, objective appraisal of the applicability of EO to populate the full range of the SDG indicators. The application and benefits of this MMF approach and the overall potential of EO support for the SDGs are discussed.

2. Methodology

A survey was conducted between November 2018 and January 2019 using a semi-structured interview format [32] with 22 experts in EO and 16 specialists in sustainability indicators. The selection of respondents was based upon their specific expertise in EO and indicators followed by an interview invitation sent via email. In the email invitation, the MMF 1.0 was briefly explained and the research article, [29], was attached. An initial set of respondents was identified as being experts in the fields of EO and indicators, partly via their presence in the academic and ‘grey’ literatures but also from knowledge of authors and attendance at international conferences. Following this, an element of ‘snowballing’ took place with several interviewees suggesting other respondents they felt should be included.
The 38 respondents came from a range of sectors and roles, including academics (15), researchers (11), consultants (8), and (Inter) Governmental Organisations (4). Respondents came from a total of 11 countries (Table 1). Each interview lasted between 40 and 80 min and was primarily carried out face-to-face; either in person or via an online and secure conversation using Skype. Five interviews were undertaken in writing as those experts preferred that format.
The MMF 1.0 framework was explained in more detail at the start of the interview, and the design of the questionnaire (Table 2) for the interview was based on the assumptions set out in [29] for the first version of the MMF but questions were framed to allow respondents to provide their own suggestions on how the framework should evolve.
The questionnaire was divided into 7 sections (Table 2) covering 19 questions about an expert’s familiarity with the SDGs, validation of the initial framework, barriers encountered in processing EO data, availability of EO data and the relevance/value of using proxy indicators. Some of the questions were not applicable for the indicator experts as they were highly specific to the EO technology context.
The transcribed interviews were subjected to content analysis. A series of open and axial coding techniques based on [33] were used to identify themes and build the theory. The first step of the process was ‘open coding’, in which tentative labels were assigned to the interview transcription data. Secondly, in the axial coding, codes were selected to focus on the analysis of the core categories to identify relationships among the open codes. Thus, categories/themes were identified in the data using the concepts behind the survey questions.

3. Results

3.1. Expert Interviews

Most of the respondents (also noted as key informants (KI)) considered that there was a need to assess the contribution that EO-derived data could make to the SDG indicators, although all acknowledged that this is a complex process. All noted that the first MMF [29] was a valuable attempt to provide the kind of information needed to help assess the fitness-for-purpose of EO data for SDG indicators. Respondents felt that the framework may unlock fascinating and unexplored applications of EO data and, at the same time, might accelerate the usage of EO data. Likewise, the respondents believed the MMF could be valuable for decision-making processes by (i) providing insights on those indicators that could be populated using EO-derived data, (ii) helping make the process of populating the SDG indicators more effective and, (iii) help identify resource-efficient ways to collect data of the required quality and timeliness. Typical quotes from respondents were:
“Today we only have data for 20% of SDG indicators, so serious action needs to be taken. Such a useful common framework puts things on a spectrum that will enhance the usage of EO data and therefore it will be able to fill data gaps and build a bridge between technical work and sustainability.”
(Respondent A)
“From a policy maker point of view, I think this is a brilliant framework as it provides that information that you can’t get via any other sources and can be a useful tool not only for decision makers, but also for the research community and nongovernmental organisations.”
(Respondent B)
“This framework identified indicators for which there’s a high potential for earth observation data to help us to measure things properly, but for which we might not have global data systems in place to make that real.”
(Respondent C)

3.2. Maturity Matrix Framework 2.0 (MMF 2.0) Construction

The main points of advice and suggestions from respondents used to construct MMF 2.0 are given in the Supplementary Materials (Table S1). In particular, several respondents commented on the need for the MMF to include:
  • Uncertainty generated by the ways in which EO data are processed
  • Need for a cost effectiveness to be included in the assessment
  • Practicability and maturity of the approach (Technology Readiness Level-TRL)
  • Direct and indirect (proxy) use of EO data for indicators.
  • Need for non-EO-derived data to be used alongside EO-derived data for some indicators
Based upon the responses, MMF 2.0 was developed comprising both metadata (Table 3, a listing of essential information) and the following six scalable ‘premises’ (A–F) (Table 4):
  • Uncertainty assessment (Premise A)
  • Directness (Premise B)
  • Completeness (Premise C)
  • Requirement for Non-EO information (Premise D)
  • Practicability (TRL) (Premise E)
  • Cost effectiveness analysis (Premise F)
Premises C and D were part of the first MMF and respondents affirmed their importance, but the others were new. Each of these premises is scored between 1 and 5 and is described in detail below:

3.2.1. Premise A. Uncertainty Assessment

This premise considers the uncertainty associated with the determination of the SDG indicator. For direct, quantitative measures of the SDG indicator (e.g., some environmental indicators), this would include the assessment of uncertainties associated with the raw satellite data and those introduced in the processing of the raw data to obtain a bio-geophysical measurement, a process that often includes models. Ideally, such models would be assessed by propagating uncertainties through the processing and the uncertainties themselves would be validated through in situ observations: however, more commonly, uncertainties are estimated through validation (with validation being considered for the value rather than for the uncertainty). For SDG indicators that are obtained using classification, machine learning techniques or image recognition, and those that are obtained indirectly through proxies, uncertainty estimates are based on statistical evaluations of the differences between models and ground reference data sets. It is important to remember that ground reference measurements also have associated uncertainties in the measured values, sampling representativeness and completeness.
For MMF 2.0, recognising that not all current EO techniques have had a rigorous uncertainty analysis performed, the ‘uncertainty premise’ was divided into two sub-components: Uncertainty Information, which considered the extent to which uncertainty analysis had been performed (from a basic study to an independently-validated analysis) and Accuracy level (which was scored according to the numerical uncertainty given).

3.2.2. Premise B. Directness

This premise refers to whether the EO data can support population of the SDG indicator either directly or indirectly. Direct use of EO data tends to be associated more with environmental monitoring (e.g., measures of land use change) while indirect/proxy measures based on EO, such as the consideration of night-lighting levels as a proxy for economic activity, tend to be more valuable for socio-economic indicators. An indirect or ‘proxy’ measure using EO data is often associated with empirical and semi-empirical methods that find correlations between an EO-derived data and, for example, GDP. In this case, the empirical relationships need to be regularly validated in situ to reduce uncertainty.

3.2.3. Premise C. Completeness

This premise remains unchanged from MMF 1.0 [29]. It assesses the extent to which EO-derived data can be used to populate the indicator and addresses the issue that some indicators have more than one component e.g., a numerator and a denominator. The SDG indicator is dissected into sub-indicators, using the metadata repository [34] available for each SDG indicator in order to assign the score from 1 to 5, with 1 meaning EO does not support indicator and 5 meaning that EO-derived data can be used to assess all components of the indicator.

3.2.4. Premise D. Requirement for Non-EO Information

For the aspects of the indicator (sub-indicators) that are identified in the analysis of Premise C to be supported by EO data, Premise D considers the importance of non-EO data (e.g., the use of surveys, tax returns or census-derived data) in combination with EO-derived data. Thus, different forms of EO data can be combined with other types of data to populate indicators. For example, [35] provide an example of combining EO and mobile phone data to obtain poverty estimates. In this premise, the score assigned depends on the degree to which non-EO data are used, their importance and implications. A low score implies that EO data are used only to supplement non-EO data. For intermediate scores, non-EO data are used to provide a ‘training set’ for EO algorithms and for high scores EO data could be used directly with some non-EO data for validation purposes only.

3.2.5. Premise E. Practicability

This premise addresses the practical feasibility of using EO-derived data and the maturity of the method or innovation as published either in peer-reviewed publications or technical reports. This premise is based on an adaptation of the nine TRL criteria originally developed by NASA [36] by placing them into 5 scalable score sub-criteria.

3.2.6. Premise F. Cost Effectiveness Analysis

This premise addresses the need for EO-based methods to be cost-effective relative to established approaches such as surveys. Conducting a cost effectiveness analysis is an important consideration [37,38] when deciding on the most efficient ways of providing data to support the SDG indicator. According to [39] it is necessary to take into account a range of factors when conducting a cost-effectiveness analysis:
  • Cost of acquiring, cleaning and preparing the EO data in comparison with other types of data available. For instance, software acquisition, staff salaries, training, etc.
  • Assessment of accuracy, relevance, consistency, interpretability and timeliness of EO data against other sources of data available
  • Scalability, in terms of the size of the area of interest
  • Assessment of the knowledge required for processing the data
Moreover, [40] recognised that collecting socio-economic data can be very expensive and time consuming to monitor the 232 SDG indicators, potentially costing up to $253 billion globally over 15 years. It has been also demonstrated how very high-resolution satellite data can provide a more cost-effective solution than traditional household surveys to track several SDGs mainly in poverty and food security.
Perhaps surprisingly, the cost effectiveness of using EO data to populate specific indicators has rarely been considered although it is often mentioned as a concern and/or a benefit. For example, the UN Global Working Group on Big Data conducted a survey in 2015 enquiring about the strategic vision of National Statistics Officers (NSOs) and their practical experience with Big Data. They found that among the many benefits mentioned of using Big Data, “cost reduction” was recognised by 74% of respondents from non-OECD countries and 61% from OECD countries [37]. In addition, the economic benefits of using EO data have occasionally been given, albeit in a rather broad perspective. For example, according to [38], the economic benefits of using EO data have been estimated by the UK government (for 2020) to be £200 million, including agriculture (£18 million), built environment (£8 million), coastal zones (£1 million), forestry (£22 million) and transport (£86 million). Another example is provided by the UK Rural Payments Agency (RPA). They assessed the benefits of replacing field inspectors with VHR EO data to assess farmers’ yearly claims and estimated that using VHR satellite data saved £2.1 million per year on average.
The outcome from applying the MMF 2.0 in Table 4 is a Maturity Matrix Score (MMS) for each of the SDG indicators. In this, the scores for the two components of A are averaged to derive an overall value for the premise (referred to as A*).
Premise   A   mean   score =   A . 1 . + A . 2 . 2   A
The average Maturity Matrix Score (MMS) is then found for all scores across the premises as follows:
MMS =   P r e m i s e   A + P r e m i s e   B + P r e m i s e   C + P r e m i s e   D + P r e m i s e   E + P r e m i s e   F 6
The arithmetic mean was selected by the authors instead of more complex variants (e.g., the geometric mean) because of its intuitive simplicity. It is acknowledged that it is possible to score a high value for the aggregate MMS for an indicator whilst still having a low value for some of the individual premises. 3.3. MMF 2.0 applied to SDG Indicator 11.1.1.
As an illustration of how the MMF 2.0 is applied, a worked example is given for SDG Indicator 11.1.1 ‘Proportion of urban population living in slums, informal settlements or inadequate housing.’ To estimate this population, UN Habitat, the body responsible for monitoring this indicator, uses several datasets derived from the following five conditions: access to water, access to sanitation facilities, sufficient living area, durable housing and security of tenure [41].
The indicator is measured every 3–5 years as new data become available. However, the required data are often unavailable, outdated, inconsistent or exclude specific areas such as small-settlements. There have been efforts by the research community to use EO-derived data to populate this indicator. Notably, [42] provide an overview of suitable EO-based methods to monitor the dynamics of deprived living condition areas via proxies (roof type, building structure, proximities) and to estimate the population using EO-based maps combined with traditional survey data.
In terms of the process undertaken in selecting the literature for each SDG indicator and the calculation of MMS, a flowchart was used as shown in Scheme 1. As an example, SDG 11.1.1 was firstly scrutinised using the UN metadata repository and this revealed that the indicator is comprised of 5 components as noted above. As a next step, the literature was searched for those peer-reviewed articles and/or reports which provide evidence that the EO could be used to populate the components of the indicator. In this case, the research article [42] was selected among several, as a principal reference for the MMS calculation due to its comprehensive approach. As a last step, we critically reviewed the approach against MMF 2.0, and a listing of metadata was extracted and is presented in Table 5.
Of special relevance here is the spatial and temporal resolution used, the methods of processing EO data and validation and scalability. To allocate an MMS for this indicator, a score from 1 to 5 was assigned for each premise (see Table 6) based upon the judgement of the authors and the information found in [42].
The assessments for the scoring were:
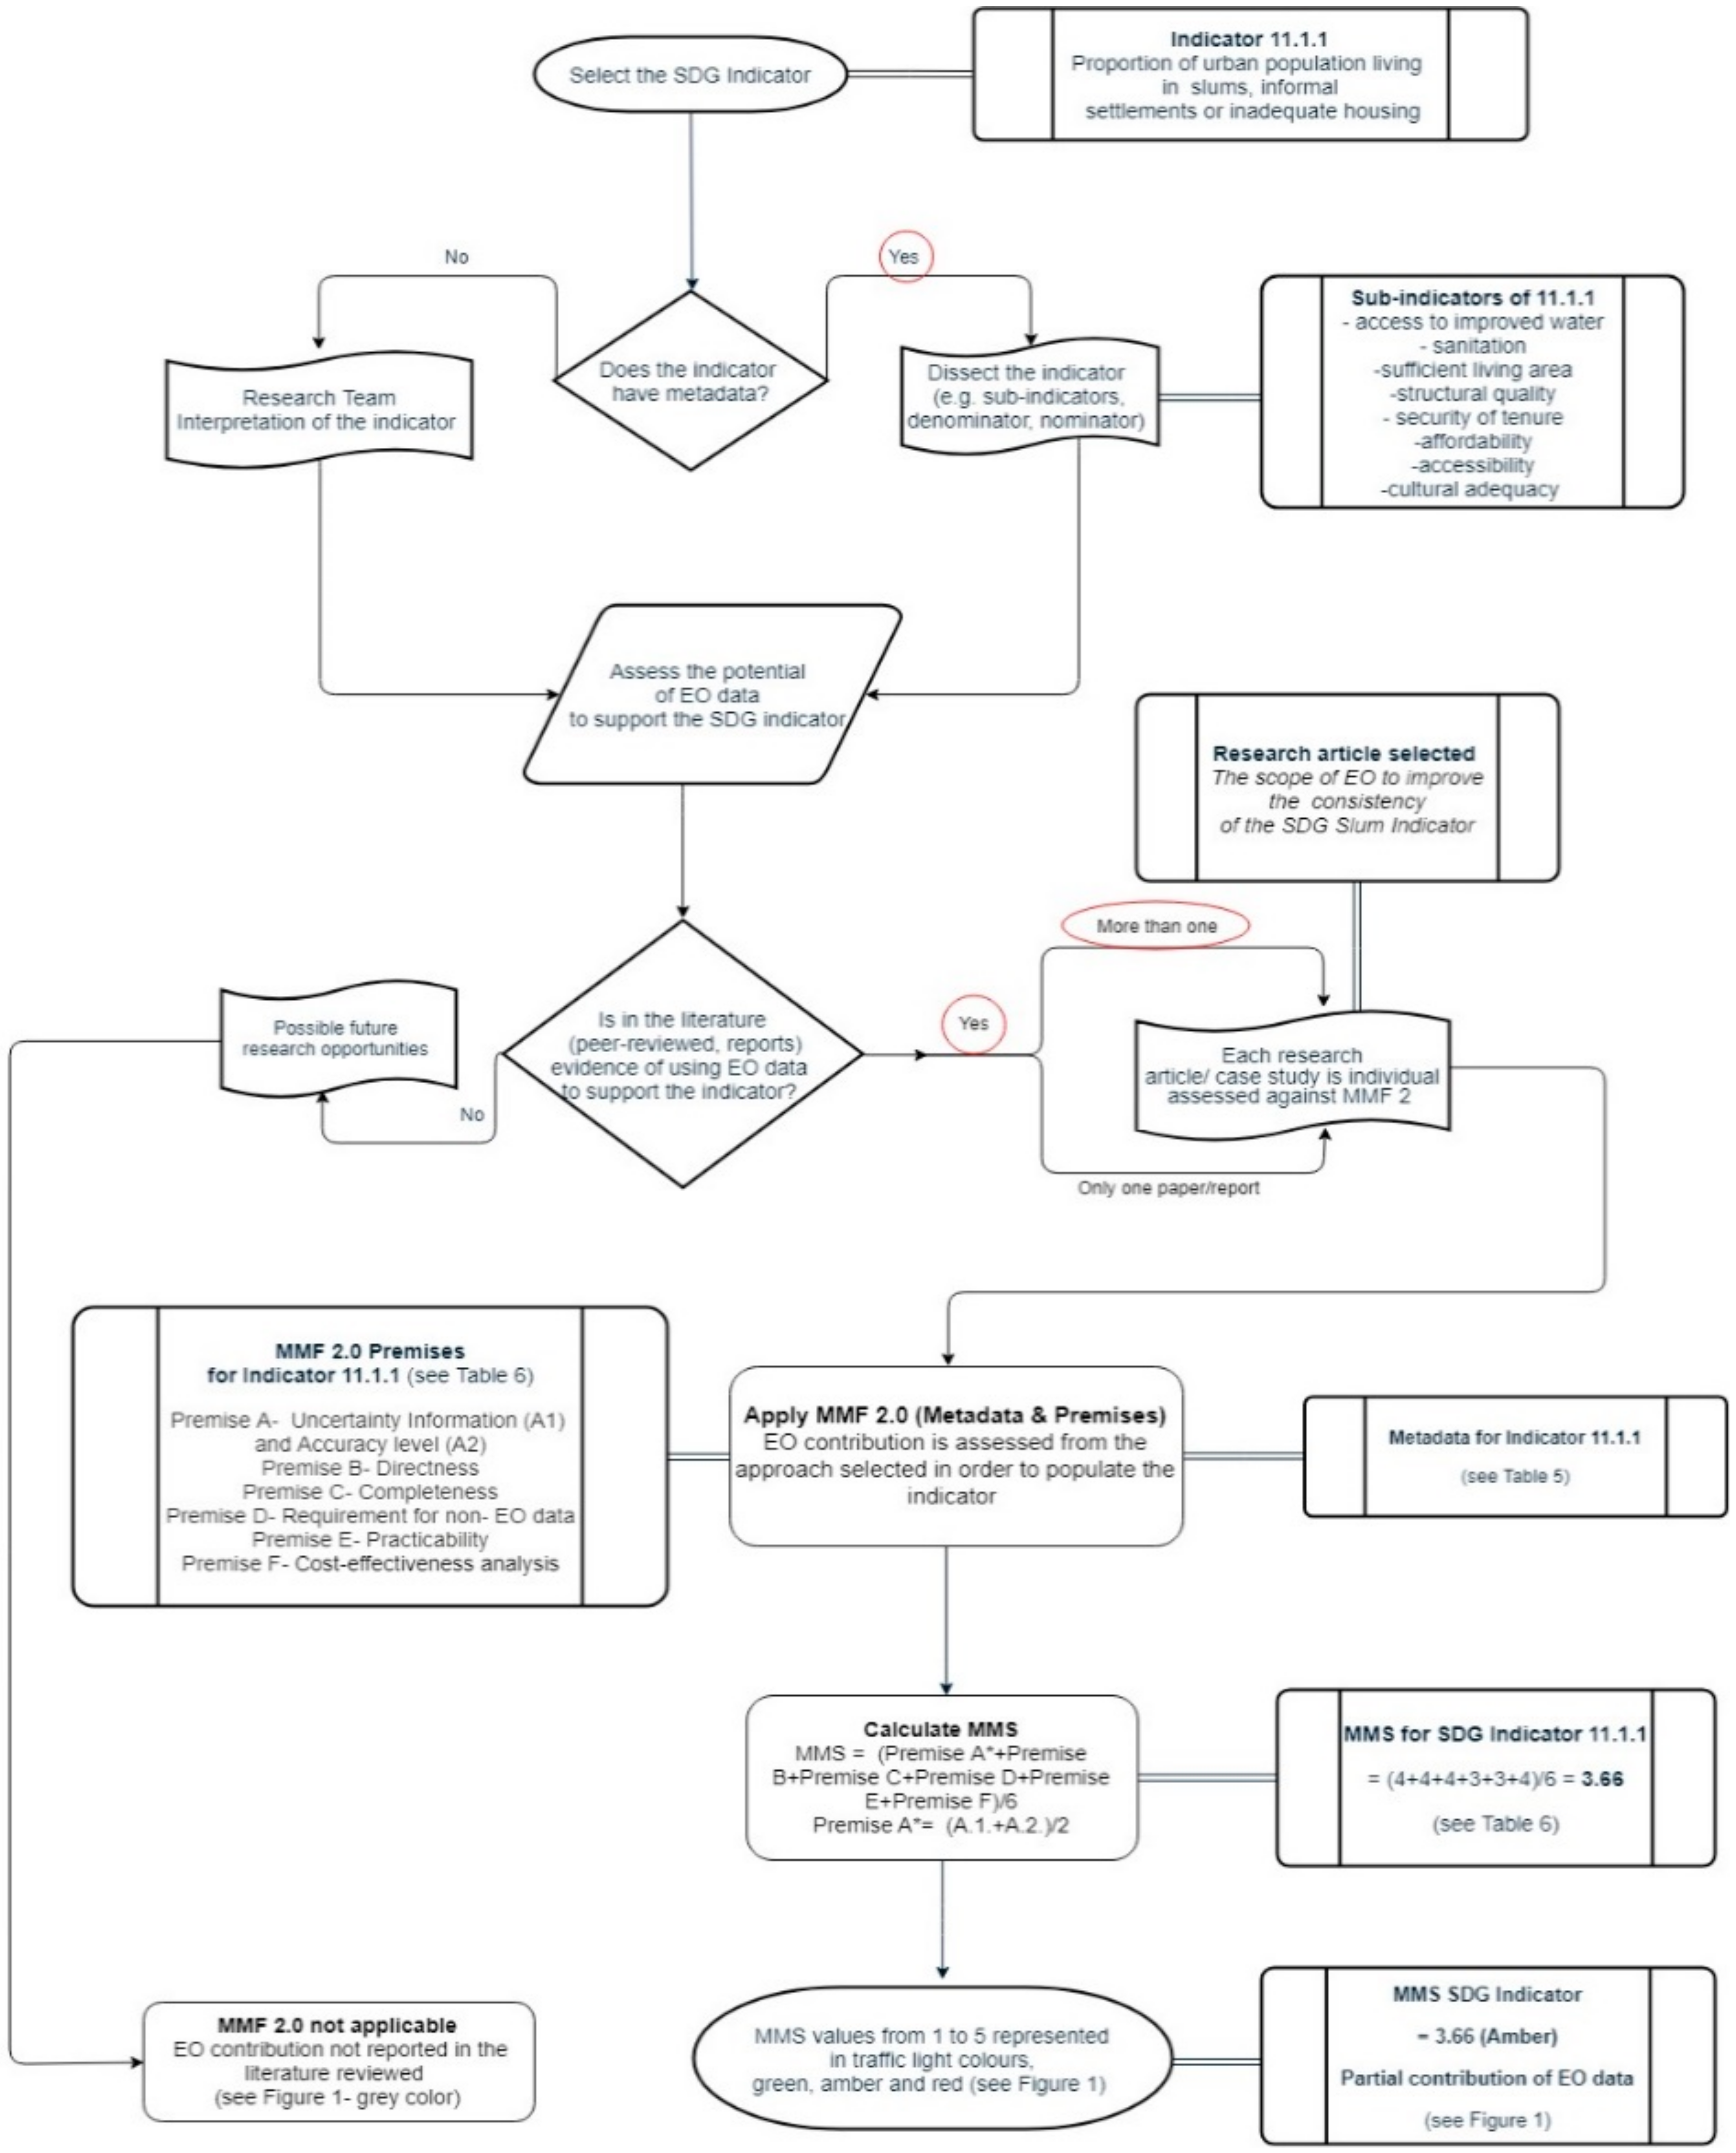
  • Premise A (Uncertainty assessment): A score of 4 was chosen as the published research conducted several accuracy assessments on different methods of processing EO data, referring to the measures which have been proposed in the literature [43]. Therefore, the uncertainty was validated through comparison with a level of accuracy estimated to be between 20% and 50%. The value for Premise A (A*) is given by 4 (A.1) + 4 (A.2) = 8/2 = 4.
  • Premise B (Directness): The reviewed approach maps EO data to the indicator through an indirect observation of proxies (e.g., accessibility to water and sanitation, roof type and material, settlement characteristics, etc.) combined with survey data. Consequently, a score of 4 was assigned.
  • Premise C (Completeness): The indicator metadata repository was consulted to understand the extent to which EO data can be used to populate the indicator. Based on the metadata, the indicator is dissected into inadequate housing and housing affordability, informal settlements and slums. However, these sub-indicators have a series of components, such as access to improved water, sanitation, sufficient living area, structural quality, security of tenure, affordability, accessibility, cultural adequacy. A score of 4 was assigned because most of these components could be assessed by EO data and the reviewed approach provided an outlook on how EO–based mapping could contribute in supporting the SDG 11.1.1.
  • Premise D (Requirement for non-EO information): A value of 3 was allocated as both EO and non-EO data are used and interconnected. Thus, using EO-based maps combined with locally available survey data can estimate the scale of the population living in slums.
  • Premise E (Practicability): A score of 3 (related to TRL 4 and 5) was chosen for the maturity and practicability of the reviewed approach. In terms of practicability of their research, a comprehensive example of upscale mapping to entire cities, and ultimately, to global scale was given in the report. Also presented were several methods of using EO to support SDG 11.1.1 in a clear and advanced manner: however, it was recognised that algorithms such as Convolutional Neural Networks (CNNs) need to be improved in order to be able to process the data at the city-level. Furthermore, the visual image interpretation of slums by local experts could bring disputes, because of the subjectivity in delineation of deprived vs. non-deprived status, thus affecting the mapping results.
  • Premise F (Cost-effectiveness): A score of 4 was given based on the assumption, from the discussion of satellite data prices in [42], that mapping deprived areas at regional and country scale would require the combination of VHR satellite data (e.g., SPOT 5-lower cost) with high resolution free data (e.g., from Sentinel 2) to provide greater cost-efficiency compared with traditional non-EO alternatives. Although the improved cost efficiency depends on the scale of mapping and the satellite company prices. Taking all this into account, a score of 4 was allocated.
Overall, the MMS for this SDG Indicator 11.1.1 is 3.66 (see Table 6).

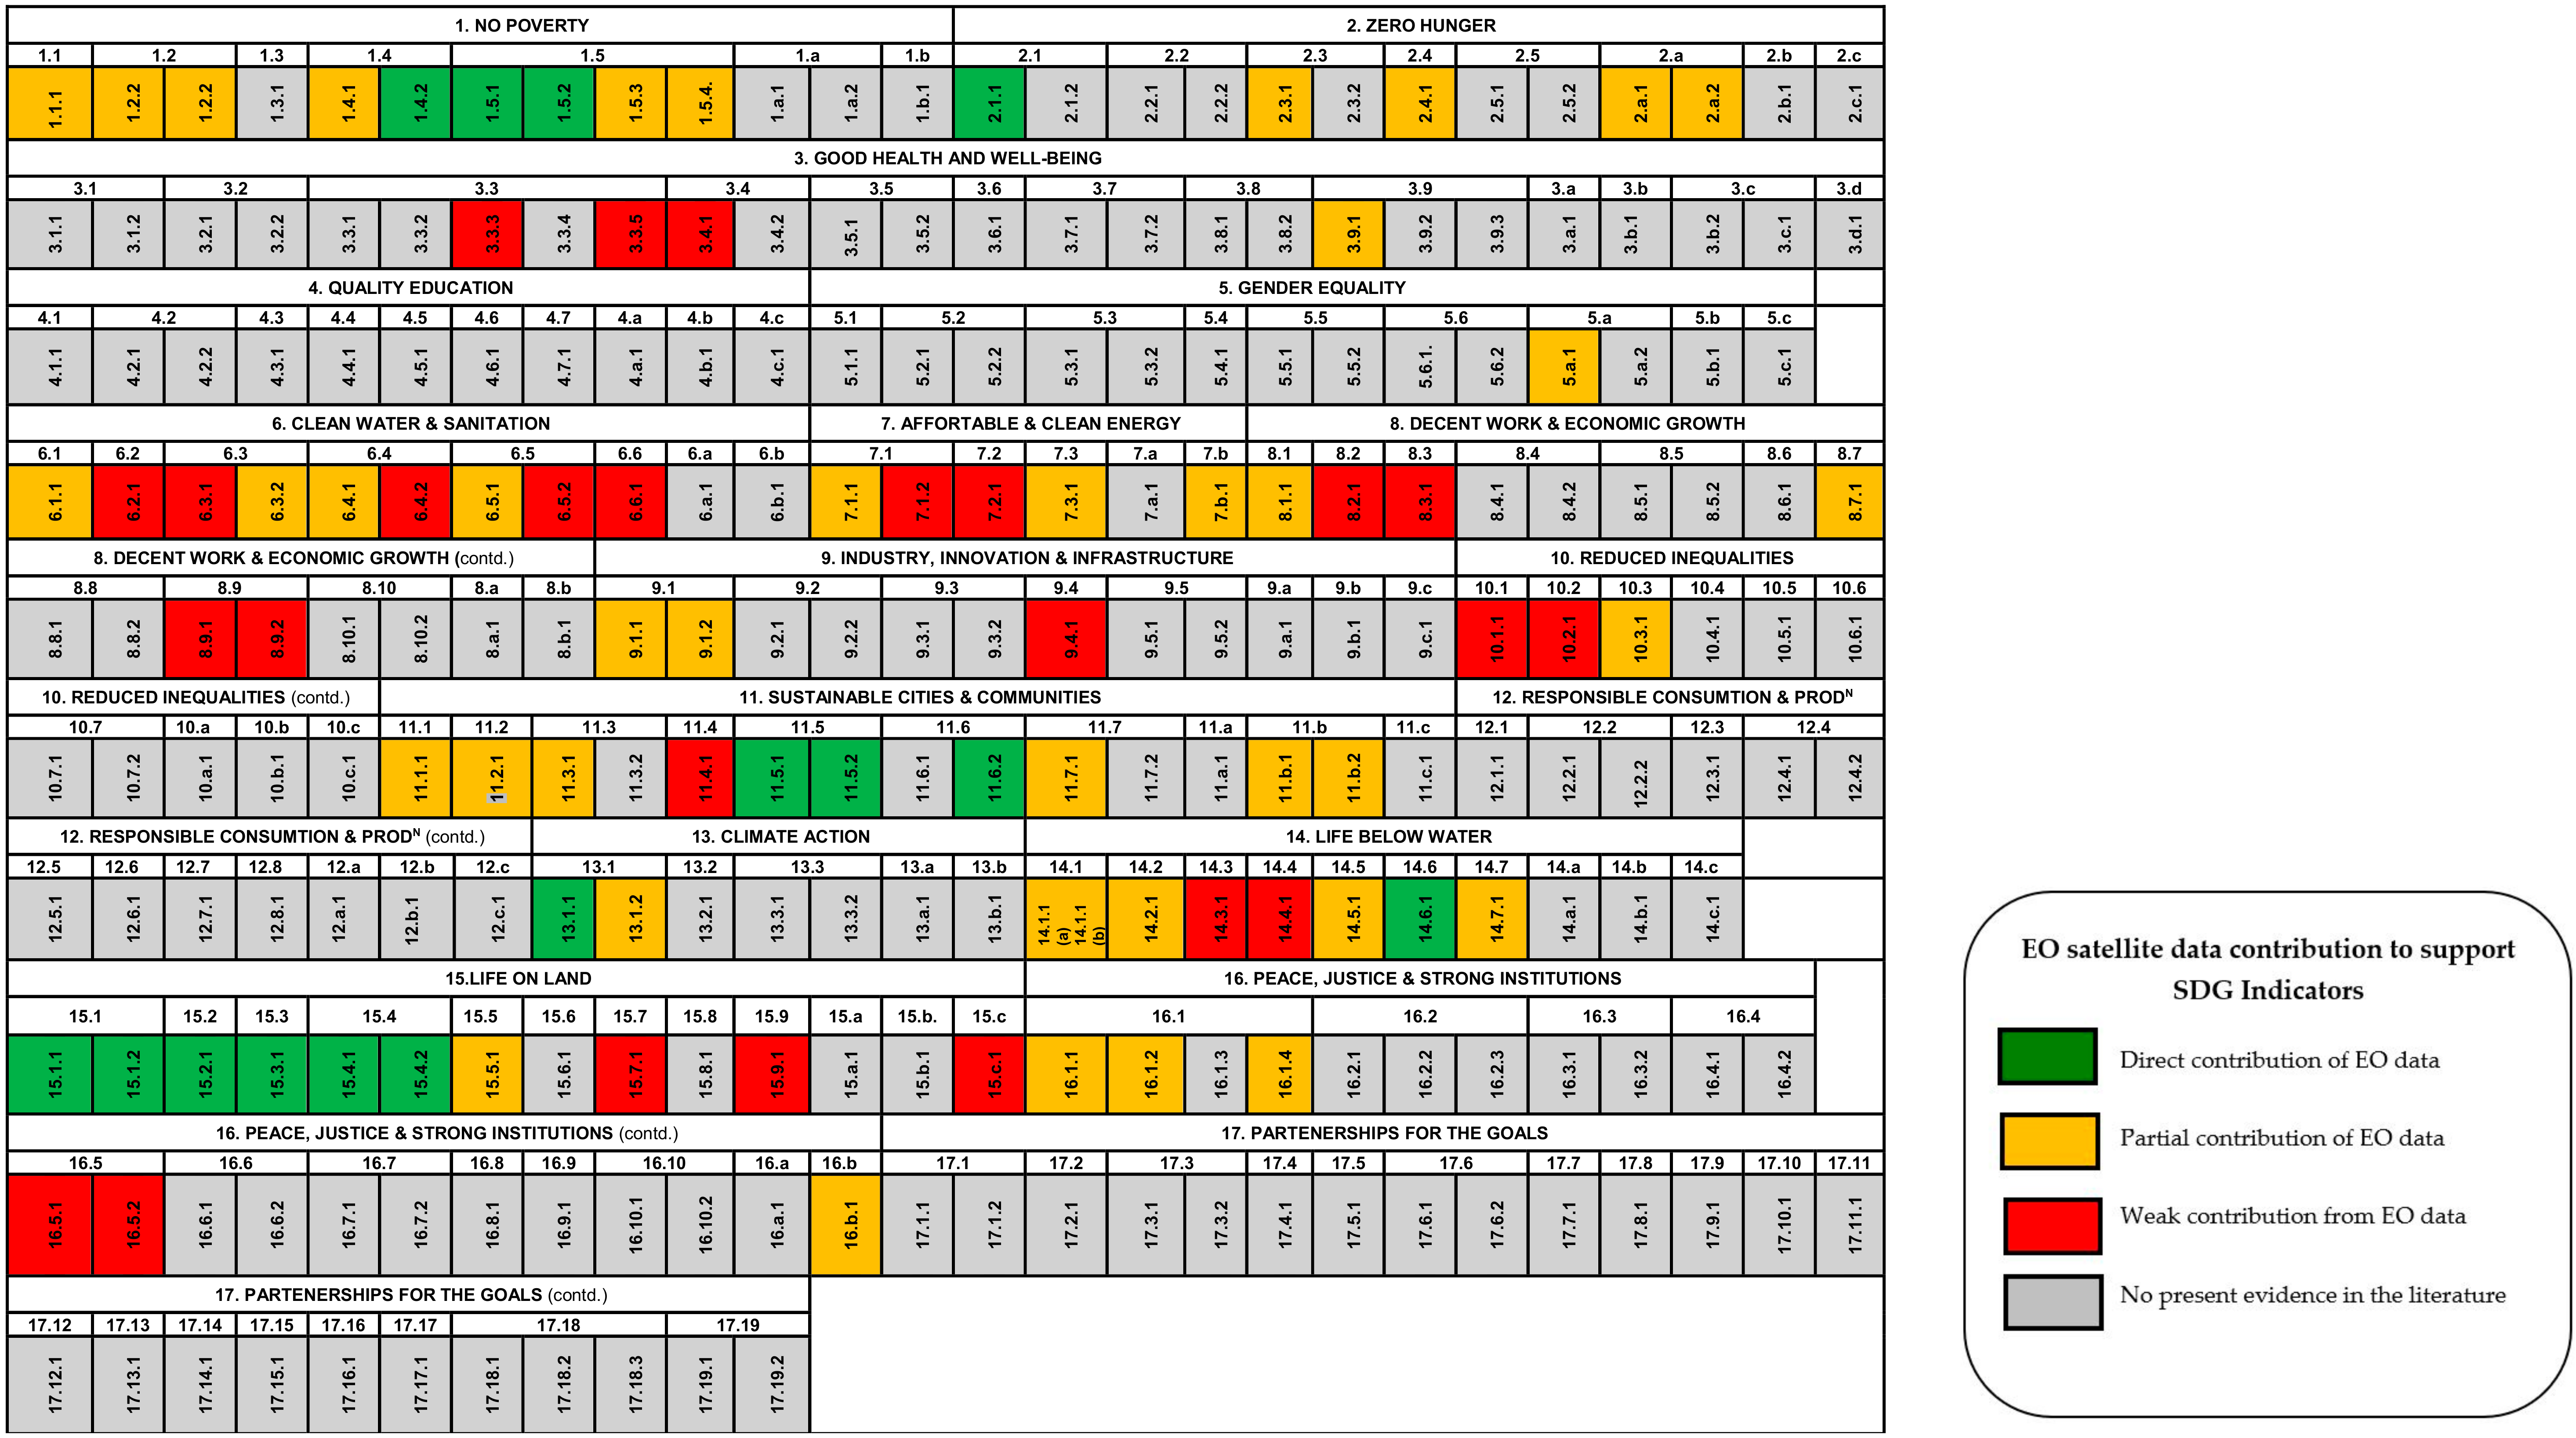
3.3. MMF 2.0 Dashboard for All SDG Indicators

Using the approach outlined in 3.3, the results of applying MMF 2.0 to all 232 indicators within the SDGs are summarised in the dashboard in Figure 1. The output represents the MMS values from 1 to 5 in traffic light colours, green, amber and red. The grey colour was assigned to those SDG Indicators that lacked any reported EO contribution in the literature reviewed.
Figure 1 shows that 80 indicators have enough information to be able to make an analysis using MMF 2.0. Of these 80, 25 in red have MMS values between 1 and 2 meaning that EO can provide, at best, weak support. The 40 amber indicators have MMS values between 2 and 4 indicating that EO data can partially contribute to populating the indicator, and the 15 green indicators have MMS values between 4 and 5 indicating strong support from EO data.
Comparison of the original MMF 1.0 dashboard with the advanced MMF 2.0 dashboard (see Figure S1) reveals only few differences in the numbers of indicators per category of support. However, some important qualitative differences exist in the MMSs between the original MMF 1.0 and the current MMF 2.0 (Table S2). The reasons for these differences are that MMF 2.0 contains new premises such as uncertainty assessment, directness, practicability, cost-effectiveness of analysis, and new publications have been released or found in the literature. Comparison of the dashboards revealed 21 indicators where, due to this evolution of the MMF methodology, the evaluation of the potential of EO-derived date/approaches differed between MMF 1.0 and the more advanced MMF 2.0 dashboards. Full details of these comparisons are presented in the Supplementary Materials (Tables S2 and S3, and Figure S1) [44,45,46].
The dashboard serves as an overview of the EO data contribution based on over 70 publications assessed by the research team. We recognise that there may be existing reports that we are not aware of, or which have been very recently published. Such reports, of course, can be brought into the MMF 2.0 evaluation and the dashboard updated dynamically; it is important therefore to note that the dashboard here represents a current ‘snapshot’.

4. Discussion

This paper has presented an advanced MMF for the evaluation of the contribution that EO can make to providing data and insights to populate the SDG Indicators. It has integrated inputs from experts in EO and sustainable development indicators and is therefore arguably a marked improvement on the original version published in [29]. The inclusion of expert opinion delivers an enhanced degree of robustness to the assumptions (now modified) at the heart of MMF 2.0. It is also noteworthy that all respondents mentioned the usefulness of such a framework for assessing the use of EO-derived data for the SDG indicators, and the value of this for focusing attention on areas with the greatest potential.
Nonetheless, some limitations still exist in the various assumptions that underpin the framework and in the degree of subjectivity in the evaluation of EO potential to support an indicator. There is, of course, some potential for bias in choosing the score and two people using the framework for the same indicator may arrive at different values for the MMS. Indeed, even published material can miss important points (for the MMF) such as an estimate of uncertainty. Also, and as noted above, there is a general lack of reported analysis of cost effectiveness of the use of EO-derived data in most of the peer-reviewed literature and even within many of the technical reports, although the latter are more likely to have such information even if only at broad scales. This is changing, albeit slowly. For example, a recent paper [47], using the example of a set of 330 rural households in western Kenya, suggests that savings in the order of $US 100,000 over a 15-year monitoring period can be achieved by using EO data for some socioecological conditions for the SDGs compared with conventional household survey costs (based on World Bank estimates). Nonetheless, this lack of economic assessment on the use of EO data to populate indicators is clearly revealed by the MMF 2.0 framework and remains a major gap in knowledge that should be addressed with urgency.
Applying the MMF 2.0 to the SDG indicators has raised some intriguing points, especially when compared with the outputs from applying the original form of the MMF. The two MMF dashboards (Figure S1) have some qualitative differences, with indicators changing MMS value (hence colour code). Some quantitative changes in the number of indicators in the various categories were also observed (see Table S2 in Supplementary Materials). The differences between MMF 1.0 and MMF 2.0 (Table S3) [44,45,46] are primarily down to changes in the premises as a result of the expert-input and some additions to the available literature.
The results of applying the systematic approach of MMF 2.0 further confirm that EO satellite data have real value for populating SDG indicators. However, there are still many SDG indicators in Figure 1 that are shaded grey meaning that more information is needed to make an assessment of the value of EO for populating them. These 152 ‘grey’ indicators represent a very substantial and currently untapped opportunity for future research, although it is recognised that a number of these ‘unknowns’ may well be found in the end to be unsuitable for EO approaches for their data provision. It should be noted also that the MMF 2.0 assessment is strictly based upon published evidence, either in journal papers or reports, but rather than wait for that base to become established it is also possible to take a more speculative ‘what if?’ stance and set out some preliminary assessments with regard to what may be possible given the current suite of satellites and those due to be launched in the immediate future.
Following on from the points made above, we can suggest a number of different applications of using the MMF 2.0 framework and recommendations to facilitate this use:
  • Those establishing new EO-derived methodologies can use the MMF 2.0 to self-assess their approach and as a check-list to ensure that they provide all the relevant information in their publications and reports to enable others to assess the fitness-for-purpose of the proposition. The MMF can also be used to identify potential opportunity areas for research and gaps in our understanding of some methodologies. The rigorous framework of MMF 2.0 is therefore beneficial for evaluating the potential utility of such ‘prospective’ applications of EO, from the early stage of their development.
  • For those who are responsible for populating the SDG indicators, the MMF provides a way of quickly assessing the fitness-for-purpose of a methodology and perhaps also as a guide for choosing between methodologies.
  • For the IAEG-SDGs, the framework should help with identifying potential new SDG Indicators, especially within the Driver-Pressure-State-Impact-Response (DPSIR) framework for indicators [48]. Also, many of 152 indicators without evidence from EO data support could be addressed via ‘proxy’ indicators which potentially good support from EO. We believe that the unevenness in distribution of the types of SDG indicators, as seen here in the context of the DPSIR framework, places some restriction on the potential role that EO could play in providing data to support the SDGs [49].
  • Having such a framework and knowing the EO benefits (such as independence, increasing availability, cost) could increase the usage of EO data and eventually, fully or partially substitute for more costly traditional, ground-based data for several indicators.
  • For such an approach to be widely used, it should be easily and openly accessible. The UN SDG indicator metadata repository [34] could be an eventual home for such information, although this would be a significant shift from its current purpose. Further research and development are required to create a fully operationalised and ideally online platform. This would require establishing a platform and framework for supplying evidence, potentially for peer reviewing of that evidence and for presenting summary information and outcomes in a manner that is helpful to users. The European Union’s Copernicus Climate Change Service has been developing a similar concept for the publication of climate data records [50] which includes a framework for presenting fitness-for-purpose of such records, along with peer review of data quality. We suggest that the MMF 2.0 could be developed in a similar manner into an operational tool, recognising that the climate data record framework will have taken approximately a decade from initial concept to implementation.

5. Conclusions

This paper has presented an evolved form of the Maturity Matrix Framework (MMF) based on input from key informants in the EO and sustainable development indicator fields. MMF 2.0 aims to assess the contribution of EO to support SDG indicators.
Their input substantiated our view that the MMF is useful for a variety of users, including those involved in policy and National Statistics agencies. We anticipate that the framework will be used by those charged with recommending a particular method for SDG Indicator analyses, act as a valuable check-list for comparing methodologies and that its use will create more consistency in how such methods are described.
Our review of methodologies published in the peer-reviewed and grey literature, considered 70 papers. Between them, they showed that EO data can:
  • make a major contribution to 15 indicators
  • partially contribute to 40 indicators
  • provide weak support to 25 indicators
  • There was no existing evidence to support EO contribution to 152 indicators.
Some aspects of the MMF 2.0 were relatively straightforward to score from the published literature. However, despite some good examples, there are challenges associated with the use of EO-derived data and questions still remain that need answers. For example, the existing literature provides little information on the economic cost-effectiveness of EO data as well as the uncertainties associated with the methodologies.
Many researchers and organisations advocate the benefits of the synergistic use of EO-derived data, most notably from satellites. These data can be accessible with spatiotemporal consistency and reliability. Thus, planetary changes can be tracked using a variety of different sensors, spatial resolutions and over time scales. However, in-situ measurements and validation points are necessary and can be valuable for specific projects.
Despite their advantages, EO approaches and data are still remarkably under-utilised. The limitations, particularly in many developing countries, include for instance, lack of standardisation of EO data, the need of analysis-ready data, lack of successful case studies to provide proof of concept, insufficiency of collaborative efforts among many countries in addressing similar problems (e.g., workforce, technical training, infrastructure for data management). Therefore, assessment frameworks such as this MMF 2.0 for EO and the SDGs are key to ensuring that EO technology is utilised to its full potential for the benefit of communities across the globe.
Finally, we believe that frameworks such as this MMF 2.0 present insightful, robust, reproducible and transparent ways to provide effective support for the SDGs.

Supplementary Materials

The following are available online at https://www.mdpi.com/2071-1050/11/18/5062/s1, Figure S1: Comparison of MMF 1.0 and MMF 2.0 dashboards, Table S1: Criteria derived from interviews with the respondents (Rs), Table S2: Comparison between MMF 1.0 and MMF 2.0 Dashboards: Numbers of SDG indicators by category of support from EO data, Table S3: Reasons for changes between MMF 1.0 and MMF 2.0 dashboards.

Author Contributions

Conceptualization, A.A., S.M., R.M, E.R.W. and J.L.; methodology, A.A., S.M., R.J.M., E.R.W. and J.L.; software, A.A.; validation, A.A., S.M., R.J.M., E.R.W. and J.L.; formal analysis, A.A., E.R.W.; investigation, A.A.; resources, A.A., S.M., R.J.M., E.R.W. and J.L.; data curation, A.A.; writing—original draft preparation, A.A.; writing—review and editing, A.A., S.M., R.J.M., E.R.W. and J.L., visualization, A.A., E.R.W.; supervision, S.M., R.J.M., E.R.W. and J.L., project administration, S.M.; funding acquisition, S.M., R.J.M., and E.R.W.

Funding

This research was funded by Natural Environment Research Council (NERC) SCENARIO Doctoral Training Partnership, Grant/Award NE/L002566/1, CASE award partner the National Physical Laboratory (NPL) and the APC was funded by the University of Surrey (TBC).

Acknowledgments

This research was supported by the SCENARIO Doctoral Training Partnership of the UK Natural Environment Research Council (NERC) with PhD funding for the first author. We thank the National Physical Laboratory (NPL) for co-funding and supervision support as the CASE award partner for this PhD research. The contribution of all expert interview respondents to the research and the development of MMF 2.0 is gratefully acknowledged.

Conflicts of Interest

The authors declare no conflict of interest. The co-funder had a role in the design of the study, in the collection, analyses and interpretation of data, in the writing of the manuscript, and in the decision to publish the results.

References

  1. United Nations. Transforming our world: The 2030 Agenda for Sustainable Development. Gen. Assem. 70 Sess. 2015, 16301, 1–35. [Google Scholar]
  2. Ziesche, S. Innovative Big Data Approaches for Capturing and Analyzing Data to Monitor and Achieve the SDGs. United Nations-Economic Social Common for Asia Pacific 2017, 137. Available online: https://reliefweb.int/sites/reliefweb.int/files/resources/Innovative%20Big%20Data%20Approaches%20for%20Capturing%20and%20Analyzing%20Data%20to%20Monitor%20and%20Achieve%20the%20SDGs.pdf (accessed on 25 July 2019).
  3. Independent Expert Advisory Group on a Data Revolution for Sustainable Development. A World That Counts: Mobilising the Data Revolution for Sustainable Development. UN Secretariat 2014. Available online: http://www.undatarevolution.org/ (accessed on 25 July 2019).
  4. Woodcock, C.E.; Allen, R.; Anderson, M.; Belward, A.; Bindschadler, R.; Cohen, W.; Gao, F.; Goward, N.S.; Helder, D.; Helmer, E.; et al. Free Access to Landsat Imagery. Science 2008, 320, 1011a. [Google Scholar] [CrossRef] [PubMed]
  5. Harris, R.; Baumann, I. Open data policies and satellite Earth Observation. Space Policy 2015, 32, 44–53. [Google Scholar] [CrossRef]
  6. Sudmanns, M.; Tiede, D.; Lang, S.; Bergstedt, H.; Trost, G.; Augustin, H.; Baraldi, A.; Blaschke, T. Big Earth data: Disruptive changes in Earth observation data management and analysis? Int. J. Digit. Earth 2019, 1–19. [Google Scholar] [CrossRef]
  7. Reyers, B.; Stafford-Smith, M.; Erb, K.H.; Scholes, R.J.; Selomane, O. Essential Variables help to focus Sustainable Development Goals monitoring. Curr. Opin. Environ. Sustain. 2017, 26–27, 97–105. [Google Scholar] [CrossRef]
  8. Lehmann, A.; Nativi, S.; Mazetti, P.; Maso, J.; Serral, I.; Spengler, D.; Niamir, A.; McCallum, I.; Lacroix, P.; Patias, P.; et al. GEOEssential—Mainstreaming workflows from data sources to environment policy indicators with essential variables. Int. J. Digit. Earth 2019, 1–17. [Google Scholar] [CrossRef]
  9. Big Data UN Global Working Group. Available online: https://unstats.un.org/bigdata/taskteams/satellite/ (accessed on 25 July 2019).
  10. Big Data UN Global Working Group. Available online: https://unstats.un.org/unsd/bigdata/taskteams/si-gsd/default.asp (accessed on 25 July 2019).
  11. Anderson, K.; Ryan, B.; Sonntag, W.; Kavvada, A.; Friedl, L. Earth Observation in Service of the 2030 Agenda for Sustainable Development. Geo-Spat. Inf. Sci. 2017, 20, 77–96. [Google Scholar] [CrossRef]
  12. GEO. Earth Observations in Support of the 2030 Agenda for Sustainable Development. Available online: https://www.earthobservations.org/documents/publications/201703_geo_eo_for_2030_agenda.pdf (accessed on 30 August 2019).
  13. European Space Agency (ESA). Satellite Earth Observation in Support of SDG. Available online: http://eohandbook.com/sdg/files/CEOS_EOHB_2018_SDG.pdf (accessed on 25 July 2019).
  14. Dobson, J.E.; Bright, E.A.; Durfee, R.G.; Worley, B.A. LandScan: A global population database for estimating population at risk. Photogramm. Eng. Remote Sens. 2000, 66, 849–857. [Google Scholar]
  15. Sutton, P.; Elvidge, C.; Ghosh, T. Estimation of gross domestic product at sub-national scales using nighttime satellite imagery. Int. J. Ecol. Econ. Stat. 2007, 8, 5–21. [Google Scholar]
  16. Martinez, L.R. How Much Should We Trust the Dictator’s GDP Estimates? SSRN 2017. [Google Scholar] [CrossRef]
  17. Chen, X. Explaining Subnational Infant Mortality and Poverty Rates: What Can We Learn from NightTime Lights? Spat. Demogr. 2015, 3, 27–53. [Google Scholar] [CrossRef]
  18. Bruederle, A.; Hodler, R. Nighttime lights as a proxy for human development at the local level. PLoS ONE 2018, 13, 1–22. [Google Scholar] [CrossRef] [PubMed]
  19. Elvidge, C.D.; Sutton, P.C.; Ghosh, T.; Tuttle, B.T.; Baugh, K.E.; Bhaduri, B.; Budhendra, E. A global poverty map derived from satellite data. Comput. Geosci. 2009, 35, 1652–1660. [Google Scholar] [CrossRef]
  20. Kuffer, M.; Pfeffer, K.; Sliuzas, R.; Taubenbock, H.; Baud, I.; Van Maarseveen, M. Capturing the Urban Divide in Nighttime Light Images from the International Space Station. IEEE J. Sel. Top. Appl. Earth Obs. Remote Sens. 2018, 11, 2578–2586. [Google Scholar] [CrossRef]
  21. Townsend, A.C.; Bruce, D.A. The use of night-time lights satellite imagery as a measure of Australia’s regional electricity consumption and population distribution. Int. J. Remote Sens. 2010, 31, 4459–4480. [Google Scholar] [CrossRef]
  22. Doll, C.N.H.; Pachauri, S. Estimating rural populations without access to electricity in developing countries through night-time light satellite imagery. Energy Policy 2010, 38, 5661–5670. [Google Scholar] [CrossRef]
  23. Zhang, Q.; Seto, K.C. Can night-time light data identify typologies of urbanization? A global assessment of successes and failures. Remote Sens. 2013, 5, 3476–3494. [Google Scholar] [CrossRef]
  24. Georg, I.; Blaschke, T.; Taubenböck, H. A Global Inventory of Urban Corridors Based on Perceptions and Night-Time Light Imagery. ISPRS Int. J. Geo-Inf. 2016, 5, 233. [Google Scholar] [CrossRef]
  25. Sala, E.; Mayorga, J.; Costello, C.; Kroodsma, D.; Palomares, M.L.D.; Pauly, D. The economics of fishing the high seas—Supplementary matterials. Sci. Adv. 2018, 4, 1–14. [Google Scholar] [CrossRef]
  26. Li, X.; Li, D.; Xu, H.; Wu, C. Intercalibration between DMSP/OLS and VIIRS night-time light images to evaluate city light dynamics of Syria’s major human settlement during Syrian Civil War. Int. J. Remote Sens. 2017, 38, 5934–5951. [Google Scholar] [CrossRef]
  27. Hodler, R.; Raschky, P.A. Regional Favoritism. Q. J. Econ. 2014, 129, 995–1033. [Google Scholar] [CrossRef]
  28. Rybnikova, N.A.; Portnov, B.A. Outdoor light and breast cancer incidence: A comparative analysis of DMSP and VIIRS-DNB satellite data. Int. J. Remote Sens. 2017, 38, 5952–5961. [Google Scholar] [CrossRef]
  29. Andries, A.; Morse, S.; Lynch, J.M.; Woolliams, E.R.; Fonweban, J.; Murphy, R.J. Translation of Earth Observation data into sustainable development indicators: An analytical framework. Sustain. Dev. 2018, 27, 366–376. [Google Scholar] [CrossRef]
  30. GeoVille. Available online: https://www.geoville.com/news/detail/view-from-the-sky-the-contribution-of-eo-to-the-sdgs/ (accessed on 25 July 2019).
  31. Bell, S.; Morse, S. Sustainability Indicators Past and Present: What Next? Sustainability 2018, 10, 1688. [Google Scholar] [CrossRef]
  32. May, T. Methods of Social Research. In Social Research: Interviewing: Methods and Process, 4th ed.; Open University Press, McGraw-Hill Education: Maidenhead, UK, 2016; pp. 120–180. [Google Scholar]
  33. Urquhart, C. Building the Theory. In Grounded Theory for Qualitative Research, 1st ed.; SA GE Publications: London, UK, 2013; pp. 78–105. [Google Scholar]
  34. SDG Indicators. Metadata Repository. Available online: https://unstats.un.org/sdgs/metadata/ (accessed on 25 July 2019).
  35. Steele, J.E.; Sundsoy, P.R.; Pezzulo, C. Mapping poverty using mobile phone and satellite data. J. R. Soc. Interface 2017, 14. [Google Scholar] [CrossRef]
  36. Mankins, J.C. Technology readiness levels. Res. Technol. Manag. 1995, 53, 1–5. [Google Scholar]
  37. United Nations. Earth Observations for Official Statistics: Satellite Imagery and Geospatial Data Task. 2017. Available online: https://unstats.un.org/bigdata/taskteams/satellite/UNGWG_Satellite_Task_Team_Report_WhiteCover.pdf (accessed on 25 July 2019).
  38. Sadlier, G.; Flytkjær, R.; Sabri, F.; Robin, N. Value of Satellite-Derived Earth Observation Capabilities to the UK Government Today and by 2020. 2019. Available online: https://londoneconomics.co.uk/wp-content/uploads/2018/07/LE-IUK-Value-of-EO-to-UK-Government-FINAL-forWeb.pdf (accessed on 25 July 2019).
  39. Tam, S.M.; Clarke, F. Big Data, Statistical Inference and Official Statistics. Int. Stat. Rev. 2015, 83, 436–448. [Google Scholar] [CrossRef]
  40. Jerven, M. Benefits and Costs of the Data for Development Targets for the Post 2015 Development Agenda. 2014. Available online: https://www.copenhagenconsensus.com/sites/default/files/data_assessment_-_jerven.pdf (accessed on 25 July 2019).
  41. SDG Indicator 11.1.1 Metadata. Available online: https://unstats.un.org/sdgs/metadata/files/Metadata-11-01-01.pdf (accessed on 25 July 2019).
  42. Kuffer, M.; Wang, J.; Nagenborg, M.; Pfeffer, K.; Kohli, D.; Sliuzas, R.; Persello, C. The Scope of Earth-Observation to Improve the Consistency of the SDG Slum Indicator. ISPRS Int. J. Geo-Inf. 2018, 7, 428. [Google Scholar] [CrossRef]
  43. Kohli, D.; Stein, A.; Sliuzas, R. Uncertainty analysis for image interpretations of urban slums. Comput. Environ. Urban Syst. 2016, 60, 37–49. [Google Scholar] [CrossRef]
  44. Global Fishing Watch. Available online: https://globalfishingwatch.org/vessel-tracking-data/ (accessed on 25 July 2019).
  45. Straka, W.C.; Seaman, C.J.; Baugh, K.; Cole, K.; Stevens, E.; Miller, S.D. Utilization of the Suomi national polar-orbiting partnership (SNPP) visible infrared imaging radiometer suite (VIIRS) day/night band for arctic ship tracking and fisheries management. Remote Sens. 2015, 7, 971–989. [Google Scholar] [CrossRef]
  46. Supporting the Calculation of SDG Indicators Using GEO and EO Data at the German Federal Agency of Cartography and Geodesy. Available online: https://meetingorganizer.copernicus.org/EGU2019/EGU2019-15847.pdf (accessed on 25 July 2019).
  47. Watmough, G.R.; Marcinko, C.L.J.; Sullivan, C.; Tschirhart, K.; Mutuo, P.K.; Palm, C.A.; Svenning, J.C. Socioecologically informed use of remote sensing data to predict rural household poverty. Proc. Natl. Acad. Sci. USA 2019, 116, 1213–1218. [Google Scholar] [CrossRef] [PubMed] [Green Version]
  48. European Environment Agency (EEA). Environmental Indicators: Typology and Overview. 1999. Available online: https://www.eea.europa.eu/publications/TEC25 (accessed on 18 July 2019).
  49. Andries, A.; Morse, S.; Lynch, J.M.; Woolliams, E.R.; Fonweban, J.; Murphy, R.J. Translation of Earth Observation data into sustainable development indicators: An analytical framework. In Proceedings of the 24th International Sustainable Development Research Society Conference—Actions for a Sustainable World: From Theory to Practice, Messina, Italy, 13–15 June 2018; Available online: https://isdrs2018.exordo.com/files/papers/70/initial_draft/1c_Andries_Paper_Final_paper.pdf (accessed on 25 July 2019).
  50. Nightingale, J.; Boersma, K.F.; Muller, J.P.; Compernolle, S.; Lambert, J.C.; Blessing, S.; Giering, R.; Gobron, N.; De Smedt, I.; Coheur, P.; et al. Quality Assurance Framework Development Based on Six New ECV Data Products to Enhance User Confidence for Climate Applications. Remote Sens. 2018, 10, 1254. [Google Scholar] [CrossRef]
Scheme 1. Flow chart for the process of assessing the potential of EO data to populate the SDG indicators: Example for Indicator 11.1.1.
Sustainability 11 05062 sch001
Figure 1. MMF 2.0 Dashboard: evaluation of degree of EO support for all SDG indicators.
Sustainability 11 05062 g001
Table 1. Number of participants interviewed by sector and institution.
SectorInstitution NameNumber of Respondents
AcademiaUniversity of Surrey, UK2
University of Leicester, UK2
The Open University, UK1
University of Edinburgh, UK1
University of Cranfield, UK1
University of Denver, USA2
Colombia University, USA1
University of Twente, Netherlands1
University of Malta, Malta1
Central European University, Hungary1
Linnaeus University. Sweden1
Charles University, Czechia1
ConsultancyUN Environment World Conservation Monitoring Centre (UNEP-WCMC), UK2
Satellite Applications Catapult, UK1
Spottitt Ltd., UK1
Ecometrica, UK1
Rezatec, UK1
Cizoti Nigeria Limited, Nigeria2
(Inter)/Governmental OrganisationGroup on Earth Observation, Switzerland1
Finnish Environment Institute1
Statistics Finland2
Research CentreAidData- part of William and Mary, USA2
Plymouth Marine Laboratory, UK1
Yale Center for Environmental Law and Policy, USA1
Global Footprint Network, USA1
Center for Environmental and Sustainability Research, Italy2
Joint Research Centre European Commission, Portugal1
Institut pour un Développement Durable, Belgium1
International Environment Forum, Switzerland1
National Space Research and Development Agency (NASRDA), Nigeria1
Table 2. Questionnaire design.
SectionDescription
Section 1. IntroductionExplanatory introduction giving the purpose of the study and describing data protection.
Section 2. Participant contact detailsContact details of the respondent.
Section 3. Sustainable Development Goals (SDGs)Questions on the participant’s familiarity with an impression of SDGs.
Section 4. Earth observation (EO) data in support of SDG indicatorsDetailed questions on the participant’s work projects using EO data to support SDG indicators. Also, what barriers have they faced regarding EO data availability and processing during these processes.
Section 5. Maturity Matrix Framework (MMF)Questions about our MMF to validate assumptions made in the design of the MMF.Also, questions about the value of information in publications (articles and grey literature) to evaluate the fitness-for-purpose of a technique.
Section 6. Proxy indicatorsQuestions about the role of proxy indicators, which may be more easily determined from EO data, in quantifying SDG indicators.
Section 7. RoundupAny other comments by the respondent.
Table 3. MMF 2.0 Metadata.
MMF 2.0-METADATA
ScrutiniseCriteriaDescription
SDG IndicatorType of indicatorQualitative/Quantitative
Indicator number1.1.1–17.19.2
Drivers, Pressures, State, Impact, Response (DPSIR) FrameworkDriver/ Pressure/ State/ Impact/ Response
Tier NumberTIER-I/II/III
Interactions with other indicators1.1.1–17.19.2
Publication reviewedPublication name
Type of publicationGovernment report, technical report, peer-reviewed research article, etc
Year of publicationYear
LanguagesEnglish/French/Spanish etc.
Spatial resolutionLow resolution > 1 km
Medium resolution 100 m–1 km
High Resolution 5–100 m
Very High Resolution < 5 m
Type of sensorOptical
Radar
Temporal resolution1 day
2–6 days
>7 days
Methods of processing EO satellite dataPhysical models
Predictive Models
Supervised/Unsupervised Classification
Image Segmentation-Object Based Classification
Visual interpretations methods combined with geospatial data
Validatione.g., In situ, Very High Resolution (VHR)
ScalabilityLocal-Urban/ rural
County level
National
Regional
Global
Table 4. MMF 2.0 Premises.
MMF2.0 PREMISES
A. Uncertainty AssessmentB. DirectnessC. CompletenessD. Requirement for Non-EO InformationE. PracticabilityF. Cost-Effectiveness Analysis
ScoreA.1. Uncertainty InformationA.2. Accuracy Level
1No uncertainty information providedLevel of accuracy not determinedEO does not support indicatorEO does not support indicatorIndicator measured by non-EO dataBasic approach formulated for an application (discovery) (TRL 1 and 2)Non-EO data sources are likely to be more cost effective
2Uncertainty estimated, no evidence, no validationUncertainties
>80%
EO provide information towards proxy indicator/indirect approachEO supports minor part of indicatorEO data supplements primary analysis based on non-EO dataProof of Approach/Concept towards initial integration and verification (TRL 3 and 4)Non-EO data are probably more cost effective but EO data show some potential
3Uncertainty evaluated with evidence/ validationUncertainties
50–80%
EO measures a proxy indicatorEO supports moderate part of indicatorEO and non-EO are interconnected/interdependentAddress development, testing, and validation—Approach validated in situ (TRL 4 and 5)EO and non-EO data are similar cost
4Uncertainties validated through comparisonUncertainties
20–50%
EO measures high quality proxy indicatorEO supports main part of indicatorEO data used directly; non-EO used for modelling/prediction (e.g., Deep Convolutional Neural Network)Actual approach validated and successfully passed; (TRL 5 and 6)EO data are likely to be more affordable than non-EO data
5Uncertainties independently validatedUncertainties
<20%
EO can directly measure the indicatorEO supports complete indicatorEO data used directly; limited non-EO data requirement for validationIntegration of the approach into an end-user’s decision-making activity (TRL 7–9)A cost effectiveness analysis has been carried out and EO data is the most advantageous
Table 5. MMF 2.0 Metadata for Indicator 11.1.1.
ScrutiniseCriteriaDescription
SDG IndicatorType of Indicator11.1.1-Proportion of urban population living in slums, informal settlements or inadequate housing
Indicator Numberquantitative
DPSIR FrameworkState indicator
TIER NumberI
Interactions with Other Indicators1.2.1 and 1.3.1
Publication ReviewedPublication NameThe scope of EO to improve the consistency of the SDG Slum Indicator [42]
Type of PublicationPeer- reviewed research article
Year of Publication2018
LanguagesEnglish
Spatial ResolutionUnmanned Aerial Vehicle (UAV) (3–4 cm); VHR-World View 3-up to 30 cm; Google Earth (30 m); SPOT 5 (up to 5 m); Sentinel 2 (10 m); TerraSAR X (vary)
Type of Sensoroptical and radar
Temporal ResolutionVary (up to several days)
Methods of Processing EO Satellite DataMachine learning; Object-Based Image Analysis (OBIA); image texture analysis; visual interpretation
ValidationBy VHR data
ScalabilityLocal, albeit can be upscale to global with some degree of uncertainty and cost
Table 6. MMF 2.0 Premises for Indicator 11.1.
PremiseScore
Uncertainty Assessment-Uncertainty Information (A1) and Accuracy level (A2)4—Uncertainties validated through comparison
4—Uncertainties 20–50%
Directness4—EO measures high quality proxy indicator
Completeness4—EO supports main part of indicator
Requirement for non-EO information3—EO and non-EO are interconnected/interdependent
Practicability3—Address development, testing, and validation-Approach validated in situ (TRL 4 and 5)
F Cost-effectiveness analysis4—EO data are likely to be more affordable than non- EO data
Therefore, for Premise A score = 4 + 4 = 8/2 = 4
Overall MMS = (4 + 4 + 4 + 3 + 3 + 4)/6 = 3.66

