Comparing Technology Acceptance for Autonomous Vehicles, Battery Electric Vehicles, and Car Sharing—A Study across Europe, China, and North America


Urstein Süd 1, Salzburg University of Applied Sciences, Puch/Salzburg 5412, Austria
Sustainability 2019, 11(16), 4333; https://doi.org/10.3390/su11164333
Submission received: 5 July 2019
/
Revised: 29 July 2019
/
Accepted: 5 August 2019
/
Published: 10 August 2019
(This article belongs to the Special Issue Consumer Preferences for Alternative Fuels, Automation, and Shared Mobility in Transportation)
Abstract
:The automotive industry today faces three major transitions: the emergence of autonomous driving, electric powertrain replacing the internal combustion engine, and changes in possession of automobiles, e.g., increased usage of car sharing. As all three transitions are fostered by technologies that drive digital transformation of automobiles, the Technology Acceptance Model (TAM) by Davis represents the underlying research model of this paper. Hypotheses are developed and tested for a sample of 1177 participants using Partial Least Squares Structural Equation Modeling (PLS-SEM). Group differences are investigated for three markets: Europe, North America, and China. The paper confirms the underlying assumptions of the Technology Acceptance Model in the context of automobiles. Further, it illustrates influential societal norms and individual experiences for technology acceptance. In addition, compound effects for technology acceptance are found, e.g., the perceived enjoyment of electric driving affects the acceptance of autonomous driving and car possession behavior. The novel approach to integrate three different technologies within the Technology Acceptance Model requires unifying items to a level which makes them comparable, limiting the results for each individual technology. For practice, automotive manufacturers obtain advice on how to foster technology acceptance. For society, the paper uncovers the role of societal norms for technology acceptance in the context of automobiles. Policy makers can obtain insights on how to successfully increase technology acceptance, e.g., for environmental purposes. Conclusively, the paper applies the Technology Acceptance Model for three developments in the context of automobiles, thereby extending current research using the Technology Acceptance Model.
1. Introduction
Ever since the development of the first automobile, automotive technologies have been subject to substantial technological progress. A multitude of technologies has been introduced in the technological history of the automobile, that had to be introduced and accepted by the customers [1,2,3,4,5].
Automobiles have taken a central role in the majority of societies worldwide, providing, above mobility, a certain level of freedom, while often serving as a status symbol. Despite the popularity of automobiles, they represent a major cause of ecological and social concerns [2,3]. Therefore, sustainable mobility solutions are required for, e.g., reducing accidents, environmental impact, road congestion, or parking space required [4,5].
Since the demand for automobiles is predicted to continue in industrialized nations and expand in emerging markets, more efficient and more sustainable automobile solutions are increasingly encouraged by regulatory policies worldwide [6,7]. The policies and resulting dynamics lead to a paradigm shift in the automotive industry, including, e.g., autonomous vehicles (AV), battery electric vehicles (BEV) and car sharing (CS). However, despite the availability of an increasing range of Autonomous Vehicles, Battery-electric Vehicles, and Car Sharing solutions, automobiles that are fully controlled by a driver, powered by fossil fuels, and privately owned are still dominating streetscapes worldwide [8,9,10,11,12]. So far, market shares of Battery-electric Vehicles are still marginal with the exception of lead markets such as Norway or city centers [13,14,15].
The current technological developments in the automotive industry are particularly relevant for traditional incumbent manufacturers who are facing an increasingly competitive market: New automotive manufacturers, such as Tesla and Build Your Dreams, technology companies like Google and Apple, and mobility service providers, such as Zipcar, enter the industry [10,12,16,17]. These new entrants, as well as established car manufacturers, are increasingly placing the development and marketing of Autonomous Vehicles, Battery-electric Vehicles, and Car Sharing at the heart of their corporate strategy, despite facing little acceptance by many customers [13,15,16,17,18,19,20,21]. Therefore, it is paramount to understand what factors determine the consumer acceptance of the three technologies, and to what extent differences exist between markets worldwide. In return, this allows to develop vehicles and market strategies that may encourage a wider customer acceptance of the technologies [2,3,4,5,8,22].
In current literature, several studies investigate factors that determine adoption of Battery-electric Vehicles, e.g., Junquera et al. [13], Moons and de Pelsmacker [18], Plötz et al. [19], and Schuitema et al. [15], or Payre et al. [20], as well as Haboucha et al. [21] in the case of Autonomous Vehicles. However, a holistic understanding, comparing several technologies that are relevant for automobiles in the future, cannot be found in extant literature.
In the case of Car Sharing, although it does not represent a technology as such, it is mainly technology-enabled through digital technologies, e.g., social media or apps on mobile devices. The further unfolding of Car Sharing can therefore be traced to the emergence of these technologies [4,10].
For comparing Autonomous Vehicles, Battery-electric Vehicles, and Car Sharing in a common research design, two reasons can be stated: First, to establish a comparison of all three technologies and their acceptance factors. Second, all three technologies might influence each other: If a car is no longer powered by an internal combustion engine, potentially reducing the perceived enjoyment of car driving as a Battery-electric Vehicles, customers might be more willing to accept autonomous driving or even are less eager to own the car themselves [3,8].
As a methodological framework, the Technology Acceptance Model (TAM) by Davis [1] was chosen and extended by established influential factors in TAM research. Further, the study aims for establishing a cross-cultural comparison, as cultural or market-related differences represent a major influence on technology adoption factors [22,23]. In summary, the present paper addresses the following research question:
- What are factors for technology adoption regarding Autonomous Vehicles (AV), Battery electric vehicles (BEV), and Car Sharing (CS), differentiated in an international comparison?
To answer this research question, an international sample of 1177 respondents was chosen, mainly comparing the three markets of Europe, China, and North America. Twelve hypotheses are tested. In addition to the established variables of the TAM, the paper places special emphasis on the environmental attitudes and the willingness to protect those of the respondents. Further, the paper testes the influence of their personal openness to new innovations.
Out of the twelve hypotheses developed, only one hypothesis is not confirmed for any technology or region: The influence of environmental protection on the objective usability of a technology. Further, the paper uncovers several technology-specific or region-specific differences. For instance, the paper finds that one’s motivation towards environmental protection has a positive influence on the perceived enjoyment of a Battery-electric Vehicles and Car Sharing in Europe and North America, but not for Autonomous Vehicles. In China, this positive influence in significantly lower in the case of Car Sharing and even not significant for Battery-electric Vehicles.
2. Hypothesis Development
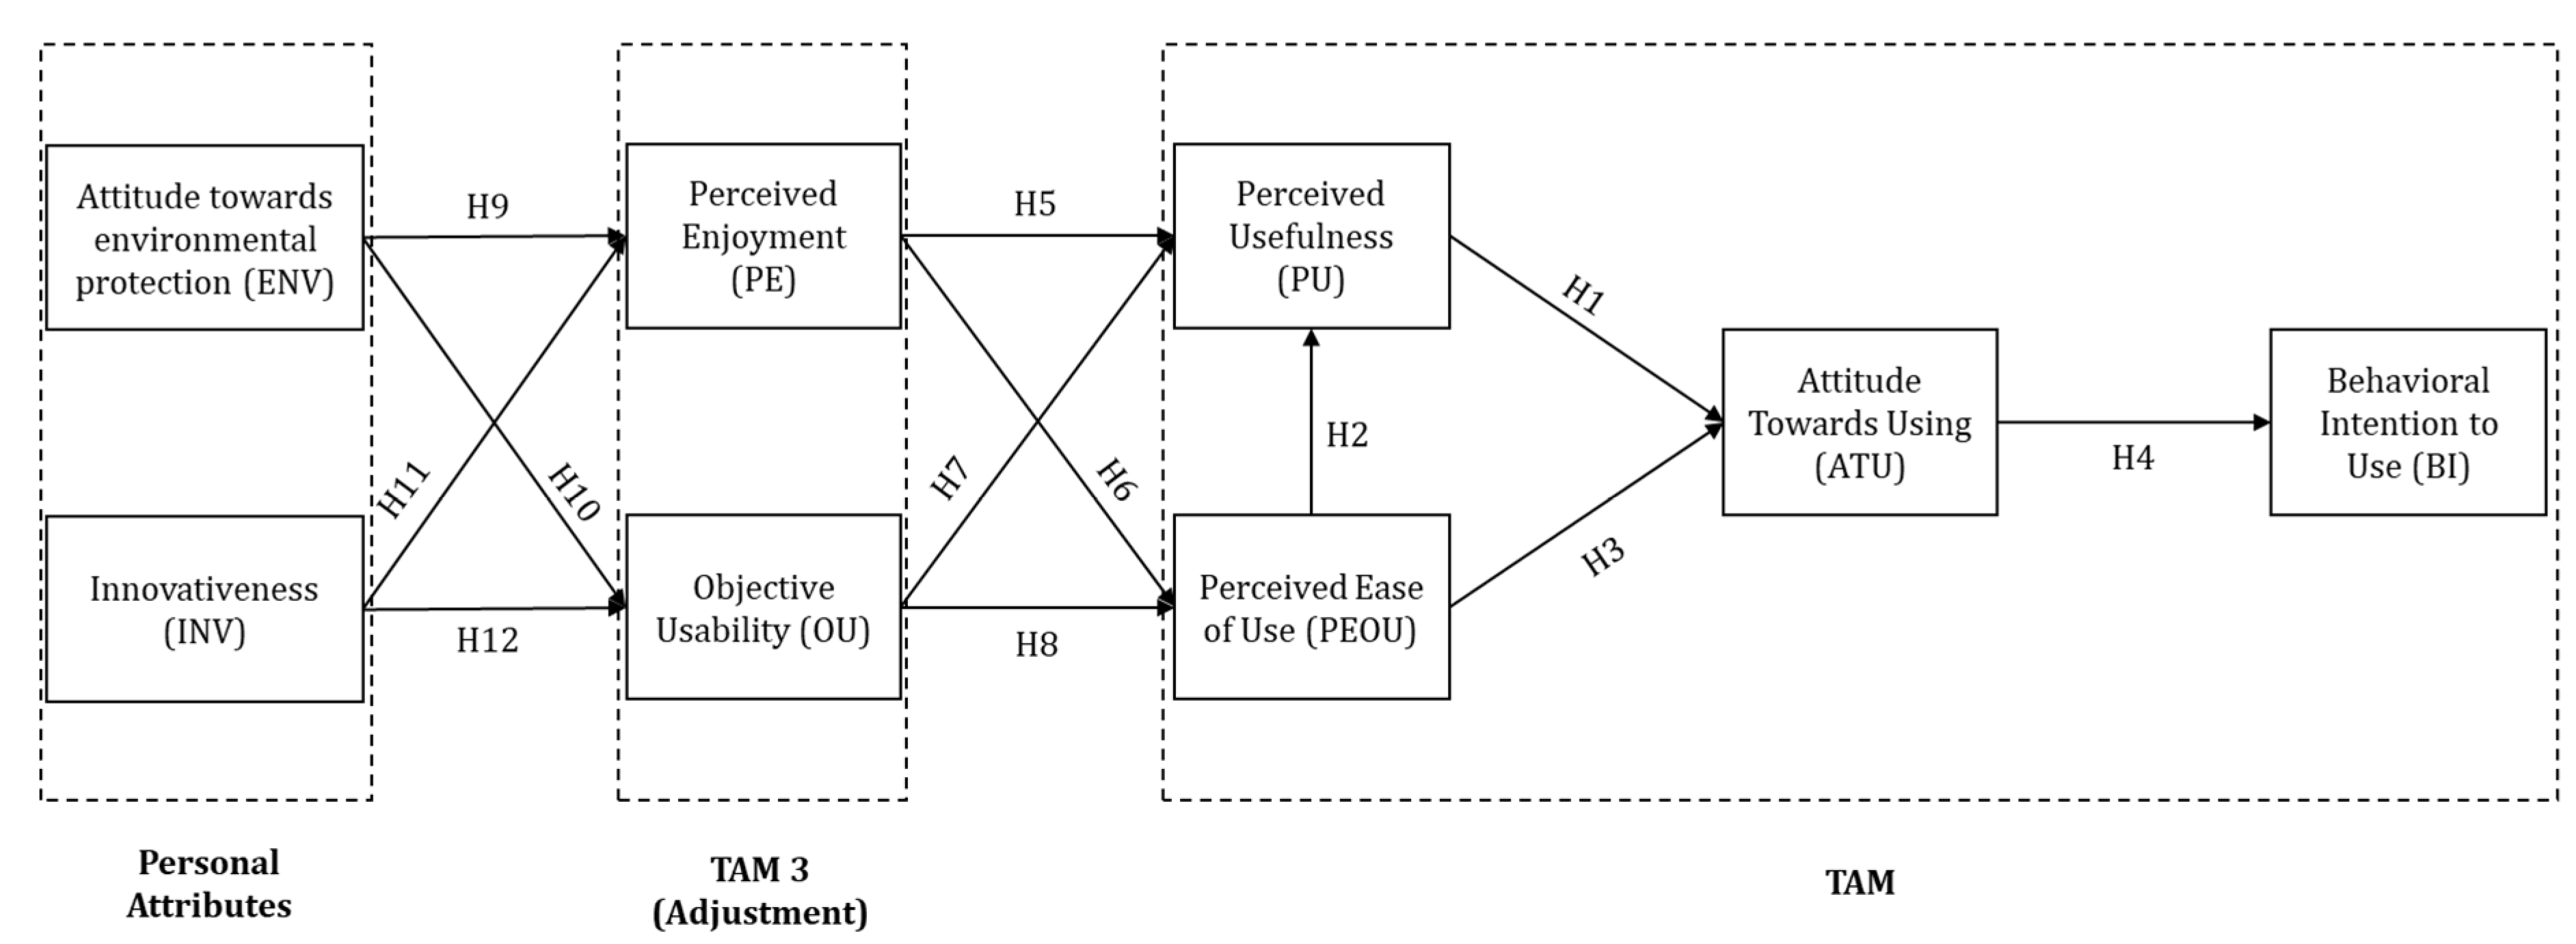
The research model and the hypotheses developed are based on the original TAM by Davis [1] (H1 to H4), its extension TAM 3 by Venkatesh and Bala [24] (H5 to H8), and personal values and attributes related to environmental protection and innovativeness (H9 to H12). Figure 1 subsumes the research model and hypothesis developed, which are further described below.
The original TAM developed by Davis [1] and the later versions of the framework highlight the central roles of the Perceived Usefulness (PU) and the Perceived Ease of Use (PEOU) of a technology as predictors of an individual’s Attitude Towards Using (ATU) and Behavioral Intention to use (BI) a technology. This model builds on the Theory of Planned Behavior and the Theory of Reasoned Action [23,24,25]. The general underlying relationships within the TAM have been confirmed for a multitude of technologies [26].
Previous research in the context of automobiles, such as Hengstler et al. [27], Hidrue et al. [28], or Jiang [29], confirm the central role of those core factors for technology adoption in the context of automobiles. Thus, the following hypotheses are suggested:
Hypothesis 1 (H1).
The Perceived Usefulness of the technology has a positive influence on the Attitude Towards Using.
Hypothesis 2 (H2).
The Perceived Ease of Use of the technology has a positive influence on its Perceived Usefulness.
Hypothesis 3 (H3).
The Perceived Ease of Use of the technology has a positive influence on the Attitude Towards Using.
Hypothesis 4 (H4).
The Attitude Towards Using of the technology has a positive influence on the Behavioral Intention to Use.
In the TAM3, an extension of the original TAM by Venkatesh and Bala [24], the Perceived Enjoyment (PE) of a technology has been found to influence the Perceived Ease of Use of a technology. Further studies have found evidence that the factor also impacts the Perceived Usefulness of a technology. Even pro-environmental and innovative users have been found to consider both the environmental impacts of their consumption and the enjoyment of technologies [24,30,31,32].
Empirical evidence for the positive relationship of Perceived Enjoyment of a technology on consumer acceptance has been found in the context of Battery-electric Vehicles and for eco-innovations in general [15,33]. Similarly, future users of Autonomous Vehicles may perceive the usage of the technology to be less enjoyable as the vehicles are no longer controlled by a person and Car Sharing users may perceive the usage of mobility on demand to be less enjoyable. Therefore, the following hypotheses are postulated:
Hypothesis 5 (H5).
The Perceived Enjoyment of the technology has a positive influence on its Perceived Usefulness.
Hypothesis 6 (H6).
The Perceived Enjoyment of the technology has a positive influence on its Perceived Ease of Use.
The Objective Usability (OU) of a technology has equally been integrated in previous studies, representing a predictor of the Perceived Usefulness and Perceived Ease of Use of a technology [34]. An enhanced usability can serve to remove so-called “access barriers” to use a technology [35,36,37]. In the context of eco-innovations and Battery-electric Vehicles alike, it has been found that the Objective Usability of a technology affects the consumer acceptance of a technology [38,39,40]. Thus, the following hypotheses are proposed:
Hypothesis 7 (H7).
The Objective Usability of the technology has a positive influence on its Perceived Usefulness.
Hypothesis 8 (H8).
The Objective Usability of the technology has a positive influence on its Perceived Ease of Use.
In addition to the original TAM and its extensions introduced in the TAM3, previous research has shown that the consumer acceptance of the automobile solutions is also affected by one’s Attitude Towards Environmental Protection (ENV) as well as one’s Innovativeness (INV). However, both factors have scarcely been included in existing studies on technology acceptance. The majority of extant studies describe early adopters of the technologies as individuals who tend to be more pro-environmental and innovative than the average consumer [41]. Both constructs address aspects such as technology anxiety [42,43], innovation ecosystem, and public opinion [44,45], as well as innovation resistance and trust [26,46]. In the case of automobiles, a more positive perception and higher adoption rates among innovative consumers indicate that the factors have a positive effect on the Perceived Usefulness and Perceived Ease of Use [27,47,48,49]. Therefore, the following hypotheses are suggested:
Hypothesis 9 (H9).
Attitude towards Environmental Protection has a positive influence on the Perceived Enjoyment of the technology.
Hypothesis 10 (H10).
Attitude towards Environmental Protection has a positive influence on Objective Usability of the technology.
Hypothesis 11 (H11).
Innovativeness has a positive influence on the Perceived Enjoyment of the technology.
Hypothesis 12 (H12).
Innovativeness has a positive influence on the Perceived Ease of Use of the technology.
3. Data and Measures
3.1. Sample and Data Collection
The empirical data of the present study were obtained through an online survey distributed among students, personal contacts as well as social media, beginning in 2016. Out of 1276 questionnaires obtained, 1177 were included. As for the rest more than 5% of data was missing.
In the final sample of 1177 respondents, 65 per cent are males and the average age of respondents is 38.1 years, ranging between 16 and 90 years. Out of 1177 respondents, 664 respondents are from Europe, 291 from China, and 116 from North America, i.e., the USA and Canada. The 104 further respondents mainly derive from Asia and Australia, as well as Central and Southern America. 62 per cent of the respondents live in urban or suburban areas, 8 per cent of the respondents own a Battery-electric Vehicles, and 5 per cent a hybrid vehicle.
3.2. Measures
After a short introductory section to all three technologies, the respondents were asked to rate the items provided. All constructs were measured through multiple items on a 7-point Likert scale, ranging from 1 (strongly disagree) to 7 (strongly agree), using reflective scales [50].
On the one hand, the measurement items were adopted from the original TAM or its extension, the TAM 3. On the other hand, scales were refined using established TAM studies in the field of automotive technologies [19,23,24,25,38,51,52,53,54,55,56,57,58,59,60,61,62,63]. This is especially true for the items relating to the attitude towards environmental protection and the innovativeness, as those have scarcely been integrated in TAM research [19,51,52,53].
In addition to English, five language versions were added to enable participants worldwide to complete the survey. Each language version of the survey was translated by native or bilingual speakers. The final version of the survey was available in German, English, Spanish, French as well as simplified and traditional Chinese. Before the survey, a pretest was conducted in order to ensure conceptual equivalence of terms. Table 1 shows the measurement items used.
3.3. Data Analysis and Validation of the Measurement Model
The hypotheses developed in Section 2 were evaluated through variance-based Partial Least Squares Structural Equation Modeling (PLS-SEM) [64,65] using Smart PLS 3.0 [66], as offering high statistical accuracy for relatively small sample sizes, as required for multi-group analysis among different regions intended [67,68,69]. The measurement model was evaluated before interpreting the path coefficients and assessing the significances by bootstrapping at structural model level [67]. A bootstrapping procedure with 5000 samples was used, while sign changes during the bootstrapping process were not accepted [70].
For indicator reliability, a threshold of 0.7 was applied for factor loadings [71]. Loadings above 0.5 were accepted, if other items measuring the same construct had significantly higher reliability scores [64]. Internal consistency reliability was tested, as recommended by Hair et al. [65] for PLS-SEM, by using composite reliability (CR), applying a threshold of 0.7 [72], achieved by all constructs. Convergent validity was examined using average variance extracted (AVE), setting an initial threshold of 0.5, which proved factor loadings to be at an acceptable level for all constructs [73]. All constructs fulfill this criterion, except Perceived Usefulness (PU) for Battery-electric Vehicles with 0.467, which is in an acceptable range, shown in Table 2.
Concerning discriminant validity, also addressing possible unintended cross-loadings, the heterotrait–monotrait (HTMT) criterion was applied, providing better reliability for PLS-SEM than the Fornell–Larcker criterion [74]. As can be obtained from Table A1 in the Appendix A, a conservative threshold of 0.85 for the HTMT is fulfilled in all cases [75].
4. Results
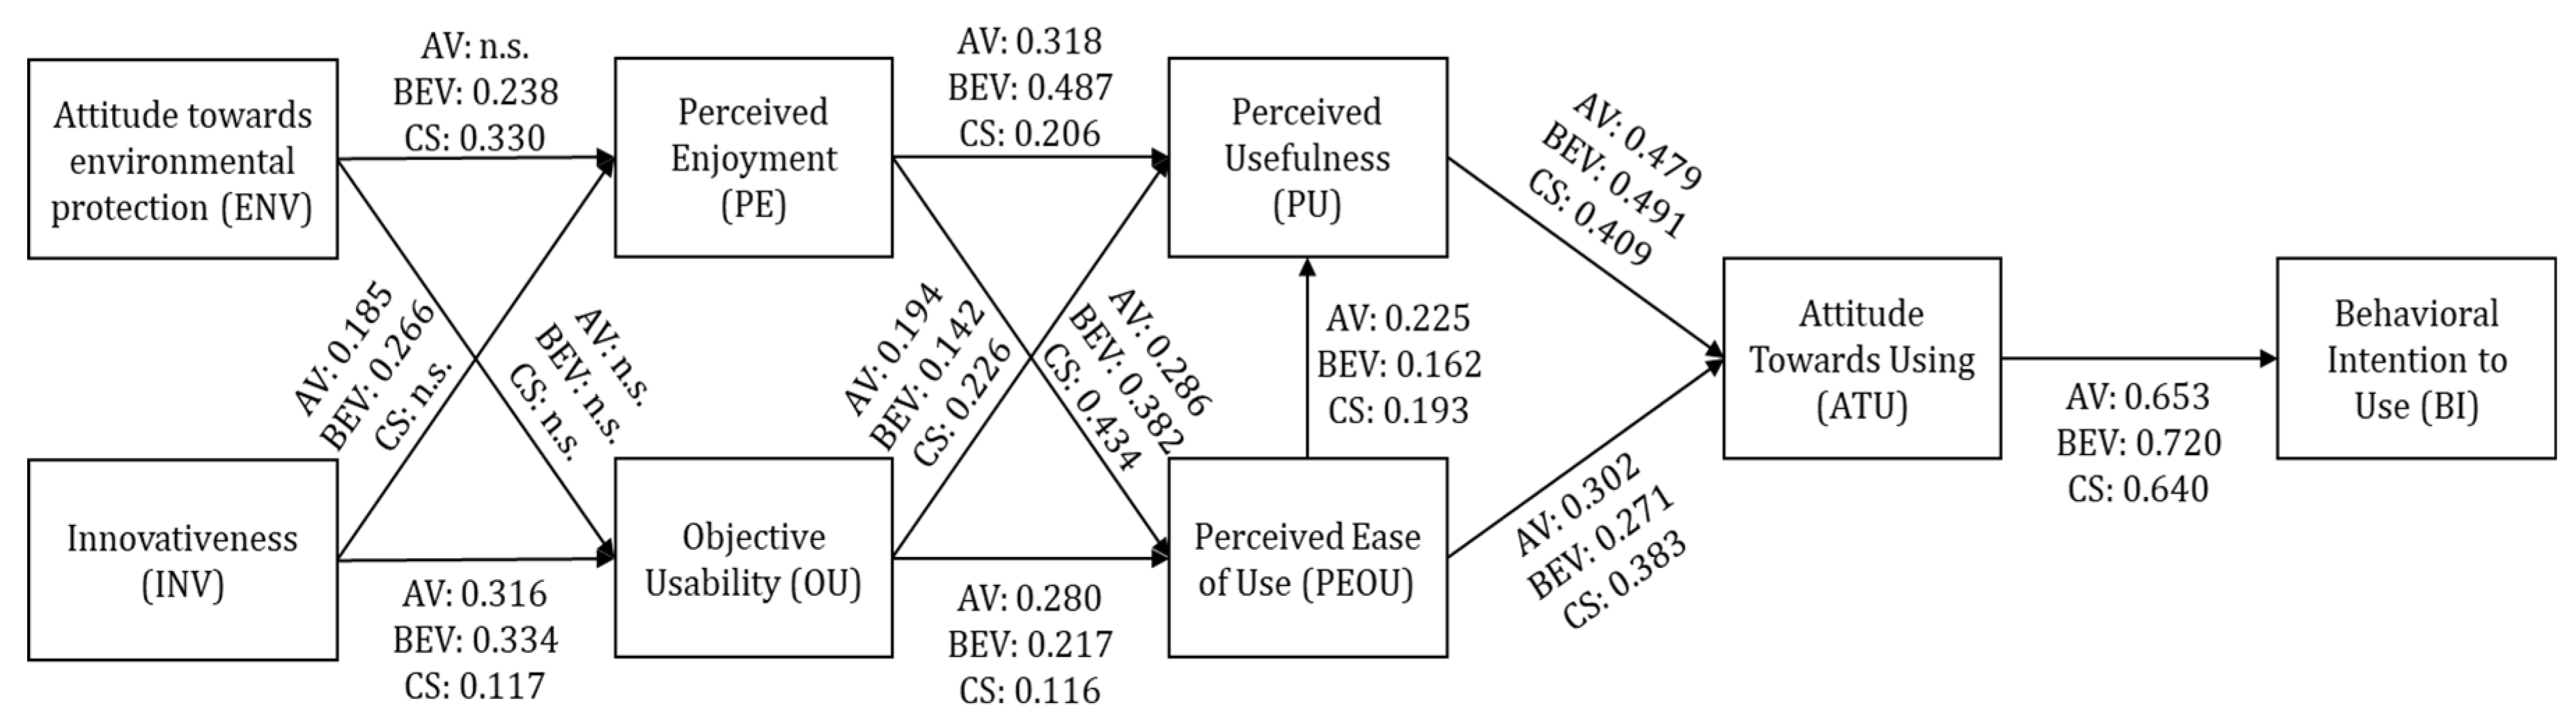
In the following, Figure 2 shows the path coefficients within the research model for Autonomous Vehicles, Battery-electric Vehicles, and Car Sharing. All paths shown fulfill p < 0.001, whilst paths with p > 0.05 were considered as not significant. Statistically not significant paths can only be found for relationships including the Attitude towards environmental protection (ENV) and Innovativeness (INV) as personal attributes. Interestingly, control variables tested (age and gender) proved to be not significant influences. Only the Perceived Ease of Use decreases with age, but not at p < 0.05, but only at p < 0.1, which is why these control variables were not considered further.
Regarding R square values, Perceived Enjoyment (PE) (AV: 0.140, BEV: 0.247, CS: 0.207) and Objective Usability (OU) (AV: 0.199, BEV: 0.209, CS: 0.114) show low R square values, relating to the partially insignificant relationships of Attitude towards environmental protection and innovativeness. For Perceived Usefulness (PU) (AV: 0.281, BEV: 0.464, CS: 0.372) and Perceived Ease of Use (PEOU) (AV: 0.259, BEV: 0.311, CS: 0.368), R square values are on a medium level. For the Attitude Towards Using (ATU), R square values are moderate to high (AV: 0.507, BEV: 0.458, CS: 0.466). For Behavioral Intention to Use (BI), R square values are high for all three technologies (AV: 0.552, BEV: 0.530, CS: 0.503).
In the following, the twelve hypotheses are evaluated. Only those technology-specific or region-specific differences that are noticeable are referred to, which all fulfill p < 0.05. Composing the three major regions within the sample, region-specific differences are investigated for Europe, China, and North America.
H1, suggesting that the Perceived Usefulness of the technology has a positive influence on the Attitude Towards Using, is confirmed for all three technologies and is on a comparable level for Autonomous Vehicles, Battery-electric Vehicles, and Car Sharing. The empirical results do not indicate differences between Europe, China, and North America for H1.
H2, stating that the Perceived Ease of Use of the technology has a positive influence on its Perceived Usefulness, is also confirmed for Autonomous Vehicles, Battery-electric Vehicles, and Car Sharing on a comparable level. This relationship is noticeably stronger for Autonomous Vehicles for North America (β = 0.351), in comparison to Europe (β = 0.176). The same applies for Battery-electric Vehicles, where the positive relationship is much stronger for North America (North America: β = 0.390; Europe: β = 0.113; China: β = 0.098). On the contrary, for Car Sharing, the relationship is not significant for North America, which is in contrast to the findings for China (β = 0.269) and Europe (β = 0.237).
H3, claiming that the Perceived Ease of Use of the technology has a positive influence on the Attitude Towards Using, is supported on a comparable level for all three technologies. Comparable to H2, for North America, this relationship is significantly stronger for Autonomous Vehicles (β = 0.435) and Battery-electric Vehicles (β = 0.424) than in comparison to Europe (β = 0.296 (AV); β = 0.285(BEV)) and China (β = 0.231 (AV); β = 0.147 (BEV)). Regarding Car Sharing, the positive relationship between Perceived Ease of Use and the Attitude Towards Using is stronger in Europe (β = 0.427), in comparison to China (β = 0.204) and North America (β = 0.291).
H4, stating that the Attitude Towards Using of the technology has a positive influence on the Behavioral Intention to Use, is supported. For China, this relationship is lower for Autonomous Vehicles (β = 0.553), Battery-electric Vehicles (β = 0.406), and Car Sharing (β = 0.653) than for Europe and North America.
H5, stating that the Perceived Enjoyment of the technology has a positive influence on its Perceived Usefulness, is confirmed for all three technologies. It has a stronger relationship for Battery-electric Vehicles (β = 0.487) than for Autonomous Vehicles (β = 0.318) and Car Sharing (β = 0.206). However, no region-specific differences can be found.
H6, claiming that the Perceived Enjoyment of the technology has a positive influence on its Perceived Ease of Use, is supported for all three technologies. It has a stronger relationship for Car Sharing (β = 0.434) than for Battery-electric Vehicles (β = 0.382) and Autonomous Vehicles (β = 0.286). Whereas this relationship is weaker for China in the case of Autonomous Vehicles (β = 0.164) and Car Sharing (β = 0.230), the relationship is stronger for Battery-electric Vehicles in North America (β = 0.532).
H7, suggesting that the Objective Usability of the technology has a positive influence on its Perceived Usefulness, is confirmed. However, no clear technology-specific or region-specific differences can be found.
H8, suggesting that the Objective Usability of the technology has a positive influence on its Perceived Ease of Use, is supported for all three technologies with a comparable positive relationship. As found for H7, no technology-specific or region-specific differences can be obtained from the empirical results.
H9, claiming that Attitude towards Environmental Protection has a positive influence on the Perceived Enjoyment of the technology, is confirmed for Battery-electric Vehicles and Car Sharing, but not for Autonomous Vehicles. Interestingly, this relationship is significantly lower for China in the case of Car Sharing (β = 0.121) and not significant for Battery-electric Vehicles, in contrast to Europe and North America.
H10, suggesting that Attitude towards Environmental Protection has a positive influence on the Objective Usability of the technology, is not supported for all three technologies. Hence, H10 is the only hypothesis not supported.
H11, claiming that Innovativeness has a positive influence on the Perceived Enjoyment of the technology, is supported for Autonomous Vehicles and Battery-electric Vehicles, but not for Car Sharing. Further, the empirical data shows no region-specific differences.
H12, proposing that Innovativeness has a positive influence on the Objective Usability of the technology, is confirmed for all three technologies. It is stronger for Battery-electric Vehicles (β = 0.334) and Autonomous Vehicles (β = 0.316) than for Car Sharing (β = 0.117). Again, there are no region-specific differences between Europe, China, and North America.
5. Discussion
The paper confirms the basic assumptions of the TAM by Davis [1] for three technologies within a common research setting regarding H1 to H4. Hence, the findings are in line with previous consumer acceptance research in the field such as Hengstler et al. [26], Hidrue et al. [27], and Jiang [28], extending their findings for Autonomous Vehicles and Battery-electric Vehicles to Car Sharing.
The paper contributes to the understanding of cross-cultural differences in technology adoption [29]. In particular, regarding region-specific differences for H1 to H4, the positive influence of the Perceived Ease of Use on Perceived Usefulness and Attitude Towards Using is stronger for Autonomous Vehicles and Battery-electric Vehicles in North America, whereas the opposite applies for Car Sharing. The Perceived Ease of Use of has a higher influence on the Attitude Towards Using for Autonomous Vehicles and Battery-electric Vehicles than in comparison to Europe and China. For Car Sharing, the positive relationship between Perceived Ease of Use and the Attitude Towards Using is stronger in Europe.
Further, the paper finds a lower relationship between Attitude Towards Using and Behavioral Intention to Use for China. In this respect, the paper shows a possible avenue for future research, as Chinese respondents might be willing to use a certain technology, but do not possess the required resources.
The TAM3 by Venkatesh and Bala [24] highlights the role of a technology’s Perceived Enjoyment and Objective Usability on its Perceived Ease of Use and Perceived Usefulness, which is confirmed through H5 to H8 in the context of the three technologies. The paper finds that the influence of the Perceived Enjoyment on Perceived Usefulness is stronger for Battery-electric Vehicles, especially in North America. On the other hand, the influence of the Perceived Enjoyment on Perceived Ease of Use is stronger for Car Sharing, but weaker in China regarding both, Autonomous Vehicles and Car Sharing, whereas this relationship is stronger for Battery-electric vehicles in North America.
These findings confirm and extend the theoretical framework by Ha and Stoel [32] and further previous findings in the context of eco-innovations and Battery-electric Vehicles that also identified the Perceived Enjoyment of a technology to be imperative for high consumer acceptance levels [15,33]. Hence, the findings emphasize the importance of enjoyment in the context of using automobiles and that the Perceived Enjoyment is a central factor for adopting automotive technologies.
Moreover, the role of a technology’s Objective Usability on the Perceived Usefulness and the Perceived Ease of Use can be confirmed, as previous studies highlight the importance of designing automotive concepts that are compatible with consumers’ existing lifestyles in order to accept a certain technology [38,39,40].
Further, the present study makes a contribution by incorporating two constructs which were rarely in previous TAM studies: Attitude towards Environmental Protection and Innovativeness in H9 to H12. In the context of Battery-electric Vehicles, several studies consider one’s Attitude towards Environmental Protection to be a predictor of the consumer acceptance of Battery-electric Vehicles [15,19]. The paper confirms this relationship, as the influence of Attitude towards Environmental Protection on Perceived Enjoyment is higher for Battery-electric Vehicles and Car Sharing, and not significant for Autonomous Vehicles.
In China, this relationship is lower for Car Sharing, or even insignificant for Battery-electric Vehicles. In sum, the Attitude towards Environmental Protection seems to be a less important factor for Chinese participants than for those in North America and Europe. This indicates that the factors should also be included in future research frameworks focusing on the consumer acceptance of eco-friendly and/or innovative technologies. For instance, Chinese respondents might be more focused on catching up or even leapfrogging technological developments and then achieving environmental benefits, rather than achieving them right away [78].
On the other hand, the influence of Innovativeness on Perceived Enjoyment and Objective Usability is higher for Autonomous Vehicles and Battery-electric Vehicles, which is not a counter-intuitive, but a valuable finding. Further, region-specific differences cannot be found for this relationship.
In sum, automotive manufacturers and mobility providers can utilize the findings described above in their marketing strategy, as well as for products and services provided for the three technologies and across regions. This is possible, since the integration of the three technologies within a common research model makes relationships comparable with each other.
This includes, for instance, a higher importance of Perceived Enjoyment for Battery-electric Vehicles regarding Perceived Usefulness than for Autonomous Vehicles and Car Sharing. In return, highlighting and emphasizing as well as improving the Perceived Enjoyment of Battery-electric Vehicles is advised for car manufacturers in order to increase customers’ Perceived Usefulness of the technology. This relates to marketing strategies as well as to experiences customers make with Battery-electric Vehicles.
On the other hand, Perceived Enjoyment as an antecedent for the Perceived Ease of Use is stronger for Car Sharing and Battery-electric Vehicles in comparison to Autonomous Vehicles. Therefore, linking enjoyment and user-friendliness of Car Sharing can be advised for mobility providers. Further, especially the acceptance of Battery-electric Vehicles can be supported in North America in this manner.
Likewise, Innovativeness as antecedents for Autonomous Vehicles and Battery-electric Vehicles, and Attitude towards Environmental Protection for Battery-electric Vehicles and Car Sharing should be considered. For instance, marketing strategies could target environmental-oriented drivers more through Battery-electric Vehicles and Car Sharing, while innovation-oriented drivers should rather be approached via Autonomous Vehicles and Battery-electric Vehicles.
Further region-specific differences can be seen, as for instance, the Attitude towards Environmental Protection does not show a significant influence on the Perceived Enjoyment for China, in contrast to Europe and North America. This might relate to either cultural background, or the beforehand mentioned different situation on the Chinese automotive market yet in comparison to Europe and North America.
For Autonomous Vehicles in general, as there is no significant relationship with the Attitude towards Environmental Protection yet, it is recommended to highlight its environmental advantages. Among others, more efficient driving, individually and in complex traffic flows, can be achieved, allowing to prevent traffic jams by more efficient road usage and reducing emissions. These advantages can complement safety-related advantages of Autonomous Vehicles that could be known better yet.
6. Conclusions
The major contribution of this paper relating to its study design, the integration of three technologies within a single research setting, is also one of its major limitations: Constructs and measurements had to be made comparable to each other, therefore not allowing to investigate one of the three technologies in as much detail as other studies do. This is also related to limitations regarding the length of the questionnaire, as investigating all three technologies in detail is not feasible and will lead to many respondents aborting the questionnaire. Therefore, although a common research design provides many advantages, the technologies must be investigated in more detail in order to advance the understanding of their acceptance in future research. This also applies for the interdependencies of certain technologies.
Furthermore, especially Autonomous Vehicles are still at the beginning of their emergence and can therefore only be evaluated to a certain extent. Although many autonomous features are present in modern cars, such as lane keeping assistants and autonomous cruise control, fully autonomous driving in cities is still a concept rather than reality. Therefore, different stages of development might be integrated in future studies.
Also, the moderating role of several factors such as social status, age, or gender could not be confirmed on a significant or even strong influential level for this dataset. Therefore, these moderating could be better integrated in study designs such as conjoint analysis or behavioral research setups rather than a questionnaire-based survey.
A suggestion for future research is to attempt to better understand and merge the research streams of providing mobility and the manufacturing of cars, in which car manufacturers both engage. This relates to research streams such as manufacturing and digitization, often subsumed under the concepts of “Industry 4.0” or “Made in China 2025”. In order to better understand the entire ecosystem of car production and mobility solutions, more sustainable solutions as a whole could be created. This also relates to the fact that a large proportion of emissions is not generated when running cars, but producing them. This is especially true for Battery-electric vehicles, as well as the integration of further technical aspects [4,5,6,79,80,81,82,83,84].
Funding
This research received no external funding.
Conflicts of Interest
The author declares no conflict of interest.
Appendix A

Table A1.
Discriminant validity.
| ATU_(AV) | |||||||||||||||||||
|---|---|---|---|---|---|---|---|---|---|---|---|---|---|---|---|---|---|---|---|
| ATU_(BEV) | 0.378 | ||||||||||||||||||
| ATU_(CS) | 0.260 | 0.351 | |||||||||||||||||
| BI_(AV) | 0.778 | 0.297 | 0.117 | ||||||||||||||||
| BI_(BEV) | 0.315 | 0.789 | 0.216 | 0.453 | |||||||||||||||
| BI_(CS) | 0.167 | 0.203 | 0.777 | 0.152 | 0.294 | ||||||||||||||
| PE_(AV) | 0.628 | 0.340 | 0.171 | 0.618 | 0.301 | 0.102 | |||||||||||||
| PE_(BEV) | 0.348 | 0.767 | 0.271 | 0.321 | 0.716 | 0.193 | 0.577 | ||||||||||||
| PE_(CS) | 0.151 | 0.220 | 0.668 | 0.077 | 0.209 | 0.653 | 0.246 | 0.401 | |||||||||||
| ENV | 0.057 | 0.310 | 0.329 | 0.035 | 0.283 | 0.298 | 0.099 | 0.339 | 0.391 | ||||||||||
| INV | 0.247 | 0.231 | 0.059 | 0.296 | 0.356 | 0.060 | 0.228 | 0.356 | 0.056 | 0.182 | |||||||||
| OU_(AV) | 0.394 | 0.168 | 0.064 | 0.476 | 0.180 | 0.037 | 0.364 | 0.153 | 0.052 | 0.081 | 0.362 | ||||||||
| OU_(BEV) | 0.188 | 0.364 | 0.109 | 0.261 | 0.360 | 0.036 | 0.165 | 0.335 | 0.050 | 0.069 | 0.394 | 0.730 | |||||||
| OU_(CS) | 0.123 | 0.197 | 0.281 | 0.155 | 0.154 | 0.159 | 0.090 | 0.130 | 0.116 | 0.043 | 0.144 | 0.524 | 0.698 | ||||||
| PEOU(AV) | 0.589 | 0.261 | 0.076 | 0.617 | 0.277 | 0.036 | 0.475 | 0.242 | 0.033 | 0.015 | 0.185 | 0.462 | 0.293 | 0.189 | |||||
| PEOU_(BEV) | 0.271 | 0.565 | 0.158 | 0.314 | 0.597 | 0.063 | 0.261 | 0.540 | 0.125 | 0.209 | 0.206 | 0.242 | 0.393 | 0.239 | 0.576 | ||||
| PEOU (CS) | 0.168 | 0.137 | 0.574 | 0.098 | 0.164 | 0.622 | 0.129 | 0.156 | 0.554 | 0.213 | 0.017 | 0.048 | 0.034 | 0.114 | 0.151 | 0.193 | |||
| PU (AV) | 0.666 | 0.368 | 0.266 | 0.567 | 0.320 | 0.132 | 0.536 | 0.381 | 0.141 | 0.118 | 0.189 | 0.417 | 0.297 | 0.238 | 0.507 | 0.341 | 0.142 | ||
| PU_(BEV) | 0.318 | 0.697 | 0.276 | 0.299 | 0.606 | 0.151 | 0.386 | 0.721 | 0.208 | 0.374 | 0.247 | 0.225 | 0.399 | 0.224 | 0.271 | 0.519 | 0.092 | 0.548 | |
| PU (CS) | 0.266 | 0.387 | 0.611 | 0.202 | 0.269 | 0.385 | 0.274 | 0.329 | 0.352 | 0.325 | 0.072 | 0.159 | 0.215 | 0.308 | 0.161 | 0.286 | 0.316 | 0.460 | 0.577 |
References
- Davis, F.D. Perceived usefulness, perceived ease of use, and user acceptance of information technology. MIS Q. 1989, 13, 319–340. [Google Scholar] [CrossRef]
- Kent, J.L. Driving to save time or saving time to drive? The enduring appeal of the private car. Transp. Res. Part A 2014, 65, 103–115. [Google Scholar] [CrossRef]
- Nolan, A. A dynamic analysis of household car ownership. Transp. Res. Part A 2010, 44, 446–455. [Google Scholar] [CrossRef]
- Wiedmann, K.P.; Hennigs, N.; Pankalla, L.; Kassubek, M.; Seegebarth, B. Adoption barriers and resistance to sustainable solutions in the automotive sector. J. Bus. Res. 2011, 64, 1201–1206. [Google Scholar] [CrossRef]
- Zhang, T.; Gensler, S.; Garcia, R. A study of the diffusion of alternative fuel vehicles: An agent-based modeling approach. J. Prod. Innov. Manag. 2011, 28, 152–168. [Google Scholar] [CrossRef]
- Fontaras, G.; Samaras, Z. On the way to 130 g CO2/km—Estimating the future characteristics of the average European passenger car. Energy Policy 2010, 38, 1826–1833. [Google Scholar] [CrossRef]
- Fujimoto, T. The long tail of the auto industry life cycle. J. Prod. Innov. Manag. 2014, 31, 8–16. [Google Scholar] [CrossRef]
- Dijk, M.; Yarime, M. The emergence of hybrid-electric cars: Innovation path creation through co-evolution of supply and demand. Technol. Forecast. Soc. Chang. 2010, 77, 1371–1390. [Google Scholar] [CrossRef]
- Liu, J. Electric vehicle charging infrastructure assignment and power grid impacts assessment in Beijing. Energy Policy 2012, 51, 544–557. [Google Scholar] [CrossRef]
- Marletto, G. Car and the city: Socio-technical transition pathways to 2030. Technol. Forecast. Soc. Chang. 2014, 87, 164–178. [Google Scholar] [CrossRef]
- Shaheen, S.A.; Cohen, A.P. Carsharing and personal vehicle services: Worldwide market developments and emerging trends. Int. J. Sustain. Transp. 2013, 7, 5–34. [Google Scholar] [CrossRef]
- Wesseling, J.H.; Faber, J.; Hekkert, M.P. How competitive forces sustain electric vehicle development. Technol. Forecast. Soc. Chang. 2014, 81, 154–164. [Google Scholar] [CrossRef] [Green Version]
- Junquera, B.; Moreno, B.; Álvarez, R. Analyzing consumer attitudes towards electric vehicle purchasing intentions in Spain: Technological limitations and vehicle confidence. Technol. Forecast. Soc. Chang. 2016, 109, 6–14. [Google Scholar] [CrossRef]
- Pinkse, J.; Bohnsack, R.; Kolk, A. The role of public and private protection in disruptive innovation: The automotive industry and the emergence of low-emission vehicles. J. Prod. Innov. Manag. 2014, 31, 43–60. [Google Scholar] [CrossRef]
- Schuitema, G.; Anable, J.; Skippon, S.; Kinnear, N. The role of instrumental, hedonic and symbolic attributes in the intention to adopt electric vehicles. Transp. Res. Part A: Policy Pract. 2013, 48, 39–49. [Google Scholar] [CrossRef]
- Stringham, E.P.; Miller, J.K.; Clark, J.R. Overcoming barriers to entry in an established industry: Tesla motors. Calif. Manag. Rev. 2015, 57, 85–103. [Google Scholar] [CrossRef]
- Wells, P.; Nieuwenhuis, P. Transition failure: Understanding continuity in the auto-motive industry. Technol. Forecast. Soc. Chang. 2012, 79, 1681–1692. [Google Scholar] [CrossRef]
- Moons, I.; de Pelsmacker, P. Emotions as determinants of electric car usage intention. J. Mark. Manag. 2012, 28, 195–237. [Google Scholar] [CrossRef]
- Plötz, P.; Schneider, U.; Globisch, J.; Dütschke, E. Who will buy electric vehicles?: Identifying early adopters in Germany. Transp. Res. Part A 2014, 67, 96–109. [Google Scholar] [CrossRef]
- Payre, W.; Cestac, J.; Delhomme, P. Intention to use a fully automated car: Attitudes and a priori acceptability. Transportation Research Part F: Traffic Psychology and Behaviour 2014, 27, 252–263. [Google Scholar] [CrossRef] [Green Version]
- Haboucha, C.J.; Ishaq, R.; Shiftan, Y. User preferences regarding autonomous vehicles. Transp. Res. Part C 2017, 78, 37–49. [Google Scholar] [CrossRef]
- Choi, Y.K.; Totten, J.W. Self-construal’s role in mobile TV acceptance: Extension of TAM across cultures. J. Bus. Res. 2012, 65, 1525–1533. [Google Scholar] [CrossRef]
- Davis, F.D.; Bagozzi, R.P.; Warshaw, P.R. User acceptance of computer technology: A comparison of two theoretical models. Manag. Sci. 1989, 35, 982–1003. [Google Scholar] [CrossRef]
- Venkatesh, V.; Bala, H. Technology acceptance model 3 and a research agenda on interventions. Decis. Sci. 2008, 39, 273–315. [Google Scholar] [CrossRef]
- Venkatesh, V.; Davis, F.D. A theoretical extension of the technology acceptance model: Four Longitudinal Field Studies. Manag. Sci. 2000, 46, 186–204. [Google Scholar] [CrossRef]
- Smith, R.; Deitz, G.; Royne, M.B.; Hansen, J.D.; Grünhagen, M.; Witte, C. Cross-cultural examination of online shopping behavior: A comparison of Norway, Germany, and the United States. J. Bus. Res. 2013, 66, 328–335. [Google Scholar] [CrossRef]
- Hengstler, M.; Enkel, E.; Duelli, S. Applied artificial intelligence and trust—The case of autonomous vehicles and medical assistance devices. Technol. Forecast. Soc. Chang. 2016, 105, 105–120. [Google Scholar] [CrossRef]
- Hidrue, M.K.; Parsons, G.R.; Kempton, W.; Gardner, M.P. Willingness to pay for electric vehicles and their attributes. Resour. Energy Econ. 2011, 33, 686–705. [Google Scholar] [CrossRef] [Green Version]
- Jiang, S. Purchase intention for electric vehicles in china from a customer-value perspective. Soc. Behav. Personal. 2016, 44, 641–655. [Google Scholar] [CrossRef]
- Dabholkar, P.A.; Bagozzi, R.P. An attitudinal model of technology-based selfservice: Moderating effects of consumer traits and situational factors. J. Acad. Mark. Sci. 2002, 30, 184–201. [Google Scholar] [CrossRef]
- Ferreira, J.B.; da Rocha, A.; da Silva, J.F. Impacts of technology readiness on emotions and cognition in Brazil. J. Bus. Res. 2014, 67, 865–873. [Google Scholar] [CrossRef]
- Ha, S.; Stoel, L. Consumer e-shopping acceptance: Antecedents in a technology acceptance model. J. Bus. Res. 2009, 62, 565–571. [Google Scholar] [CrossRef]
- Gurtner, S.; Soyez, K. How to catch the generation Y: Identifying consumers of eco-logical innovations among youngsters. Technol. Forecast. Soc. Chang. 2016, 106, 101–107. [Google Scholar] [CrossRef]
- Lee, Y.C. The role of perceived resources in online learning adoption. Comput. Educ. 2008, 50, 1423–1438. [Google Scholar] [CrossRef]
- Ellen, P.; Bearden, W.; Sharma, S. Resistance to technological innovations: An examination of the role of self-efficacy and performance satisfaction. J. Acad. Mark. Sci. 1991, 19, 297–307. [Google Scholar] [CrossRef]
- Gourville, J.T. Eager sellers stony buyers: Understanding the psychology of new product adoption. Harvard Business Review 2006, 84, 98–106. [Google Scholar]
- Porter, C.E.; Donthu, N. Using the technology acceptance model to explain how attitudes determine Internet usage: The role of perceived access barriers and demographics. J. Bus. Res. 2006, 59, 999–1007. [Google Scholar] [CrossRef]
- Jansson, J. Consumer eco-innovation adoption: Assessing attitudinal factors and perceived product characteristics. Bus. Strategy Environ. 2011, 20, 192–210. [Google Scholar] [CrossRef]
- Pasaoglu, G.; Fiorello, D.; Martino, A.; Zani, L.; Zubaryeva, A.; Thiel, C. Travel patterns and the potential use of electric cars—Results from a direct survey in six European countries. Technol. Forecast. Soc. Chang. 2014, 87, 51–59. [Google Scholar] [CrossRef]
- Sovacool, B.K.; Hirsh, R.F. Beyond batteries: An examination of the benefits and barriers to plug-in hybrid electric vehicles (PHEVs) and a vehicle-to-grid (V2G) transition. Energy Policy 2009, 37, 1095–1103. [Google Scholar] [CrossRef]
- Bartels, J.; Reinders, M.J. Consumer innovativeness and its correlates: A propositional inventory for future research. J. Bus. Res. 2011, 64, 601–609. [Google Scholar] [CrossRef]
- Hohenberger, C.; Spörrle, M.; Welpe, I.M. Not fearless, but self-enhanced: The effects of anxiety on the willingness to use autonomous cars depend on individual levels of self-enhancement. Technol. Forecast. Soc. Chang. 2017, 116, 40–52. [Google Scholar] [CrossRef]
- Meuter, M.L.; Ostrom, A.L.; Bitner, M.J.; Roundtree, R. The influence of technology anxiety on consumer use and experiences with self-service technologies. J. Bus. Res. 2003, 56, 899–906. [Google Scholar] [CrossRef]
- Kim, S.H.; Park, H.J. Effects of social influence on consumers’ voluntary adoption of innovations prompted by others. J. Bus. Res. 2011, 64, 1190–1194. [Google Scholar] [CrossRef]
- Kyriakidis, M.; Happee, R.; Winter, J.C.F. Public opinion on automated driving: Results of an international questionnaire among 5000 respondents. Transp. Res. Part F 2015, 32, 127–140. [Google Scholar] [CrossRef]
- Talke, K.; Heidenreich, S. How to overcome pro-change bias: Incorporating passive and active innovation resistance in innovation decision models. J. Prod. Innov. Manag. 2014, 31, 894–907. [Google Scholar] [CrossRef]
- Heffner, R.R.; Kurani, K.S.; Turrentine, T.S. Symbolism in California’s early market for hybrid electric vehicles. Transp. Res. Part D 2007, 12, 396–413. [Google Scholar] [CrossRef]
- Jensen, A.F.; Cherchi, E.; Mabit, S.L. On the stability of preferences and attitudes before and after experiencing an electric vehicle. Transp. Res. Part D 2013, 25, 24–32. [Google Scholar] [CrossRef] [Green Version]
- Skippon, S.; Garwood, M. Responses to battery electric vehicles: UK consumer attitudes and attributions of symbolic meaning following direct experience to reduce psychological distance. Transp. Res. Part D 2011, 16, 525–531. [Google Scholar] [CrossRef]
- Diamantopoulos, A.; Riefler, P.; Roth, K.P. Advancing formative measurement models. J. Bus. Res. 2008, 61, 1203–1218. [Google Scholar] [CrossRef]
- Roberts, J.A. Profiling levels of socially responsible consumer behavior: A cluster analytic approach and its implications for marketing. J. Mark. Theory Pract. 1995, 3, 97–117. [Google Scholar] [CrossRef]
- Seebauer, S. Why early adopters engage in interpersonal diffusion of technological innovations: An empirical study on electric bicycles and electric scooters. Transp. Res. Part A 2015, 78, 146–160. [Google Scholar] [CrossRef]
- Wolf, A.; Seebauer, S. Technology adoption of electric bicycles: A survey among early adopters. Transp. Res. Part A 2014, 69, 196–211. [Google Scholar] [CrossRef]
- Bruner, G.C.; Kumar, A. Explaining consumer acceptance of handheld Internet devices. J. Bus. Res. 2005, 58, 553–558. [Google Scholar] [CrossRef]
- Venkatesh, V. Determinants of perceived ease of use: Integrating control, intrinsic motivation, and emotion into the technology acceptance model. Inf. Syst. Res. 2000, 11, 342–365. [Google Scholar] [CrossRef]
- Fagnant, D.J.; Kockelman, K.M. Preparing a nation for autonomous vehicles. opportunities, barriers and policy recommendations. Transp. Res. Part A 2015, 77, 167–181. [Google Scholar] [CrossRef]
- Lee, J.; Park, B.; Malakorn, K.; So, J. Sustainability assessments of cooperative vehicle intersection control at an urban corridor. Transp. Res. Part C 2013, 32, 193–206. [Google Scholar] [CrossRef]
- Wadud, Z.; MacKenzie, D.; Leiby, P. Help or hindrance? The travel, energy and carbon impacts of highly automated vehicles. Transp. Res. Part A 2016, 86, 1–18. [Google Scholar] [CrossRef] [Green Version]
- Kihm, A.; Trommer, S. The new car market for electric vehicles and the potential for fuel substitution. Energy Policy 2014, 73, 147–157. [Google Scholar] [CrossRef]
- Firnkorn, J.; Müller, M. What will be the environmental effects of new free-floating car-sharing systems? The case of car2go in Ulm. Ecological Economics 2011, 70, 1519–1528. [Google Scholar] [CrossRef]
- Habib, K.M.N.; Morency, C.; Islam, M.T.; Grasset, V. Modelling users’ behaviour of a carsharing program. Application of a joint hazard and zero inflated dynamic ordered probability model. Transp. Res. Part A 2012, 46, 241–254. [Google Scholar] [CrossRef]
- Weikl, S.; Bogenberger, K. Relocation strategies and algorithms for free-floating car sharing systems. IEEE Intell. Transp. Syst. Mag. 2013, 5, 100–111. [Google Scholar] [CrossRef]
- Venkatesh, V.; Morris, M.G.; Davis, G.B.; Davis, F.D. User acceptance of information technology: Toward a unified view. MIS Q. 2003, 27, 425–478. [Google Scholar] [CrossRef]
- Chin, W.W. The partial least squares approach to structural equation modeling. In Modern Methods of Business Research; Marcoulides, G.A., Ed.; Psychology Press: Mahwah, NJ, USA, 1998; pp. 295–336. ISBN 0805830936. [Google Scholar]
- Hair, J.F.; Sarstedt, M.; Pieper, T.M.; Ringle, C.M. The use of partial least squares structural equation modeling in strategic management research: A review of past practices and recommendations for future applications. Long Range Plan. 2012, 56, 320–340. [Google Scholar] [CrossRef]
- Ringle, C.M.; Wende, S.; Becker, J.M. SmartPLS 3; SmartPLS: Hamburg, Germany, 2014. [Google Scholar]
- Henseler, J.; Ringle, C.M.; Sinkovics, R.R. The use of partial least squares path modeling in international marketing. In Advances in International Marketing; Sinkovics, R.R., Ghauri, P.N., Eds.; Emerald Publishing: Bingley, England, 2009. [Google Scholar]
- Henseler, J.; Ringle, C.M.; Sarstedt, M. Using partial least squares path modeling in advertising research: basic concepts and recent issues. In Handbook of Research on International Advertising; Okazaki, S., Ed.; Edward Elgar Publishing: Cheltenham, UK, 2012. [Google Scholar]
- Reinartz, W.; Haenlein, M.; Henseler, J. An empirical comparison of the efficacy of covariance-based and variance-based SEM. Int. J. Res. Mark. 2009, 26, 332–344. [Google Scholar] [CrossRef] [Green Version]
- Hair, J.F.; Hult, G.T.M.; Ringle, C.M.; Sarstedt, M. A Primer on Partial Least Squares Structural Equation Modeling (PLS-SEM); Sage Publications: Thousand Oaks, CA, USA, 2016. [Google Scholar]
- Carmines, E.G.; Zeller, R.A. Reliability and Validity Assessment; Thousand Oaks: Thousand Oaks, CA, USA, 1979. [Google Scholar]
- Nunnally, J. Psychometric Theory; McGraw-Hill: New York, NY, USA, 1978. [Google Scholar]
- Fornell, C.; Larcker, D.F. Structural equation models with unobservable variables and measurement error: Algebra and statistics. J. Mark. Res. 1981, 18, 382–388. [Google Scholar] [CrossRef]
- Henseler, J.; Ringle, C.M.; Sarstedt, M. A new criterion for assessing discriminant validity in variance-based structural equation modeling. J. Acad. Mark. Sci. 2015, 43, 115–135. [Google Scholar] [CrossRef]
- Voorhees, C.M.; Brady, M.K.; Calantone, R.; Ramirez, E. Discriminant validity testing in marketing: An analysis, causes for concern, and proposed remedies. J. Acad. Mark. Sci. 2016, 44, 119–134. [Google Scholar] [CrossRef]
- Podsakoff, P.M.; MacKenzie, S.B.; Lee, J.Y.; Podsakoff, N.P. Common method biases in behavioral research: A critical review of the literature and recommended remedies. J. Appl. Psychol. 2013, 88, 879–903. [Google Scholar] [CrossRef]
- Podsakoff, P.M.; Organ, D.W. Self-reports in organizational research: Problems and prospects. J. Manag. 1986, 12, 531–544. [Google Scholar] [CrossRef]
- Müller, J.M.; Voigt, K.I. Sustainable industrial value creation in SMEs: A comparison between industry 4.0 and made in China 2025. Int. J. Pr. Eng. Man. GT. 2018, 5, 659–670. [Google Scholar] [CrossRef]
- Birkel, H.S.; Veile, J.W.; Müller, J.M.; Hartmann, E.; Voigt, K.I. Development of a risk framework for Industry 4.0 in the context of sustainability for established manufacturers. Sustainability 2019, 11, 384. [Google Scholar] [CrossRef]
- Müller, J.M. Antecedents to digital platform usage in industry 4.0 by established manufacturers. Sustainability 2019, 11. [Google Scholar] [CrossRef]
- Müller, J.M. Business model innovation in small- and medium-sized enterprises: Strategies for industry 4.0 providers and users. J. Manuf. Technol. Manag. 2019. [Google Scholar] [CrossRef]
- Müller, J.M.; Däschle, S. Business model innovation of industry 4.0 solution providers towards customer process innovation. Processes 2018, 6, 260. [Google Scholar] [CrossRef]
- Zeng, Y.; Huang, Z.; Cai, Y.; Liu, Y.; Xiao, Y.; Shang, Y. A control strategy for driving mode switches of plug-in hybrid electric vehicles. Sustainability 2018, 10, 4237. [Google Scholar] [CrossRef]
- Xie, S.; Hu, X.; Lang, K.; Qi, S.; Liu, T. Powering mode-integrated energy management strategy for a plug-in hybrid electric truck with an automatic mechanical transmission based on Pontryagin’s minimum principle. Sustainability 2018, 10, 3758. [Google Scholar] [CrossRef]
Figure 1.
Research model and hypotheses.

Figure 2.
Results. Note: n.s. = not significant.

Table 1.
Measurement items.
| Construct | Item | Adapted from |
|---|---|---|
| Attitude towards Environmental Protection (ENV) | I consider the potential environmental impact of my actions when making many of my decisions. | Plötz et al. [19]; Roberts [51] |
| I am willing to be inconvenienced in order to take actions that are more environmentally friendly. | ||
| To me, it is important to drive a car that harms the environment as little as possible. | ||
| Innovativeness (INV) | I keep myself informed about recent automobile product developments. | Plötz et al. [19]; Seebauer [52]; Wolf and Seebauer [53] |
| I like to deal with automobiles in more detail than their basic functions would require. | ||
| I like to give technical innovations a trial, even if they are not widely used yet. | ||
| Perceived Enjoyment (PE) | I would find using Autonomous Vehicles/Battery-electric Vehicles/Car Sharing to be enjoyable. | Bruner and Kumar [54]; Venkatesh [55]; Venkatesh and Bala [24] |
| Owning/ using Autonomous Vehicles/Battery-electric Vehicles/Car Sharing would make my life more interesting. | ||
| Using Autonomous Vehicles/Battery-electric Vehicles/Car Sharing will give more enjoyment than traditional cars. | ||
| Objective Usability (OU) | I would have access to the financial and non-financial resources that are required to use Autonomous Vehicles/Battery-electric Vehicles/Car Sharing. | Jansson [38]; Plötz et al. [19] |
| It would be easy to integrate Autonomous Vehicles/Battery-electric Vehicles/Car Sharing in my mobility environment. | ||
| Using Autonomous Vehicles/Battery-electric Vehicles/Car Sharing would be compatible with my daily routine. | ||
| Perceived Usefulness of Autonomous Vehicles (PU AV) | Autonomous vehicles… | |
| ... have the potential to make driving a car safer. | Fagnant and Kockelman [56]; Lee et al. [57]; Wadud et al. [58] | |
| ... lead to insurance premium reductions. | ||
| ... provide better access to mobility to people (e.g., children, the elderly) with a limited ability to drive. | ||
| ... produce fewer emissions. | ||
| ... contribute to a better traffic flow. | ||
| ... allow passengers to save time as the cars would park themselves. | ||
| ... allow all passengers to focus on things other than driving the car. A driver would be no longer required. | ||
| Perceived Usefulness of Battery-Electric Vehicles (PU BEV) | Battery-electric Vehicles… | |
| ... have the potential to make driving a car safer. | ||
| ... enable a dynamic driving experience. | Hidrue et al. [27]; Kihm and Trommer [59]; Plötz et al. [19] | |
| ... can drive quietly. | ||
| ... do not produce any harmful emissions. | ||
| ... the expenses for recharging the car are lower than for refueling a traditional car. | ||
| ... the maintenance costs are lower. | ||
| ... allow the owner to benefit from tax reliefs. | ||
| ... can be powered by renewable energy. | ||
| Perceived Usefulness of Car Sharing (PU CS) | Using car sharing…. | |
| ... one is only charged for using a car when actually driving the vehicle. | Firnkorn and Müller [60]; Habib et al. [61]; Weikl and Bogenberger [62] | |
| ... parking spaces can be used in a more effective and less expensive manner. | ||
| ... contributes to a greener city by eliminating the need to own a (second) vehicle. | ||
| ... people can rent a car whenever they actually require a vehicle. | ||
| ... users can always rent new cars. | ||
| ... users are not required to service and maintain the car. | ||
| ... it contributes to a better combination of different modes of transport. | ||
| Perceived Ease of Use (PEOU) | I would not need help (car manual, driving training, product demonstration) to Autonomous Vehicles/Battery-electric Vehicles/Car Sharing. | Davis [1]; Davis et al. [23]; Venkatesh and Davis [25]; Venkatesh et al. [63] |
| Learning to operate/hire Autonomous Vehicles/Battery-electric Vehicles/Car Sharing would be easy for me. | ||
| My interaction with Autonomous Vehicles/Battery-electric Vehicles/Car Sharing would be clear and understandable. | ||
| Attitude Toward Using (ATU) | I like the idea of using Autonomous Vehicles/Battery-electric Vehicles/Car Sharing. | Davis et al. [23]; Venkatesh et al. [63] |
| I think that using Autonomous Vehicles/Battery-electric Vehicles/Car Sharing is beneficial to me.Using Autonomous Vehicles/Battery-electric Vehicles/Car Sharing is very good policy. | ||
| Behavioral Intention to use (BI) | Assuming I had access to Autonomous Vehicles/Battery-electric Vehicles/Car Sharing, I would intend to use it. | Davis et al. [23]; Plötz et al. [19]; Venkatesh and Bala [24]; Venkatesh and Davis [25]; Venkatesh et al. [63] |
| I will use Autonomous Vehicles/Battery-electric Vehicles/Car Sharing on a regular basis in the next 5 to 10 years. |
Table 2.
Composite Reliability (CR) and Average Variance Extracted (AVE) of constructs.
| Construct | Technology | CR | AVE |
|---|---|---|---|
| Attitude towards environmental protection (ENV) | - | 0.889 | 0.727 |
| Innovativeness (INV) | - | 0.919 | 0.791 |
| Perceived Enjoyment (PE) | Autonomous Vehicles | 0.894 | 0.738 |
| Battery-electric Vehicles | 0.904 | 0.737 | |
| Car Sharing | 0.894 | 0.759 | |
| Objective Usability (OU) | Autonomous Vehicles | 0.889 | 0.728 |
| Battery-electric Vehicles | 0.892 | 0.734 | |
| Car Sharing | 0.903 | 0.759 | |
| Perceived Usefulness (PU) | Autonomous Vehicles | 0.880 | 0.514 |
| Battery-electric Vehicles | 0.859 | 0.467 | |
| Car Sharing | 0.896 | 0.553 | |
| Perceived ease of use (PEOU) | Autonomous Vehicles | 0.818 | 0.611 |
| Battery-electric Vehicles | 0.831 | 0.631 | |
| Car Sharing | 0.810 | 0.609 | |
| Attitude towards using (ATU) | Autonomous Vehicles | 0.958 | 0.883 |
| Battery-electric Vehicles | 0.944 | 0.849 | |
| Car Sharing | 0.911 | 0.773 | |
| Behavioral Intention to use (BI) | Autonomous Vehicles | 0.904 | 0.759 |
| Battery-electric Vehicles | 0.918 | 0.788 | |
| Car Sharing | 0.951 | 0.866 |
© 2019 by the author. Licensee MDPI, Basel, Switzerland. This article is an open access article distributed under the terms and conditions of the Creative Commons Attribution (CC BY) license (http://creativecommons.org/licenses/by/4.0/).
Share and Cite
MDPI and ACS Style
Müller, J.M. Comparing Technology Acceptance for Autonomous Vehicles, Battery Electric Vehicles, and Car Sharing—A Study across Europe, China, and North America. Sustainability 2019, 11, 4333. https://doi.org/10.3390/su11164333
AMA Style
Müller JM. Comparing Technology Acceptance for Autonomous Vehicles, Battery Electric Vehicles, and Car Sharing—A Study across Europe, China, and North America. Sustainability. 2019; 11(16):4333. https://doi.org/10.3390/su11164333
Chicago/Turabian StyleMüller, Julian M. 2019. "Comparing Technology Acceptance for Autonomous Vehicles, Battery Electric Vehicles, and Car Sharing—A Study across Europe, China, and North America" Sustainability 11, no. 16: 4333. https://doi.org/10.3390/su11164333
Note that from the first issue of 2016, this journal uses article numbers instead of page numbers. See further details here.