Article

Distribution and Management of Nutria (Myocastor coypus) Populations in South Korea

1
National Institute of Ecology, 1210 Geumgang-ro, Maseru-myeon, Seocheon-gun 33657, Korea
2
Department of Environmental and Occupational Health Sciences, University of Washington, Box 357234, Seattle, WA 98195, USA
3
Department of Life Sciences, Yeungnam University, 280 Daehak-Ro, Gyeongsan 38541, Korea
*
Authors to whom correspondence should be addressed.
Sustainability 2019, 11(15), 4169; https://doi.org/10.3390/su11154169
Submission received: 17 June 2019 / Revised: 24 July 2019 / Accepted: 31 July 2019 / Published: 1 August 2019

Abstract

:
In 2014, the South Korean government initiated the “Nutria Eradication Project” to actively manage and control populations of nutria, an invasive alien species that threatens national biodiversity. In the present study, we examined domestic nutria habitats in 2014 to 2018 and analyzed spatial shifts in habitat distribution to develop management policies and eradication strategies for the South Korean Ministry of Environment. A total of 27,487 nutria individuals were captured over five years upon the initiation of the eradication project. We found that the number of habitat tracks decreased from 1510 in 19 administrative districts in 2014 to 176 in 14 districts in 2018. We examined the distribution of nutria habitat tracks and found a northwestward shift at an average angle of 313.9° and 46,656.9 m. This distribution shift prompted improvements in control policies focused on nutria capture to suppress rodent movement and shifting distributions. We redefined the spatial scope of our control regions accordingly and established isolated environments in each region to prevent further spread. Additionally, resource management was focused in areas showing habitat expansion. Overall, we observed an estimated 54% decrease in nutria habitat tracks from 2016 to 2017. Our results have since been enacted in government policies and provide a basis for establishing flexible strategies for effectively controlling nutria habitats and populations. In 2017, the South Korean government allocated additional funds for research and for the development of further control strategies working toward the project’s goals.

1. Background

International trade is frequently accompanied by the migration of associated species. This increases the movement and settlement of invasive alien species, some of which can rapidly reproduce and disperse and thus adapt to new environments threatening the local biodiversity [1,2,3,4]. Combined with major factors affecting the global environment, such as climate change [5,6] or the destruction of wild habitats by human disturbance [7,8], invasive alien species further aggravate biodiversity loss. This negatively affects our ability to preserve both the global ecosystem and human society in terms of economic as well as environmental damage [9]. The threat of invasive alien species and their adverse effects is often continuous and long-lasting [10,11].
The nutria (Myocastor coypus Molina; also known as the coypu), a semiaquatic rodent native to South America, was initially transported to Europe, North America, Asia, and Africa to produce fur products and meat. Owing to a global decrease in demand for nutria products and consequent loss of economic value, nutria were released and have settled in the natural environment. Upon successful settlement in natural habitats, nutria have caused economic loss by damaging crops, forest trees, aquatic vegetation, and drainage systems [12,13,14]. Nutria are frequently found in nutrient-rich areas with plenty of water, such as river basins, riverbanks, wetlands, and coasts. As well as agricultural damage, their foraging and burrowing behaviors result in biodiversity loss by competing with indigenous species [15,16,17,18,19].
Nutria were first introduced to South Korea in 1985, when 100 nutria individuals were imported from France to produce fur and meat. The imported nutria died, owing to immature breeding methods and maintenance. In 1987, 60 nutria were imported from Bulgaria and were successfully bred domestically [20]. The nutria breeding industry in South Korea peaked in 2001 with over 470 farms breeding over 150,000 individuals. However, due to a subsequent reduction in demand, the industry gradually declined and, lacking proper management, nutria colonized the natural environment where they have continued to propagate (Figure 1).
Upon their discovery in six administrative districts around the Nakdong River basin in 2006, efforts were made by local governments to capture these nutria. However, their distribution had expanded to 13 districts by 2012, increasing the necessity for action by the central government [21]. The South Korean government organized a nutria eradication plan in response to public requests and in the face of increasing agricultural damage. In 2013, a pilot project was implemented in which 3349 nutria were captured, thus confirming the need for eradication. Incorporating the advice and management experience of an array of nutria eradication campaigns and population control specialists from the UK, Belgium, the Netherlands, and the US, the Nutria Eradication Project was established in 2014 with a budget of 9.5 million USD allocated by the South Korean government (Table 1).
The aim of the present study was to provide information regarding nutria habitat change based on nutria capture, and hence offer guidelines for nutria eradication. The ultimate goal of the project was to preserve national biodiversity and mitigate the damage caused by nutria. Herein, we present the results of the eradication project thus far, including domestic distribution and spatiotemporal patterns and to provide suggestions for strategic improvements to policies and directions for nutria population control.

2. Methods

2.1. Survey Areas

Field surveys were conducted in spring, late autumn, and winter from March 2014 to December 2018 with a total of 95 wildlife specialists over more than 42 weeks a year. According to pilot studies which investigated initial nutria distribution and habitats from the South Korean Ministry of Environment reports [22,23] and the published literature [20,21] investigation sites represented 243 administrative districts. Based on this information, all areas of the Nakdong River basin, drainage texture, surrounding lakes downstream of the Namhan River, and all areas of Jeju Island were surveyed (Figure 2).
The Nakdong River basin is between 127°29′ E and 129°19′ E and between 35°03′ N and 37°13′ N. The river runs ~510 km through a catchment area of ~23,384 km2, which constitutes ~24% of the Korean peninsula. Multipurpose dams, riverbanks, and well-developed estuaries, including small-scale reservoirs and wetlands are also widely distributed in this area. The temperature during the winter ranges from –3 °C to 2 °C, which is milder than other regions on the Korean peninsula. In the summer, the temperature is fairly uniform ranging from 25–26 °C. The Chungjuho, an artificial lake located downstream of Namhan River with an area of 67.5 km2 and one of our survey locations, was in the region between 127°50′ E and 128°20′ E and 36°50′ N and 37°05′ N. The city of Jeju in Jeju Island is situated in the regions between 126°08′ E and 126°58′ E and 33°06′ N to 34°00′ N. There are 73 streams on Jeju Island with fairly stagnant water flowing over basalt beds.

2.2. Nutria Distribution Survey

All surveyors traveled on foot over the river basin of the target areas with a walking speed of less than 2 km/h to check for dens, footprints, feces, as well as direct observation of the animals [21,24]. All observations were recorded with coordinates (WGS84) obtained by GPS (GPS V; Garmin Inc.). The coordinate information for the observed habitat tracks within an area of 0.01 km2 were summarized and represented as one ‘habitat track’ on a map using ArcGIS ArcMap 10.3.1 [25].

2.3. Spatial Analysis of Nutria Habitat Shifts

Shifts in habitat track distributions were analyzed using the surveyed habitat coordinates. Linear directional mean values were used to analyze the spatial habitat distributions and their changes over time. The analytical methods used to determine the directional distribution and linear directional mean of habitats followed those of Mitchell, using tools in ArcGIS ArcMap 10.3.1 [26].
The habitat directional changes were evaluated by analyzing the distribution of points on a map to create the standard deviational ellipse (SDE), which represented the spatial standard deviation of distances of nutria habitats from a reference pivot point [27]. The SDE can be a range of different shapes, such as circular, oval, and flattened circles. The standard deviation of distances was calculated by accounting for the distances between analytic units from a pivot point using the weights of each indicator and weights of each coordinate. By comparing the distances of the standard deviation of the calculated minor axis (Y-axis) and the major axis (X-axis), the distances of the yearly habitat trace distributions were obtained.
Overall changes in habitat track distribution were identified using the pivot points of the SDE and the values of the axial changes. To analyze the linear directional distribution of habitats, the average linear directional distance values were calculated to provide overall information about the shift in the SDE. In our study, the pivot points of nutria habitats found in surveys each year were connected to identify the directions of spatial habitat shifts.

3. Results

3.1. Nutria Eradication Project in South Korea

The South Korean Nutria Eradication Project is operated by a common cooperative system involving 18 organizations with different roles, including the National Institute of Ecology, which is part of the Ministry of Environment; local environmental agencies; and local governments (Figure 3). The Ministry of Environment runs the strategic administrative committee to establish relevant policies and implement plans, and the National Institute of Ecology specifically operates an advisory group to develop strategies for population control through scientific assessment of habits, distribution, propagation, and population size.
The local environmental agencies responsible for managing river basins each employ nutria capture specialists for continuous control throughout the year. Local governments manage a monetary reward system to encourage the public to capture nutria and are responsible for eradicating nutria in residential areas. The nutria eradication actors have improved capture efficiency by deploying strategic arrangements of cage traps, controlling capture through the use of GIS programs, and standardizing control activities.
In a five-year period, a total of 27,487 nutria were caught: 7864 in 2014, 6786 in 2015, 5475 in 2016, 5432 in 2017, and 1930 in 2018, resulting in a decreased trend in the observed number of habitat tracks (Table 2). The Ministry of Environment annually monitors the changes in nationwide nutria habitats as part of the eradication project and also evaluates performance to improve efficiency.

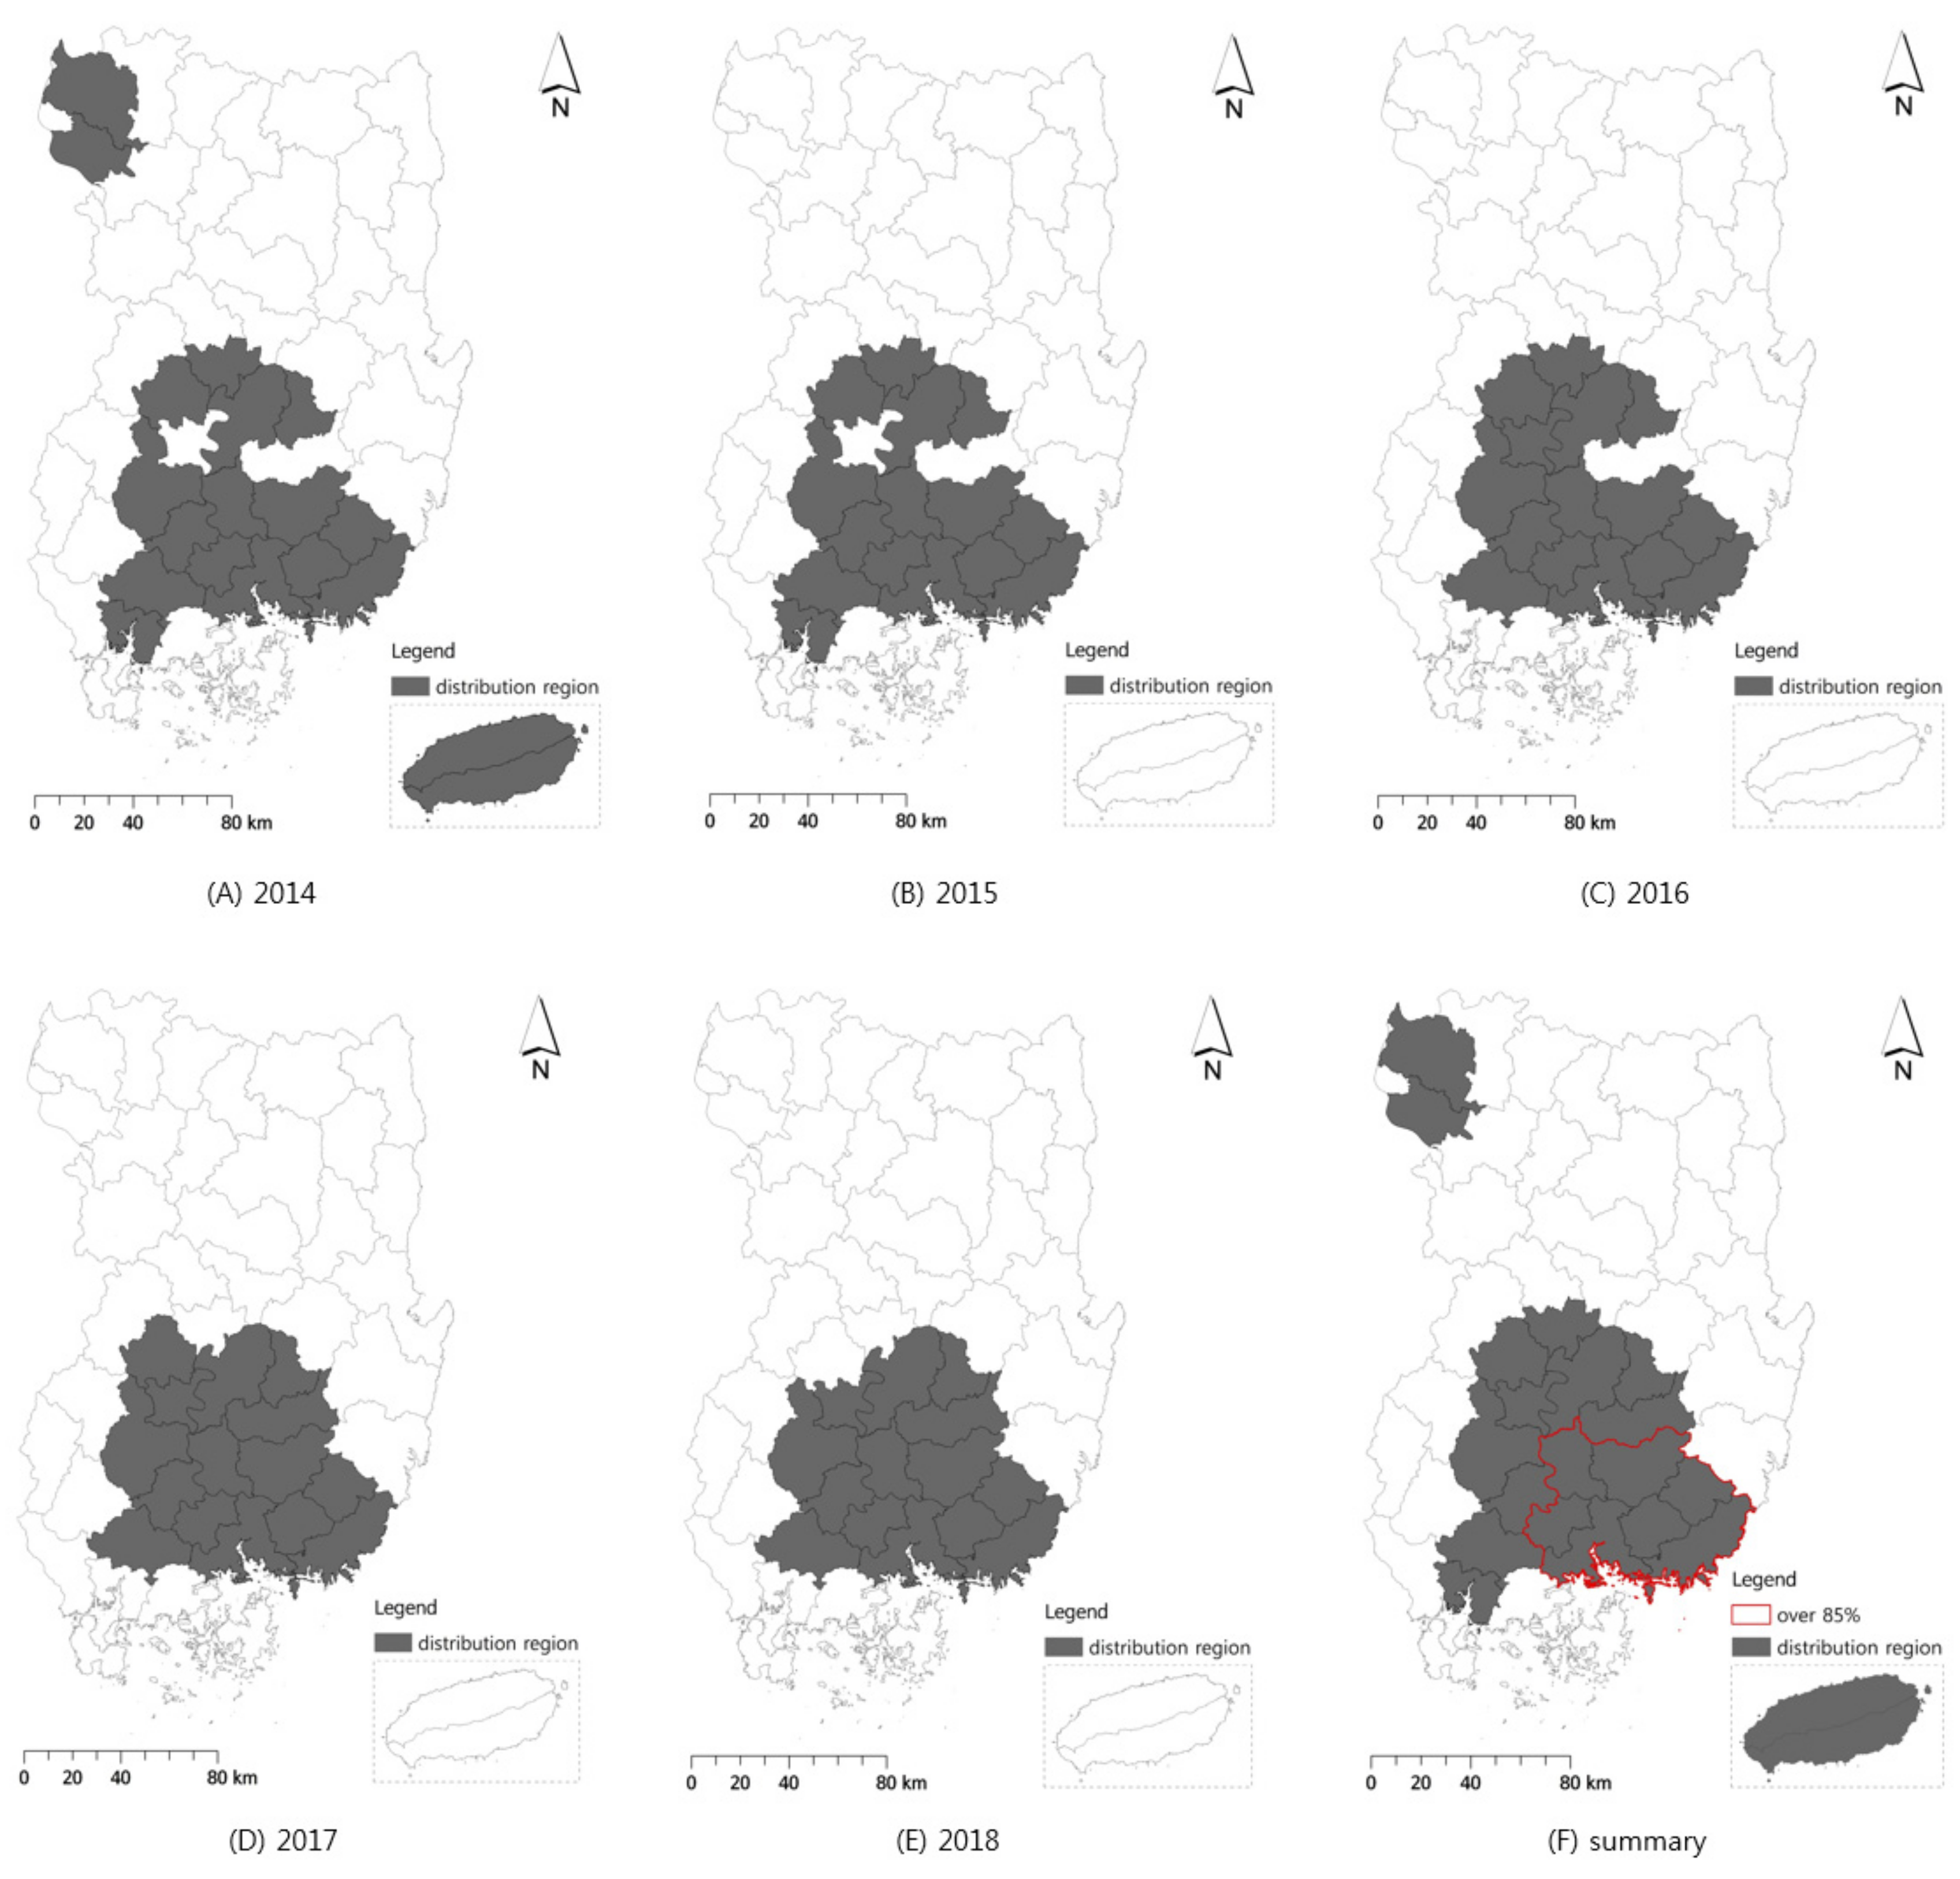
3.2. Nutria Distribution in South Korea

Since 2014, the National Institute of Ecology has investigated the domestic distribution of nutria populations and habitat tracks. The results have been used as baseline data for the overall eradication project. In 2014, nutria habitat tracks were detected in 19 local administrative districts, i.e., 2 in Chungcheongbuk-do Province, 2 in the Jeju Island, and 15 in local administrative districts, including Busan Metropolitan City downstream of the Nakdong River and Daegu Metropolitan City in the midstream regions of the Nakdong River. Nutria habitat tracks were detected in 15 local administrative districts in 2015–2017 and 14 in 2018, the latter covering the mid- and downstream regions of the Nakdong River (Figure 4). Notably, we observed an estimated 54% decrease in nutria habitat tracks between 2016 and 2017 (Figure 5). This decreasing trend in habitat tracks continues to be observed, thus showing progress in eradication.

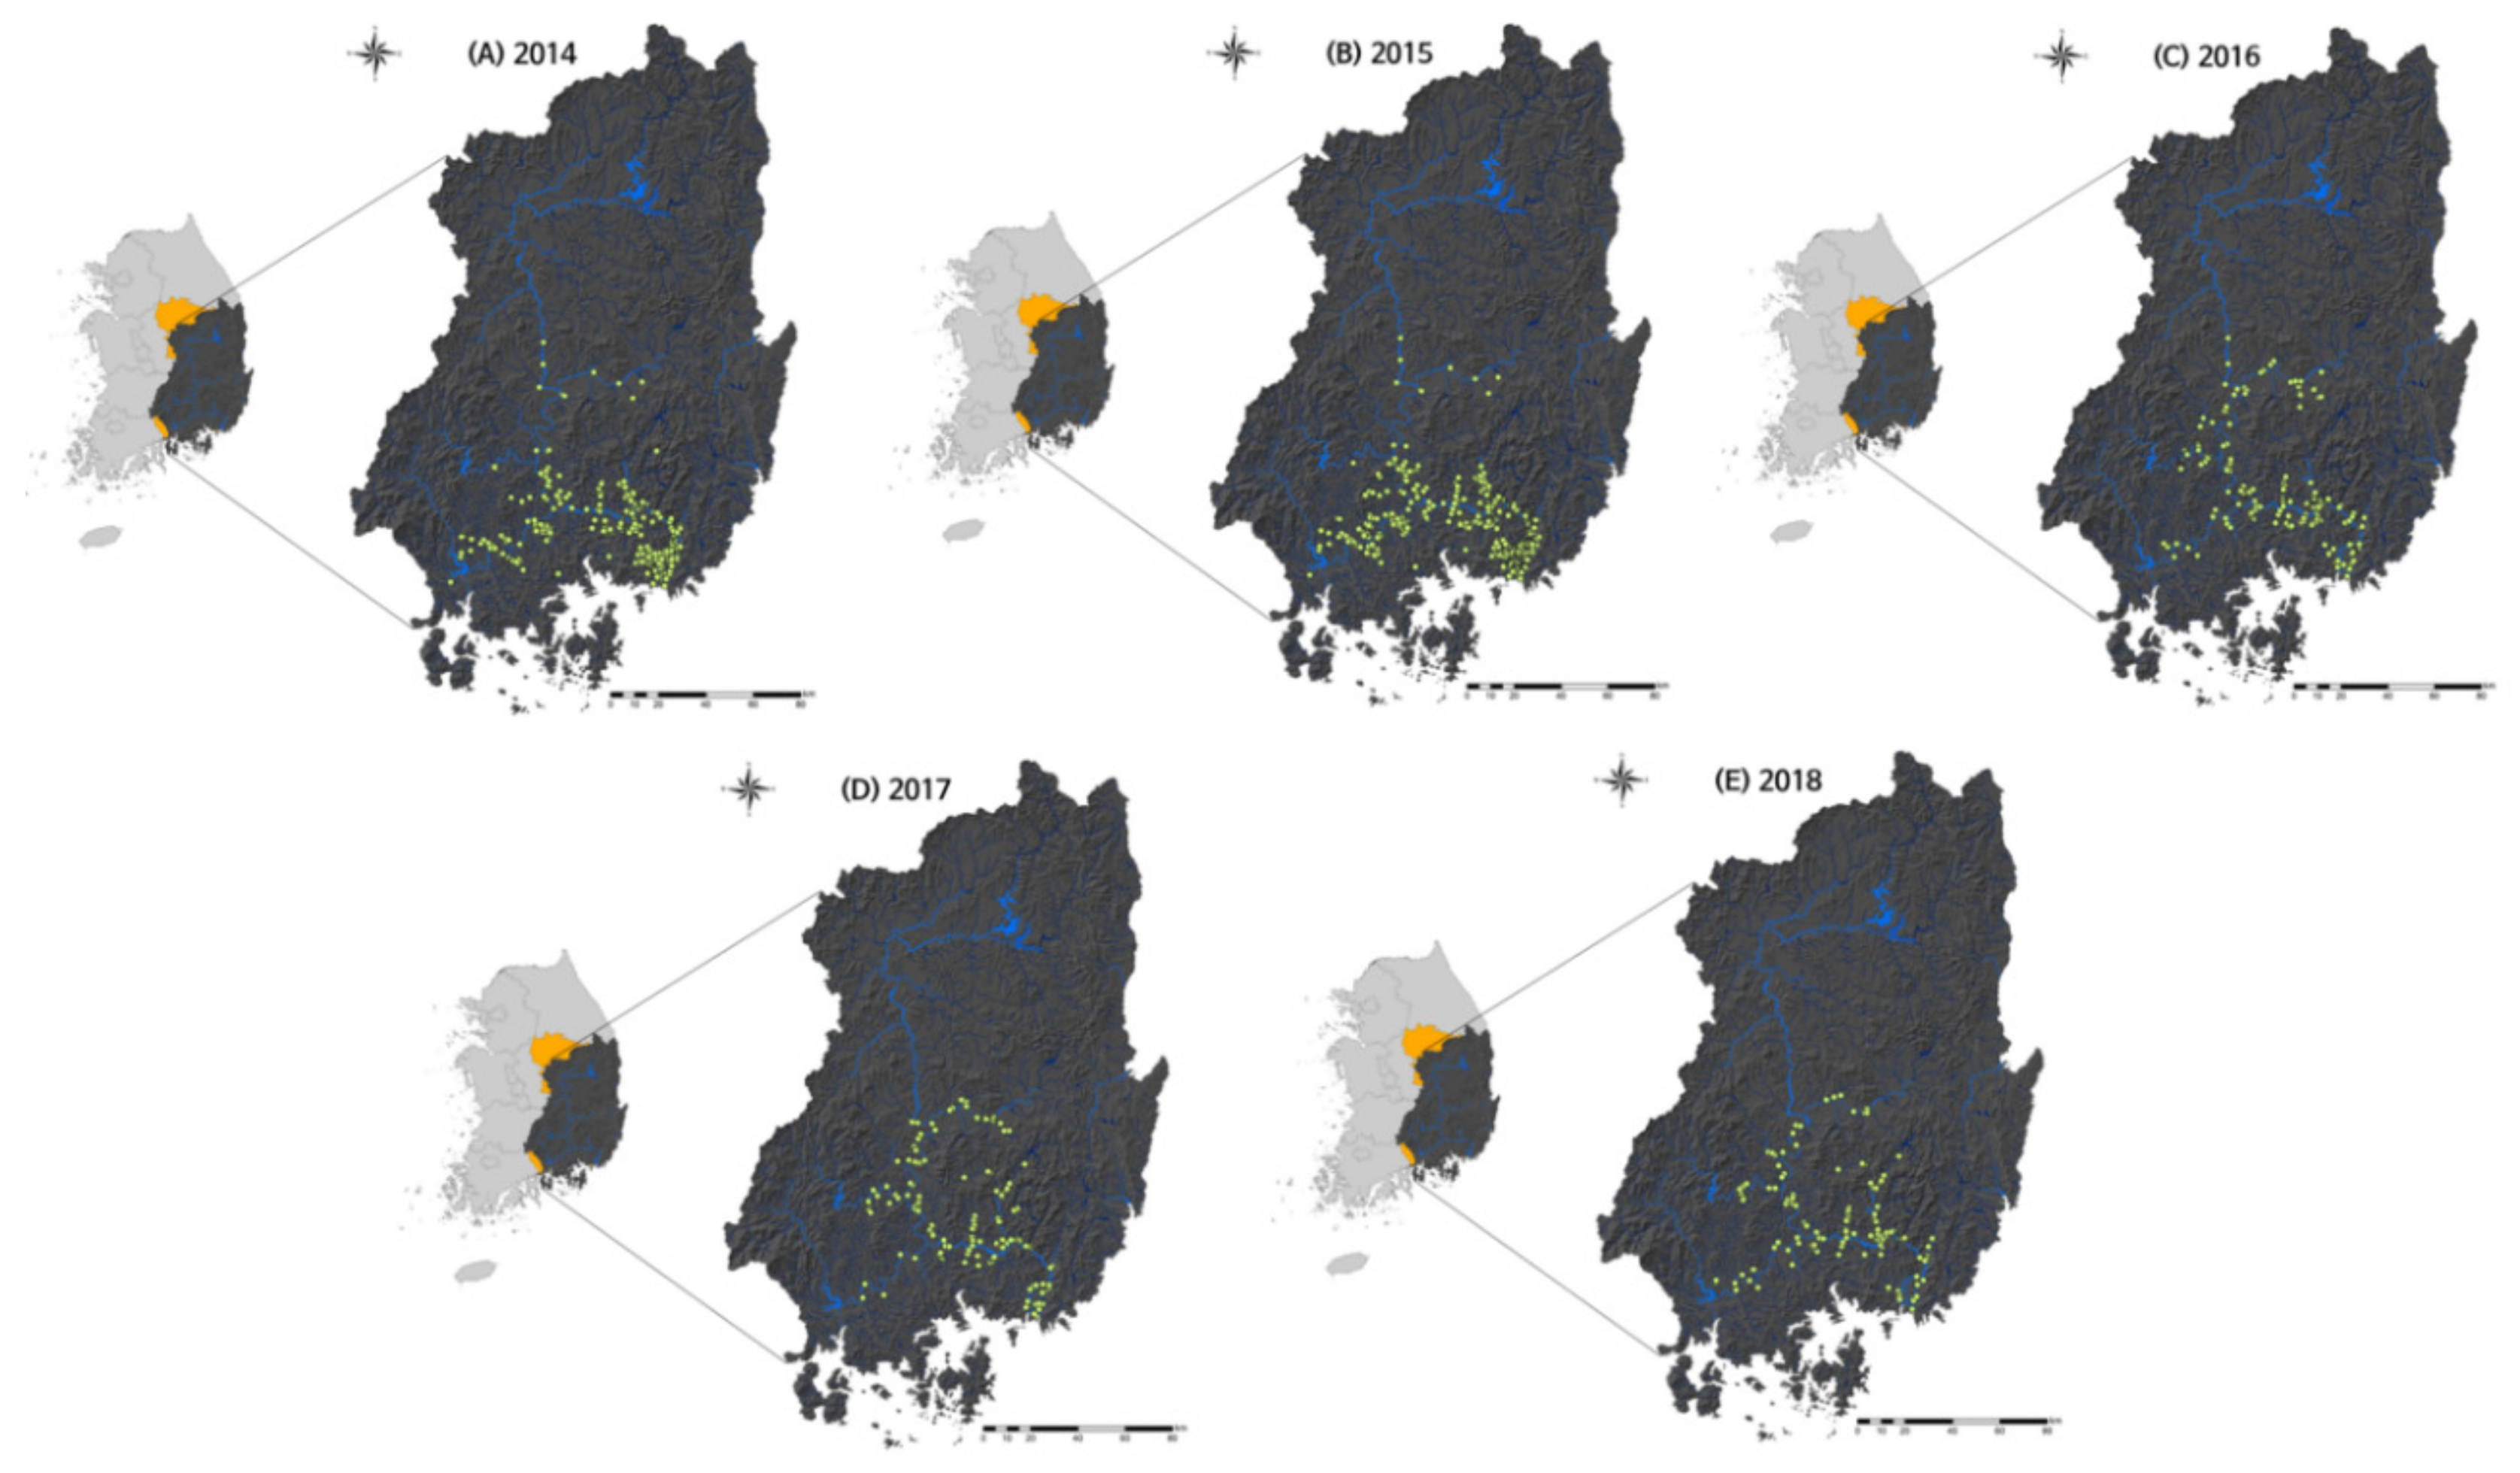
3.3. Habitat Changes in the Nakdong River Basin

To analyze shifts in nutria distribution in the Nakdong River basin, nutria habitat track numbers (1510 in 2014; 1451 in 2015; 526 in 2016; 235 in 2017; and 176 in 2018) were used (Figure 5). The SDEs in 2014 and 2015 were similarly formed by central points around the Nakdong River basin. In 2016, the minor axis of the SDE increased from 16,873.0–27,324.1 m and the central point moved northwestward. Although the SDEs in 2016 and 2017 were similar, in 2017, the major axis shifted northward, resulting in a longer ellipse. In 2018, the major axis was elongated and tilted eastward, and the minor axis decreased from 27,324.1–23,959.0 m. Overall, the change in nutria habitat track distribution moved 46,656.9 m north-northwestward (313.9°).

4. Discussion

Nutria populations were locally managed after the species was designated as invasive by the national government in 2009. Since the South Korean Ministry of Environment initiated the Nutria Eradication Project in 2014, nutria populations have been controlled at the national level. The eradication project, in collaboration with local eradication teams, controls all areas of the Nakdong River basin and utilizes habitat information reported by the National Institute of Ecology to capture nutria individuals and control populations. Moreover, the project facilitates the participation of citizens by providing incentives for presenting captured nutria to local governments.
As of 2018, the distribution of nutria habitat tracks was observed to be limited to 14 administrative districts of the Nakdong River (Figure 4). The number of nutria habitat tracks were similar in 2014 and 2015; however, they have declined rapidly since 2016. Although the number of nutria habitat tracks have decreased, they still inhabit the area around the Nakdong River basin, despite ongoing management efforts.
Excluding the Nakdong River basin in 2014, no habitat tracks have been found in the local districts of Chungcheongbuk-do and Jeju Island, where nutria habitat tracks were previously recorded. An analysis of nationwide nutria habitat changes predicted that nutria would be limited to the mid- and downstream areas of the Nakdong River based on the low winter temperatures and suggested that it would be unlikely for nutria populations to propagate beyond the river basin [24]. In addition, previous studies that investigated nutria distributions in South Korea reported that populations were concentrated around the mid- and downstream areas of the Nakdong River and would fail to settle in other major rivers [21,23]. For many invasive alien species, temperature is a potential limiting factor. In particular, nutria are vulnerable to cold winters, and thus nutria tend to propagate rapidly in areas with mild winters. However, in sustained cold weather, they fail to reproduce and often die [28,29]. Furthermore, natural disasters, frequent variation in water levels, and pressure from capture efforts negatively affect the settlement of nutria populations [30,31,32,33,34].
In 2014 and 2015, half of all identified habitats were concentrated in the estuaries of the Nakdong River (Figure 5). In 2016, we found that the nutria habitats spread to the drainage textures, near the inlets of the river. Furthermore, based on spatial habitat distribution surveys, we found that the habitat distributions shifted northwestward (Table 3). These results strongly suggested that the distribution shift in the Nakdong River basin had occurred by a change in the concentrated eradication area through diversification of nutria management strategy. The Nakdong River basin waterways are interconnected in a net-like form in which nutria can move freely [21,24]. However, rather than establishing strategies in these net-like areas, capture activities have been carried out independently in respective regions, neglecting this observation. Studies of the management of nutria populations in Italy report that control measures in isolated areas result in complete eradication, whereas similar measures are ineffective in areas with high mobility and infiltration of nutria [35,36]
Habitat reduction in concentrated areas was identified in 2014 and 2015, with expansion into habitats of nearby regions (Figure 5), and data on the directional distribution of nutria habitats were useful for the development of improved strategies and control measures. These results also provide guidelines for improvement, such as the additional allocation of resources to regions that require more focused control measures, liaison reinforcements for field teams, and nutria interception efforts in managed areas (Table 2). Therefore, we improved local control strategies based on the habitat in each area, changes in nutria habitats in each drainage texture, and shifts in habitat distributions. Specifically, management areas were redefined and reassigned to capture teams based on recent distribution information.
Focusing resources on concentrated areas and maintaining continuous capture efforts were shown to be important factors for a successful eradication campaign in the UK [37]. Similarly, all control areas were equipped with cage traps to intercept the nutria movement routes and to construct isolated environments. The amount of effort for nutria capture was maintained at previous levels. In areas where nutria habitats were concentrated or showed propagation, additional resources were intensively allocated to control the population.
These improvements in nutria population control strategies for the Nutria Eradication Project in 2017 and 2018 resulted in decreases in nutria habitat track numbers (Figure 5). From 2014–2018, 27,487 nutria were captured, effectively managing the population by implementing and then improving the Nutria Eradication Project in South Korea.
In an effort to develop new eradication technologies and models to predict population changes, the South Korea Ministry of Environment allocated an additional 4 million USD in 2017. To eradicate invasive alien species, such as the nutria, long-lasting efforts and policy support are essential. We are closely monitoring nutria habitat tracks and using the information to improve the efficiency of control strategies by developing advanced scientific techniques. Our efforts are expected to contribute to the preservation of national biological resources and biodiversity through the recovery of natural ecosystems damaged by nutria.

Author Contributions

D.-H.L. and J.R.L.; Conceptualization, D.-H.L. and J.R.L.; methodology, Y.-C.K., A.K. and J.L.; validation, Y.-C.K., A.K., J.R.L. and D.-H.L.; formal analysis, Y.-C.K., S.-G.P., M.K., T.-S.K. and D.-H.L.; investigation, Y.-C.K., A.K. and J.L.; resources, Y.-C.K., J.R.L. and D.-H.L.; data curation, Y.-C.K., J.R.L. and D.-H.L.; writing—original draft preparation, Y.-C.K., J.L., J.R.L. and D.-H.L.; writing—review and editing, Y.-C.K., T.-S.K., J.R.L. and D.-H.L.; visualization, J.-H.L., J.R.L. and D.-H.L.; supervision, Y.-C.K., J.R.L. and D.-H.L.; project administration, J.R.L. and D.-H.L.; funding acquisition.

Funding

This research was supported by a grant from the Korea Environment Industry & Technology Institute [201800227001] funded by the Ministry of Environment, and the National Institute of Ecology (NIE-A-2019-12), funded by the Ministry of Environment in Republic of Korea.

Conflicts of Interest

The authors declare no conflict of interest.

References

  1. Adams, V.M.; Douglas, M.M.; Jackson, S.E.; Scheepers, K.; Kool, J.T.; Setterfield, S.A. Conserving biodiversity and Indigenous bush tucker: Practical application of the strategic foresight framework to invasive alien species management planning. Conserv. Lett. 2018, 11, e12441. [Google Scholar] [CrossRef] [Green Version]
  2. Bosso, L.; De Conno, C.; Russo, D. Modelling the risk posed by the zebra mussel Dreissena polymorpha: Italy as a case study. Environ. Manag. 2017, 60, 304–313. [Google Scholar] [CrossRef] [PubMed]
  3. Brown, P.M.J.; Roy, D.B.; Harrower, C.; Dean, H.J.; Rorke, S.L.; Roy, H.E. Spread of a model invasive alien species, the harlequin ladybird Harmonia axyridis in Britain and Ireland. Sci. Data 2018, 5, 180239. [Google Scholar] [CrossRef] [PubMed]
  4. Convention on Biological Diversity (CBD). Alien Species That Threaten Ecosystems, Habitat or Species. 2002. Available online: https://www.cbd.int/decision/cop/default.shtml?id=7197 (accessed on 12 March 2018).
  5. Huang, Z.; Footitt, S.; Tang, A.; Finch-Savage, W.E. Predicted global warming scenarios impact on the mother plant to alter seed dormancy and germination behaviour in Arabidopsis. Plant Cell Environ. 2018, 41, 187–197. [Google Scholar] [CrossRef] [PubMed]
  6. Razgour, O.; Taggart, J.B.; Manel, S.; Juste, J.; Ibanez, C.; Rebelo, H.; Alberdi, A.; Jones, G.; Park, K. An integrated framework to identify wildlife populations under threat from climate change. Mol. Ecol. Resour. 2018, 18, 18–31. [Google Scholar] [CrossRef]
  7. Bosso, L.; Ancillotto, L.; Smeraldo, S.; D’Arco, S.; Migliozzi, A.; Conti, P.; Russo, D. Loss of potential bat habitat following a severe wildfire: A model based rapid assessment. Int. J. Wildland Fire 2018, 27, 756–769. [Google Scholar] [CrossRef]
  8. Johnson, M.F.; Karanth, K.K.; Weinthal, E. Compensation as a policy for mitigating human-wildlife conflict around four protected areas in Rajasthan, India. Conserv. Soc. 2018, 16, 305–319. [Google Scholar] [CrossRef]
  9. Wilcove, D.S.; Rothstein, D.; Dubow, J.; Phillips, A.; Losos, E. Quantifying threats to imperiled species in the United States. Bioscience. BioScience 1998, 48, 607–615. [Google Scholar] [CrossRef]
  10. Cronk, Q.C.B.; Fuller, J.L. Plant Invaders: The Threat to Natural Ecosystems; Chapman & Hall: London, UK, 1995. [Google Scholar]
  11. Zietsman, L. Observations on Environmental Change in South Africa; SUN Media: Stellenbosch, South Africa, 2011. [Google Scholar]
  12. Carter, J.; Leonard, B.P. A review of the literature on the worldwide distribution, spread of, and efforts to eradicate the coypu (Myocastor coypus). Wildl. Soc. Bull. 2002, 30, 162–175. [Google Scholar]
  13. Bertolino, S.; Genovesi, P. Semiaquatic Mammals Introduced into Italy: Case Studies in Biological Invasion. In Biological Invaders in Inland Waters: Profiles Distribution and Threats; Gherardi, F., Ed.; Springer: Berlin, Germany, 2007; pp. 175–191. [Google Scholar]
  14. Bertolino, S.; Viterbi, R. Long-term cost-effectiveness of coypu (Myocastor coypus) control in Piedmont (Italy). Biol. Invasions 2010, 12, 2549–2558. [Google Scholar] [CrossRef]
  15. Linscombe, G.; Kinler, N.; Wright, V. Nutria population density and vegetative changes in brackish marsh in coastal Louisiana. In Worldwide Furbearer Conference Proceedings; Chapman, J.A., Pursley, D., Eds.; Worlwide Furbearer Conference Inc.: Frostburg, MA, USA, 1981; pp. 129–141. [Google Scholar]
  16. Taylor, K.L.; Grace, J.B.; Marx, B.D. The effects of herbivory on neighbor interactions along a coastal marsh gradient. Am. J. Bot. 1997, 84, 709–715. [Google Scholar] [CrossRef] [PubMed]
  17. Carter, J.; Foote, A.L.; Johnson-Randall, A. Modeling the effects of nutria (Myocastor coypus) on wetland loss. Wetlands 1999, 19, 209–219. [Google Scholar] [CrossRef]
  18. Panzacchi, M.; Cocchi, R.; Genovesi, P.; Bertolino, S. Population control of coypu Myocastor coypus in Italy compared to eradication in UK: A cost-benefit analysis. Wildl. Biol. 2007, 13, 159–171. [Google Scholar] [CrossRef]
  19. Bertolino, S.; Angelici, C.; Monaco, E.; Monaco, A.; Capizzi, D. Interactions between Coypu (Myocastor coypus) and bird nests in three mediterranean wetlands of central Italy. Hystrix 2011, 22, 333–339. [Google Scholar] [CrossRef]
  20. Lee, D.H.; Kil, J.; Yang, G. Ecological Characteristics for the Sustainable Management of Nutria (Myocastor coypus) in Korea; National Institute of Environmental Research: Incheon, Korea, 2012. Available online: http://webbook.me.go.kr/DLi-File/NIER/09/018/5512304.pdf (accessed on 8 March 2018).
  21. Lee, D.H.; Kil, J.; Kim, D.E. The Study on the Distribution and Inhabiting Status of Nutria (Myocastor coypus) in Korea. Korean J. Environ. Ecol. 2013, 27, 316–326. [Google Scholar]
  22. Kil, J.; Kim, Y.; Kim, D.; Kim, H.; Lee, D.; Hwang, S.; Lee, C.; Yang, G. Monitoring of Invasive Alien Species Designated by the Wildlife Protection Act (VI); National Institute of Environmental Research: Incheon, Korea, 2012. Available online: http://webbook.me.go.kr/DLi-File/NIER/06/016/5560070.pdf (accessed on 28 March 2018).
  23. Kil, J.; Kim, Y.; Kim, D.; Kim, H.; Lee, D.; Hwang, S.; Kim, S.; Lee, J.; Baek, W.; Park, H.; et al. Monitoring of Invasive Alien Species Designated by the Wildlife Protection Act (VII); National Institute of Environmental Research: Incheon, Korea, 2013. Available online: http://webbook.me.go.kr/DLi-File/NIER/06/020/5570342.pdf (accessed on 29 March 2018).
  24. Hong, S.; Do, Y.; Kim, J.Y.; Kim, D.K.; Joo, G.J. Distribution, spread and habitat preferences of nutria (Myocastor coypus) invading the lower Nakdong River, South Korea. Biol. Invasions 2015, 17, 1485–1496. [Google Scholar] [CrossRef]
  25. Kim, A.; Kim, Y.C.; Lee, D.H. A Management Plan According to the Estimation of Nutria (Myocastor coypus) Distribution Density and Potential Suitable Habitat. Korea Sci. 2018, 27, 203–214. [Google Scholar] [CrossRef]
  26. Mitchell, A. The ESRI Guide to GIS Analysis; ESRI Press: Redlands, CA, USA, 2005; Volume 2. [Google Scholar]
  27. An, Y.; Lee, S. A study on the construction of spatial database and the characteristics of relocation for the relocated firms by industrial types. J. Korea Plan. Assoc. 2014, 49, 17–28. [Google Scholar] [CrossRef]
  28. Gosling, L.M.; Baker, S.J.; Skinner, J.R. A Simulation Approach to Investigating the Response of a Coypu Population to Climatic Variation. EPPO Bull. 1983, 13, 183–192. [Google Scholar] [CrossRef]
  29. Reggiani, G.; Boitani, L.; De Stefano, R. Population dynamics and regulation in the coypu Myocastor coypus in central Italy. Ecography 1995, 18, 138–146. [Google Scholar] [CrossRef]
  30. Gosling, L.M.; Baker, S.J. Planning and monitoring an attempt to eradicate coypus from Britain. In Symposia of the Zoological Society of Lodon; Clarendon Press Oxford: Oxford, UK, 1987; Volume 58, pp. 99–113. Available online: https://www.researchgate.net/profile/Leonard_Gosling/publication/284044063_Planning_and_monitoring_an_attempt_to_eradicate_coypus_from_Britain/links/577e261c08aeaa6988b09136/Planning-and-monitoring-an-attempt-to-eradicate-coypus-from-Britain.pdf (accessed on 3 September 2018).
  31. Gosling, L.M.; Baker, S.J.; Clarke, C.N. An attempt to remove coypus (Myocastor coypus) from a wetland habitat in East Anglia. J. Appl. Ecol. 1988, 25, 49–62. [Google Scholar] [CrossRef]
  32. Cocchi, R.; Riga, F. Linee Guida per il Controllo Della Nutria (Myocastor coypus); Istituto Nazionale per la Fauna Selvatica “Alessandro Ghigi”: Bologna, Italy, 2001. [Google Scholar]
  33. Bertolino, S.; Perrone, A.; Gola, L. Effectiveness of coypu control in small Italian wetland areas. Wildl. Soc. Bull. 2005, 33, 714–720. [Google Scholar] [CrossRef]
  34. Hogue, J.; Mouton, E. Coastwide Nutria Control Program 2011–2012. 2015. Available online: http://nutria.com/uploads/1112CNCPfinalreport_FINAL2.pdf (accessed on 21 June 2018).
  35. Reeves, S.A.; Usher, M.B. Application of a diffusion model to the spread of an invasive species: The coypu in Great Britain. Ecol. Model. 1989, 47, 217–232. [Google Scholar] [CrossRef]
  36. Velatta, F.; Ragni, B. La popolazione di nutria Myocastor coypus del lago Trasimeno. Consistenza, struttura e controllo numerico. Atti II Convegno Nazionale dei Biologi della Selvaggina, Suppl. Ric. Biol. Selvaggina 1991, 19, 311–326. [Google Scholar]
  37. Baker, S.J. Control and eradication of invasive mammals in Great Britain. Revue Sci. Tech. 2010, 29, 311–327. [Google Scholar] [CrossRef]
Figure 1. Overview of invasive nutria colonization timeline in South Korea. (a) Animals actively farmed, (b) cessation of active breeding, (c) colonization of natural habitats, (d) agricultural damage.
Sustainability 11 04169 g001
Figure 2. Surveyed nutria distribution areas in South Korea.
Sustainability 11 04169 g002
Figure 3. Cooperative system and responsibilities of governmental and local institutions organized for the control of nutria populations.
Sustainability 11 04169 g003
Figure 4. Changes in the distribution of nutria in each local administrative district from 2014 to 2018. The gray region represents the distribution area in which the nutria habitat tracks were observed. (F) The summary shows the distribution of nutria in all administrative districts from 2014 to 2018. The red line indicates the area in which over 85% of the habitat track numbers were observed.
Sustainability 11 04169 g004
Figure 5. Distribution of nutria habitat tracks in the Nakdong River basin (2014–2018) in (A) 2014, (B) 2015, (C) 2016, (D) 2017, and (E) 2018. Blue lines: streams; Orange regions: Survey areas; Green dots: Habitat tracks; dark gray: The Nakdong River basin.
Sustainability 11 04169 g005
Table 1. Cases and changes in management strategy of nutria in South Korea from 1985 to 2013.
Level of ControlPeriodNo. of Individuals CapturedDistribution of Nutria Habitats and Population Control Strategies
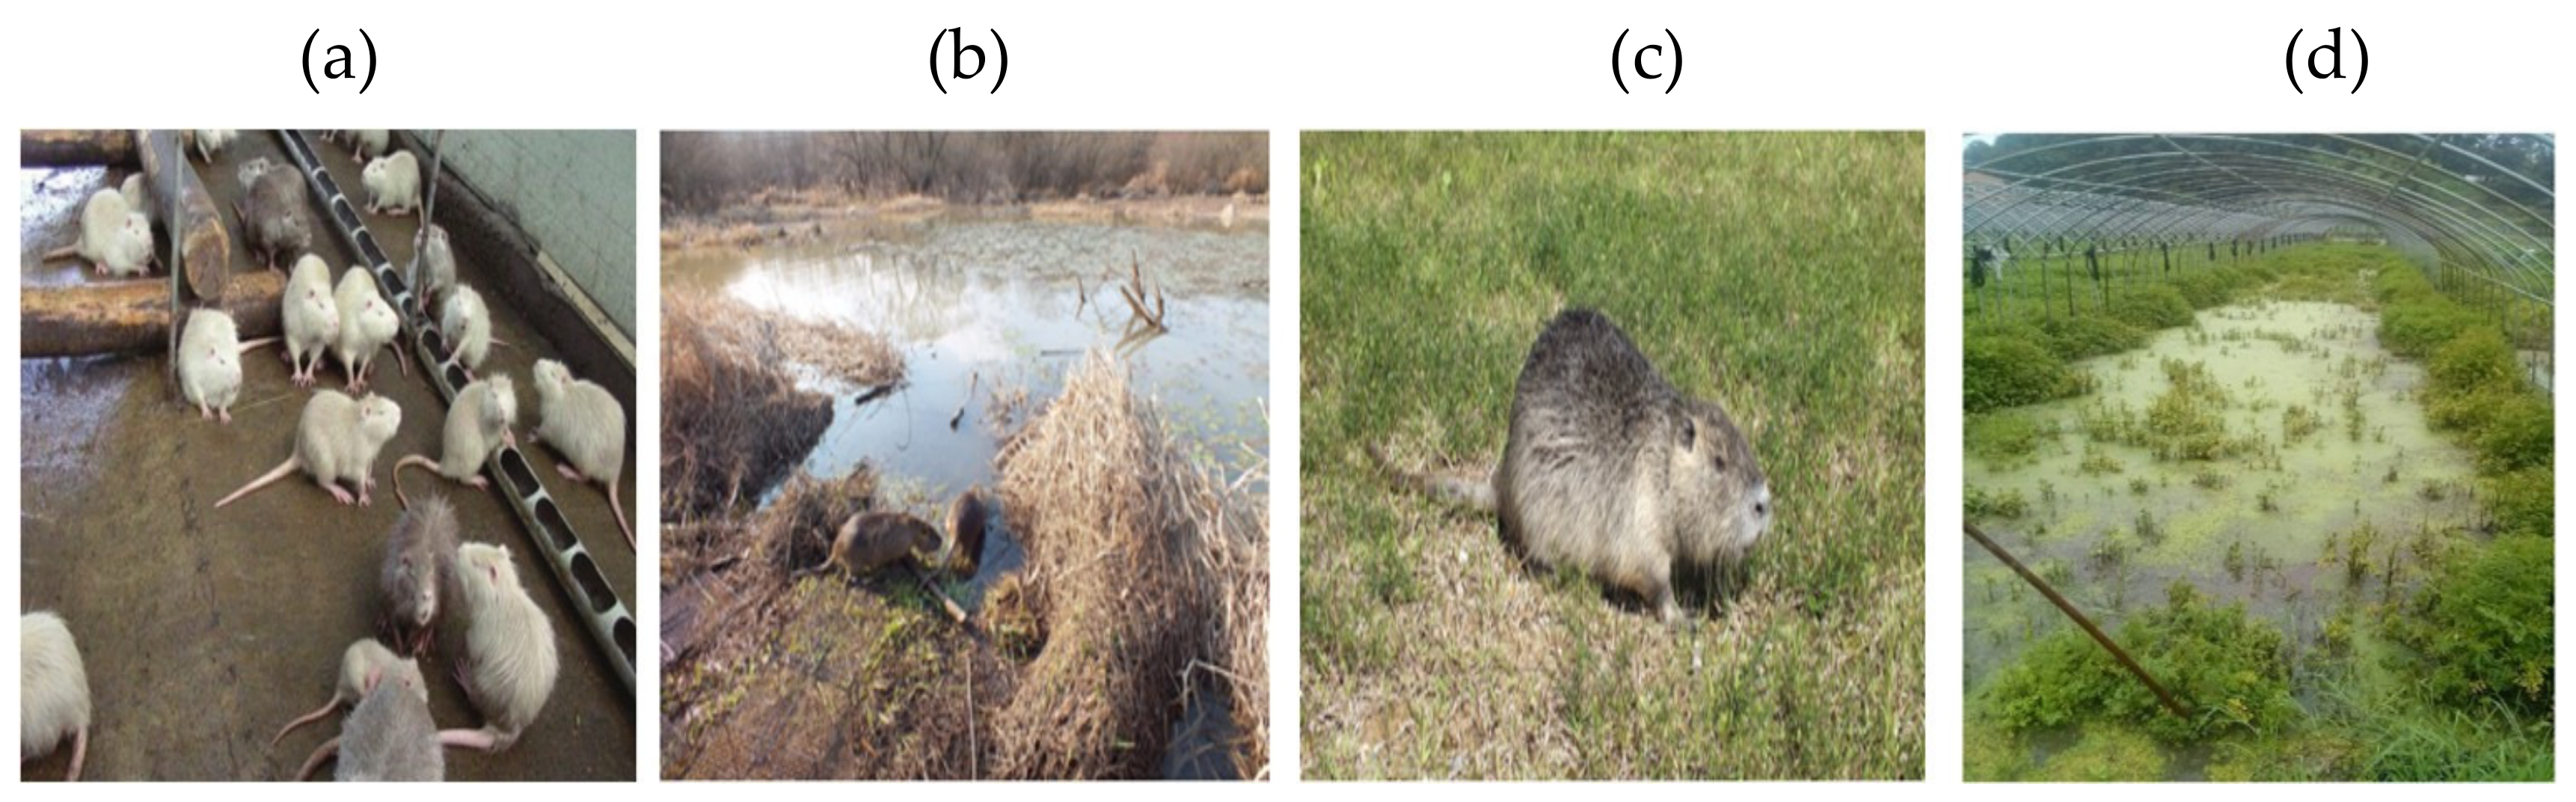
Nutria escaped from breeding farms; local control of population of nutria 1985–2001No nutria capture efforts1985: Nutria were imported from France for the first time; all perished due to immature breeding techniques;
1987: 100 individuals were imported from Bulgaria and distributed domestically in farms;
1999: First case report of nutria escaped from their breeding environment; Settled populations discovered in the Woopo Swamp in the Nakdong River basin;
2001: 150000 nutria individuals were bred in 450 domestic farms
2006No nutria capture effortsAbandonment of nutria breeding increased owing to decreased economic value;
Identification of nutria habitats in six local administrative districts in the Nakdong River basin
2009–2011581Nutria was designated as an invasive alien species by national law;
Local governments were obliged to control the nutria population in regions designated for the preservation of natural ecosystems;
Occasional allocation of limited resources for the control of nutria;
Composite use of guns and traps were used to capture nutria
20121135Nutria populations expanded to 13 domestic administrative districts [21];
Rapid propagation of nutria in the Nakdong River basin was detected
20133349Increase in requests from the public, including farmers and citizens, to remove nutria;
Implementation of a pilot project to remove and control nutria populations;
The Nutria Eradication Program was established within the National Plan to Control Invasive Alien Species
Table 2. Cases and changes in management strategy of nutria in South Korea from 2014 to 2018.
Level of ControlPeriodNumber of Individuals CapturedDistribution of Nutria Habitats and Population Control Strategies
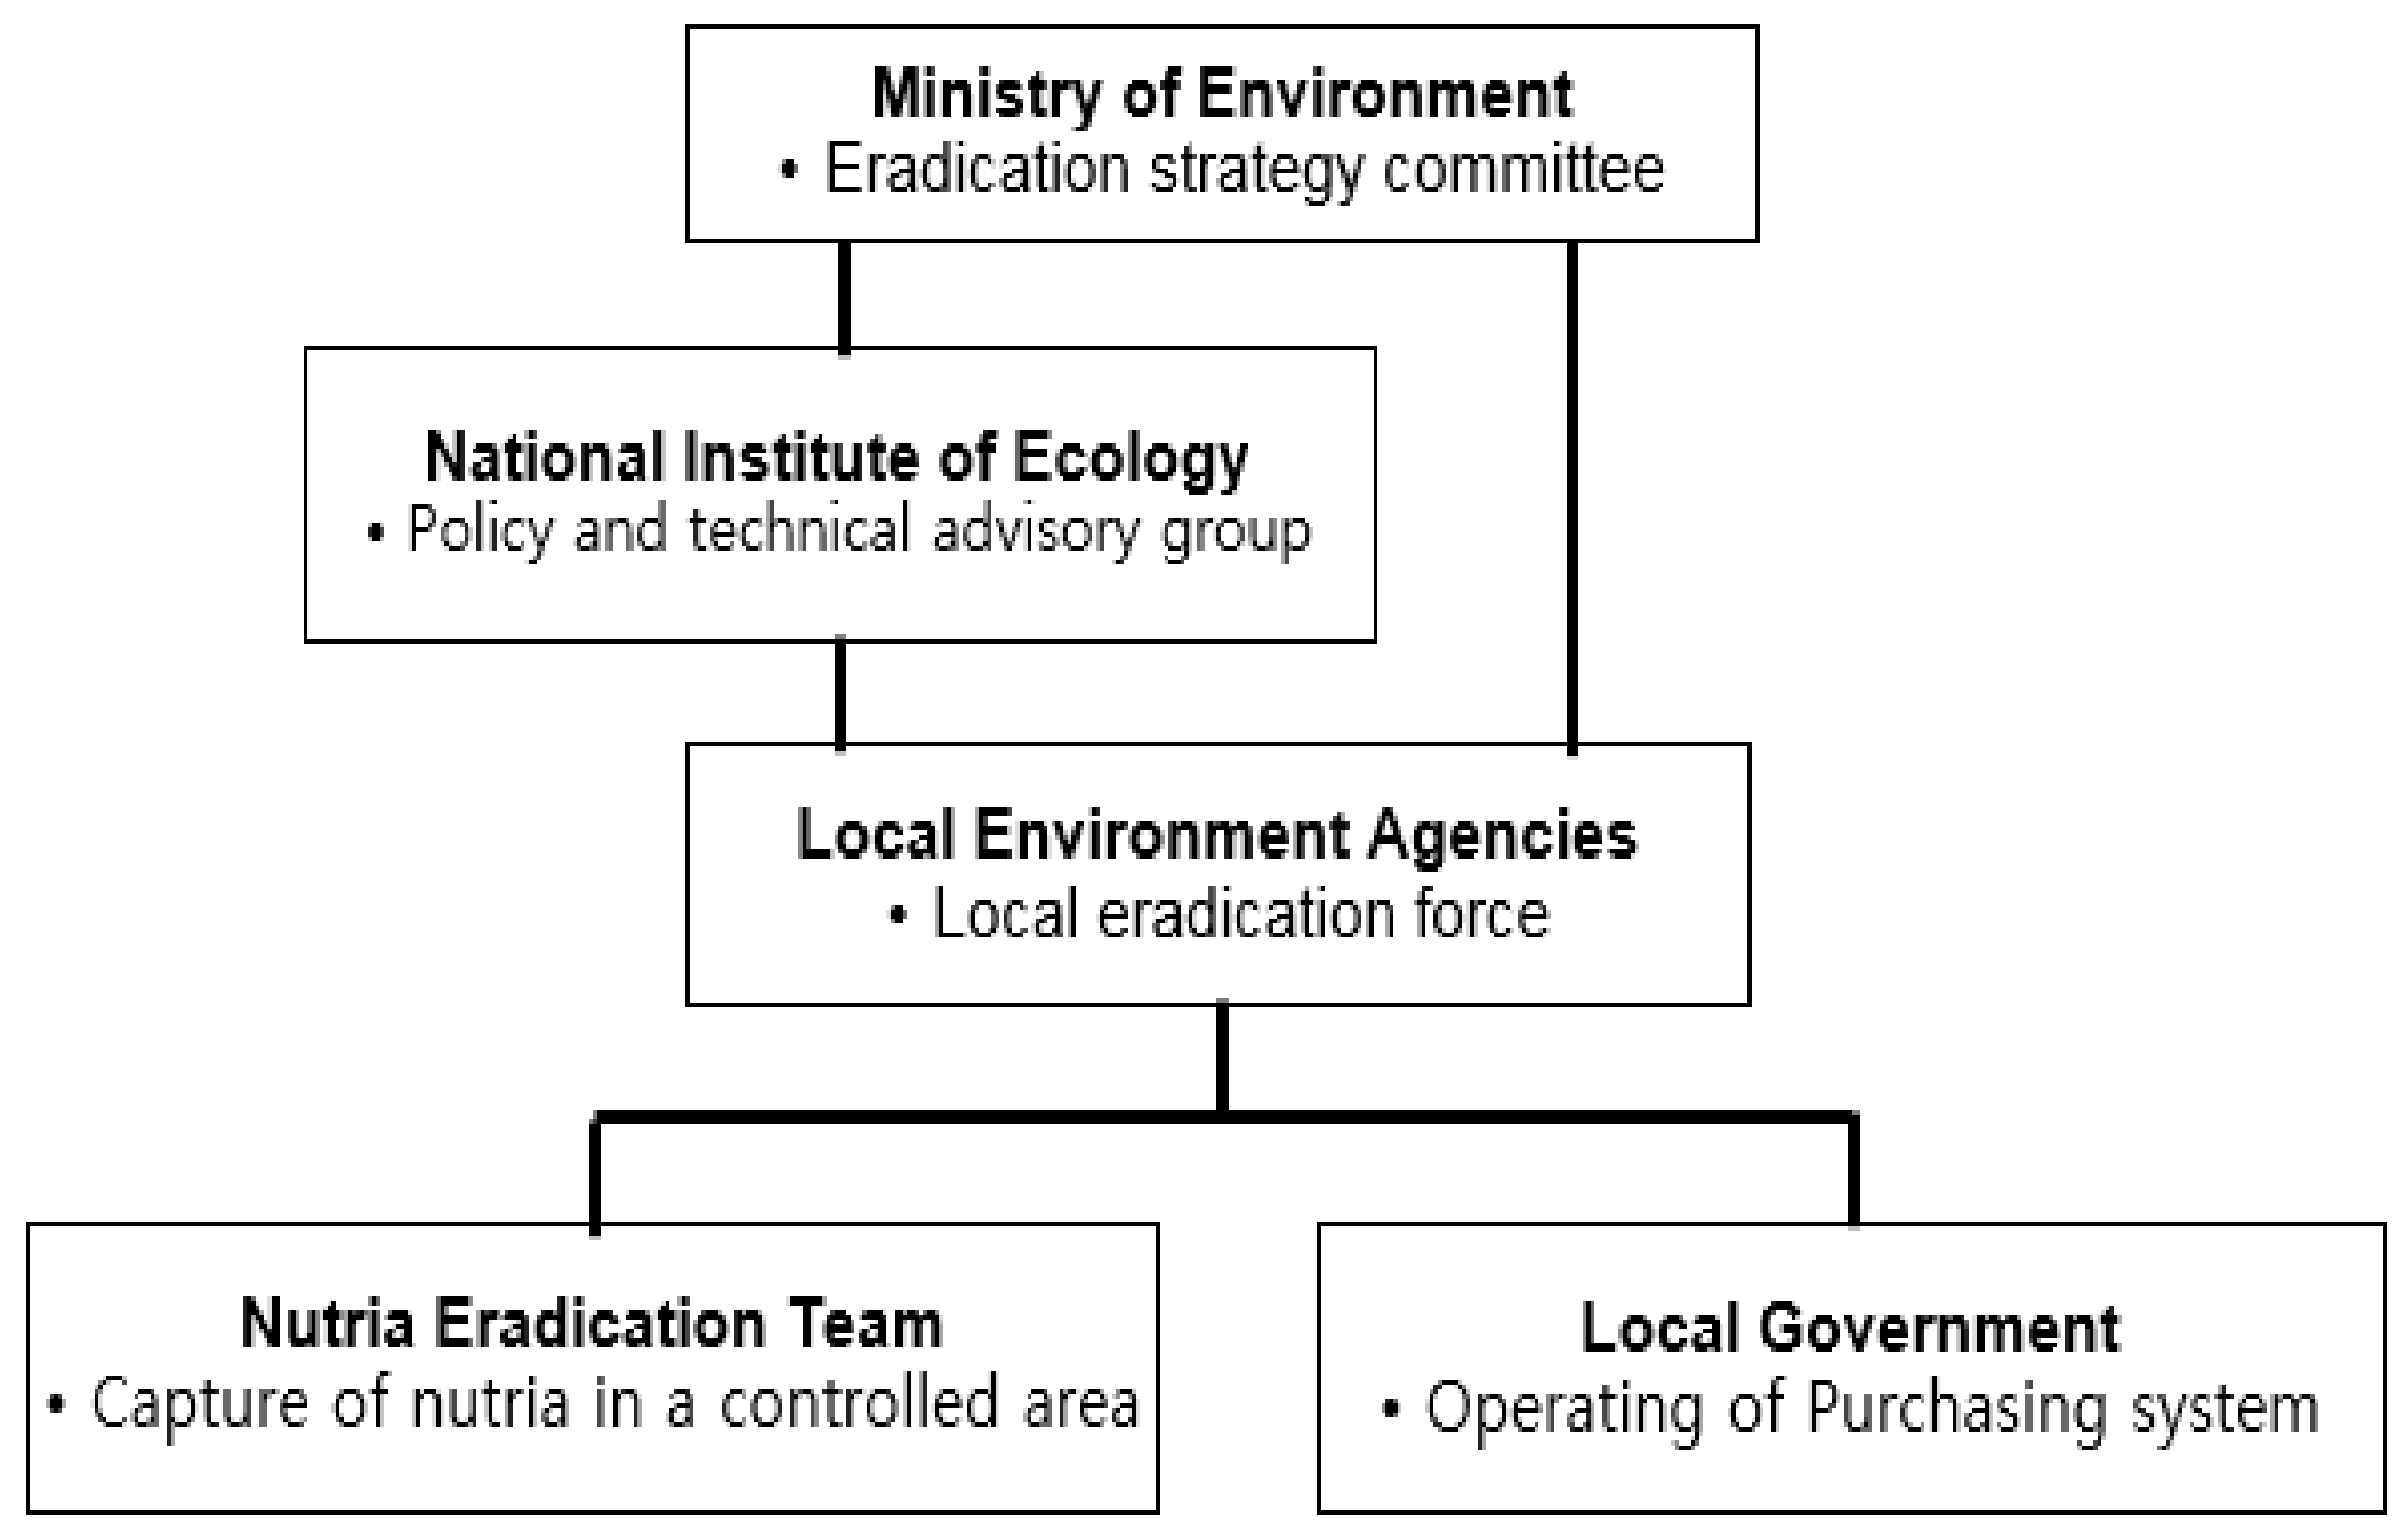
National control of nutria populations through the Nutria Eradication Project20147864Implementation of the National Nutria Eradication Program;
Establishment of the Common Cooperative System involving the Ministry of Environment, National Institute of Ecology, Local Environmental Agencies, and Local Governments Organized to Control the Population of Nutria
Allocation of necessary funds, for eradication, 9.5 million USD;
Appointment of a technical advisory group for the scientific control of nutria populations
Organization of a nutria eradication team including 16 wildlife capture specialists;
Development of an Inventory for the examination of the existing data, distribution, and propagation of nutria; Estimates of changes in population size were reflected in the control strategy
Strategic arrangement of cage traps to improve capture efficiency;
Implementation of incentive system for the performance of nutria capture;
Incentive system expanded to include monetary rewards for nutria captured by the public
Standardization of GIS-based capturing area control and guidelines;
Establishment of annual executable control strategies and improvement in the control of nutria populations based on the current state of habitats
20156786
20165475
20175432
20181930
Table 3. Changes in nutria distribution.
Sustainability 11 04169 i001
Division20142015201620172018
SDECentral X coordinate128.75°
128°45′00″
128.759°
128°45′32.4″
128.589°
128°35′20.4″
128.596 128°35′45.6″128.57 128°34′12″
Central Y coordinate35.2721°
35°16′19.56″
35.2899°
35°17′23.64″
35.4584°
35°27′30.24″
35.5362 35°32′10.32″35.4303 35°25′49.08″
X-axis Standard deviation distance37,433.8 m33,489.3 m37,208.5 m30,162.6 m40,193.3 m
Y-axis Standard deviation distance32,221.5 m16,873.0 m27,324.1 m39,710.5 m23,959.0 m
Rotation angle104.0°109.7°127.1°144.6°120.3°
LDMAverage distance moved46,656.8 m
Average angle of movement313.9°
SDE: Standard deviational Ellipse, which is the spatial standard deviation of distances of nutria habitats from the reference pivot point; X-axis standard deviation distance: Distance of the standard deviation of the calculated major axis (X-axis); Y-axis standard deviation distance: Distance of the standard deviation of the calculated minor axis (Y-axis); LDM: Linear directional mean. Calculated average linear directional distance values to provide overall information about the shift in the SDE.

