Article

Perceptions of Final Beneficiaries about the Performance of Cross-sector Partnerships: A Case Study Applied to the 2008 Zaragoza International Exhibition on Water and Sustainable Development

by
José María Agudo-Valiente
1,*,
Pilar Gargallo-Valero
2 and
Manuel Salvador-Figueras
2
1
Department of Economics and Management, University of Zaragoza, 50005 Zaragoza, Spain
2
Department of Applied Economics, University of Zaragoza, 50005 Zaragoza, Spain
*
Author to whom correspondence should be addressed.
Sustainability 2019, 11(14), 3860; https://doi.org/10.3390/su11143860
Submission received: 17 May 2019 / Revised: 5 July 2019 / Accepted: 10 July 2019 / Published: 16 July 2019

Abstract

:
Using the 2008 Zaragoza International Exhibition “Water and sustainable development” as a case study, this paper aims to respond to the increasing demand for measurements of the effects and the implications of the performance of cross-sector partnerships from the perspective of their intended final beneficiaries. A contingency framework for measuring the short-, medium- and long-term effects of the 2008 Zaragoza International Exhibition is developed based on a “results chain” or “logic model”. Our results highlight that there are positive long-term synergies between the two main purposes of the 2008 Zaragoza International Exhibition; first, to increase public awareness of and commitment to the problems of water and sustainable development and, second, to make the city of Zaragoza better known internationally and to modernize its infrastructures. Although respondents to our survey consider that the long-term effects on the city are greater, the main short- and medium-term effects are related to awareness of water problems, sustainable development and non-governmental organizations. These results are in tune with what has happened around the city in the last 10 years providing indirect validity both to our study and to the proposed methodology.

1. Introduction

Organizations cannot individually address the complex challenges of sustainability on their own. Joint efforts are needed to integrate environmental, social and economic considerations to facilitate the transition to a more sustainable society [1], to provide social goods such as clean water, health or education [2], to address complex social problems such as poverty and inequality [3] or to fill institutional voids [4]. In order to increase the efficiency and effectiveness of these activities, in recent years, public–private–nonprofit partnerships are growing in number around the world. These cross-sector partnerships have been constituted as organizational solutions to these complex societal problems that call for the comparative advantages of different sectors [5]. The central aim of these partnerships between firms, governmental agencies, non-governmental organizations (NGOs), universities and other organizations is to address these problems through collaboration and the combination of their organizational capacities and resources [6,7,8] to obtain benefits for the wider community rather than for special interests [9].
These partnerships are increasingly being adopted by many companies, which have appreciated their potential to contribute to long-term competitive advantage [10], by governments, which see them as ways of producing public goods in collaboration with NGOs [5] and firms [11], and by many civil society organizations in order to develop novel solutions to complex, old problems [12]. Simultaneously, these partnerships have to address the challenges of assessing and reporting their non-financial performance under increasing demands for measurements of effects and their implications for general performance measurement [3]. It is for this reason that the evaluation of anticipated outputs (short-term effects), outcomes (medium-term effects) and impacts (long-term effects) [13], as well as the “accountability” [14] and the assessments of the efficiency and effectiveness of partnerships in addressing their intended goals are the most critical elements in partnership decisions [15]. As a consequence, there has been an increase in the management literature on cross-sector partnerships [16] and a large number of studies seem to indicate that joint efforts and collaborative approaches can help to build sustainability-oriented organizations [17,18]. However, both theoretical and practical research need more thorough evidence of the effects of cross-sector partnerships and to establish the conditions under which these effects can be enhanced [15].
Ebrahim and Rangan [3] argue that organizations which have a linear theory of change and a tightly-focused operational strategy have the ability to measure their inputs, activities, outputs and outcomes, but they are unable to reasonably measure their impacts. These authors define these impacts as lasting changes in the lives of people and their societies and develop a tool that reasonably measures and explains them [14]. To that end, Ebrahim and Rangan [14] and Van Tulder et al. [15] develop a contingency framework for measuring outputs, outcomes and impacts and their implications for the efficiency and effectiveness of cross-sector partnerships through the use of a logical chain of the social performance of cross-sector partnerships.
Following the literature mentioned above [6,7,8,9], for which the objective of cross-sector partnerships is to help to solve complex problems through collaboration and obtain benefits for the community in general, partnerships management is a relevant matter and the use of performance assessment systems may become relevant to improve efficiency [19]. One way to carry out this assessment is to know the perceptions of the final beneficiaries about the performance of the cross-sector partnerships. With this purpose the authors propose for the first time in the literature, a methodology based on the logic model framework of Van Tulder et al. [15] (see Figure 1 below) and the use of structural equation models to evaluate the performance of inter-sectoral partnerships from the perceptions of final beneficiaries. The procedure is applied to the assessment of the outputs, outcomes and impacts of the 2008 Zaragoza International Exhibition “Water and sustainable development” (EXPO) on people’s awareness of water and sustainable development and of the future development of the city of Zaragoza, which were the main objectives of exhibition. We use the opinions of a sample of Zaragoza citizens who were the final beneficiaries of the EXPO cross-sector partnership in a specifically designed survey.
The study is organized as follows. Section 2 discusses the current state of effects assessments in social performance measurement. Section 3 reviews the theoretical model of a value chain to measure the effects of cross-sector partnerships. Section 4 describes the case study. Section 5 develops a logical model to assess the short-, medium- and long-term effects and the effectiveness and efficiency of the EXPO. Finally, Section 6 concludes. An Appendix, with the equations of the structural model used in the paper, and Supplementary Material, with an additional comparative study by socio-demographic characteristics of the respondents, has also been included.

2. The Current State of Effects Assessments in Social Performance Measurement

In the absence of a universally accepted methodology, partnership researchers are clearly becoming more interested in the objective evaluation of effects and its interaction with the context. In this section we explore the current state of the assessment of effects and how and to what extent this can be achieved.

2.1. The Demand for Evidence-Based Effects Assessments

Cross-sector partnership research is characterized by a growing abundance of methodological approaches to measure the effects of these partnerships [16,20]. However, even though a wide range of assessment models are available, most of them come up against measurement difficulties due to the multi-causality of partnerships [21]. For this reason, there has been very little empirical evaluation, so effects assessment models across sectors remain relatively limited [22]. These circumstances reiterate the importance of moving the discussion on effects towards more concrete evidence-based insights in order to assess when and under which conditions different types of partnerships do or do not work [23]. There is a lack of monitoring and evaluation of the outputs, outcomes and impacts of cross-sector partnerships. That is why governments, NGOs and firms have started to call for better evidence-based effects assessment methodologies [24].

2.2. Concepts and Current State of Effects Assessments in Social Performance Measurement

There is a growing consensus in the literature that “outputs” refer to immediate effects on the participating organizations, while “outcomes” refer to intermediate direct effects on communities or to changes in the lives of individuals, and “impacts” to lasting results achieved at a societal level or to long-term and net effects (direct and indirect effects) on bigger issues [15]. For example, if we wish to reduce poverty through education in a community, we could build a training center. This building would be an input. Then, a certain number of people would attend classes and this number would be an output. As a consequence, more people from that community would have access to specific knowledge of professional training and this would be an outcome. Finally, in the long term, people of that community could work in more qualified jobs and improve their quality of life (this would be an impact).
Nevertheless, the literature on the development of cross-sector partnership initiatives has only identified a limited number of positive impacts for firms, governments and NGOs [25] while it finds numerous positive outcomes and few negative outcomes for individual stakeholders [26]. Furthermore, there is no specific analytical framework for effects assessment that is applicable to all partnerships and such a framework has not been empirically examined in a multi-sector context to date [22] either because, for some complex problems, the long-term effects are still difficult to measure [27] or because little is known about their contribution to wider goals [28]. Gray and Stites [26] suggest that evidence of the effectiveness of multi-sector partnerships still remains largely anecdotal and prescriptive, without clear outcomes of the partnerships on communities and on the environment. In order to make a global assessment of effects, the effectiveness of partnerships needs to be considered in their interaction with the context and their consequences for communities. Most studies conclude that the effects of partnerships need to be addressed at several levels of analysis: community, network, organization and the individuals within participating organizations [22,29]. Critical studies insist on the necessity of investigating this interaction with the development of stronger mechanisms for assessing and ensuring accountability towards both partners and intended beneficiaries if partnerships are to meet their intended objectives [30]. In this paper, we work at community level, focusing on the perceptions of Zaragoza citizens, who we take as representatives of the community that is the final beneficiary of the EXPO.

3. Partnership Monitoring and Evaluation Framework: The Effects Value Chain

Some frameworks for measuring the effects of the social performance of cross-sector partnerships and social sector organizations propose the use of a “results chain” or “logic models” which link the effects of these partnerships to the objectives defined by the participants. These models present a chain of results in which organizational inputs and activities lead to a series of outputs, outcomes and, ultimately, to societal impacts [3]. However, many of these effects are strongly related to broader processes which are difficult to measure and may create indirect and unintended effects that affect the overall results of partnerships. Van Tulder et al. [15] propose an analytical framework for partnership effects assessment which contains two dimensions: (1) a descriptive part that follows an effects value chain and documents the steps of the partnership from issue definition through to impact; (2) an analytical part that covers the four most relevant aspects of partnering (context, efficiency, effectiveness and impact) that assesses the fit and value-added of the partnership to the societal situation. Figure 1 shows the most relevant constituting factors of these two dimensions in the partnership monitoring and evaluation framework.
This effect value chain includes the following elements (see Figure 1):
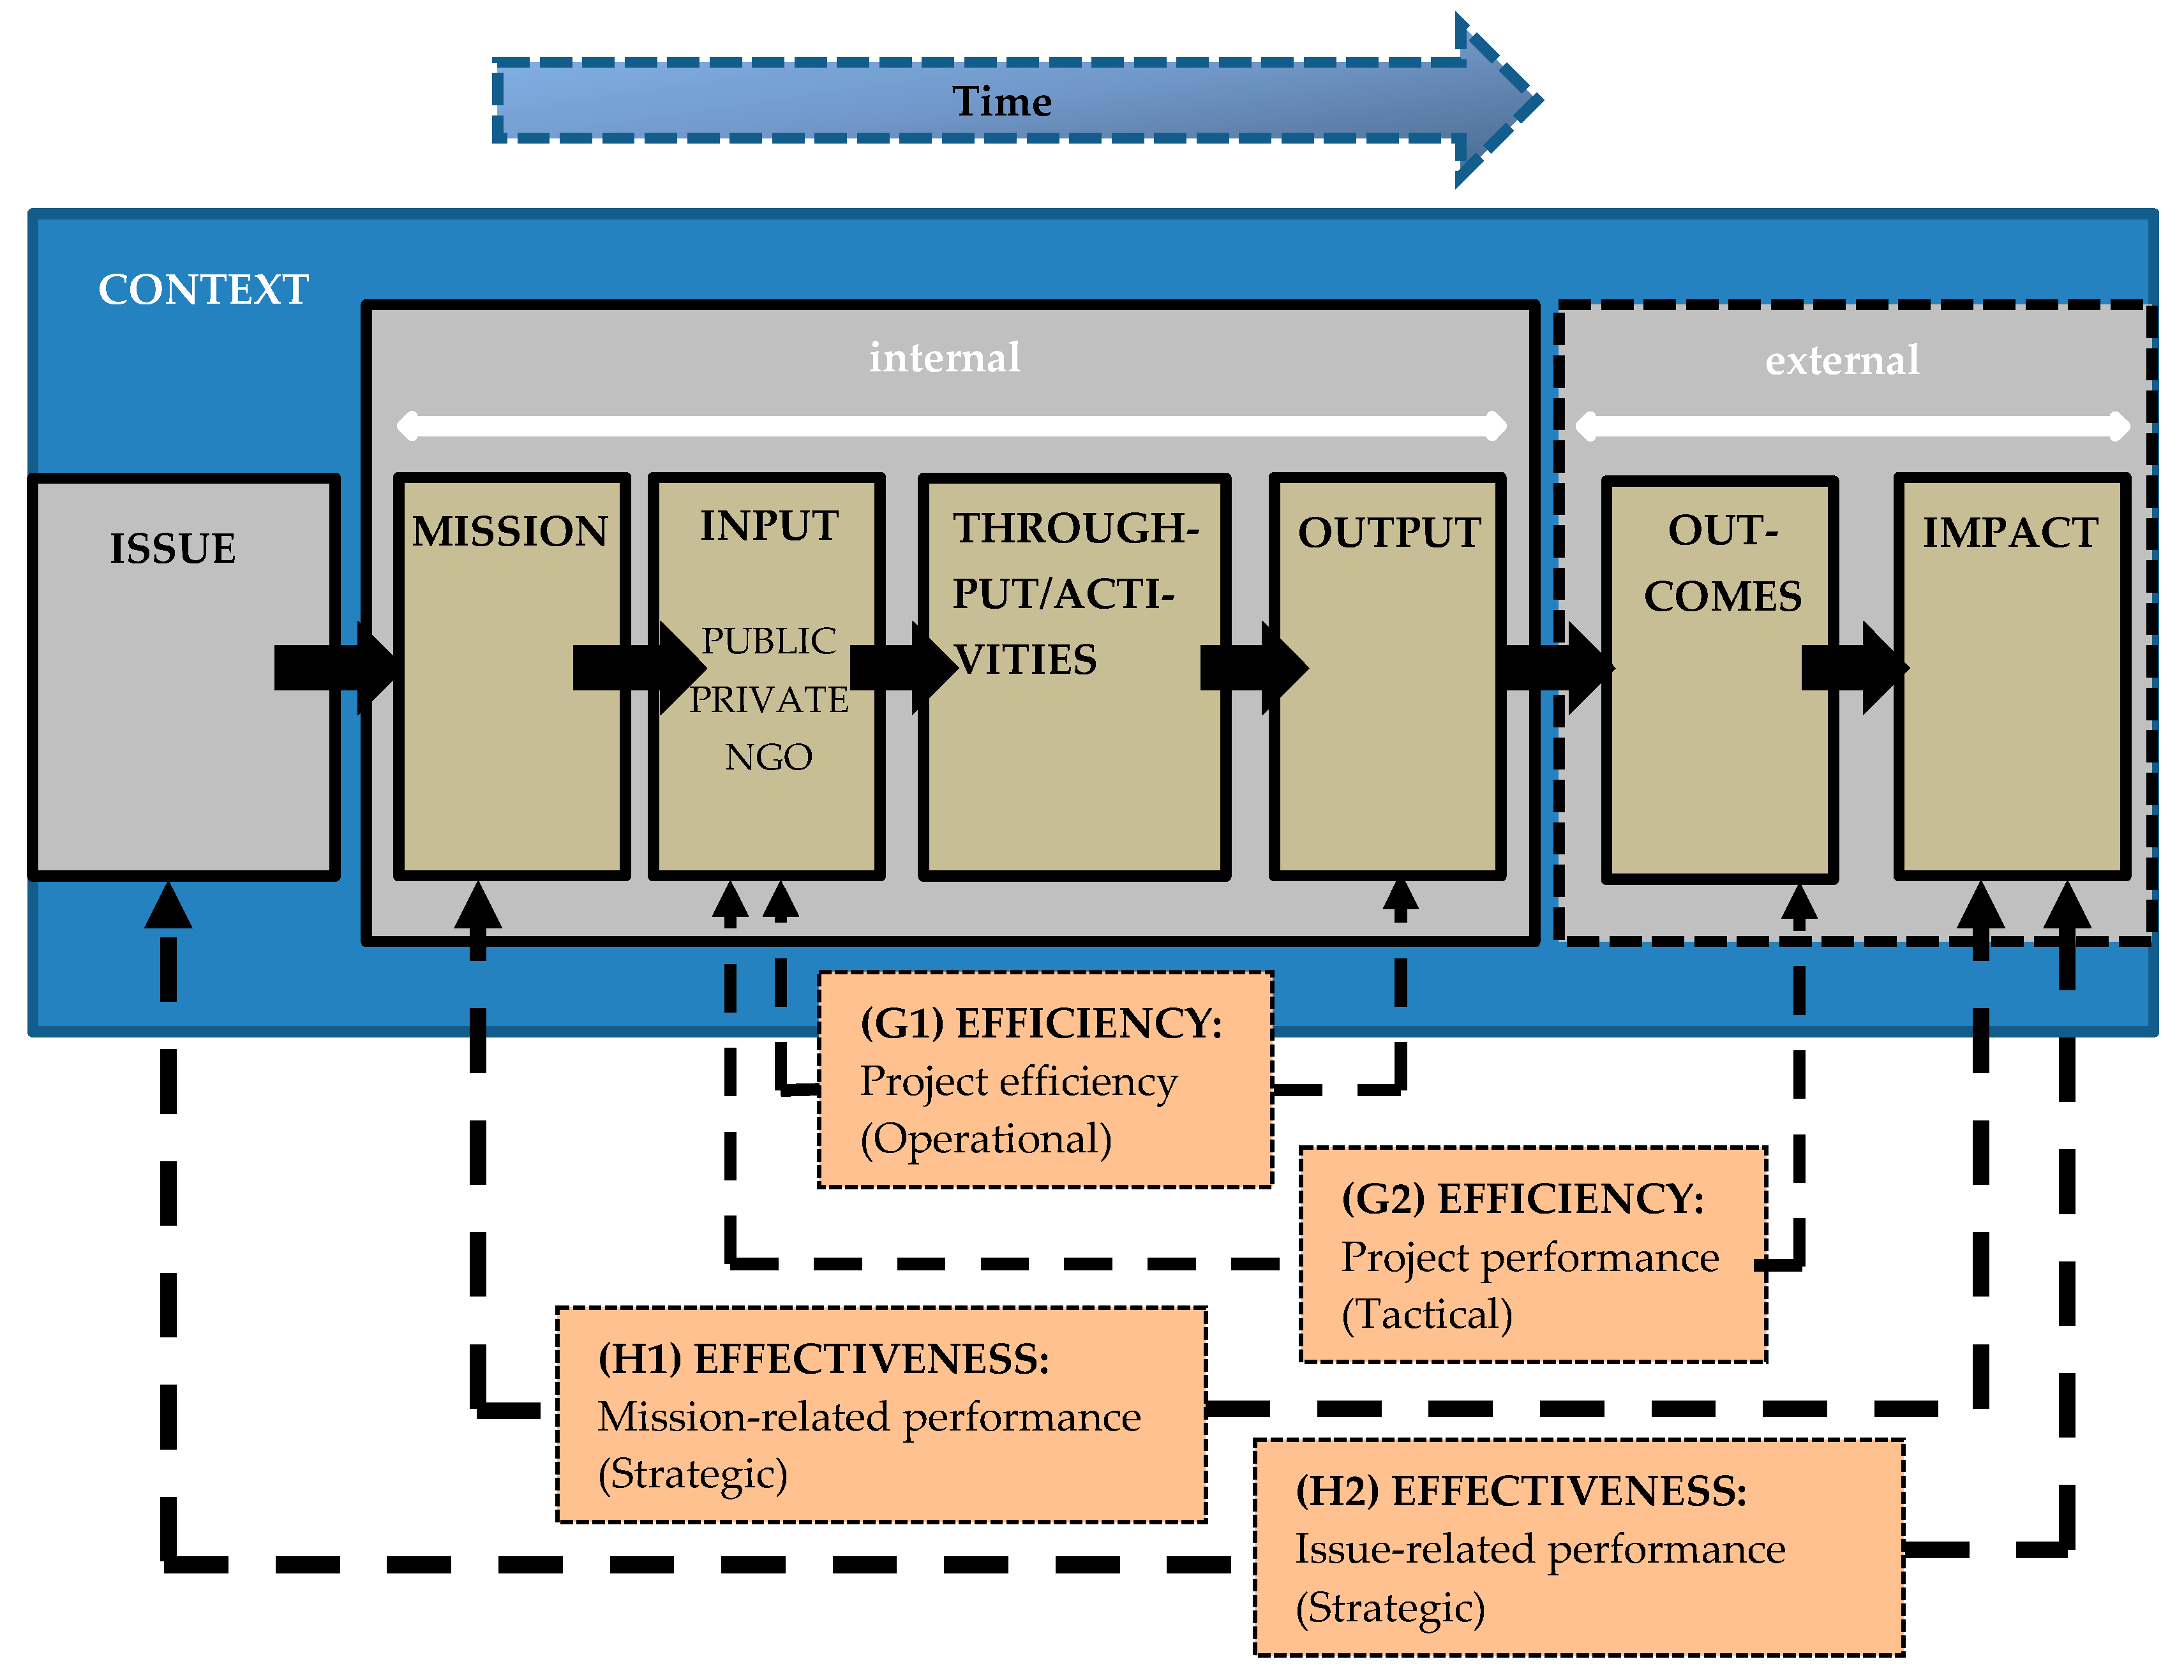
  • The context, which defines the configuration, refers to the particular environment in which the cross-sector partnership operates and can be a country, a region, a city, an issue, or a network. The context conditions and determines the specific factors of the success or failure of partnerships (the degree of efficiency and effectiveness), the nature of the issue and the specific characteristics of the partnership.
  • The issue, which can be defined in terms of social problem/opportunity, refers to the social issue being addressed by the partnership. For partners to agree on the social issue they are seeking to tackle is the first step in achieving any kind of effect [31].
  • The partners’ mission and goal, which act as the linking pin between the issue and the input, are often defined in a general way and, once the ambition of one party has been achieved, the partnership can be terminated.
  • The inputs, i.e., the resources and capabilities provided to achieve the cross-sector partnership’s mission (for example money, staff time, capital assets, commitment), are brought in by each partner (public partners or governments, private partners or firms and community partners or civil society).
  • The activities, in whose execution and implementation process partners work towards the partnership objectives.
  • The outputs or results of the combination of inputs and activities that a participating organization can measure or assess directly. The output dimension of the effects value chain also includes the benefits for each of the participants in terms of, for example, profits, legitimacy, exposure and moral capital.
  • The outcomes are the specific changes in program participants’ (individuals, communities or society at large after) knowledge, status and level of functioning. These changes occur in the short and medium-term and their logical progression should be reflected in impacts occurring in the very long-term in society.
  • The impacts are the fundamental and profound changes occurring in organizations, communities or systems as a result of program activities and organizational efforts, including intended and unintended effects and negative and positive effects [32]. Impacts have a long-term character and occur after the conclusion of project funding.
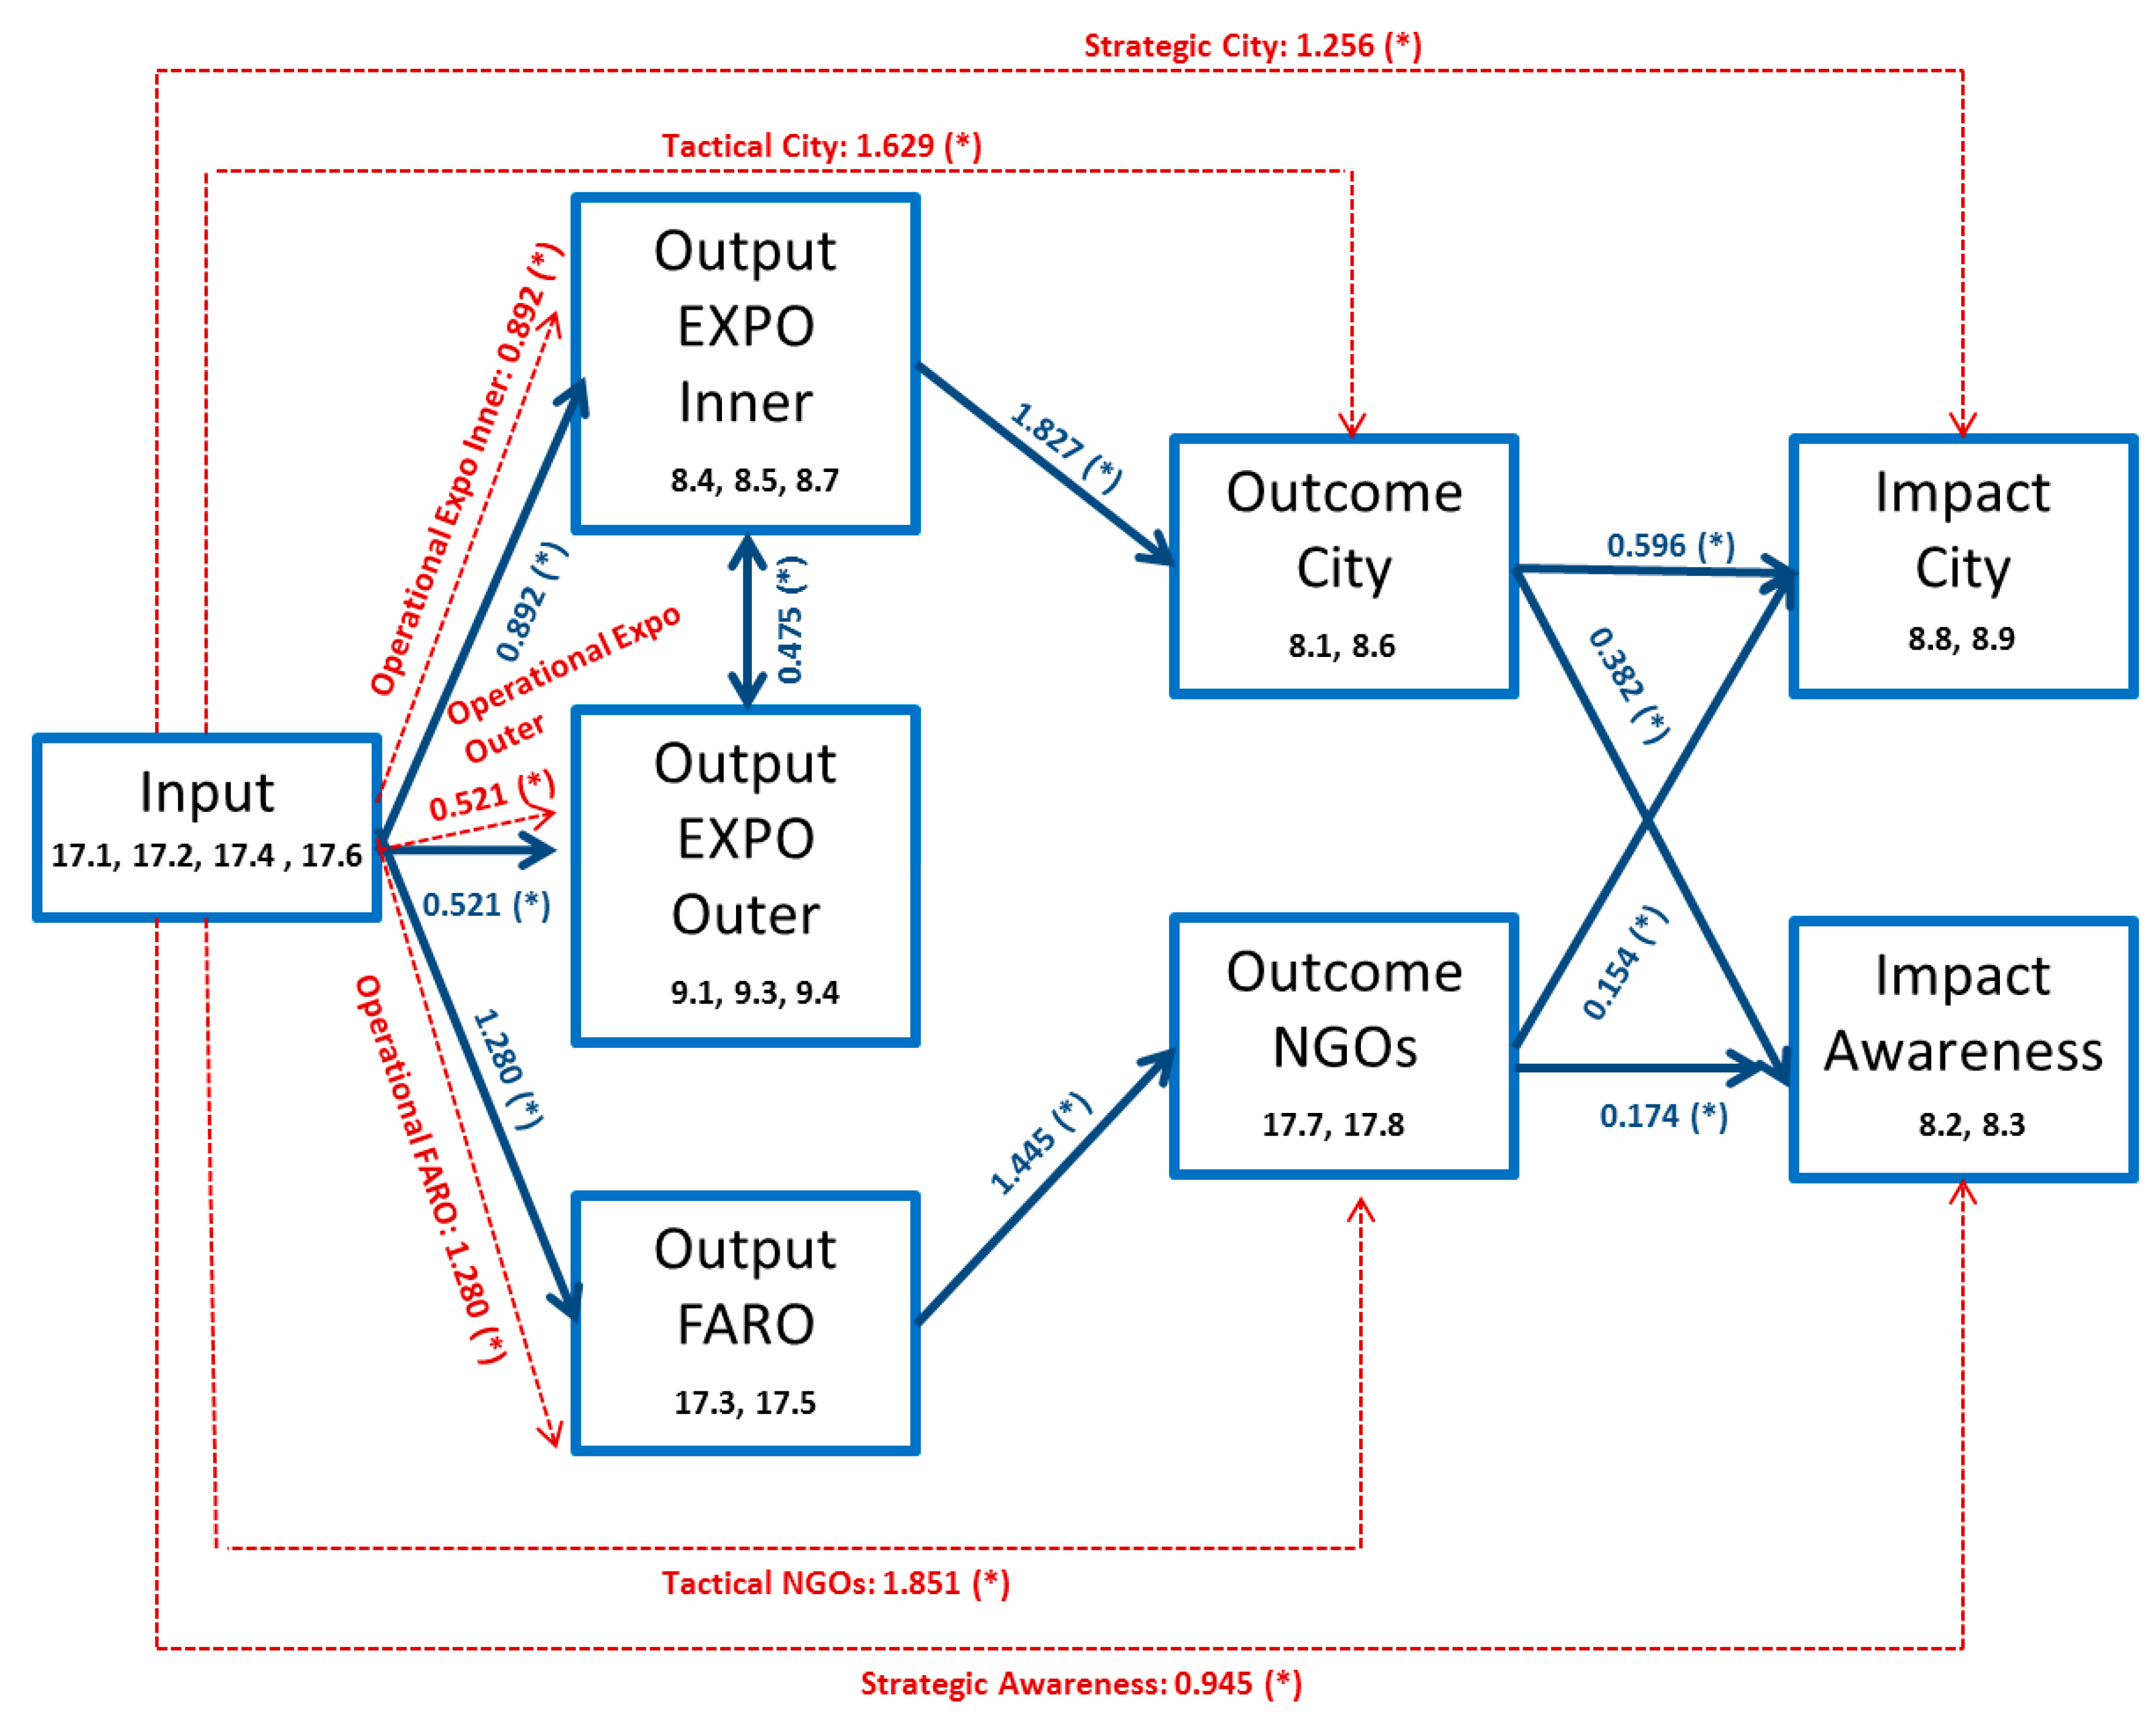
  • Efficiency, which refers to the ability to accomplish the partnership activities with a minimum expenditure of time, resources and effort. The efficiency dimension of a partnership can be assessed using a benefit/cost or outputs-outcomes/inputs analysis and it constitutes the internal value added of the partnership. Therefore, the outputs-outcomes/inputs relationship contains two specific dimensions: An operational level of project efficiency that links input with output (G1 in Figure 1) and a tactical level of project performance that links input with outcome (G2). At the operational level of project efficiency, we expect that, once the activities are accomplished, the service delivery will be produced. An example of the operational efficiency of the project “Reducing poverty in a developing country through education” is the ratio of the number of people who attend classes in the new training center to money invested. At the tactical level of project performance, we expect that the accomplishment of these activities will lead to changes of project performance in the short or medium term. An example of a tactical level of performance of the project “Reducing poverty in a developing country through education” is the ratio of number of people who have achieved professional training as a consequence of their studies in the training center to money invested.
  • Effectiveness, which is “the value added and the impact of the partnership” compared to the individual activities of the different partners. It measures the quality of the partnership performance in accomplishing the goals and whether the results could have been achieved with a different approach. Like efficiency, effectiveness can also be split into two dimensions: A strategic mission-related performance assessment (H1 in Figure 1) that evaluates how the specific partnership made a difference in context and time, as articulated in the partnership’s mission, and an issue-related performance measure (H2 in Figure 1) that assesses the contribution of the partnership in providing solutions to the social issue initially defined.
Within this analytical framework for partnership assessment, Van Tulder et. [15] propose four impact orders/loops (individual/inside partner, organization, partnership and society/issue) of cross-sector partnership. These four orders/loops correspond to the benchmark project efficiency (operational), project performance (tactical) and mission-related performance and issue-related performance. These orders/loops are as follows (see Figure 1):
  • First order impact loop, which establishes the operational efficiency of partnerships through the effects of internal value added between inputs and throughputs/activities of the partnership. It links inputs with outputs.
  • Second order impact loop, which establishes the tactical efficiency of partnerships through the effects of internal added value between the inputs and outputs, hence also capturing the operational level effects (first order impact loop). It links inputs with outcomes.
  • Third order impact loop, which captures the value added of partnerships in accordance with its mission from inputs to outcomes and includes the interaction effects across the stages. It links mission with impacts.
  • Fourth order impact loop that includes all the stages from input to impact. This allows the assessment of the overall value added obtained by the partnership and its contribution to the issue. However, these stages are the most complex to address because of the large number of levels of analysis and of interaction effects. It links the issue with impacts.

4. The 2008 Zaragoza International Exhibition and the Citizen Initiatives Pavilion

The growth model of the economies of most countries was producing an environmental deterioration on a global scale with a use of natural resources not sustainable. Social awareness of the States and citizens, and the acquisition of collective commitments aimed at modifying production methods and consumption habits became necessary. One way to try to increase this awareness was the organization of an international exhibition to serve as a meeting point between representatives of different countries with different cultures and ways of life in which they could propose strategies and interventions to achieve sustainable development.
The city of Zaragoza is the fifth biggest city of Spain with an estimated population of 666,880 inhabitants. It is the capital of Aragón, a medium-sized 47,669 km2 region in the northeastern part of Spain with a GDP of 27,403 € per capita [33]. Zaragoza and Aragón are regularly selected in socioeconomic studies as representative Spanish city and region, respectively, as they have sectoral distribution and socioeconomic indicators similar to the mean of Spain [34]. On December 16, 2004, Zaragoza was elected by the BIE to host the EXPO 2008 ahead of two candidates: The Italian city of Trieste and the Greek city of Thessaloniki. Water management and sustainable development were issues that aroused (and continue to arouse) growing concern around the world. This thematic axis determined all the details of the EXPO: Its location in the meander of the river Ebro, its mascot chosen by popular vote (a drop of water called Fluvi acronym of the Latin “flumen vitae” or river of life), the shapes of the buildings, and the contents of the debates of experts during the months of the exhibition that gave rise to the Water Charter of Zaragoza. To channel and visualize social support for the EXPO, volunteering was promoted in Zaragoza. There were more than 40,000 registered volunteers who collaborated in the organization for up to 6 hours a day.
Finally, EXPO was held in Zaragoza from June 14 to September 14, 2008 about the global issue of water management and development models and whose theme was “Water and sustainable development”. It was an example of cross-sector collaboration with a double mission (or two objectives). First, to increase public awareness of problems associated with water and sustainable development. Second, to change the development model of Zaragoza to a more sustainable one, making the city more internationally known and modernizing its infrastructures.
The EXPO was regulated by the Bureau International des Expositions (BIE) and constituted a space dedicated to leisure, culture, reflection and exchange of knowledge about these problems among the different participants (106 countries, 346 NGOs, 62 public and private collaborating entities, 6 sponsoring partners and three international organizations). The event attracted more than 5.6 million visitors with an average of 60,763 visits per day [35].
The city of Zaragoza faced the enormous challenge of the construction of the EXPO site and the accompanying infrastructure with the collaboration of the public administration (Government of Spain, Government of Aragon and Zaragoza City Council), private entities and the third sector, which constituted the partnership Expo Social Zaragoza 2008. The site occupied 25 hectares of the meander of Ranillas next to the river Ebro, where the pavilions were built to locate the exhibition. Some of these buildings led to milestones in Spanish and world engineering. The infrastructure plan of the EXPO entailed investments of 2500 million euros with a whole series of road, railway, tourist and green interventions, resulting in a qualitative leap of modernity in the city [35].
The main economic data directly related to the event were the following. The investments for the site in land, housing development, access and others amounted to a total of 625 million euros. The income obtained from the sale of tickets, sponsorship and others was 236 million euros and the expenses in construction, communication, content, shows and others amounted to 291 million euros. It is estimated that the city of Zaragoza received some 900,000 tourists in relation to this exhibition [35].
Among the pavilions of the exhibition, the citizen initiatives pavilion (named FARO) was managed directly by NGOs. This is highlighted in its alignment with the theme of the exhibition “Water and sustainable development”, through its bioclimatic construction, and in its program of activities. FARO was the first chance non-governmental organizations have had to take responsibility for the contents and design of a Pavilion in an International Exhibition. It represented 346 civil organizations (developmental, ecological, social and cultural) and 62 public and private collaborating entities, on a local and Spanish level, as well as from the five continents. The civil organizations in Zaragoza were responsible for managing FARO with an aim and a project in common: an effort in participation and coordination which would change the world. FARO denounced the situation of millions of people who have no access to safe water or sanitation; it showed alternative solutions to the great challenge of sustainable coexistence between humans and nature; and it stimulated a desire to change to a sustainable way of life, spreading the spirit of the participating organizations and initiatives to the visitors.

5. The Partnership and Social Effects Monitoring and Evaluation

In this section, we elaborate a statistical tool to monitor and evaluate the cross-sector partnerships and their social effects from the opinions expressed by their intended beneficiaries. This tool is based on the methodology proposed by Van Tulder et al. [15] and it is applied to evaluate the short-, medium- and long-term effects of the EXPO. To that aim, we use structural equation models because of their ability to impute relationships between unobserved constructs (latent variables) from observable variables. In our case, we build a structural equation model based on the perceptions of the final beneficiaries of the EXPO: The citizens of Zaragoza. The measurement part of the model relates the items of the survey (observable variables) with the inputs, outputs, outcomes and impacts (latent variables) of the EXPO. The structural part of model is based on the diagram of Figure 1 and determines the relationships (direct and indirect) between the above effects by means of linear regression models which we use to estimate the operational, tactical and strategic efficiencies of the EXPO (see Appendix A for more details).
The input-activities are related to the pavilions and their contents, the volunteers who worked in them and aspects related to the organization of the EXPO. The outputs, outcomes and impacts are related to effects of the event in the short (during the event), medium and long term (both after the event), respectively. Besides, we calculate the operational and tactical efficiencies and the effectiveness associated with the two EXPO missions, evaluating the direct and indirect influences of the inputs on the outputs, outcomes and impacts indicators, obtained from the structural equation model.
We start by describing our sources of information and the variables used in the study. This is followed by a description of the methodology used and the results obtained.

5.1. Data

In collaboration with the EXPO, and within the citizen initiatives of FARO, the creation of a group was promoted to study the effects of the international exhibition in the city of Zaragoza of 2008. The group comprised voluntary experts on the subject and representatives of public and private institutions, NGOs and business organizations. The information to monitor and evaluate the partnership and its social impact on the city of Zaragoza was obtained by means of a survey of citizens who benefited from the project. The survey focused on a random sample of citizens of Zaragoza and was conducted in 2009, the year after the EXPO. This time lag was considered appropriate so that respondents could assess the effects of the event, as well as being able to remember as many aspects of it as possible.
The design of the survey took into account the two objectives of the EXPO: 1) to increase awareness of problems associated with water and sustainable development and 2) to change the development model of Zaragoza to a more sustainable one, making the city more internationally known and modernizing its infrastructures. Table 1 shows the selected items of the questionnaire, whose answers were codified on a 7-point Likert scale (a psychometric and symmetric scale which captures the level of agreement or disagreement for a series of statements from 1: strongly disagree to 7: strongly agree) together with the indicator to which they are associated and following the evaluation framework shown in Figure 1. The valuation of the inputs of the EXPO was carried out through an indicator obtained from the items p.17_1, p.17_2, p.17_4 and p.17_6 of the survey, which are related to the pavilions and their contents, the volunteers who worked in them and aspects related to the organization of the EXPO. Valuation of outputs was carried out through three indicators: The Output EXPO Inner indicator (built from items p.08_4, p.08_5 and p.08_7) which evaluates the effects exerted by the EXPO on its visitors as a consequence of its activities; the Output EXPO Outer indicator (built from items p.09_1, p.09_3 and p.09_4) which evaluates the effects exerted by the EXPO on some aspects related to the daily life of citizens of Zaragoza such as the economic cost of the event, price increases and the day-to-day operations of the city; and the Output FARO indicator (built from the items p.17_3 and p.17_5) which evaluates the effects of the FARO pavilion on the awareness of problems associated with water and sustainable development. Valuation of outcomes was made through the indicators Outcome City (built from p.17_7 and p.17_8 items) and Outcome NGOs (built from p.08_1 and p.08_6). Outcome City evaluates the short and medium-term effects of EXPO in the internationalization and modernization of Zaragoza, while Outcome NGOs evaluates the effects of EXPO and FARO on the recognition of the work carried out by NGOs to raise awareness among citizens about water problems and sustainable development. Valuation of the long-term impacts of these aspects was collected in the Impact City (built from items p.08_8 and p.08_9) and Impact Awareness (built from p.08_2 and p.08_3) indicators.
Table 2 shows the results of a descriptive study of the answers to the questionnaire. The number of surveyed citizens was 455 of which 396 (87%) answered all the items, the percentages of non-response to each item oscillating around 2%. The most frequent profile of the respondents corresponds to a woman (52.3%), between 26 and 55 years of age (54.5%), with university studies (42.6%) and salaried (44.2%) (see Supplementary Material for more details). In addition, most of the respondents visited the EXPO (83.3%) and only 16.7% of them were volunteers.
The scores obtained in the formulated items were, in general, medium-high with average scores between 4.2 and 5.9 (Table 2). Only items p.09_3 and p.09_4 obtain scores below these levels (3.19 and 2.75, respectively); nevertheless, it should be taken into account that these items were drafted negatively.
The highest valuations corresponded to items related to the short and medium-term effects on the city (Outcomes City), the inner results of the EXPO, i.e., the effects exerted on its visitors and as a consequence of its activities (Output EXPO Inner) and the inputs, with mean scores larger than 5.3 for most of these items. On the contrary, the lowest valuations corresponded to items related to the effects of FARO (Output FARO) and to the long-term EXPO effects on the awareness of society of the problems related to water and sustainable development (Impacts Awareness) with most of items related to these indicators having mean values lower than 4.6 points.

5.2. Structural Equation Model

Figure 2 shows the perceptual diagram of the structural model used to measure the short-, medium- and long-term effects of the EXPO. The model is based on Van Tulder et al. [15] where a very general framework to carry out an assessment of cross-sector partnership activities performed (inputs) and the short (outputs), medium (outcomes) and long (impacts) term effects are described.
The equations of the model are given in Appendix A. The method used for the estimation of their coefficients has been the maximum likelihood using the R statistical package lavaan [36].
Table 3 contains the estimations of the intercepts, factor loadings and variances of the error terms of the measurement model while Table 4 shows the estimations of the coefficients of the structural model. The factor loadings of the measurement model are all significantly different from zero and with the expected sign (see Table 3). Besides, most of the coefficients of the structural model (see Table 4) are coherent with the direct relationship of the logic model of Figure 1, revealing the existence of significant direct influences of the Inputs on the Outputs, of the Outputs on the Outcomes and of the Outcomes on the Impacts for the two objectives of the EXPO.
The only exception is the absence of a significant direct relationship between the Output EXPO Outer and the Outcomes City. This is due to the significantly positive residual covariance (0.475) between the Output EXPO Inner and Output EXPO Outer, reflecting the influence of the common aspects related to the internal and external EXPO management, which highlights the existence of a significant indirect relationship between Output EXPO Outer and the Outcomes City through Output EXPO Inner.
It is worthwhile highlighting the significant direct influences of the Outcomes NGOs and Outcomes City on the long-term effects of the EXPO revealing the existence of positive synergies between its two main objectives: raising awareness of problems related to water and sustainable development and changing the development model of Zaragoza to a more sustainable one, making the city more internationally known and modernizing its infrastructures.
Finally, Table 5 shows some goodness-of-fit measures of the model. Concretely, we provide the Root Mean Square Error of Approximation (RMSEA) and the Standardized Root Mean Residual (SRMR) which compare the observed and the hypothesized covariance matrices of the model. Both are less than 0.1 which is the limit that separates an acceptable fit of a good fit. Besides we provide the Comparative Fit Index (CFI) and the Tucker-Lewis Index (TLI) which compare the fit of the model with the independence model. We notice that both indices have values larger than 0.95 that is considered the limit to have an acceptable fit.
Table 5 contains the estimations of the operational, tactical and strategic efficiencies of the EXPO which measure, respectively, its short-, medium- and long-term effects. These effects have been estimated using the mathematical expressions given at the bottom of this table (see also the Appendix A where it is shown how these expressions have been obtained). All the effects are significant and positive. The larger values correspond to the short- and medium-term effects on awareness about problems related to water and sustainable development and on the NGOs in FARO. In the long term, however, respondents consider that impacts on the city are greater.

5.3. Analysis of Impacts after EXPO

Today, 10 years after the celebration of the EXPO, the impacts of its two objectives can be clearly seen. First, there was an increase in public awareness of and commitment to the problems associated with water and sustainable development [35], both at the level of the city itself and outside it. Within the city, important intangibles were achieved that are still valid a decade later. Among other examples, we can highlight the effect that the EXPO had as a vehicle of unification and integration, the consolidation of the volunteer movement (which even today, is an active group that continues to collaborate with the city council in organizing all kinds of events), and the changes in urban mobility with the reduction of motorized traffic in the city center and the increasing use of the bicycle. As a consequence, Zaragoza now has a municipal bicycle rental service and the number of kilometers of bike lane has risen from 12 before the EXPO to the current 131. Outside the city, the impact of the EXPO on commitment to the problems associated with water and sustainable development has been considerable. Perhaps the most relevant, due to its international projection, was achieved by the Water Tribune, a forum of experts from all over the world, organized during the EXPO. The conclusions of the work carried out by these experts gave rise to the Charter of Zaragoza on Water, which subsequently led to the General Assembly of the United Nations officially forming the Water Council and recognizing people’s rights to water and sanitation in July 2010. These rights were reflected in the Sustainable Development Goals (SDGs) whose number 6 is “Guaranteeing the availability of water and its sustainable management and sanitation for all”, without forgetting that the intellectual legacy was collected and systematized in the Blue Box, which makes accessible thousands of documents -texts, presentations, videos, photographs, news, and other works- that emerged from conferences, workshops, debates and various performances held in the Water Tribune or derived from its various instruments.
The EXPO also achieved a high impact on its other major objective, changing the development model of Zaragoza to a more sustainable one, making the city more internationally known and modernizing its infrastructures. These impacts were indicated by Serrano et al. [37], Barlés and Anso [38] and Duarte et al. [39], who examined the associated investments and tourism expenditures, finding that the effects of the EXPO were positive. These effects took place, basically, in the services sector [40] and although the productive structure was not modified, it changed the intensity of the relationship between sectors [39]. The EXPO made it possible to carry out projects that had been pending for decades and their role in the transformation of Zaragoza was transcendental [41,42]. The city obtained the public investment needed to build ring roads, a terminal at the airport, bridges and footbridges on the three rivers that bathe the city (Ebro, Gállego and Huerva), and to recover their banks. Furthermore, the EXPO site itself provides a physical space that today constitutes the new lungs of the city with 125 hectares of green area. This space is a new zone of familiar leisure in a city that, until then, lived with its back to the Ebro and contains half a hundred kilometers of green walks along the urban sections of the three rivers. Moreover, the reconversion of the EXPO enclosure into a business park, which was planned for when the pavilions and buildings of the exhibition were designed, has allowed its rapid transformation. These buildings are now an administrative center of the city giving work to more than 3000 people. The EXPO has also caused an impact outside the city. Currently, Zaragoza is much better known at all levels although causes that are alien to the exhibition itself and difficult to determine at present may have contributed to this knowledge. According to the National Institute of Statistics, the number of national visitors to the city has increased by 3.7%, that is, from 52,569 visitors a month in the years prior to the international exhibition to 54,541 in the following years. Foreigner visitors have increased by 53.5% from 12,940 to 19,875 visitors per month, respectively [33].
Summarizing, the EXPO 2008 was an event that favored substantial growth, both economic and social, through the change in urban growth and development models, thus promoting new urban projects and implementing good practices in environmental matters, fundamentally in water management and conservation and sustainable development [43]. In this way, Zaragoza is now a new city, more integrated, more complex, with greater exchange capacity, more sustainable, trained for new challenges, with greater capacities, intercultural and open [44].

6. Conclusions

This study proposes an empirical procedure for measuring, through the perceptions of their final beneficiaries, the short-, medium- and long- term effects of cross-sector partnerships and their implications for efficiency and effectiveness. The procedure uses a structural equation model based on the methodology proposed by Ebrahim and Rangan [14] and Van Tulder et al. [15] and, to our level of knowledge, is the first time that it has been used in this context in the literature. The methodology is applied to the assessment of the impacts of the 2008 Zaragoza International Exhibition “Water and sustainable development” on its two objectives: to increase public awareness of and commitment to the problems associated with water and sustainable development, and to change the development model of Zaragoza to a more sustainable one, making the city more internationally known and modernizing its infrastructures.
To do so, we have used the opinions of a sample of the beneficiaries of the cross-sector partnership in a specifically designed survey. Our results show that, in the opinion of the EXPO beneficiaries, there were positive long-term synergies between the achievements of its two objectives. All the estimations of the operational, tactical and strategic efficiencies of the EXPO that measure the effects of the inputs of the EXPO in the short, medium and long term were significantly positive. The greatest short- and medium-term effects occurred in the awareness of the problems associated with water and sustainable development through the NGOs in the FARO pavilion. However, in the long term, the beneficiaries of the exhibition considered that the impacts on the reaching of the above objectives would be somewhat smaller. Thus, we can conclude that, according to the opinion expressed in 2009 by the beneficiaries of the EXPO, the event managed to fulfill its two main goals in the short term and, to a lesser extent, that it would achieve its objectives in the medium and long term.
However, despite the success achieved and the fulfillment of its double mission, today there is a sense that there are still many things to do, especially at an ideological and cultural level. The concern of the institutions for the use of the EXPO site and its adaptation for productive uses was a priority instead of promoting the intellectual legacy of the EXPO, in a period of crisis that lasted several years. This corroborates the perceptions of our respondents about the impacts of the EXPO, which were larger on the city than on citizen awareness. All these facts are in tune with the perceptions provided by the beneficiaries of the EXPO in 2009, thus giving indirect validity to our study and the proposed methodology.
In view of these results, and in order to promote the EXPO intellectual legacy and make Zaragoza a point of reference at a global, national and local level, it might be convenient to establish training and education centers on the proper use of natural resources to change the habits of citizens and, especially, of future generations. We know that the post-EXPO association is trying to promote and keep this legacy alive by presenting different lines of action to politicians.
Nevertheless, the present study can be very useful to politicians and leaders. In addition to the massive investments that EXPO brought to Zaragoza, a very important aspect to assess the success of an event like this is what contributes to the leisure economy of the region and to the creation of a new image of the territory. In this sense, knowing the assessment of citizens regarding the event is fundamental and one of the factors that political leaders should take into account. Another aspect that explains the success of a great event is its contribution to social cohesion and progress of society. This is achieved by giving a satisfactory response to some serious current problem (for example, the lack of sustainability) and establishing a new scale of values. The results analyzed reveal that in all previous aspects the EXPO achieved its objectives even though it is necessary to continue with the awareness of the new generations.
Even though the representativeness of the specific case analyzed in the paper is limited and the proposed methodology needs to be validated in other contexts, we believe that, being based on a framework as general as that proposed in Van Tulder et al. [15], our procedure could be used as a useful starting point to establish a measurement method of the effects, efficiency and effectiveness of partnerships through the opinions of their final beneficiaries. Furthermore, the methodology is flexible enough to include other aspects that have not been considered here, such as the perception of other stakeholders, changes in the goals of the players over time or the experience partners have in the partnership, by including items aimed at measuring these aspects in additional surveys. These possible extensions are contemplated as futures lines of research.

Supplementary Materials

Supplementary materials are available online at https://www.mdpi.com/2071-1050/11/14/3860/s1.

Author Contributions

J.M.A.-V. conceived and designed the survey, provided data and carried out the setting-up of the model and the bibliographic review. P.G.-V. and M.S.-F. purged the data, established the structural model, estimated its parameters, tested its significance and goodness of fit, and built the tables and figures. The three authors jointly interpreted the results and redrafted the introduction and conclusions.

Funding

Agudo-Valiente was financially supported by the MICINN-FEDER (Spanish Ministry of Economy and Competitiveness) project grant number ECO2016-77843-P and the Government of Aragón (Group Reference CREVALOR: S42_17R) and co-financed with FEDER 2014–2020 “Construyendo Europa desde Aragón”. Gargallo-Valero and Salvador-Figueras were financially supported by the MICINN-FEDER (Spanish Ministry of Economy and Competitiveness) project grant number ECO2016-79392-P (AEI/FEDER, UE) and the S41_17R research group (DGA-FSE, project 269223).

Conflicts of Interest

The authors declare no conflict of interest.

Appendix A. Equations of the Logic Model

In this appendix we show the equations of the structural model used in the paper whose perceptual map is given in Figure 2.
Measurement Model:
This model relates the items of the survey with their corresponding indicators. The μ parameters are the mean scores of each item and the a coefficients are the loading factors and determines the correlation of each item with its indicator. The σ2 parameters are the variance of the error terms ε.
Input
p . 17 _ 1 = μ p . 17 _ 1 + a p . 17 _ 1 , Input Input + ε p . 17 _ 1   with   E [ ε p . 17 _ 1 ] = 0 , Var ( ε p . 17 _ 1 ) = σ p . 17 _ 1 2
p . 17 _ 2 = μ p . 17 _ 2 + a p . 17 _ 2 , Input Input + ε p . 17 _ 2   with   E [ ε p . 17 _ 2 ] = 0 , Var ( ε p . 17 _ 2 ) = σ p . 17 _ 2 2
p . 17 _ 4 = μ p . 17 _ 4 + a p . 17 _ 4 , Input Input + ε p . 17 _ 4   with   E [ ε p . 17 _ 4 ] = 0 , Var ( ε p . 17 _ 4 ) = σ p . 17 _ 4 2
p . 17 _ 6 = μ p . 17 _ 6 + a p . 17 _ 6 , Input Input + ε p . 17 _ 6   with   E [ ε p . 17 _ 6 ] = 0 , Var ( ε p . 17 _ 6 ) = σ p . 17 _ 6 2
E[Input] = 0, Var(Input) = 1
Output EXPO Inner
p . 08 _ 4 = μ p . 08 _ 4 + a p . 08 _ 4 , Output _ Inner Output   Expo   Inner + ε p . 08 _ 4   with   E [ ε p . 08 _ 4 ] = 0 , Var ( ε p . 08 _ 4 ) = σ p . 08 _ 4 2
p . 08 _ 5 = μ p . 08 _ 5 + a p . 08 _ 5 , Output _ Inner Output   Expo   Inner + ε p . 08 _ 5   with   E [ ε p . 08 _ 5 ] = 0 , Var ( ε p . 08 _ 5 ) = σ p . 08 _ 5 2
p . 08 _ 7 = μ p . 08 _ 7 + a p . 08 _ 7 , Output _ Inner Output   Expo   Inner + ε p . 08 _ 7   with   E [ ε p . 08 _ 7 ] = 0 , Var ( ε p . 08 _ 7 ) = σ p . 08 _ 7 2
E[Output Expo Inner] = 0, Var(Output Expo Inner) = 1
Output EXPO Outer
p . 09 _ 1 = μ p . 09 _ 1 + a p . 09 _ 1 , Output _ Outer Output   EXPO   Outer + ε p . 09 _ 1   with   E [ ε p . 09 _ 1 ] = 0 , Var ( ε p . 09 _ 1 ) = σ p . 09 _ 1 2
p . 09 _ 3 = μ p . 09 _ 3 + a p . 09 _ 3 , Output _ Outer Output   EXPO   Outer + ε p . 09 _ 3   with   E [ ε p . 09 _ 3 ] = 0 , Var ( ε p . 09 _ 3 ) = σ p . 09 _ 3 2
p . 09 _ 4 = μ p . 09 _ 4 + a p . 09 _ 4 , Output _ Outer Output   EXPO   Outer + ε p . 09 _ 4   with   E [ ε p . 09 _ 4 ] = 0 , Var ( ε p . 09 _ 4 ) = σ p . 09 _ 4 2
E[Output EXPO Outer] = 0, Var(Output Outer) = 1
Output FARO
p . 17 _ 3 = μ p . 17 _ 3 + a p . 17 _ 3 , Output _ Faro Output   Faro + ε p . 17 _ 3   with   E [ ε p . 17 _ 3 ] = 0 , Var ( ε p . 17 _ 3 ) = σ p . 17 _ 3 2
p . 17 _ 4 = μ p . 17 _ 4 + a p . 17 _ 4 , Output _ Faro Output   Faro + ε p . 17 _ 4   with   E [ ε p . 17 _ 4 ] = 0 , Var ( ε p . 17 _ 4 ) = σ p . 17 _ 4 2
E[Output_Faro] = 0, Var(Output_Faro) = 1
Outcome City
p . 08 _ 1 = μ p . 08 _ 1 + a p . 08 _ 1 , Outcome _ City Outcome   City + ε p . 08 _ 1   with   E [ ε p . 08 _ 1 ] = 0 , Var ( ε p . 08 _ 1 ) = σ p . 08 _ 1 2
p . 08 _ 6 = μ p . 08 _ 6 + a p . 08 _ 6 , Outcome _ City Outcome   City + ε p . 08 _ 6   with   E [ ε p . 08 _ 6 ] = 0 , Var ( ε p . 08 _ 6 ) = σ p . 08 _ 6 2
E[Outcome_City] = 0, Var(Outcome_City) = 1
Outcome NGOs
p . 17 _ 7 = μ p . 17 _ 7 + a p . 17 _ 7 , Outcome _ NGOs Outcome   NGOs + ε p . 17 _ 7   with   E [ ε p . 17 _ 7 ] = 0 , Var ( ε p . 17 _ 7 ) = σ p . 17 _ 7 2
p . 17 _ 8 = μ p . 17 _ 8 + a p . 17 _ 8 , Outcome _ NGOs Outcome   NGOs + ε p . 17 _ 8   with   E [ ε p . 17 _ 8 ] = 0 , Var ( ε p . 17 _ 8 ) = σ p . 17 _ 8 2
E[Outcome NGOs] = 0, Var(Outcome_NGOs) = 1
Impact Awareness
p . 08 _ 2 = μ p . 08 _ 2 + a p . 08 _ 2 , Impact _ Awareness Impact   Awareness + ε p . 08 _ 2   with   E [ ε p . 08 _ 2 ] = 0 , Var ( ε p . 08 _ 2 ) = σ p . 08 _ 2 2
p . 08 _ 3 = μ p . 08 _ 3 + a p . 08 _ 3 , Impacts _ Awareness Impacts   Awareness + ε p . 08 _ 3   with   E [ ε p . 08 _ 3 ] = 0 , Var ( ε p . 08 _ 3 ) = σ p . 08 _ 3 2
E[Impact Awareness] = 0, Var(Impact Awareness) = 1
Impact City
p . 08 _ 8 = μ p . 08 _ 8 + a p . 08 _ 8 , Impact _ City Impact   City + ε p . 08 _ 8   with   E [ ε p . 08 _ 8 ] = 0 , Var ( ε p . 08 _ 8 ) = σ p . 08 _ 8 2
p . 08 _ 9 = μ p . 08 _ 9 + a p . 08 _ 9 , Impact _ City Impact   City + ε p . 08 _ 9   with   E [ ε p . 08 _ 9 ] = 0 , Var ( ε p . 08 _ 9 ) = σ p . 08 _ 9 2
E[Impact City] = 0, Var(Impact City) = 1
Structural Model:
The structural model determines the relation-ship between the indicators by means of linear regression models. This model has been building in agreement with the perceptual diagram of Figure 2. The regression coefficients β determines the sign, and the influence of the indicators which act as independent variables, on the indicator which act as dependent variable. The σ2 parameters are the variance of the error terms ε and the σ Output _ Inner , Output _ Outer is the covariance of the error terms ε Output _ Inner   and   ε Output _ Outer and collects the interrelation-ship between the Output_EXPO_Inner and Output_EXPO_Outer indicators
Output   Expo   Inner = β Output _ Inner , Input Input   + ε Output _ Inner   with   E [ ε Output _ Inner ]   =   0 ,   Var ( ε Output _ Inner )   = σ Output _ Inner 2
Output   Expo   Outer = β Output _ Outer , Input Input   + ε Output _ Outer   with   E [ ε Output _ Outer ]   =   0 ,   Var ( ε Output _ Outer )   = σ Output _ Outer 2
Output   Faro = β Output _ Faro , Input Input   + ε Output _ Faro   with   E [ ε Output _ Faro ]   =   0 ,   Var ( ε Output _ Faro )   = σ Output _ Faro 2
Cov ( ε Output _ Inner , ε Output _ Outer ) = σ Output _ Inner , Output _ Outer
Outcome   City = β Outcome _ City , Output _ Inner Output   Expo   Inner   + ε Outcome _ City   with   E [ ε Outcome _ City ]   =   0 ,
Var ( ε Outcome _ City )   = σ Outcome _ City 2
Outcome   NGOs = β Outcome _ NGOs , Output _ Faro Output   Faro   + ε Outcome _ NGOs   with   E [ ε Outcome _ NGOs ]   =   0 ,
Var ( ε Outcome _ NGOs )   = σ Outcome _ NGOs 2
Impact   Awareness = β Impact _ Awareness , Outcome _ City Outcome   City   + β Impact _ Awareness , Outcome _ NGOs Outcome   NGOs + ε Impact _ Awareness
with   E [ ε Impact _ Awareness ]   =   0 , Var ( ε Impact _ Awareness )   = σ Impact _ Awareness 2
Impact   City = β Impact _ City , Outcome _ City Outcome   City   + β Impact _ City , Outcome _ NGOs Outcome   NGOs + ε Impact _ City
with   E [ ε Impact _ City ]   =   0 , Var ( ε Impact _ City )   = σ Impact _ City 2
The structural equations determines, in particular, the influence of the Input on the Outcomes, Outcomes and the Impacts indicators which constitute an estimation of the operational, tactical and strategic efficiencies of the EXPO shown in Table 5 of the paper. So, for instance, the βOutput_Outer,Input coefficient measures the direct influence of the Input on the Output_EXPO_Outer indicator, which quantifies the effects of the EXPO on the daily life of the citizens of Zaragoza and it is, therefore, an estimation of the short-term Operational City efficiency of the EXPO. Additionally, from the structural equations of the Outcome_City and Output_EXPO_Inner indicators it is followed that:
Outcome   City = β Outcome _ City , Output _ Inner Output   Expo   Inner   + ε Outcome _ City =
β Outcome _ City , Output _ Inner ( β Output _ Inner , Input Input   + ε Output _ Inner )   + ε Outcome _ City =
β Outcome _ City , Output _ Inner β Output _ Inner , Input Input + β Outcome _ City , Output _ Inner ε Output _ Inner   + ε Outcome _ City =
β Outcome _ City , Output _ Inner β Output _ Inner , Input Input + error   terms
Therefore, βOutcome_City,Output_Inner βOutput_Inner,Input collects the medium-term indirect influence of the Input of the Outcome_City through the Output_Expo_Inner and is an estimation of the Tactical City efficiency of the EXPO. Finally, from the structural equations of the Impact_City, Outcome_City, Outcomes_NGOs, Output_FARO and Outpu_Expo_Inner it is followed that:
Impact   City = β Impact _ City , Outcome _ City Outcome   City   + β Impact _ City , Outcome _ NGOs Outcome   NGOs + ε Impact _ City   =
β Impact _ City , Outcome _ City ( β Outcome _ City , Output _ Inner Output   Expo   Inner   + ε Outcome _ City )   +
  β Impact _ City , Outcome _ NGOs ( β Outcome _ NGOs , Output _ Faro Output   Faro   + ε Outcome _ NGOs ) + ε Impact _ City   =
β Impact _ City , Outcome _ City β Outcome _ City , Output _ Inner Output   Expo   Inner + β Impact _ City , Outcome _ NGOs β Outcome _ NGOs , Output _ Faro Output   Faro + error   terms =
β Impact _ City , Outcome _ City β Outcome _ City , Output _ Inner ( β Output _ Inner , Input Input   + ε Output _ Inner ) +
β Impact _ City , Outcome _ NGOs β Outcome _ NGOs , Output _ Faro ( β Output _ Faro , Input Input   + ε Output _ Faro ) + error   terms =
( β Impact _ City , Outcome _ City β Outcome _ City , Output _ Inner β Output _ Inner , Input + β Impact _ City , Outcome _ NGOs β Outcome _ NGOs , Output _ Faro ) Input + error   terms
So, β Impact _ City , Outcome _ City β Outcome _ City , Output _ Inner β Output _ Inner , Input + β Impact _ City , Outcome _ NGOs β Outcome _ NGOs , Output _ Faro collects the indirect influence of Input on the Impact_City indicator where β Impact _ City , Outcome _ City β Outcome _ City , Output _ Inner β Output _ Inner , Input collects the influence through the path Outcome_City -Output_Expo_Inner and β Impact _ City , Outcome _ NGOs β Outcome _ NGOs , Output _ Faro through the path Outcome_NGOs -Output_FARO. Therefore it is an estimation of the Strategic City efficiency of the EXPO.

References

  1. Seuring, S.; Gold, S. Sustainability management beyond corporate boundaries. J. Clean. Prod. 2013, 56, 1–6. [Google Scholar] [CrossRef]
  2. Warner, M.; Sullivan, R. Putting Partnerships to Work: Strategic Alliances for Development between Government and Private Sector and Civil Society; Warner, M., Sullivan, R., Eds.; Greenleaf Publishing: Sheffield, UK, 2004. [Google Scholar]
  3. Ebrahim, A.; Rangan, V.K. Putting the brakes on impact: A contingency framework for measuring social impact. Acad. Manag. Ann. Meet. Proc. 2010, 1, 1–6. [Google Scholar]
  4. Fransen, L.W.; Kolk, A. Global rule-setting for business: A critical analysis of multi-stakeholder standards. Organization 2007, 14, 667–684. [Google Scholar] [CrossRef]
  5. Brinkerhoff, D.W.; Brinkerhoff, J.M. Public–private partnerships: Perspectives on purposes, publicness, and good governance. Public Adm. Dev. 2011, 31, 2–14. [Google Scholar] [CrossRef]
  6. Crane, A. Exploring green alliances. J. Mark. Manag. 1998, 14, 559–579. [Google Scholar] [CrossRef]
  7. Brinkerhoff, J.M. Assessing and improving partnership relationships and outcomes: A proposed framework. Eval. Progr. Plan. 2002, 25, 215–231. [Google Scholar] [CrossRef]
  8. Brinkerhoff, J.M. Government-nonprofit partnership: A defining framework. Public Adm. Dev. 2002, 22, 19–30. [Google Scholar] [CrossRef]
  9. Skelcher, C.; Sullivan, H. Working Across Boundaries. Collaboration in Public Services; Palgrave Macmillan: Basingstoke, UK, 2002. [Google Scholar]
  10. Lavie, D. The competitive advantage of interconnected firms: An extension of the resource-based view. Acad. Manag. Rev. 2006, 31, 638–658. [Google Scholar] [CrossRef]
  11. Clarke, A.; Fuller, M. Collaborative strategic management: Strategy formulation and implementation by multi-organizational cross-sector social partnerships. J. Bus. Ethics 2010, 94, 85–101. [Google Scholar] [CrossRef]
  12. Laasonen, S.; Fougere, M.; Kourula, A. Dominant articulations in academic business and society discourse on NGO-business relations: A critical assessment. J. Bus. Ethics 2012, 109, 521–545. [Google Scholar] [CrossRef]
  13. Margolis, J.; Walsh, J.P. Misery loves companies: Rethinking social initiatives by business. Adm. Sci. Q. 2003, 48, 268–305. [Google Scholar] [CrossRef]
  14. Ebrahim, A.; Rangan, V.K. What Impact? A Framework for Measuring the Scale & Scope of Social Performance. Calif. Manag. Rev. 2014, 56, 118–141. [Google Scholar]
  15. Van Tulder, R.; Seitanidi, M.M.; Crane, A.; Brammer, S. Enhancing the Impact of Cross-Sector Partnerships. J. Bus. Ethics 2016, 135, 1–17. [Google Scholar] [CrossRef]
  16. Branzei, O.; Le Ber, M.J. Theory-method interfaces in cross-sector partnership research. Soc. Partnersh. Responsib. Bus. 2014, 1, 229–266. [Google Scholar]
  17. Lozano, R. Developing collaborative and sustainable organisations. J. Clean. Prod. 2008, 16, 499–509. [Google Scholar] [CrossRef]
  18. Govindan, K.; Seuring, S.; Zhu, Q.; Garrido Azevedo, S. Accelerating the transition towards sustainability dynamics into supply chain relationship management and governance. J. Clean. Prod. 2016, 112, 1813–1823. [Google Scholar] [CrossRef]
  19. Pinto, F.; Simoes, P.; Marques, R. Raising the bar: The role of governance in performance assessments. Util. Policy 2017, 40, 38–47. [Google Scholar] [CrossRef]
  20. Crane, A.; Seitanidi, M.M. Social Partnerships and Responsible Business: What, Why and How? Routledge: Abingdon, UK, 2014. [Google Scholar]
  21. Austin, J.E.; Stevenson, H.; Wei-Skillern, J. Social and commercial entrepreneurship: The same, different, or both? Entrepreneursh. Theory Pract. 2006, 30, 1–22. [Google Scholar] [CrossRef]
  22. Babiak, K.M. Criteria of effectiveness in multiple crosssectoral interorganizational relationships. Eval. Progr. Plan. 2009, 32, 1–12. [Google Scholar] [CrossRef]
  23. Kolk, A. Partnerships as panacea for addressing global problems? On rationale, context, actors, impacts and limitations. In Social Partnerships and Responsible Business: A Research Handbook; Seitanidi, M.M., Crane, A., Eds.; Routledge: London, UK, 2014; pp. 15–43. [Google Scholar]
  24. Lund-Thomsen, P. Assessing the impact of publicprivate partnerships in the global south: The case of the Kasur Tanneries pollution control project. J. Bus. Ethics 2009, 90, 57–78. [Google Scholar] [CrossRef]
  25. Idemudia, U. Oil extraction and poverty reduction in the Niger Delta: A critical examination of partnership initiatives. J. Bus. Ethics 2009, 90, 91–116. [Google Scholar] [CrossRef]
  26. Gray, B.; Stites, J. Sustainability through partnerships. Capitalizing on collaboration. Netw. Bus. Sustain. 2013, 1, 1–110. [Google Scholar]
  27. Liket, K. Why ‘Doing Good’ Is Not Good Enough: Essays on Social Impact Measurement; ERIM Ph.D. Series Research in Management; Erasmus University Rotterdam: Rotterdam, The Netherlands, 2014. [Google Scholar]
  28. Utting, P.; Zammit, A. United Nations-business partnerships: Good intentions and contradictory agendas. J. Bus. Ethics 2009, 90, 39–56. [Google Scholar] [CrossRef]
  29. Seitanidi, M.M. Employee involvement in implementing CSR in cross sector social partnerships. Corp. Reput. Rev. 2009, 12, 90–105. [Google Scholar] [CrossRef]
  30. Rein, M.; Stott, L. Working together: Critical perspectives on six cross-sector partnerships in southern Africa. J. Bus. Ethics 2009, 90, 79–89. [Google Scholar] [CrossRef]
  31. Austin, J.; Seitanidi, M. Creating Value in Nonprofit-Business Collaborations. New Thinking & Practice; Jossey-Bass: San Francisco, CA, USA, 2014. [Google Scholar]
  32. Wainwright, S. Measuring Impact: A Guide to Resources; NCVO Publications: London, UK, 2002. [Google Scholar]
  33. INE (Statistical National Institute). Years 2005 to 2018. Available online: http://www.ine.es/jaxiT3/Tabla.htm?t=2078 (accessed on 14 June 2019).
  34. Centelles, F. El Estado Autonómico Teoría y Práctica; Alzacanes: Toledo, Spain, 1993; ISBN 8488480016. [Google Scholar]
  35. Gómez Bahillo, C.; Sanaú Villarroya, J. La Exposición Internacional Zaragoza 2008. In Proceedings of the Consejo Económico y Social de Aragón. Colección de informes, Zaragoza, Spain, 14 June–14 September 2008. [Google Scholar]
  36. Rosseel, Y. The Lavaan Tutorial; Department of Data Analysis, Ghent University: Ghent, Belgium, 2017. [Google Scholar]
  37. Serrano Sanz, J.M.; Gómez Loscos, A.; Pérez y Pérez, L.; Sanaú Villarroya, J.; Sanz Villarroya, I. Los Efectos Económicos de la Expo Zaragoza 2008; Fundear: Zaragoza, Spain, 2009. [Google Scholar]
  38. Barlés, M.J.; Ansó, S. El turismo de negocios y congresos en Zaragoza tras la Expo: Un estudio exploratorio. Rev. De Gest. Públ. Y Priv. 2009, 14, 11–38. [Google Scholar]
  39. Duarte, R.; Jiménez, S.; Langarita, R.; Sánchez-Choliz, J. Evaluating the structural effects of a big cultural event: The case of the International Expo Zaragoza 2008. Reg. Sec. Econ. Stud. 2015, 15, 62–76. [Google Scholar]
  40. Molina Chueca, J.A. Evidencia Socioeconómica de la Expo 2008; Ayuntamiento de Zaragoza: Zaragoza, Spain, 2009. [Google Scholar]
  41. Fernández-Ges, A. Processes, urban impact and evaluation of the high-speed rail in the city of Zaragoza, Spain. 360 Rev. De Alta Veloc. 2018, 6, 179–205. [Google Scholar]
  42. Saura Rami, J.A. Expo Zaragoza 2008 and its impact on urban place names. Alazet 2015, 27, 125–129. [Google Scholar]
  43. Sotelo Pérez, M.; Sotelo Navalpotro, J.A. Cambios y transformaciones urbanas en Zaragoza, tras la Expo del 2008. Obs. Medioambient. 2016, 19, 249–286. [Google Scholar] [CrossRef]
  44. Pellicer Corellano, F. Expo Zaragoza 2008: La metamorfosis de las riberas del Ebro. Econ. Aragon. 2008, 37, 54–74. [Google Scholar]
Figure 1. The partnership monitoring and evaluation framework. Source: Van Tulder et al. [15].
Sustainability 11 03860 g001
Figure 2. Perceptual map of the model used to assess the impacts of the EXPO (blue continuous lines are the direct effects and red discontinuous lines are the operational, tactical and strategic efficiencies). The 5% significant coefficients are marked with (*).
Sustainability 11 03860 g002
Table 1. Items analyzed together with the indicator to which they are associated +.
IndicatorItemMeaning
Input
(Valuation of the physical elements and organization of the EXPO)
p.17_1The architecture of the buildings was the most appropriate for the content of the exhibition
p.17_2The contents of the pavilions were appropriate for the theme of the international exhibition “Water and sustainable development”
p.17_4The EXPO volunteer staff appropriately transmitted the message of the EXPO on water and sustainable development to the visitor
p.17_6The organization and operation of the EXPO was adequate
Output EXPO Inner
(Valuation of inner EXPO effects exerted on its visitors and as a consequence of its activities)
p.08_4The EXPO spread knowledge of other countries and cultures about their relations with water and sustainable development
p.08_5The event was a place of leisure and recreation for citizens
p.08_7The managing entities demonstrated a great capacity of management giving an adequate image of the city
Output EXPO Outer
(Valuation of outer EXPO effects on the daily life of citizens of Zaragoza)
p.09_1The economic cost was compensated by the social benefits of the event
p.09_3There was a generalized rise in prices of basic goods during the EXPO celebration period due exclusively to the event
p.09_4There were serious problems in the city including daily traffic jams, increased crime, etc.
Output FARO
(Valuation of effects of the FARO pavilion)
p.17_3The FARO pavilion highlighted awareness among visitors of the problems related to water and sustainable development
p.17_5The message of the FARO pavilion positively influenced my awareness of the problems of water and sustainable development
Outcome NGOs
(Valuation of short and medium-term effects of the EXPO and FARO on the work of NGOs)
p.17_7My perception of the work of NGOs in the world was reinforced thanks to the EXPO
p.17_8The NGOs have shown that they can work together to solve these types of problems
Outcome City
(Valuation of short and medium-term effects of the EXPO on Zaragoza)
p.08_1Thanks to the EXPO, Zaragoza is now more internationally known
p.08_6Thanks to the EXPO, Zaragoza has achieved a modernization of its infrastructures that could not have been achieved without it
Impact Awareness
(Valuation of long-term effects of the EXPO on awareness of water and sustainable development)
p.08_2The EXPO created greater awareness among citizens of the problems related to water and sustainable development
p.08_3The EXPO created greater awareness among organizations (public and private) of the problems related to water and sustainable development
Impact City
(Valuation of long-term effects of the EXPO on Zaragoza)
p.08_8The citizens of Zaragoza believe that the future of the city has improved after the EXPO
p.08_9The citizens of Zaragoza feel more confident in their own possibilities after the EXPO
Note: + The answers to the items were measured on a 7-point Likert scale (1: strongly disagree, 2: disagree, 3: slightly disagree, 4: neutral, 5: slightly disagree, 6: agree, 7 strongly agree).
Table 2. Descriptive study of the items.
IndicatorItemObs.Miss.Min.Q1MedianMeanQ3Max.St. Dev.
Inputp.17_144872555.30671.15
p.17_2442131565.79771.15
p.17_4443122455.20671.27
p.17_6444112455.23671.24
Output EXPO Innerp.08_445321465.42771.50
p.08_545322566.06771.14
p.08_744691454.71671.27
Output EXPO Outerp.09_145051454.79671.64
p.09_344871233.19471.70
p.09_445051222.75471.56
Output FAROp.17_3439161454.56671.33
p.17_5440151354.52671.46
Outcome NGOsp.17_7438171454.73671.41
p.17_8433221455.17671.30
Outcome Cityp.08_145321465.31671.34
p.08_645412565.91771.15
Impact Awarenessp.08_245141454.50571.33
p.08_3445101344.21571.36
Impact Cityp.08_844961455.17671.29
p.08_9445101454.95671.42
Table 3. Measurement model.
IndicatorItemFactor loadings (aij)Intercepts (μi)Error Variances ( σ i 2 )
EstimateSEp-ValueEstimateSEp-ValueEstimateSEp-Value
Inputp.17_10.7640.0520.0005.2970.0540.0000.7430.0590.000
p.17_20.9500.0560.0005.1870.0600.0000.7130.0650.000
p.17_40.7350.0530.0005.7790.0540.0000.7790.0610.000
p.17_60.8120.0560.0005.2340.0580.0000.8610.0680.000
Output EXPO Innerp.08_40.8720.0540.0005.4190.0700.0000.8610.0820.000
p.08_50.6080.0420.0006.0550.0540.0000.6400.0530.000
p.08_70.5340.0500.0004.7140.0600.0001.1060.0830.000
Output EXPO Outerp.09_11.0480.0670.0003.2090.0770.0001.2830.1130.000
p.09_3-1.2040.0700.0003.2050.0800.0001.0430.1040.000
p.09_4-1.1560.0610.0002.7460.0730.0000.7160.0880.000
Output FAROp.17_30.5530.0490.0004.5500.0630.0000.9560.0780.000
p.17_50.6930.0590.0004.5040.0690.0000.8760.0840.000
Outcome NGOsp.17_70.4700.0710.0004.7150.0670.0000.5570.0640.000
p.17_80.4440.0660.0005.1380.0620.0000.4330.0540.000
Outcome Cityp.08_10.3740.0680.0005.3130.0630.0000.8140.0710.000
p.08_60.2030.0410.0005.9080.0540.0001.0340.0730.000
Impact Awarenessp.08_20.7130.0430.0004.5030.0620.0000.4370.0570.000
p.08_30.7460.0470.0004.2170.0640.0000.3970.0600.000
Impact Cityp.08_80.5180.0450.0005.1670.0610.0000.5410.0550.000
p.08_90.6180.0570.0004.9360.0670.0000.4120.0650.000
Table 4. Structural model.
Output EXPO InnerOutcome CityImpact City
EstimateSEp-valueEstimateSEp-valueEstimateSEp-value
βOutput_Inner,Input0.8920.0910.000βOutput_Inner,Outcomes_City1.8270.3790.000βOutcomes_City,Impacts_City0.5960.1250.000
βOutcomes_NGOs,Impacts_City0.1540.0460.001
Output EXPO OuterOutcome NGOsImpact Awareness
EstimateSEp-valueEstimateSEp-valueEstimateSEp-value
βOutput_Outer,Input0.5210.0680.000βOutput_Faro,Outcomes_NGOs1.4450.2620.000βOutcomes_City,Impacts_Awar0.3820.0790.000
Output FAROβOutcomes_NGOs,Impacts_Awar0.1740.0410.000
EstimateSEp-value
βOutput_Faro,Input1.2800.1380.000
σOutput_City,Output_Expo0.4750.0560.000
RMSEA0.08595% CI
(0.078, 0.091)
SRMR0.065
CFI0.889
TLI0.868
Table 5. Effects of the EXPO in the short-, medium- and long-term.
EfficiencyEstimateSEp-Value
Operational EXPO (1)0.8920.0910.000
Operational City (2)0.5210.0680.000
Operational FARO (3)1.2800.1380.000
Tactical City (4)1.6290.3340.000
Tactical NGOs (5)1.8510.3300.000
Strategic City (6)1.2560.1470.000
Strategic Awareness (7)0.9450.0920.000
(1) βOutput_Inner,Input (2) βOutput_City,Input. (3) βOutput_Faro,Input. (4) βOutcome_City,Output_Inner* βOutput_Expo,Input. (5) βOutcome_NGOs,Output_Faro* βOutput_Faro,Input. (6) βImpact_City,Outcome_City* βOutcome_City,Output_Inner* βOutput_Inner,Input + βImpact_City,Outcome_NGOs* βOutcome_NGOs,Output_Faro* βOutput_Faro,Input. (7) βImpact_Awareness,Outcome_City* βOutcome_City,Output_Inner* βOutput_Inner,Input + βImpact_Awareness,Outcome_NGOs* βOutcome_NGOs,Output_Faro* βOutput_Faro,Input.

