Risk Identification and Evaluation of the Long-term Supply of Manganese Mines in China Based on the VW-BGR Method
by
 ,
,
Shule Li
1,2,3, 
Jingjing Yan
1,2,3,*,
Qiuming Pei
4,*,
Jinghua Sha
1,2,3,
Siyu Mou
1,2,3 and
Yong Xiao
4
1
School of Economics and Management, China University of Geosciences, Beijing 100083, China
2
Key Laboratory of Carrying Capacity Assessment for Resource and Environment, Ministry of Land and Resource, Beijing 100083, China
3
Lab of Resources and Environmental Management, China University of Geosciences, Beijing 100083, China
4
Faculty of Geosciences and Environmental Engineering, Southwest Jiaotong University, Chengdu 611756, China
*
Authors to whom correspondence should be addressed.
Sustainability 2019, 11(9), 2683; https://doi.org/10.3390/su11092683
Submission received: 20 April 2019
/
Revised: 7 May 2019
/
Accepted: 8 May 2019
/
Published: 10 May 2019
Abstract
:Manganese is mostly used in the iron and steel industry and serves as an important metal mineral in the national economy. It is difficult to substantially increase the output of China’s manganese ore because it is of low grade and high impurity content. However, as a large consumer in the world, it is very important to ensure the long-term stable supply of this mineral. Collecting historical data on manganese ore in China over the past 20 years, we identified and evaluated risks during the whole process of production, supply, consumption, reserves, and trade of resources using the Volkswagen and German Federal Institute for Geosciences and Natural Resources (VW-BGR) method by selecting nine indicators: current market equilibrium, market price volatility, Reserve/production ratio, import dependence, import concentration, country risks, country concentration and future supply and demand trend. Furthermore, we assessed its economic importance by calculating the contribution of manganese ore involved in different value chains. It shows the same downward trend both in manganese ore consumption and economic importance, and the future demand of manganese ore will slow down, and the global supply will exceed demand. Based on the comprehensive evaluation of supply and demand trends in the past and future, it was concluded that the current market balance, import dependence and country concentration risks are the main driving factors for the supply risk of manganese ore in China, showing higher supply risk than that of the other factors; the resource and geostrategic risks are moderate, and may significantly reduce the supply risk if effective measures are implemented. As per the aforementioned analysis, to address the risk of supply interruption, this study provides some suggestions and measures, such as strengthening resource reserves and low-grade manganese ore utilization at home, actively exploring foreign markets, exploiting overseas resources, expanding import channels, extending the industrial chain, and adopting equity mergers and acquisitions abroad.
1. Introduction
During the 21st century, as China, India and other emerging economies are rapidly developing, and the global economy and resource consumption are markedly increasing, infrastructure construction shows a great demand for mineral resources and high-tech dependence on specific mineral materials. Therefore, mineral resources still serve as an important material basis for economic and social development, and are generally confronted with a severe shortage [1,2]. With the acceleration of industrialization, urbanization and internationalization, the demand for mineral resources during the process of global economic and social development will continue to expand, leading to a relationship between supply and demand. In this context, the supply of mineral resources is not only subjected to limited resources, but is also greatly challenged by the difficulties in ensuring sustainability and safety [3,4,5]. Manganese ore is among the basic industrial bulk raw material minerals; manganese and alloys are widely used in various domains such as the iron and steel industries, nonferrous metallurgy, the chemical industry, electronics, batteries, agriculture and medicine. Approximately 90% of the consumption of manganese is to produce manganese ferroalloys, which can remove impurities and improve the physical properties of steel during the process of steel-making. In 2018, given its important effect in the iron and steel industries, manganese ore was listed by the U.S. Department of the Interior as one of the 35 key minerals affecting the U.S. economy and national security [6]. Hence, ensuring its adequate, stable and sustainable supply is a strategic demand of economic and social development.
The risk assessment of mineral resources supply is closely related to the “Criticality” assessment of mineral resources, as defined by the National Research Commission (NRC). The importance of minerals can be described as a function and expressed in the form of an effective graph, in which the vertical axis reflects the effectiveness in use and the horizontal axis measures its effectiveness which is termed a critical matrix, aiming to help decision makers implement appropriate measures to avoid the shortage of a mineral resources supply [7]. Subsequently, the European Commission has also developed this method and adopted more authoritative indicators in the selection and weight of supply risk indicators. Some scholars have introduced both environmental risk and supply risk into the assessment of material “Criticality” [8,9,10,11]. In recent years, the supply risk assessment of raw materials of criticality is growing popular among state public institutions, banks, and mining corporations [12] because of its importance. Studies of “supply risk” and “supply risk interruption assessment” are common and key points in the relevant literature on criticality materials [12,13]. In many cases, some institutions and scholars must first define the concept of critical materials from a qualitative point of view, and then analyze the supply diversity of such materials to determine whether there is a potential risk of supply interruption [7,14,15,16,17,18]. However, to date, no global consensus on the definition of material criticality has been reached. Scholars may empirically choose different definitions according to the scope of the study and the main target, which are subjective factors. Therefore, it is necessary to introduce some measurement models into the study of supply risk of critical materials [12] to assess whether supply risk is likely to be interrupted. In terms of the selection of model methods, predecessors have generally used multiple regression analysis, multicriteria decision analysis and the Monte Carlo method to calculate and conduct simulation analysis on the degree of supply risk of critical mineral resources [19,20,21,22]; however, these methods are more suitable for the analysis of medium- to short-term supply risk of mineral resources. Mr. Leontief (in 1982), the Nobel Prize winner in economics, once proposed that there was no supply risk in mineral resources over the short term, and the longer the historical data analysis of mineral resources would extend, the further the future could be predicted; only in this manner could the future risk of using raw materials be decided [23,24]. Accordingly, to predict the long-term supply and demand situation of mineral resources is an important analysis method for assessing the supply risk of mineral resources through the analysis of their supply and demand situation and the historical data of the factors affecting the change in supply and demand. Systematic dynamics, life cycle assessment, the Hubbert peak model and satisfaction function, as well as other measurement research methods, have been used to evaluate the long-term supply risk of raw materials [25,26,27,28]. However, these methods are mostly based on geopolitical risk or one of the corners of market supply and demand to conduct a risk assessment. In fact, it is not convincing to evaluate mineral resources only based on one attribute; since resources boast different attributes, it should be the joint action of several indicators [29].
Many experts and scholars have conducted considerable research regarding the sustainability of manganese ore, industrial policy, market structure and resource status, noting that China’s manganese ore industry faces issues such as low intensification, extensive growth, low utilization efficiency of manganese ore resources, poor sustainable development capability, and a problematic supply situation [30,31,32]. However, most of these analyses, focusing on the downstream products of manganese ore, such as the steel industry and clean energy materials, are based on the global market and are unclear in showing the domestic resources and market conditions. The research methodology used in this study was a combination of trends in supply and demand based on past and future developments developed by Volkswagen AG and the German Federal Institute for Geosciences and Natural Resources (BGR), designed to identify and evaluate an assessment model of critical market long-term of supply risk [3]. The advantage of this method lies in the data fluctuation law being clear in a long time series analysis; and the raw material supply risk reference point can be accurately identified combined with the analysis of each inflection point, peak and trough condition, tracing back to 50 or even 100 years of development status if the data permit, to provide an early warning of supply risks [33].
The assessment of raw material supply risks is challenging because of the complexity of the influencing factors and data availability [19]. Collecting historical data of China’s manganese ore for nearly 20 years, we used the VW-BGR method to identify and evaluate the risks throughout the whole process of production, supply, consumption, reserves and trade of resources and propose risk management strategies at global, regional and domestic levels. The present study aims to quantitatively assess the supply risk of manganese ore in China, help policy makers identify the source of risk and avoid the risk of the disruption of the manganese ore resource supply.
2. Overview of China’s Manganese Ore Resources
The world’s manganese ore resources are abundant, but the distribution is not equitable, as shown in Table 1. South Africa, Ukraine and Brazil have the largest reserves of manganese ore, accounting for more than 60% of global reserves; China’s reserves rank sixth in the world.
The genetic types are mainly sedimentary, volcanic sedimentary, hydrothermal, sedimentary metamorphic and weathering crust [35].
- High grade (Mn > 44%) manganese ore is mainly distributed in South Africa, Australia, Brazil and Gabon in the form of sedimentary metamorphic and weathered crust types;
- India, Kazakhstan and Mexico have medium grade (Mn 30%–44%) manganese ore resources;
- Ukraine and Ghana mainly feature low-grade manganese ore (Mn < 30%) and the deposit types are mainly sedimentary and volcanic.
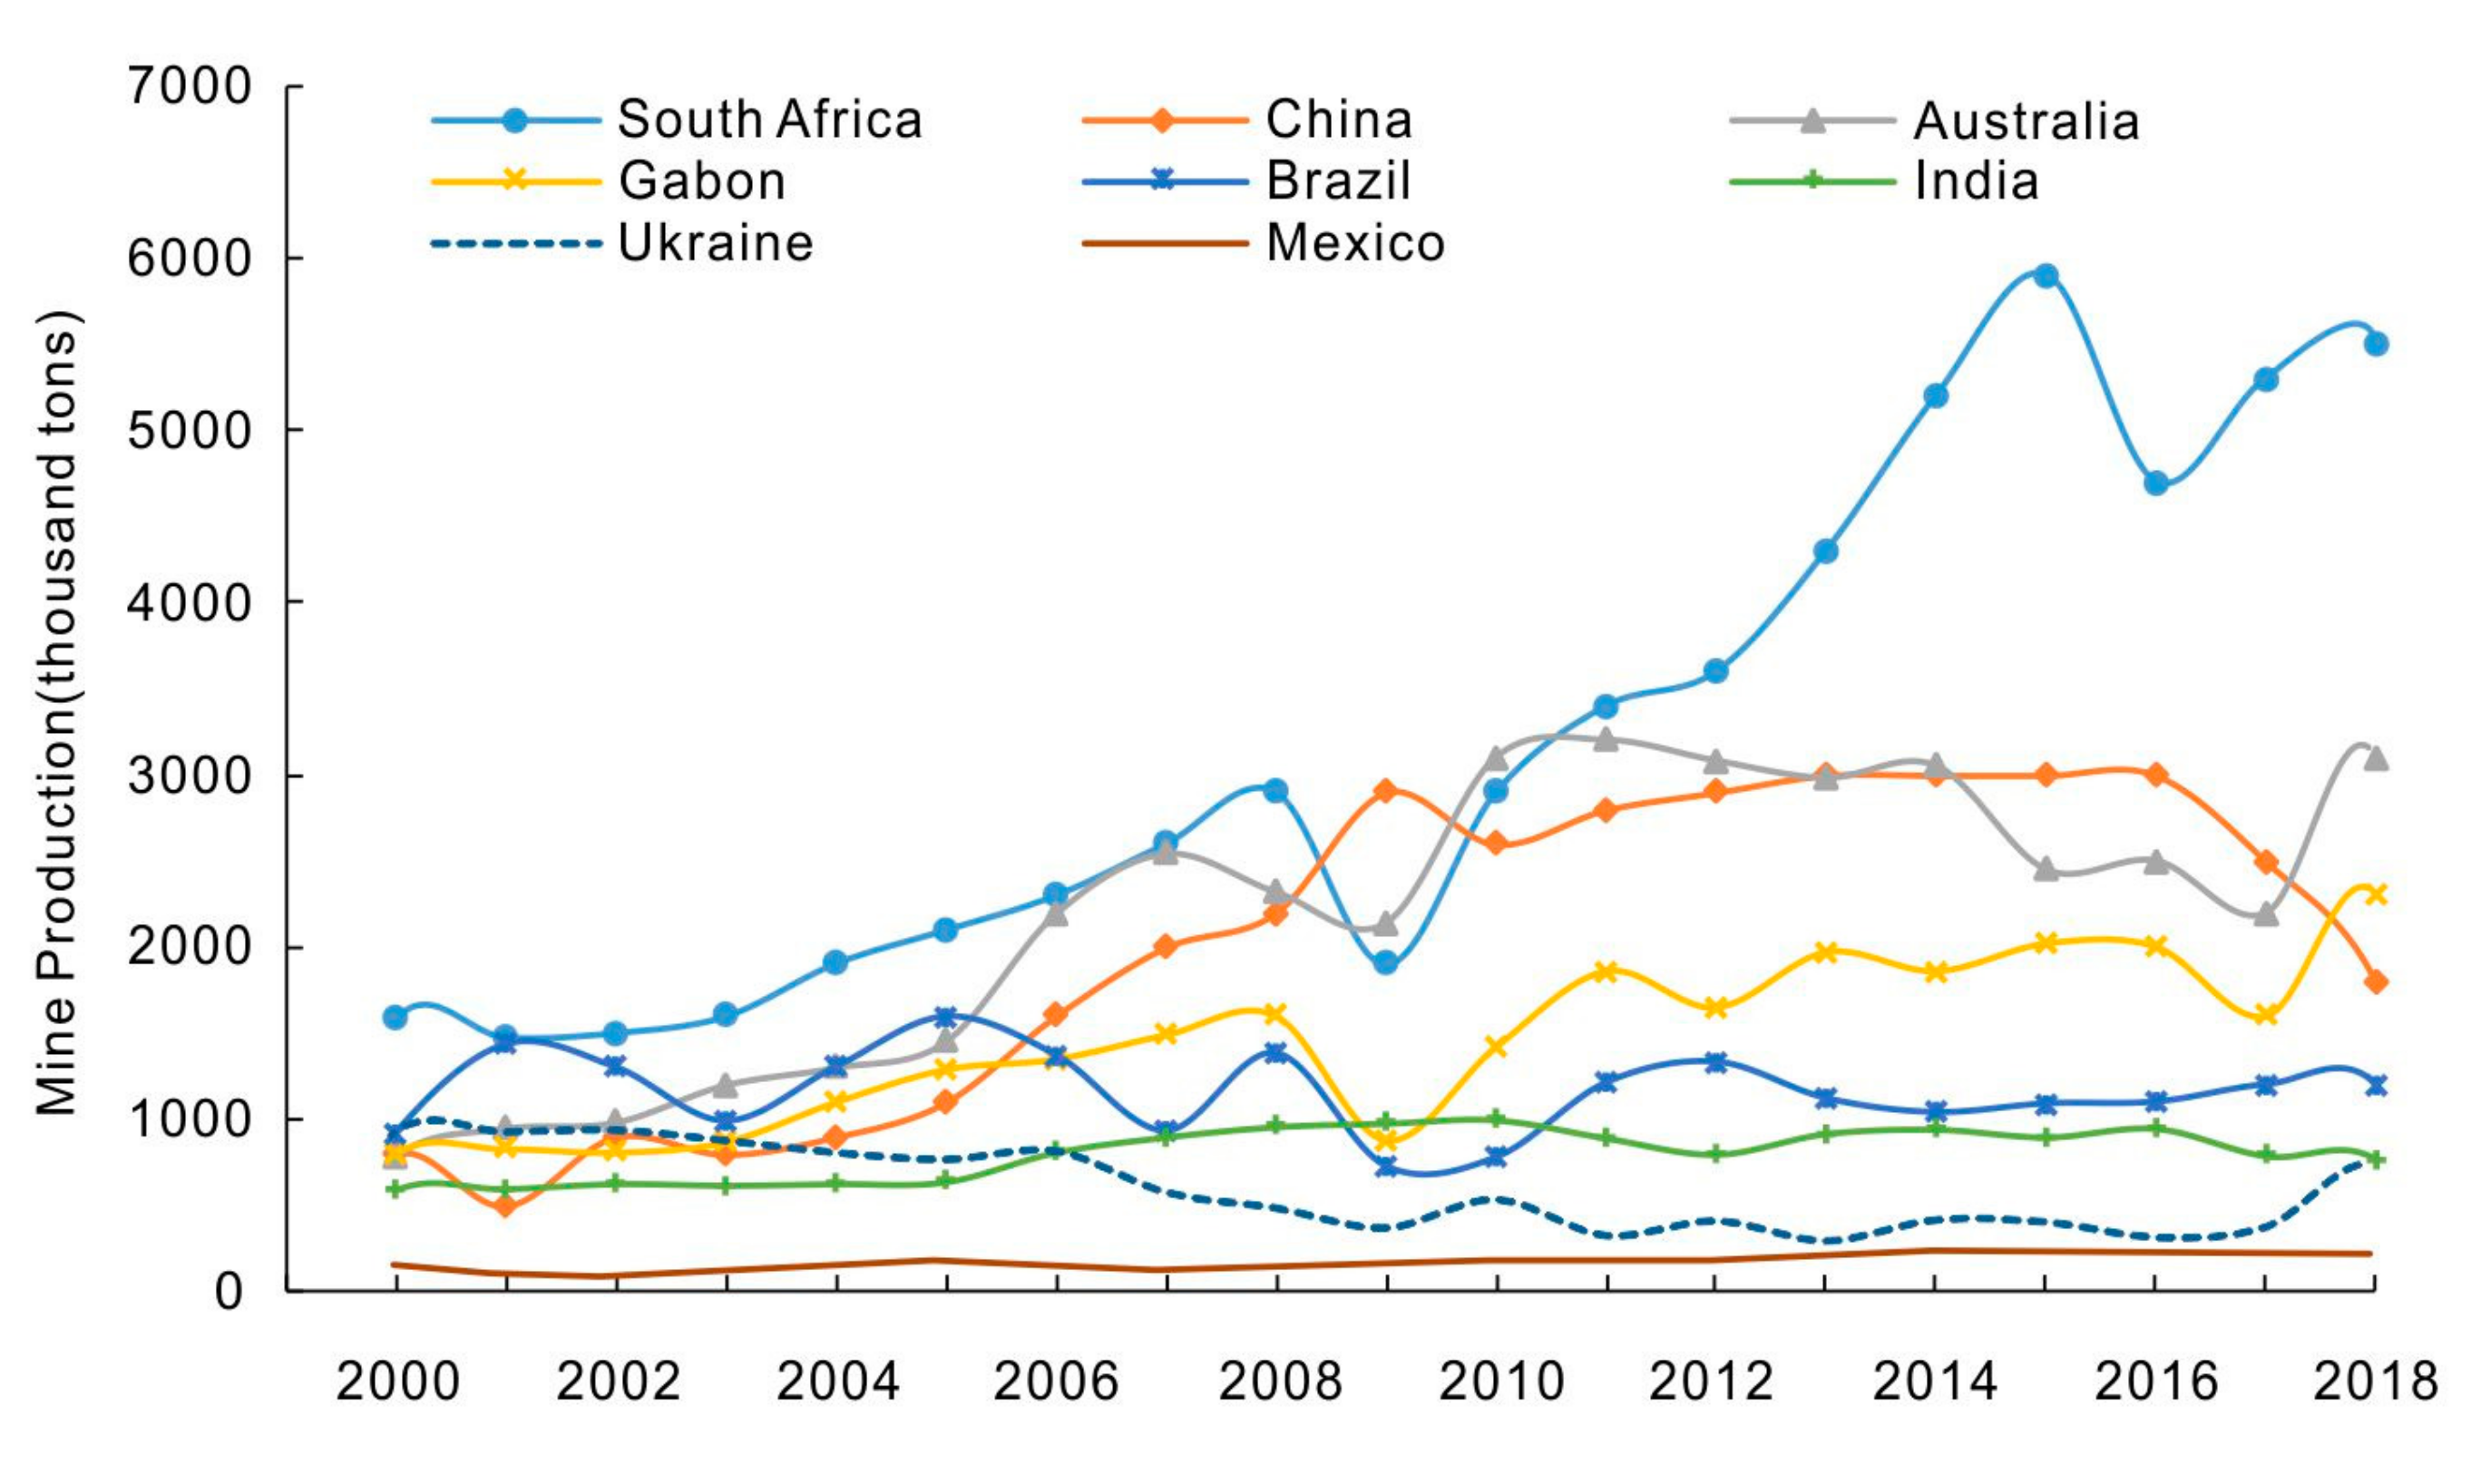
With the upsurge in global mineral development during recent years, the exploration and development of manganese ore throughout the world has significantly increased. Global manganese ore production has increased from 2000 to 2018, with a growth rate of 115.7% (Figure 1). During 2008, despite the impact of the global financial crisis, global production plummeted in 2009; however, it showed steady and rapid recovery and growth during the next few years. This dynamic also showed that the world was gradually moving out of the financial crisis; however, with the impact of the steel surplus, manganese ore global production for all countries decreased during 2016.
China’s manganese ore is mainly distributed in the Pan-Yangtung ancient land to the south, Yanliao to the north, and the Tianshan and Qilianshan mountains to the west, where it is widely distributed and relatively concentrated [37,38]. The Neogene Proterozoic, Early Paleozoic (Cambrian, Ordovician), and Late Paleozoic–Early Mesozoic are important eras for the formation of manganese ore in China. In recent years, manganese ore prospecting has made great progress and breakthroughs with the discovery of medium-large manganese deposits in eastern Guizhou province, southwestern Guangxi Autonomous Region, northwestern Sichuan province, western Kunlun Mountain and northern Tibet [39,40]. Over the past decade, the identified resource reserves of manganese ore have increased by 55.8%. However, more than 90% of these resources are lean manganese ore and the distribution is very uneven. The ore is high in impurities, has high phosphorus, iron and silicon contend, has a fine grain size and is difficult to select and smelt, making it difficult to significantly increase the yield [41].
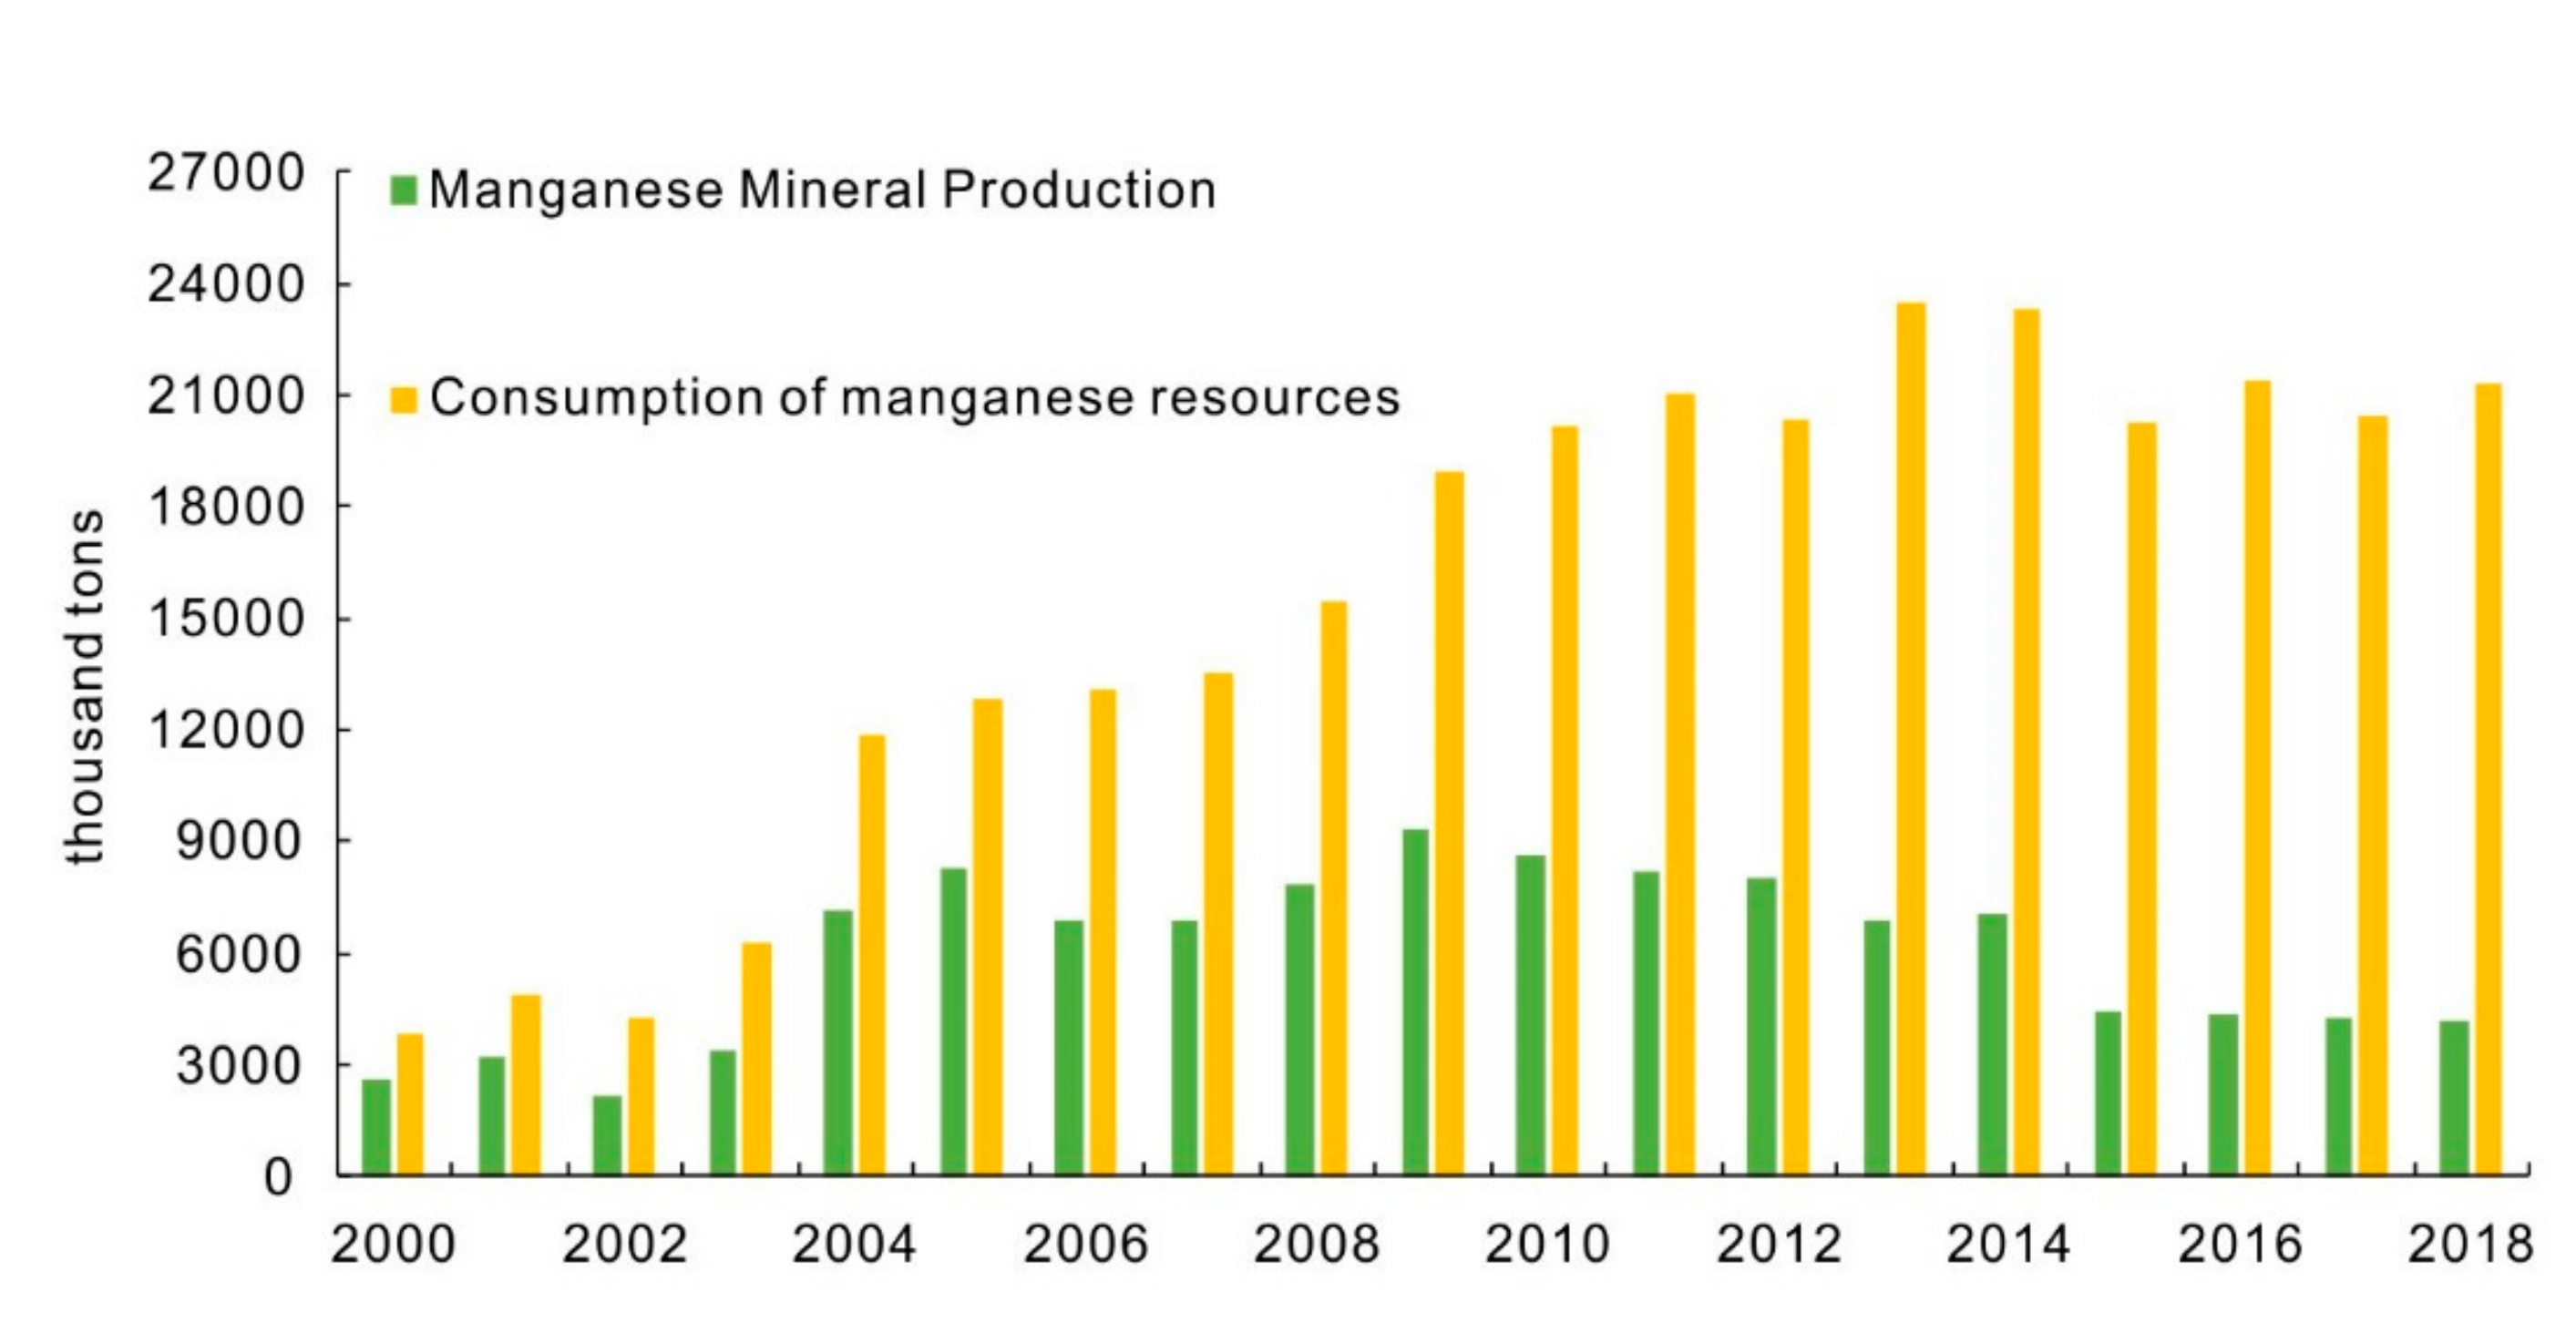
In China, 90% of manganese is used in the steel industry in the form of ferroalloys, and the other 10% is used in batteries and chemicals, etc. Therefore, the changing trend of manganese ore depends on the development of the steel industry. Between 2000 and 2013, with increased urbanization in China, the per capita consumption of manganese-based ferroalloys continued to increase, during which the consumption of manganese ore showed an overall upward trend. Particularly around 2004, when China’s steel industry rapidly developed, the apparent consumption of stainless steel ranked first in the world. Therefore, the long-term supply of domestic manganese ore is threatened with a large gap between supply and demand (Figure 2). It is still necessary to import a large amount of high-quality manganese ore from abroad.
3. Supply Risk of Manganese Ore Based on the VW-BGR Method
Based on time series data, the VW-BGR method can quickly and accurately identify multidimensional supply risks of single minerals, evaluate risk levels, and comprehensively evaluate the overall risk characteristics of minerals. The method evaluates the current risk level according to the historical fluctuation trend of each indicator, determines the upper and lower limits of the interval according to the maximum and minimum values of historical fluctuation values during a certain time period, and then divides the interval into 3 levels and 9 classes. The higher the level, the greater the risk (Table 2).
3.1. Indicator Selection
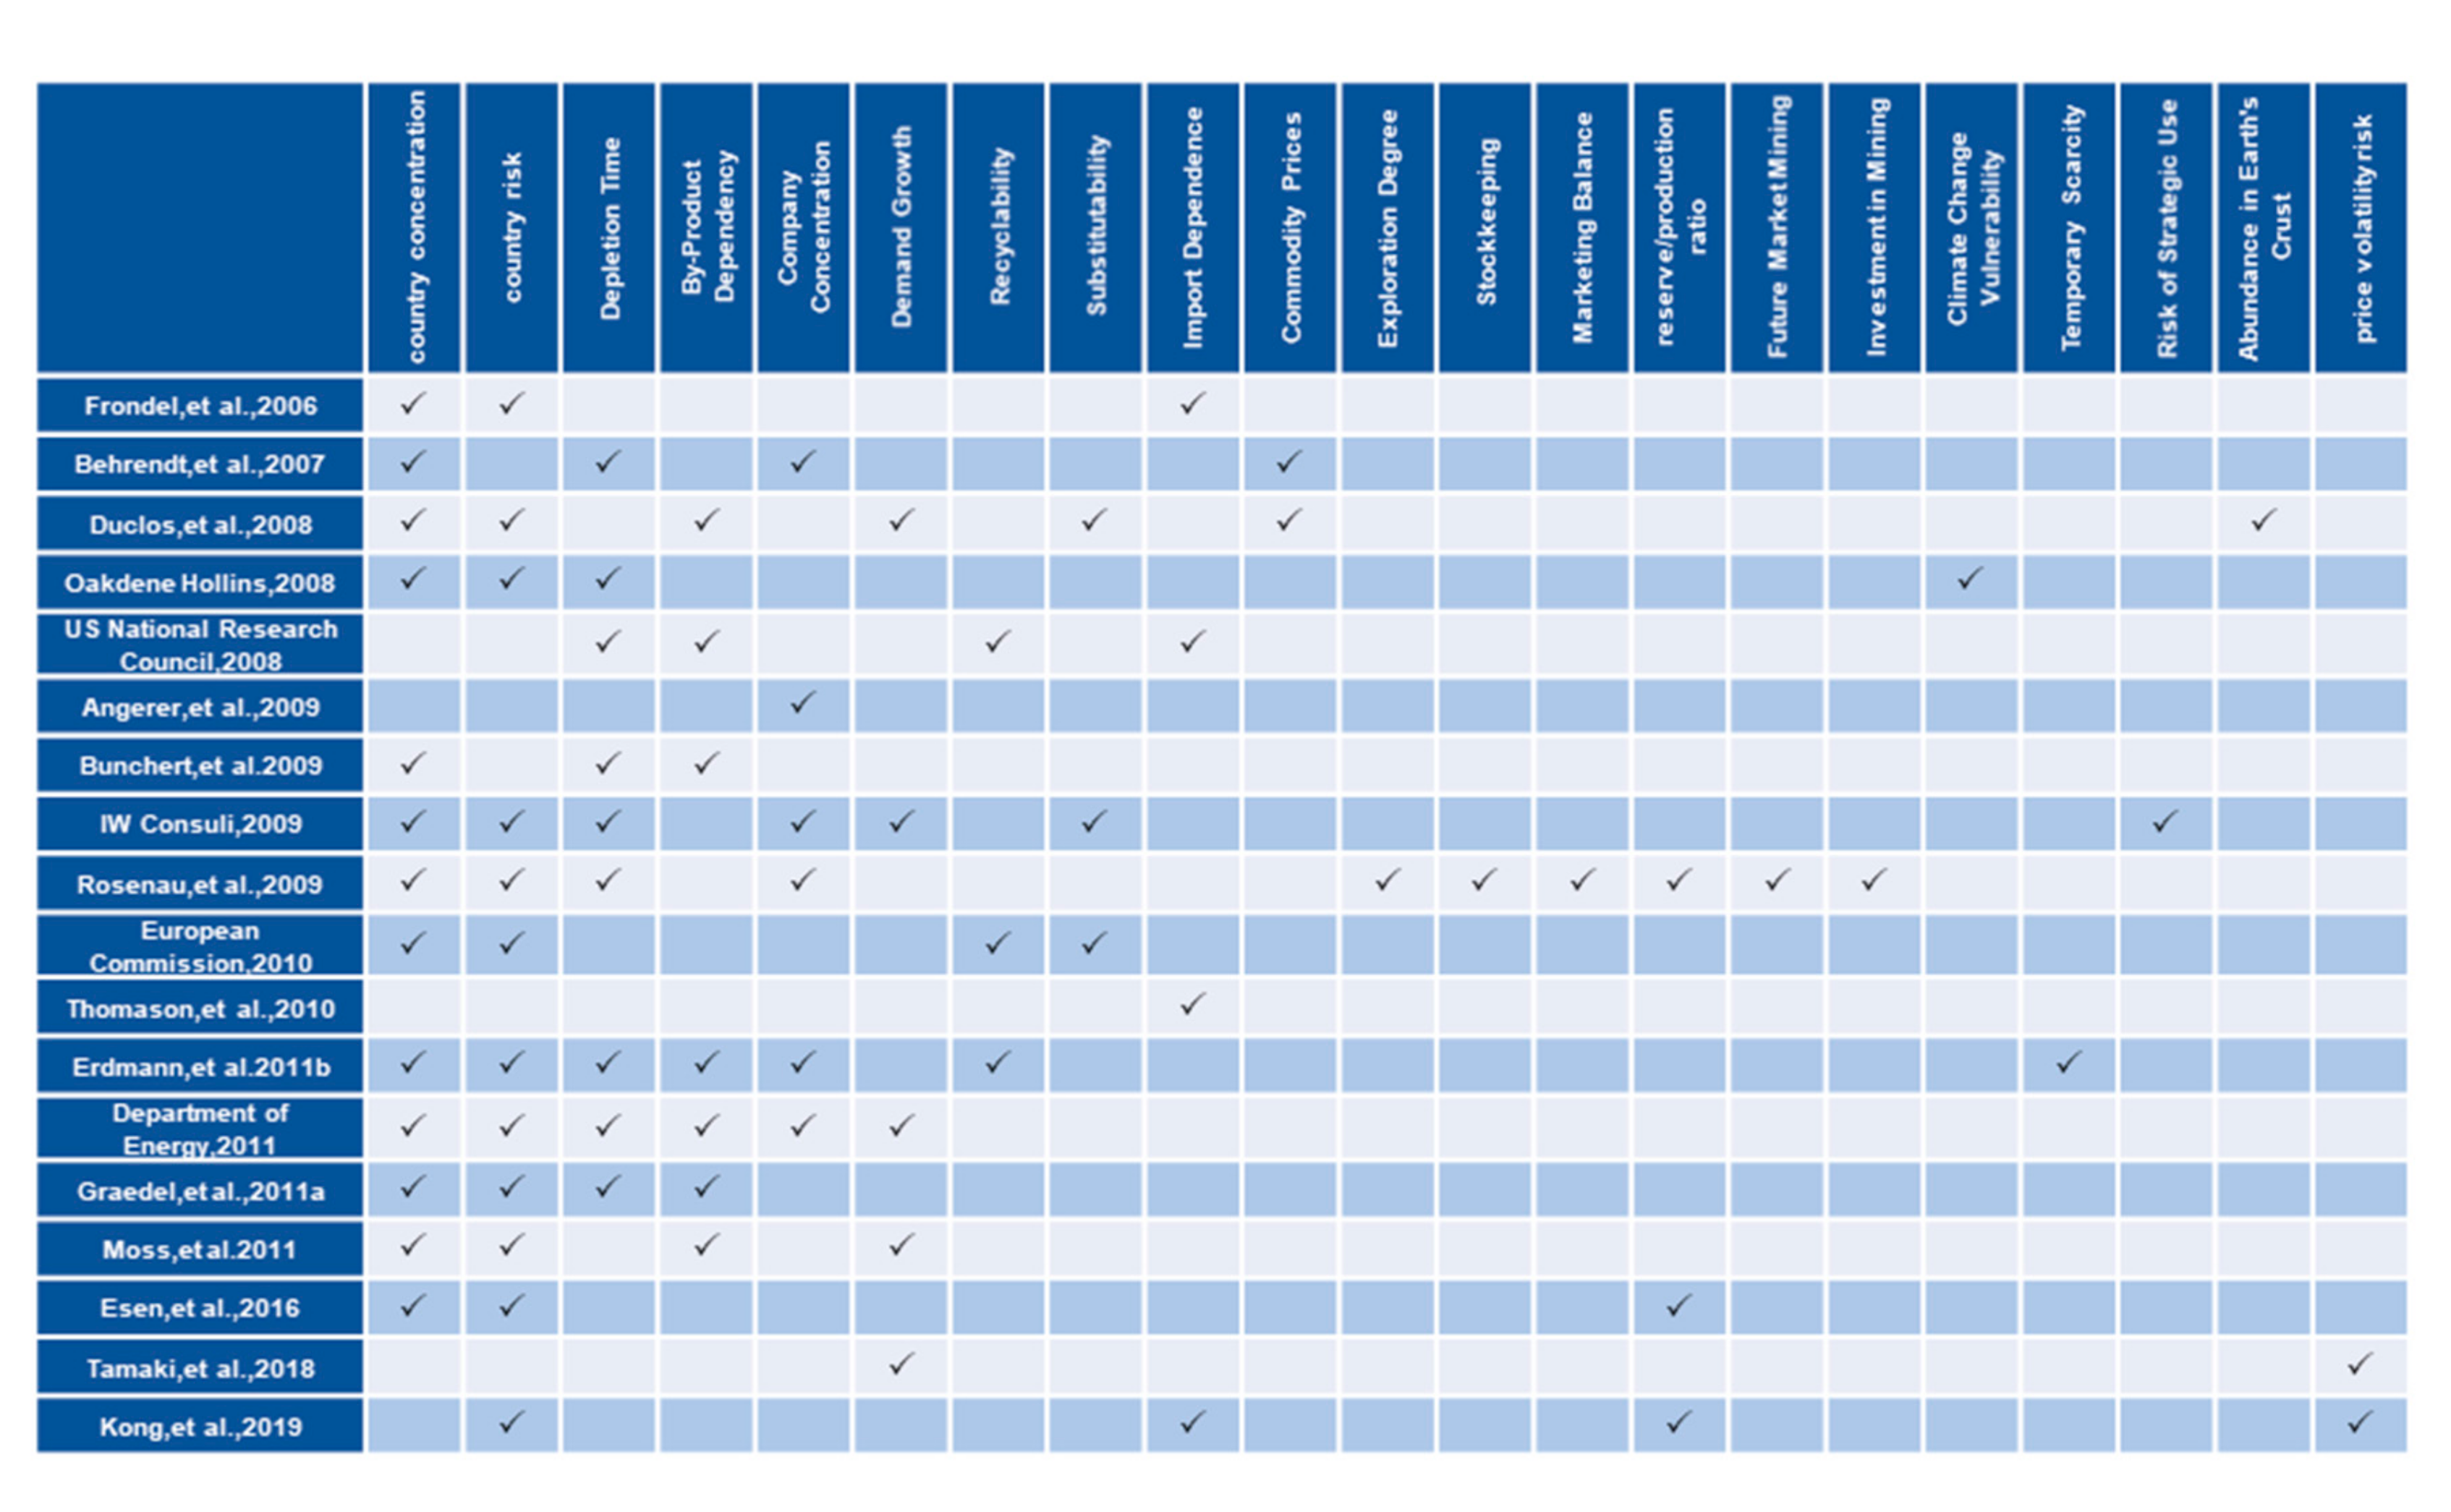
Historical data is taken to analyze the long-term supply risk of mineral resources, the research results of which depend on the analytical indicators adopted. When mineral resources producers and consuming countries formulate public policies on the development and utilization of mineral resources, or there are issues concerning resource security, national security and environment in the future development of new production capacity, different indicators will produce different analysis results. Therefore, when using historical data analysis, it is necessary to use the selected indicators for analysis while assuming that other factors remain unchanged. For the analysis of historical data of mineral resources, it is necessary for the time series of mineral data to be analyzed to be relatively complete, with at least 15 years of complete data, which aids in determining the pattern of changes in consumption patterns and production status. Second, for the analysis of historical data of mineral resources, only factors directly related to mineral resources are used, and cross-effects between mineral resources are not considered. The analysis of each mineral remains independent. Regarding target value supply risks, a total of 21 commonly used indicators have been identified from a synthesis of previous studies used to assess resource availability. Figure 3 shows a detailed allocation between indicators and each supply risk assessment [20,29].
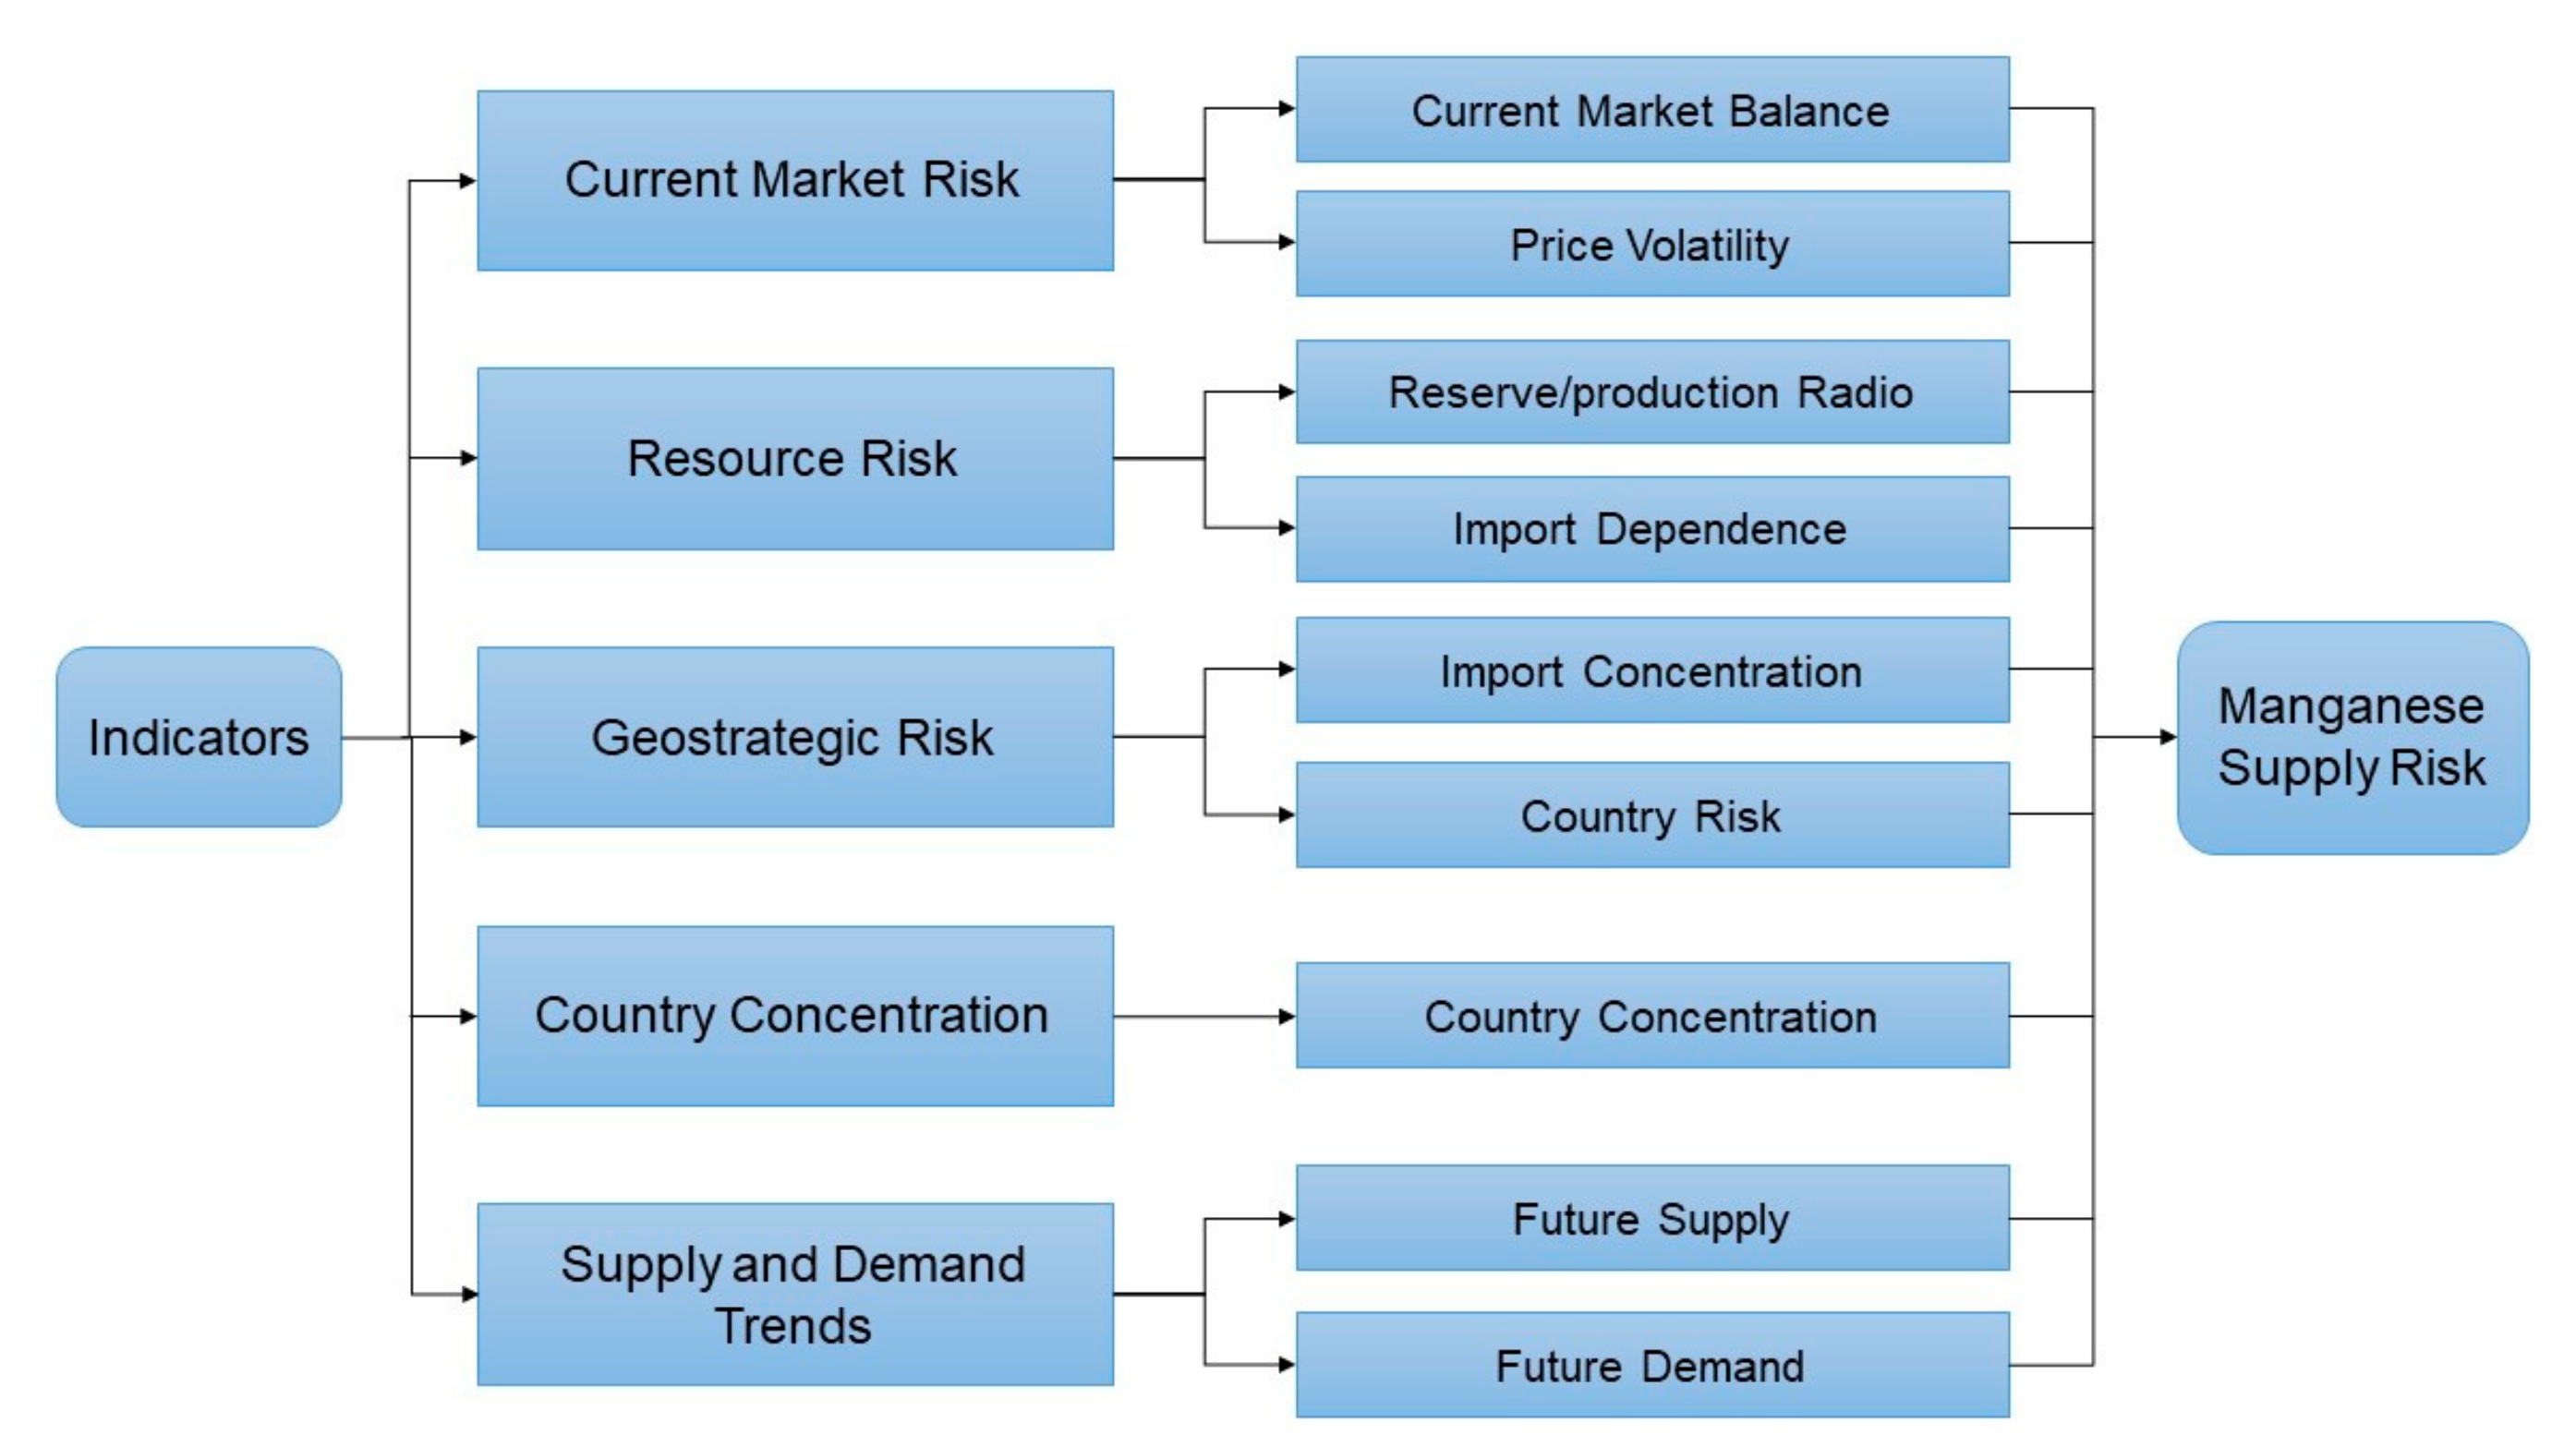
Based on a comprehensive understanding of the market situation of China’s manganese resources over a long time period, using the VW-BGR method we adopted measurable indicators for comprehensive analysis and prediction, evaluating and identifying the main types of risk existing in China’s manganese ore supply, and predicting the market development trend of manganese resources in China. According to the applicability, relevance, accessibility and credibility of the data, five indicators suitable for manganese ore resources were selected to evaluate the risk of manganese supply in China, as shown in Figure 4.
3.2. Current Market Risk (Rating: 8, Problematic)
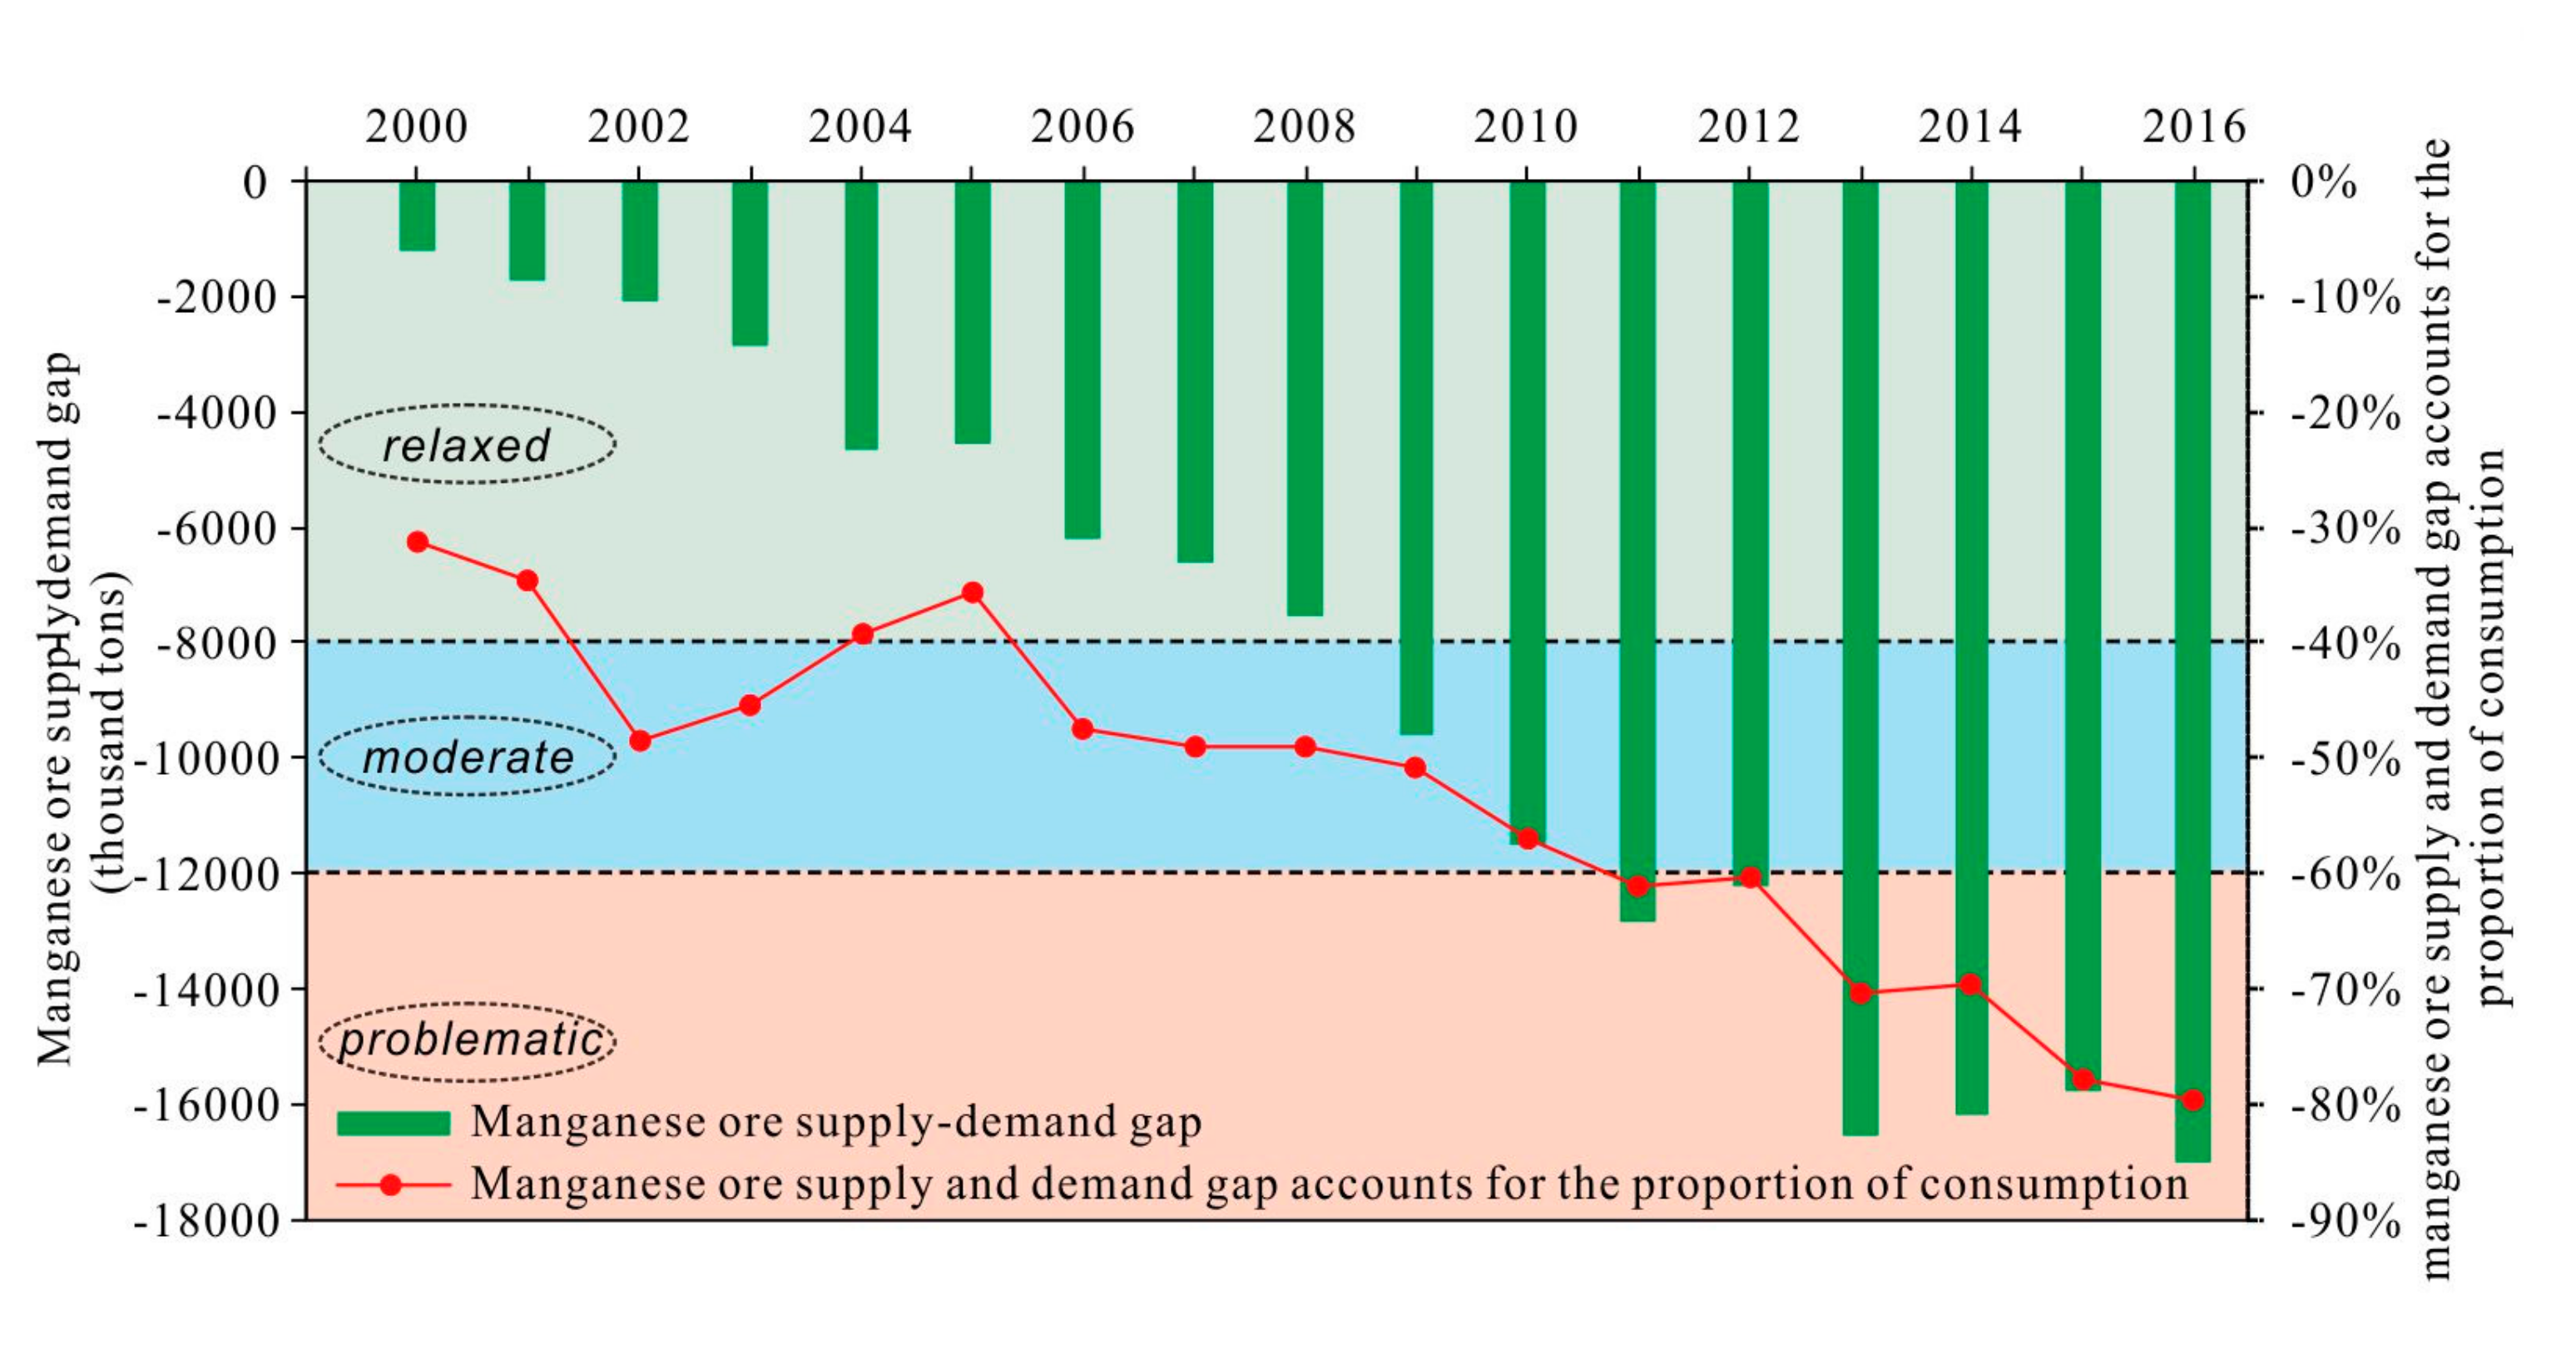
3.2.1. Current Market Equilibrium (Rating: 9, Problematic)
At present, China’s mineral products are restricted by the degree of market development. Serious local protectionism remains in many locations because of the strong regionality of mining development. The phenomena of disorderly mining of mineral resources, strong competition, a low level of comprehensive utilization in the mining industry, reduction in the production cost of mineral products at the cost of wasting resources, ignoring safety, and damaging the environment are widespread, which restrains the normal development of the mineral products market to a certain extent and results in huge market risks. From 2000 to 2016, manganese ore was in short supply. With the development of the national economy and the construction of infrastructure, the gap between the supply and demand gradually expanded. According to the actual situation of manganese ore supply and demand in China, we used the index of the supply and demand gap of manganese ore in China as a proportion of consumption to express the market equilibrium. The calculation formula is as follows:
- : The proportion of the supply demand gap in consumption of manganese mines in China during year t
- : Manganese mineral production in China during year t
- : Apparent consumption of manganese mines in China during year t
According to historical data, the upper and lower limits of the supply demand disparity in the proportion of the consumption are −80% and −30%, respectively. The interval is divided into three levels: −80% to −60% falls into “problematic”, −60% to −40% “moderate”, and −40% to −30% “relaxed”. During 2016, the gap between the supply and demand reached −79.52%, which was “problematic” with a rating of 9 (Figure 5).
3.2.2. Price Volatility (Rating: 7, Problematic)
The mining industry is the basic industry of the national economy. The periodic characteristics of economic development determine that the demand for mineral products and market prices present an obvious periodicity. The effect of the economic development cycle on the product prices and investment returns of mining investment projects are greater than any other industry. The demand for important mineral resources in developing countries is increasing with the rapid development of their economy, and thus stable access to resources has become an important consideration for policymakers in resource-importing countries [2,45]. The current concentration of global manganese production is very high, mainly involving five manganese mining companies: Australia’s BHP Billiton, OM, South Africa’s Assmange, Gabon’s Eramet Comilog and Brazil’s Vale. In 2018, global production of manganese ore from the above five companies accounted for almost 40% of the total market. In addition, the suppliers of manganese resources are large international companies that are small in number, but which play a major role in the global supply chain, consequently granting these suppliers bargaining power. Hence, it is crucial for the producers to procure stable supplies of resources at low prices [2,46]. Considering that the manganese ore pricing system is based on annual contracts, foreign manganese companies often join forces to raise prices substantially. The formula for calculating the price fluctuation is as follows:
- : Absolute value of annual average import price volatility of manganese mines during year t
- : Annual average import price of manganese mines during year t
- : Average annual import price of manganese mines during year t-1
With the integration of the global economy, the production and operation of manganese are concentrated in a few multinational companies. The manganese ore market has been in short supply for a long time, and the countries rich in manganese ore resources have almost monopolized the pricing power of manganese ore. According to historical data, the absolute value of the manganese ore price volatility from 0.47% to 2.3% is set at a “relaxed” state, a “moderate” state when it is less than 0.47%, and a “problematic” state when it is greater than 2.3%. During 2016, the absolute price volatility of the import price of manganese ore was 2.97%; a “problematic” state.
3.3. Resource Risk (Rating:6, Moderate)
Endowment is an inherent natural characteristic of mineral resources, as well as the fundamentality of the availability of domestic mineral resources, including the scale of reserves, types and quality of mineral resources, the degree of mineral resources accumulation, mining conditions, metallurgical processing conditions and the matching degree of mineral resources. The endowment of mineral resources directly determines the availability of domestic mineral resources and will directly affect the supply of domestic mineral resources. Generally, if the reserves account for a large proportion of the world’s total reserves, the reserve/production ratio is high, and the reserves of large- and medium-sized deposits and rich ore reserves account for a large proportion of the domestic total reserves, and if the resource prospects are good, the safety of mineral resources will be high; otherwise, the safety of mineral resources will be low. The supply risk of manganese ore originates from the fact that the reserves and production of manganese ore have difficulty meeting the demand. The imbalance between reserves, production and consumption of manganese ore is measured by the comparison of reserves and production and the degree of import dependence.
3.3.1. Reserve/Production Ratio (Rating: 3, Relaxed)
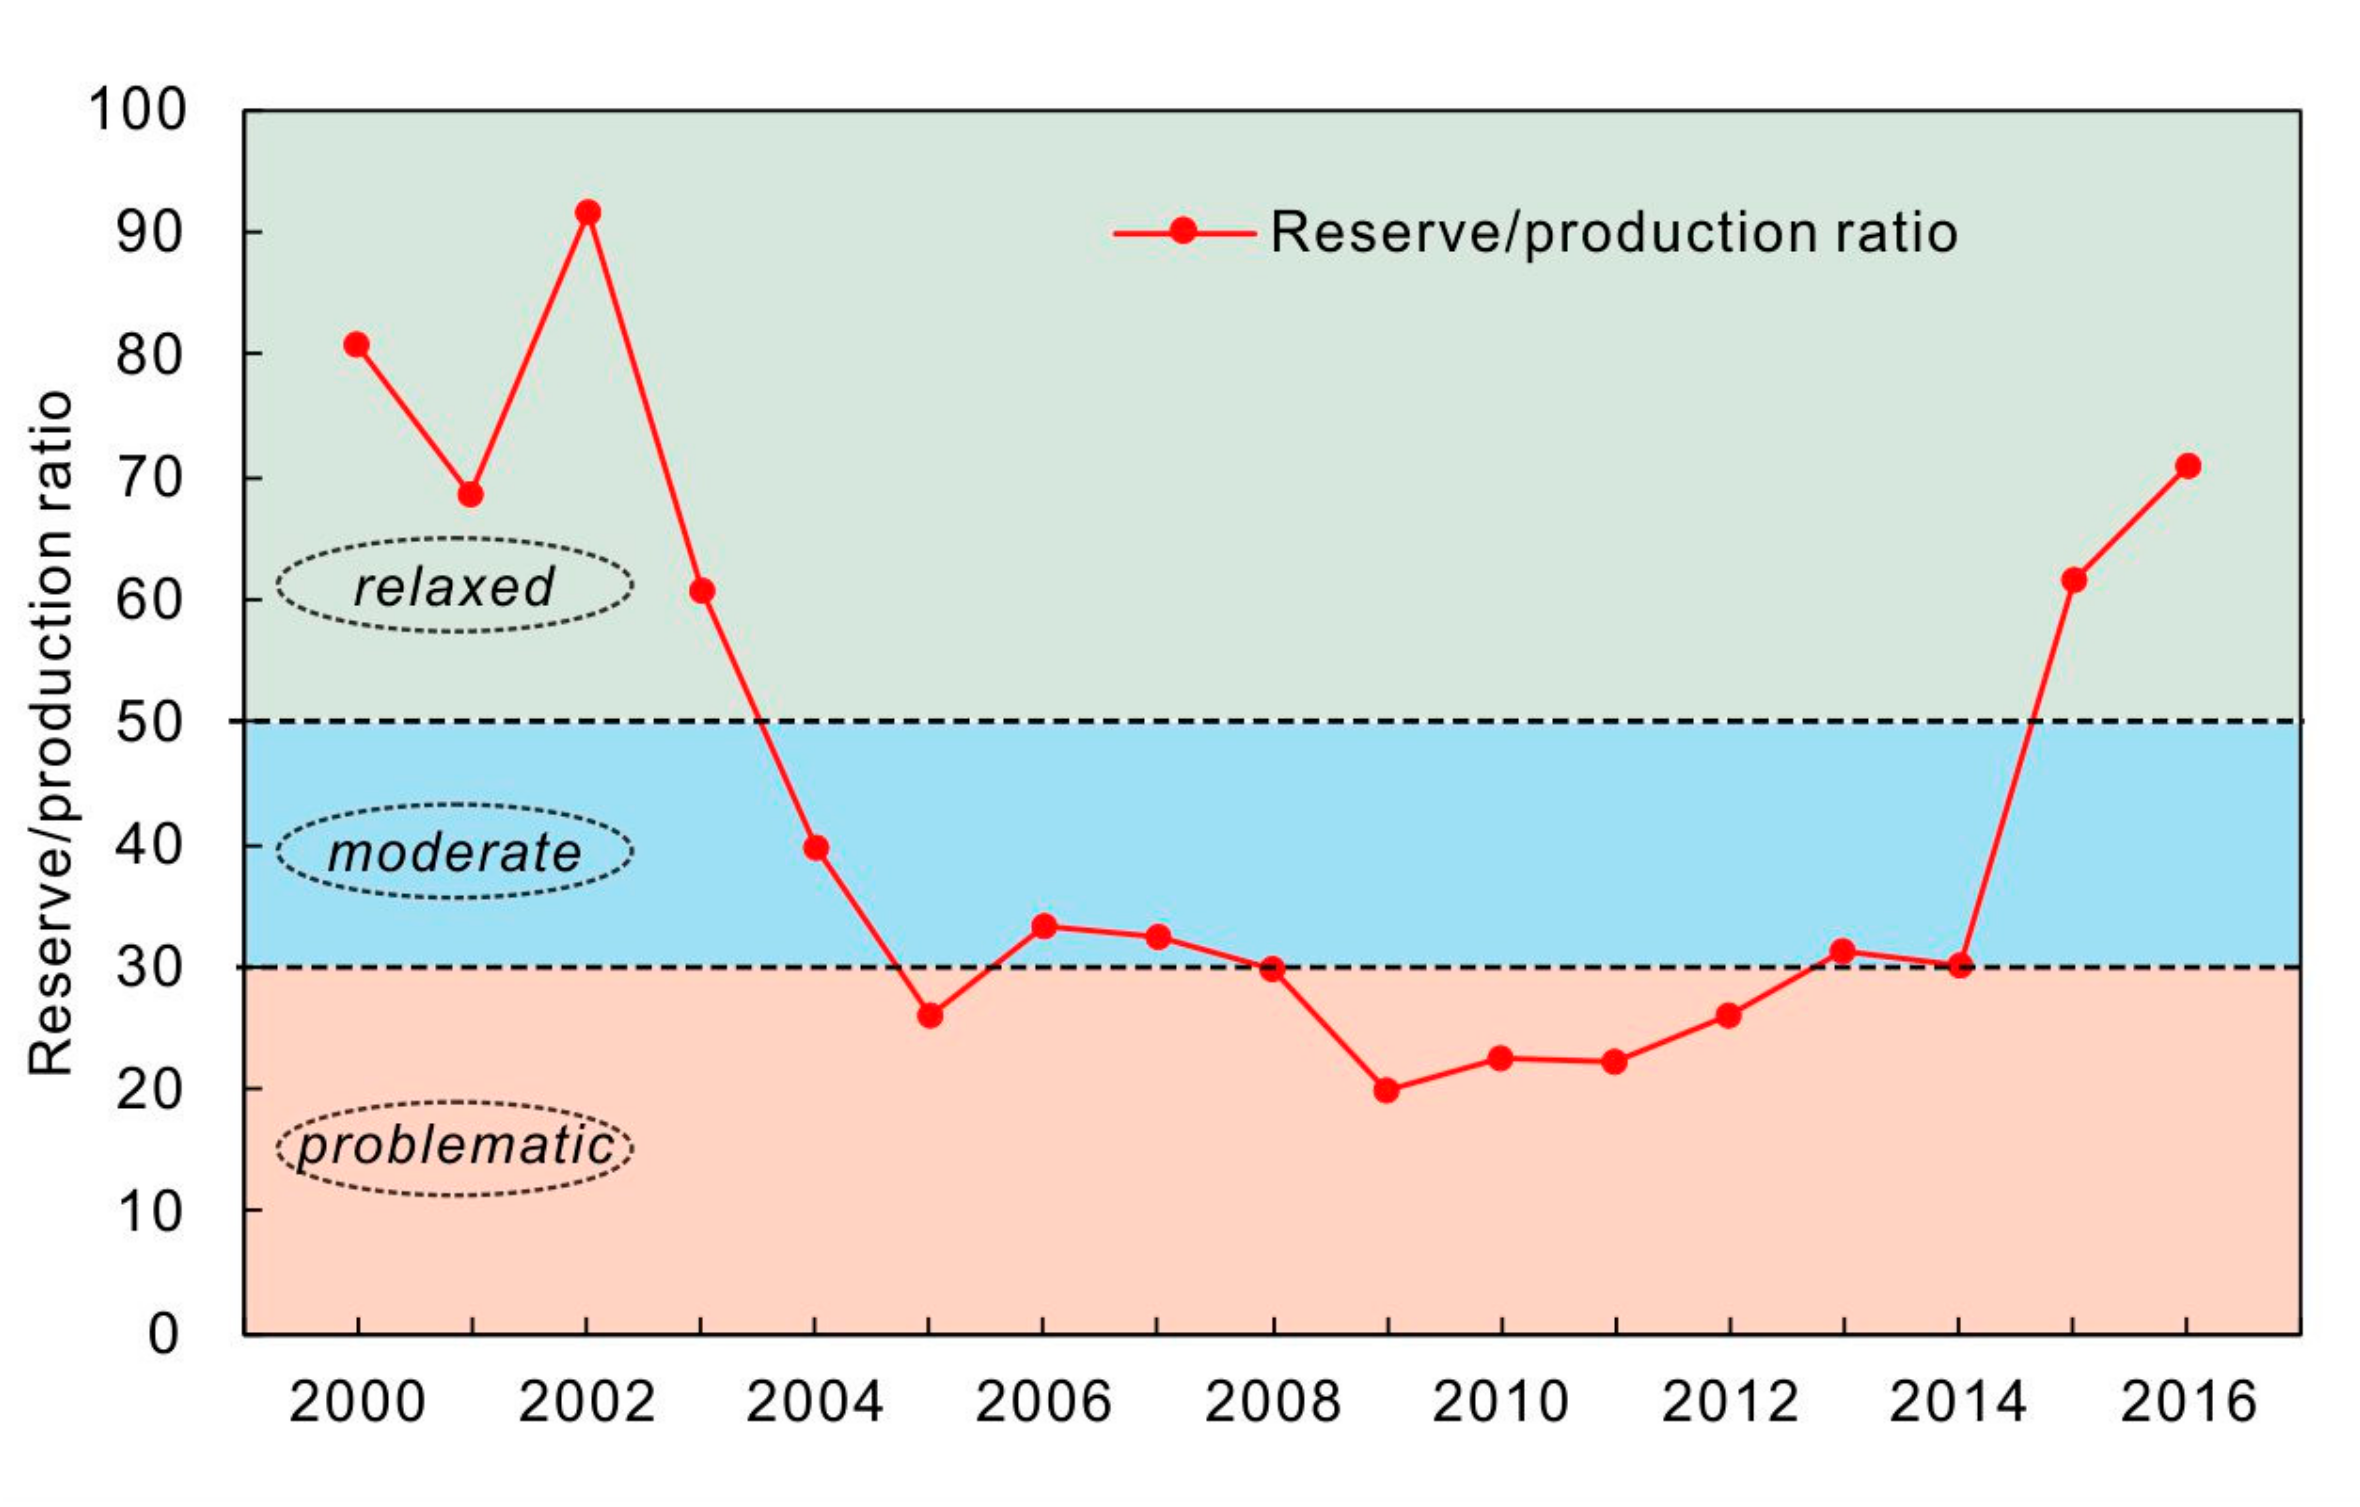
The reserve/production ratio indicator is the basis of determining resource security, that is, how long the remaining resources at present can be used for production and consumption. This indicator represents the sustainability of domestic resources in the event of disruption of the external resource supply, and measures the endowment status of domestic resources [47]. Since 2003, China’s social economy has entered a period of rapid development with the acceleration of industrialization; thus, the demand for manganese ore has continued to steadily grow. With the development of manganese ore gradually increasing, easily mined areas and rich ore are rapidly decreasing. By the end of 2011, the reserves of manganese mines had been greatly reduced compared to prior years, causing the reserve/production ratio to reduce year by year. However, during the 12th Five-Year Plan period, the reserve and production of manganese ores has slowly increased compared to the situation in the past. On the one hand, China comprehensively promoted the strategic action of prospecting breakthroughs, achieving great progress and breakthroughs in the prospecting of manganese ores, and increasing to a certain extent the proven reserves; on the other hand, the demand for manganese ores entered a slower growth period because of the changes in the development of the steel industry, and thus the production of manganese ore declined. Therefore, the ratio of reserves to production during 2016 doubled compared to that during 2010. The calculation formula of the reserve/production ratio is as follows.
- : Reserve/production ratio of manganese mines in China during year t
- : Basic reserves of manganese Mines in China during year t
- : Manganese mineral production in China during year t
To quantify the supply risk, when the reserve/production ratio reaches approximately 30–50, we consider it to be appropriate. If the value is less than 30, supply will be at serious risk. During 2016, the reserve/production ratio of manganese ore in China was 70.8, a “relaxed” state with a rating of 3 (Figure 6).
3.3.2. Import Dependence (Rating: 9, Problematic)
The degree of import dependence of resources mainly reflects how much of the total demand for resources is obtained from abroad through trade. Generally, an increased dependence on international markets means increased risk factors and increased insecurity [48]. At present, China has grown to be the largest importer of manganese ore in the world, and the import dependence of manganese ore in China has remained greater than 50%. After entering the golden age of the mining industry, China has become the world’s largest importer and consumer of manganese resources and is facing a huge risk of its resource supply as its dependence on foreign countries increases year by year, increasing from 31.22% to 79.52% over 17 years. The formula for calculating the degree of import dependence is as follows:
- : Import dependence of manganese mines in China during year t
- : Import volume of manganese mines in China during year t
- : Export volume of manganese mines in China during year t
- : Consumption of manganese mines in China during year t
According to the evaluation criteria of the import dependence degree of minerals in shortage, 20% ≤ x ≤ 40% is relaxed, 40% < x ≤ 70% moderate, and 70% < x problematic. During 2016, the import dependence degree increased to 79.52; thus, it was deemed “problematic”, with a rating of 9 (Table 3).
3.4. Geostrategic Risk (Rating: 6, Moderate)
If importation concentrated in several countries, it is more likely to be affected by the political influence of those countries. Therefore, the key to assessing geopolitical risk lies in the analysis of the concentration of manganese imports and that of the political relationship between the relatively concentrated countries and China. In addition, a stable political background of supplier countries is the basis of ensuring supply. Therefore, the weighted national risk of importing countries was selected to measure the geostrategic risk faced by the importing of manganese ore.
3.4.1. Import Concentration (Rating: 7, Problematic)
The concentration degree of resource imports mainly reflects the concentration degree of the source of importing resources. If the concentration degree of importing resources is high, this indicates that the source of the resource imports is too concentrated, which is not conducive to risk diversification. Although the number of importing countries has increased compared to 2000, South Africa alone accounted for 42.3% of China’s import share during 2016 (Figure 7) because of the increase in the production of major producers of manganese ores such as South Africa and the increased investment in the Chinese market.
Using the Herfindahl–Hirschman Index (HHI) to measure the concentration of importing countries, this study set the score within the interval of 1500–2500 as the benchmark for moderate supply risk (the U.S. Department of Justice and the Federal Trade Commission use values of 1500–2500), 2500 or more as problematic, and 1500 or less as relaxed. The calculation formula is as follows:
- : Concentration of importing country of manganese ore in China during year t
- : During year t, China’s imports of manganese ore in country c accounted for the share of total imports
During 2016, China’s manganese ore import concentration was 2550, the source of imports was too concentrated, and the risk was “problematic”, with a rating of 7 (Figure 8).
3.4.2. Country Risk (Rating: 5, Moderate)
The country risk is equivalent to the weighted sum of the global national governance index weighted by the market share of mineral resources, which expands the influence of the political stability of the major countries producing mineral resources. The country risk of the importing country is quantified by the national risk rating (grades 1–9) issued by the China Export Credit Insurance Corporation. If the score is less than 4, it will be deemed to be “relaxed”, and “problematic” if it is greater than 6. The calculation formula is as follows:
- : Weighted national risk
- : Risk rating of import source country C
Weighting the country risk rating, the country risk of China’s manganese ore importing countries during 2016 was 4.48, which was still in a modest state compared to an increase of 0.22 in 2006, as indicated by Table 4.
Overall, although the country risk of China’s manganese ore imports is moderate, the country concentration is too high; thus, the overall rating is 6, moderate.
3.5. Country Concentration (Rating: 9, Problematic)
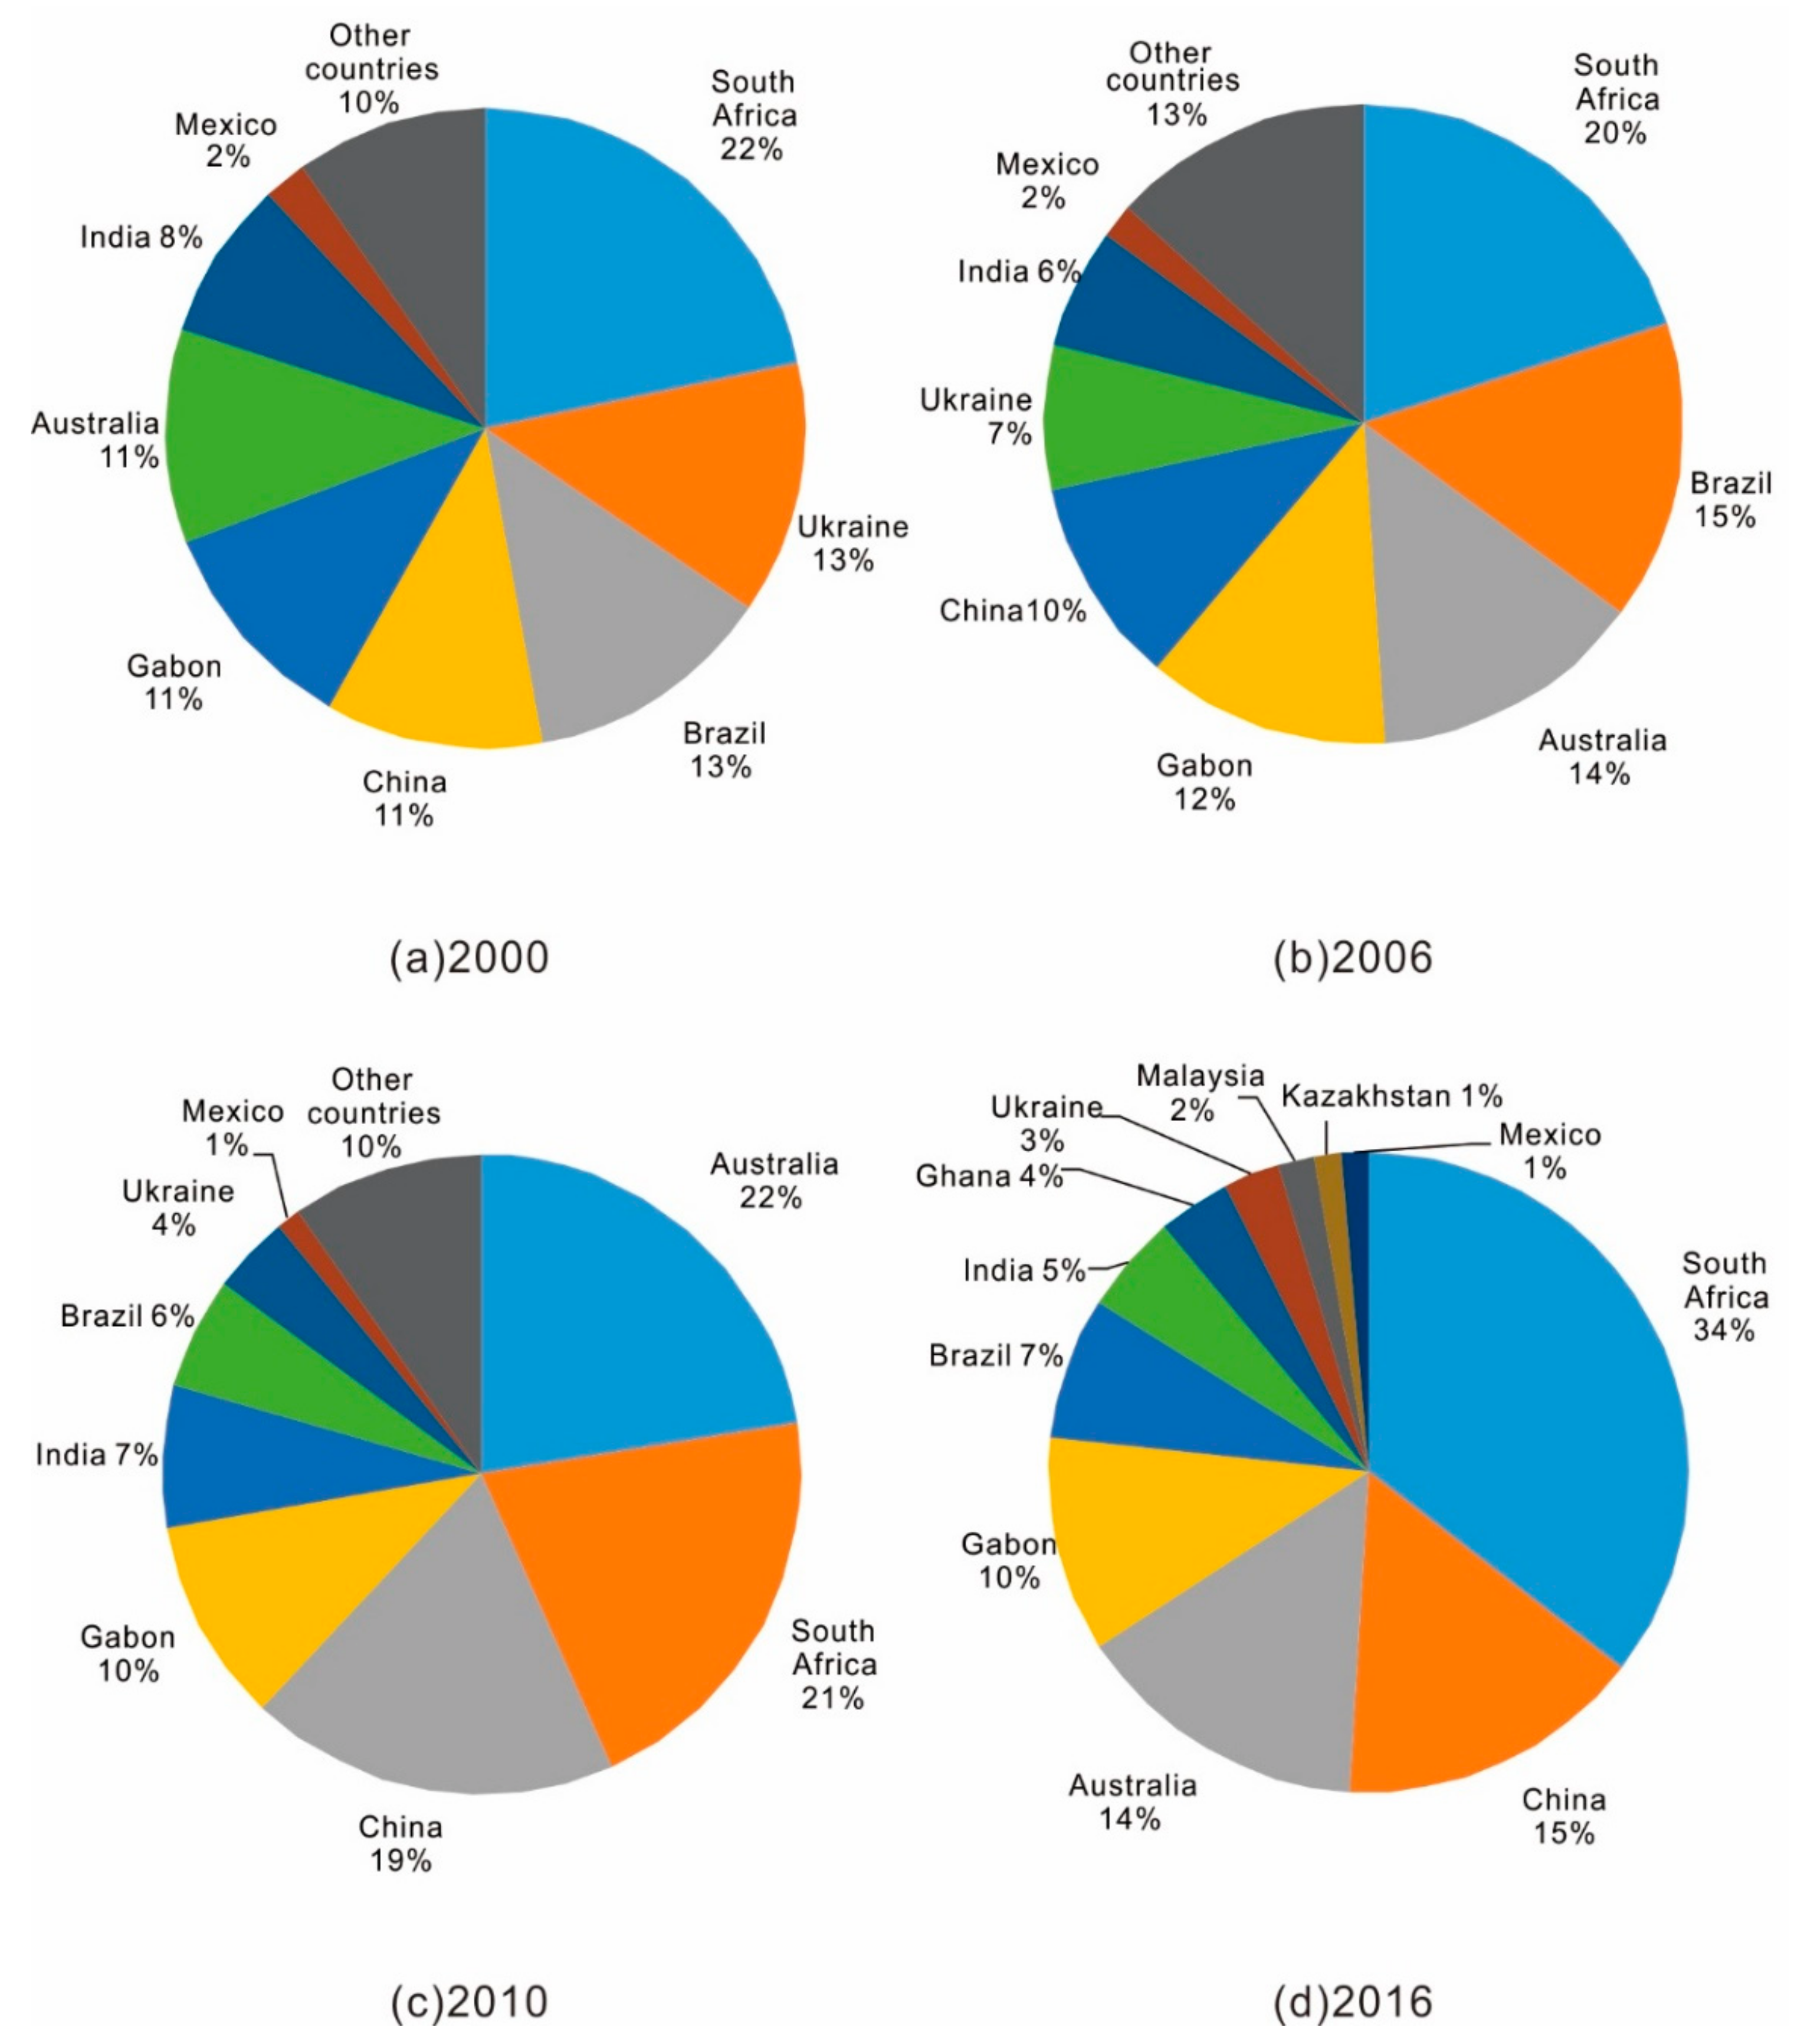
Mineral resources are distributed in the earth’s crust in different quantities and ore concentrations, meaning that some countries boast more mineral resources than others. The imbalance of geological resource distribution may lead to potential constraints and bottlenecks in the stable supply of resources [50]. The major producing countries of manganese resources increased from 7 in 2000 to 11 in 2016, but production in countries such as South Africa and Australia still accounts for greater than 70% of the world’s production. Manganese ore production is still concentrated in a few countries with rich resources (Figure 9).
China’s manganese ore is low grade and has a high production cost. Therefore, it is significant to understand the basic situation and investment environment of the manganese ore resource countries. There are many methods for measuring concentration, the most commonly used of which is the Herfindahl–Hirschman Index (HHI). Among the key indicators of formal concentration measurement in economics and the sum of the production of each mineral resource supplier in the global market share, the HHI Index measures the concentration of the global mineral resources supply and effects of the geopolitical relationship of a country. The calculation formula is as follows:
- : Herfindahl–Hirschman Index of the top four manganese producers in the world during year t
- : Country c’s share of the world’s total manganese production during year t
According to historical data, a score within the interval 1000–1300 is set as the benchmark value for the “moderate” supply risk, “problematic” if the score is greater than 1300, and “relaxed” if the score is less than 1000. During 2016, the world’s top four manganese ore-producing countries accounted for 73.2% of the world’s total manganese ore production, and the HHI index was 1,669.88. As shown in Table 5 it was twice than that of 2000. There was a large resource supply risk. It was deemed to be in a “problematic” state, with the rating of 9.
3.6. Future Supply and Demand Trend (Rating: 3, Relaxed)
From the perspective of supply, in the context of weak demand for manganese ore in the world, its global supply (metal amount) will continue to increase after 2016. According to the prediction of Commodity Research Unit, the manganese ore (metal amount) in 2020 will be 19.858 million tons, up by 4.5% from 2016. The project of reducing production will ease the oversupply of the market (Table 6). However, the new projects that will be put into production in the future will still drive the pattern of oversupply of manganese ore (Table 7).
From the perspective of demand, because of the irreplaceability of manganese ore in the steel industry and the proportion of ultrahigh consumption, the development trend of the manganese ore industry will still depend on the evolving change of the steel industry. The increase in crude steel production will lead to the increase of demand for manganese ore. To assess the involvement of manganese ore in different value chains as a result of consumption diversity, we could assess its economic importance based on the contribution of raw materials to different industries. The formula for calculating the degree of economic importance is as follows:
- : the economic importance of minerals
- : Gross Domestic Product
- : The share of consumption of manganese ore in the sector s
- : Industrial value added by sector s
Through calculation, the consumption of manganese ore in various sectors in 2015 is shown in Table 8.
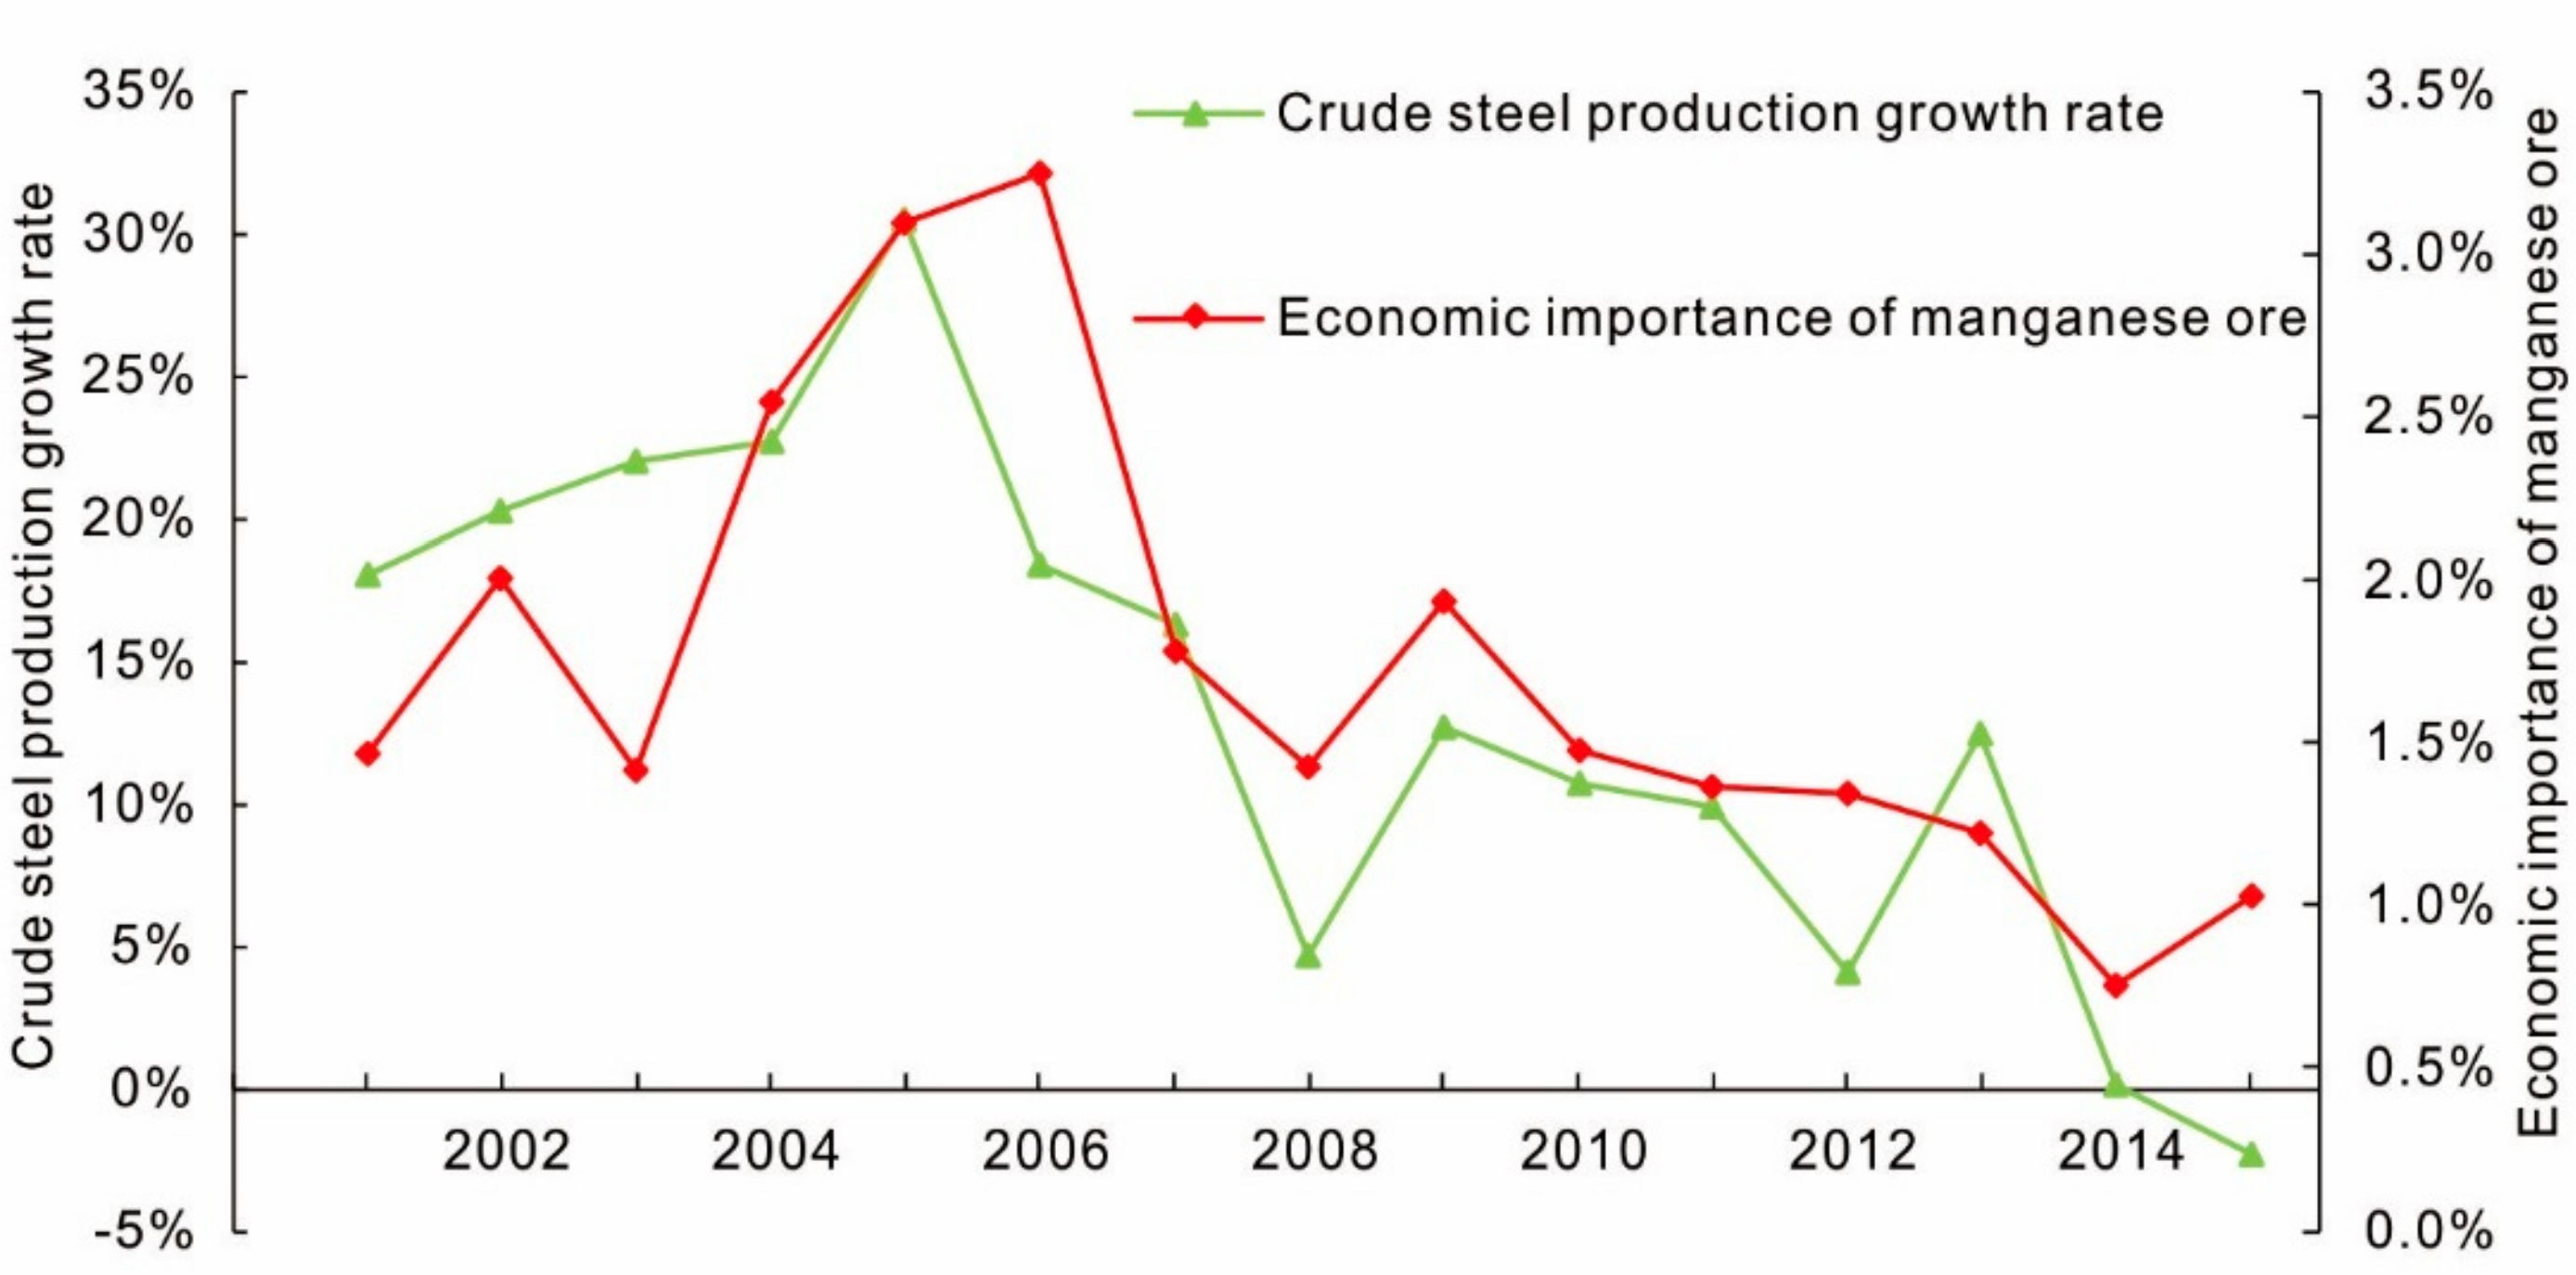
In this way, the economic importance of manganese ore from 2000 to 2015 is calculated, as shown in Figure 10. As the construction, machinery, automobile, shipbuilding, petrochemical, electric power, coal, transportation, railway, environmental protection, light industry, home appliances, hardware and other industries are all booming with the improvement of national infrastructure construction, the products of steel consumer demand has been greatly promoted. The average economic contribution of manganese ore in the past 16 years was 1.79%. During the period 2005–2007, driven by the strong demand in the domestic and international steel market, China’s steel industry showed a trend of rapid development, and the economic contribution exceeded 3%. However, in recent years, the economic importance of manganese ore has declined year by year, reaching a minimum of 0.75% in 2015.
Due to the irreplaceability of manganese ore and ultra-high percentage of consumption in the steel industry, the development trend of the manganese ore industry will still depend on the development and changes of the steel industry. Therefore, the increase in the output of China’s crude steel will lead to an increase in the added value of the steel industry. The economic contribution of large and manganese ore will be greater. As shown in Figure 10, the crude steel production growth rate and manganese ore economic importance curves show roughly the same downward trend. Because of the weak steel consumption in recent years, it is expected that the demand for manganese ore will enter a period of gradual growth in the future.
In summary, in the context of the overall sluggish demand for manganese ore in the world and increasing supply, the oversupply pattern of manganese ore still exists in the next few years, and it is in a “relaxed” state, with a rating of 3.
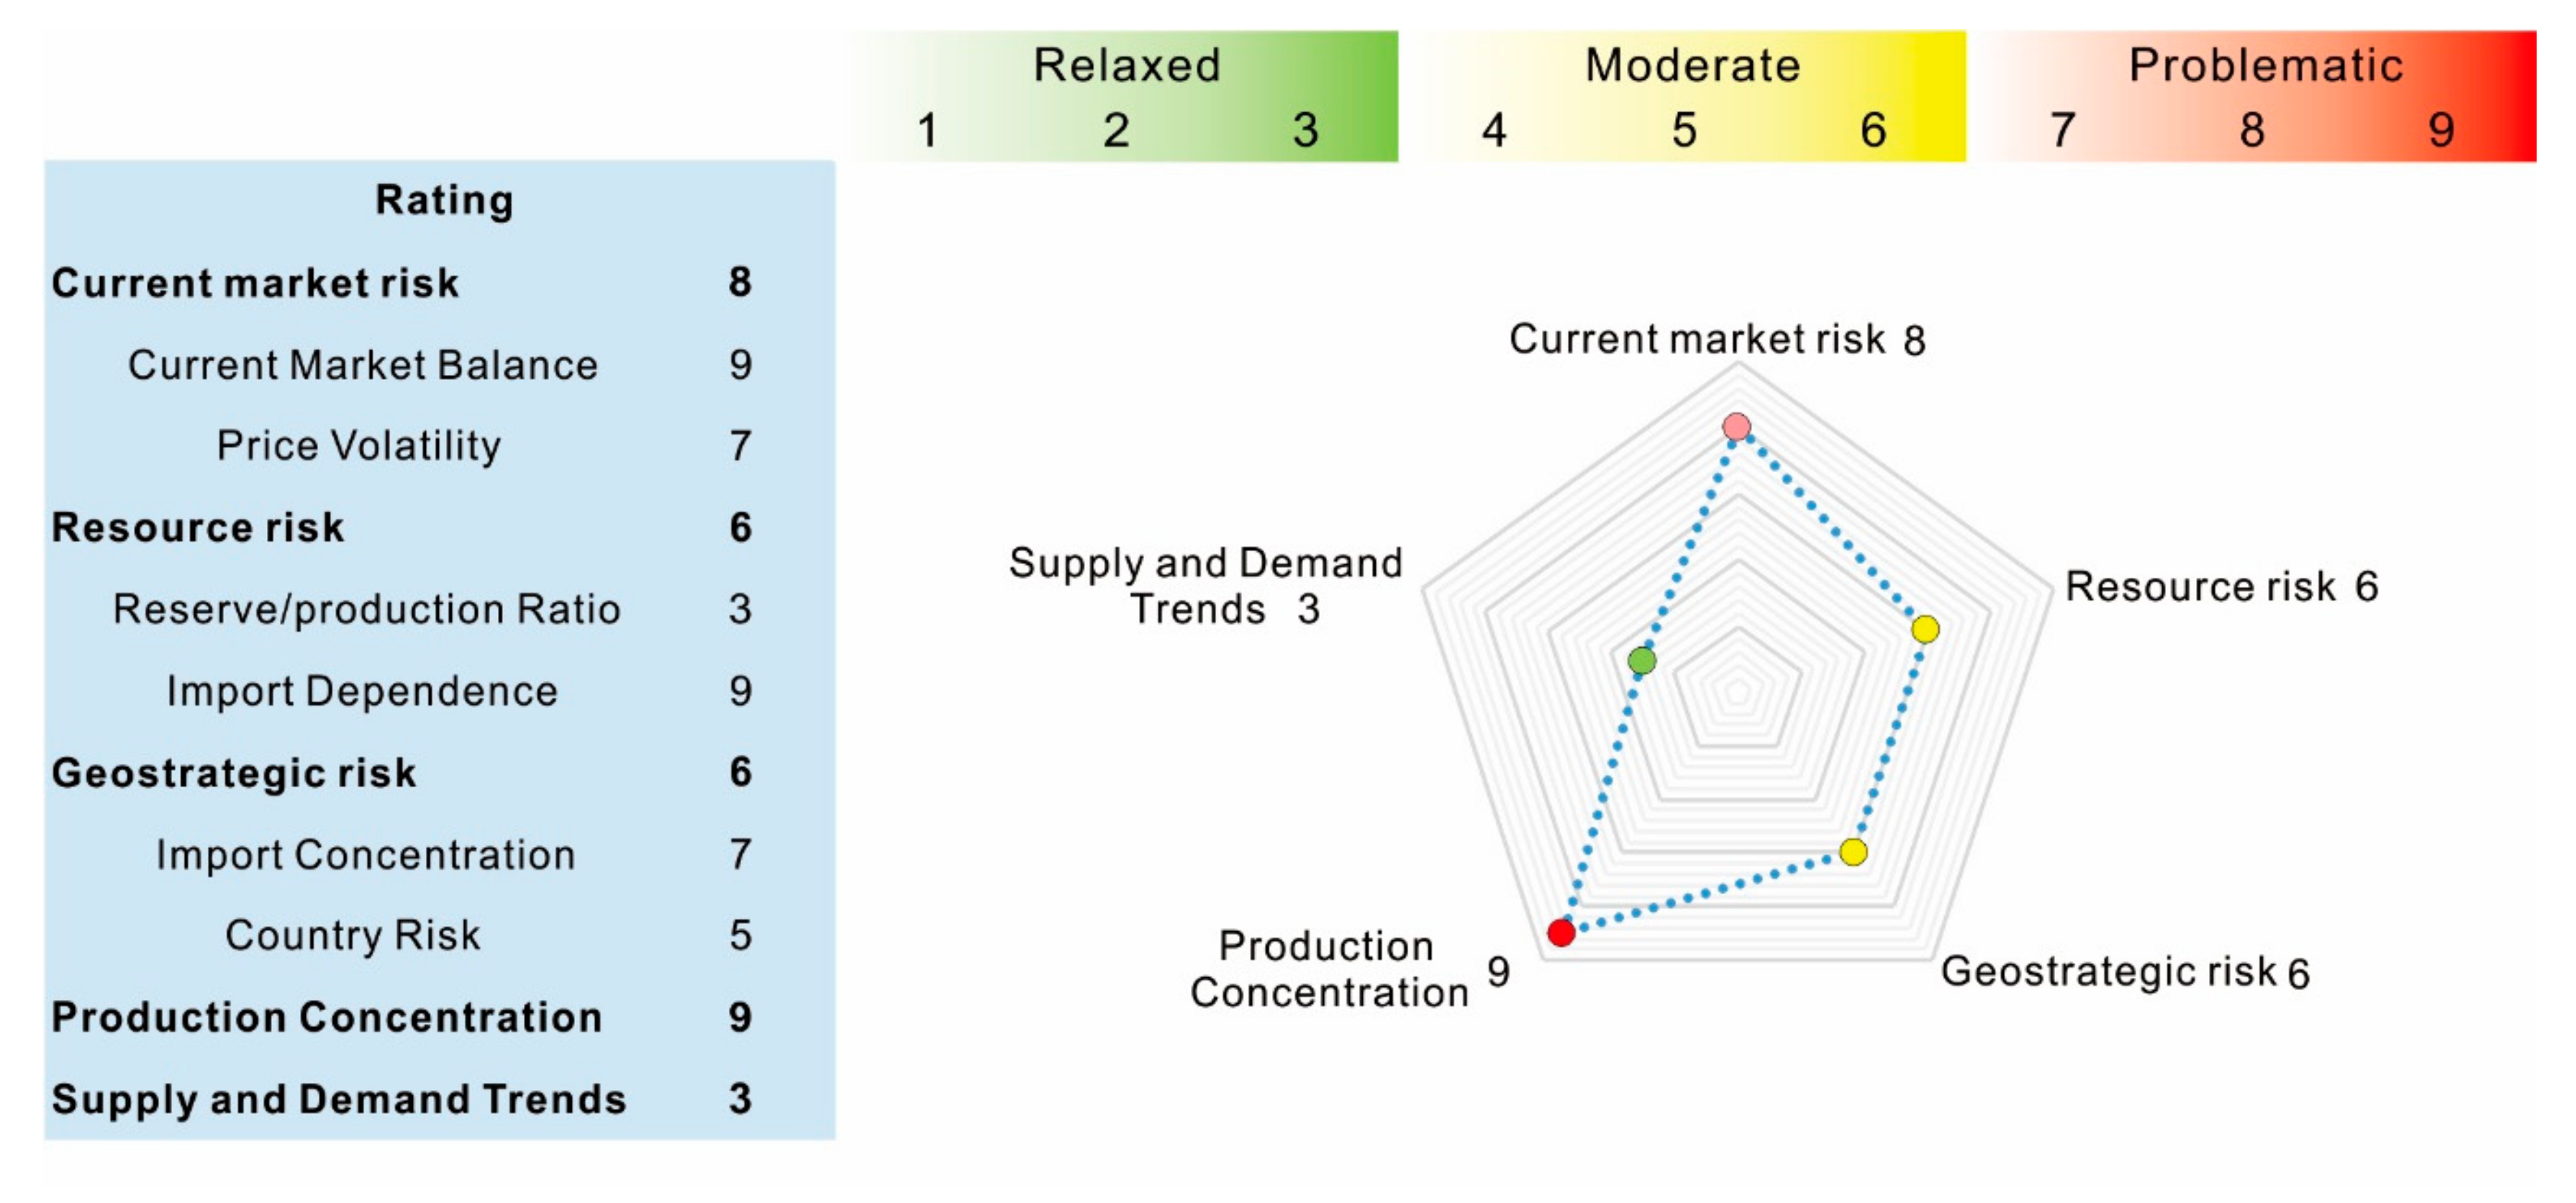
3.7. Overall Evaluation
We finally present the calculation and rating of the indicator in the spider map (Figure 11). Because of problematic market supply and demand, high price fluctuations, and high import dependence and country concentration, the overall supply conditions of China’s manganese ore from 2000 to 2016 were considered “problematic” (rating: 7).
4. Discussion
4.1. Main Supply Risk Drivers
In this study, the supply risk of manganese ore resources in China is a composite indicator consisting of five first-level indicators and eight second-level indicators. The overall rating is 7, and the risk situation is tight. Among them, the current market equilibrium, import dependence and country concentration risk rating is 9, which means that priority measures, if implemented, may significantly reduce the supply risks [19].
China’s manganese ore’s production is generally of low grade and has a high development cost and fails to meet domestic consumption, causing a difference between supply and demand up to 80%, which is among the reasons for the current high market risk rating. China’s manganese ore consumption can only be met through the large-scale import of high-quality manganese ore from abroad, which has caused the risk of over-reliance on resources from other countries because of higher dependence on foreign countries. In the short term, resource prices and long-term exploration profits may change dramatically. Stable resources are critical for resource-importing countries and companies that use resources as inputs. Therefore, sharing the exploration risks through government support policies is conducive to the development of society [2]. Therefore, we should pay attention to geological exploration investment, deepen the theoretical study of the genesis of mineral deposits, and achieve breakthroughs in ore prospecting striving to discover more high-grade manganese ore resources in our country, which will significantly reduce the cost of production and promote improved economic benefits. Experts and scholars over the years have made efforts to conduct in-depth research and development of a new low-grade manganese ore processing technology and innovatively use low-grade manganese ore during the ferromanganese alloy production process and production of high-purity manganese sulfate. This has been done in an attempt to determine new means to directly develop and utilize low-grade manganese ore and increase the efficient use of manganese ore resources while reducing costs and contamination [54,55].
If the ore is concentrated in a few resource-rich countries, it will face the risk of supply disruption [17]. Manganese ore production in countries such as South Africa and Australia still accounts for more than 70% of world production, resulting in higher country concentration risks. Over the long term, to make full use of global resources to compensate for the shortcomings of China’s resource shortage, the international strategy of mining enterprises should choose an appropriate external cooperation mode to ensure the availability of materials in the future. For the operation of financial capital, insurance capital investment can also be used as a commercial investment operation to avoid risks in the development of overseas mineral resources.
4.2. Secondary Factors of China’s Supply Risk
The trading practices of manganese ore and price mechanisms were developed during the early 1980s with their own characteristics—manganese ore consumers and manganese ore producers determined the quantity, type, and price of products traded by signing long-term subscription agreements, and their prices were determined through negotiation each year. However, as the demand for the steel market has continued to increase, the spot price of manganese ore has frequently been higher than the long-term agreement price. The BHP Billiton Group in October 2009 canceled the quarterly pricing method provided in the long-term contracts with customers and switched to monthly pricing, and its new additional capacity was sold at spot price trading. As the largest country for manganese ore use, China’s importing price fluctuated considerably because it was only a passive recipient of price, with no ability to intervene, having no pricing power. In an open economy, the Chinese manganese ore market relies too much on imports to be in a dominant position in global resource allocation; it facilitates the formation of a monopoly among large multinational companies. Domestic mining companies should further enhance the concentration of the manganese industry, increase the industrial scale economy and regulate the market competition to adjust the manganese product structure and further improve the capability of China’s manganese ore price negotiations [56].
There is a large security risk for China’s manganese ore imports because they are too concentrated; geostrategic risks are only in a modest state. It is essential to broaden the number of resource-importing countries and balance the proportion of importing countries to share the risk of the manganese ore trade. Government and financial institutions have been supporting domestic companies in acquiring overseas mining interests. Since China launched the “One Belt, One Road” initiative in 2013, the relevant government departments have clearly proposed to increase the exploration and development of traditional mineral resources such as coal, oil and gas, and metal minerals of the countries along the “Belt and Road” initiative [57]. This provides a major opportunity for China to strengthen cooperation with other countries along the line in the field of mineral resources. The countries along the “Belt and Road” are rich in important solid mineral resources, complementing China, and have a strong willingness to cooperate in mining countries along the route. China and its countries along the line have broad prospects for cooperation in the field of mineral resources. Actively participating in the construction of the “Belt and Road”, weakening trade and investment barriers, and seeking cross-border cooperation should be priorities striving to build a harmonious win-win situation. Achieving an optimal allocation of manganese ore resources on a global scale, improving the economic rationality and safety of utilizing offshore manganese ore resources, and promoting harmonious resource diplomacy are also important.
4.3. Other Factors Influencing Manganese Supply Risk in China
Although South Africa and Australia, the main importing countries of manganese ore, have a developed stable economy and maintain good international trade with China, showing a relaxed risk rating and moderate country risk, some mining countries are suffering from political instability and inadequate economic and social conditions. Political conflicts in these countries are highly likely and pose a potential threat to the supply of raw materials. Expanding import sources can be adopted to ease supply pressures in emergencies.
As industrialization has accelerated since 2000, China’s social economy has entered a period of rapid and stable development, and thus the demand for manganese ore has continued to steadily grow. However, by the end of 2014, the amount of mine resources had been significantly reduced, and the corresponding reserve/production ratio has decreased year by year. With the weakness of prospecting breakthroughs and iron and steel industry since 2015, the demand has decreased, and the reserve/production ratio has gradually recovered to a lower risk. However, because of the natural depletion of mine production capacity and the growing depletion of resources, the risk of the domestic resource supply of manganese ore remains.
During the adjustment period of China’s economy from highly rapid development to moderately rapid development, domestic steel consumption was weak, and manganese ore consumption decreased correspondingly. However, because of the existence of constant demand, the absolute value of consumption will gradually oscillate downward year by year, rather than dramatically decrease. This may result in an oversupply situation during the next few years, and the supply risk will be relaxed in the future.
5. Conclusions
Mineral resources are an indispensable material basis for global economic development. The rise of emerging economies represented by China during the 21st century has led to major adjustments in the global economic structure and major changes in mineral resources exploration, development, trade and investment, which as a result have caused a breakdown of the original balance between supply and demand of mineral resources. This has led to the soaring price of mineral resources, the failure of the pricing mechanism and the disorder of market functions. The security of global mineral resource supplies has gradually evolved to be an important international issue, attracting much attention from all countries. The supply risk of mineral resources concerns national resource security; thus, it is essential to carry out risk identification and management research. By using the VW-BGR method, this paper identifies the future development trend of the manganese ore market and concludes that there is a risk of supply disruption in China’s manganese ore. Hence, it is very necessary to ensure the stable and sustainable supply of manganese ore. To promote the sustainable development of manganese ore industry in China, it is undoubtedly significant to strengthen the resource reserves and improve the utilization of and low-grade manganese ore. At the same time, the Chinese government should open up foreign markets and adjust manganese import strategies, such as mergers and acquisitions, or holding international small- and medium-sized manganese mining companies, so as to reduce the market share of manganese mining giants and consequently weaken their monopoly on international manganese ore pricing. This paper mainly evaluated the supply risk of manganese ore in China from a long-term perspective while considering future demand. The selection of methods and criteria will result in a serious impact on the assessment of resource criticality. However, because of the different basic conditions of each mineral, it is not sufficiently comprehensive to align the index weight. However, improvements in the development of more accurate methods over time may enhance the accuracy of the results. It is also clear that the development of the manganese industry has contributed to the rapid development of the national economy, but it has also consumed resources and polluted the environment. With the increasing demand for resources and the rising price of mineral products, many low-grade deposits will also be exploited. Thus, the production of metals of the same weight requires extraction of increasingly more minerals and useless materials, which will exert tremendous pressure on ecosystems and water resources, and a large amount of mining waste will cause extreme changes in the entire geological landscape. Therefore, the mining industry is still confronted with the greatest challenge of how to resolve the contradiction between resource acquisition and ecological destruction.
Author Contributions
Conceptualization, S.L., J.Y, Q.P. and J.S.; Methodology, S.L. and J.Y.; Writing—original draft preparation, S.L. and Q.P.; Supervision, J.S.; Investigation, S.M. and Y.X. Funding Acquisition, J.S. and Q.P.
Funding
This research was supported by the Geological Survey Development Roadmap and Management Policy Research Project Stage Results (DD20160087), the Fundamental Research Funds for the Central Universities (2682019CX15) and the China Geological Survey Oil and Gas Resource Survey Center Project “Research on shale gas bidding block input accounting” ([Funding]2015XQ2015-04-03-13).
Acknowledgments
The authors would like to thank the China Geological Survey Development Research Center for help with the Partial basic data. We also greatly appreciate the positive and constructive comments from the editor Macy Zong and three anonymous reviewers.
Conflicts of Interest
The authors declare no conflict of interest.
References
- Graedel, T.E.; Rachel, B.; Chelsea, C.; Thomas, C.; Joanne, C.; Lee, C.; Elizabeth, F.; Claire, H.; Christine, J.; Nassar, N.T. Methodology of metal criticality determination. Environ. Sci. Technol. 2012, 46, 1063–1070. [Google Scholar] [CrossRef]
- Morita, T.; Higashida, K.; Takarada, Y.; Managi, S. Does acquisition of mineral resources by firms in resource-importing countries reduce resource prices? Resour. Policy 2018, 58, 97–110. [Google Scholar] [CrossRef]
- Rosenau-Tornow, D.; Buchholz, P.; Riemann, A.; Wagner, M. Assessing the long-term supply risks for mineral raw materials—A combined evaluation of past and future trends. Resour. Policy 2009, 34, 161–175. [Google Scholar] [CrossRef]
- Henckens, M.L.C.M.; Ryngaert, C.M.J.; Driessen, P.P.J.; Worrell, E. Normative principles and the sustainable use of geologically scarce mineral resources. Resour. Policy 2018, 59, 351–359. [Google Scholar] [CrossRef]
- Henckens, M.L.C.M.; Biermann, F.H.B.; Driessen, P.P.J. Mineral resources governance: A call for the establishment of an International Competence Center on Mineral Resources Management. Resour. Conserv. Recycl. 2019, 141, 255–263. [Google Scholar] [CrossRef]
- U.S. Geological Survey (USGS). Interior Releases 2018’s Final List of 35 Minerals Deemed Critical to U.S. National Security and the Economy. 2019. Available online: https://www.usgs.gov/news/interior-releases-2018-s-final-list-35-minerals-deemed-critical-us-national-security-and (accessed on 10 May 2019).
- National Research Council (NRC). Minerals, Critical Minerals, and the U.S. Economy; The National Academies Press: Washington, DC, USA, 2008; Available online: http://dels.nas.edu/resources/static-assets/materials-based-on-reports/reports-in-brief/critical_minerals_final.pdf (accessed on 10 May 2019).
- Graedel, T.E.; Harper, E.M.; Nassar, N.T.; Nuss, P.; Reck, B.K. Criticality of metals and metalloids. Proc. Natl. Acad. Sci. USA 2015, 112, 4257–4262. [Google Scholar] [CrossRef] [PubMed]
- European Commission (EC). Report on Critical Raw Materials for the EU. Report of the Ad hoc Working Group on defining critical raw materials. 2010. Available online: https://eur-lex.europa.eu/legal-content/EN/TXT/?uri=CELEX:52011DC0025 (accessed on 10 May 2019).
- European Commission (EC). Report on Critical Raw Materials for the EU. Report of the Ad hoc Working Group on defining critical raw materials. 2014. Available online: https://eur-lex.europa.eu/legal-content/EN/TXT/?uri=CELEX:52014DC0297 (accessed on 10 May 2019).
- European Commission (EC). Report on Critical Raw Materials for the EU. Report of the Ad hoc Working Group on defining critical raw materials. 2017. Available online: https://eur-lex.europa.eu/legal-content/EN/TXT/?uri=CELEX:52017DC0490 (accessed on 10 May 2019).
- Jin, Y.; Kim, J.; Guillaume, B. Review of critical material studies. Resour. Conserv. Recycl. 2016, 113, 77–87. [Google Scholar] [CrossRef]
- Florescu, M.S.; Ceptureanu, E.G.; Cruceru, A.F.; Ceptureanu, S.I. Sustainable Supply Chain Management Strategy Influence on Supply Chain Management Functions in the Oil and Gas Distribution Industry. Energies 2019, 12, 1632. [Google Scholar] [CrossRef]
- U.S. Government Publishing Office (GPO). Strategic and Critical Materials Stockpiling Act. 1979. Available online: http://www.gpo.gov/fdsys/pkg/STATUTE-93/pdf/STATUTE-93-Pg319.pdf (accessed on 10 May 2019).
- Bauer, D.; Diamond, D.; Li, J.; Sandalow, D.; Telleen, P.; Wanner, B.U.S. Department of Energy Critical Materials Strategy. Office of Scientific & Technical Information Technical Reports. 2010. Available online: https://digital.library.unt.edu/ark:/67531/metadc834802/ (accessed on 10 May 2019).
- Goe, M.; Gaustad, G. Identifying critical materials for photovoltaics in the US: A multi-metric approach. Appl. Energy 2014, 123, 387–396. [Google Scholar] [CrossRef]
- Brown, T. Measurement of mineral supply diversity and its importance in assessing risk and criticality. Resour. Policy 2018, 58, 202–218. [Google Scholar] [CrossRef]
- Yokoi, R.; Nakatani, J.; Moriguchi, Y. Calculation of Characterization Factors of Mineral Resources Considering Future Primary Resource Use Changes: A Comparison between Iron and Copper. Sustainability 2018, 10, 267. [Google Scholar] [CrossRef]
- Zhou, Y.; Li, J.; Wang, G.; Chen, S.; Xing, W.; Li, T. Assessing the short-to medium-term supply risks of clean energy minerals for China. J. Clean. Prod. 2019, 215, 217–225. [Google Scholar] [CrossRef]
- Jasiński, D.; Cinelli, M.; Dias, L.C.; Meredith, J.; Kirwan, K. Assessing supply risks for non-fossil mineral resources via multi-criteria decision analysis. Resour. Policy 2018, 58, 150–158. [Google Scholar] [CrossRef]
- Gleich, B.; Achzet, B.; Mayer, H.; Rathgeber, A. An empirical approach to determine specific weights of driving factors for the price of commodities—A contribution to the measurement of the economic scarcity of minerals and metals. Resour. Policy 2013, 38, 350–362. [Google Scholar] [CrossRef]
- Boev, I.; Šorša, A.; Kovacevik, B.; Mitrev, S.; Boev, B. The use of factor analysis to distinguish the influence of parent material, mining and agriculture on groundwater composition in the Strumica valley, Macedonia. Geol. Croat. 2016, 69, 245–253. [Google Scholar] [CrossRef]
- Sohn, I. Long-term projections of non-fuel minerals: We were wrong, but why? Resour. Policy 2005, 30, 259–284. [Google Scholar] [CrossRef]
- Sohn, I. Long-term energy projections: What lessons have we learned? Energy Policy 2007, 35, 4574–4584. [Google Scholar] [CrossRef]
- Gemechu, E.D.; Helbig, C.; Sonnemann, G.; Thorenz, A.; Tuma, A. Import-based Indicator for the Geopolitical Supply Risk of Raw Materials in Life Cycle Sustainability Assessments. J. Ind. Ecol. 2016, 20, 154–165. [Google Scholar] [CrossRef]
- Soliman, J.L.; Lopez, N.S.A.; Biona, J.B.M.M. Assessing sustainability of long-term energy supply using desirability functions. Energy Procedia 2019, 158, 3723–3728. [Google Scholar] [CrossRef]
- Glöser, S.; Soulier, M.; Tercero Espinoza, L.A. Dynamic analysis of global copper flows. Global stocks, postconsumer material flows, recycling indicators, and uncertainty evaluation. Environ. Sci. Technol. 2013, 47, 6564–6572. [Google Scholar] [CrossRef]
- Calvo, G.; Valero, A.; Valero, A. Assessing maximum production peak and resource availability of non-fuel mineral resources: Analyzing the influence of extractable global resources. Resour. Conserv. Recycl. 2017, 125, 208–217. [Google Scholar] [CrossRef]
- Achzet, B.; Helbig, C. How to evaluate raw material supply risks—An overview. Resour. Policy 2013, 38, 435–447. [Google Scholar] [CrossRef]
- Giuliodori, D.; Rodriguez, A. Analysis of the stainless-steel market in the EU, China and US using co-integration and VECM. Resour. Policy 2015, 44, 12–24. [Google Scholar] [CrossRef]
- Sun, W.; Dong, K.; Zhao, T. Market demand dynamic induced mechanism in China’s steel industry. Resour. Policy 2017, 51, 13–21. [Google Scholar] [CrossRef]
- Liu, J.; An, R.; Xiao, R.; Yang, Y.; Wang, G.; Wang, Q. Implications from substance flow analysis, supply chain and supplier’ risk evaluation in iron and steel industry in Mainland China. Resour. Policy 2017, 51, 272–282. [Google Scholar] [CrossRef]
- Erdmann, L.; Graedel, T.E. Criticality of non-fuel minerals: A review of major approaches and analyses. Environ. Sci. Technol. 2011, 45, 7620. [Google Scholar] [CrossRef]
- U.S. Geological Survey (USGS). Mineral Commodity Summaries. 2019. Available online: https://doi.org/10.3133/70202434 (accessed on 10 May 2019).
- Dill, H.G. The “chessboard” classification scheme of mineral deposits: Mineralogy and geology from aluminum to zirconium. Earth-Sci. Rev. 2010, 100, 1–420. [Google Scholar] [CrossRef]
- U.S. Geological Survey (USGS). Mineral Commodity Summaries 2001-2018. 2001–2018. Available online: https://minerals.usgs.gov/minerals/pubs/mcs/ (accessed on 10 May 2019).
- Yin, J.; Xiao, K. Resources potential analysis and metallogenic prospect of Mn resources in China. Geol. China 2014, 5, 1424–1437. [Google Scholar]
- Xiao, J.; He, J.; Yang, H.; Wu, C. Comparison between Datangpo-type manganese ores and modern marine ferromanganese oxyhydroxide precipitates based on rare earth elements. Ore Geol. Rev. 2017, 89, 290–308. [Google Scholar] [CrossRef]
- Gao, J.; Yang, R.; Xu, H.; Zhang, X.; Feng, K.; Zheng, L. Genesis of Permian sedimentary manganese deposits in Zunyi, Guizhou Province, SW China: Constraints from geology and elemental geochemistry. J. Geochem. Explor. 2018, 192, 142–154. [Google Scholar] [CrossRef]
- Chen, X.; Jiang, S. Discovery of the largest Carboniferous manganese deposit in Longtou-Limiao, central Guangxi, China. China Geol. 2018, 1, 312–313. [Google Scholar] [CrossRef]
- Cong, Y.; Dong, Q.; Xiao, K.; Chen, J.; Gao, Y.; Yin, J. Characteristics and Predicted Potential of Mn Resources in China. Earth Sci. Front. 2018, 3. [Google Scholar] [CrossRef]
- Ministry of Natural Resources of the People’s Republic of China. China Mineral Resources 2001–2018. 2001–2018. Available online: http://www.mnr.gov.cn/sj/sjfw/kc_19263/zgkczybg/ (accessed on 10 May 2019).
- Esen, V.; Oral, B. Natural gas reserve/production ratio in Russia, Iran, Qatar and Turkmenistan: A political and economic perspective. Energy Policy 2016, 93, 101–109. [Google Scholar] [CrossRef]
- Kong, Z.; Lu, X.; Jiang, Q.; Dong, X.; Liu, G.; Elbot, N.; Zhang, Z.; Chen, S. Assessment of import risks for natural gas and its implication for optimal importing strategies: A case study of China. Energy Policy 2019, 127, 11–18. [Google Scholar] [CrossRef]
- Mo, J.; Jeon, W. The Impact of Electric Vehicle Demand and Battery Recycling on Price Dynamics of Lithium-Ion Battery Cathode Materials: A Vector Error Correction Model (VECM) Analysis. Sustainability 2018, 10, 2870. [Google Scholar] [CrossRef]
- Benchekroun, H.; Halsema, A.; Withagen, C. When additional resource stocks reduce welfare. J. Environ. Econ. Manag. 2010, 59, 109–114. [Google Scholar] [CrossRef]
- Hatayama, H.; Tahara, K. Evaluating the sufficiency of Japan’s mineral resource entitlements for supply risk mitigation. Resour. Policy 2015, 44, 72–80. [Google Scholar] [CrossRef]
- Zeng, X.; Xu, M.; Li, J. Examining the sustainability of China’s nickel supply: 1950–2050. Resour. Conserv. Recycl. 2018, 139, 188–193. [Google Scholar] [CrossRef]
- China Export & Credit Insurance Corporation. The handbook of Country Risk. 2017. Available online: http://www.sinosure.com.cn/index.shtml (accessed on 10 May 2019).
- Habib, K.; Hamelin, L.; Wenzel, H. A dynamic perspective of the geopolitical supply risk of metals. J. Clean. Prod. 2016, 133, 850–858. [Google Scholar] [CrossRef]
- National Bureau of Statistics of China. China Statistical Yearbook, 2001–2016. Available online: http://www.stats.gov.cn/tjsj/ndsj/ (accessed on 10 May 2019).
- Department of Industrial Statistics, National Statistical Bureau of China. China Industrial Statistics Yearbook, 2001–2016. 2001–2016. Available online: http://tongji.cnki.net/kns55/Navi/HomePage.aspx?id=N2017030048&name=YZGJN&floor=1 (accessed on 10 May 2019).
- Worldsteel. World Steel Statistical Yearbook, 2001–2018. 2001–2018. Available online: https://www.worldsteel.org/steel-by-topic/statistics/steel-statistical-yearbook.html (accessed on 10 May 2019).
- Lan, J.; Sun, Y.; Guo, L.; Li, Z.; Du, D.; Zhang, T.C. A novel method to recover ammonia, manganese and sulfate from electrolytic manganese residues by bio-leaching. J. Clean. Prod. 2019, 223, 499–507. [Google Scholar] [CrossRef]
- Luo, S.; Guo, H.; Zhang, S.; Wang, Z.; Li, X.; Yan, G.; Wang, J. Comprehensive utilization of metallurgic waste in manganese electrowinning: Towards high performance LiMn2O4. Ceram. Int. 2019, 45, 8607–8615. [Google Scholar] [CrossRef]
- Daw, G. Security of mineral resources: A new framework for quantitative assessment of criticality. Resour. Policy 2017, 53, 173–189. [Google Scholar] [CrossRef]
- O’Trakoun, J. China’s belt and road initiative and regional perceptions of China. Bus. Econ. 2018, 53, 17–24. [Google Scholar] [CrossRef]
Figure 1.
Manganese mine production of different countries from 2000 to 2016 (data from USGS mineral commodity summaries, 2001–2018 [36]).
Figure 1.
Manganese mine production of different countries from 2000 to 2016 (data from USGS mineral commodity summaries, 2001–2018 [36]).

Figure 2.
Output and consumption of manganese resources in China from 2000 to 2016 (data from USGS Mineral Commodity Summaries, 2001–2018 [36], and China Mineral Resources, 2001–2018. [42]).

Figure 3.
This figure shows in which of the 16 raw material criticality assessments the 21 supply risk indicators were used. ✓ are indicators used by this study, the blank place are indicators not used (source: modified from Achzet, B.; C. Helbig., 2013; Esen, V.; B. Oral., 2016; Kong Et Al. 2019; Morita Et Al. 2018. [2,29,43,44]).

Figure 4.
Indicators for the assessment of long-term supply risk.

Figure 5.
Supply/demand gap of manganese ore in China from 2000 to 2016 (data from China Mineral Resources, 2001–2018 [42]).
Figure 5.
Supply/demand gap of manganese ore in China from 2000 to 2016 (data from China Mineral Resources, 2001–2018 [42]).

Figure 6.
Reserve/production ratio of manganese ore in China from 2000 to 2016 (data from China Mineral Resources, 2001–2018 [42]).
Figure 6.
Reserve/production ratio of manganese ore in China from 2000 to 2016 (data from China Mineral Resources, 2001–2018 [42]).

Figure 7.
Concentration of manganese importing countries in China from 2000 to 2016 (data from China Mineral Resources, 2001–2018 [42] and UN Comtrade database: https://comtrade.un.org/).
Figure 7.
Concentration of manganese importing countries in China from 2000 to 2016 (data from China Mineral Resources, 2001–2018 [42] and UN Comtrade database: https://comtrade.un.org/).

Figure 8.
Major manganese importing countries (data from China Mineral Resources, 2001–2018 [42] and UN Comtrade database: https://comtrade.un.org/).
Figure 8.
Major manganese importing countries (data from China Mineral Resources, 2001–2018 [42] and UN Comtrade database: https://comtrade.un.org/).

Figure 9.
Distribution of manganese ore major producing countries in the world (data from USGS Mineral Commodity Summaries, 2001–2018 [36]).
Figure 9.
Distribution of manganese ore major producing countries in the world (data from USGS Mineral Commodity Summaries, 2001–2018 [36]).

Figure 10.
Comparison of China’s crude steel production growth rate and economic importance of manganese ore (data from China Mineral Resources, 2001–2018 [42], China Statistics Yearbook, 2001–2016 [51], China Industrial Statistics Yearbook, 2001–2016 [52] and World Steel Statistical Yearbook, 2001–2018 [53]).

Figure 11.
Summary of the evaluated and rated market situation for manganese.


Table 1.
Distribution of manganese ore grade, reserve and production in major countries of the world.
Table 1.
Distribution of manganese ore grade, reserve and production in major countries of the world.
| Country | Ore Grade (%) | Production in 2017 (Thousand Tons) | Production in 2018 (Thousand Tons) | Reserves (Thousand Tons) |
|---|---|---|---|---|
| South Africa | 30–50 | 5400 | 5500 | 230000 |
| Ukraine | 18–22 | 735 | 740 | 140000 |
| Brazil | 27–48 | 1160 | 1200 | 110000 |
| Australia | 42–48 | 2820 | 3100 | 99000 |
| Gabon | 50 | 2190 | 2300 | 65000 |
| China | 15–30 | 1700 | 1800 | 54000 |
| India | 50 | 734 | 770 | 33000 |
| Ghana | NA | 810 | 850 | 13000 |
| Mexico | 25 | 212 | 220 | 5000 |
| Kazakhstan | NA | 168 | 170 | 5000 |
| Malaysia | NA | 478 | 510 | NA |
| Other countries | 898 | 940 | small | |
| World total | 17300 | 18000 | 760000 |
(Data source: USGS Mineral Commodity Summaries 2019. [34]).
Table 2.
Rating scale with benchmarks.
| Risk Situation | Relaxed | Moderate | Problematic | ||||||
|---|---|---|---|---|---|---|---|---|---|
| Risk rating | 1 | 2 | 3 | 4 | 5 | 6 | 7 | 8 | 9 |
Table 3.
Import dependence of manganese ore in China from 2000 to 2016.
| Years | Consumption (Thousand Tons) | Export Volume (Thousand Tons) | Import Volume (Thousand Tons) | Import Dependence |
|---|---|---|---|---|
| 2000 | 3838.5 | 5.2 | 1203.7 | 31.22% |
| 2001 | 4916.7 | 3.3 | 1710.0 | 34.71% |
| 2002 | 4275.2 | 4.4 | 2079.6 | 48.54% |
| 2003 | 6255.6 | 3.9 | 2849.5 | 45.49% |
| 2004 | 11829.2 | 2.5 | 4646.7 | 39.26% |
| 2005 | 12864.4 | 2.1 | 4578.5 | 35.57% |
| 2006 | 13073.7 | 1.9 | 6207.6 | 47.47% |
| 2007 | 13549.0 | 3.9 | 6631.9 | 48.92% |
| 2008 | 15406.6 | 2.3 | 7567.9 | 49.11% |
| 2009 | 18910.2 | 27.4 | 9617.6 | 50.71% |
| 2010 | 20161.0 | 78.2 | 11578.2 | 57.04% |
| 2011 | 21071.7 | 1.9.2 | 12971.9 | 61.04% |
| 2012 | 20307.7 | 125.1 | 12365.8 | 60.28% |
| 2013 | 23471.9 | 50.6 | 16598.5 | 70.50% |
| 2014 | 23298.2 | 15.5 | 16207.7 | 69.50% |
| 2015 | 20249.0 | 17.2 | 15780.6 | 77.85% |
| 2016 | 21404.5 | 30.1 | 17051.3 | 79.52% |
(Data from UN Comtrade database: https://comtrade.un.org/).
Table 4.
Geostrategic risk for China manganese import including country concentration and weight country risk.
Table 4.
Geostrategic risk for China manganese import including country concentration and weight country risk.
| 2006 | 2016 | ||||||||
|---|---|---|---|---|---|---|---|---|---|
| Importing Country | Import Share% | HHI Index | Country Risk Rating | Country Risk Weight | Importing Country | Import Share% | HHI Index | Country Risk Rating | Country Risk Weight |
| Australia | 43.02% | 1850 | 2 | 0.86 | South Africa | 41.65% | 1735 | 5 | 2.08 |
| Gabon | 19.53% | 381 | 7 | 1.37 | Australia | 23.82% | 568 | 2 | 0.48 |
| South Africa | 14.95% | 224 | 5 | 0.75 | Ghana | 10.28% | 106 | 6 | 0.62 |
| Ghana | 9.42% | 89 | 7 | 0.66 | Brazil | 7.60% | 58 | 6 | 0.46 |
| Brazil | 6.62% | 44 | 6 | 0.40 | Gabon | 7.37% | 54 | 6 | 0.44 |
| India | 1.77% | 3 | 5 | 0.09 | Malaysia | 4.90% | 24 | 4 | 0.20 |
| Vietnam | 1.16% | 1 | 6 | 0.07 | Myanmar | 1.58% | 2 | 8 | 0.13 |
| Myanmar | 0.93% | 1 | 8 | 0.07 | Morocco | 0.51% | 0 | 6 | 0.03 |
| Other countries | 2.59% | 7 | Other countries | 1.53% | 2 | ||||
| World total | 100% | 2600 | 4.26 | World total | 100.00% | 2550 | 4.48 | ||
(Data source: China Mineral Resources, 2001–2018 [42], UN Comtrade database: https://comtrade.un.org/, and the handbook of Country Risk, 2007–2017 [49]).
Table 5.
Concentration of the first four major producer countries in 2000–2016.
| Years | The Share of the Top Four Manganese Producers | HHI | |||||||
|---|---|---|---|---|---|---|---|---|---|
| 2000 | South Africa | 21.70% | Ukraine | 12.77% | Brazil | 12.64% | China | 10.99% | 914.69 |
| 2001 | South Africa | 19.46% | Brazil | 18.82% | Australia | 12.47% | Ukraine | 12.24% | 1038.08 |
| 2002 | South Africa | 18.57% | Brazil | 16.05% | Australia | 12.14% | Ukraine | 11.60% | 884.30 |
| 2003 | South Africa | 19.51% | Australia | 14.63% | Brazil | 12.07% | Ukraine | 10.73% | 855.81 |
| 2004 | South Africa | 20.37% | Australia | 13.90% | Brazil | 13.90% | Gabon | 11.76% | 940.15 |
| 2005 | South Africa | 20.00% | Brazil | 15.14% | Australia | 13.81% | Gabon | 12.29% | 970.95 |
| 2006 | South Africa | 19.33% | Australia | 18.40% | China | 13.45% | Brazil | 11.51% | 1025.56 |
| 2007 | South Africa | 20.63% | Australia | 20.16% | China | 15.87% | Gabon | 11.83% | 1223.97 |
| 2008 | South Africa | 21.80% | Australia | 17.44% | China | 16.54% | Gabon | 12.03% | 1198.06 |
| 2009 | China | 26.85% | Australia | 19.81% | South Africa | 17.59% | India | 9.07% | 1505.49 |
| 2010 | Australia | 22.30% | South Africa | 20.86% | China | 18.71% | Gabon | 10.22% | 1386.91 |
| 2011 | South Africa | 21.25% | Australia | 20.00% | China | 17.50% | Gabon | 11.63% | 1292.95 |
| 2012 | South Africa | 22.78% | Australia | 19.49% | China | 18.35% | Gabon | 10.44% | 1345.09 |
| 2013 | South Africa | 25.44% | China | 17.75% | Australia | 17.63% | Gabon | 11.66% | 1409.31 |
| 2014 | South Africa | 29.21% | Australia | 17.13% | China | 16.85% | Gabon | 10.45% | 1540.28 |
| 2015 | South Africa | 34.44% | China | 16.67% | Australia | 16.11% | Gabon | 10.00% | 1823.77 |
| 2016 | South Africa | 33.76% | China | 14.84% | Australia | 14.27% | Gabon | 10.32% | 1669.88 |
(Data from USGS Mineral Commodity Summaries, 2001–2018 [36]).
Table 6.
Production reduction of manganese ore projects in 2016.
| Mine | Production Reduction Time | Deadline | Reduced Production |
|---|---|---|---|
| Tshipi | 2016/1 | 2016/1 | 860 thousand tons |
| UMK | 2015/2 | 2016/1 | Half-production in December 2015, only in the last week of January 2016 and no sales of manganese ore in January |
| SOUTH32 | 2015/1 | 2016/1 | —— |
| AML | Late 4th quarter of 2015 | —— | —— |
(Data source: China Ferroalloy Online: http://www.cnfeol.com/).
Table 7.
New project investment table for manganese ore.
| Country | Company/Project | Production Capacity (1000 Tons/Year) | Commissioning Time |
|---|---|---|---|
| Malaysia | Pertama Ferroalloys (JV of Asia Minerals, Nippon Denko, Shinsho Corp) | 2000 (Sintered manganese ore) | 2015 |
| Togo | Ferrex-Nayega, project | 600 (Phase 1) to 2500 | 2016 |
| India | Runbat Mines | 1610 | 2016 |
| India | MOLK-Kandri project | 570 | 2018 |
| Indonesia | Gulf Minerals/Asia Mine | 1080 | 2018 |
| India | MOLK-Ukwa project | 1050 | 2019 |
| South Africa | Wessels Mine | 500 | —— |
(Data source: China Ferroalloy Online: http://www.cnfeol.com/).
Table 8.
Departmental consumption of manganese ore in 2015.
| Application Field | Industry Sector | As | Qs (Billion) | GDP (Billion) | EC (%) |
|---|---|---|---|---|---|
| metal industry | Ferrous metal smelting and rolling processing industry | 0.9 | 450.34 | 90030.9. | 0.75% |
| Household appliances | Electrical machinery and equipment manufacturing | 0.04 | 1055.9 | ||
| battery | Electrical machinery and equipment manufacturing | 0.02 | 1055.9 | ||
| Chemical industry | Chemical raw materials and chemical manufacturing | 0.04 | 1194.74 |
© 2019 by the authors. Licensee MDPI, Basel, Switzerland. This article is an open access article distributed under the terms and conditions of the Creative Commons Attribution (CC BY) license (http://creativecommons.org/licenses/by/4.0/).
Share and Cite
MDPI and ACS Style
Li, S.; Yan, J.; Pei, Q.; Sha, J.; Mou, S.; Xiao, Y. Risk Identification and Evaluation of the Long-term Supply of Manganese Mines in China Based on the VW-BGR Method. Sustainability 2019, 11, 2683. https://doi.org/10.3390/su11092683
AMA Style
Li S, Yan J, Pei Q, Sha J, Mou S, Xiao Y. Risk Identification and Evaluation of the Long-term Supply of Manganese Mines in China Based on the VW-BGR Method. Sustainability. 2019; 11(9):2683. https://doi.org/10.3390/su11092683
Chicago/Turabian StyleLi, Shule, Jingjing Yan, Qiuming Pei, Jinghua Sha, Siyu Mou, and Yong Xiao. 2019. "Risk Identification and Evaluation of the Long-term Supply of Manganese Mines in China Based on the VW-BGR Method" Sustainability 11, no. 9: 2683. https://doi.org/10.3390/su11092683
Note that from the first issue of 2016, this journal uses article numbers instead of page numbers. See further details here.