Efficiency versus Fairness in the Management of Public Housing Assets in Palermo (Italy)


1
Department of Architecture, University of Palermo, 90128 Palermo, Italy
2
Department of Civil Engineering and Architecture, University of Catania, 95125 Catania, Italy
*
Author to whom correspondence should be addressed.
Sustainability 2019, 11(4), 1199; https://doi.org/10.3390/su11041199
Submission received: 28 January 2019
/
Revised: 16 February 2019
/
Accepted: 19 February 2019
/
Published: 24 February 2019
(This article belongs to the Special Issue Real Estate Economics, Management and Investments)
Abstract
:Public housing policy has been proposing plans of public housing (PH) stock alienation or, as an alternative, property enhancement plans, since administrative and financial commitments have become too heavy for municipalities. This paper deals with one of the current public housing management policy initiatives, undertaken by the Municipality of Palermo (Italy), which aimed at transferring a significant part of the public housing asset to the current tenants, according to some terms and conditions, and applying a politically fixed price. This policy is described in general, focusing on the amount of the assets involved, reporting the terms and conditions for transferring them at an affordable price, and analysing their concentration/distribution in the urban areas. The main aim of the paper is to provide a valuation pattern for defining the trade-off between the efficiency and fairness of such a tool, recognising the conditions for the consistency between the transfer price established by municipality, the merit of the public housing asset, and the market value. A detailed study on two representative neighbourhoods was carried out in order to measure the value of solidarity of this policy and to propose some corrective rules.
1. Introduction
A city is the place of maximum concentration of social and private capital, but it is also the place where social inequalities are physically evident and are manifested through the distribution of public and private spaces, public facilities and services in quantitative and qualitative terms.
The claim of “the right to the city” by weak social groups that risk being marginalized, is a complex issue that is mixed with many others such as increasing regional density and social polarization by Soja [1], security-obsessed urbanism by Davis [2], the privatopia as the rise of residential private government by Mackenzie [3], and the right to belong to a place by Aalbers and Gibb [4].
The right to housing, in particular, is one of the main features of the “right to the city” [5], and although in the 1960s–70s it was a key objective of Italian welfare policies, many households still face the problem of affordable housing today, especially in the southern Italy and in the metropolitan areas of the big cities. In several countries, governmental institutions analyse housing affordability adopting different approaches and indexes [6,7] to measure the gap between housing market prices and household incomes [8,9,10] and, subsequently, decide how to implement their housing policy, e.g., promoting social housing projects, applying fiscal incentives, providing subsidies. An effective action of public housing (PH) policy is the right to buy (RTB), established in the United Kingdom in 1980, that allowed tenants in publicly-owned housing to buy their rented dwelling at a subsidized price. As discounts on market price were very heavy and ranged from 35% up to a maximum of 70%, or up to a maximum subsidy of 80,900 pounds (April 2018), the RTB was the main factor responsible of an increasing share of home ownership among householders from 55% to 70% by 2000 [11,12].
In Italy, due to the massive housing policy started under law 167/1962, a huge amount of public residential assets were built, a great part of which the municipalities still own. The progressive process of physical and social decay that have been affecting especially the marginal neighbourhoods has been making the management of these context increasingly expensive, particularly since the end of the 1980s. Since the 1990s, many Italian laws provided the alienation or enhancement of public real estate assets in order to allow the public authorities to reduce the management and maintenance costs of real estate assets and to obtain immediate liquidity. Enhancement, on the other hand, has the objective of getting the highest profits from publicly owned properties, and it may include the improvement of the energy efficiency of the assets [13] according to market conditions as well as to social welfare, and taking into account the financial sustainability [14].
In a first phase, publicly owned properties were privatized through direct selling or financial instruments such as securitization (Legislative Decree 351/2001), which had contradictory results. For instance, the Public Property Securitization Company (SCIP) established in 2001 was put into liquidation in 2009 and all the unsold buildings were returned to their owners without obtaining good profits for the public authorities, partly due to the economic, financial and real estate crisis that started in 2008. In contrast, in 2001–04 the securitization of about 700 properties in Rome achieved good results in terms of numbers of real estate sold, sales period, and revenues.
Public authorities that retain ownership of real estate properties may confer them in real estate investment funds that are also open to private participation. The enhancement of real estate assets is implemented through public companies, such as Sviluppo Italia (Law 326/2003) to which buildings for tourist use could also be transferred (Legislative Decree 269/2003), as well as through public private partnerships [15] and involving private investment initiatives and assets [16,17], e.g., namely the ‘Urban Transformation Company’ (Legislative Decree 42/2004). In the last decade, several plans, namely ‘unitary development programs’ and the ‘national development plan’, have been promoted for the enhancement of local and national public assets, e.g., through redevelopment projects of urban areas, or projects to found cultural districts (Law 410/2001 and 244/2007).
The securitization procedure usually provides for the sale of properties at market prices although it reserves a special protection for the tenants of houses, who have the right of pre-emption to purchase, and are also entitled to a 40.5% reduction in the housing price, whereas a 30% reduction is applied to tenants of non-residential properties. However, this provision does not have an equalizing effect, because the reduction in the market price is independent of the level of household income, and the tenants do not necessarily have a low income [18,19].
As the alienation of public housing is mostly directed towards low-income tenants, the dwellings are sold at a price that is set by law. In this case, the political pricing allows the municipalities to offer affordable housing and to transfer a substantial part of the social wealth to the households who have been living there for years and may benefit from the acquisition of an asset that is worth much more than the price they pay. More generally, such a policy has an equalization purpose since the real estate market price has increased significantly more than income and the ICP (index of consumer prices) [20].
In such an issue, the convergence and integration of efficiency and fairness [21,22] in PH appraisal and management can be considered the basis of “the true value” [23], i.e., the authentic value, which is the “raw material” for “true valuations”, i.e., valuation that are reliable in validating projects specifically aimed at societal and environmental justice [24] in the perspective of urban sustainability [25,26,27].
This work proposes an appraisal model aimed at estimating the real estate market value, based on the database of the institutional real estate market observatory by the Italian Ministry of Finance and on a real estate market survey, and applies the model to a case study in the city of Palermo (southern Italy) (Figure 1). Whereas several approaches may be chosen to analyse the complexity of urban real estate market according to the specific aims of the study, the peculiar features of the city and of submarkets, and of the available data [28,29,30,31,32,33], we specifically carried out a real estate survey over the two districts of Palermo in which the municipality has transferred 32 dwellings. Moreover, a linear multiple regression model has been developed in order to find out the correlations between the market price and the more significant characteristics featuring the properties to be appraised basing on a sample of 98 properties.
Based on these estimates, the application aims at:
- -
- measuring the differential between the estimated prices and the ‘political prices’ that are fixed by the municipality according to the current laws, then assuming the ratio between the political and the estimated prices as an indicator of the overall efficiency of the public housing policy [34];
- -
These results can provide significant information for judging the relevance of the current municipal PH policy in the light of some criticalities of the entire process, concerning the reliability of the method and the criteria used for calculating the political price, the information about the real condition of the properties to be transferred, and the poor overall result of the process given the little number of the properties transferred until now.
2. Materials: Public Housing Policy in the Municipality of Palermo
The housing policy of the Municipality of Palermo provides two main tools to support households facing financial difficulties: leasing of public housing and financial subsidies to housing rent. Another possible means could be the promotion of social housing, as the Sicilian Region published a notice in 2017 (Gazzetta Ufficiale della Regione Siciliana, n° 12, 2017) to co-fund several social housing projects in Sicily, including in the metropolitan area of Palermo, but they have not been approved yet and, in any case, they could not impact housing problems significantly.
The amount of municipally owned housing is not sufficient to cover the needs of the low-income households, as it is shown by the 2003–04 municipal announcement for the allocation of public housing: the legitimate applications were 9865 and only 219 apartments were allocated until 2012, covering just 2.2% of the needs in 8 years [37].
Financial support to households provides three types of subsidies that cannot be accumulated:
- the additional subsidy to housing rent, for low-income households;
- the subsidy to involuntary arrears of tenants, implementing the Legislative Decree 102/2013;
- the subsidy for housing emergency.
In recent years, the drastic reduction of regional and state funds and the high number of applications for subsidies have forced the Municipality of Palermo to reduce or cancel the provision of those subsidies that had become very small. For instance, the municipal budget allocated to additional subsidies to housing rent 6,547,561 euros in 2009 and 247,409 euros in 2012, consequently the corresponding average annual subsidy decreased from 608 euros per household in 2009 to just 36 euros in 2012 [38].
The financial difficulties experienced by households are also noticeable by the eviction notices for arrears that number 1300 per year with 82% of the total notices from 2005 until 2012, whereas these started decreasing from 2013 thanks to the legal concept of ‘involuntary arrears of tenants’ (DL 102/2013). This occurs when a household cannot pay the rent due to a drastic and improvised decrease of his income for serious reasons, such as being fired, non-renewed employment contract, or serious health problems. The decreasing eviction notices for arrears do not correspond to a real improvement in household conditions, in fact the total amount of eviction notices remains constant, confirming the persistence of households’ difficulties to find affordability housing on the rental market. Moreover, territorial analyses have shown that low-income households are not concentrated exclusively in the suburbs, but are spatially distributed throughout the municipal territory [38,39].
2.1. Public Housing Stock in Palermo
Nowadays, the public housing asset of Palermo consists of 24,035 dwellings most of which are owned by the municipality and ‘Istituto Autonomo Case Popolari’ (IACP), which is a public institution that manages the local public housing stock.
The number of public houses is very small compared to the population (668,405 inhabitants in 2018) and to the index of ‘material and social vulnerability of households’ by the Italian National Institute of Statistics ISTAT that is equal to 102 in Palermo, whereas the national average value is 99.3—the higher the index, the worse the social vulnerability [38]. This index is achieved by the combination of seven basic indicators: percentage of households without a qualification; percentage of large families (more than 6 members); percentage of single parent families; percentage of elderly households; percentage of households living in crowded housing; percentage of young people not in employment, education, or training; percentage of families with children whose members are unemployed.
These socio-economic problems are the main causes of squatting housing, as an extreme form of claim to the right to housing by movements and committees of disadvantaged families. At the same time, they are subtracting housing to households who are legally entitled according to the law and to a rank order list as drawn up by the Municipality of Palermo. In 2017, squatting of public housing in Palermo was nearly 22%, and the municipally owned housings had the highest incidence, that was equal to 53.8%. Table 1 reports the amounts of public housing, distinguishing between those that are owned by Municipality or IACP, and those that are squatted.
2.2. The Transfer Programme of Public Housing
The Municipality of Palermo drafted the ‘Alienation and Real Estate Development Plan’, according to the law 133/2008, which identifies the properties to be sold or to developed, with the objectives of rationalization of asset management and the recovery of financial resources to be used in the renewal or new construction of public housing. The Alienation Plan in 2015 (Municipal Council resolution no. 442 of December 4, 2015) became operational in April 2016 and provided for the sale of a high share of public housing owned by the municipality. The ‘Public Notice of Sale of Housing of Public Housing owned by the municipality of Palermo’ was published to implement the sale and it allows the assignees of 2569 public dwellings, who are people to whom the property has been leased, to purchase the dwelling in which they live.
In order to purchase the dwelling, the current tenants must meet the following requirements:
- being up-to-date with the payment of the rent and the condominium fees;
- no member of the family must own, use or usufruct a suitable housing for the family;
- to have had the final assignment of the dwelling for at least two years;
- being in possession of other legal requirements (that are set by Presidential Decree 30/12/1972 no. 1035).
The sale price of the dwelling is calculated according to the law 560/1993 rules and becomes a politically fixed price that meets the social purpose of allowing low-income households who otherwise would not afford to pay market prices to purchase homes.
The political price is evaluated by multiplying the dwelling cadastral income, which is usually very little, to several coefficients that are set by law. As first step, a baseline price is calculated by multiplied the cadastral income by the coefficient , which is equal to 100 for housing (1). The coefficient b may reduce the baseline price of 1% for each year after the date of construction up to a maximum of 20% to take into account the depreciation of the property. Conversely, the baseline price is increased by any extraordinary maintenance costs over the last 5 years, as expressed in Formula (2). The price P1 thus calculated may be further reduced by 10% in the case of single downpayment (3).
where: , , and are political prices; is the dwelling cadastral income; is the coefficient for housing and is equal to 100; is a variable depreciation coefficient, ; is the extraordinary maintenance cost; is the reduction coefficient for a single downpayment and is equal to 10%.
People who cannot afford a single downpayment must pay the 30% of price while the residual value may be paid by an up to 15 years mortgage by applying the legal interest rate and by taking out an insurance policy. In any case, every legal and technical expense to obtain an Energy Performance Certificate and the verification of the legal conformity of the dwelling is charged to the purchaser.
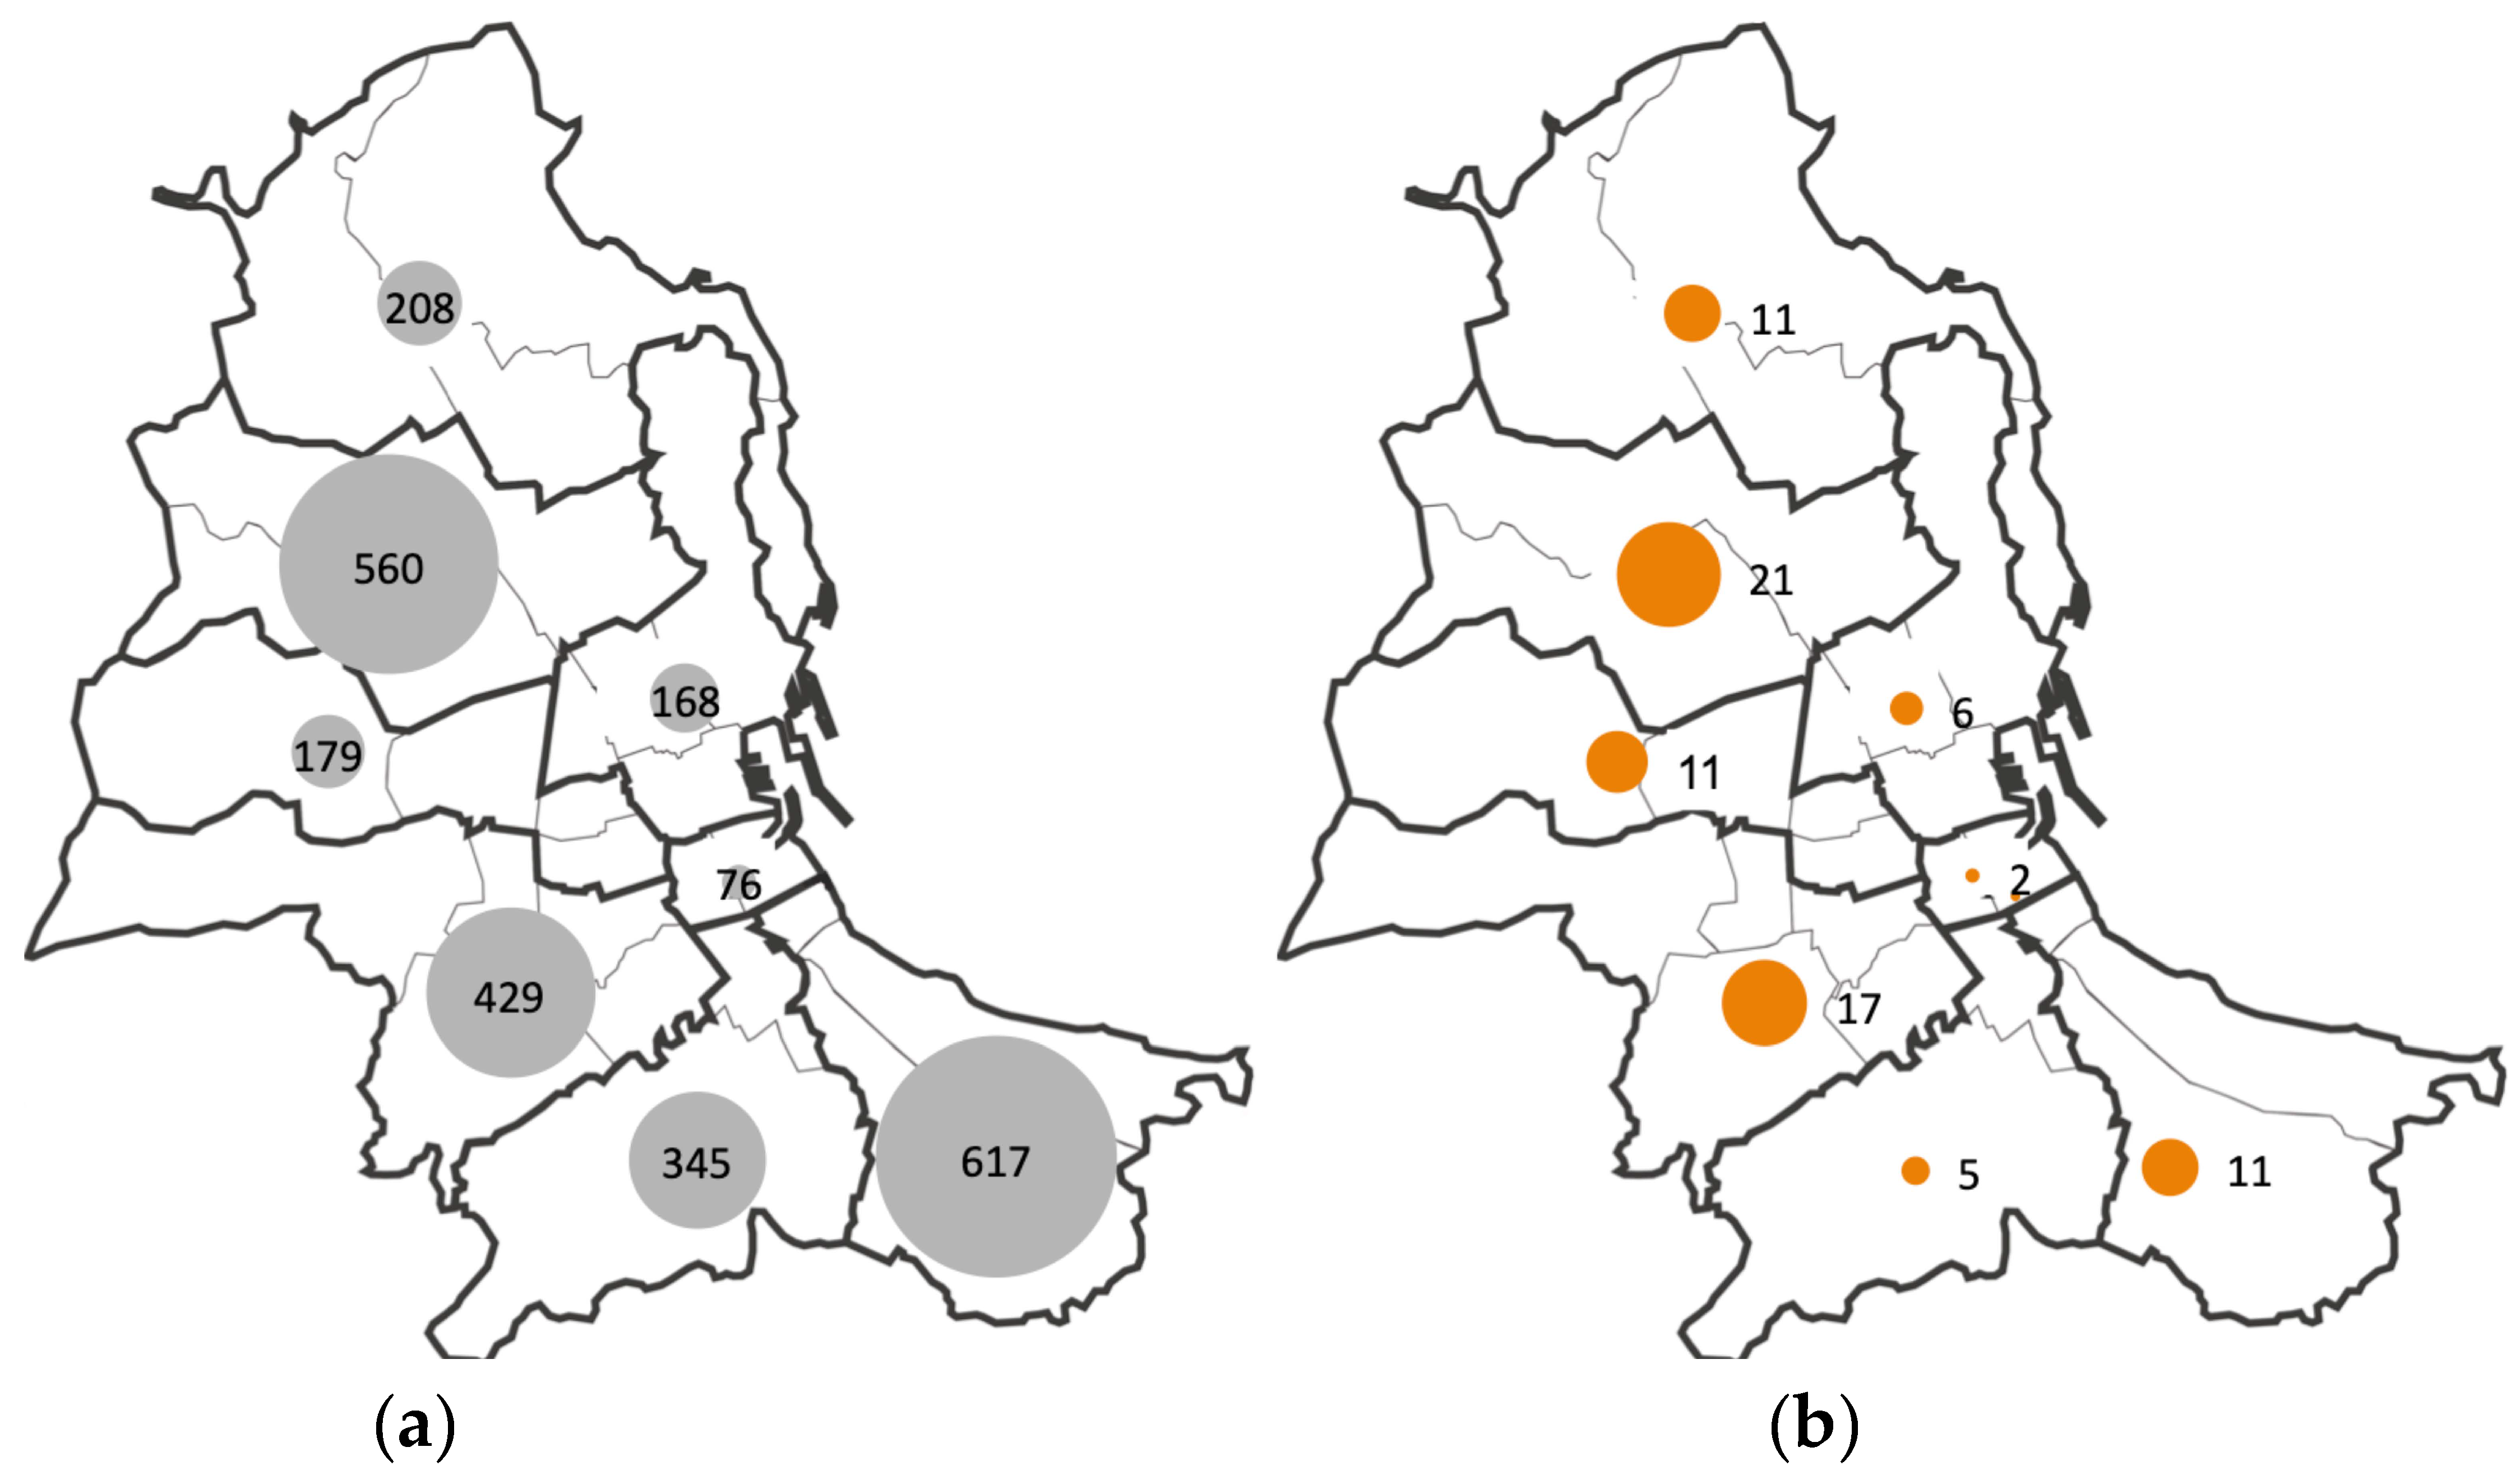
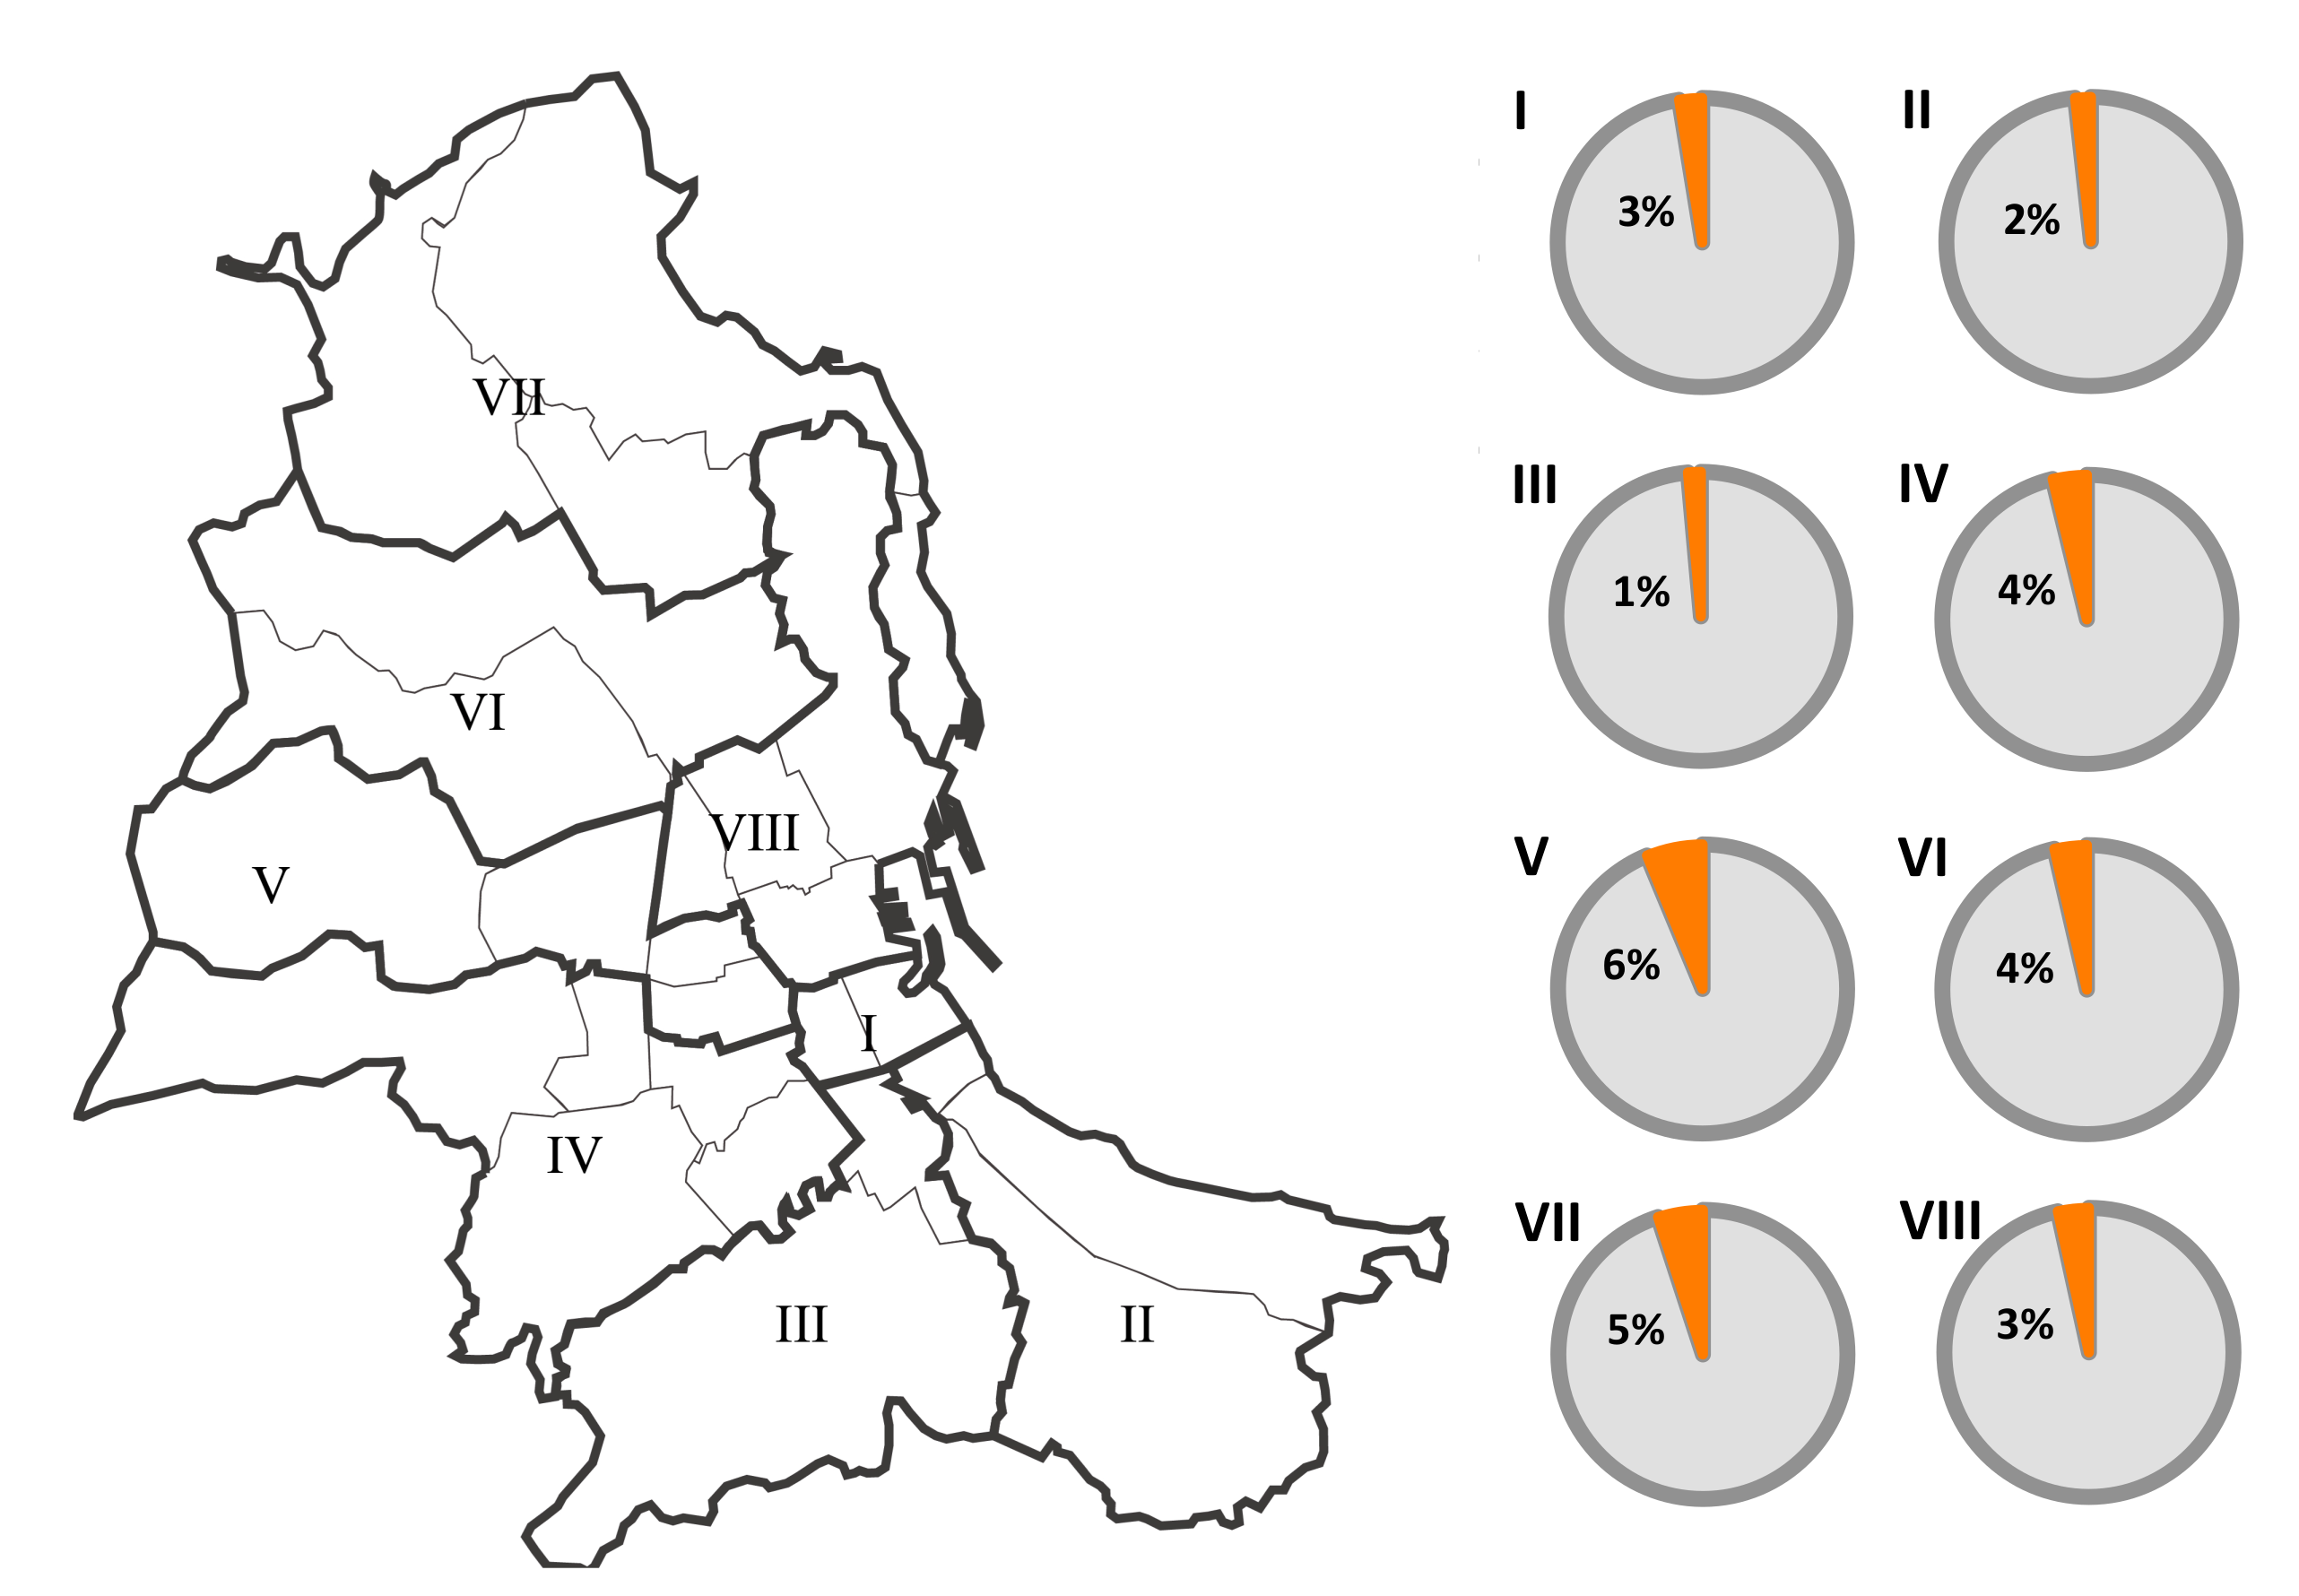
The population and the population density in the eights districts of Palermo are described in Table 2. Figure 2 shows the location of the public housing on sale in 2016 and the sold public housing from 2016 until May 2018 in the eight districts of Palermo, whereas Figure 3 shows the percentage of public housing sold in the same years.
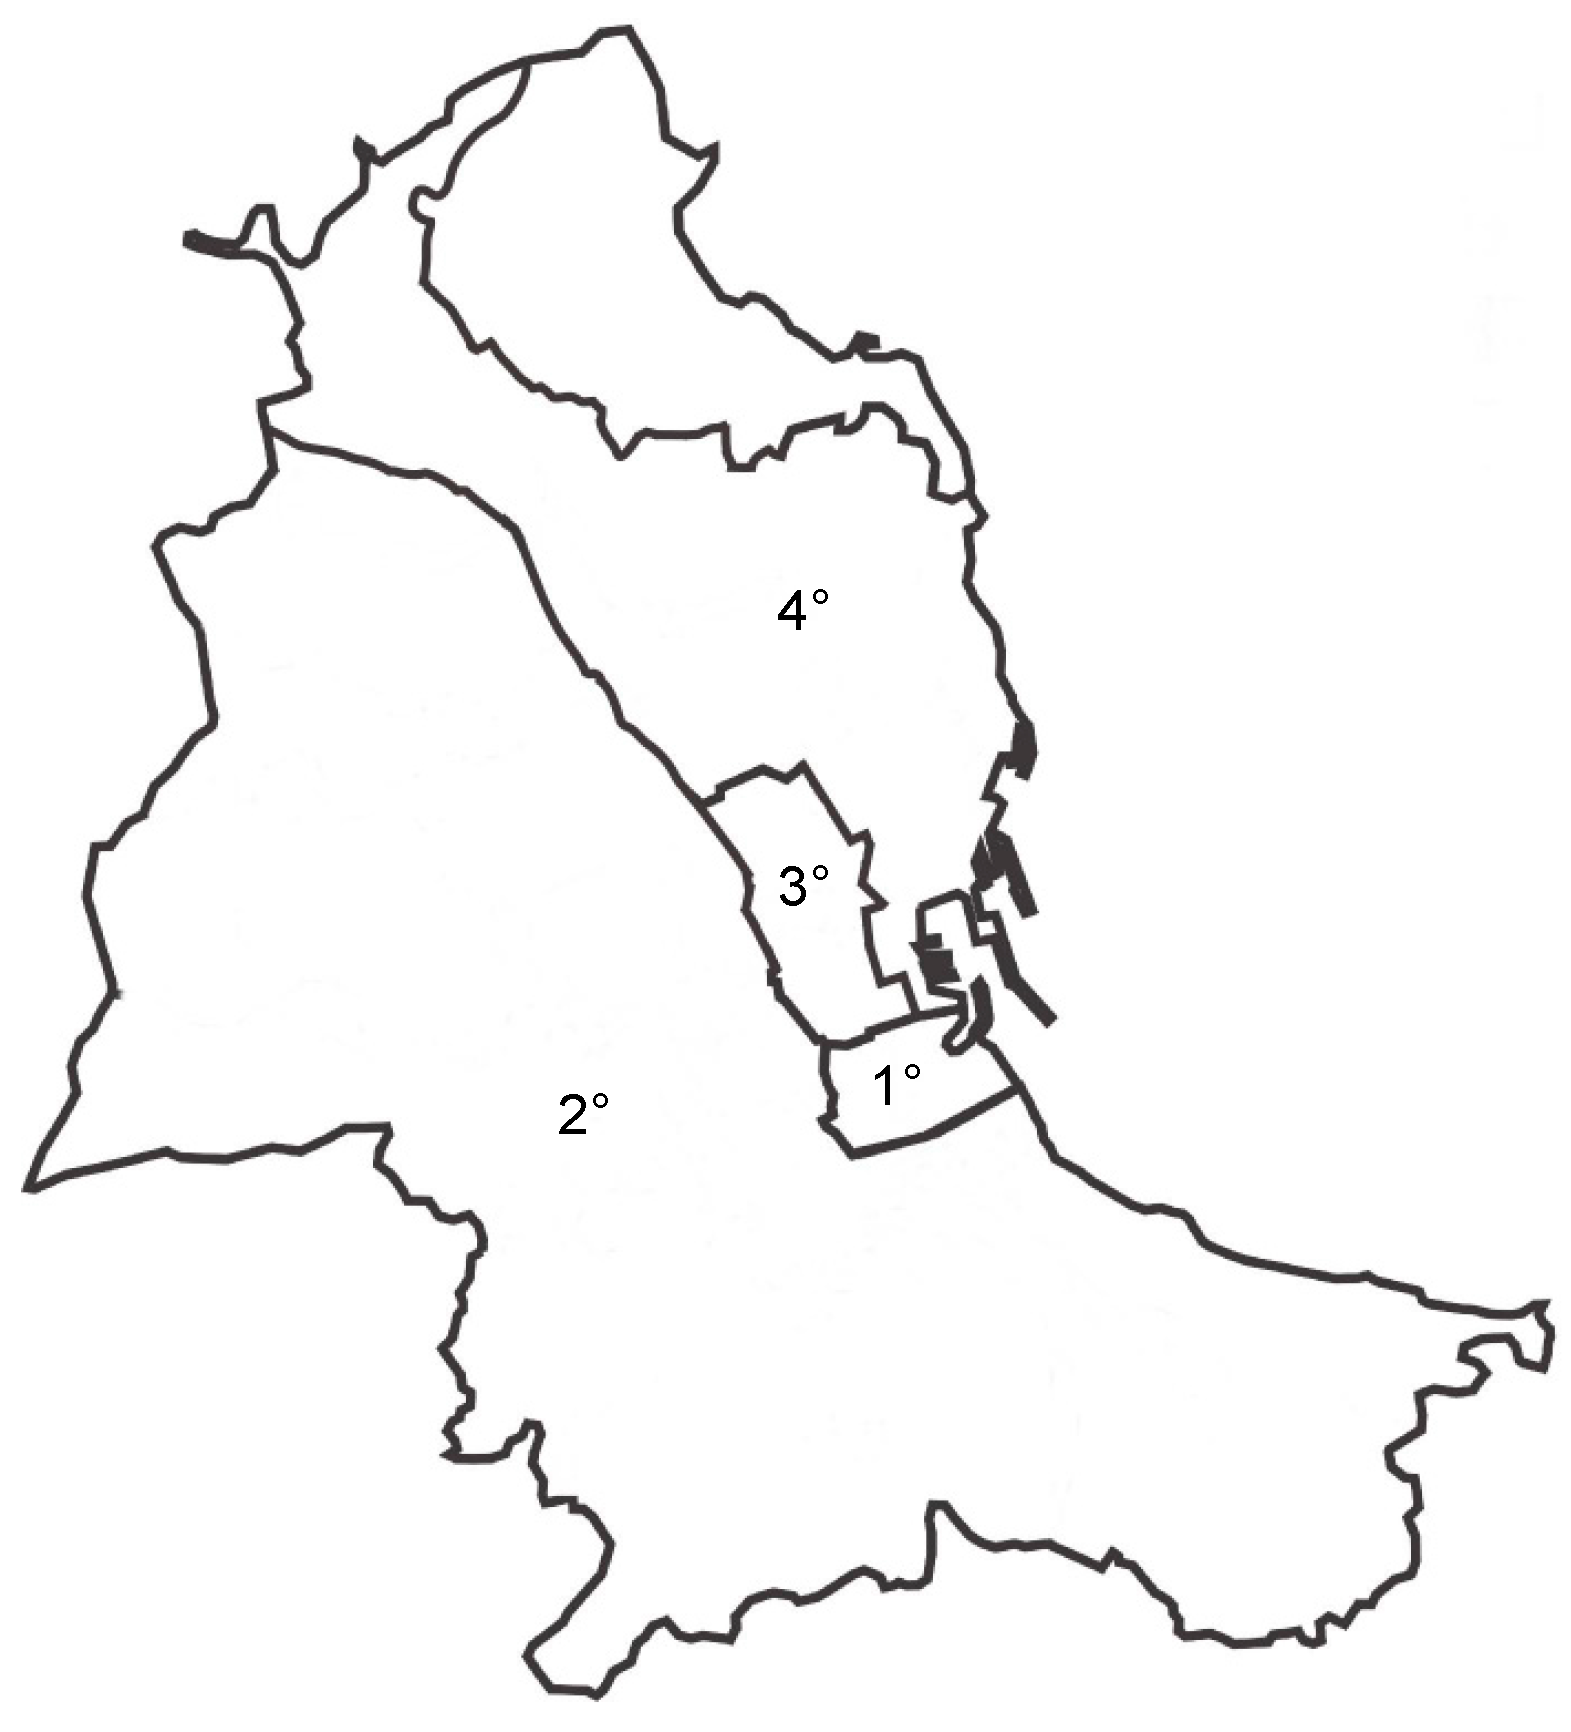
Table 3 shows the calculation of the political prices for all the public housing sold according to the cadastral zones (Figure 4), categories and classes to which they belong. In particular, the baseline price indicates the maximum political price, whereas the price indicates the minimum price that includes all the possible reductions by law. The maximum baseline prices are 452 and 497 euros/sqm for the highest cadastral category and class of public housing located in the central or wealthy districts, whereas the minimum political price is 106 euros/sqm for the housing located in the historical centre or in semi-peripheral districts.
3. Methods
This case study aims at providing a measure of the efficiency and fairness of the PH policy the municipality is committed to, based on a comparison of the estimates of the current real estate market prices of the properties to be transferred, to the transfer prices supposed by municipal administration in order to:
- -
- reconsider the rules for the political pricing in order to grant homogeneous reductions of the real estate market estimates, for the purpose of the equalization between the current tenants (potential owners);
- -
- suggest possible variations in the political prices for those properties of which, due to any higher location characteristics, the market estimates are greater, and in respect of which the reduction is greater than the average.
According to the characteristics of the PH asset and the general aim of the municipality, an appraisal pattern was developed in three stages:
- A real estate market survey aimed at providing a wide and articulated database intended to appraise the potential real estate market price of the properties to be transferred;
- The application of a multiple linear regression pattern, aimed at eliciting the marginal prices of the characteristics by which the properties to be transferred have been featured;
- The estimate of the properties to be transferred aimed at comparing the real estate potential market price to the political prices carried out by the municipality according to the current laws, in order to provide some critical item of the fairness of the municipal public housing management policy.
3.1. Real Estate Market Survey: Characterization of the Sample
The progressive public-private integration in the formation and implementation of urban policies over the entire development process from inception through appraisal, valuation and financing to completion and disposal, has made the analysis of the real estate market an indispensable premise of planning [40]. The real estate market survey is carried out to achieve a proper sample of dwellings of which asking prices are reported. The dwellings have been characterized by six primary characteristics [41], articulated in 17 sub-characteristics [42] (Table 4).
In order to provide an early representation of the relation between property value (quality) and asking price, the units belonging to the sample have been characterized by attributing to each of them a score ranging from 1 up to 5, from the points of view of the 17 sub-characteristics listed in Table 4. Then these scores have been aggregated into the six main characteristics ) by a reasonable weight system set basing on expertise:
A similar further aggregation aimed at synthesizing the qualitative value of the surveyed units by an overall score (), provides an early profile of the relation between the current price and value (characteristics) in that area, by using the weight system calculated with the multiple regression method as explained in the next section:
3.2. The Multiple Regression Model
The multiple regression model is a statistical tool widely used for economic and estimative purposes [43,44,45]. The regression model establishes a correlation between the market value, or income, and characteristics like urban location [46], location within the building, technological condition, and architectural and environmental quality [47] that most significantly affect them, in order to express the mutual correlations between the characteristics and the quantitative effect produced by each characteristic on the price.
In the appraisal analysis, the multiple regression model provides the equation of price or income and identifies a hyperplane (regression plane) [48]:
where is the generic observation in a sample of property, is the asking price of the generic property; (with ) the property features; is the intercept; is the inclination of with respect to the variable while keeping constant variables ; is the inclination of with respect to the variable while keeping constant variables ; and is the inclination of with respect to the variable while keeping constant variables ; is error at observation.
The starting point of the regression is represented by a matrix that summarizes the linear relationships between the dependent (price) and the independent variables (location, positions within the building, technological and architectural characteristics), and between the independent variables to each other.
The model provides:
- a set of parameters that summarize the relationship between the dependent variable and the independent ones, under the assumptions that the former is the effect of the latter, and that in examining the influence of each independent variable on the dependent ones, the value of other independent variables are kept constant;
- a statistic for examining the significance of the parameters, and a probability value associated with each of these parameters;
- a value that summarizes the proportion of variance of the dependent variable that is generally explained by the independent variables.
Regression analysis consists of several basic steps:
- evaluation of the adequacy of the variables (measurement level, distribution, collinearity etc.);
- choice of the analytical strategy to insert the independent variables into an equation;
- interpretation of the solution;
- validation of the solution.
There are numerous indices and tests to verify the multiple regression model, the most important for estimation purposes being:
- The coefficient of determination which represents the proportion of variability of the explained by the independent variables, may measure the goodness of the proximity of the model to the original data; or which takes into account the number of explanatory variables included in the model and sample size;
- The , derived from the corresponding analysis of variance, which allows to decide if the variance induced by regression is statistically significant or may be assigned to the case to a predetermined level of confidence;
- The on the statistical significance of the individual variables;
- The variance inflation factor (VIF) is the ratio of variance in a model with multiple terms, divided by the variance of a model with one term alone. It quantifies the severity of multicollinearity in an ordinary least squares regression analysis. It provides an index that measures how much the variance (the square of the estimate’s standard deviation) of an estimated regression coefficient is increased because of collinearity;
- The analysis of residuals, which may assess the appropriateness of the model by defining residual and examining residual plots. Residuals are the difference between the observed value of the dependent variable and the predicted value. The analysis of the residuals : is a tool to verify the goodness of the regression model, i.e., if there are no violations in terms of linearity, additivity and homoschedasticity of particular variables.
In particular, the following conditions must be verified:
- mean equal to zero: ; for each combination of values of the independent variables, the expected residual value must be equal to 0;
- homoschedasticity: for each ; the variance of the residuals must be constant for all combinations of the values of the independent variables;
- normality: the distributions of the values of for each combination of values of independent variability must be of normal form;
- absence of autocorrelation: , for each and , with ; residues associated with different observations must not be correlated;
- the independent variables must not be correlated with the residuals:
On the basis of the procedure carried out, it is possible to suggest some acceptable values of the statistical measures percentages and statistical tests supporting a multiple regression model to the real estate appraisal context [49].
- Value of the coefficients of determination equal to or greater than 0.95, or in some less restrictively are proposed values equal to 0.90 or, however, close to 0.90;
- The average error rate should not be higher than 10% and errors for each observation must not be greater than 15%, or the standard error should not be greater than 5% of the average price;
- The limit values of the t and F tests are based on the confidence interval that generally is equal to 0.95. An important condition in the regression analysis concerns the relation between the number of observations and the number of explanatory variables required.
- Practical criteria suggest that the relation between the number of observations and the number of variables should be , o + 30, or less restrictively at least up to in respect of the previous inequality, or even , where is the number of observations in the sample of property trades and is the number of the property features. In general, the choice of the criterion is related to the actual availability of the data.
3.3. Appraisal and Benchmarking
To determine the amount of the ‘solidarity rent’ that is transferred from public administration to low-income households, the housing political prices of the sold dwellings have to be compared to market prices.
The market prices of all the sold dwellings may be appraised applying the above described multiple regression model which processes the sample of data from the direct real estate market survey. In order to convert ask prices into market prices, a reduction factor has to be applied as an effect of the bargaining. A detailed evaluation of the ‘solidary rent’ may be obtained by the comparison between the estimated prices and the political prices.
Moreover, we assume the OMI (Observatory of the Real Estate Market) quotations as benchmarks. The OMI is an Italian Finance Ministry’s observatory that classifies the real estate market data by several parameters, such as city, area, use, and building typology; it also makes available a range of maximum-minimum prices. Although the OMI prices are referred to large areas and the average conservation status of the buildings, the differential obtained from their comparison with the political prices provides a first reasonable quantification of the ‘value of solidarity’ magnitude.
4. Application and Results
4.1. Real Estate Market Survey
The real estate market survey has been carried out over the V and VI Districts of Palermo, which cover a wide urban area of 41.43 sq.km that is equal to 26% of the total area of the eight districts. These districts have been chosen as the case study since a relevant amount of public housings to be transferred is located there, that is equal to 739 units and to 28.6% of the offered for sale dwellings. Then, to evaluate the distance between the market price and the political price at which 32 dwellings have been already transferred, the proposed real estate observation addresses a very detailed sample of 98 units of which asking prices are reported and displayed in the table and in the chart of Figure 5.
This sample provided a scale of prices and values as benchmarks that, by the elicitation of the marginal prices of the chosen characteristics, allowed us to place all the public housing to be transferred in the appropriate price range.
A sample of the real estate survey is displayed in Table 5 reporting location, size, prices, the aggregated scores of the properties by the main characteristics () and by the overall quality score (). The size of the properties has been measured by both number of rooms and surface areas due to the typological heterogeneity of the units surveyed, and some inaccuracies of the data collected.
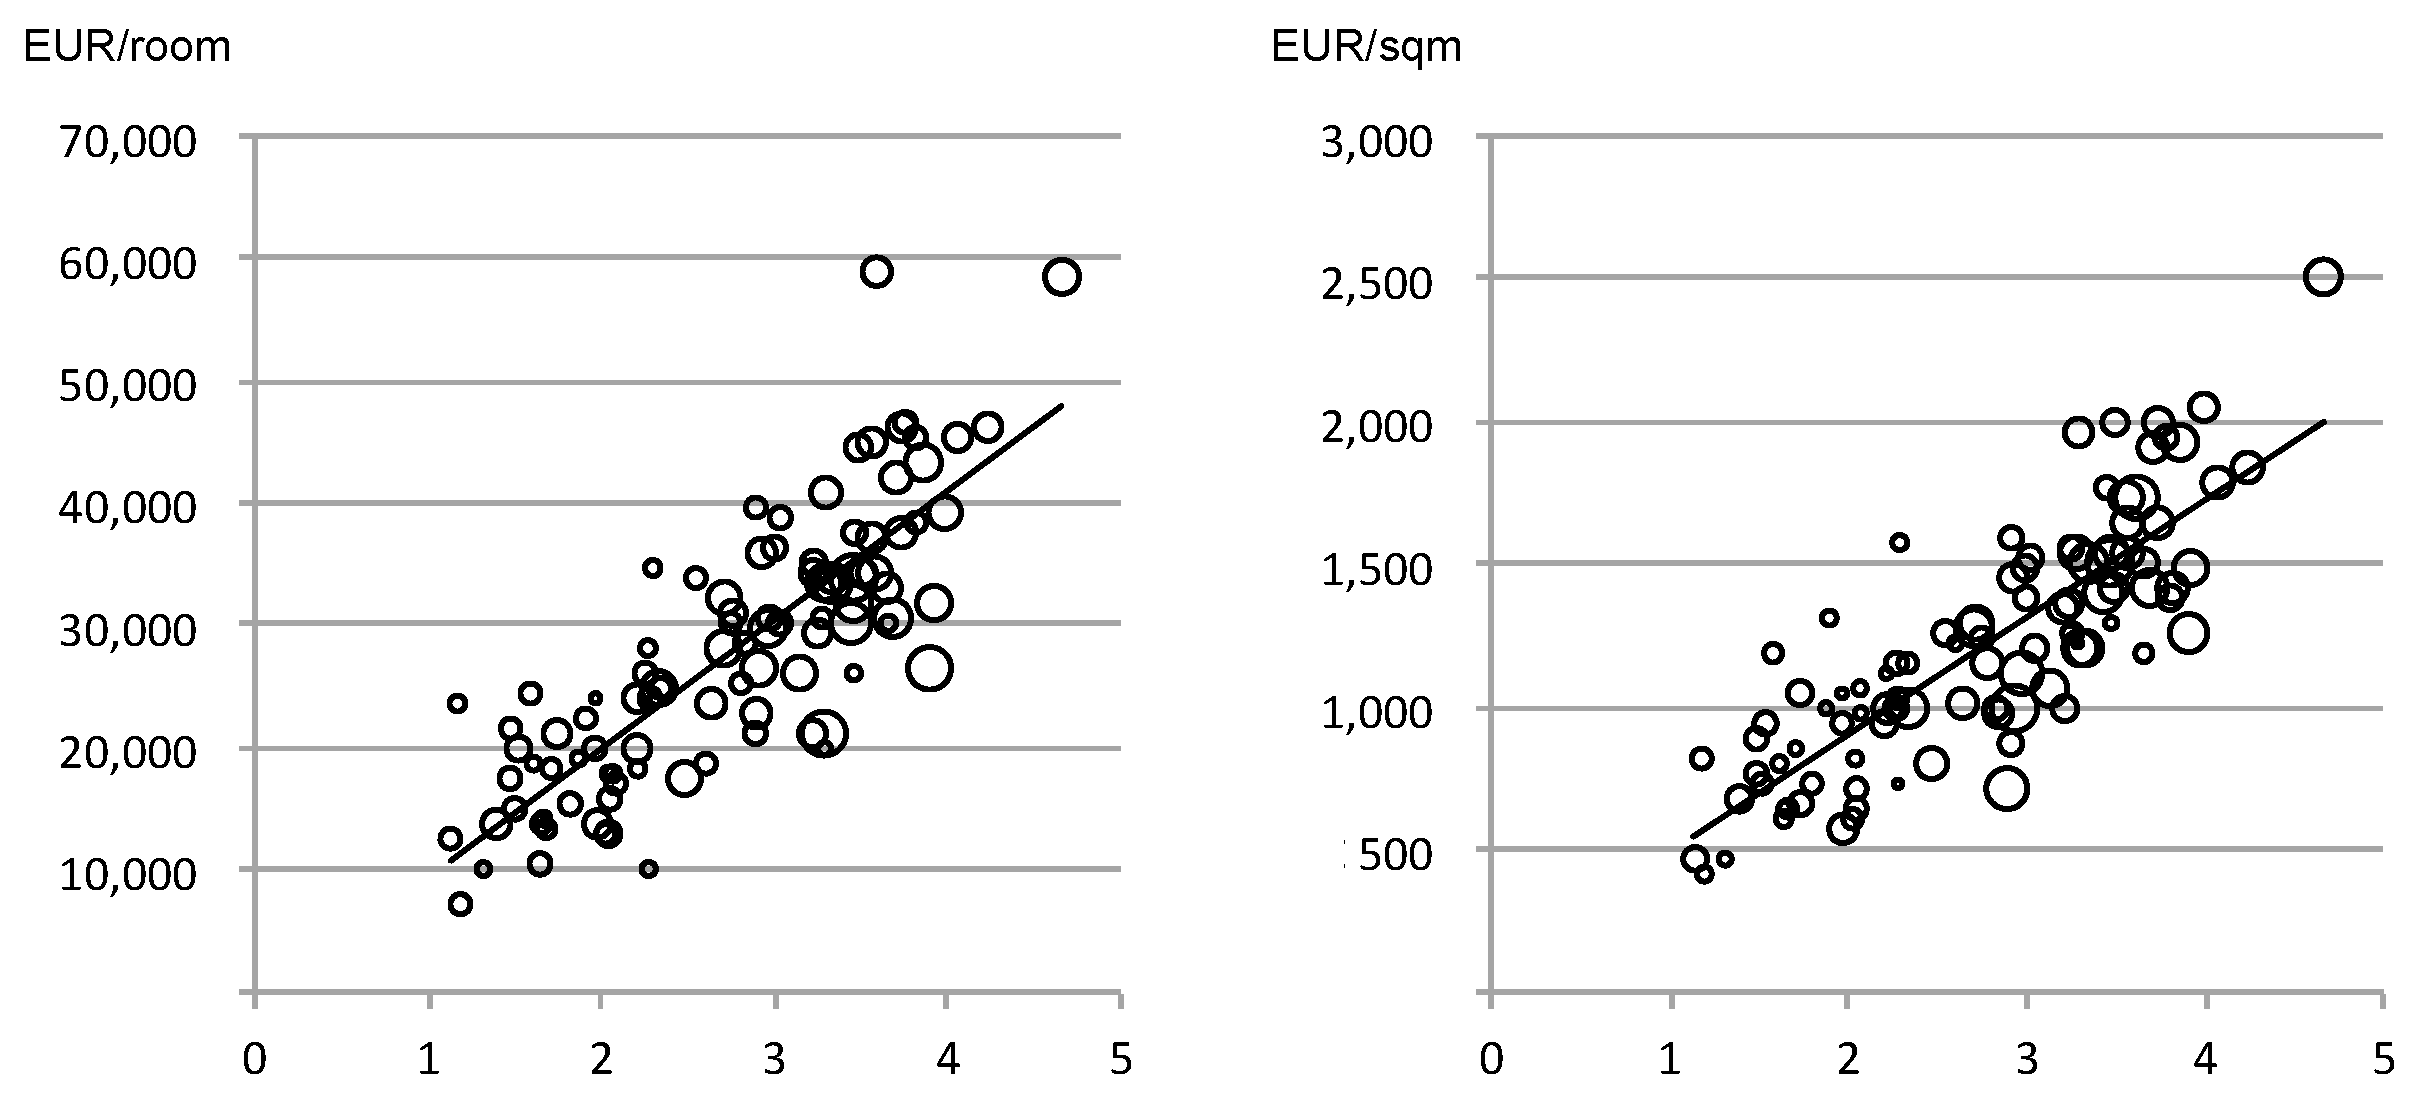
The relation between unit prices (by room and by surface area), and overall quality score—as displayed in an early representation by the charts of Figure 6—is significantly consistent. The bubble size represents the size of every single property: the smaller real estate matches a lower quality and price, due to a local specific characteristic of demand seeking for properties suitable mostly for families especially in the predominantly residential areas.
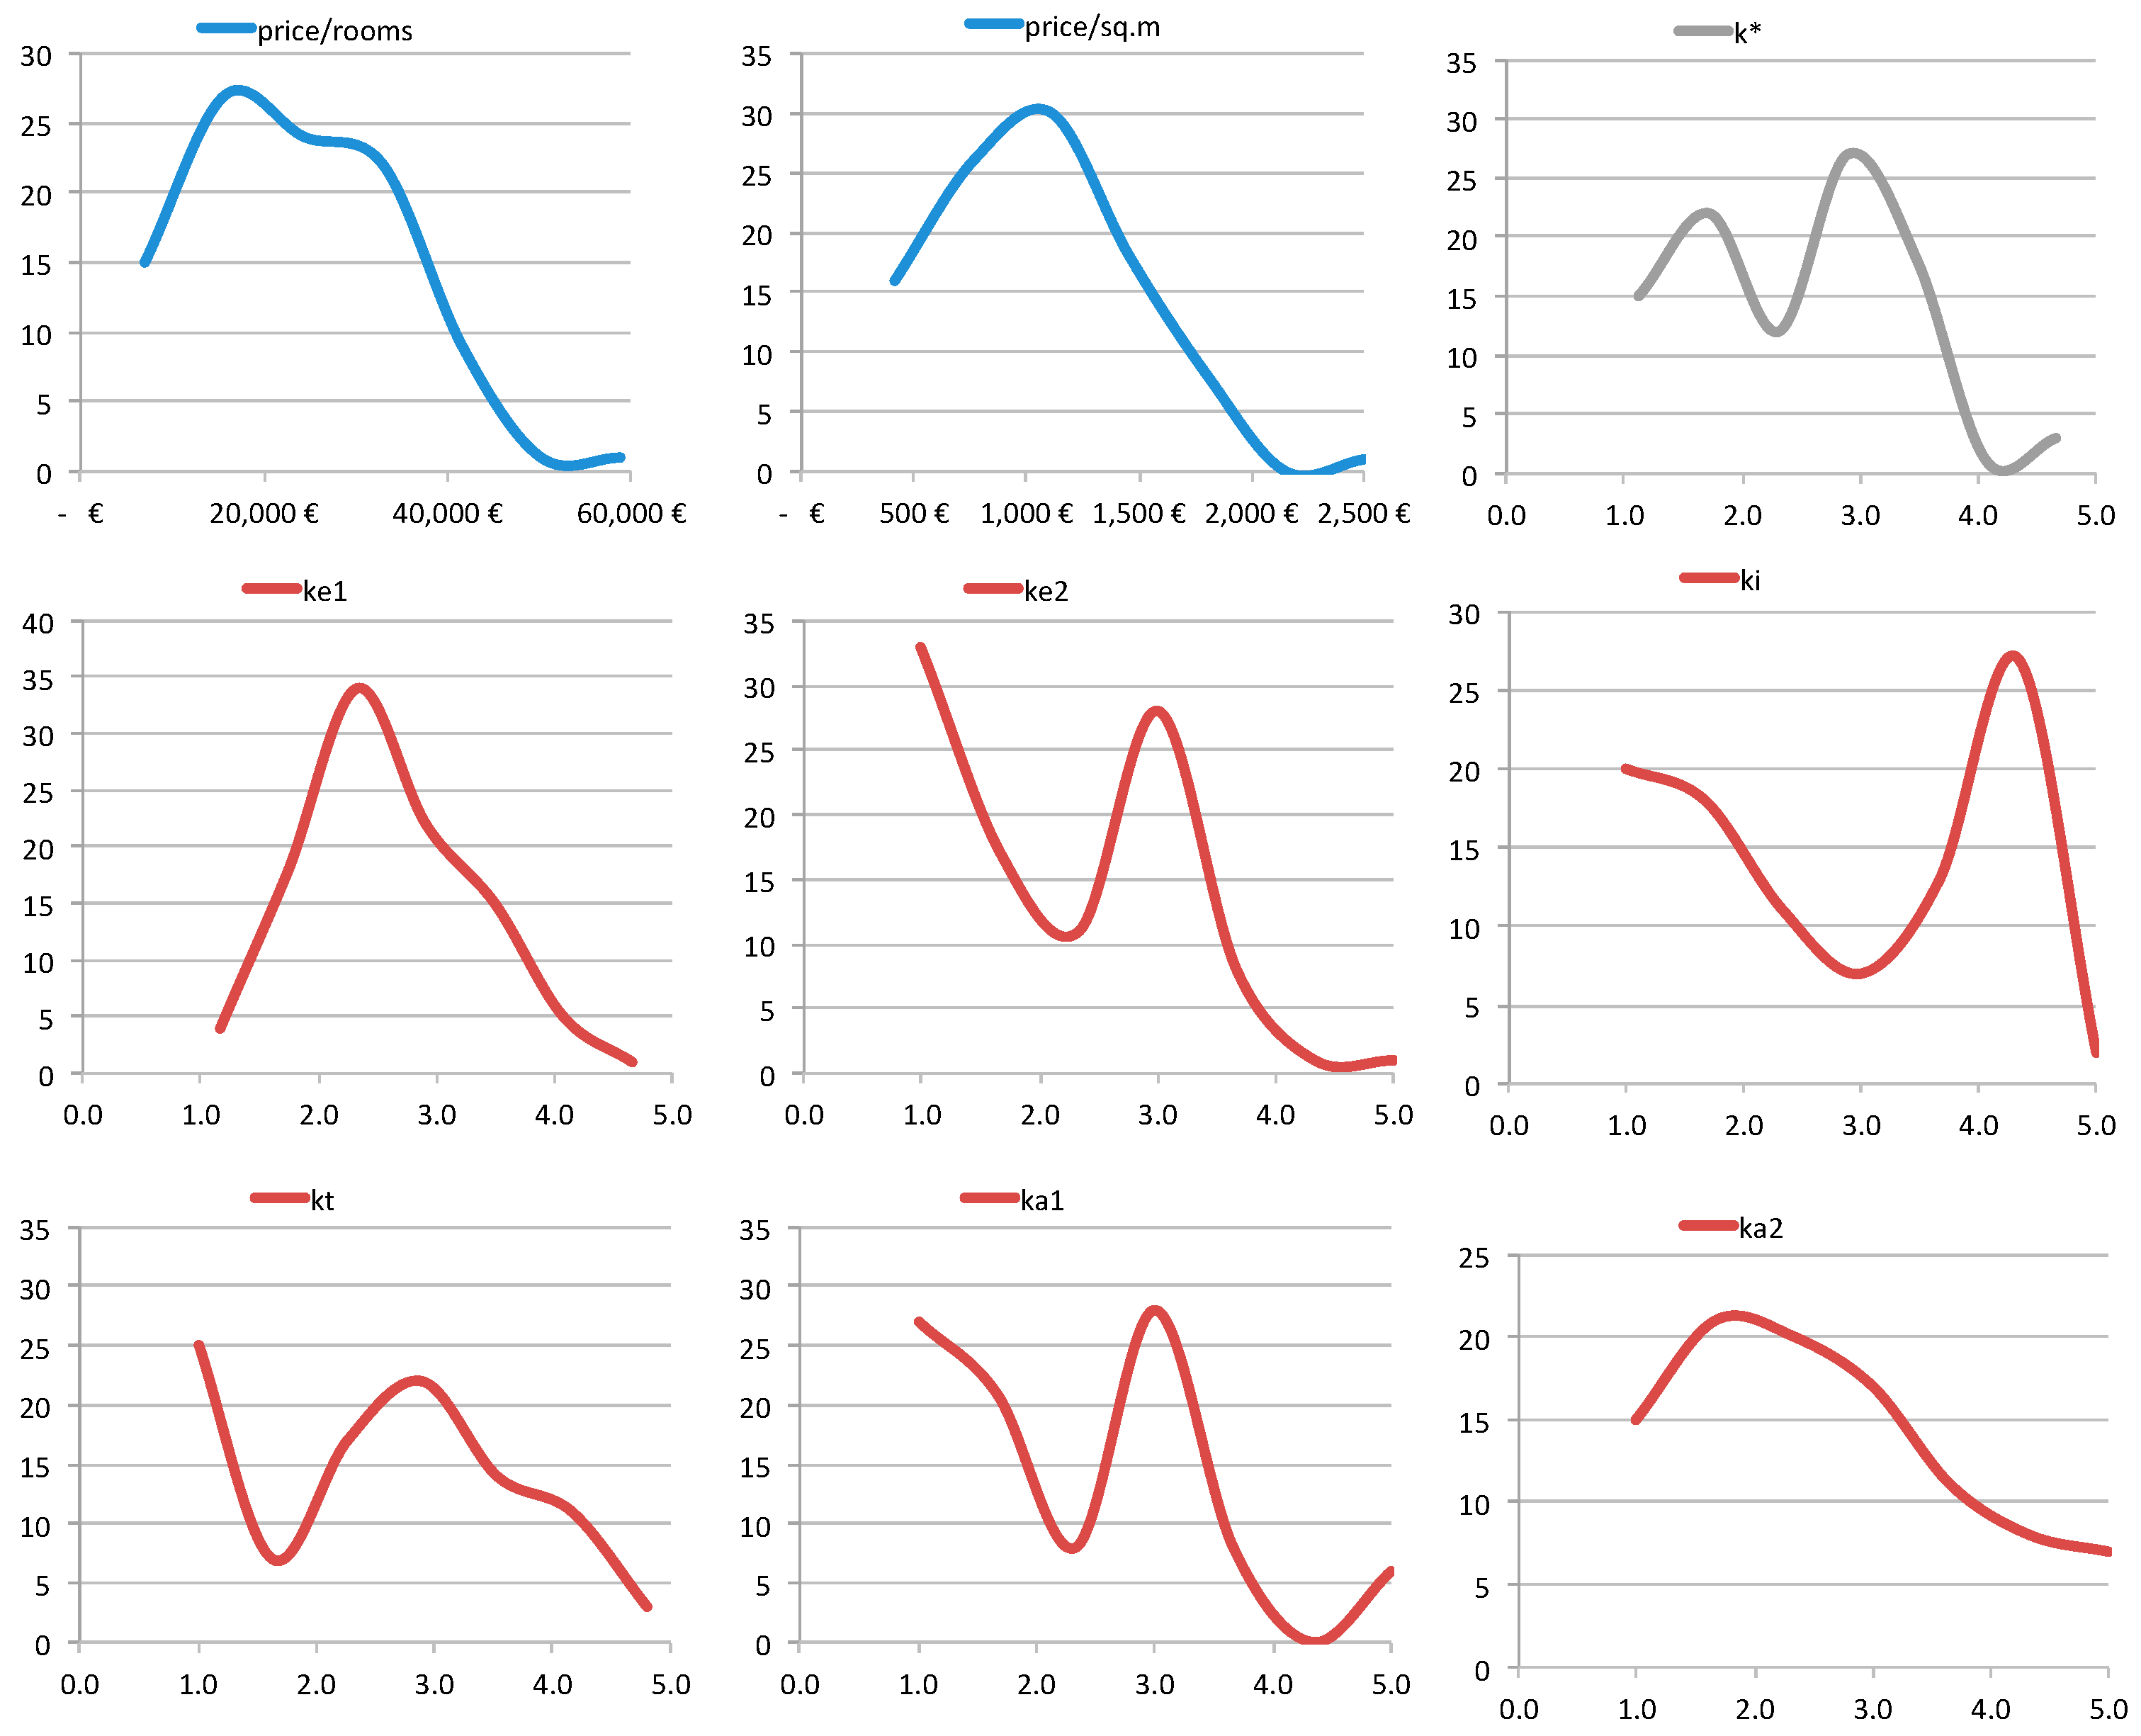
The charts of Figure 7 show the probability density function for unit prices, overall quality score, and the six characteristics. As for prices, we notice the prevalence of a low-medium level; in terms of location, the sample is distributed in areas that have medium or medium-low accessibility and settlement quality, while the specific characteristics of the neighbourhood context are rather varied; as the location of the real estate units inside the building is often on the upper floors, or the buildings are located in external or open areas, the views and brightness are often high; the level of technological performance is mostly low and medium-low as well as the overall architectural characteristics.
4.2. The Multiple Linear Regression Analysis and the Elicitation of the Predictors
The regression model implemented in this study is aimed at identifying a correlation and the quantitative effect produced by each characteristic defined above, and the market value , and then the reciprocal correlations between the different characteristics.
The proposed regression model can be represented by the following equation:
Given the sample of properties of V and VI Districts, consisting of 98 real estate units characterised by and by real estate characteristics , , , , , the regression model was implemented with the help of SPSS statistical software.
There are several techniques to select the optimal number of predictors, among the aforementioned characteristics, to be inserted in a multiple regression model, such as the block techniques, namely standard regression and hierarchical regression, and stepwise: forward (step-up) selection, backward (step-down) selection, remove selection.
Multiple regression was performed here with all the techniques mentioned above, but the best results identified on the basis of the indices and tests validating the regression model, were obtained by applying the backward (step-down) selection technique.
Backward selection at first involves with all candidate variables, testing the deletion of each variable using a chosen model fit criterion, deleting the variable (if any) whose loss gives the most statistically insignificant deterioration of the model fit, and repeating this process until no further variables can be deleted without a statistically significant loss of fit.
The backward (step-down) selection technique allowed to identify five significant predictors, i.e., , , , , with respect to the six previously considered.
The architectural characteristic of the building was not significant for this regression model, which is consistent with the general characteristics of the segment of the Palermo real estate market, which the sample belongs to.
In fact, in relation to the type of buildings in the sample, the subjects perceive this feature in a less significant way compared to the others.
In the case of the model with five variables identified with the backward (step-down) selection technique, the tests provided the following results:
- The coefficient of determination , which represents the proportion of variability of explained by the explanatory variables, and which represents a measure of the goodness of the proximity of the model to the original data in this case is 0.834, which can be considered an acceptable result;
- taking into account the number of explanatory variables , i.e., the six real estate characteristics included in the model and the sample size has a value of 0.825, which can be considered acceptable;
- The used to evaluate the statistical significance of the model as a whole is based on the relationship between the variance explained by the model and the residual variance; in this case the is less than the ;
- The on the statistical significance of the individual predictors within the meaningful model for the five variables , i.e., the real estate characteristics , , , have a significant influence on the formation of the ;
- The VIF, that helps to quantifies the severity of multicollinearity in an ordinary least squares regression analysis, in this case is very low and there is not multicollinearity between the variables.
- The analysis of the eigenvalues to identify possible multicollinearity conditions identifies low values of the condition index, i.e., very low or lack of multicollinearity.
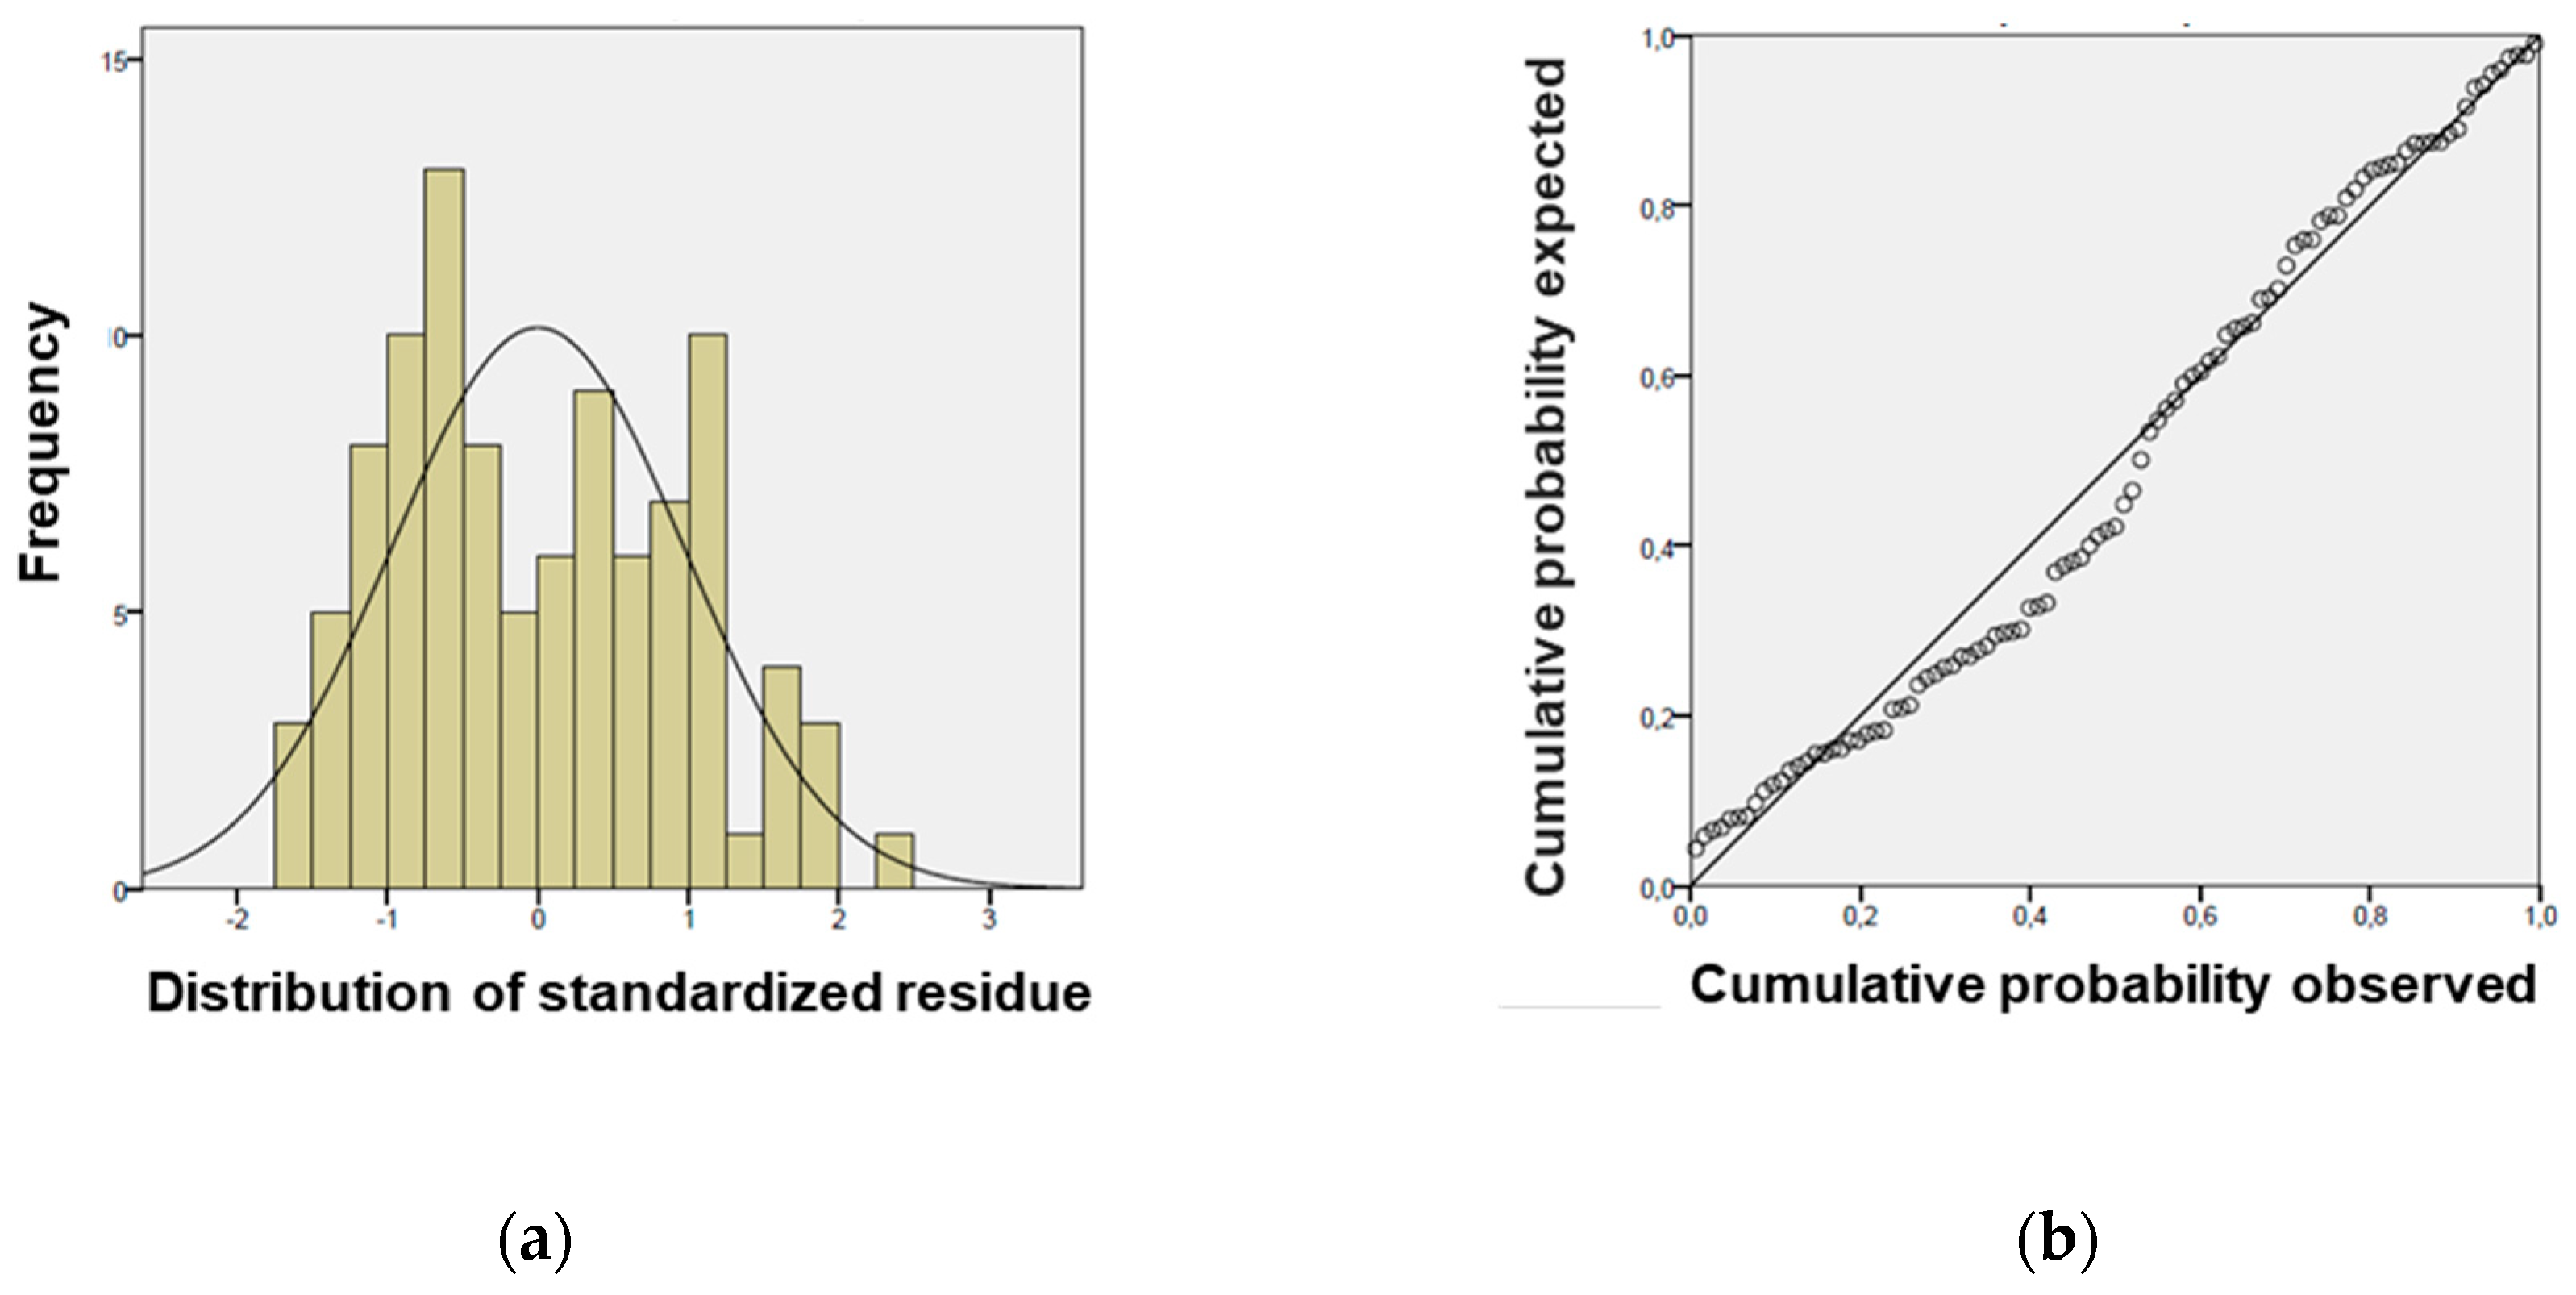
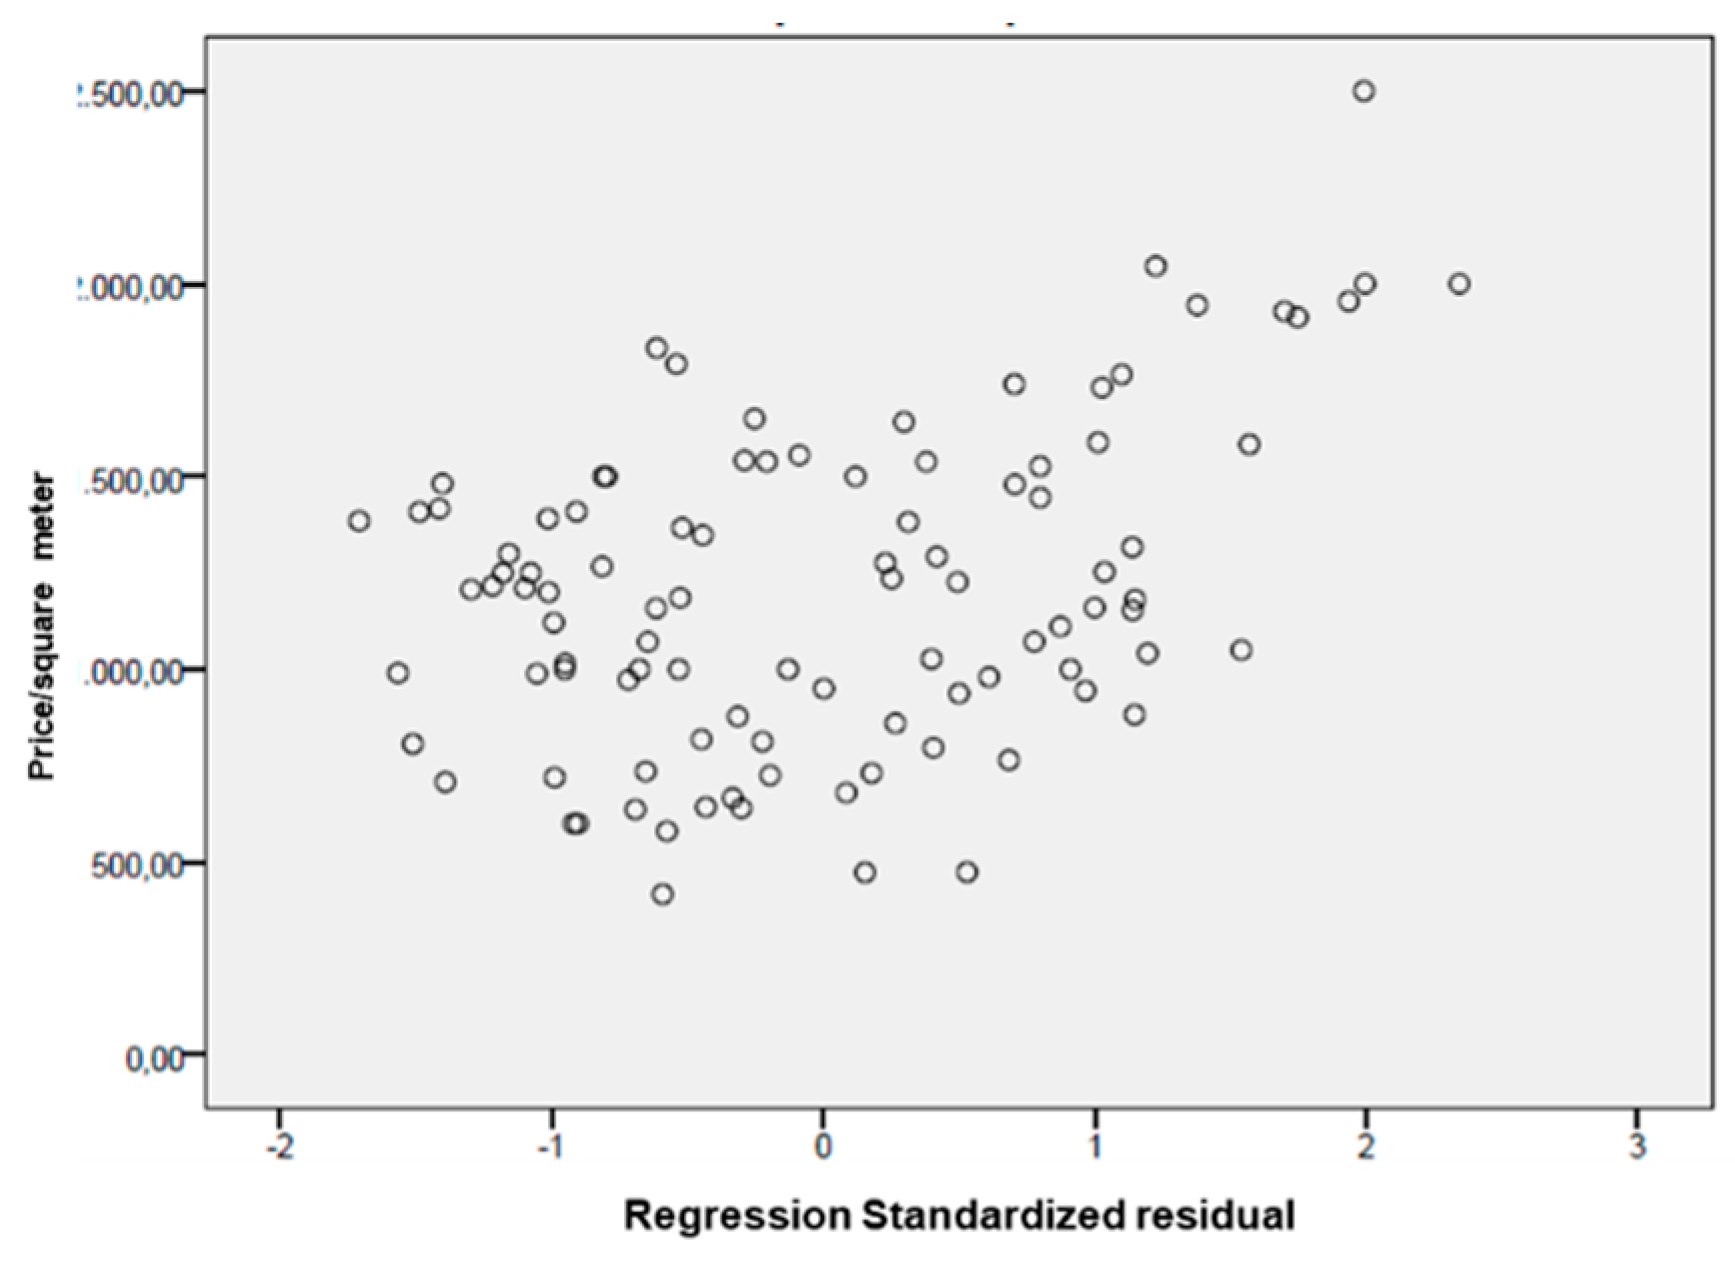
- The analysis of the residuals shows that the standardized residue approximates to the distribution to the normal one, i.e., for each combination of values of the independent variables, the expected residual value is equal to 0 and for each the variance of the residuals is constant for all combinations of the values of the independent variables (Figure 6 left);
- In the Normal P-P graph of standardized residual regression the points tend to be arranged even if with some approximation along a straight line (Figure 8b, right);
The analysis of the residues then highlights the respect of the linearity, additivity and homoschedasticity of the variables of the model.
The coefficients of the predictors for the regression model are the following: = 135,016; = 94,688; = 61,006; = 131,957; = 59,136.
4.3. Comparison between Political, Real Estate Market, and Observatory of the Real Estate Market (OMI) Prices
In order to measure the value of solidarity, the political price of public housing is compared to two other prices: the estimated price, by applying the multiple regression model, and the OMI price.
Once the predictors are found, the multiple regression model was performed to appraise the potential market price of the 32 public dwellings in the districts V and VI, that were already transferred from the municipality to the tenants. The 32 dwellings have been characterized by attributing them the scores according to the range which is described in Section 3.1, and afterward the resulting estimated prices were reduced of 20% to take into account bargaining (Table 6).
The OMI prices for this case study have been selected from the OMI database and are referred to the city of Palermo and to the OMI zones in which the dwellings are located. With reference to the OMI real estate typologies, “cheap housing” is the typology that better represents the public housing buildings. Moreover, due to a low quality of the technical characteristics and current maintenance of public housing, the minimum OMI prices are used as proper benchmarks (Table 6).
Afterward, the final comparison between the three types of prices has been carried out in terms of ratio between political/estimated prices and political/OMI prices (Table 6) to provide quantitative-monetary elements for the estimate of the value of solidarity.
5. Discussion and Conclusions
The comparison between the political prices (P), the OMI prices (O) and the estimated prices (E) by the multiple regression model suggests the following discussion and some forward-looking considerations.
As shown in the Figure 11, the political prices vary slightly, as they mainly depend on the cadastral incomes that are almost equivalent over the cadastral zones. These zones are very large areas, especially in the periphery or suburbs, so the cadastral incomes are unable to take into account the peculiar characteristics of each dwelling for the political price calculation. The political prices are very low and range just between 118 and 229 euros/sqm (Table 7), according to the intention of the legislator to offer affordable housing to low-income households.
Although the OMI zones are more numerous than the cadastral ones, the OMI prices are also similar over several peripheral zones and are obviously higher than the political ones as they are referred to the real estate market, in fact the unit OMI price varies between 800 and 880 euros/sqm and the standard deviation (SD) is 31 euros/sqm (Table 7).
Instead, the estimated prices vary widely because the regression model is able to implement the peculiar negative or positive characteristics of each dwelling into the market price appraisal, as a consequence it ranges from 502 to 1172 euros/sqm, and instead the SD is 237 euros/sqm (Table 7).
Table 7 displays other indicators that synthetize the overall efficiency and fairness of the housing policy as it refers to the alienation of 32 public housings.
We assume the P/E ratio as the index of the efficiency of the housing policy, the lower the ratio, the higher the housing affordability. The P/E ratios are very low as they ranges from 0.12 to 0.38, while the average ratio is equal to 0.18. As a consequence, the municipally applied an average reduction of 82% to the market prices that is higher even than maximum discount set by RTB in the United Kingdom, which is 70%.
However, the discount on the market price varies over the sample and, as a consequence, disparities arise among the tenants who purchased the housing. The relative standard deviation (RSD%), which is an index of relative dispersion, measures the fairness of the housing policy among the tenants and when it is applied to the ratios, the lower the RSD%, the higher the fairness. In this case study the RSD% of the ratio P/E is rather high, as it is equal to 31%, and reveals an internal inequality in transferring public housing; in fact, those who paid just the 12.4% of the market price to purchase a dwelling with very good characteristics, e.g., in terms of proximity to urban facilities or of panoramic quality and view, gained an additional advantage compared to other households who paid up to 38.1%.
The differentials ‘Estimated–Political price’ (E–P) and ‘OMI–Political price’ (O–P) instead measure the total amount of the discounts corresponding to the social wealth that is assumed as the ‘value of solidarity’ that the social system is willing to give for free to tenants in the perspective of the enhancement of social quality of public housing neighbourhoods.
Both the unit average differentials E–P and O–P are quite close, respectively 722 and 665 euros/sqm, whereas the corresponding RSD% are very different as the former is 26%, the latter is 5% (Table 7). We considered that the total value of solidarity was nearly 2,400,000 ÷ 2,660,000 euros for the transfer of 32 dwellings in the Districts V and VI of Palermo (Table 8).
In order to improve the fairness of the transfer of public housing and remove disparities between the tenants, the legal rules currently in force might be changed by founding the calculation of the political price on the market price, instead of the cadastral income and, moreover, by applying a constant coefficient of reduction of the housing price. This coefficient should be greater than that set for the securitization procedures, and might vary over the years in relation to few national economic and social indicators, such as gross national product (GNP), unemployed rate, index of ‘material and social vulnerability of households’, in order to increase the social efficiency and fairness of transferring public housing.
Future perspectives of the study may be to analyse the reasons for such a low number of dwellings sold, which might depend on both a very low or zero household propensity to save, due to an income that is just enough to satisfy the basic needs, and an expected capital value even lower than the politically fixed price.
Author Contributions
G.N., Section 1, Section 2, Section 3.3, Section 4.3 and Section 5; S.G., Section 3.1, Section 4.1; M.R.T., Section 3.2, Section 4.2.
Funding
The authors did not receive funds for supporting the research work or for covering the costs to publish in open access.
Conflicts of Interest
The authors declare no conflict of interest.
References
- Soja, E.W. Regional Urbanization and the End of the Metropolis Era. In New Companion to the City; Bridge, G., Watson, S., Eds.; Wiley-Blackwell: Cambridge, MA, USA, 2011; pp. 679–689. [Google Scholar]
- Davis, M. City of Quartz: Excavating the Future in Los Angeles; Verso: New York, NY, USA, 1990. [Google Scholar]
- Mackenzie, E. Privatopia: Homeowner Association and the Rise of Residential Private Government; Yale University Press: New Haven, CT, USA; London, UK, 1994. [Google Scholar]
- Aalbers, M.B.; Gibb, K. Housing and the right to the city: Introduction to the special issue. Int. J. Hous. Policy 2014, 14, 207–213. [Google Scholar] [CrossRef]
- Giampino, A.; Lo Piccolo, F. Formal property rights in the face of the substantial right to housing. Public Sect. 2016, 42, 52–63. [Google Scholar]
- Napoli, G.; Giuffrida, S.; Trovato, M.R. Fair Planning and Affordability Housing in Urban Policy. The Case of Syracuse (Italy). In Proceedings of the Computational Science and Its Applications, Beijing, China, 4–7 July 2016; Springer International Publishing: Cham, Switzerland, 2016; Volume 9789, pp. 46–62. [Google Scholar] [CrossRef]
- Napoli, G. Housing affordability in metropolitan areas. The Application of a Combination of the Ratio Income and Residual Approaches to Two Case Studies in Sicily, Italy. Buildings 2017, 7, 95. [Google Scholar] [CrossRef]
- Stone, M.E. A housing affordability standard for the UK. Hous. Stud. 2006, 21, 453–476. [Google Scholar] [CrossRef]
- Stone, M.E.; Burke, T.; Ralston, L. The Residual Income Approach to Housing Affordability: The Theory and the Practise. 2011. Available online: http://works.bepress.com/michael_stone/7 (accessed on 31 May 2018).
- Haffner, M.; Boumeester, H. The Affordability of Housing in the Netherlands: An Increasing Income Gap between Renting and Owning? Hous. Stud. 2010, 25, 799–820. [Google Scholar] [CrossRef]
- Government UK; Council Housing and Housing Association. Right to Buy. Available online: www.gov.uk/right-to-buy-buying-your-council-home (accessed on 30 September 2018).
- Disney, R.; Luo, D. The Right to Buy public housing in Britain: A welfare analysis. J. Hous. Econ. 2017, 35, 51–68. [Google Scholar] [CrossRef]
- Napoli, G.; Gabrielli, L.; Barbaro, S. The efficiency of the incentives for the public buildings energy retrofit. The case of the Italian Regions of the “Objective Convergence”. Valori e Valutazioni 2017, 18, 25–39. [Google Scholar]
- Napoli, G. Financial sustainability and morphogenesis of urban transformation project. In Proceedings of the ICCSA 2015, Part III, LNCS 9157, Banff, AB, Canada, 22–25 June 2015; Springer International Publishing: Cham, Switzerland, 2015; pp. 178–193. [Google Scholar] [CrossRef]
- Gabrielli, L.; Giuffrida, S.; Trovato, M.R. Functions and Perspectives of Public Real Estate in the Urban Policies: The Sustainable Development Plan of Syracuse. In Proceedings of the ICCSA 2016, LNCS 9789, Beijing, China, 4–7 July 2016; Gervasi, O., Murgante, B., Misra, S., Eds.; Springer: Cham, Switzerland, 2016; Volume IV, pp. 13–28. [Google Scholar] [CrossRef]
- Trovato, M.R.; Giuffrida, S. The choice problem of the urban performances to support the Pachino’s redevelopment plan. Int. J. Bus. Intell. Data Min. 2014, 9, 330–355. [Google Scholar] [CrossRef]
- Trovato, M.R.; Giuffrida, S. A DSS to Assess and Manage the Urban Performances in the Regeneration Plan: The Case Study of Pachino. In Proceedings of the International Conference on Computational Science and Its Applications, ICCSA 2014, PT III, Guimarães, Portugal, 30 June–3 July 2014; pp. 224–239. [Google Scholar] [CrossRef]
- Hoekstra, J.; Saizarbitoria, I.H.; Etxarri, A.E. Recent changes in Spanish housing policies: Subsidized owner-occupancy dwellings as a new tenure sector? J. Hous. Built Environ. 2010, 25, 125–138. [Google Scholar] [CrossRef]
- Eastaway, M.P.; Varo, I.S.M. The Tenure Imbalance in Spain: The Need for Social Housing Policy. Urban Stud. 2002, 39, 283–295. [Google Scholar] [CrossRef]
- Palomerg, J. How Did Finance Capital Infiltrate the World of the Urban Poor? Homeownership and Social Fragmentation in a Spanish Neighborhood. Int. J. Urban Reg. Res. 2013. [Google Scholar] [CrossRef]
- Giuffrida, S. City as Hope. Valuation Science and the Ethics of Capital. In Integrated Evaluation for the Management of Contemporary Cities SIEV 2016; Green Energy and Technology; Mondini, G., Fattinnanzi, E., Oppio, A., Bottero, M., Stanghellini, S., Eds.; Springer: Cham, Switzerland, 2018; pp. 411–424. [Google Scholar] [CrossRef]
- Giuffrida, S. A Fair City. Value, Time and the Cap Rate. In Integrated Evaluation for the Management of Contemporary Cities SIEV 2016; Green Energy and Technology; Mondini, G., Fattinnanzi, E., Oppio, A., Bottero, M., Stanghellini, S., Eds.; Springer: Cham, Switzerland, 2018; pp. 425–439. [Google Scholar] [CrossRef]
- Giuffrida, S. The True Value. On Understanding Something. In Appraisal. From Theory to Practice; Stanghellini, S., Morano, P., Bottero, M., Oppio, A., Eds.; Springer: Cham, Switzerland, 2017; pp. 1–14. ISBN 978-3-319-49675-7. [Google Scholar] [CrossRef]
- Naselli, F.; Trovato, M.R.; Castello, G. An evaluation model for the actions in supporting of the environmental and landscaping rehabilitation of the Pasquasia’s site mining (EN). In Proceedings of the ICCSA 2014. LNCS 8581, Part III, Guimarães, Portugal, 30 June–3 July 2014; Springer International Publishing: Cham, Switzerland, 2014; pp. 26–41. [Google Scholar] [CrossRef]
- Sullivan, L.J.; Rydin, Y.; Buchanan, C. Neighbourhood Sustainability Frameworks—A Literature Review; Working Paper; Centre for Urban Sustainability and Resilience, University College London: London, UK, 2014. [Google Scholar]
- Berardi, U. Sustainability assessment of urban communities through rating systems. Environ. Dev. Sustain. 2013, 15, 1573–1591. [Google Scholar] [CrossRef]
- Rizzo, F. Nuova economia. Felicità del lavoro creativo e della conservazione della natura, infelicità della speculazione finanziaria e dell’inquinamento ambientale; Aracne: Roma, Italy, 2013. [Google Scholar]
- Napoli, G.; Giuffrida, S.; Valenti, A. Forms and functions of the real estate market of Palermo. Science and knowledge in the cluster analysis approach. In Appraisal: From Theory to Practice. Results of SIEV 2015; Stanghellini, S., Morano, P., Bottero, M., Oppio, A., Eds.; Springer International Publishing: Cham, Switzerland, 2017; pp. 191–202. [Google Scholar] [CrossRef]
- Gabrielli, L.; Giuffrida, S.; Trovato, M.R. From Surface to Core: A Multi-layer Approach for the Real Estate Market Analysis of a Central Area in Catania. In Proceedings of the Computational Science and Its Applications—ICCSA 2015, Banff, AB, Canada, 22–25 June 2015; Springer: Cham, Switzerland, 2015; Volume III, pp. 284–300. [Google Scholar]
- Giuffrida, S.; Ventura, V.; Trovato, M.R.; Napoli, G. Axiology of the historical city and the cap rate. The case of the old town of Ragusa Superiore. Valori e Valutazioni 2017, 18, 41–55. [Google Scholar]
- Gabrielli, L.; Giuffrida, S.; Trovato, M.R. Gaps and Overlaps of Urban Housing Sub-market: Hard Clustering and Fuzzy Clustering Approaches. In Appraisal: From Theory to Practice; Springer: Cham, Switzerland, 2017; pp. 203–219. ISBN 978-3-319-49675-7. [Google Scholar] [CrossRef]
- Nesticò, A.; De Mare, G.; Galante, M. The Sustainable Limit of the Real Estate Tax: An Urban-Scale Estimation Model. In Proceedings of the Computational Science and Its Applications—ICCSA 2014, Guimarães, Portugal, 30 June–3 July 2014; Springer: Cham, Switzerland, 2014; Volume III. [Google Scholar]
- Del Giudice, V.; De Paola, P. Spatial analysis of residential real estate rental market with geoadditive models. In Advanced Valuation Modeling; Studies in Systems, Decision and Control; d’Amato, M., Kauko, T., Eds.; Springer: Cham, Switzerland, 2017; Volume 86. [Google Scholar] [CrossRef]
- Hvelplund, F. Political prices or political quantities? A comparison of renewable energy support system. New Energy 2001, 5, 18–23. [Google Scholar]
- Hemphill, L.; Berry, J.; McGreal, S. An indicator-based approach to measuring sustainable urban regeneration performance: Part 1, conceptual foundations and methodological framework. Urban Stud. 2004, 41, 725–755. [Google Scholar] [CrossRef]
- Elgert, L. Rating the sustainable city: ‘Measurementality’, transparency, and unexpected outcomes at the knowledge-policy interface. Environ. Sci. Policy 2018, 79, 16–24. [Google Scholar] [CrossRef]
- Comune di Palermo. Bilancio Sociale 2015. Available online: https://www.comune.palermo.it/bilancio_sociale.php?anno=2015&id=24&lev=2&cap=225 (accessed on 31 May 2018).
- ISTAT 8mila Census. Incidenza Delle Famiglie con Potenziale Disagio Economico nei Diversi Quartieri di Palermo, anno 2011. Available online: http://ottomilacensus.istat.it/sottotema/082/082053/15/ (accessed on 31 May 2018).
- Giampino, A.; Lo Piccolo, F.; Todaro, V. Questione abitativa e diritto alla città a Palermo. In Transizioni Postmetropolitane. Declinazioni Locali Delle Dinamiche Posturbane in Sicilia; Lo Piccolo, F., Picone, M., Todaro, V., Eds.; FrancoAngeli: Milano, Italy, 2018; pp. 185–214. [Google Scholar]
- Ratcliffe, J.; Stubbs, M.; Keeping, M. Urban Plannning and Real Estate Development; Routledge: London, UK, 1996; ISBN 9781134106653. [Google Scholar] [CrossRef]
- Forte, C. Elementi di estimo urbano; Etas Kompass: Naples, Italy, 1968. [Google Scholar]
- Napoli, G.; Giuffrida, S.; Trovato, M.R.; Valenti, A. Cap rate as the interpretative variable of the urban real estate capital asset: A comparison of different sub-market definitions in Palermo, Italy. Buildings 2017, 7, 80. [Google Scholar] [CrossRef]
- Afifi, A.; May, S.; Clark, V.A. Practical Multivariate Analysis; Taylor and Francis: Boca Raton, FL, USA, 2012. [Google Scholar]
- Hair, J.F. Multivariate Data Analysis; Andover: Hampshire, UK, 2019. [Google Scholar]
- Johnson, R.A.; Wichern, D.W. Applied Multivariate Statistical Analysis; Pearson: Upper Saddle River, NJ, USA, 2019. [Google Scholar]
- Kryvobokov, M. What location attributes are the most important for market value? Extraction of attributes from regression models. Prop. Manag. 2007, 25, 257–286. [Google Scholar]
- Zahirovic-Herbert, V.; Chatterjee, S. Historic preservation and residential property values: Evidence from quantile regression. Urban Stud. 2012, 49, 369–382. [Google Scholar] [CrossRef]
- Dattalo, P. Analysis of Multiple Dependent Variables; Oxford University Press: Oxford, UK, 2013; ISBN 9780199773596. [Google Scholar] [CrossRef]
- Ciuna, M.; Milazzo, L.; Salvo, F. A mass appraisal model based on market segment parameters. Buildings 2017, 7, 34. [Google Scholar] [CrossRef]
Figure 1.
Geographical location of Palermo in southern Italy.

Figure 2.
Public housing on sale (a) and public housing sold (b) per district in Palermo (Italy) from January 2016 to May 2018.
Figure 2.
Public housing on sale (a) and public housing sold (b) per district in Palermo (Italy) from January 2016 to May 2018.

Figure 3.
Percentage of public housing sold per district from January 2016 to May 2018 in Palermo (Italy).
Figure 3.
Percentage of public housing sold per district from January 2016 to May 2018 in Palermo (Italy).

Figure 4.
The cadastral zones in Palermo.

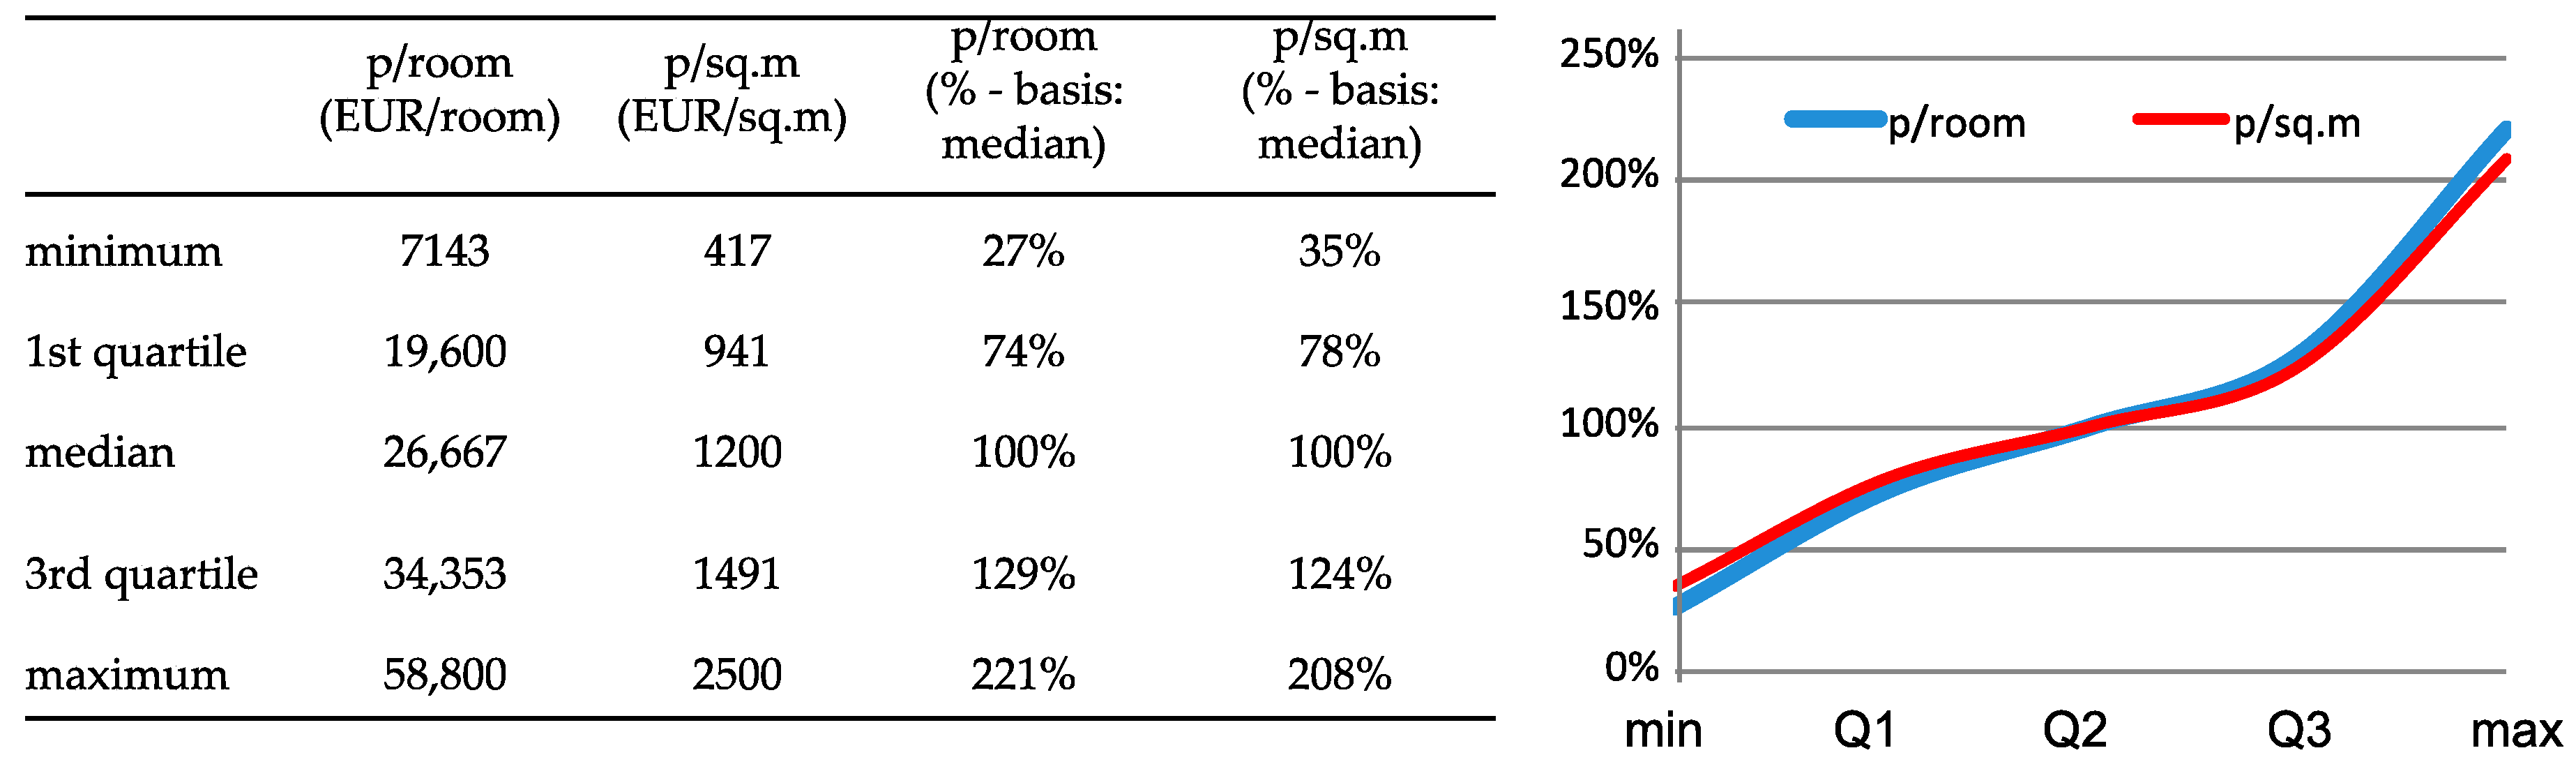
Figure 5.
Price ranges of the surveyed real estate sample in districts V and VI.

Figure 6.
Relation between unit prices (y axis) and aggregate value quality index (x axis k*) of the real estate market sample analysed.
Figure 6.
Relation between unit prices (y axis) and aggregate value quality index (x axis k*) of the real estate market sample analysed.

Figure 7.
Probability density function for unit prices, overall quality score, and the six characteristics.
Figure 7.
Probability density function for unit prices, overall quality score, and the six characteristics.

Figure 8.
Distribution of the standardized residue (a, left); normal P-P graph of standardized residual regression (b, right).
Figure 8.
Distribution of the standardized residue (a, left); normal P-P graph of standardized residual regression (b, right).

Figure 9.
Scatter graph.

Figure 10.
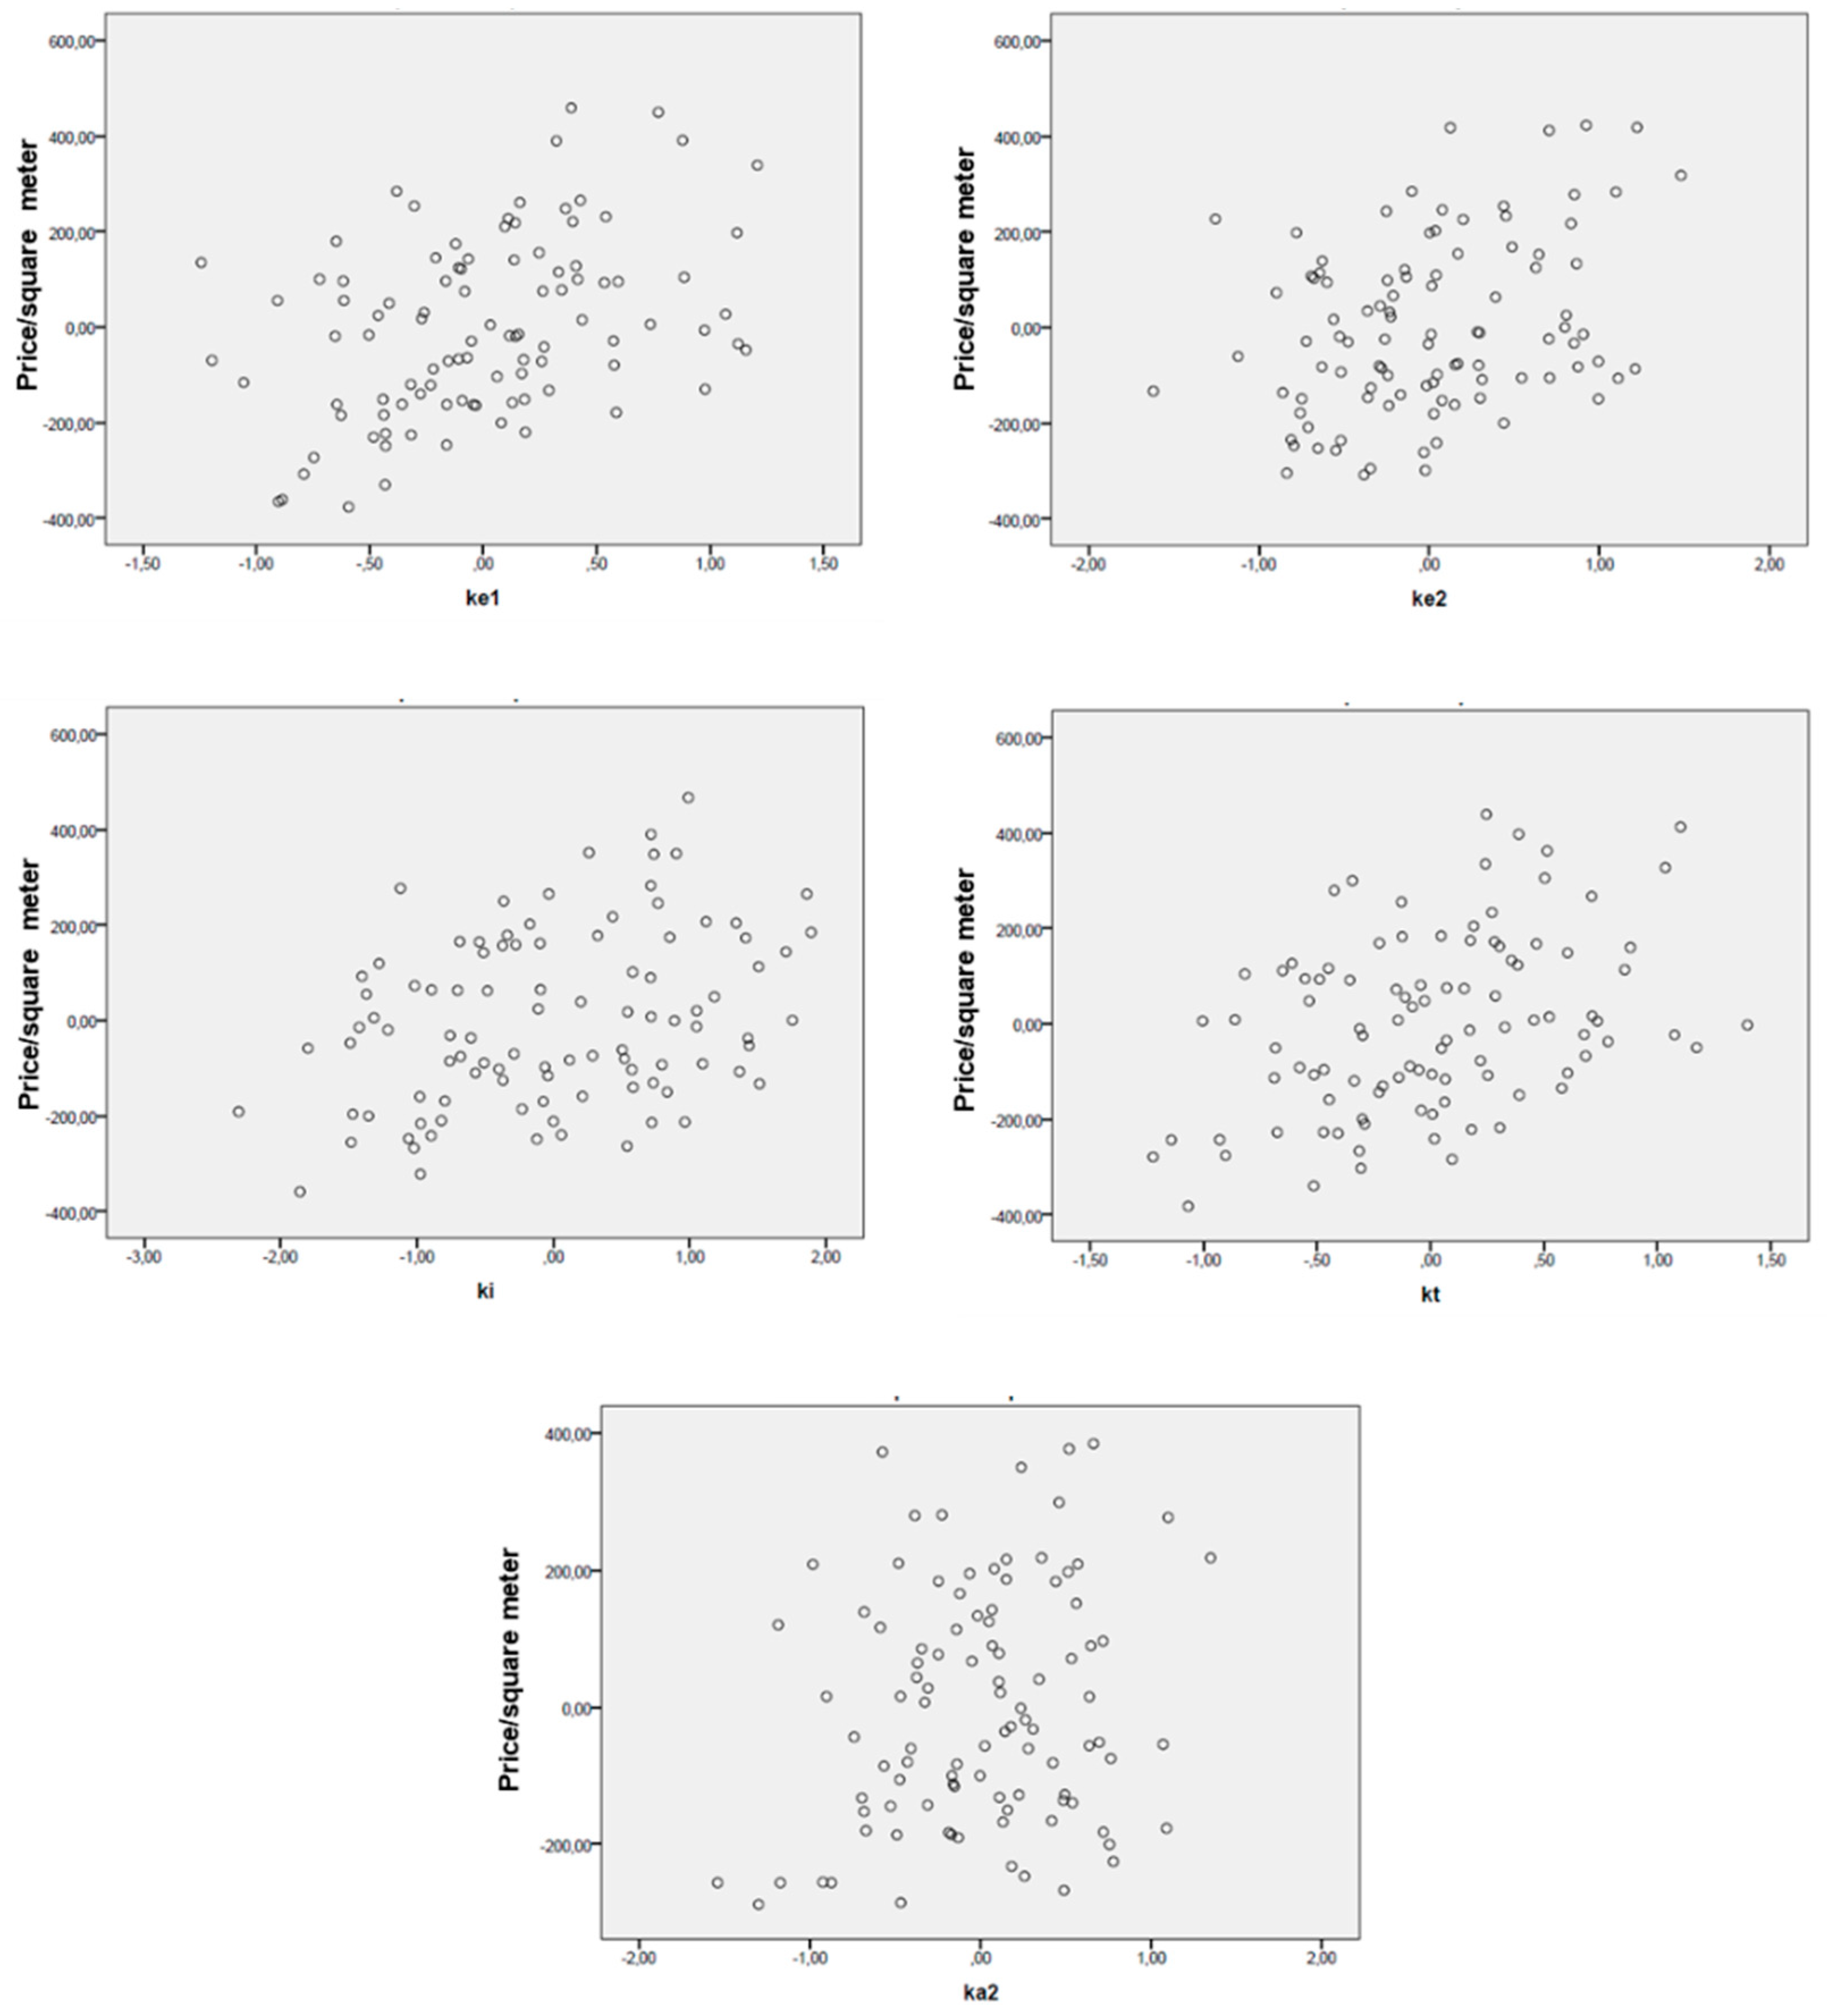
Partial regression graph - , , , .

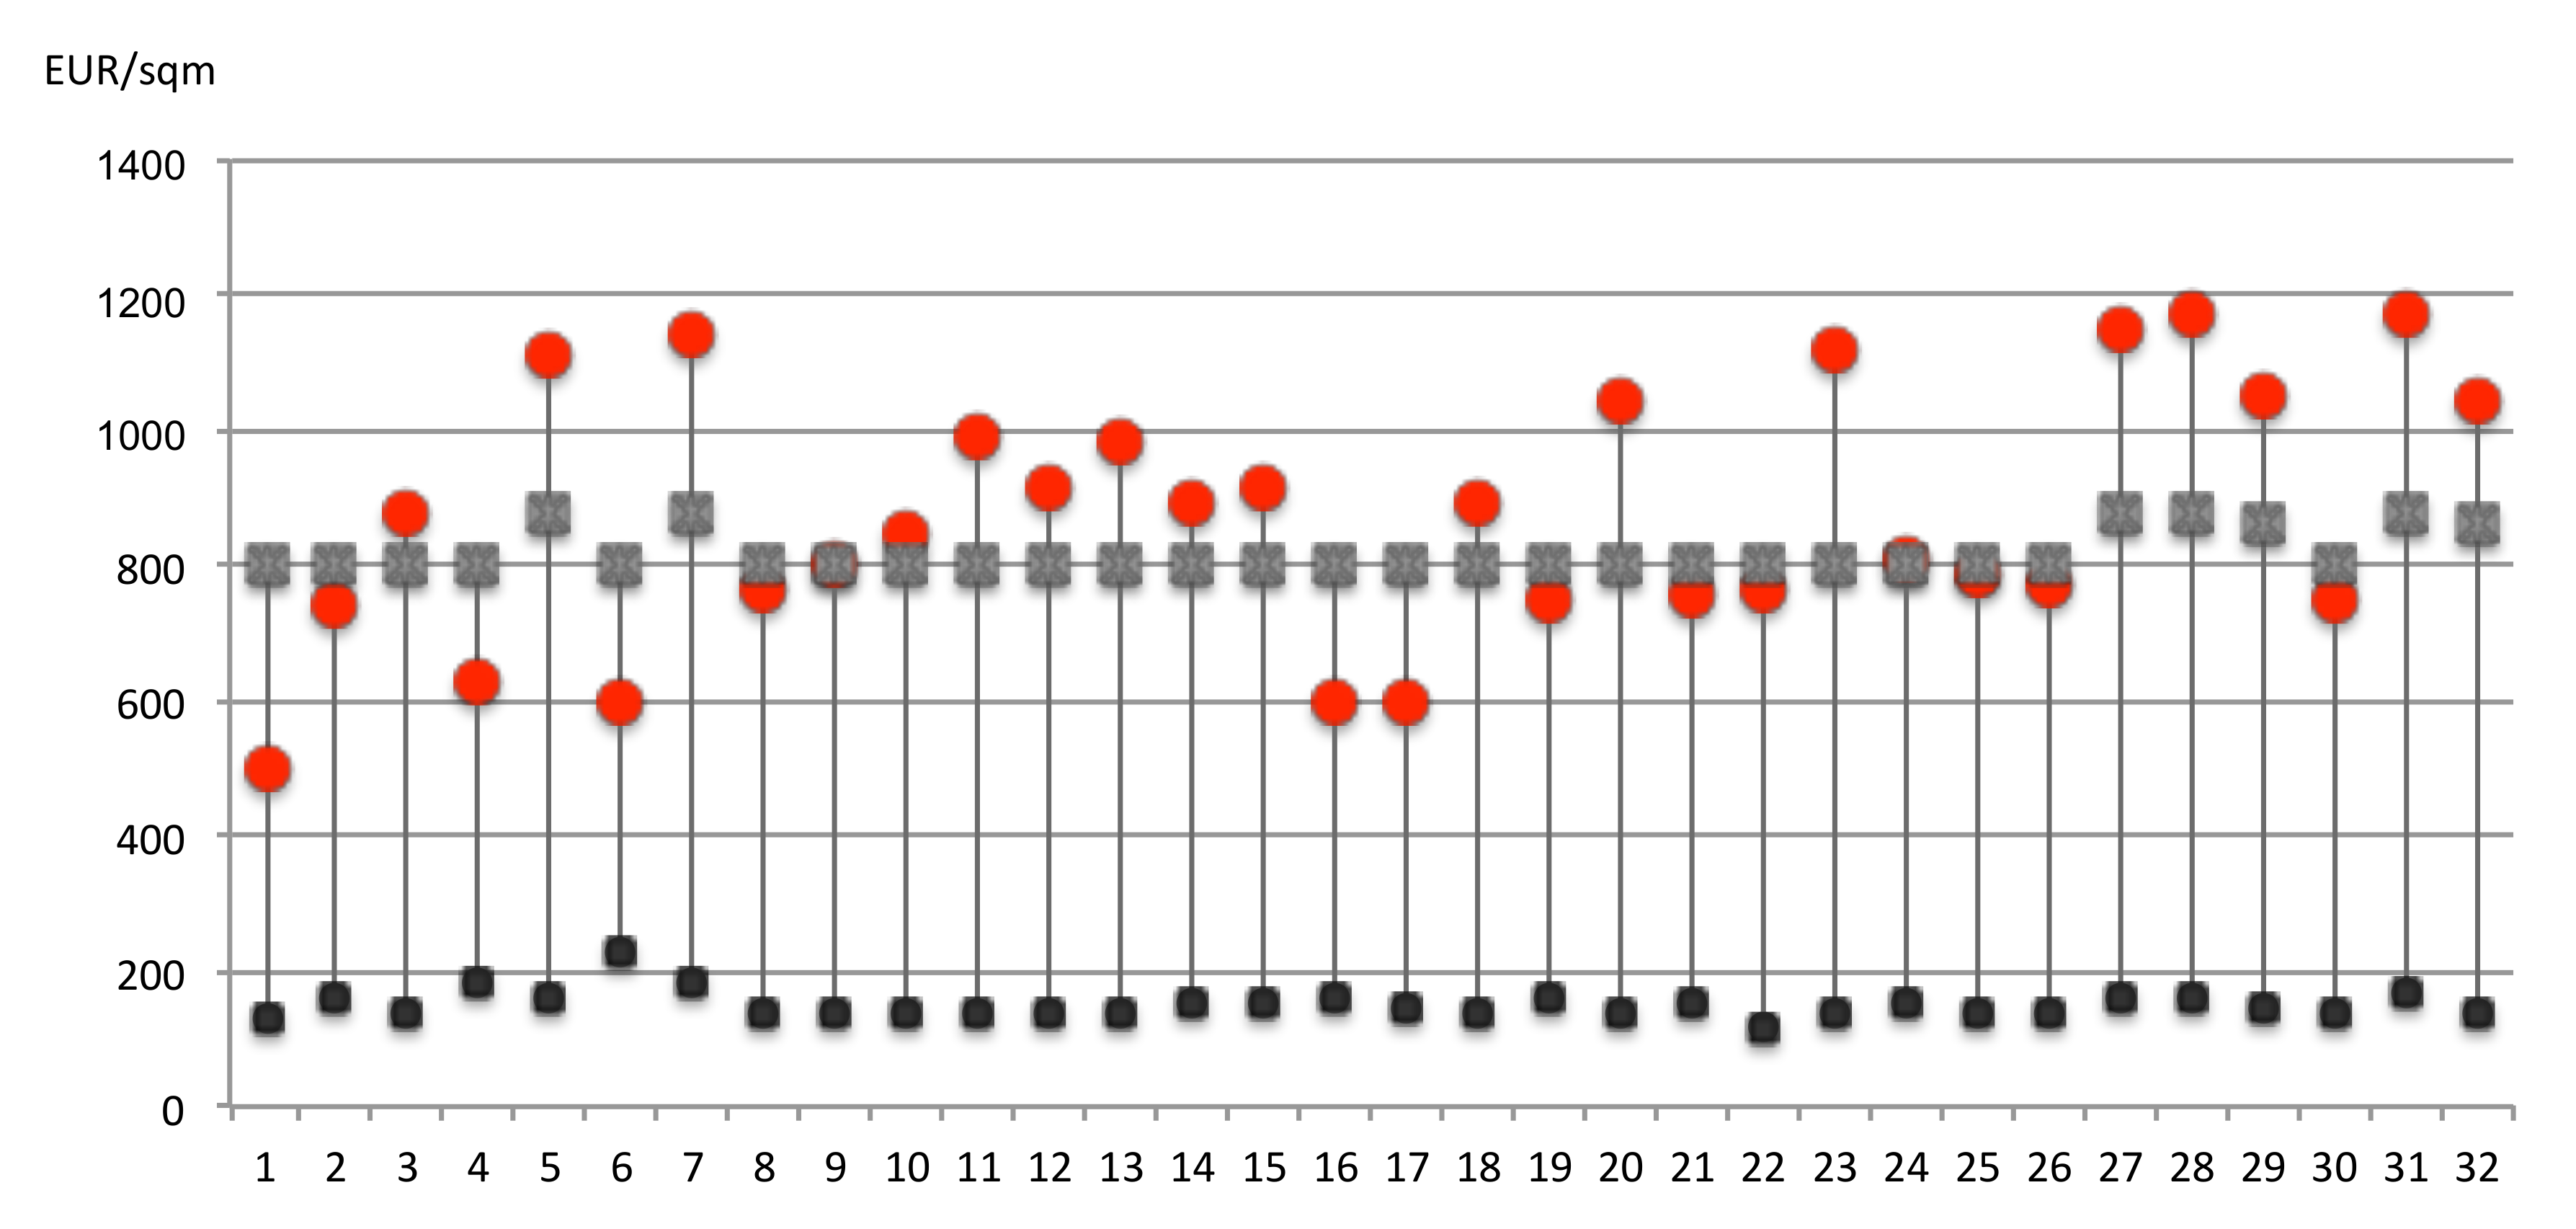
Figure 11.
Comparison between political prices (black square), estimated market prices (red circle), and OMI prices (grey square) of the 32 dwellings (unitary price euros/sqm).
Figure 11.
Comparison between political prices (black square), estimated market prices (red circle), and OMI prices (grey square) of the 32 dwellings (unitary price euros/sqm).


Table 1.
Public housing in Palermo (2017) [39].
Table 1.
Public housing in Palermo (2017) [39].
| Owner | Dwellings | Squatted Dwellings | |
|---|---|---|---|
| No. | No. | % | |
| Municipality of Palermo | 4827 | 2580 | 53.4% |
| Istituto Autonomo Case Popolari (IACP) | 19,208 | 2658 | 13.8% |
| Total | 24,035 | 5238 | 21.8% |
Table 2.
The eight districts of the Municipality of Palermo.
| Districts | Surface (sq.km) | Inhabitants | Population Density (inhab./sq.km) |
|---|---|---|---|
| I | 2.497 | 21,489 | 8606 |
| II | 21.39 | 72,888 | 3408 |
| III | 20.34 | 77,068 | 3789 |
| IV | 26.16 | 112,158 | 4287 |
| V | 17.53 | 120,885 | 6896 |
| VI | 23.90 | 78,548 | 3287 |
| VII | 32.95 | 74,330 | 2256 |
| VIII | 15.32 | 127,794 | 8342 |
Table 3.
The political prices of public housing per cadastral zone, category and class.
| Cadastral Data | Cadastral Income | Political Prices (by Law) | |||||
|---|---|---|---|---|---|---|---|
| Zone | Category | Class | EUR/room | EUR/sqm | EUR/sqm | Price 1 EUR/sqm | Price 2 EUR/sqm |
| 1° | A3 | 4 | 43.38 | 2.53 | 253 | 202 | 182 |
| 6 | 59.39 | 3.46 | 346 | 277 | 249 | ||
| A4 | 2 | 25.31 | 1.48 | 148 | 118 | 106 | |
| 4 | 35.12 | 2.05 | 205 | 164 | 147 | ||
| 2° | A2 | 5 | 54.23 | 3.16 | 316 | 253 | 228 |
| 6 | 64.56 | 3.76 | 376 | 301 | 271 | ||
| 7 | 77.47 | 4.52 | 452 | 361 | 325 | ||
| A3 | 4 | 41.32 | 2.41 | 241 | 193 | 173 | |
| 5 | 48.55 | 2.83 | 283 | 226 | 204 | ||
| 6 | 56.81 | 3.31 | 331 | 265 | 239 | ||
| 7 | 67.14 | 3.91 | 391 | 313 | 282 | ||
| A4 | 4 | 25.31 | 1.48 | 148 | 118 | 106 | |
| 5 | 29.44 | 1.72 | 172 | 137 | 124 | ||
| 6 | 34.60 | 2.02 | 202 | 161 | 145 | ||
| 7 | 40.80 | 2.38 | 238 | 190 | 171 | ||
| 3° | A2 | 3 | 74.89 | 4.37 | 437 | 349 | 314 |
| 4° | A2 | 7 | 64.56 | 3.76 | 376 | 301 | 271 |
| A3 | 8 | 67.14 | 3.91 | 391 | 313 | 282 | |
| A4 | 6 | 25.31 | 1.48 | 148 | 118 | 106 | |
| 7 | 29.44 | 1.72 | 172 | 137 | 124 | ||
| 8 | 34.60 | 2.02 | 202 | 161 | 145 | ||
| 5° | A2 | 3 | 44.41 | 2.59 | 259 | 207 | 186 |
| 4 | 51.65 | 3.01 | 301 | 241 | 217 | ||
| 5 | 61.98 | 3.61 | 361 | 289 | 260 | ||
| 6 | 72.30 | 4.22 | 422 | 337 | 304 | ||
| 7 | 85.20 | 4.97 | 497 | 398 | 358 | ||
| A3 | 8 | 51.65 | 3.01 | 301 | 241 | 217 | |
Table 4.
Characterization of the sample.
| Location, urbanization and accessibility | 1. Location | 1. Settlement quality; 2. Mix of functions |
| 2. Urban facilities | 1. Public facilities and services | |
| 3. Accessibility | 1. Mobility from/to the area with private transportation; 2. Mobility from/to the area with public transportation; 3. Mobility within the neighbourhood | |
| Neighbourhood characteristics | 1. Functional; 2. Symbolic characteristics | |
| Unit location within the building | 1. Panoramic quality and view; 2. Brightness; 3. Accessibility within the building | |
| Technological characteristics | 1. Building overall technological quality; 2. Unit finishes and windows quality; 3. Maintenance levels | |
| Building architectural quality | 1. Overall building decoration | |
| Unit architectural quality | 1. Size, functionality and distribution; 2. Additional surfaces; 3. Quality of finishes | |
Table 5.
Sample of the real estate survey in districts V and VI.
| Id. | Floor | Size | Asking Prices | Characterization | |||||||||
|---|---|---|---|---|---|---|---|---|---|---|---|---|---|
| Rooms | Surface (sq.m) | Total (EUR) | Unit (rooms) (EUR/rooms) | Unit (surf.) (EUR/sq.m) | ke1 | ke2 | ki | kt | ka1 | ka2 | k* | ||
| B01 | 5 | 5 | 110 | 165,000 | 33,000 | 1500 | 3.0 | 3.0 | 5.0 | 4.1 | 2.0 | 3.5 | 3.6 |
| B02 | 3 | 3.5 | 85 | 105,000 | 30,000 | 1235 | 3.1 | 2.0 | 1.2 | 3.5 | 3.5 | 2.6 | 2.7 |
| B03 | 2 | 4 | 98 | 145,000 | 36,250 | 1480 | 3.6 | 3.5 | 4.9 | 1.6 | 4.0 | 2.2 | 3.0 |
| B04 | 1 | 3.8 | 90 | 90,000 | 24,000 | 1000 | 2.3 | 1.5 | 3.8 | 2.0 | 1.5 | 3.0 | 2.3 |
| B05 | r | 2.3 | 37 | 45,000 | 20,000 | 1216 | 3.9 | 4.5 | 3.8 | 3.0 | 1.0 | 1.8 | 3.3 |
| B06 | r | 2.5 | 52.8 | 25,000 | 10,000 | 474 | 1.6 | 1.0 | 2.4 | 1.0 | 1.0 | 1.0 | 1.3 |
| B07 | r | 3.5 | 87.5 | 139,000 | 39,714 | 1589 | 4.0 | 2.5 | 3.1 | 2.7 | 1.5 | 3.2 | 2.9 |
| B08 | 7 | 3.8 | 110.0 | 107,000 | 28,533 | 973 | 2.4 | 2.0 | 4.6 | 2.8 | 2.5 | 2.6 | 2.8 |
| B09 | 1 | 4.8 | 120.0 | 215,000 | 45,263 | 1792 | 4.0 | 3.5 | 4.4 | 4.3 | 3.0 | 4.8 | 4.1 |
| B10 | 3 | 4.8 | 100.0 | 95,000 | 20,000 | 950 | 2.5 | 1.5 | 1.5 | 2.8 | 2.0 | 1.9 | 2.2 |
| B11 | r | 3.5 | 85.0 | 75,000 | 21,429 | 882 | 2.6 | 1.0 | 2.4 | 1.0 | 1.0 | 1.0 | 1.5 |
| B12 | 2 | 1.8 | 40.0 | 42,000 | 24,000 | 1050 | 1.6 | 1.0 | 1.7 | 2.8 | 2.0 | 1.7 | 2.0 |
| B13 | 1 | 2.5 | 34.0 | 25,000 | 10,000 | 735 | 3.1 | 3.5 | 3.1 | 1.2 | 2.0 | 1.0 | 2.3 |
| B14 | 3 | 5.3 | 115.0 | 220,000 | 41,905 | 1913 | 2.3 | 4.0 | 4.9 | 3.8 | 3.5 | 3.7 | 3.7 |
| B15 | 9 | 5.0 | 181.8 | 180,000 | 36,000 | 990 | 2.1 | 2.0 | 4.2 | 3.0 | 3.0 | 4.0 | 2.9 |
| B16 | 5 | 4.5 | 110.0 | 155,000 | 34,444 | 1409 | 3.5 | 2.5 | 4.4 | 3.8 | 3.0 | 3.3 | 3.5 |
| B17 | 6 | 6.0 | 150.0 | 190,000 | 31,667 | 1267 | 2.8 | 2.5 | 4.3 | 4.7 | 5.0 | 4.3 | 3.9 |
| B18 | 6 | 2.8 | 75.0 | 77,000 | 28,000 | 1027 | 1.9 | 1.5 | 4.0 | 2.4 | 1.5 | 1.8 | 2.3 |
| B19 | 1 | 3.8 | 120.0 | 170,000 | 45,333 | 1417 | 3.1 | 3.0 | 2.3 | 4.7 | 5.0 | 5.0 | 3.8 |
| B20 | 1 | 2.5 | 55.0 | 45,000 | 18,000 | 818 | 2.5 | 1.0 | 1.5 | 2.7 | 1.5 | 2.0 | 2.0 |
| B21 | 4 | 4.8 | 112.0 | 65,000 | 13,684 | 580 | 2.9 | 2.0 | 1.6 | 1.2 | 3.0 | 3.0 | 2.0 |
| B22 | 4 | 5.8 | 110.0 | 225,000 | 39,130 | 2045 | 3.5 | 4.0 | 4.7 | 3.8 | 3.5 | 5.0 | 4.0 |
| B23 | 6 | 2.5 | 50.0 | 65,000 | 26,000 | 1300 | 2.8 | 4.0 | 4.6 | 3.1 | 4.0 | 2.5 | 3.5 |
| B24 | 9 | 3.8 | 90.0 | 175,000 | 46,667 | 1944 | 3.5 | 3.5 | 4.6 | 3.9 | 3.0 | 3.5 | 3.8 |
| B25 | 2 | 5.0 | 100.0 | 68,000 | 13,600 | 680 | 2.8 | 1.0 | 1.0 | 1.2 | 1.0 | 1.3 | 1.4 |
Table 6.
Political, estimated and Observatory of the Real Estate Market (OMI) prices of the 32 dwellings (Districts V and VI).
Table 6.
Political, estimated and Observatory of the Real Estate Market (OMI) prices of the 32 dwellings (Districts V and VI).
| Location | Political Price (P) | Characterization | Estimated Market Price (E) | OMI Zone | OMI Price (O) | Ratio (P/E) *100 | Ratio (P/O) *100 | ||||||
|---|---|---|---|---|---|---|---|---|---|---|---|---|---|
| id | District | Street/Square | EUR/sq.m | ke1 | ke2 | ki | kt | ka2 | EUR/sq.m | id | EUR/sq.m | % | % |
| 1 | V | Petralie (IACP-L. 745) | 133 | 1.0 | 1.0 | 1.5 | 1.5 | 2.0 | 502 | E19 | 800 | 26 | 17 |
| 2 | V | Erice (IACP-L. 745) | 163 | 1.0 | 1.5 | 3.5 | 2.0 | 2.0 | 738 | E19 | 800 | 22 | 20 |
| 3 | VI | Carreca | 139 | 1.0 | 2.0 | 4.0 | 2.0 | 3.0 | 875 | E19 | 800 | 16 | 17 |
| 4 | V | Erice (IACP-L. 745) | 182 | 1.0 | 1.5 | 2.0 | 2.0 | 2.0 | 625 | E19 | 800 | 29 | 23 |
| 5 | VI | Florio | 163 | 4.0 | 2.0 | 3.5 | 2.5 | 2.0 | 1113 | E15 | 880 | 15 | 19 |
| 6 | V | Erice (IACP-L. 745) | 229 | 1.0 | 1.5 | 1.5 | 2.0 | 2.0 | 601 | E19 | 800 | 38 | 29 |
| 7 | V | Brancato | 180 | 4.0 | 2.0 | 2.0 | 3.0 | 3.0 | 1140 | B3 | 880 | 16 | 20 |
| 8 | VI | Calandrucci | 139 | 2.5 | 1.5 | 1.5 | 2.0 | 2.0 | 763 | E19 | 800 | 18 | 17 |
| 9 | VI | Centorbe | 139 | 2.5 | 2.0 | 1.5 | 2.0 | 2.0 | 800 | E19 | 800 | 17 | 17 |
| 10 | VI | Centorbe | 139 | 2.5 | 2.0 | 2.5 | 2.0 | 2.0 | 849 | E19 | 800 | 16 | 17 |
| 11 | VI | Paladini | 139 | 3.0 | 2.5 | 3.0 | 2.0 | 2.5 | 989 | E19 | 800 | 14 | 17 |
| 12 | VI | Ragusa | 139 | 2.5 | 2.5 | 1.5 | 2.5 | 2.5 | 911 | E19 | 800 | 15 | 17 |
| 13 | VI | Ragusa | 139 | 2.5 | 2.5 | 3.0 | 2.5 | 2.5 | 984 | E19 | 800 | 14 | 17 |
| 14 | VI | Rossi | 155 | 2.5 | 2.5 | 1.5 | 2.5 | 2.0 | 891 | E19 | 800 | 17 | 19 |
| 15 | VI | Rossi | 155 | 2.5 | 2.5 | 2.0 | 2.5 | 2.0 | 916 | E19 | 800 | 17 | 19 |
| 16 | V | Nicosia (IACP-L. 745) | 161 | 1.0 | 1.5 | 1.5 | 2.0 | 2.0 | 601 | E19 | 800 | 27 | 20 |
| 17 | V | Nicosia (IACP-L. 745) | 149 | 1.0 | 1.5 | 1.5 | 2.0 | 2.0 | 601 | E19 | 800 | 25 | 19 |
| 18 | VI | Paladini | 139 | 3.0 | 2.5 | 1.0 | 2.0 | 2.5 | 892 | E19 | 800 | 16 | 17 |
| 19 | VI | Scaglione | 164 | 1.5 | 2.5 | 3.5 | 1.5 | 1.5 | 752 | E19 | 800 | 22 | 20 |
| 20 | VI | Michelangelo | 139 | 3.0 | 2.5 | 3.5 | 2.5 | 2.0 | 1043 | E19 | 800 | 13 | 17 |
| 21 | VI | Alibrandi | 150 | 3.3 | 1.0 | 2.0 | 1.5 | 1.5 | 754 | E19 | 800 | 20 | 19 |
| 22 | VI | Calandrucci | 118 | 2.5 | 1.5 | 1.5 | 2.0 | 2.0 | 763 | E19 | 800 | 15 | 15 |
| 23 | VI | Michelangelo | 139 | 3.0 | 2.5 | 3.5 | 3.0 | 2.5 | 1119 | E19 | 800 | 12 | 17 |
| 24 | VI | Paladini | 150 | 2.5 | 1.5 | 2.5 | 2.0 | 2.0 | 811 | E19 | 800 | 18 | 19 |
| 25 | VI | Paladini | 139 | 2.5 | 1.5 | 2.0 | 2.0 | 2.0 | 787 | E19 | 800 | 18 | 17 |
| 26 | VI | Zumbo | 139 | 2.5 | 2.0 | 1.5 | 1.5 | 2.5 | 771 | E19 | 800 | 18 | 17 |
| 27 | V | Agostino | 158 | 3.5 | 2.5 | 2.5 | 3.0 | 3.0 | 1148 | C5 | 880 | 14 | 18 |
| 28 | V | L’Emiro | 163 | 3.5 | 2.5 | 3.0 | 3.0 | 3.0 | 1172 | C5 | 880 | 14 | 19 |
| 29 | V | Casalini | 145 | 2.0 | 4.0 | 1.5 | 3.0 | 3.0 | 1051 | E20 | 860 | 14 | 17 |
| 30 | VI | Zumbo | 139 | 2.5 | 2.0 | 1.0 | 1.5 | 2.5 | 747 | E19 | 800 | 19 | 17 |
| 31 | V | Agostino | 169 | 3.5 | 2.5 | 3.0 | 3.0 | 3.0 | 1172 | C5 | 880 | 14 | 19 |
| 32 | VI | Paladini | 139 | 3.0 | 2.5 | 3.5 | 2.5 | 2.0 | 1043 | E20 | 860 | 13 | 16 |
Table 7.
Prices, ratios, and differentials of the 32 dwellings (Districts V and VI).
| Statistical | Prices | Ratio | Differentials | ||||
|---|---|---|---|---|---|---|---|
| Index | Political (P) | OMI (O) | Estimated (E) | P/E | P/O | E–P | O–P |
| EUR/sq.m | EUR/sq.m | EUR/sq.m | No. | No. | EUR/sq.m | EUR/sq.m | |
| Min | 118 | 800 | 502 | 0.12 | 0.15 | 370 | 571 |
| Average | 151 | 816 | 873 | 0.18 | 0.19 | 722 | 665 |
| Median | 142 | 800 | 862 | 0.16 | 0.17 | 723 | 661 |
| Max | 229 | 880 | 1172 | 0.38 | 0.29 | 1009 | 722 |
| SD | 20 | 31 | 188 | 0.06 | 0.02 | 191 | 33 |
| RSD% | 13% | 4% | 22% | 31% | 13% | 26% | 5% |
Table 8.
Total differentials of the 32 dwellings (Districts V and VI).
| Differentials between Prices | ||
|---|---|---|
| Estimated–Political E–P EUR | OMI–Political O–P EUR | |
| Total | 2,661,757 | 2,400,460 |
© 2019 by the authors. Licensee MDPI, Basel, Switzerland. This article is an open access article distributed under the terms and conditions of the Creative Commons Attribution (CC BY) license (http://creativecommons.org/licenses/by/4.0/).
Share and Cite
MDPI and ACS Style
Napoli, G.; Giuffrida, S.; Trovato, M.R. Efficiency versus Fairness in the Management of Public Housing Assets in Palermo (Italy). Sustainability 2019, 11, 1199. https://doi.org/10.3390/su11041199
AMA Style
Napoli G, Giuffrida S, Trovato MR. Efficiency versus Fairness in the Management of Public Housing Assets in Palermo (Italy). Sustainability. 2019; 11(4):1199. https://doi.org/10.3390/su11041199
Chicago/Turabian StyleNapoli, Grazia, Salvatore Giuffrida, and Maria Rosa Trovato. 2019. "Efficiency versus Fairness in the Management of Public Housing Assets in Palermo (Italy)" Sustainability 11, no. 4: 1199. https://doi.org/10.3390/su11041199
Note that from the first issue of 2016, this journal uses article numbers instead of page numbers. See further details here.