Environment Control with Low-Cost Microcontrollers and Microprocessors: Application for Green Walls


Agronomy Department, University of Cordoba, 14014 Cordoba, Spain
*
Author to whom correspondence should be addressed.
Sustainability 2019, 11(3), 782; https://doi.org/10.3390/su11030782
Submission received: 17 December 2018
/
Revised: 26 January 2019
/
Accepted: 30 January 2019
/
Published: 2 February 2019
(This article belongs to the Special Issue Application of Low-cost Sensors for Environmental Exposure Assessment and Mitigation)
Abstract
:Green wall irrigation procedures are a particularly important and hard task, given that the quality of the green wall depends on them. There is currently a wide variety of irrigation programmers available, with a range of functions and prices, thereby replacing manual activities and making it easier to maintain green walls. This paper proposes the use of low-cost automated irrigation programmers via a freeware called Arduino. The system is based on air and substrate measurements to ensure optimal plant growth and high water-use efficiency. At certain thresholds, the irrigation system is activated. This not only makes irrigation more convenient but also helps to reduce energy consumption, increases irrigation efficiency and saves time. The data is then sent via Transmission Control Protocol using Internet of Things technology, in this case ThingSpeak. The platform compiles the data and presents them in simple graphical format, thus enabling real-time monitoring from wherever there is Internet access. Together with Arduino, the project incorporates the Raspberry pi system that operates like a database via Hypertext Transfer Protocol Wi-Fi received by a Structured Query Language (MySQL) server using Hypertext Preprocessor. These data are used for the subsequent analysis of green wall performance.
1. Introduction
The current debate concerning climate change has encouraged the use of plants to help mitigate some of the problems associated with a lack of green areas in cities, such as rising temperatures [1]. This lack of green spaces has led to a reduction in evapotranspiration and the normal infiltration of water into the soil, creating a heat island effect in large cities. Green walls have proven to be of benefit by improving storm water management through water retention and evapotranspiration. There are, however, other potential advantages such as cleaner air, positive psychological effects, and aesthetic improvements. Green walls (also referred to as green façades or vertical gardens) provide a way of increasing green spaces in urban areas.
With the progress made in technology, the systems that we use daily have become ever-more automated, and green wall irrigation systems are no exception, given that this is a relatively recent technology that is still under development. There are various irrigation systems on the market that have already been tested and implemented [2]. Common drawbacks of these systems are that they tend to be expensive and often require the user to control the water pump in situ [3].
The need to improve the irrigation efficiency of green walls has resulted in the use of precision irrigation techniques. Precision irrigation scheduling is based on determining the irrigation needs of the green wall in real time and specifying a location. These measurements are recorded and used to activate the irrigation system when a threshold in the substrate water content is reached. Optimizing the number of sensors and distances between them is essential for obtaining representative estimations of the amount of available water in the substrate at wall level.
Monitoring the changes in substrate water content in green walls at different depths provides key information about the plants’ water uptake rates and strategies. Variability between plants and heterogeneity of the substrate results in spatial variability of soil water content. Therefore, strategies to increase water efficiency require water content information with a high resolution in space as well as time [4].
The most commonly used equipment to monitor water in the substrate are soil water content sensors. These sensors, which are buried at different depths and in multiple locations, provide useful data about water content in the green wall. Monitoring substrate water content, together with the data from other sensors, plays an important role in applications focused on the effective use of water in green walls. The number of sensors and the distance between them are key to ensuring representative estimations of the availability of water in the green wall substrate [5].
There are currently high quality industrial devices available on the market; however, they are costly and complex, which has limited their adoption in green-wall technology. In response, alternative low-cost instruments have gradually been developed [6].
In any field experiment, regardless of its particular objective (in our case, green walls), air temperature and humidity are the environmental parameters that are measured frequently as they indicate conditions affecting plant phenology and growth. The need to take spatially distributed meteorological measurements, especially in complex sites such as green walls, has given rise to the development of low-cost sensors, which are increasingly used to achieve high spatial coverage [7].
Recent breakthroughs in open-source hardware components open the door to new ways of developing smart irrigation systems that can connect to transmission devices via the Internet, thus providing high space-time data coverage of substrate water and of other multiple sensors installed in the green walls [8].
There is growing need for multiplier devices, together with the applicable technologies for storing, recovering, and remotely transmitting large volumes of data [9]. The wireless transmission technologies reviewed [10] include Zigbee and Bluetooth communication protocols and modem-based connections such as GPRS and GSM, often together with Internet applications [11].
The cost of data loggers and sensors limits the number of sensors and the frequency of measurements. Recent breakthroughs in the field of open hardware components provide fresh opportunities to develop measuring stations that can connect to wireless transmission devices to achieve high space-time data coverage with multiple sensors. The philosophy behind open-source hardware, like open-source software, is to provide free and transparent access to the design of hardware, projects, and code so that users can easily share, customize, and update their systems [12].
A UNO microcontroller is used and is programmed to detect the soil moisture levels or the presence of rain, and switch on the electro valve relay when the soil moisture content is below or surpasses the pre-set humidity threshold based on plant requirements or switch it off in other cases or when it is raining [3].
A microcontroller is an electronic device within a pod containing numerous components, such as resistors, condensers, etc., interconnected in such a way that it can autonomously execute a series of instructions specified beforehand by a programmer. The microcontroller is the primary component of the processing and control circuit [13].
Arduino microcontroller, which is a physical open-source IT platform for developing interactive autonomous objects or objects which connect to the computer, can be used. With Arduino both hardware and software are open source [14]. A Raspberry Pi processor was also used, which stored the data from the three-month experimental period for the subsequent analysis of the development of the green wall. The project provides guidelines for reproducing and updating a low-cost, customizable smart irrigation system for green walls. It depends on open-source ideology, through which information can be shared about the design of equipment and software, thus facilitating the adoption and ongoing improvement of technologies currently available on the market [15].
With the Arduino UNO chip, all the electronic components and software to program the microcontroller are available for free. The user-friendliness and simple programming are in keeping with the affordable prices of the electronic components, thus forming part of the so-called democratized technological practice [16].
The automation system will analyze the sensors and communicate the information collected via the Internet, where it can be easily browsed in real time in a graphic format through the ThingSpeak.com.
An essential aspect of this project is the web server; in this case, one of the most popular Internet infrastructure systems, LAMP, is used. The name is taken from the acronym for Linux, Apache, MySQL, PHP. It will operate on the Raspberry Pi [17].
The platform is equipped with low-cost dielectric sensors currently available on the market, which further reduces the cost of data acquisition. Measurements taken from a number of sites are therefore more affordable, enabling an increase in time-space data density required for applications aiming to save water in green walls. Therefore, the decision was made to use the Internet of Things (IoT) technology on green walls and their irrigation systems and thus to be able to view the data in real time. The aim is to ensure that the green wall is connected to the Internet and is accessible from anywhere and by anyone who so wishes. The application of the Internet of Things in precision irrigation can save money and maximize the performance of green walls.
The main objective of this work is to create an automated irrigation system that is remotely supervised and controlled from any mobile phone, computer, or tablet with internet connection using low cost materials that are easy to program, install, and acquire as Arduino UNO and Raspberry Pi systems, which are responsible for automating irrigation and collecting environmental data for green wall prototypes. Our hypothesis was to be able to implement low-cost sensor technology to green wall systems.
2. Materials and Methods
2.1. Green Wall Prototype Structure
The green wall prototype consists of 8 open-backed boxes made using aluminum sheeting with electro-welded mesh, and with a rear bracket for fixing them to an existing structure. The prototypes boxes are 1 m2 by 10 cm deep. They have been completely filled with two different types of substrates, four with sphagnum moss and four with coconut coir and rice husk, south-facing green walls similar to commercially available products. The green wall prototype was anchored in place next to the wall of a building with a 5-cm separation to allow for air to freely circulate behind. They are located on the Rabanales Campus at the University of Cordoba, Spain (37°54′51.3″ N 4°43′28.5″ W).
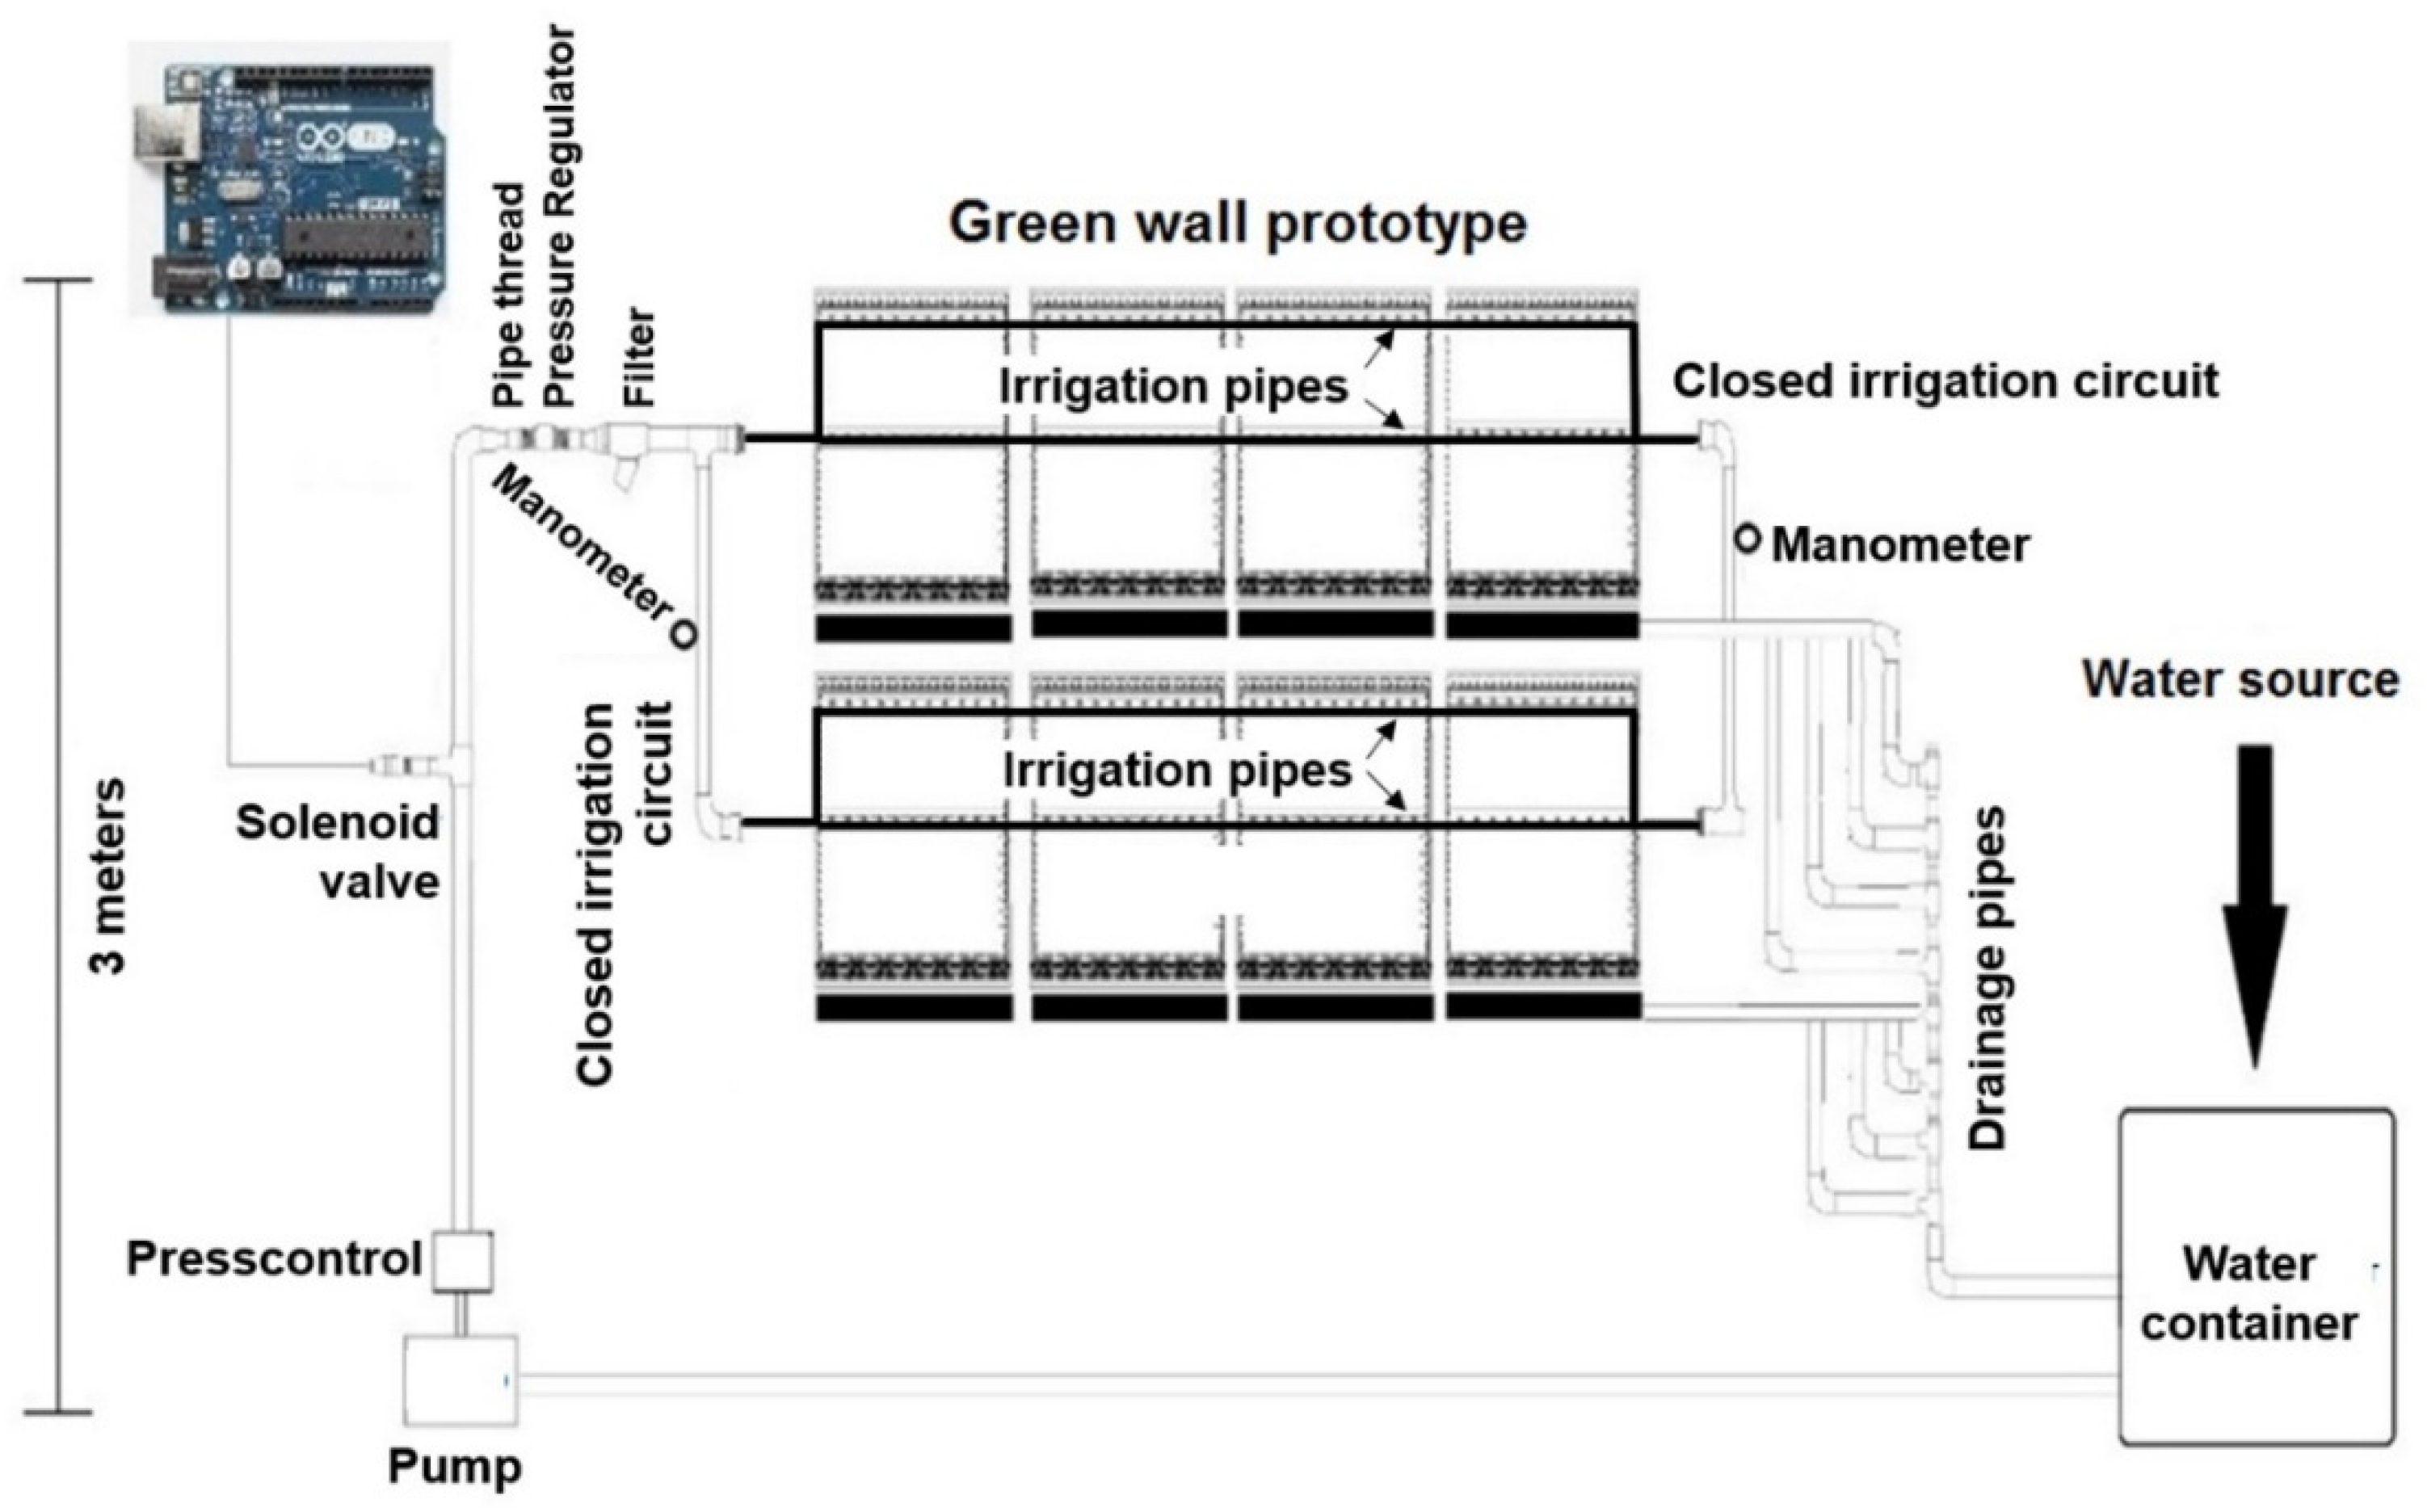
The green wall prototype uses a drip irrigation system. The irrigation pipes are in the upper and middle areas of each module, with 4l/h adjustable drippers every 20 cm along the pipe. The pipes in each of the rows will irrigate from the top down to ensure that all the plants receive sufficient moisture. The pipes are connected to an irrigation pump controlled by a relay, which will enable it to supply water to each of the green wall prototypes positioned at the highest point above ground level, as can be seen in Figure 1. Two different species of plant material were selected based on the similar water requirements, Lampranthus spectabilis and Aptenia cordifolia [18], taking into account the exposure to sunlight in the place where the green wall prototype was set up and the ease of acquiring these plants locally.
2.2. Environmental Control System
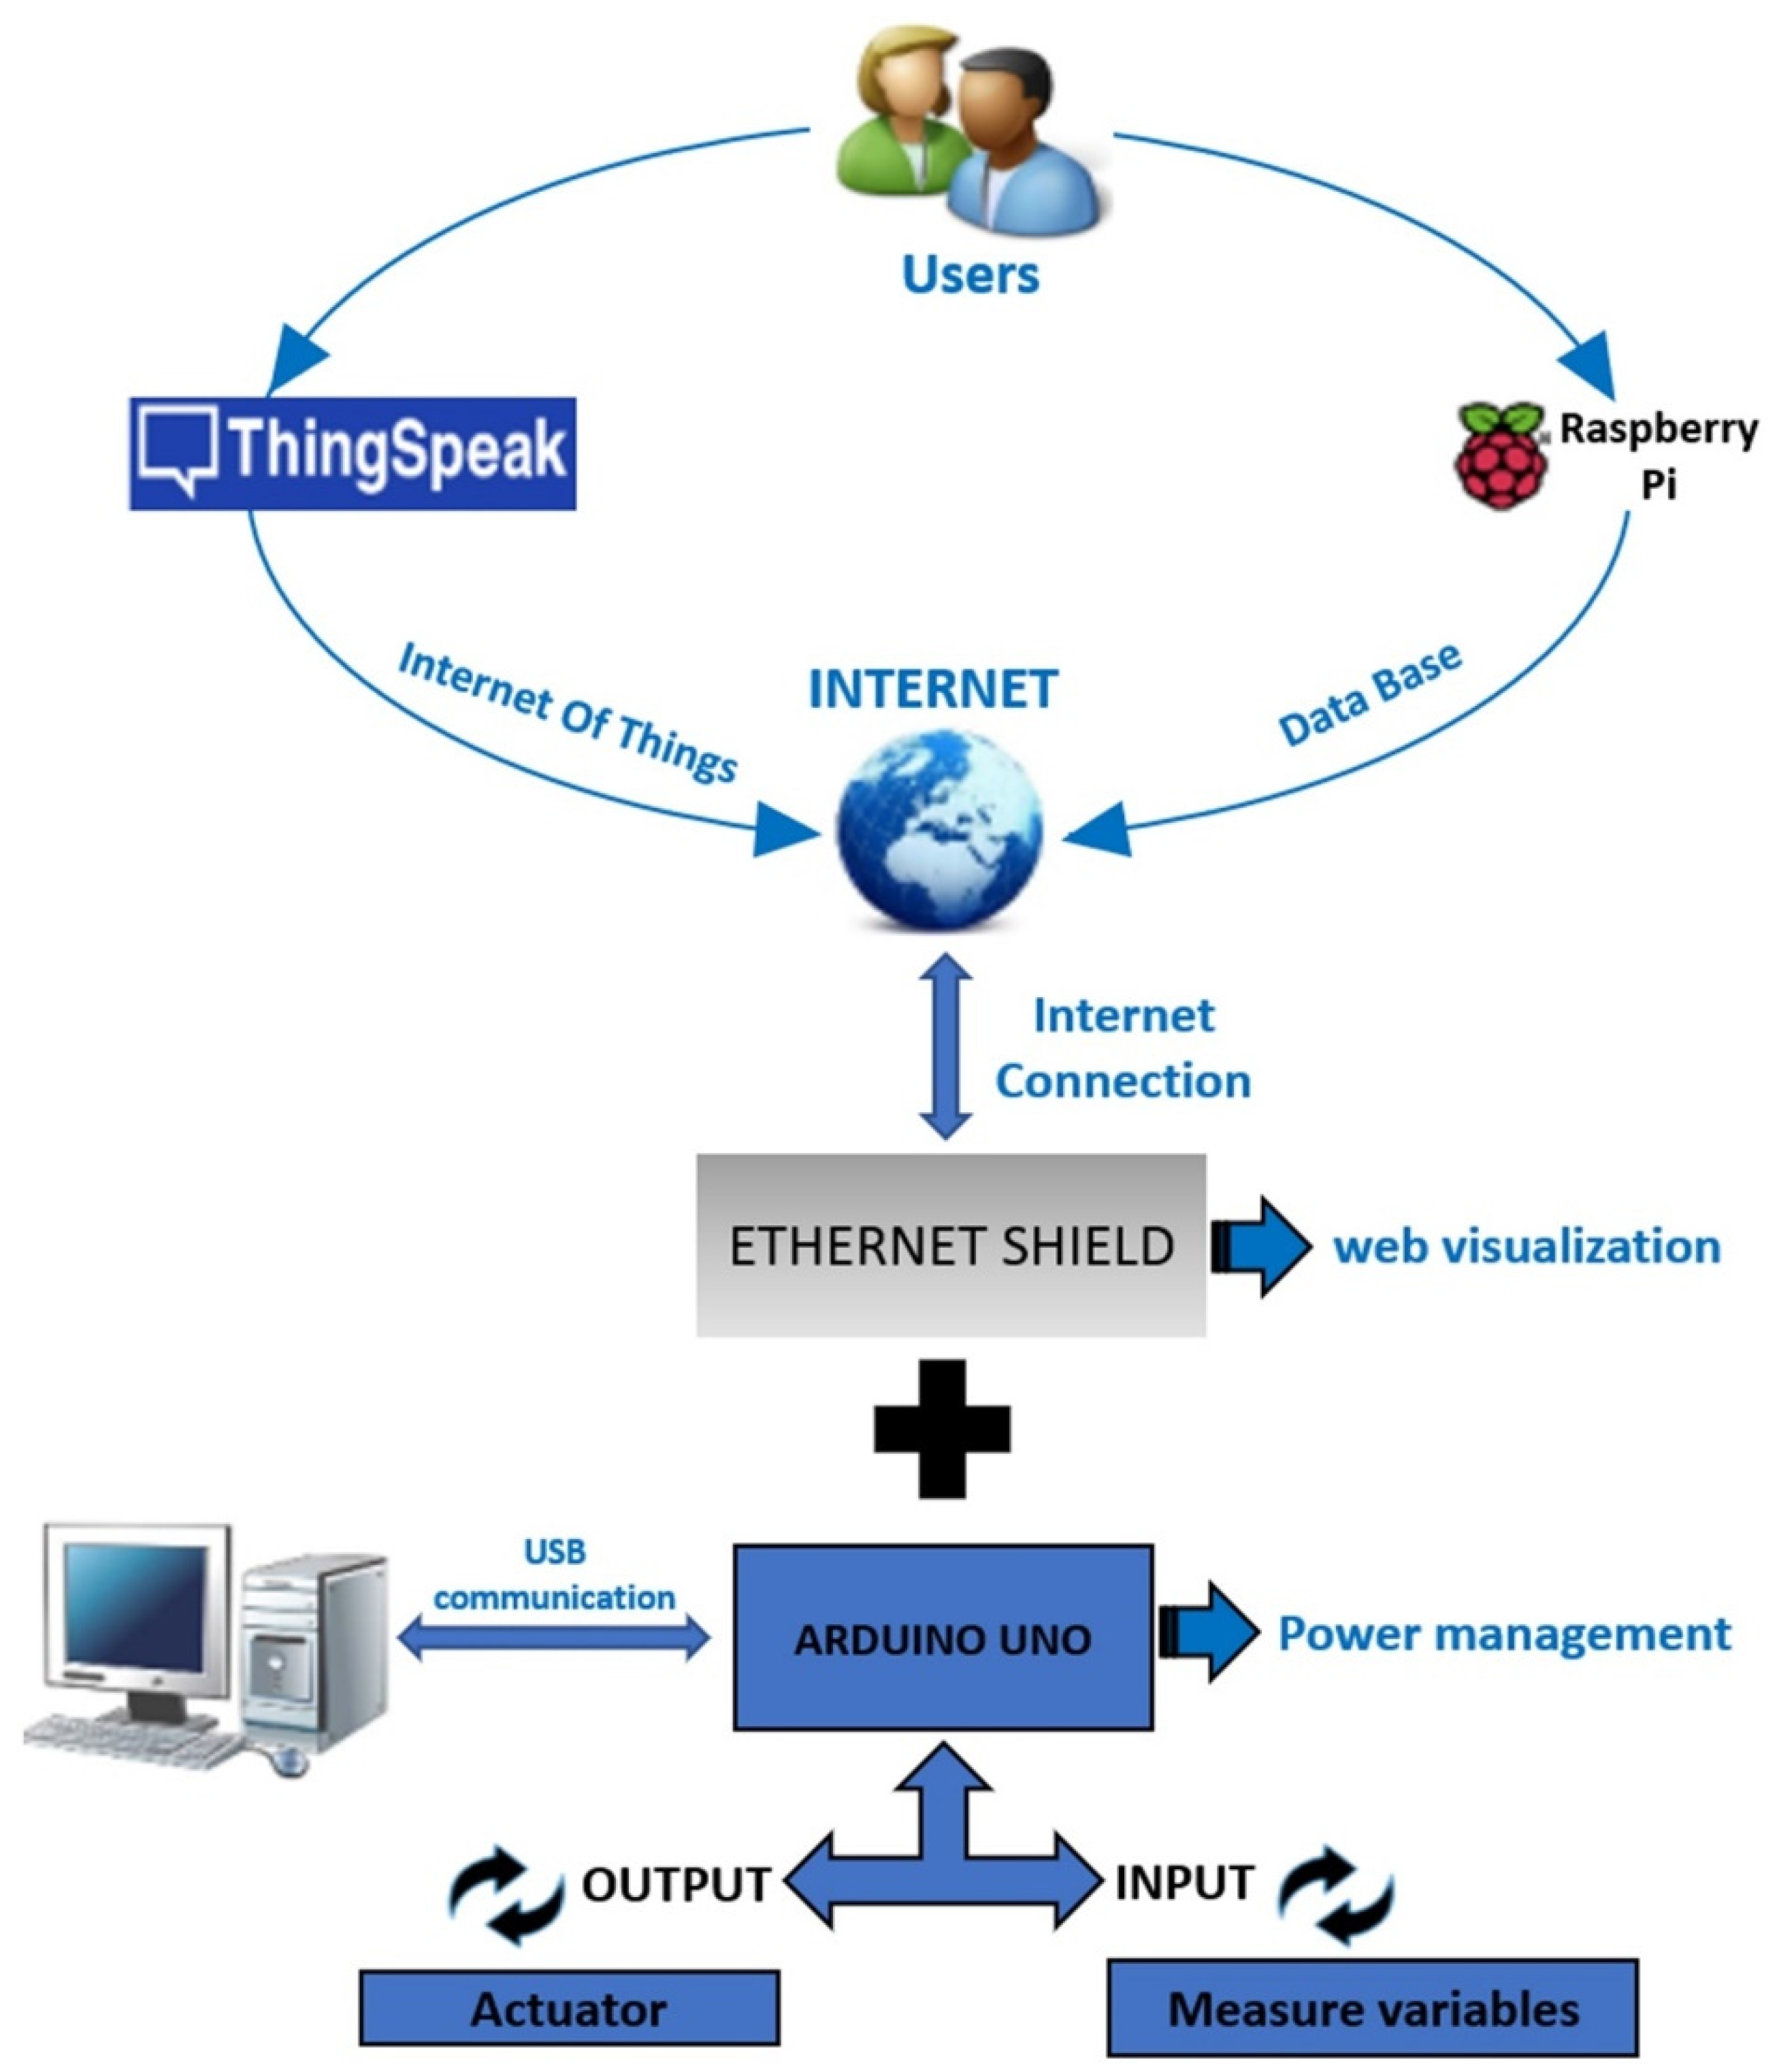
As can be seen in Figure 2, the environmental control system of the variables that control irrigation are the following:
Arduino UNO is made by Arduino® (https://www.arduino.cc/) and is a small microcontroller based on the ATmega328 microchip and a development environment for writing of the software onto the board. Arduino can be used to interact with objects and/or a wide variety of switches and sensors to control motors and other physical outputs. The experiments carried out using Arduino can be independent or communicate with software that is executed via a computer. The boards can be hand mounted or purchased ready for use [19].
Open-source Integrated Development Environment (IDE) is the term given to a set of software tools that enables programmers to easily and conveniently develop their own programs as it can be executed from Windows, Mac OS X, and Linux [20] and downloaded free of charge. The program comes with a specific set of instructions, all suitably ordered and grouped together to achieve a particular outcome.
The boards are programmable, which means users can permanently write to memory until a new program is recorded, namely the program that we want the microcontroller to execute. It runs in a Java environment and is based on the avr-gcc process, which is also open source.
The Ethernet Shield board is an extension Shield for the Arduino and is used to create web displays of the automating as it can connect to a cabled TCP/IP network. Just plugging the module onto the Arduino UNO Board. This is achieved thanks to a W5100 chip incorporated into Shield. The code of our program was configured using a program library called Ethernet, that by default is part of the official Arduino language [13].
ThingSpeak was the website used for the Internet of Things for the simplicity of its programming and its popularity with API (Application Programming Interface) and applications for the sending and storage of data from the sensors using HTTP via the Internet or via a LAN. ThingSpeak was used to build applications to record the data from the sensors during the experiment. The ThingSpeak channel used 179863, allows up to eight fields such as relative humidity, temperature, soil moisture, flow of water, and location of the experiment. The MATLAB App was also incorporated for numerical computation to allow users to analyze and display the data with greater ease [21].
Raspberry Pi model B made for raspberry foundation is a microprocessor manufacture in the UK, equipped with a Broadcom BCM2835 chip with an ARM processor up to 1 GHz, GPU VideoCore IV and 512 MB RAM. The project used Raspbian, a Linux delivery system based on Debian. The model chosen was the Raspberry Pi B+ with HDMI and RCA video output ports, mini audio jack, as well as a USB 2.0 port to which we connect a mini Wi-Fi antenna for the reception of data sent from Arduino. To store data in the Raspberry Pi, an 16GB class 10 SD card was used [19].
The Raspberry Pi is located at the university facilities, given that it uses the same Wi-Fi network as Arduino, and is not required to be located next to the green wall and exposed to the outside elements. Users can access the database from any terminal via an IP address provided by the University server.
The data collection system of the green wall prototype was programmed with LAMP, an acronym that stands for “Linux, Apache, MySQL, and PHP,” which is a common server configuration for many web applications (See Figure 2). LAMP is an open-source web development platform with Linux as its operating system, Apache as the web server, MySQL as the RDBMS, and PHP as the object-oriented script language [22].
Apache is a web server application that can be installed on the Raspberry Pi so that it can serve web pages. On its own, Apache can serve HTML files via HTTP and, with additional modules, can serve dynamic web pages using programming languages such as PHP [22].
PHP is the code that is executed when the server receives a web page request. Upon execution, PHP determines what needs to be shown on the page, and then sends the page to the browser. Contrary to static HTML, PHP can show different contents under different conditions [23]. Two PHP files were created: config.php and iot.php. The config.php file contains the information required to make a connection with the database. The iot.php file oversees uploading the data received from the sensors database. Data is are sent via a GET request.
MySQL is an open-source relational database management system (RDBMS) based on Structured Query Language (SQL). MySQL works on multiple platforms, including Linux, UNIX, and Windows. Although it can be used in a wide range of applications, MySQL is more associated with web-based applications and on-line publishing [16].
2.3. Environmental Sensors
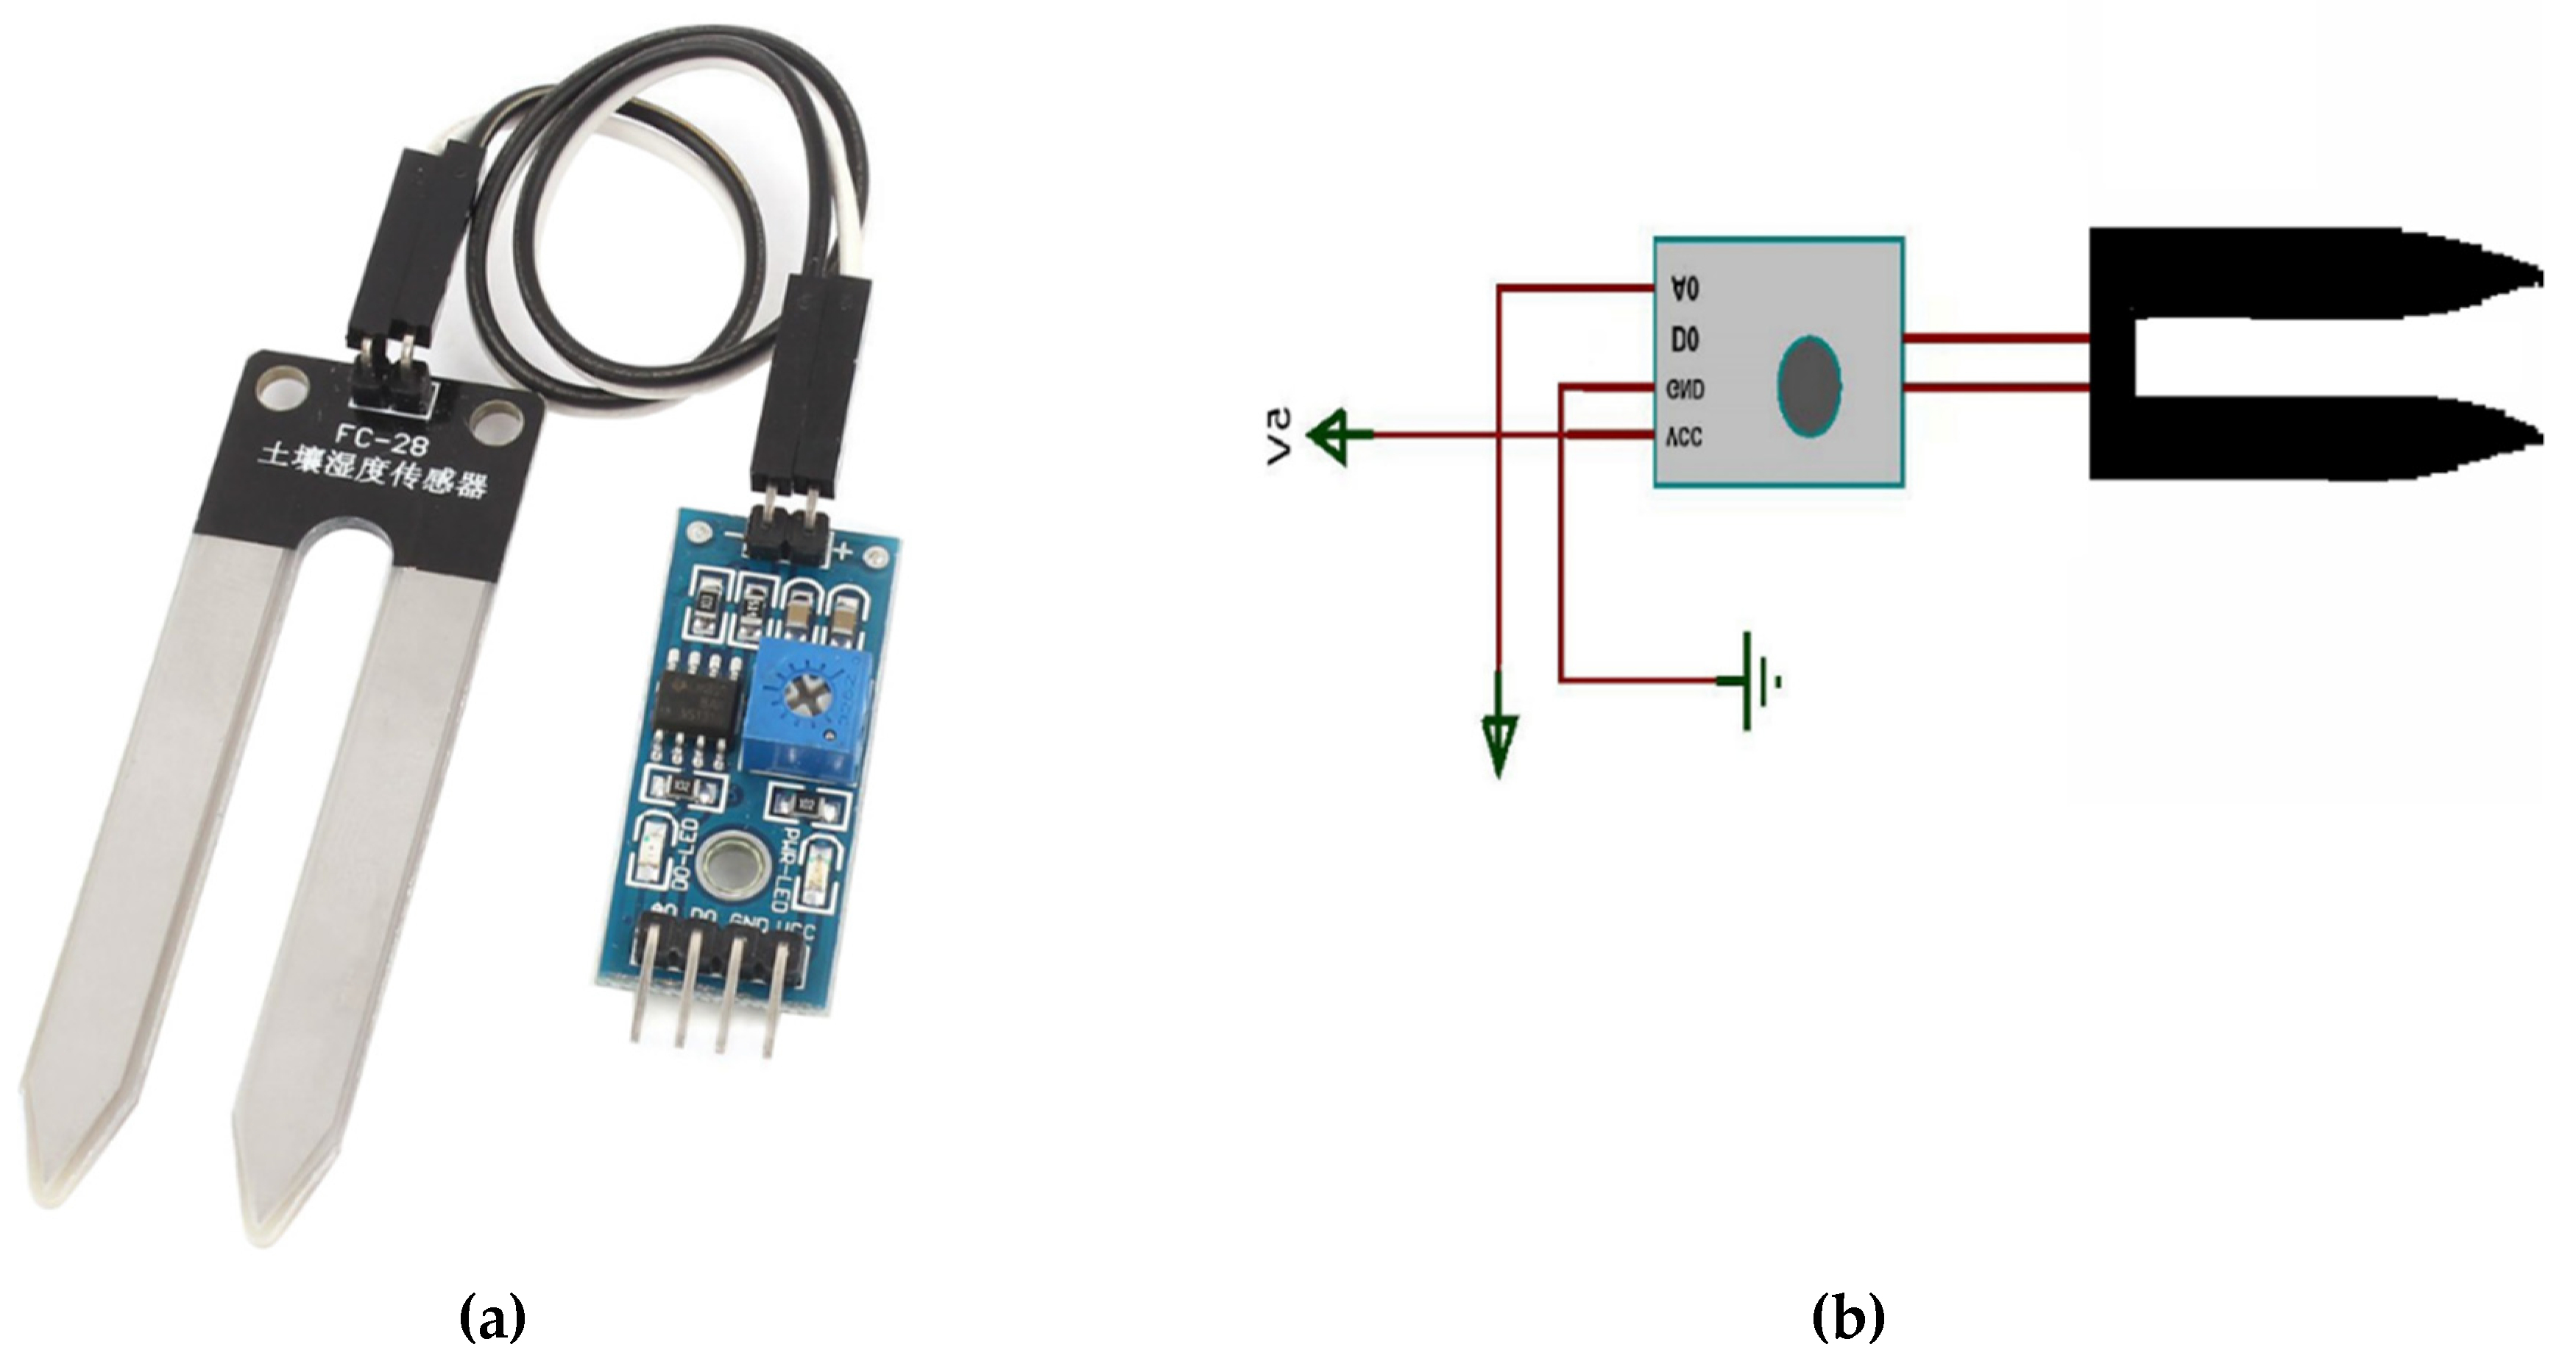
Soil moisture was measured using two FC-28 soil moisture sensors (Arduino Accessory) in each green wall module. The FC-28 moisture sensor detects moisture in the soil and generates a value based on the level of moisture (See Figure 3). The sensor operates between 3.3 and 5 volts and has the LM393 which is an analog voltage comparator chip, as a small voltmeter with integrated switches to deliver both digital and analogue values, if a greater precision is required. The sensor has a pair of electrodes which are pushed into the substrate. The sensor incorporates an LED in the board that directly shows if the soil moisture level is above or below the predefined threshold [24]. The fundamental principle is to facilitate the recording of voltage values, in our case analogue values, which are used to estimate the soil moisture levels.
Two FC-28 soil moisture sensors are positioned in each green wall module, one in the upper part and the other in the lower part to record moisture levels in both parts. The lower part of the 1-m2 prototype tends to have more water than the upper part of the module, for a total of eight FC-28 sensors in four different modules of the experimental green wall.
The FC-28 soil moisture sensors measure the volumetric substrate water content by measuring the dielectric constant of the soil. This varies according to water content, however, not all substrates share the same electrical properties due to variations in soil density, mineralogy, texture and salinity. Factory calibration of the soil moisture sensors has an accuracy of ±3–4% for most mineral substrates and approximately ±5 % for growing substrates such as sphagnum, coconut coir etc. Nevertheless, accuracy increases to ±1–2% for all substrates with specific soil-type calibration [25].
It is recommended that users of the FC-28 carry out a specific soil-type calibration to get the most accurate volumetric reading for the water content. Studies carried out by Czarnomski et al. (2005), show that specific soil-type calibration of the sensors achieves comparable performance results to those of commercial sensors but at a much more affordable price. The calibration of the soil moisture sensor was carried out on laboratory using standard sensor calibration procedures [26].
From the calibration performed, four different value ranges were defined according to the soil moisture in a range of 0 to 1000 mV: where from 0 to 370 (very moist substrate), from 370 to 600 (moist substrate), and from 600 to 800 (dry substrate), and from 800 to 1000 (totally dry substrate).
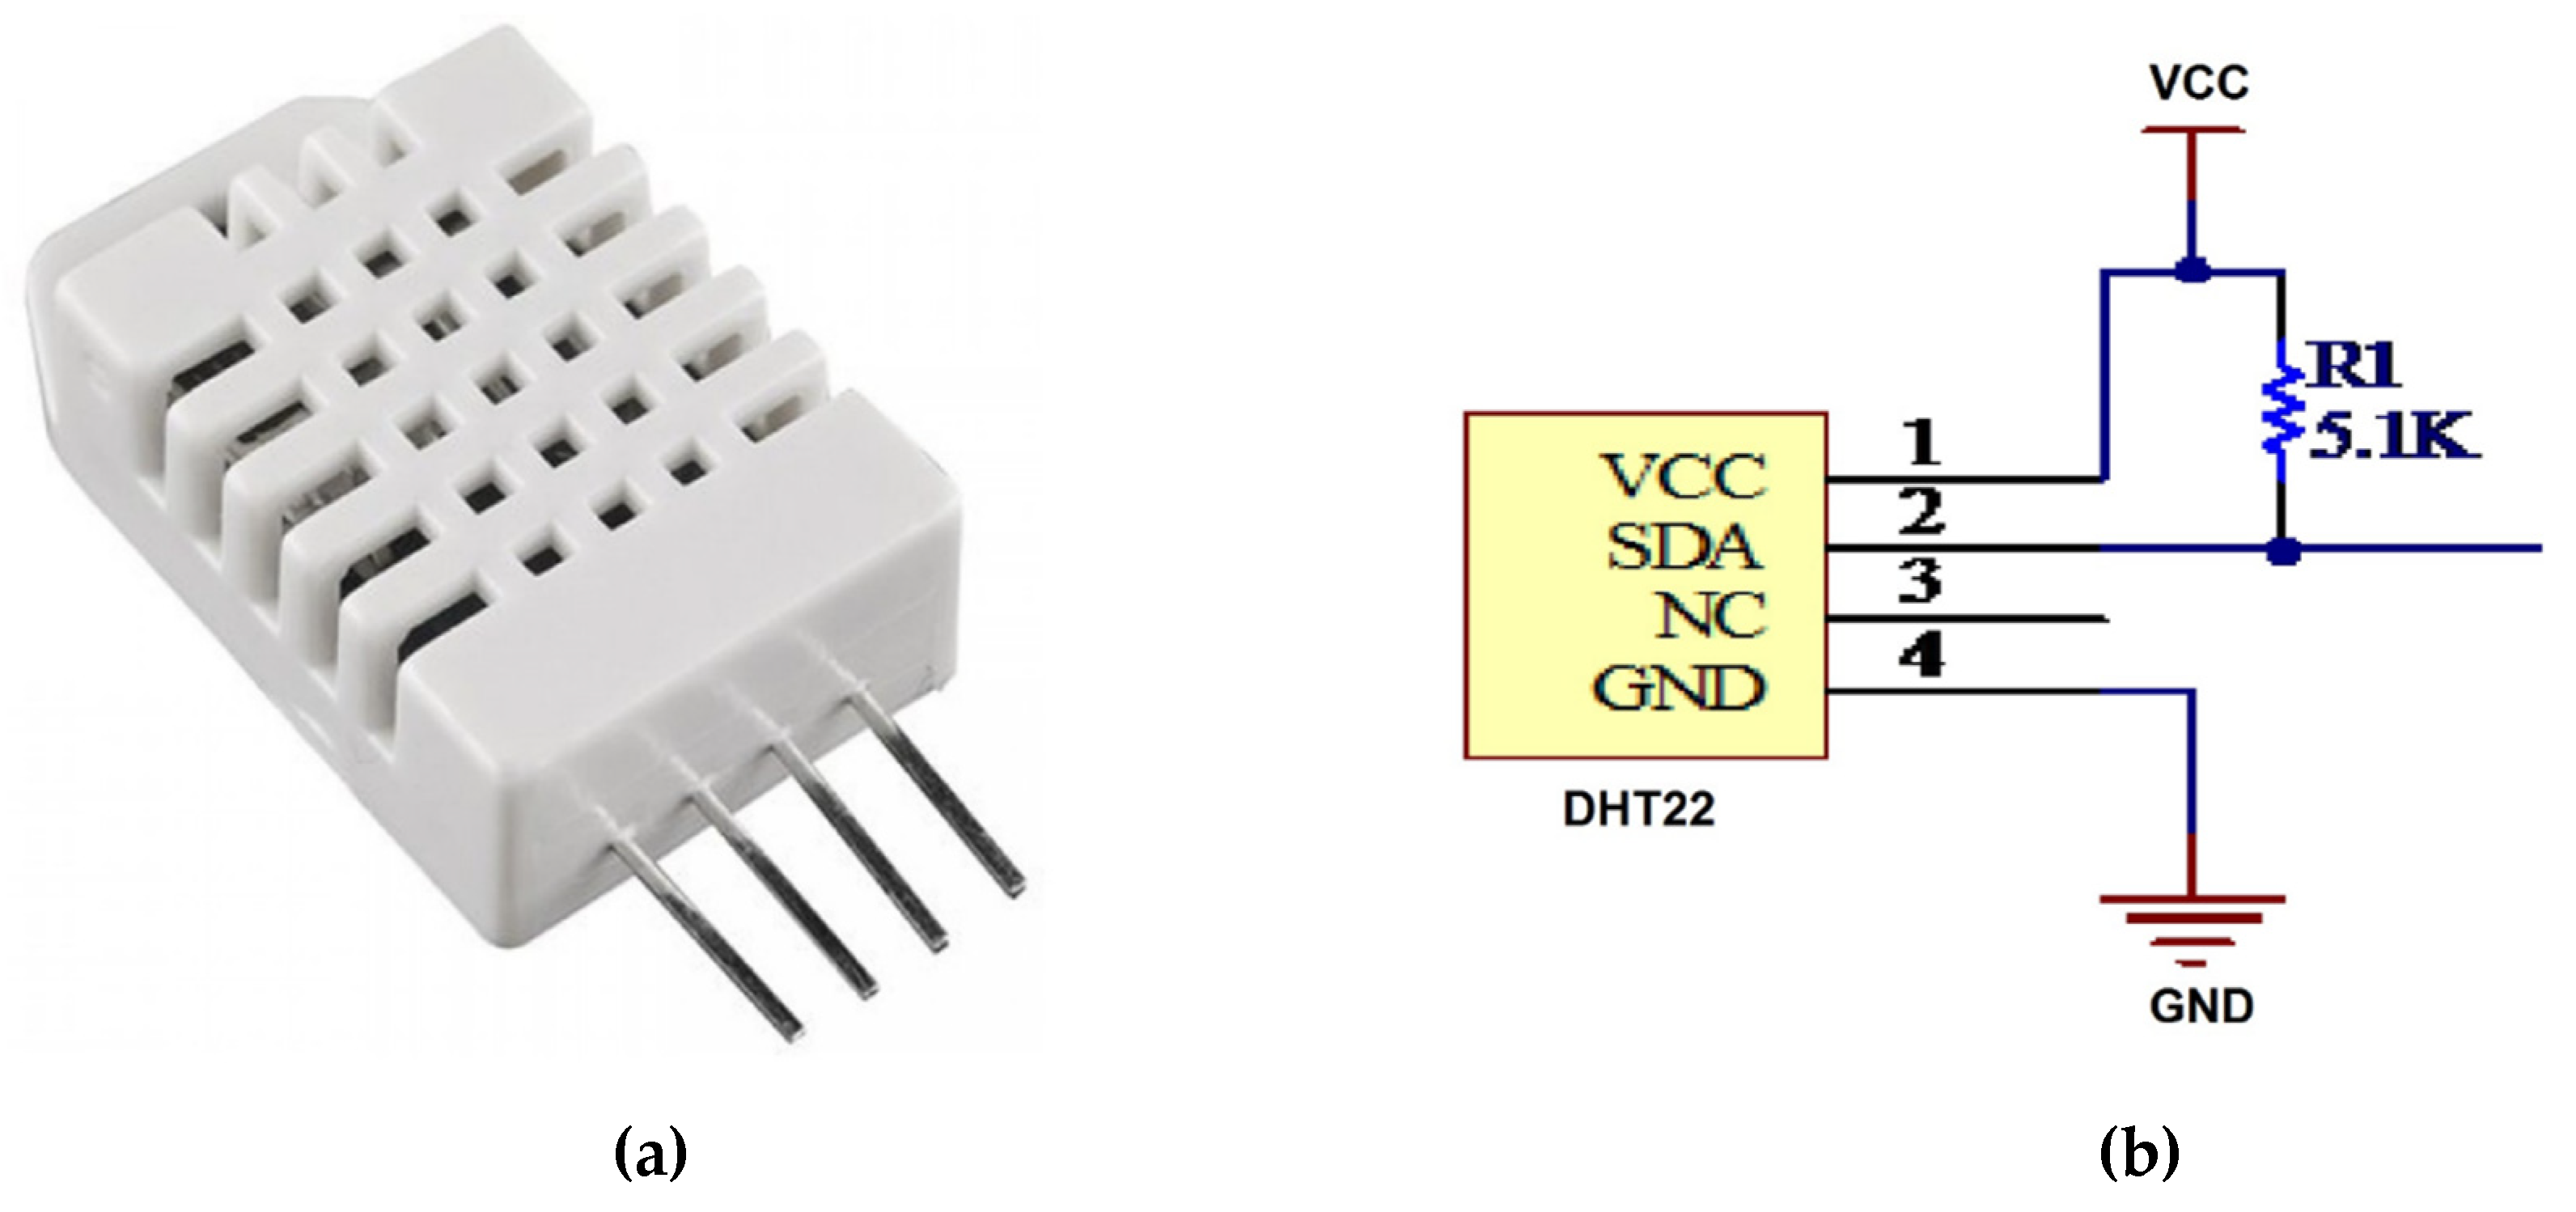
The air temperature and relative air moisture parameters should be considered when setting up an outdoor green wall. Relative humidity and temperature are measured using a basic digital low-cost DHT22 sensor using digital output as can be seen in Figure 4. It uses a capacitive moisture sensor and a thermistor to measure the surrounding air sending a digital signal to the Arduino data pin [27]. The connections are simple, an initial 3-5V pin, the second pin for data input, and the pin furthest to the right, the Ground. The features are as follows: measuring temperature between −40 and 125 °C, with an accuracy of 0.5 °C, moisture measurement between 0 and 100%, with an accuracy of 2–5% and the sampling frequency of two samples per second (0.5 Hz) [28].
The DHT22 sensors cannot be calibrated, but the specification ensures sufficient precision for this project and accuracy. Although there are different articles available on the web that appear to be about the same device, there is no guarantee that they are all from the same manufacturer. So, to verify this, four DHT22 sensors were tested in the laboratory and the results showed no significant differences. It should be remembered, nevertheless, that the accuracy of these sensors can vary over time.
The light dependent resistor (LDR) is the sensor used to determine the light intensity that is reaching the green wall (see Figure 5). It is a component whose resistance varies considerably with the amount of light it receives [29]. With a 220-ohm 1/4 W resistance, it is possible to share the voltage supplied by the source between the terminals. The analogue-digital conversion is carried out by converting the magnitude of light that shines on the green wall to a digital signal to facilitate handling by Arduino and to be able to numerically process it [13].
The photo-resistor is calibrated by determining the maximum and minimum light intensity readings, taken in situ, thus setting ranges of <10% (totally dark), between 10% and 30% (low light), >30% (ample light), ready for subsequent programming.
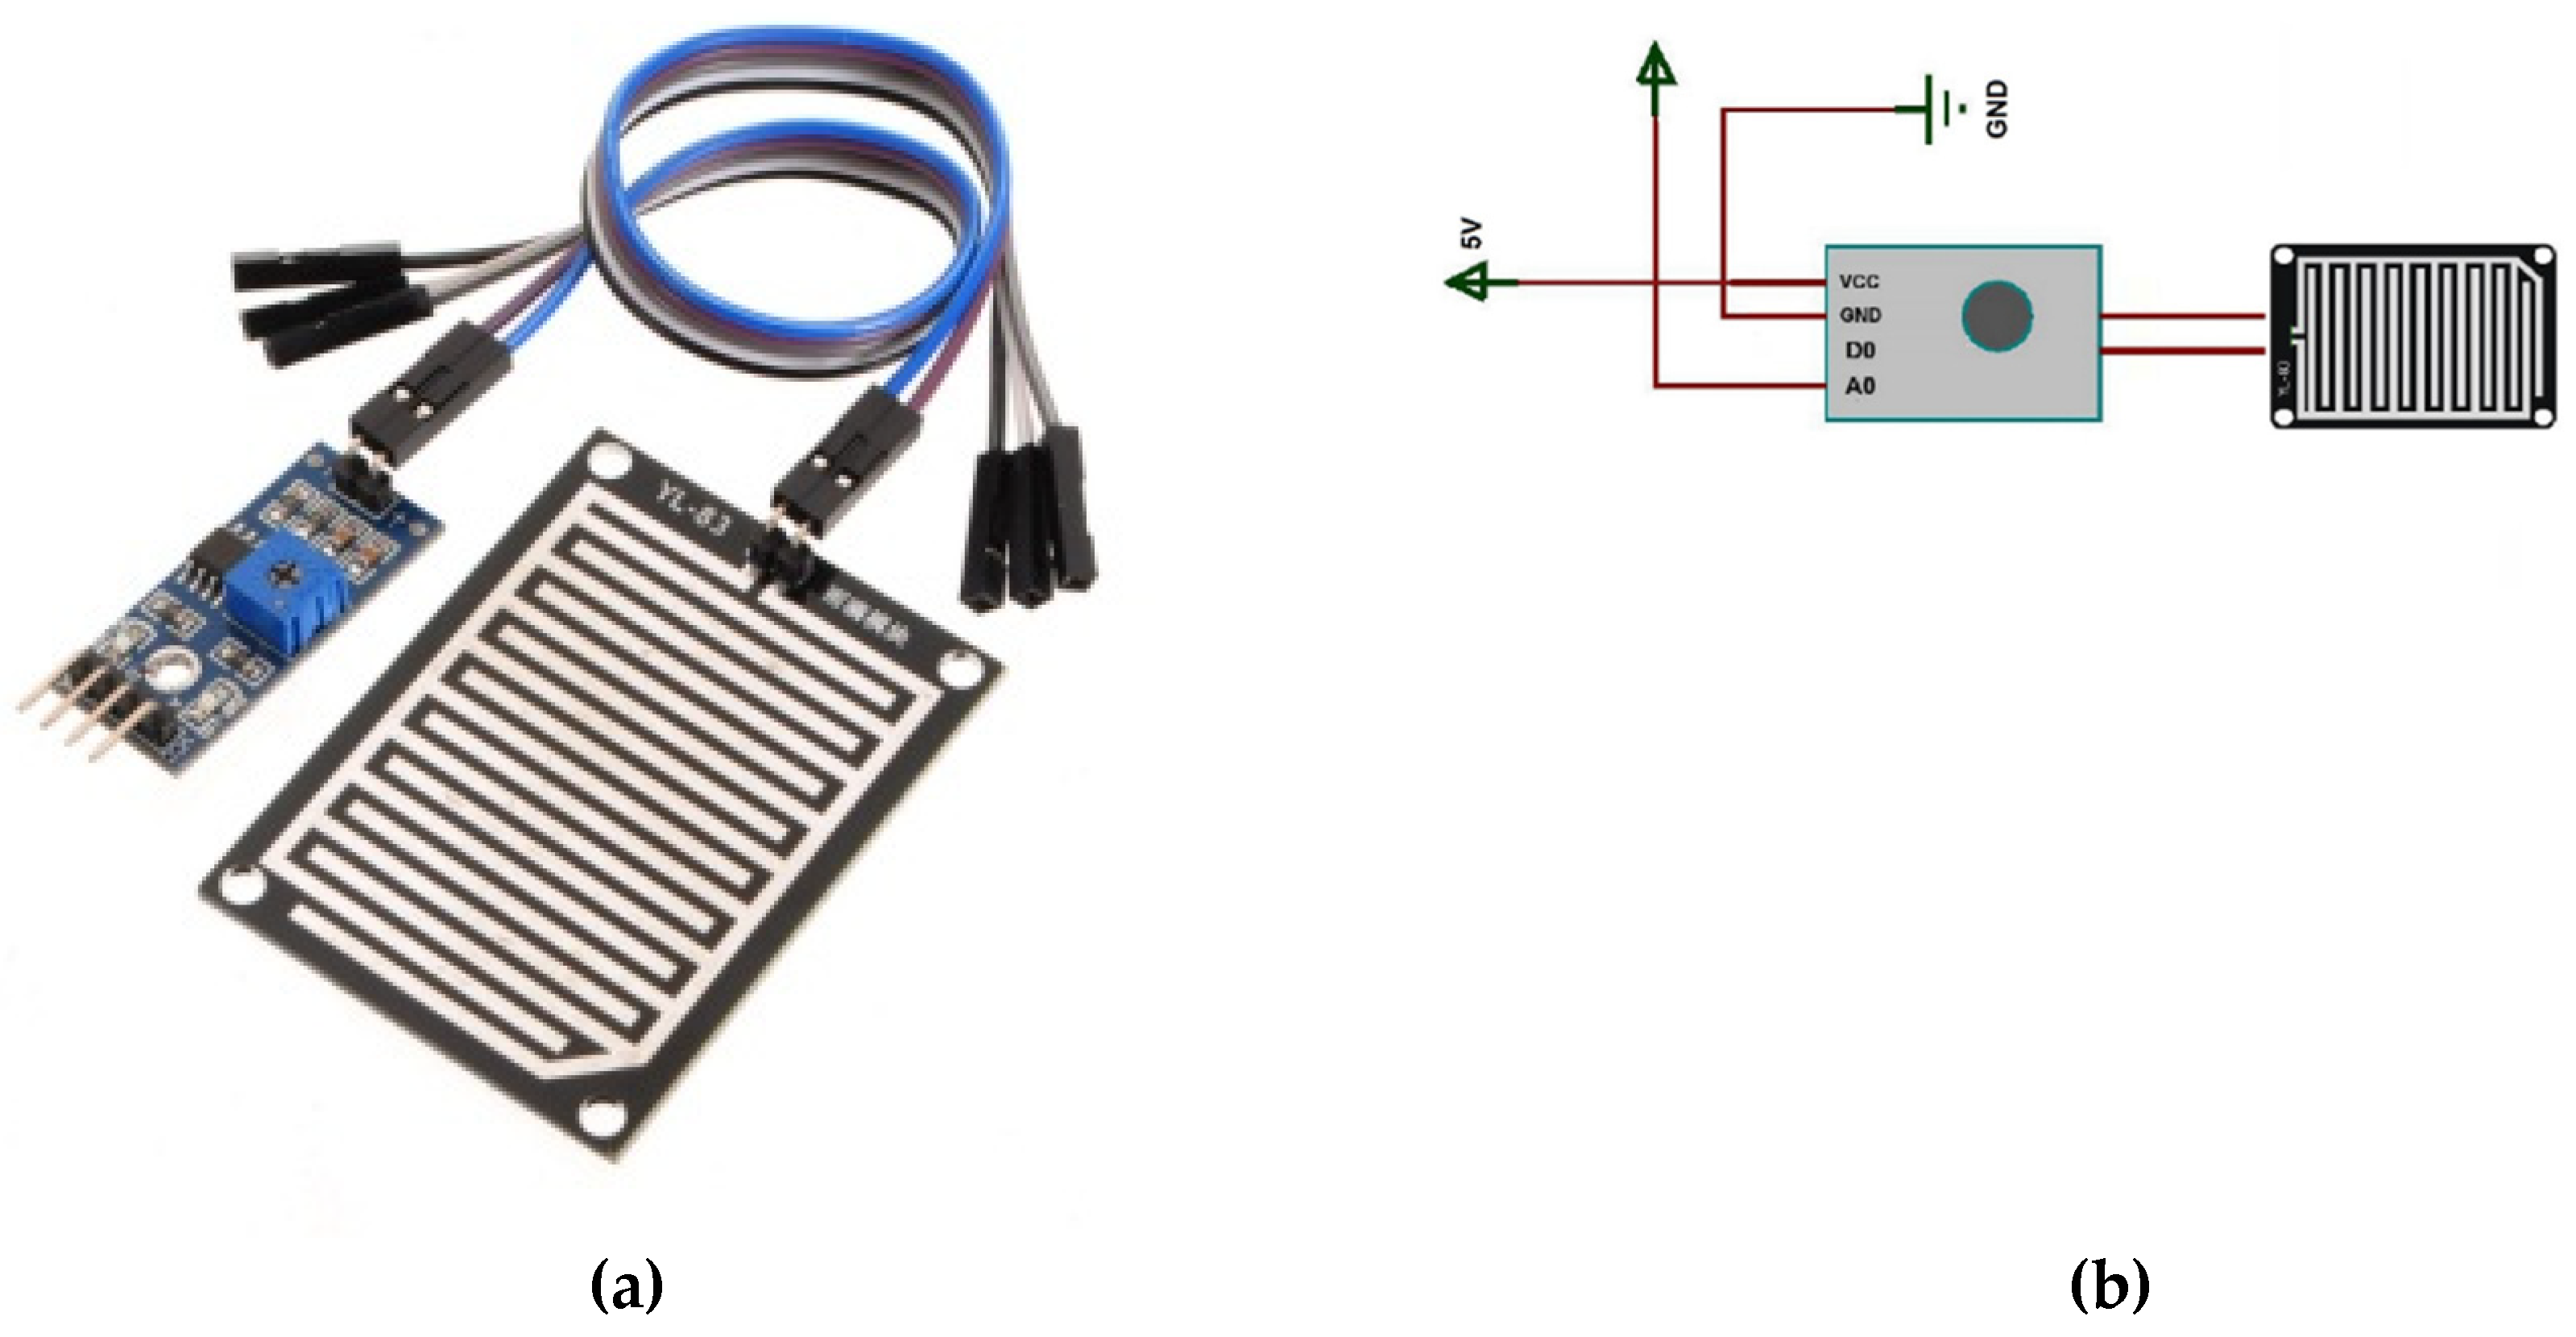
The YL-83 Rain Sensor detects rain drops and subsequently carries out specific operations such as switching the system off when it rains. For this paper, a YL-83 sensor was used given that it is a low-cost sensor that is easy to use and program. This module consists of a series of conductive strands printed onto a Bakelite plaque. The separation between the lines is very small as can be seen in Figure 6. What this model does is create a short-circuit each time it rains; the water generates a low resistance between the lines with a positive polarity and the lines connected to the ground [13]. The current that flows through these lines is subject to 10 kΩ resistance in each conductor, which stops the short-circuit from damaging the Arduino when the plaque gets wet.
As the YL-83 rain sensor is only configured to switch the pump off if it rains, it was calibrated with the values (ON/OFF), such that the pump would be switched off when water is detected on the sensor.
The DHT22 moisture and temperature sensor, the LDR Photo-resistor and the YL-83 rain sensor were installed in close proximity to the green wall to capture the environmental conditions of its surroundings. The sensors were protected by a plastic container given that they are open to the elements and are susceptible to malfunction due to the weather conditions, such as the rain and the sun. Readings are taken every five minutes by Arduino [30] located at 2 m in a weather-resistant compartment, where signals are received via basic 3.5 mm stereo jacks attached to the wall of the compartment and then sent via the Internet to the database [31].
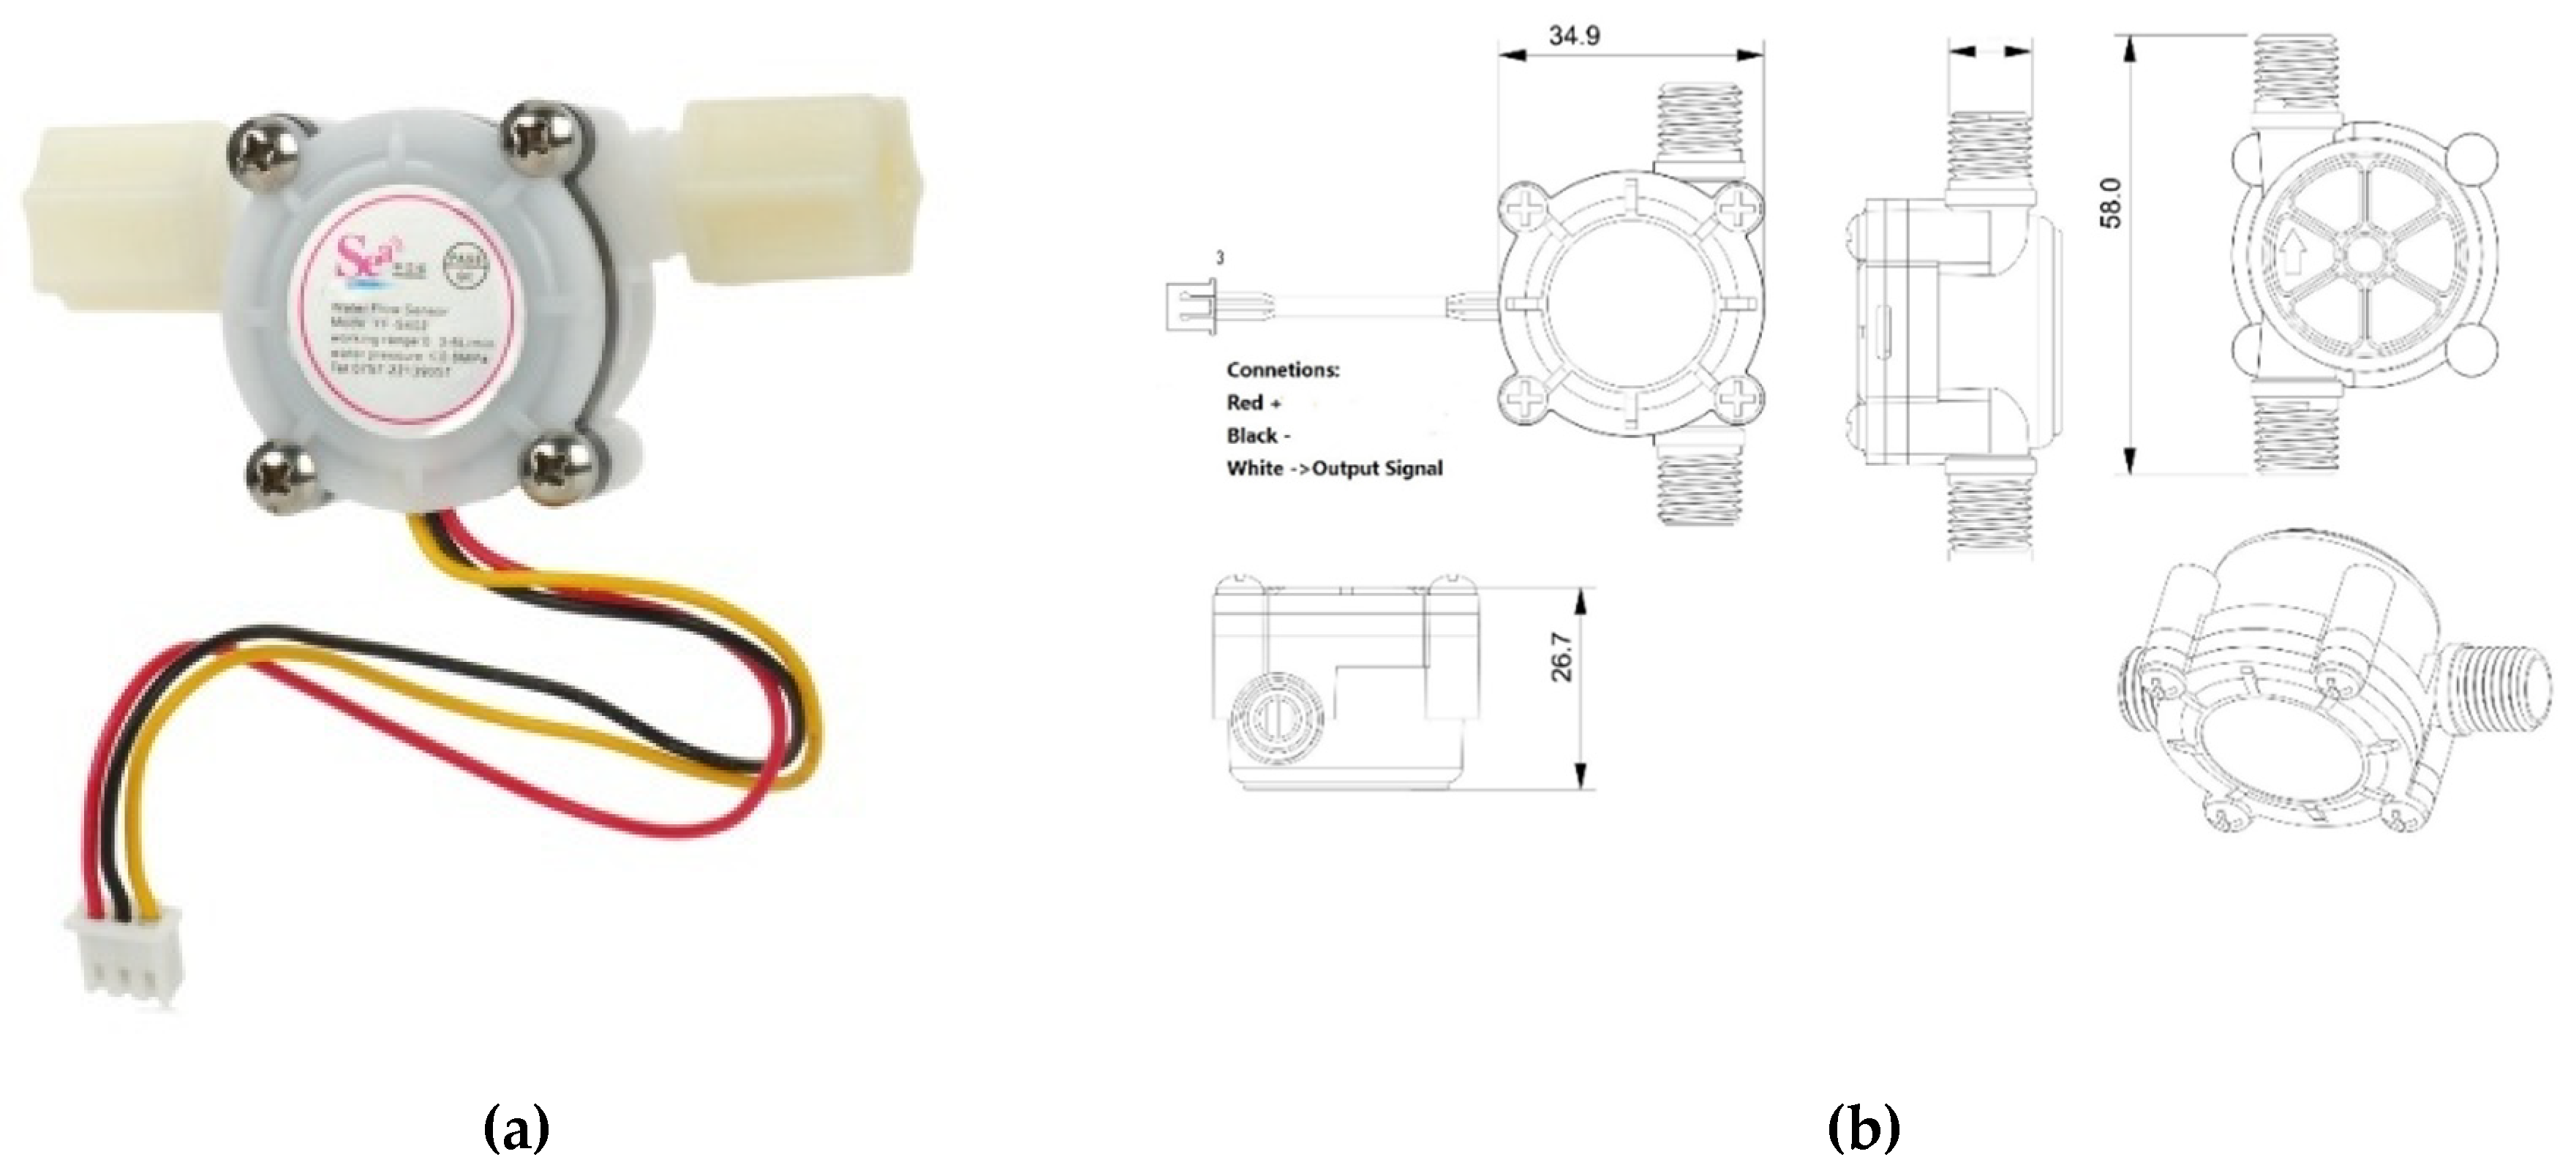
The YF-S402 water flow sensor measures the flow of water in the green wall prototypes during the experiment, and indicates the level of green wall water consumption and therefore the moisture retention of the different substrates by closing the water balance (see Figure 7). Accordingly, four water flow sensors were positioned in the water collection system of four different green wall prototypes. The sensor consists of a magnetized blade which, when rotated by the flow of water, stimulates a magnetic sensor found on the other side of the tube. Using this system, the sensor can measure the number of rotations made by the blade, which depend on the amount of the circulating flow [32].
Calibration of the flow sensors was carried out volumetrically in the laboratory, taking a known reference volume and analyzing the rotations of the Hall sensor. The YF-S402 flow sensor registered 14 pulses per liter of water which will be used for programming all the sensors, since no differences were found between the four flow sensors analyzed.
A calibration procedure should be carried out to ensure greater precision. Even if not required, it is important to do so to improve performance and to check that everything is working properly. The sampling rate is determined by performing several tests to see how many pulses are emitted using a known volume of water. The experiment is repeated several times to obtain an average. A total of six analyses were carried out: three tests with 500 mL and three with 1000 mL, as can be seen in Table 1.
For each litre of water that passed through the YF-S402 flow sensor, approximately 850 pulses were recorded, which equals 14.1 pulses / sec or 14 Hz.
The Relay Actuator is a sensor that enables Arduino to control charges at much higher voltage or intensity levels than its electronic components can handle. In our experiment, a relay was used that switched on the electrovalve of the pump to control the automated irrigation in the green wall [33]. A diode connected to the 5V power supply is used to protect the control part of the circuit when an inductive charge is converted.
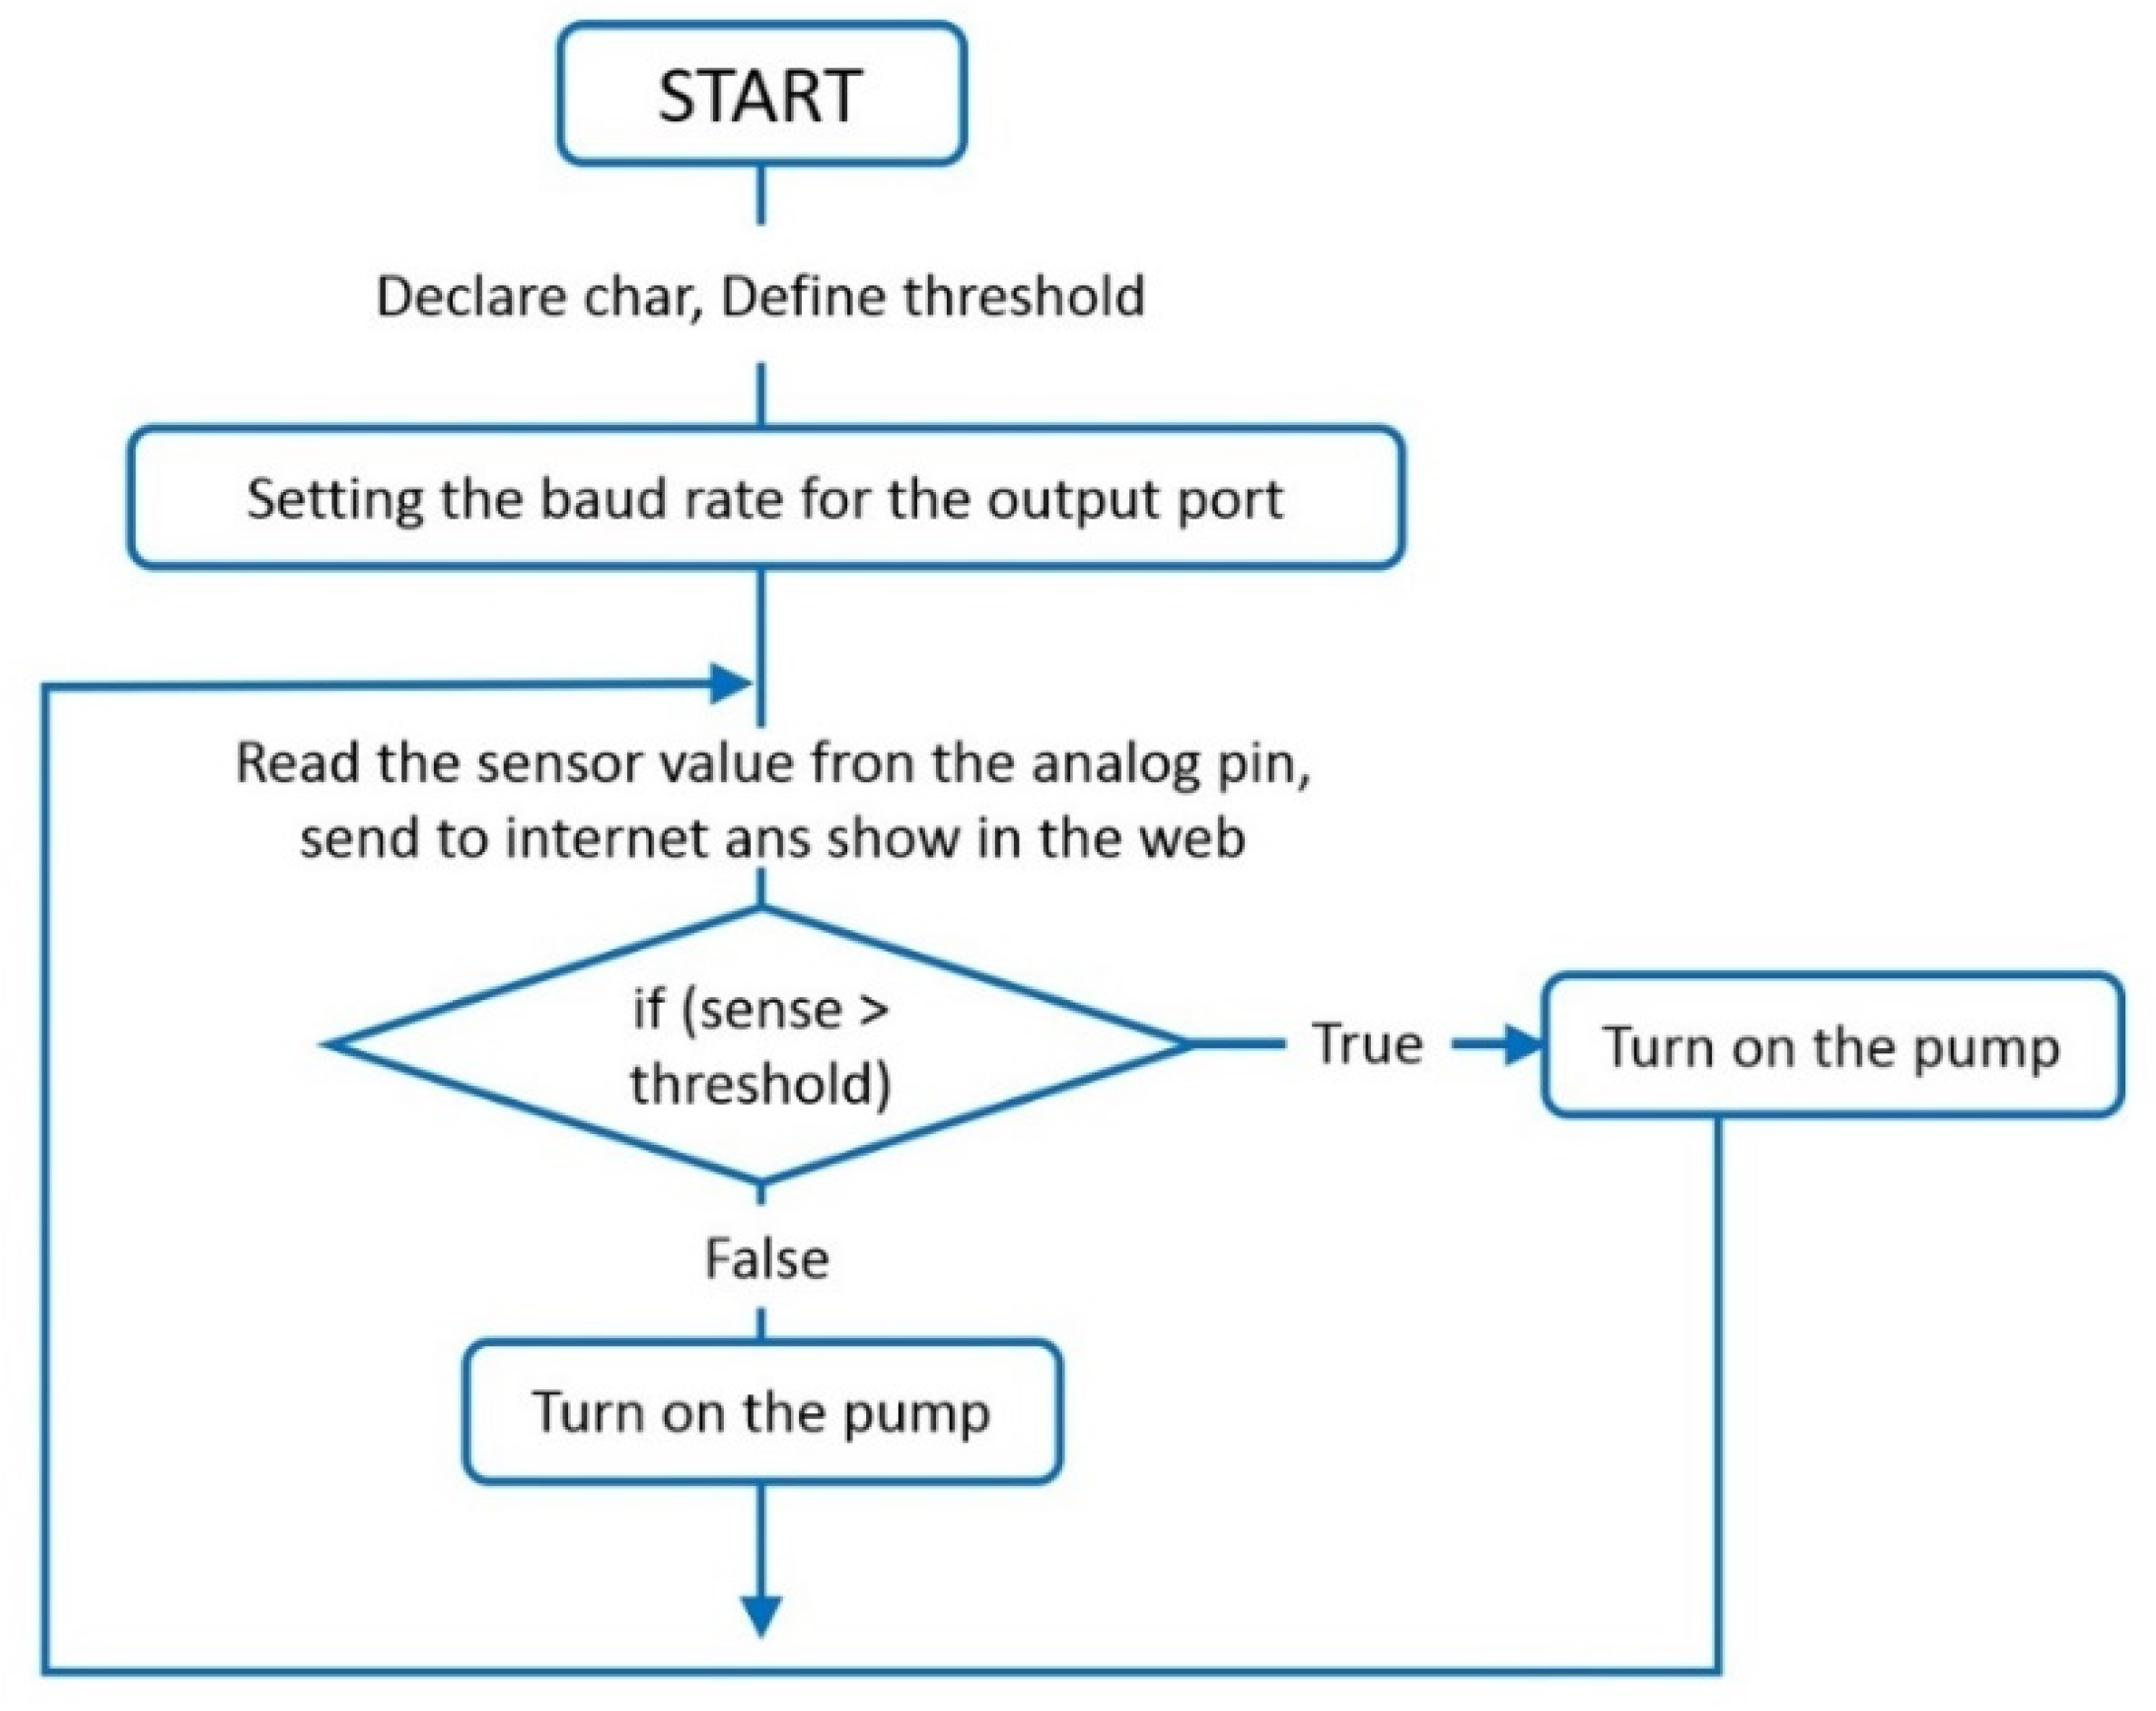
Similarly, a relay is a “switch” that is independently activated when it receives signals from Arduino when the soil moisture sensors or the rain sensor surpass the established threshold in its programming. This allows for an efficient use of water using sensors and actuators, only irrigating when the green wall substrate is dry or slightly moist [34], as we can see in the flow diagram of the Figure 8.
3. Results
As already stated above, the monitoring system displays the readings of multiple sensors for the measurements and the remote transmission of data, such as the soil water content, together with other relevant parameters about the green wall and the atmosphere.
The developed environmental control system allows intelligent irrigation through its automation. Controlling the data relative to the moistness of the green wall substrate and the climatic characteristics of its environment will have the necessary information to adopt the appropriate management measures such as the remote control of the drip irrigation system. Users would therefore be able to control the microenvironment of their green wall and consequently increase green wall production and quality.
The integrated use of micro-controllers, sensors and actuators optimizes the green wall drip irrigation system, given that is reduces water and energy consumption as users can check green wall water content in real time whenever they choose. Such a solution also optimizes the quality of the plant material growing on the green walls and may result in operational savings in green wall maintenance in the future.
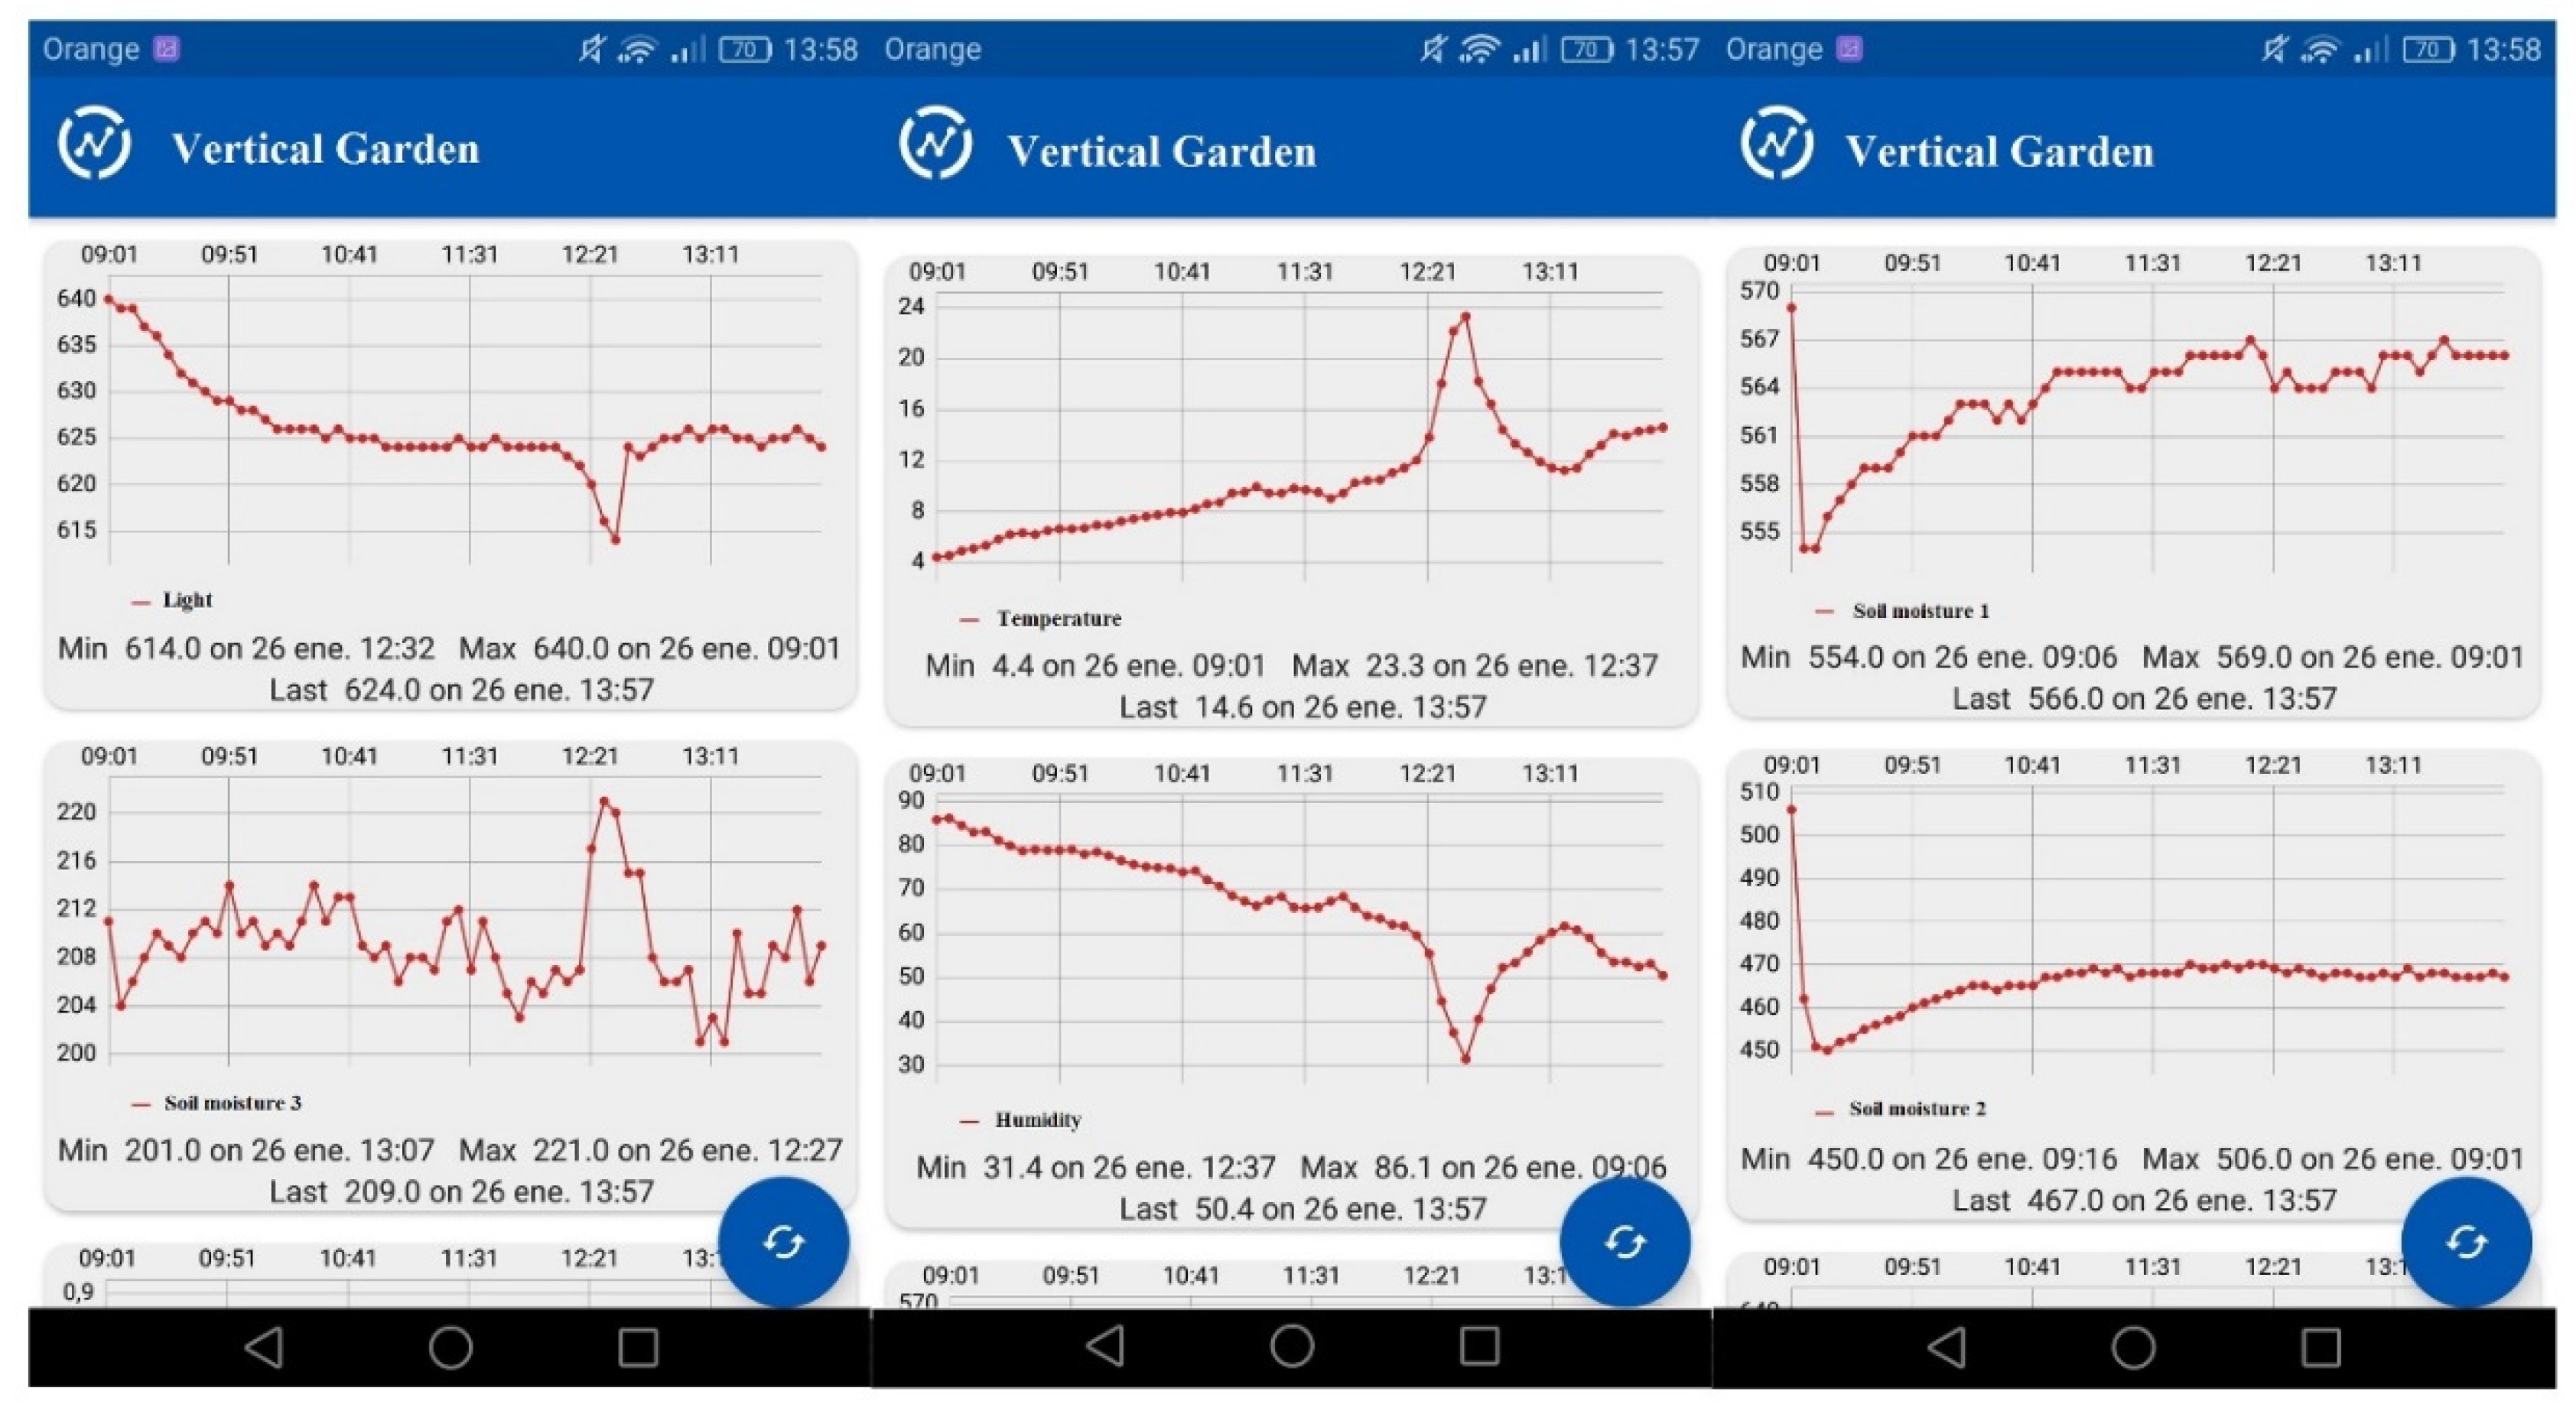
In the Figure A1 it can be observed a real-time display of the measured variables on the green wall from the APP installed on a mobile device. This display system allows knowing at all times the status of the green wall, in terms of water needs, lighting, evapotranspiration etc, and therefore decision-making in real time, being able to access from any terminal by means of connection to Internet and without needing to go to the place where the green wall is located. It was also possible to know what was happening in a certain part of the green wall, for example if the water was reaching a specific area or if this area where different species have been planted require a greater amount of water or lighting and this way to adequately manage the necessary requirements for the green wall.
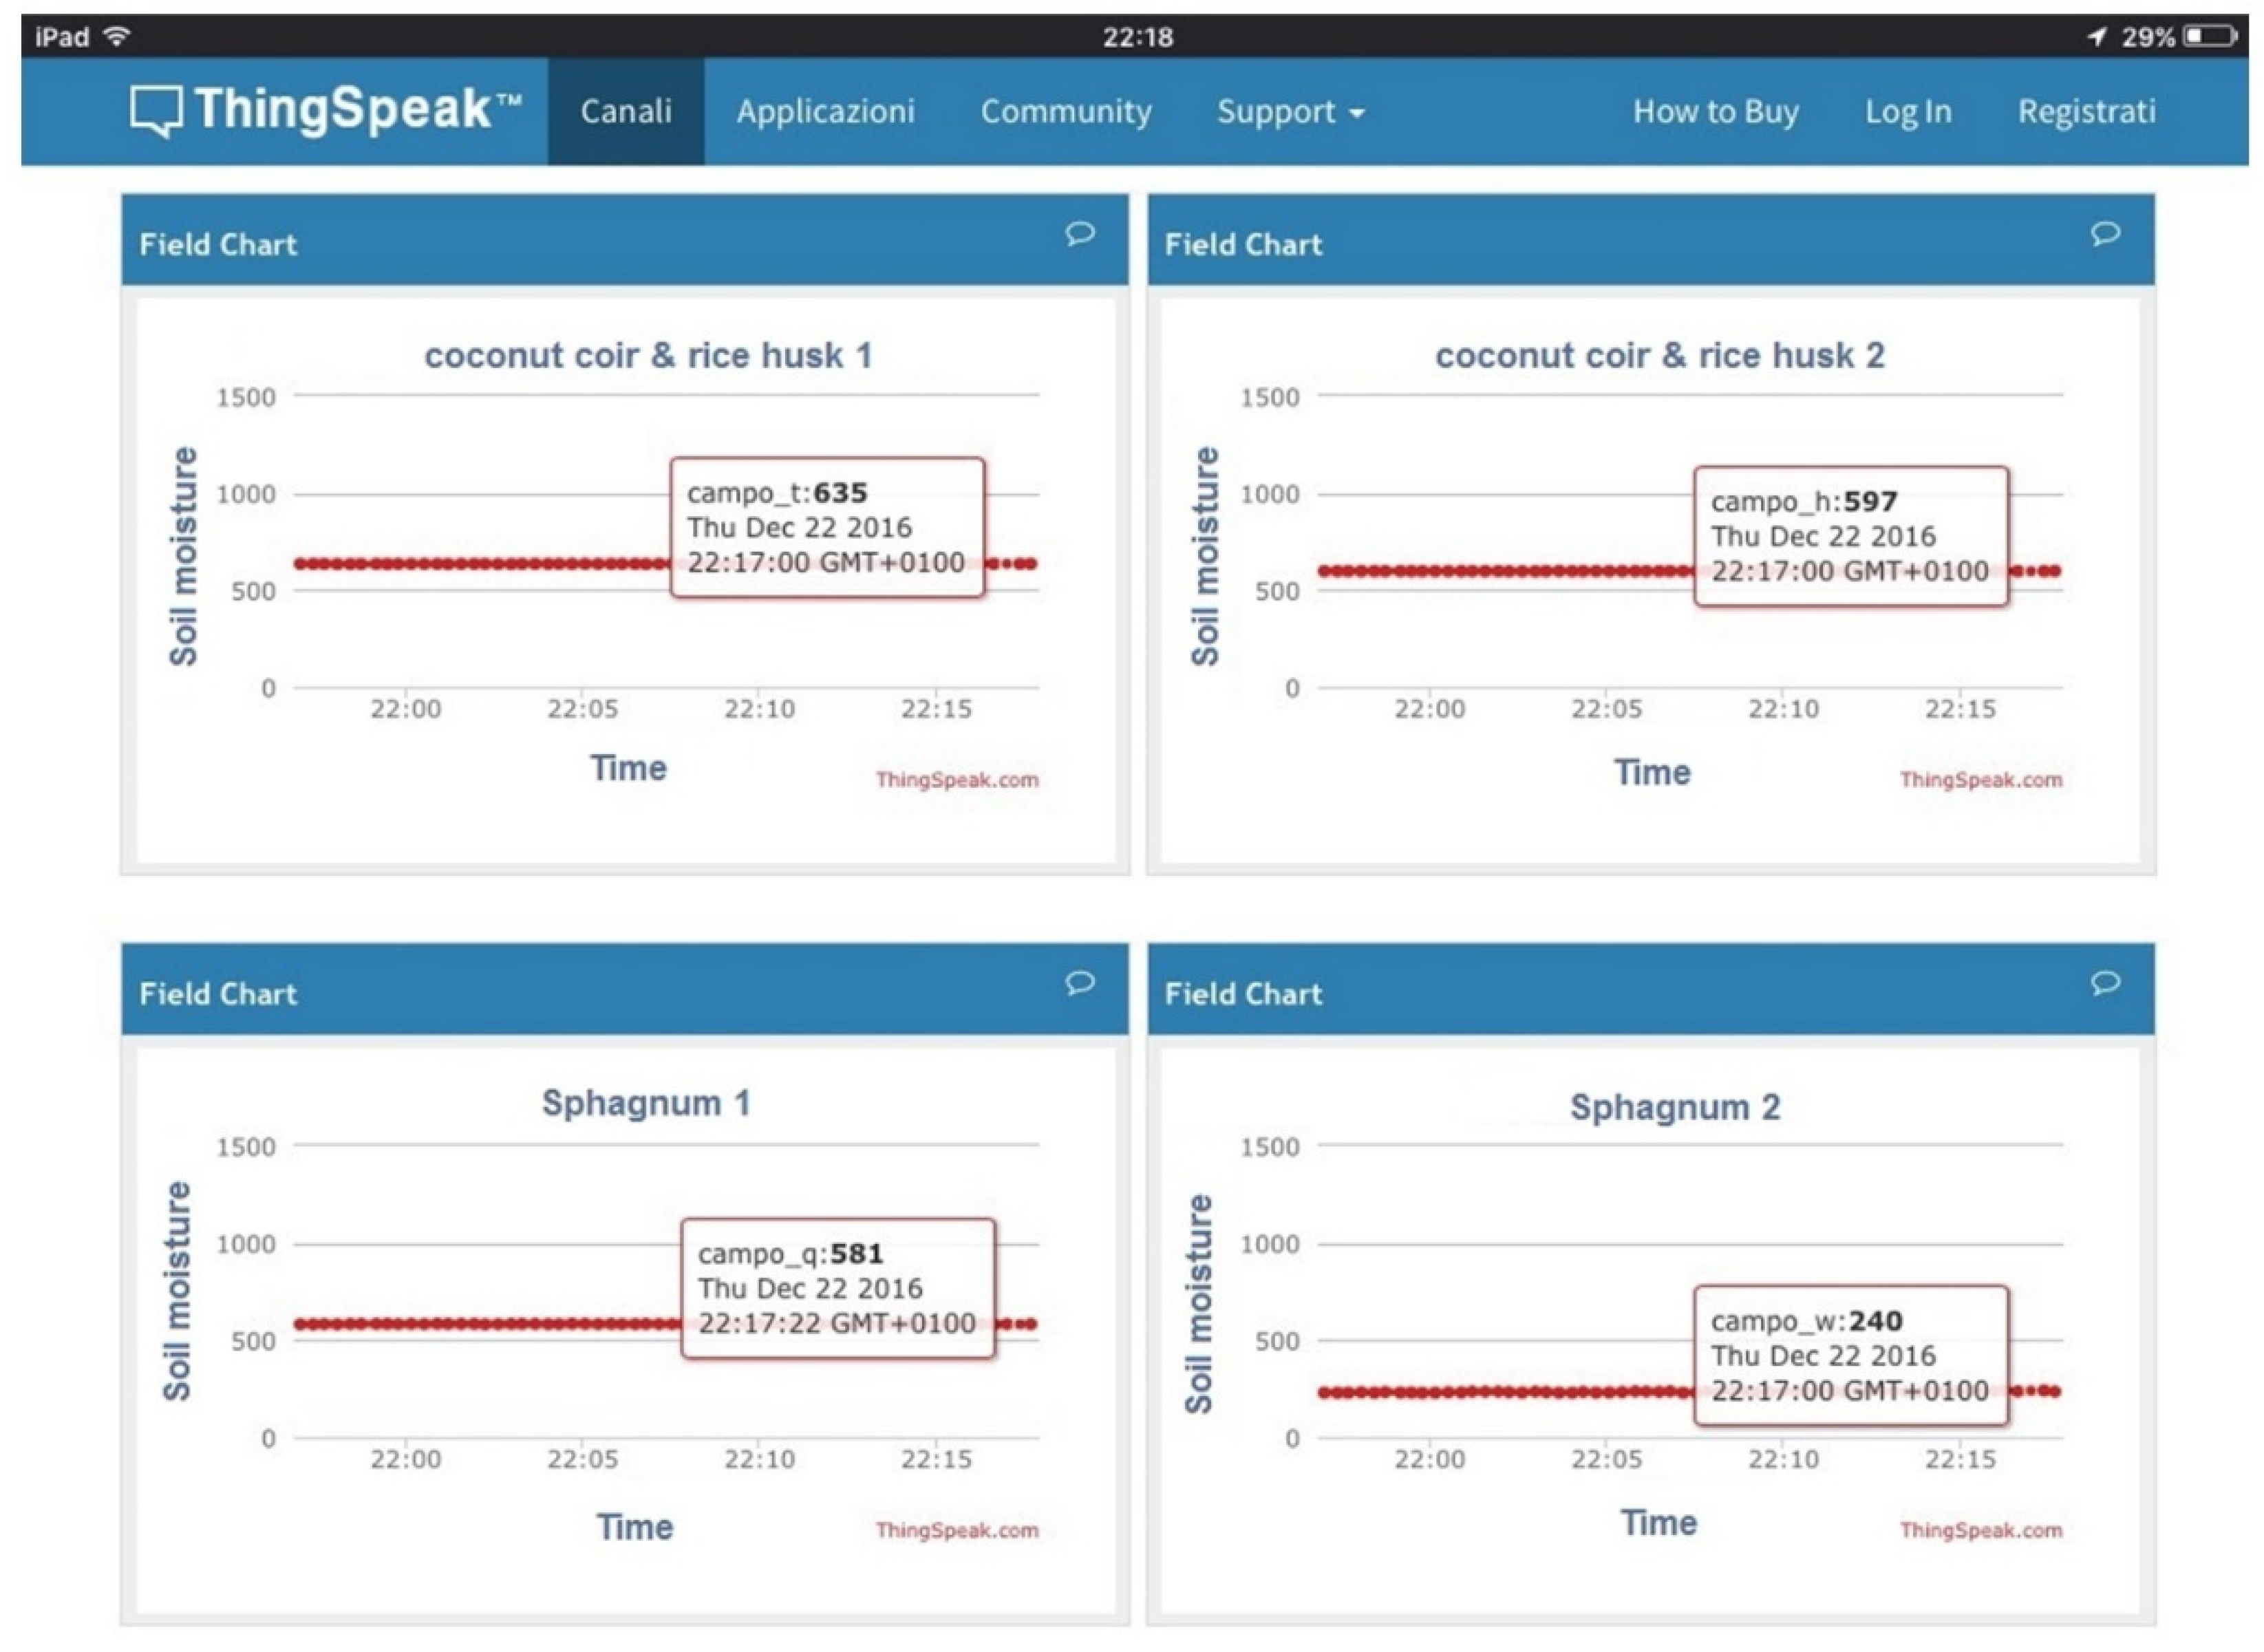
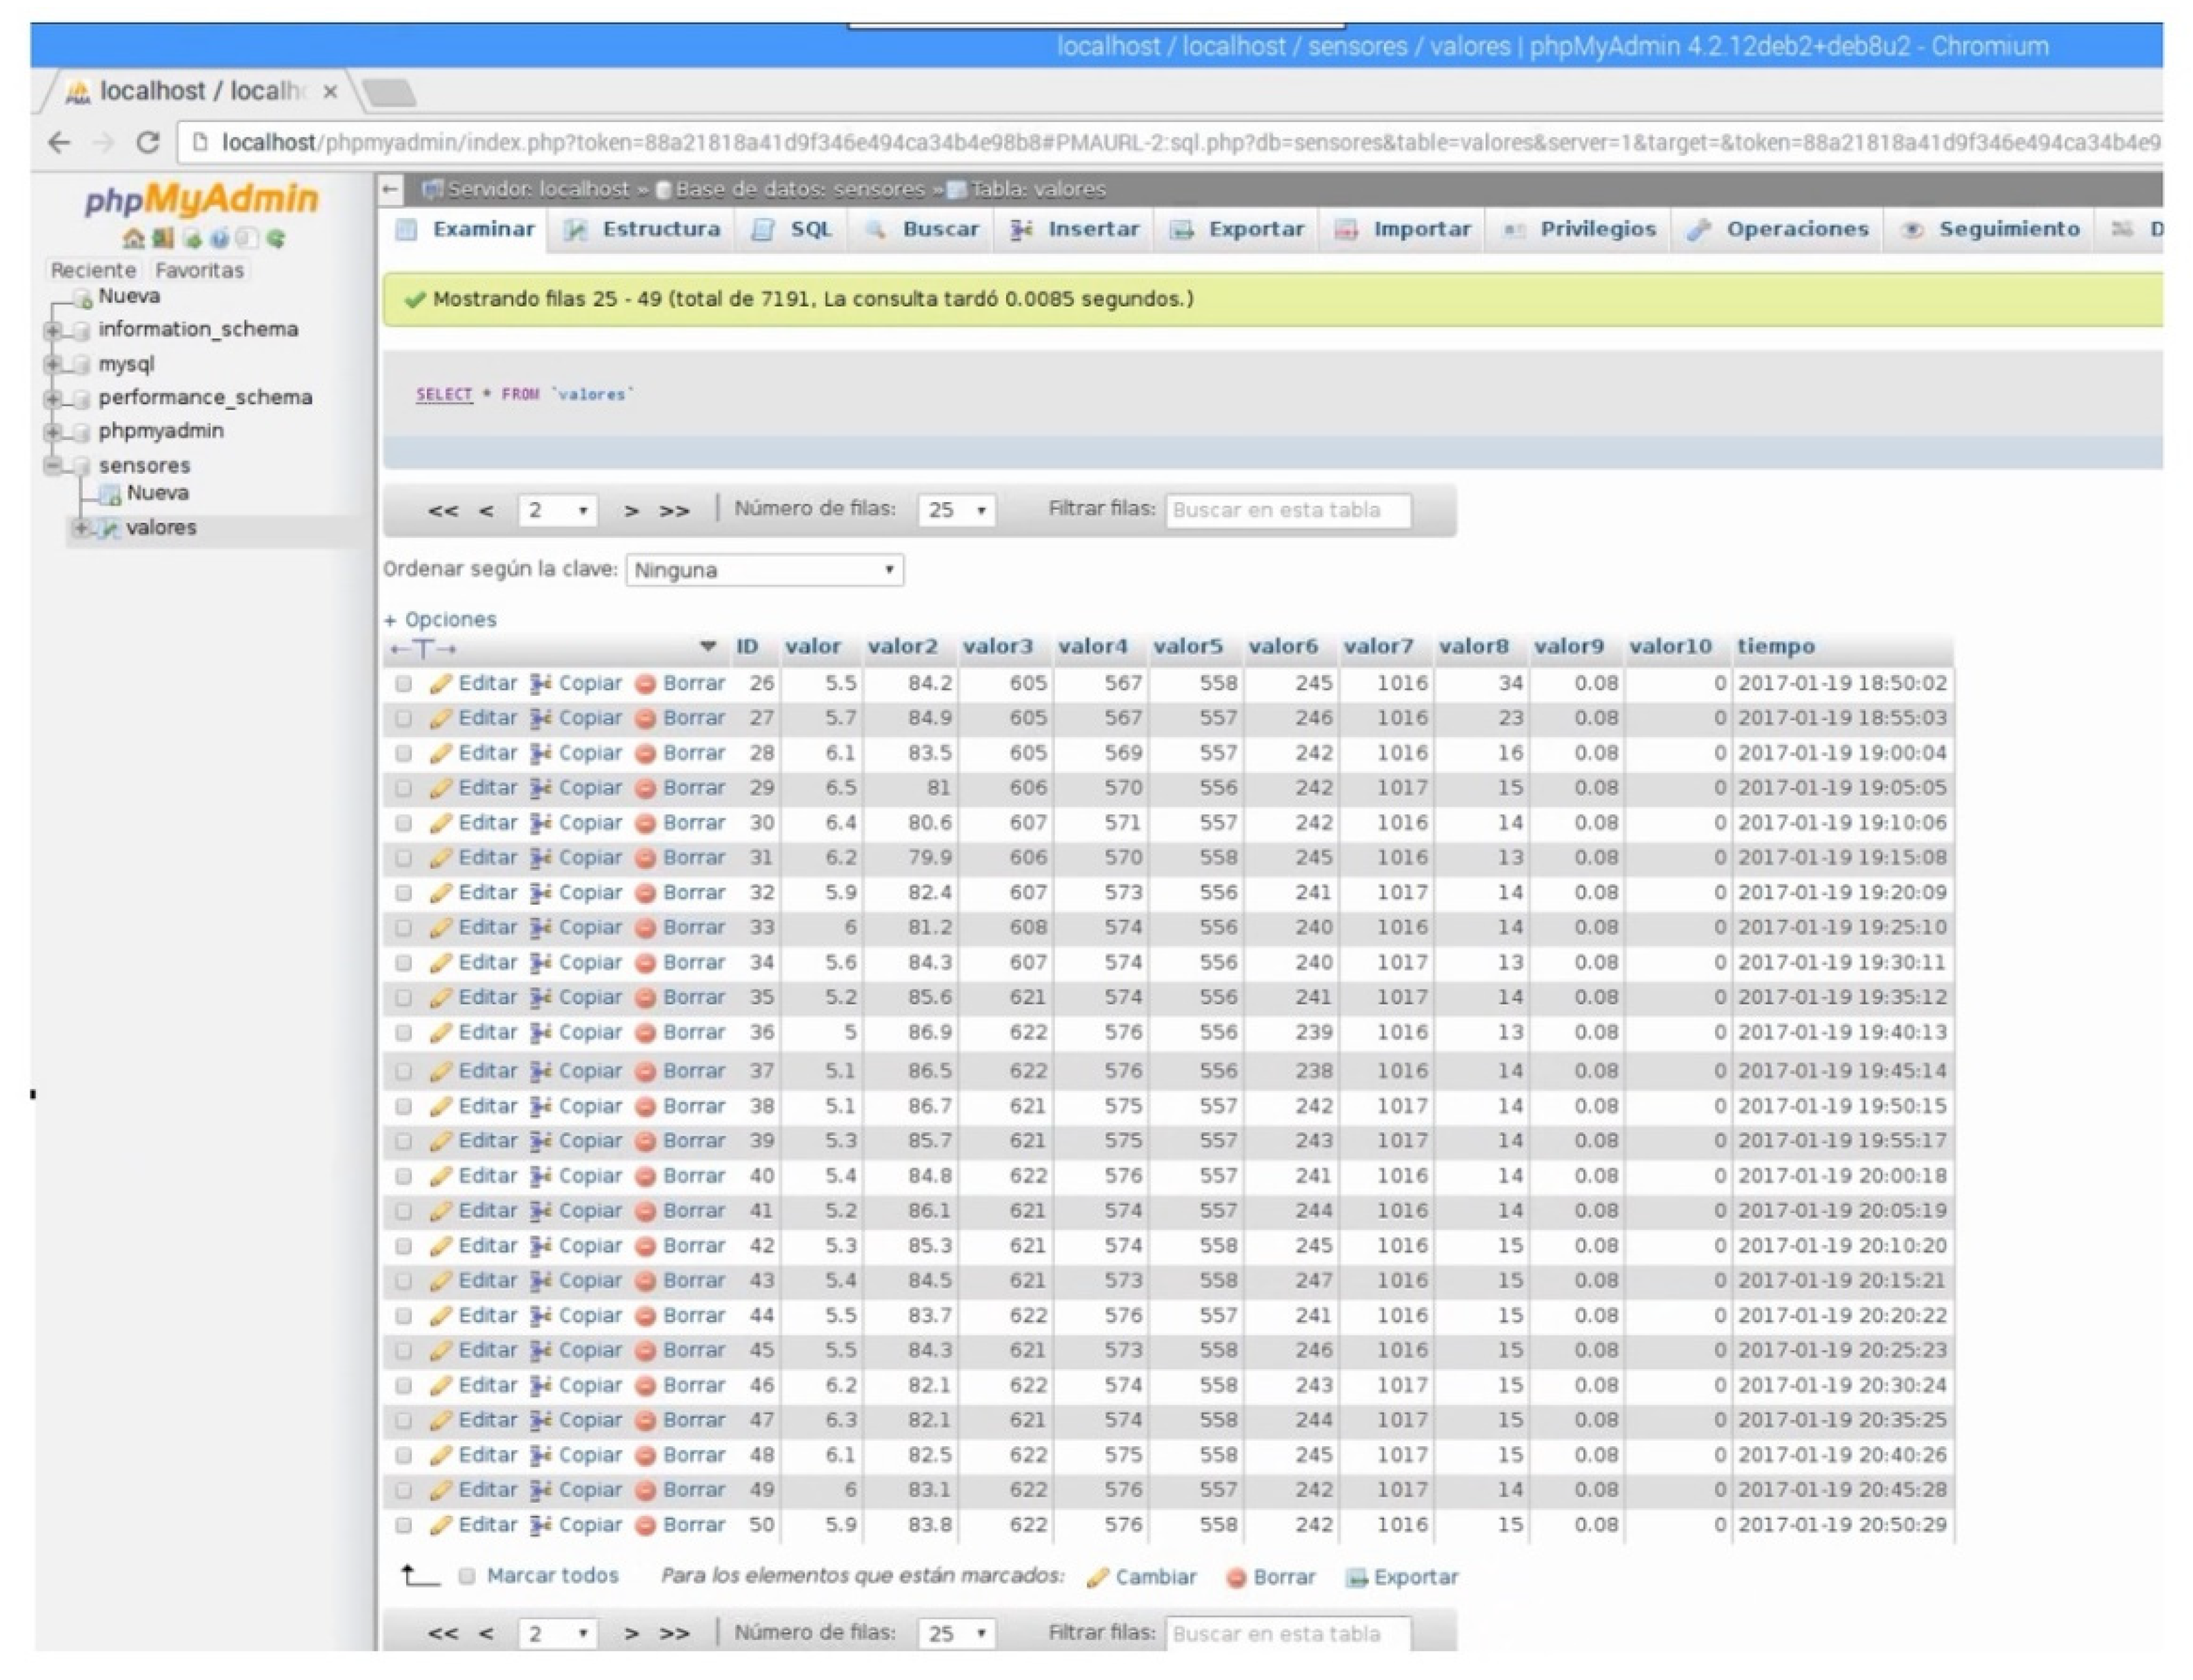
As you can see in Figure A2 and Figure A3, the Arduino UNO platform is a very affordable solution to automate the irrigation of green walls, since there are no important functional problems with the control of the actuators, the measurement of the sensors, the screen web, or with the database. In addition to sending data to the ThingSpeak web page, our data collection system is able to store and have data available for as long as necessary by using MySQL, and thus we were able to do an analysis during the entire time that the wall green was established. The storage system used is quite friendly, since it is both easy to understand and program, allows adding more sensor data, and has an organized data storage, offering other information such as date and time of each data sending and name and location of the sensor.
4. Discussion
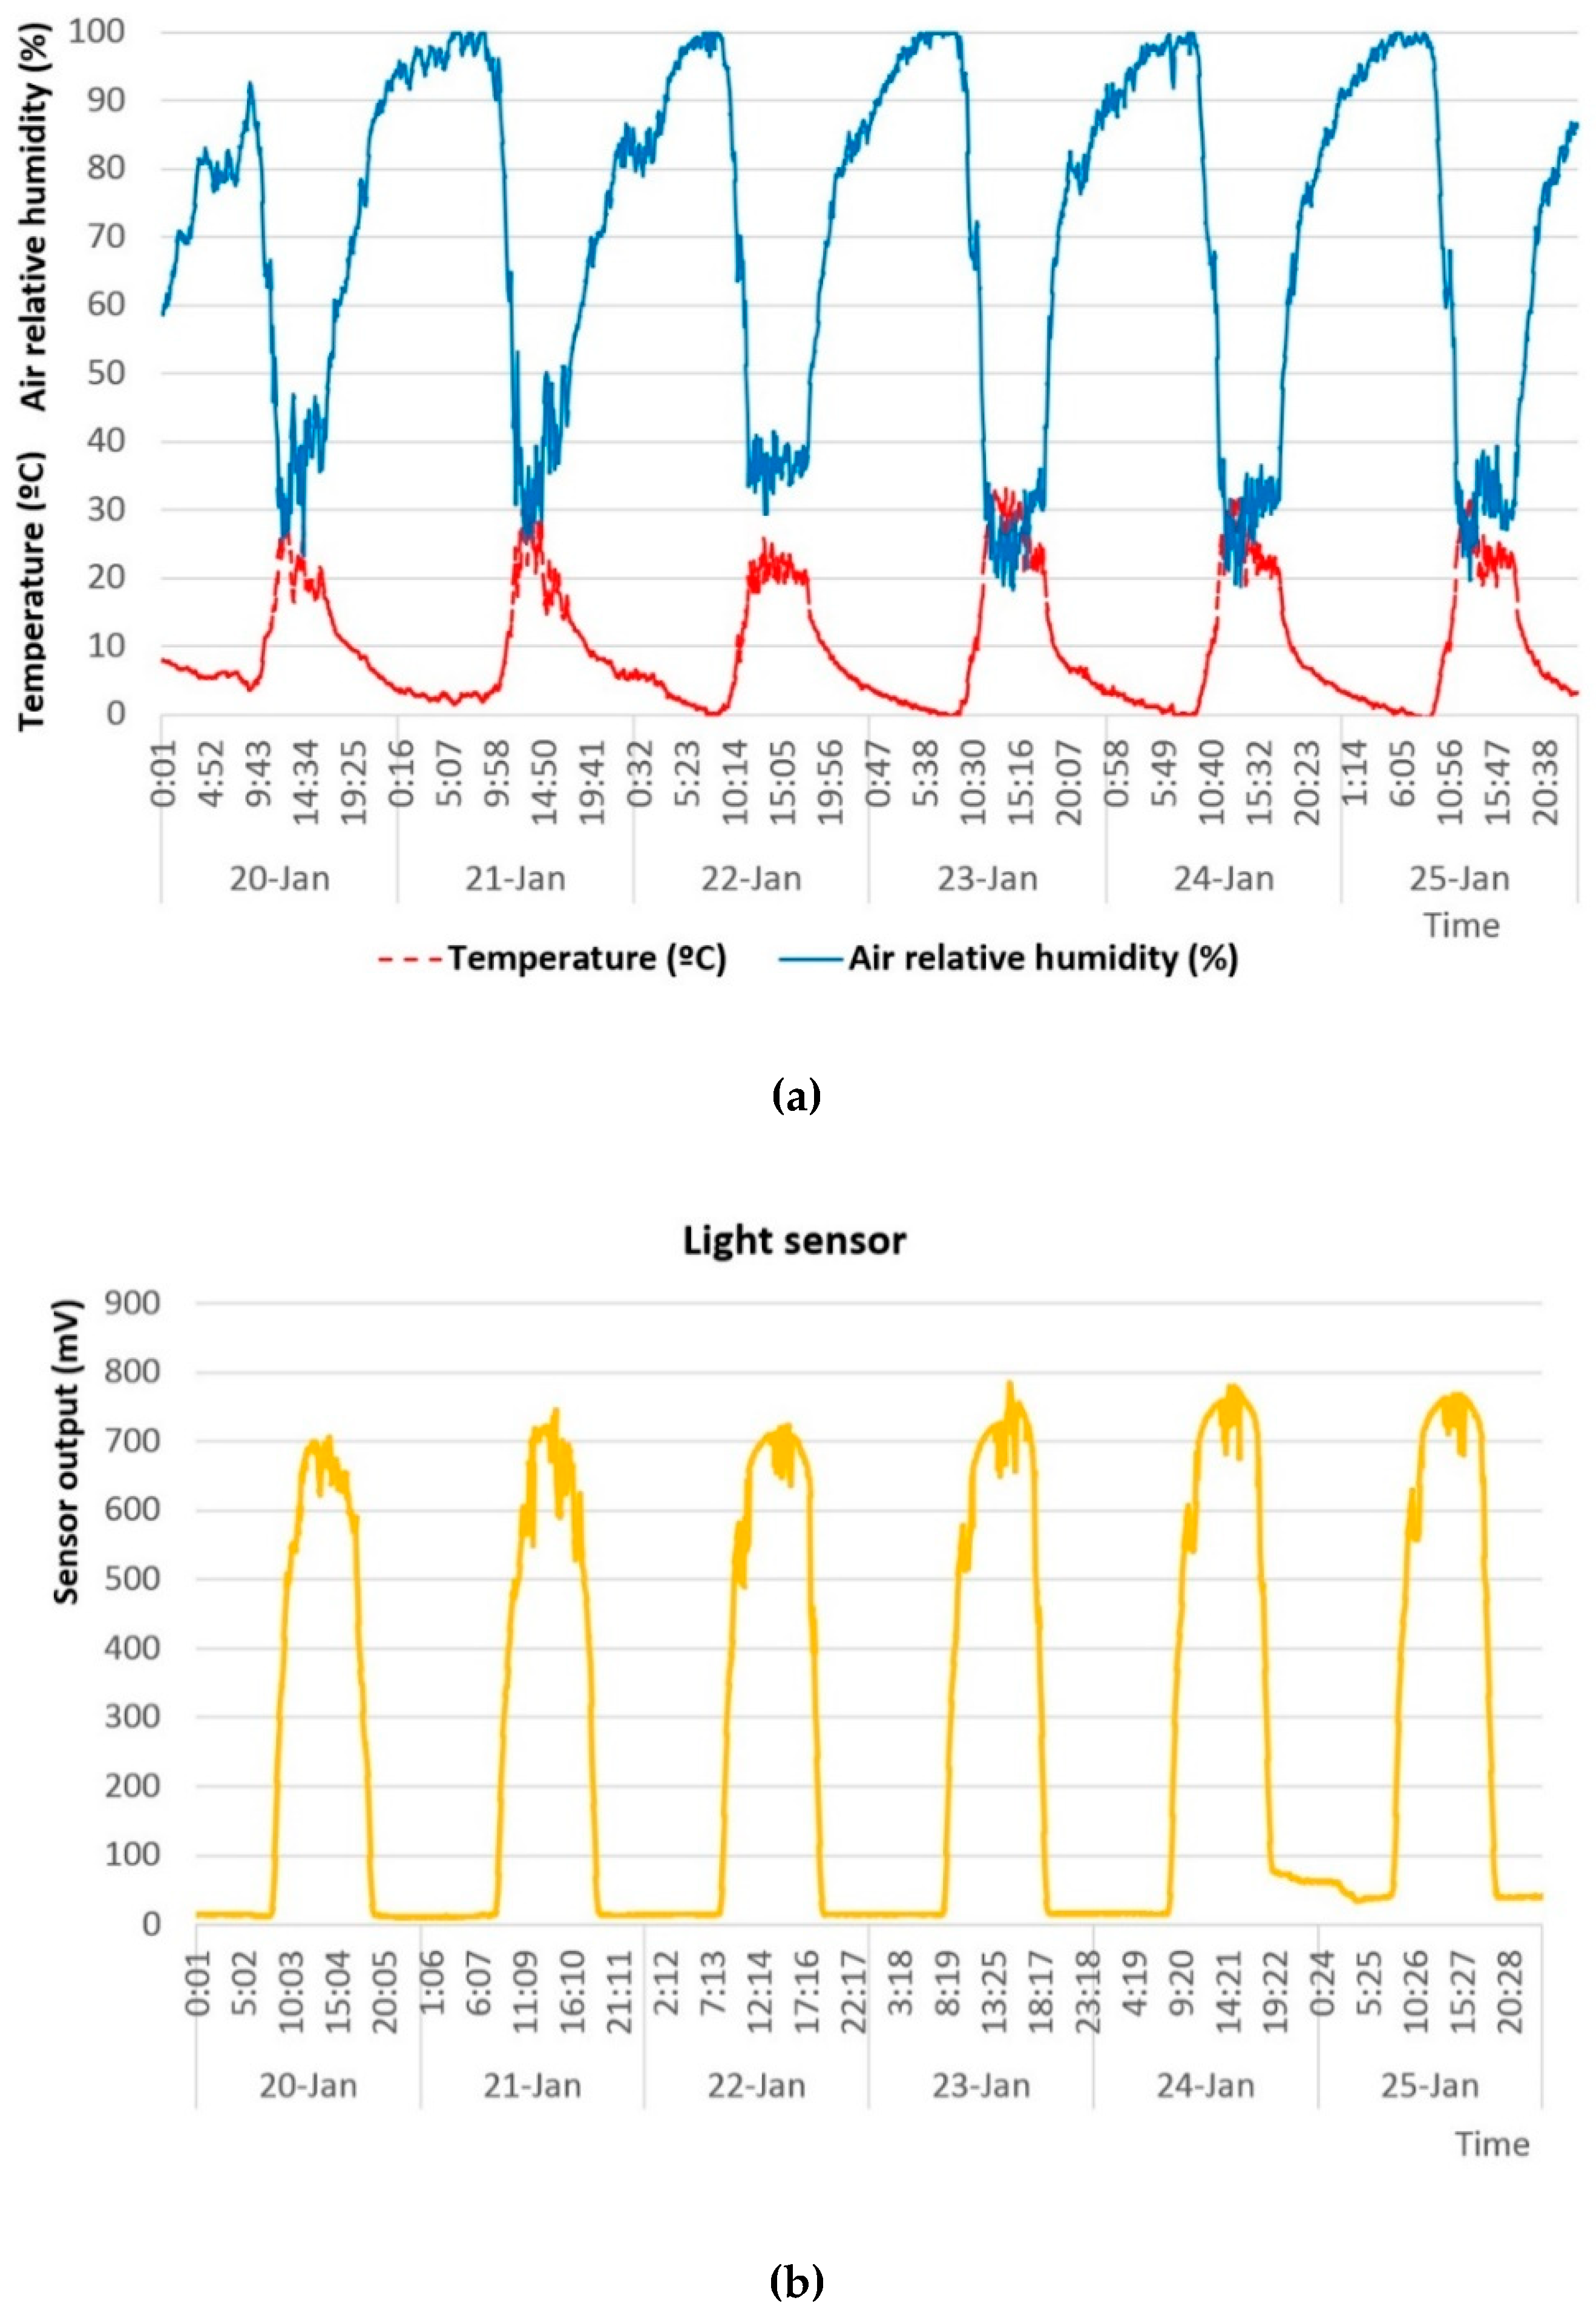
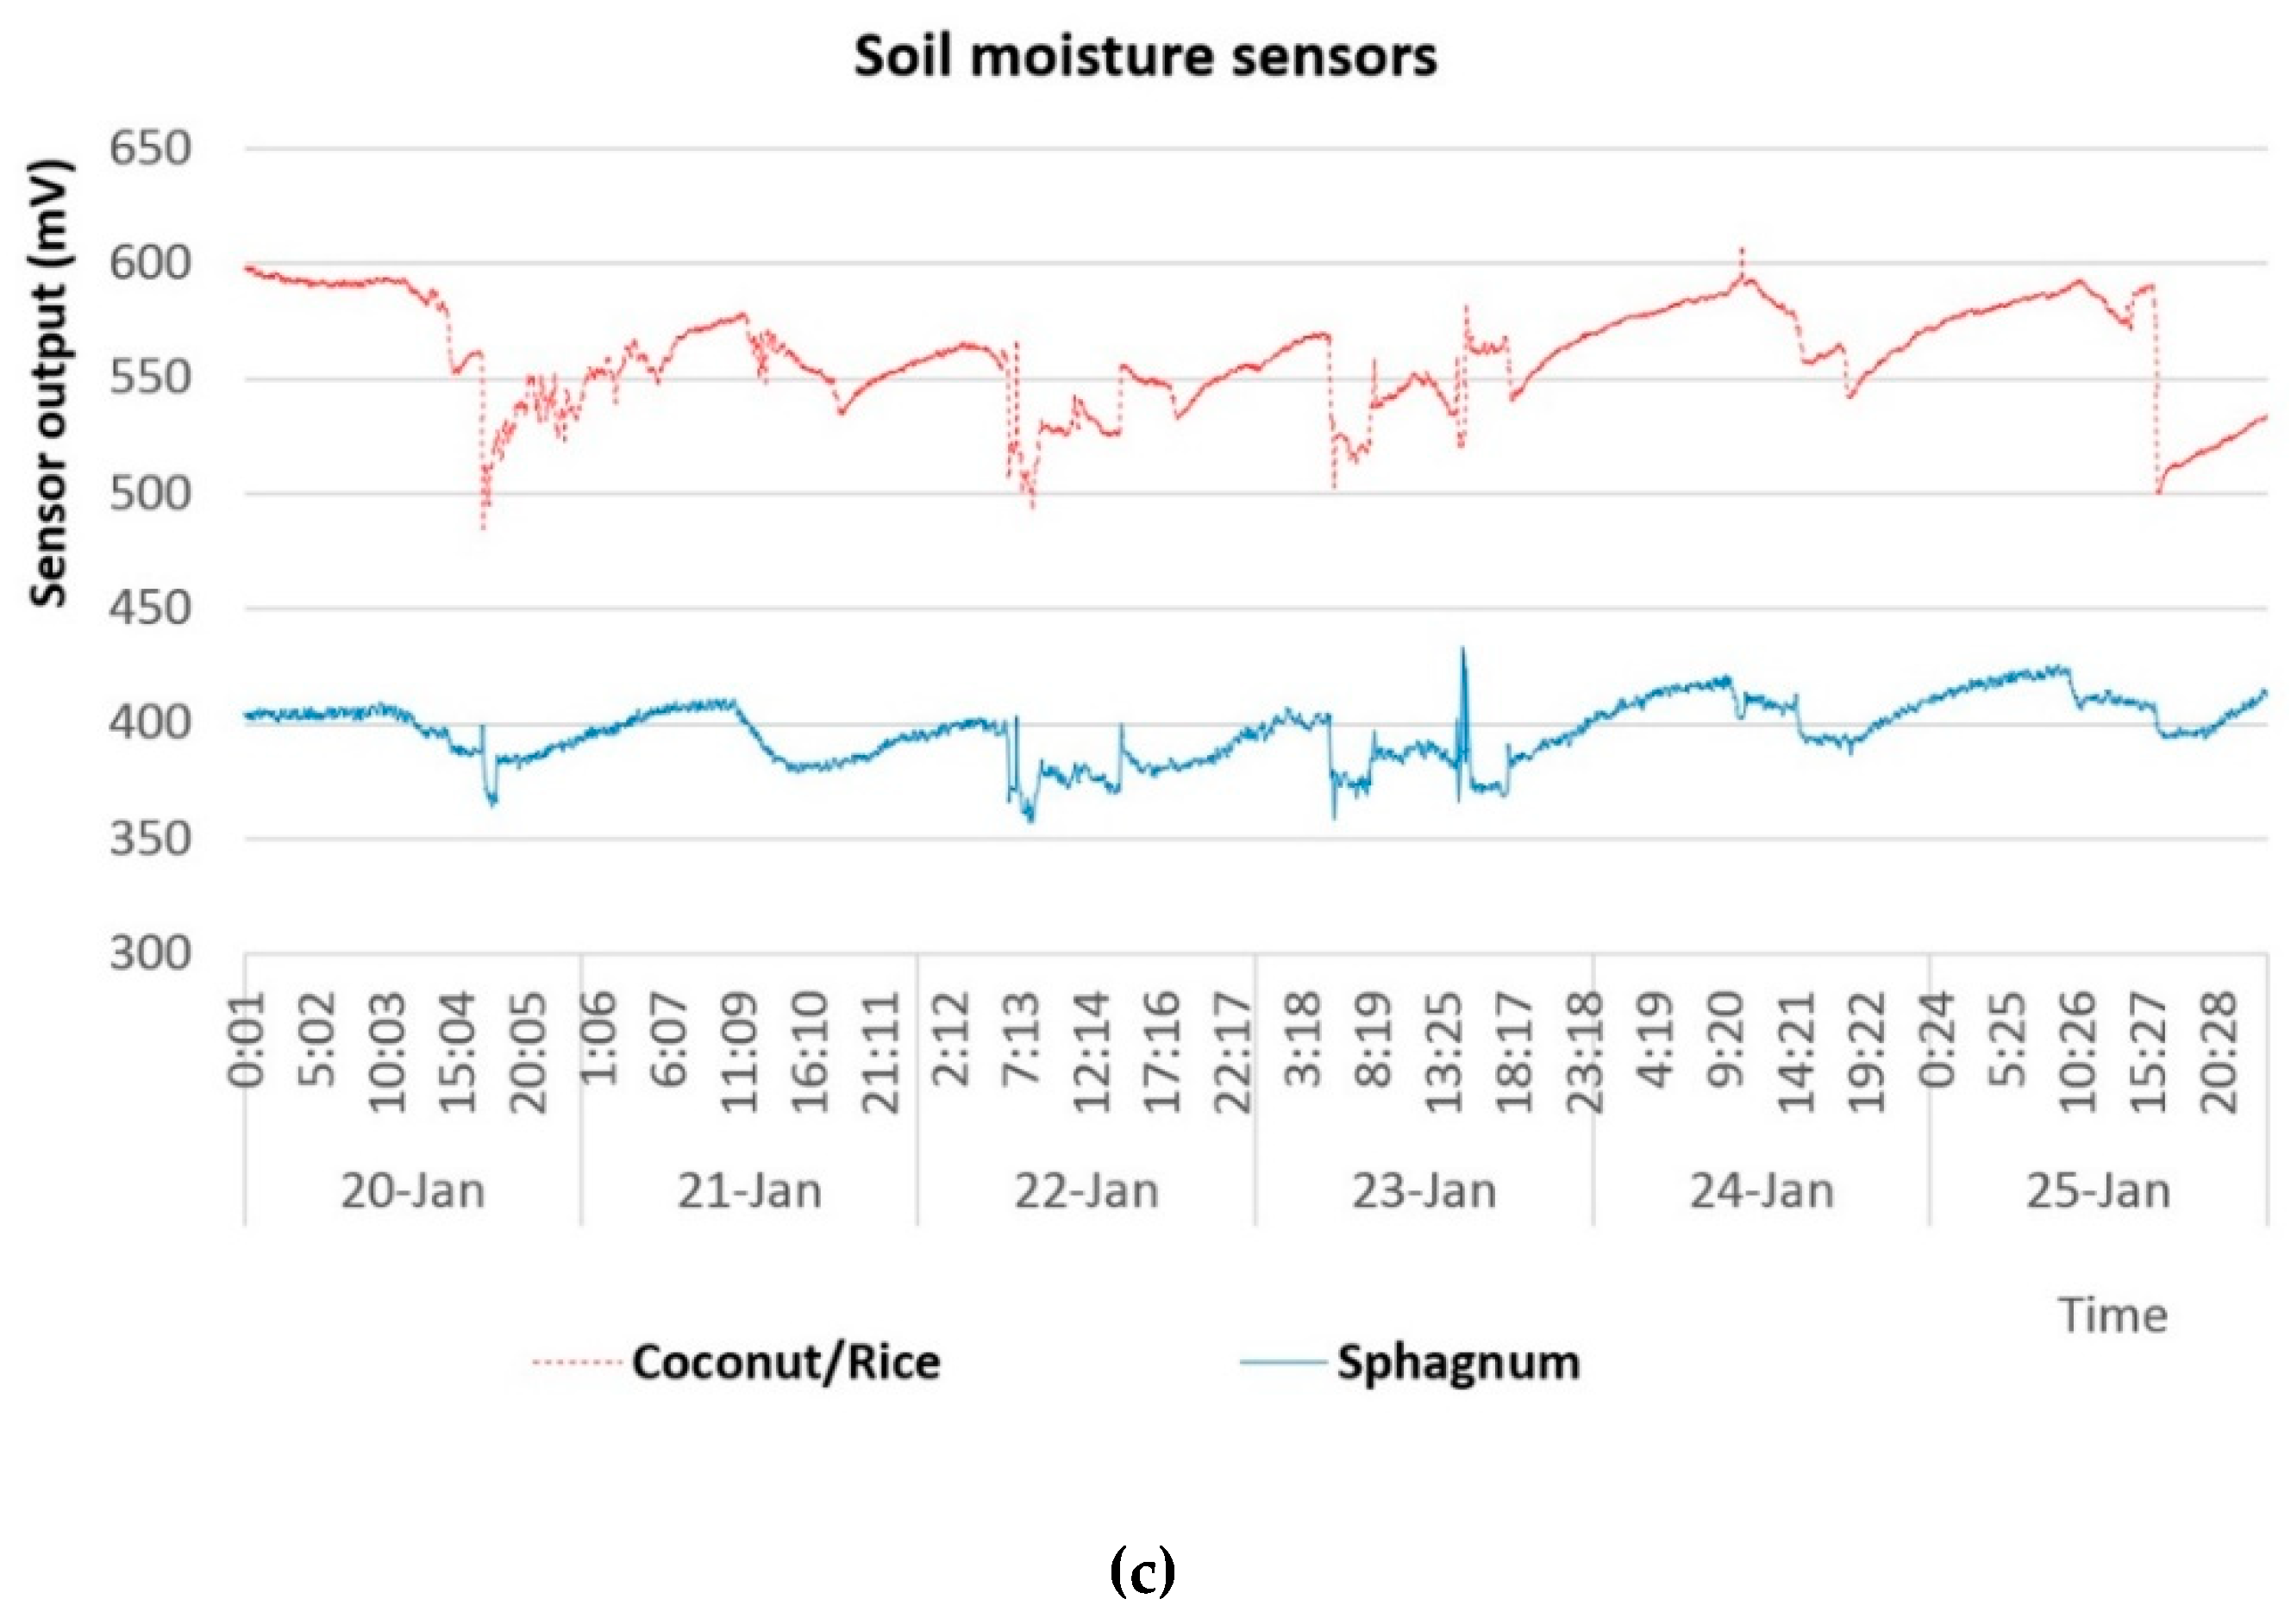
The Figure 9 shows the evolution of the readings taken during several consecutive days by the sensors of temperature and relative humidity of the air, humidity of the soil and precipitation. As can be seen, the outputs correspond to the expected responses of the sensors, that is, maximum values of humidity of the air in hours in which the temperature reaches its minimum, maximum readings of light at noon, as well as the fluctuations of the humidity of the substrate in response to the irrigation.
As a fundamental part of the irrigation management in the green wall, it was tried to maintain the humidity of the substrates around a certain value in order that the plants developed in them could grow without problems. In the case of the coconut coir/rice husk substrate, with more draining characteristics, it was tried to maintain values within the range 500–600 mV, while for the sphagnum, material with greater capacity of water retention, the used interval was 370–450 mV.
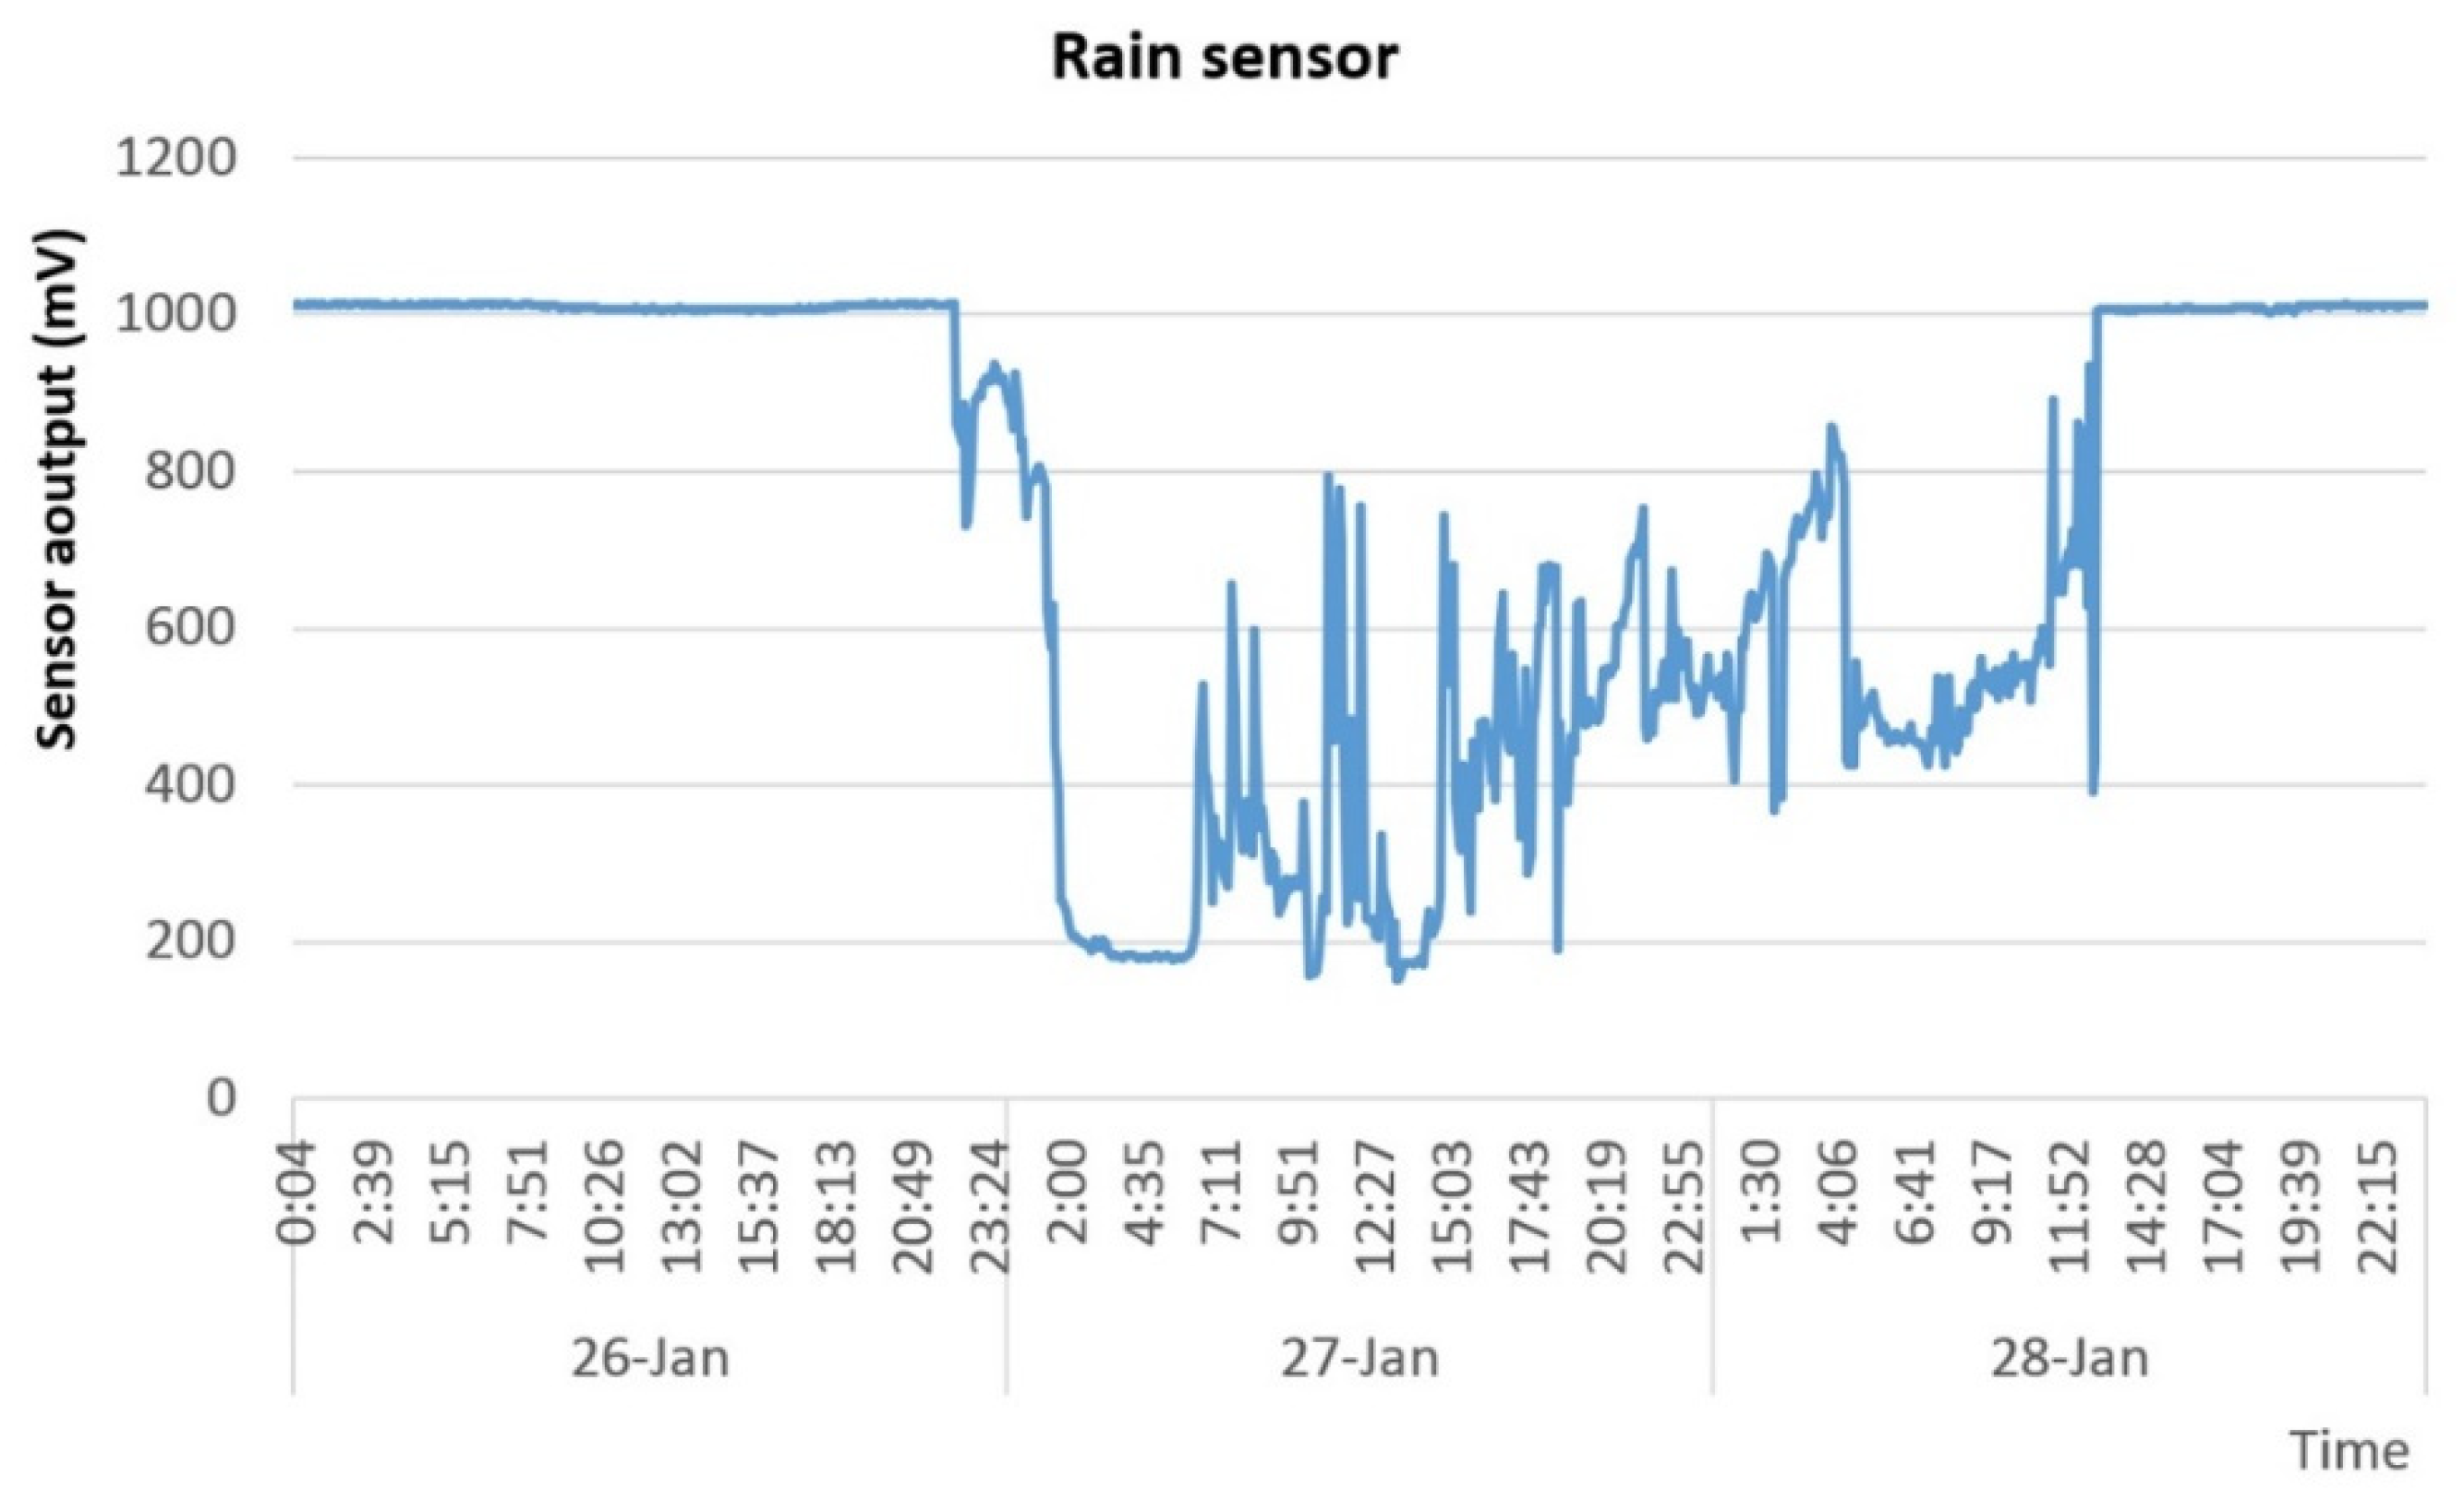
The Figure 10 show the data measured by the rain sensor during a rainfall recorded on January 26 to 28 in which 17.2 L/m2 were collected according to the weather station located in the vicinity (37°51′25″ N, 04°48′10″ W).
Finally, the Figure 11 shows the measured moisture values in of the substrates together with the values obtained by the rain sensor, as well as those measured by the water flow sensor during several consecutive days in which two rain events were produced.
As can be observed, as a consequence of the precipitation produced during the 23rd and 24th of February, the moisture content of the substrates is equalized, re-separating after the cessation of the rain, due to the maintenance of the irrigation strategy established. However, on March 3, after another rainy event, the moisture values of the substrates are again equalized. At the same time, the water contained in them is drained, being able to observe how the substrate formed by coconut coir and rice husk, being more draining, produces more runoff, while the volume of water drained by the sphagnum is significantly lower.
The main contributions of our work have been to use different types of sensors to control an automatic irrigation system. While other authors, such as [4,24], have only used soil moisture sensors, in our case we also used the rain sensor for the irrigation, as well as the storage in a microprocessor. Also, while other authors such as [3,12,24,28], have used storage in SD cards or just direct delivery to web pages, in our case we used our own storage system as a relational database management system MYSQL, to have a better and more storage of data for its later analysis. Also, the project uses a web easy to understand for the user which graphs in real time the data. Finally, the system was applied in green walls which is a system of difficult access because of their location, giving a new use to the system of sensors of low cost.
The total cost of the irrigation system and the database was about €58 (See Table 2), making it less expensive compared to commercial components like the system used in the prototype, which are around €200 without an Internet connection or approximately €400 with one. Field installations require other essential equipment such as plastic tubing, Ethernet cable, a weatherproof electric cabinet and clamps. These costs (which together, on average, come to under €50) are not listed in detail as different materials can be purchased depending on size requirements and the estimated development timeline of the green wall.
5. Conclusions
In this experiment, the Arduino microcontroller was used for very specialized applications that were adapted to the we need ins this project, enabling constant monitoring of environmental parameters, such as temperature, relative humidity, hours of sunlight, soil moisture, and flow of water, to ensure ideal conditions for the green wall.
Choosing low-cost equipment does not mean reducing measurement costs per se; rather, it means that a greater data density is achieved for the same value as a high-quality sensor. As a result, showed in our experiment, the space-time variability of the green-wall development and processes can be better covered.
Given that the prototype is located at the university, a cable connection is used, though as a general guideline. We suggest implementing a wireless system, for future research orientations. In this way, Wi-Fi or GSM systems can be installed in different places where there is no access to wired internet, and more sensors can be added covering more extensive areas to have a more localized control of irrigation.
Our experiment can be applied to any environmental control system, with precision irrigation being one of the most important since it improves the management of water resources in areas with little water.
The existing setup can be expanded in several ways: it is possible to add new sensors like CO2, barometric pressure, conductivity “nutrients,” water temperature, soil temperature sensors, communication modules, etc; at the same time, users can decide how the information will be stored or transmitted; they can also set up the Raspberry Pi to store and transmit information considering a specific time interval and also select the accuracy of data. Therefore, the solution could be adapted to another’s environmental projects.
Individual users like researchers and farmers could use this system, collecting in-field data to improve their production in another’s areas like agriculture or technologies like living walls and share data with their professional advisors. Likewise, government agencies could use the system to monitor the environmental parameters and influences.
Author Contributions
Conceptualization, Y.A.R.-S.; Methodology, Y.A.R.-S., M.F.M.-P. and J.R.-C.; Software, Y.A.R.-S.; Validation, Y.A.R.-S., M.F.M.-P. and J.R.-C.; Formal Analysis, Y.A.R.-S., M.F.M.-P. and J.R.-C.; Investigation, Y.A.R.-S., MM.F.M.-P. and J.R.-C.; Resources, M.F.M.-P.; Data Curation, Y.A.R.-S. and M.F.M.-P.; Writing-Original Draft Preparation, Y.A.R.-S., M.F.M.-P. and J.R.-C.; Writing-Review & Editing, Y.A.R.-S., M.F.M.-P. and J.R.-C.; Visualization, M.F.M.-P.; Supervision, J.R.-C.; Project Administration, M.F.M.-P.; Funding Acquisition, J.R.-C.
Funding
This research is supported with funds from the research line “Sustainability of Natural Resources” integrated in the Doctoral Program “Natural Resources and Sustainable Management” of the University of Córdoba.
Acknowledgments
The campus of Rabanales of the University of Córdoba is acknowledged for the facilities given to carry out the experimentation.
Conflicts of Interest
The authors declare no conflict of interest.
Appendix A
Figure A1.
Real-time display of the green wall from the mobile application (APP) on a mobile device.
Figure A1.
Real-time display of the green wall from the mobile application (APP) on a mobile device.

Figure A2.
Web visualization in ThingSpeak.

Figure A3.
Database display of the green-wall prototype from the computer.

References
- Bussi, G.; Janes, V.; Whitehead, P.; Dadson, S.; Holman, I. Dynamic response of land use and river nutrient concentration to long-term climatic changes. Sci. Total Environ. 2017, 590–591, 818–831. [Google Scholar] [CrossRef] [PubMed]
- Sathiesh Kumar, V.; Gogul, I.; Deepan Raj, M.; Pragadesh, S.K.; Sarathkumar Sebastin, J. Smart Autonomous Gardening Rover with Plant Recognition using Neural Networks. Procedia Comput. Sci. 2016, 93, 975–981. [Google Scholar] [CrossRef]
- Groener, B.; Knopp, N.; Korgan, K.; Perry, R.; Romero, J.; Smith, K.; Stainback, A.; Strzelczyk, A.; Henriques, J. Preliminary Design of a Low-Cost Greenhouse with Open Source Control Systems. Procedia Eng. 2015, 107, 470–479. [Google Scholar] [CrossRef]
- Oates, M.J.; Fernández-López, A.; Ferrández-Villena, M.; Ruiz-Canales, A. Temperature compensation in a low-cost frequency domain (capacitance based) soil moisture sensor. Agric. Water Manag. 2017, 183, 86–93. [Google Scholar] [CrossRef]
- Thalheimer, M. A low-cost electronic tensiometer system for continuous monitoring of soil water potential. J. Agric. Eng. 2013, 44. [Google Scholar] [CrossRef]
- Scudiero, E.; Berti, A.; Teatini, P.; Morari, F. Simultaneous monitoring of soil water content and salinity with a low-cost capacitance-resistance probe. Sensors 2012, 12, 17588–17607. [Google Scholar] [CrossRef] [PubMed]
- Hubbart, J.; Link, T.; Campbell, C.; Cobos, D. Evaluation of a low-cost temperature measurement system for environmental applications. Hydrol. Process 2005, 19, 1517–1523. [Google Scholar] [CrossRef]
- Jayaraman, P.; Yavari, A.; Georgakopoulos, D.; Morshed, A.; Zaslavsky, A. Internet of Things Platform for Smart Farming: Experiences and Lessons Learnt. Sensors 2006, 16, 1884. [Google Scholar] [CrossRef]
- Garcia-Sánchez, F.; Garcia-Haro, J. Wireless sensor network deployment for integrating video-surveillance and data-monitoring in precision agriculture over distributed crops. Comput. Electron. Agric. 2011, 75, 288–303. [Google Scholar] [CrossRef]
- Ruiz-Garcia, L.; Lunadei, L.; Barreiro, P.; Robla, I. A review of wireless sensor technologies and applications in agriculture and food industry: State of the art and current trends. Sensors 2009, 9, 4728–4750. [Google Scholar] [CrossRef]
- Pierce, F.J.; Elliott, T.V. Regional and on-farm wireless sensor networks for agricultural systems in Eastern Washington. Comput. Electron. Agric. 2008, 61, 32–43. [Google Scholar] [CrossRef]
- Fisher, D.K. Open-Source Hardware Is a Low-Cost Alternative for Scientific Instrumentation and Research. Mod. Instrum. 2012, 1, 8–20. [Google Scholar] [CrossRef]
- Artero, T.O. El Mundo Genuino-Arduino: Curso Práctico de Formación; RC libros: Madrid, Spain, 2016; p. 566. [Google Scholar]
- Banzi, M.; Shiloh, M. Introducción a Arduino; O’Reilly media-Grupo Anaya s.a.: Madrid, Spain, 2016; p. 128. [Google Scholar]
- Ray, P. A survey on Internet of Things architectures. J. King Saud Univ. Sci. Comput. Inf. Sci. 2018, 30, 291–319. [Google Scholar] [CrossRef] [Green Version]
- Tanenbaum, J.; Williams, A. Democratizing technology: Pleasure, utility and expressiveness in DIY and maker practice. In Proceedings of the SIGCHI Conference on Human Factors in Computing Systems, Paris, France, 27 April–2 May 2013; pp. 2603–2612. [Google Scholar]
- Monk, S. Raspberry Pi 200 Ejercicios Prácticos Problemas y Soluciones de Hardware y Software; O’Reilly Media—Grupo Anaya, s.a.: Madrid, Spain, 2015; p. 415. [Google Scholar]
- Ávila, A.R. Manual de Riego de Jardines; Junta de Andalucía—Consejería de Agricultura y Pesca: Sevilla, Spain, 2004; pp. 233–246.
- Blum, J. Arduino a Fondo; Wiley-Grupo Anaya, s.a.: Madrid, Spain, 2014; p. 352. [Google Scholar]
- Calaza, G.T. Taller de Arduino: Un Enfoque Práctico Para Principiantes; Marcombo s.a.: Barcelona, Spain, 2014; p. 376. [Google Scholar]
- Hertzog, P.; Swart, A.J. The Use of an Innovative Jig to Stimulate Awareness of Sustainable Technologies among Freshman Engineering Students. Sustainability 2015, 7, 9100–9117. [Google Scholar] [CrossRef] [Green Version]
- Dennis, A.K. Raspberry Pi Home Automation with Arduino; Packt Publishing: Birmingham, UK, 2013; p. 176. [Google Scholar]
- Golden, R. Raspberry Pi Networking Cookbook; Packt Publishing: Birmingham, UK, 2013; p. 204. [Google Scholar]
- Bajer, L.; Krejcar, O. Design and Realization of Low Cost Control for Greenhouse Environment with Remote Control. IFAC-Pap. OnLine 2015, 48, 368–373. [Google Scholar] [CrossRef]
- Czarnomski, N.G.; Moore, T.; Pypker, J.; Licata, B. Precision and accuracy of three alternative instruments for measuring soil water content in two forest soils of the Pacific Northwest. Can. J. For. Res. 2005, 35, 1867–1876. [Google Scholar] [CrossRef]
- Starr, J.L.; Paltineanu, I.C. Methods for Measurement of Soil Water Content: Capacitance Devices. Soil Sci. Soc. Am. J. 2002, 4, 463–474. [Google Scholar]
- Laskar, M.R.; Bhattacharjee, R.; Sau Giri, M.; Bhattacharya, P. Weather Forecasting using Arduino Based Cube-Sat. Procedia Comput. Sci. 2016, 89, 320–323. [Google Scholar] [CrossRef]
- Bitella, G.; Rossi, R.; Bochicchio, R.; Perniola, M.; Amato, M. A Novel Low-Cost Open-Hardware Platform for Monitoring Soil Water Content and Multiple Soil-Air-Vegetation Parameters. Sensors 2014, 14, 19639–19659. [Google Scholar] [CrossRef]
- Mohanraj, I.; Ashokumar, K.; Naren, J. Field Monitoring and Automation using IOT in Agriculture Domain. Procedia Comput. Sci. 2016, 93, 931–939. [Google Scholar] [CrossRef]
- Ceballos, M.C.; Gorricho, J.L.; Gamboa, O.P.; Huerta, M.K.; Rivas, D.; Rodas, M.E. Fuzzy System of Irrigation Applied to the Growth of Habanero Pepper (Capsicum chinense Jacq.) under Protected Conditions in Yucatan Mexico. Int. J. Distrib. Sens. Netw. 2015, 13. [Google Scholar] [CrossRef]
- Ripoll, A.; Viana, M.; Padrosa, M.; Querol, X.; Minutolo, A.; Hou, K.M.; Barcelo-Ordinas, J.M.; Garcia-Vidal, J. Testing the performance of sensors for ozone pollution monitoring in a citizen science approach. Sci. Total Environ. 2019, 651, 1166–1179. [Google Scholar] [CrossRef] [PubMed]
- Oxer, J.; Blemings, H. Practical Arduino: Cool Projects for Open Source Hardware; Technology in Action: New York, NY, USA, 2010; p. 445. [Google Scholar]
- Jiménez-Carvajal, C.; Ruiz-Penalver, L.; Vera-Repullo, J.A.; Jiménez-Buendía, M.; Antolino-Merino, A.; Molina-Martínez, J.M. Weighing lysimetric system for the determination of the water balance during irrigation in potted plants. Agric. Water Manag. 2017, 183, 78–85. [Google Scholar] [CrossRef]
- Srbinovska, M.; Gavrovski, C.; Dimcev, V.; Krkoleva, A.; Borozan, V. Environmental parameters monitoring in precision agriculture using wireless sensor networks. J. Clean. Prod. 2015, 88, 297–307. [Google Scholar] [CrossRef]
Figure 1.
Layout of the green walls.

Figure 2.
Layout of the Environmental Control System for green walls.

Figure 3.
(a) FC-28 soil moisture sensor; (b) Schematic sensor design.

Figure 4.
(a) DHT22 temperature and relative humidity sensor; (b) Schematic sensor design.

Figure 5.
(a) Light dependent resistor (LDR) photo-resistor; (b) Schematic sensor design.

Figure 6.
(a) YL-83 rain sensor; (b) Schematic sensor design.

Figure 7.
(a) YF-S402 water flow sensor; (b) Schematic sensor design.

Figure 8.
Flux diagram of the pump control.

Figure 9.
Sensor data of (a) temperature and relative humidity, (b) light, and (c) soil moisture.


Figure 10.
Sensor output of rain.

Figure 11.
Sensor data of (a) soil moisture and rain and (b) water flow.


Table 1.
Water flow sensor calibration tests.
| Test No. | Volume | Pulses |
|---|---|---|
| 1 | 500 mL | 422 |
| 2 | 500 mL | 430 |
| 3 | 500 mL | 427 |
| 4 | 1000 mL | 840 |
| 5 | 1000 mL | 854 |
| 6 | 1000 mL | 845 |
Table 2.
Alternative irrigation system prices.
| Sensors | Measurement | Use | Cost (€) |
|---|---|---|---|
| Arduino | Microcontroller | Control sensors | 12 |
| Shield | Arduino extension | Internet connection | 12 |
| DHT22 | Humidity and relative air temperature sensor | Agronomic and irrigation | 3 |
| YL-83 | Rain sensor | Agronomic and irrigation | 2 |
| FC-28 | Soil moisture sensor | Hydrology, soil physics, irrigation and agronomics | 8 |
| Photo-resistor | Light intensity | Agronomics, plant growth and phenology | 1 |
| YF-s402 | Hall flow sensor | Agronomics, hydrology and irrigation | 5 |
| Raspberry pi | Microprocessor | Data processing | 15 |
| TOTAL | 58 |
© 2019 by the authors. Licensee MDPI, Basel, Switzerland. This article is an open access article distributed under the terms and conditions of the Creative Commons Attribution (CC BY) license (http://creativecommons.org/licenses/by/4.0/).
Share and Cite
MDPI and ACS Style
Rivas-Sánchez, Y.A.; Moreno-Pérez, M.F.; Roldán-Cañas, J. Environment Control with Low-Cost Microcontrollers and Microprocessors: Application for Green Walls. Sustainability 2019, 11, 782. https://doi.org/10.3390/su11030782
AMA Style
Rivas-Sánchez YA, Moreno-Pérez MF, Roldán-Cañas J. Environment Control with Low-Cost Microcontrollers and Microprocessors: Application for Green Walls. Sustainability. 2019; 11(3):782. https://doi.org/10.3390/su11030782
Chicago/Turabian StyleRivas-Sánchez, Yair Andrey, María Fátima Moreno-Pérez, and José Roldán-Cañas. 2019. "Environment Control with Low-Cost Microcontrollers and Microprocessors: Application for Green Walls" Sustainability 11, no. 3: 782. https://doi.org/10.3390/su11030782
Note that from the first issue of 2016, this journal uses article numbers instead of page numbers. See further details here.