Rzeszow as a City Taking Steps Towards Developing Sustainable Public Transport


Faculty of Management, Rzeszow University of Technology, al. Powstancow Warszawy 10, 35-959 Rzeszow, Poland
*
Author to whom correspondence should be addressed.
Sustainability 2019, 11(2), 402; https://doi.org/10.3390/su11020402
Submission received: 9 December 2018
/
Revised: 3 January 2019
/
Accepted: 10 January 2019
/
Published: 15 January 2019
(This article belongs to the Special Issue Multi-Objective and Multi-Attribute Optimisation for Sustainable Development Decision Aiding)
Abstract
:The paper discusses problems related to the functioning of passenger transport in Rzeszow. The dynamic development of the city and the increase in the income of its inhabitants have led to significantly increased traffic within the city, which is detrimental both to the environment and the city’s inhabitants. It limits the quality of life in the city and in the end generates additional costs for businesses and people in urban areas due to the congestion. In compliance with the policies of the European Union, this harmful tendency needs to be limited. Developing sustainable transportation should largely contribute to this objective. With the city of Rzeszow as example, this article discusses selected actions and measures taken as part of the development of sustainable transportation and demonstrates changes in the functioning of public transport based on the author’s own research as well as data provided by the city’s authorities. The analyses show that the actions taken so far have had a positive impact.
1. Introduction
The transportation need is understood as a need to move from a starting point to a target point, within a strictly specified period of time. Problems associated with the transport of people and their mobility are especially significant within the territory of cities.
Around 70% of the European Union’s (EU) population live in cities and generate around 80% of the Union’s GDP [1]. Mobility in cities is, however, becoming more difficult and less efficient, as it is still largely based on the use of conventional private vehicles. These vehicles are a source of many harmful effects that generate additional costs and losses in several fields [2,3,4,5,6]. The most important harmful effects include: congestion, accidents, noise, air pollution, climate change and the use and deterioration of the transport and urban infrastructure [7,8,9]. According to European Union guidelines, cities must intensify their efforts to reverse unfavourable tendencies in the use of fuel and the emission of toxic elements [10,11,12]. The goal of these efforts should be reaching a 60% reduction in the emission of greenhouse gases. Due to the high density of populations in cities and the high level of traffic, a public transport system is the preferred solution for short routes [13,14,15,16,17,18]. It gives greater opportunities with respect to reducing the total emission of toxic components in the city, as compared to traffic consisting mostly of passenger cars equipped with conventional drive systems. The EU provisions concerning air quality and the increasingly stricter emission standards for road vehicles aim to ensure that city inhabitants are not exposed to the harmful effects of air pollution and particulate matter. However, almost all cities in the EU Member States still struggle to satisfy the requirements [19]. The natural environment should be exploited in a way which ensures that future generations will be able to exploit it as well [20,21]. In accordance with the principles of sustainable development, transportation should also have as small an impact on the environment as possible. Many European cities are taking steps towards achieving that goal [22,23,24,25,26,27,28].
One of the main aims of this study is to present the steps taken to reverse the unfavourable traffic trends and to make public transport more significant, with Rzeszow, a Polish medium-size urban area, being one such example. All steps taken by the city’s authorities are in line with the philosophy of developing sustainable transport, one of the premises of which is to minimise the human impact on the environment.
This article comprises seven sections. The first serves as an introduction to the study’s subject matter. The second sets forth the threats arising from road traffic. The third presents features of the city. The fourth describes in detail the public transport system in the city and the side effects of the growing number of vehicles and increasing traffic. The fifth delineates some of the courses of action taken by the city’s authorities with the aim of developing sustainable transport, the sixth shows the achieved and expected results of implementing the actions suggested and the seventh is a conclusion.
2. Research Methodology
The operation of urban transport in the city has a major impact on the comfort and quality of life, the efficiency of the operation of the urban organism and the economic management of energy sources. In many cases, striving to improve selected indicators may lead to deterioration of other important properties. Closing or very significant limitation of vehicle traffic in a given area may contribute to the depopulation and change of the nature of a given area. In the undertaken activities, it is necessary to achieve a certain compromise and the factors—parameters affecting the transport system must be contained in certain permissible areas of variation.
Due to many factors subject to change and occurrence of limitations, the solution to this problem is similar to the solution of the multicriteria optimization task, under which the objective function is optimized, taking into account such features as: quality and comfort of life, safety and efficiency of the urban organism.
All research work related to the assessment of the operation and determining the direction of changes for the considered Polish city must take into account the state and scope of operation of transport systems in cities of similar size. Comparing the operation of urban transport in small cities, for example, in the range of population 50,000–100,000 with cities larger than 1 million inhabitants, it makes no sense. In each of these groups the scale of problems differs and system solutions in the area of urban transport are different. Considering groups of cities of similar size, it is possible to determine the acceptable range of changes of selected parameters and indicate potential directions of action. The direction of these activities can be determined on the basis of analysis of solutions in the field of urban transport in cities located in countries with a high degree of economic development and a high level of ecological awareness as a role model. A group of such cities includes cities from countries such as Sweden, Norway, Germany, the Netherlands and Denmark. Due to the number of inhabitants of the city under consideration Rzeszow, a group of EU cities with a population between 150–250 thousand inhabitants was selected for analysis. On the basis of 93 EU cities specified in Reference [29], the areas of variability of parameters characterizing the shares of particular forms of urban transport were determined. In 10 cities with the highest share of public transport from 32 to 63%, only one city is in Spain, a country that is an old EU member. In terms of share of individual transport, the top 10 countries are dominated by the old EU. The share of individual transport amounts from 63 to 83% there. In this group there are no cities from the aforementioned countries with a high level of economic development and high ecological awareness. Considering the share of bicycle trips in the number of completed trips in the first 10 are cities from the Netherlands, Denmark and Germany. The share of bicycle trips is from 22 to 40%. In the latter group of cities, the share of individual transport is from 21 to 63%.
Having a specific range of variability of the parameters characterizing the transport system, it is necessary to identify the threats resulting from road transport activities. This was done for road transport and for the selected city. The improvement of the operation of urban transport can be influenced by two groups of factors. These are factors that are technical or organizational—non-technical. Organizational (non-technical) factors include organization of transport routes, frequency of courses, activities aimed at increasing the environmental awareness of inhabitants and tax policy. Technical factors include a construction and development of a traffic control system, information system for travellers, car parks, bus lanes, bicycle paths and investments in ecological and zero-emission means of transport. As part of the example considered, it was examined which of these funds were used in the analysed city and the obtained and potential benefits were determined.
During the research work, the results of own research and available data from specialist literature and the Internet will be used.
3. Threats Arising from Transport
Road transport is one of the pillars of a properly functioning economy. However, it also has a negative influence on the environment. The most important harmful effects of road transport include: congestion, accidents, noise, air pollution, climate change and the use and deterioration of the transport and urban infrastructure.
Petroleum-based fuels are currently the primary fuel for road vehicles. One of the harmful effects of using these fuels is the emission of pollutants into the atmosphere, of which the most significant are carbon monoxide, carbon oxide and NOx nitrogen oxides [30]. Particulate matter also substantially contributes to the pollution levels. Figure 1 shows CO2 emissions from various types of road vehicle between 1990 and 2015, with 1990 as the base year. These data relate to all Member States of the EU. The maximum CO2 emissions were observed between 2006 and 2008 [31].
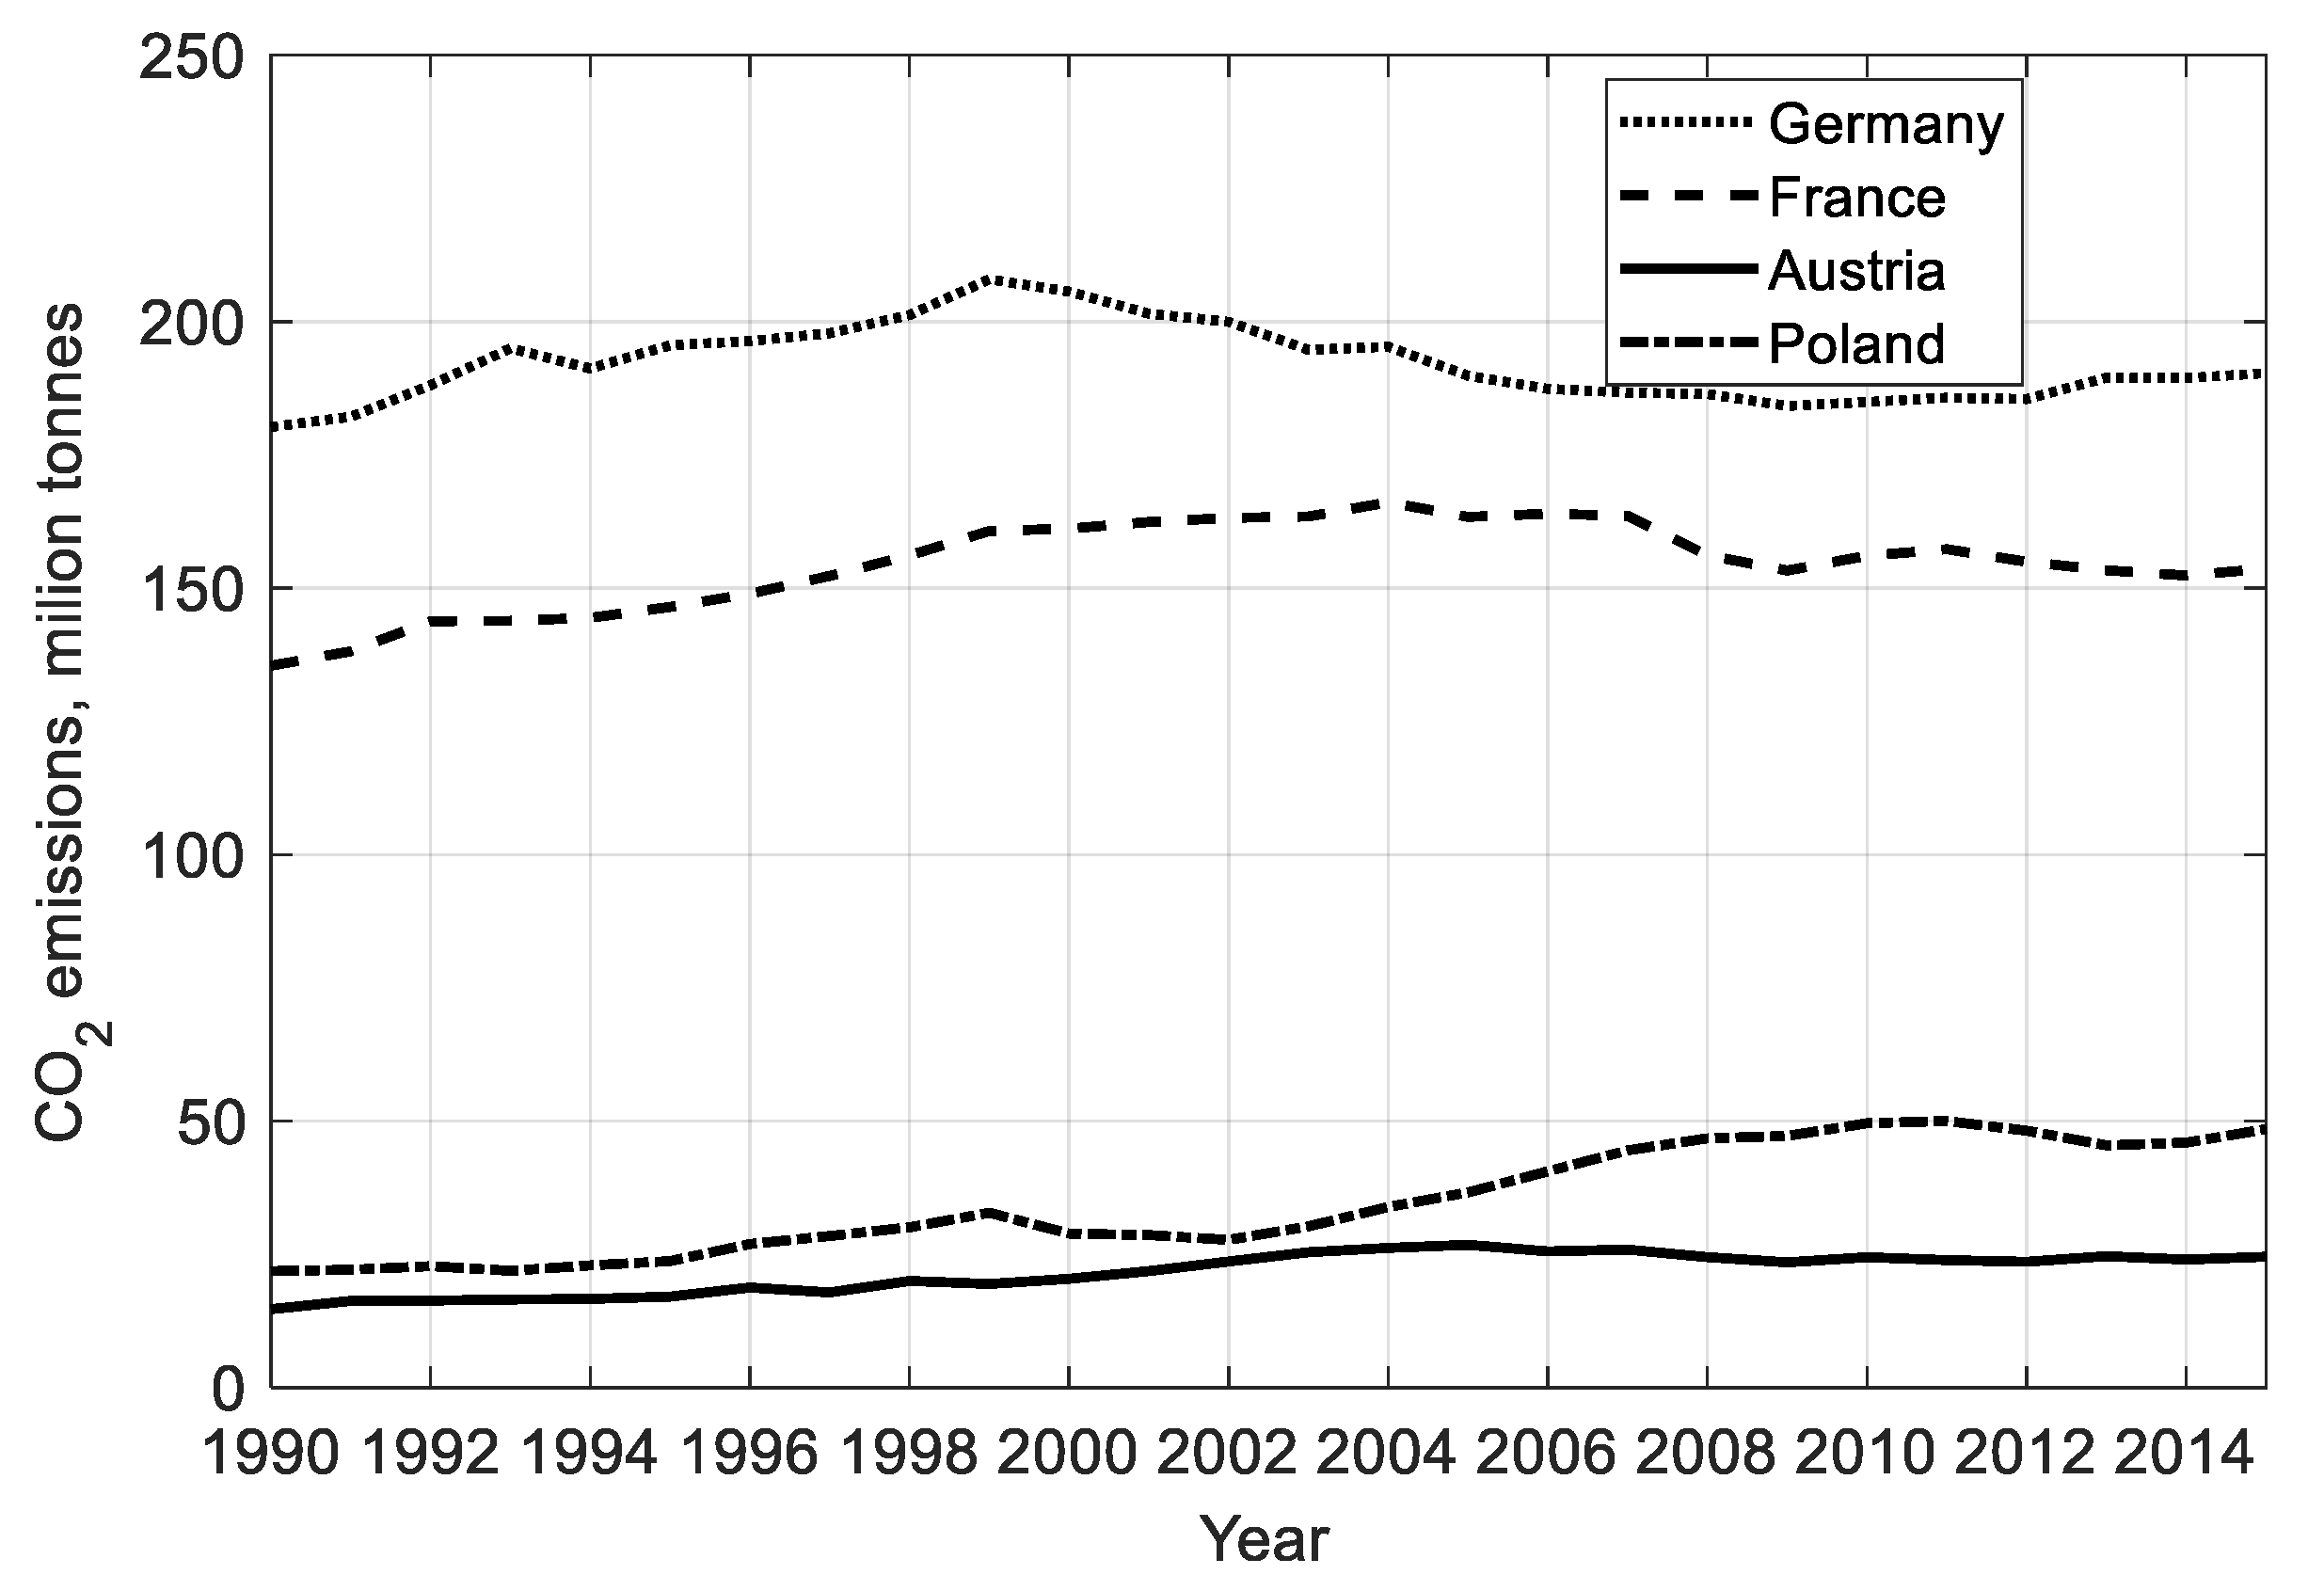
Total CO2 emissions throughout the period differed with respect to individual countries. Those countries achieving high levels of economic development, such as Austria, France or Germany, saw a decrease in CO2 emissions in relation to the maximum values reached in the 2000–2008 period (Figure 2). Countries with intensively developing and catching-up economies, such as Poland, saw a constant increase in CO2 emissions alongside the ongoing economic development. These emissions should stabilise once the countries catch up in terms of economic development.
The harmful impact of CO2 emissions on the environment is particularly hazardous for urban areas. According to EU data, transport contributes to 23% of CO2 emissions within cities. Taking into account the fact that cities are relatively small in terms of their areas, the level of emissions per given unit of area is several times higher than in other areas.
Congestion can be defined as a phenomenon in which road users mutually hinder the traffic flow for their own benefit. It occurs when the capacity of the city’s transport system is pushed to its limits. Congestion results in a decrease in speed or a complete lack of free movement of vehicles and pedestrians. This phenomenon does not take into account such circumstances as accidents or roadworks. Figure 3 schematically shows the traffic flow, taking vehicle saturation into account [3,32]. More detailed information about congestion can be found in works by Börjesson at all [33], Haywood at all [25], Kaddoura at all [34], Mussone at all [35], Prud’homme at all [36]. The curves illustrating vehicle speed as a function of intensity relate to two different roads. For municipal roads, a decrease in speed occurs once the traffic intensity exceeds the level of 1,500 vehicles per hour. For multilane express roads, a decrease in speed can be observed once the traffic intensity exceeds the level of 6000 vehicles per hour. In both cases, once the threshold values indicated by P1 and P2 are reached, there will be a decrease in speed and traffic. Traffic flow may be prevented in extreme cases.
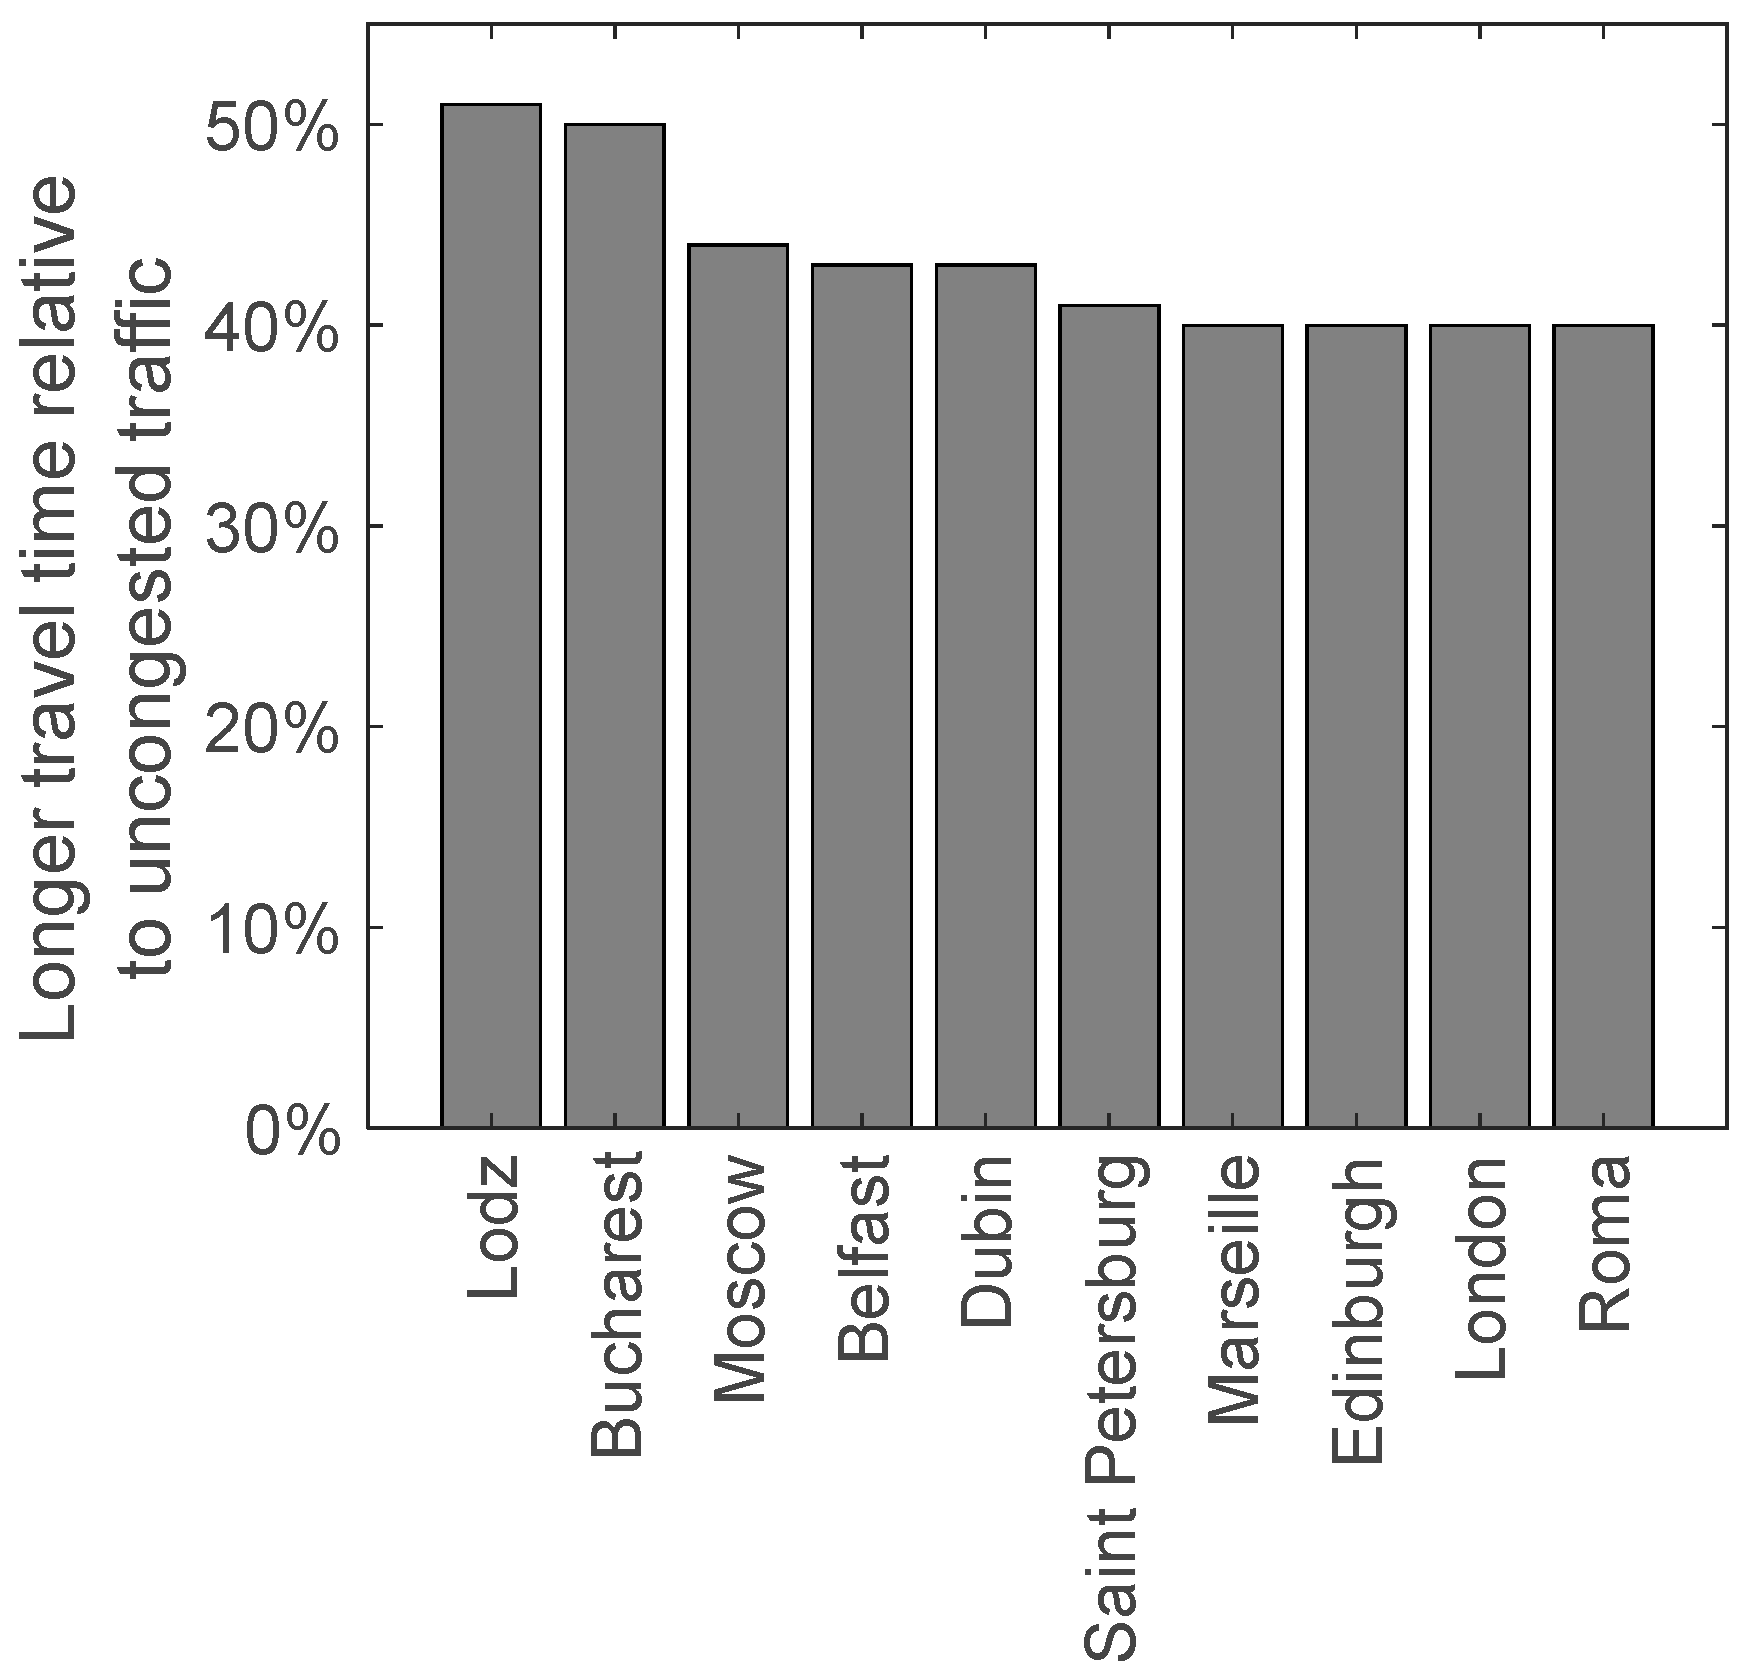
Excessive numbers of individual vehicles in a city become a cause of traffic jams, not only during peak hours but also increasingly during off peak hours. Congestion first occurs on the main transport routes and then it impacts other streets. Increasing travel times become a permanent feature of urban travel, decreasing the quality of life of the inhabitants. In many cases, congestion is described as the ratio of journey time during rush hours to journey time outside rush hours. Figure 4 shows the percentage increase in journey times arising from congestion in selected European cities [37,38].
Congestion also generates additional external costs as well as costs related to time lost during the ever longer journeys. Engaging more public transport vehicles to transfer a given number of passengers also becomes necessary as a result of congestion. The costs incurred with relation to the negative effects of congestion are significant.
Roadway noise is defined as noise that is undesirable or detrimental to human health, caused by road vehicles. Roadway noise is of a variable nature [39]. Assessments of roadway noise use the equivalent continuous sound level (Leq), which is equivalent to the average energy emitted by the sound source over the period of time of interest. As a result, two equivalent continuous sound levels can be distinguished: a daytime and a night-time level.
The negative impact of roadway noise on the human body [40] can be considered with respect to the following categories:
- impact on human health,
- impact on human activity (taking sleep disruption into account),
- annoyance caused by the noise.
The primary processes causing noise are:
- combustion in the cylinders of an engine,
- flow of intake and exhaust gases,
- airflow around the vehicle,
- interaction between the vehicle’s tyres and the road surface,
- inertia forces acting upon the vehicle’s components.
When the equivalent continuous sound level of 60 dB is exceeded, a growing number of people are annoyed by the noise. People face the risk of temporary hearing loss at a Leq exceeding 70 dB and face permanent damage at a Leq exceeding 75 dB.
The increase in roadway noise-related risks in recent years is related mostly to the construction of new roads, bridges, ring roads and motorways, as well as the sudden increase in the number of vehicles in Poland. According to the latest data from 2017, there are 2,121,600 people exposed in outside urban areas with daily noise exceeding 55 dB [41]. Roadway noise is dangerous, particularly in urbanised areas. It is perceived by an increasing number of inhabitants, especially in the urban environment. In cities of over 100,000 inhabitants on the noise in the range 55–60 dB are exposed to 1,618,100 people, 1,286,900 of 60–65 dB, 65–70 dB 668,700, 203,600 70–75 dB, 75 dB over 21,200 people [41]. Public transport is the most common and the most annoying source of roadway noise. The noise emission levels for different road vehicles are as follows: passenger cars: 75–84 dB, motorcycle: 79–87 dB, lorry: 83–93 dB, bus: 86–92 dB and tram: 70–95 dB.
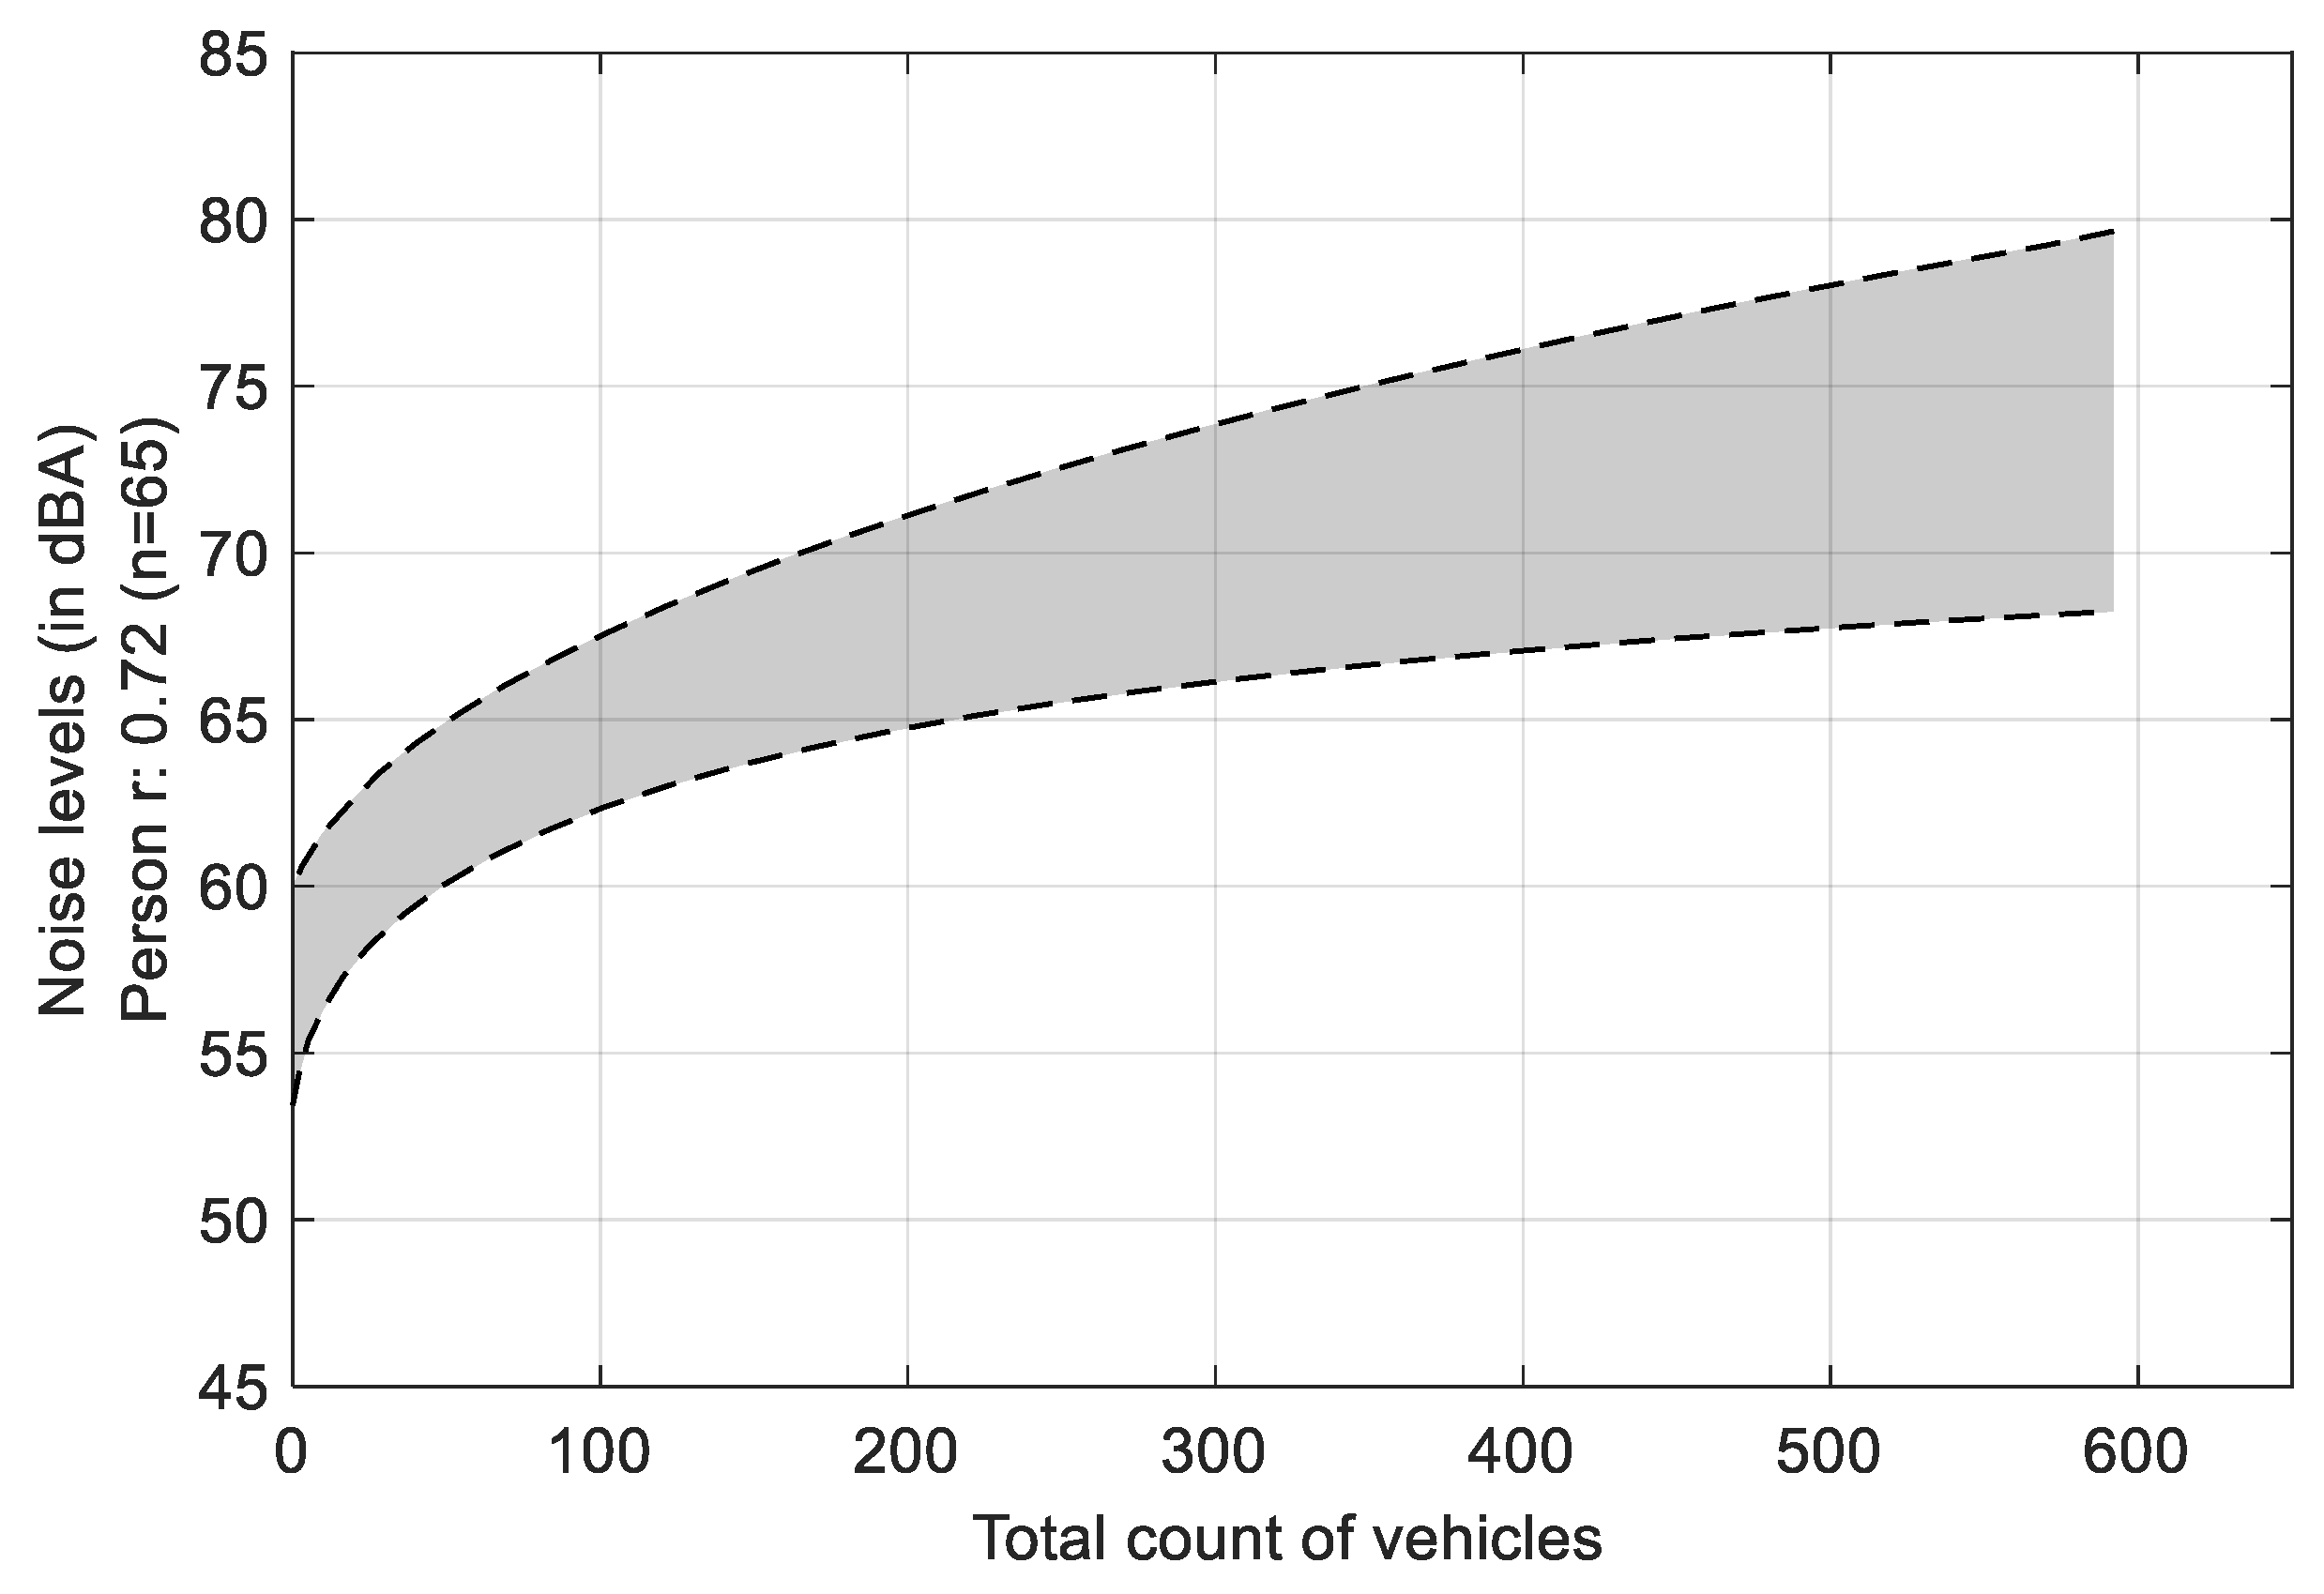
There is, then, a correlation between traffic intensity, vehicle speed and noise level. Figure 5 shows the relation between noise level and number of cars (for reference only), based on [42].
This is an approximate relation. More detailed and accurate data on this matter, which take many other factors into account (such as the type of road, environment and vehicles in traffic), can be found elsewhere [32,43,44].
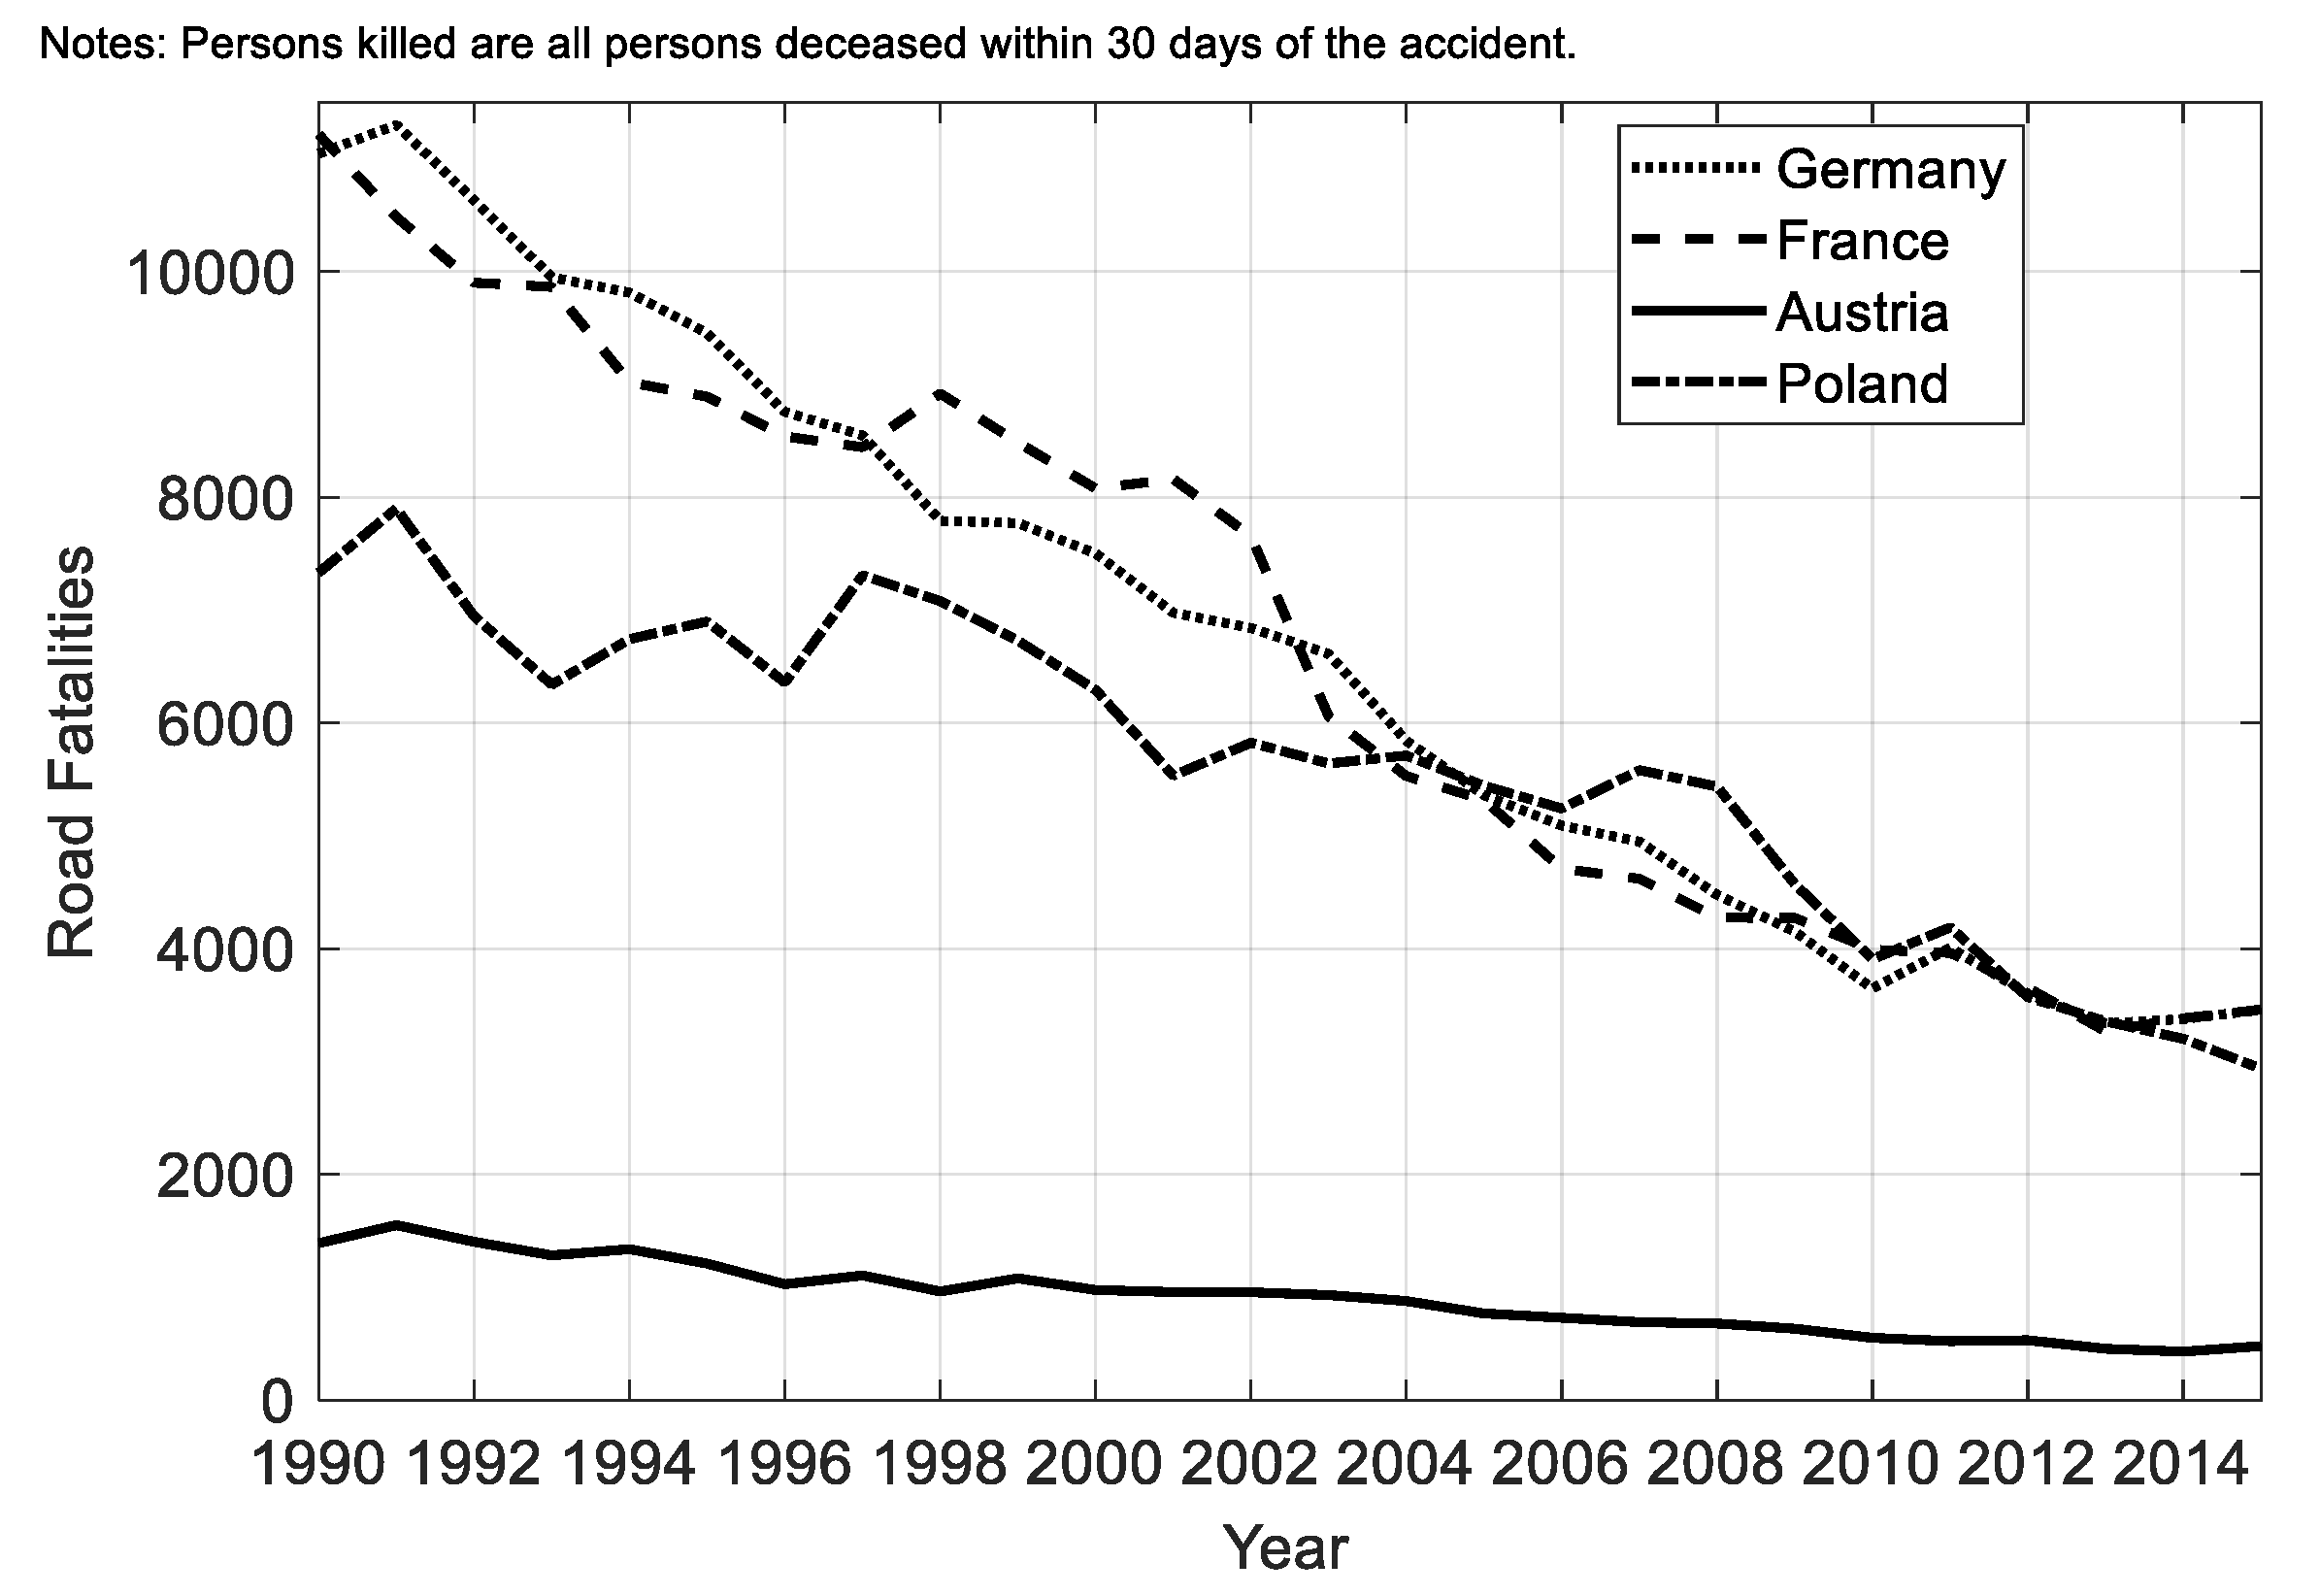
Road accidents are an important threat related to road transport operations. In this area, it is continuously better visible in Figure 6.
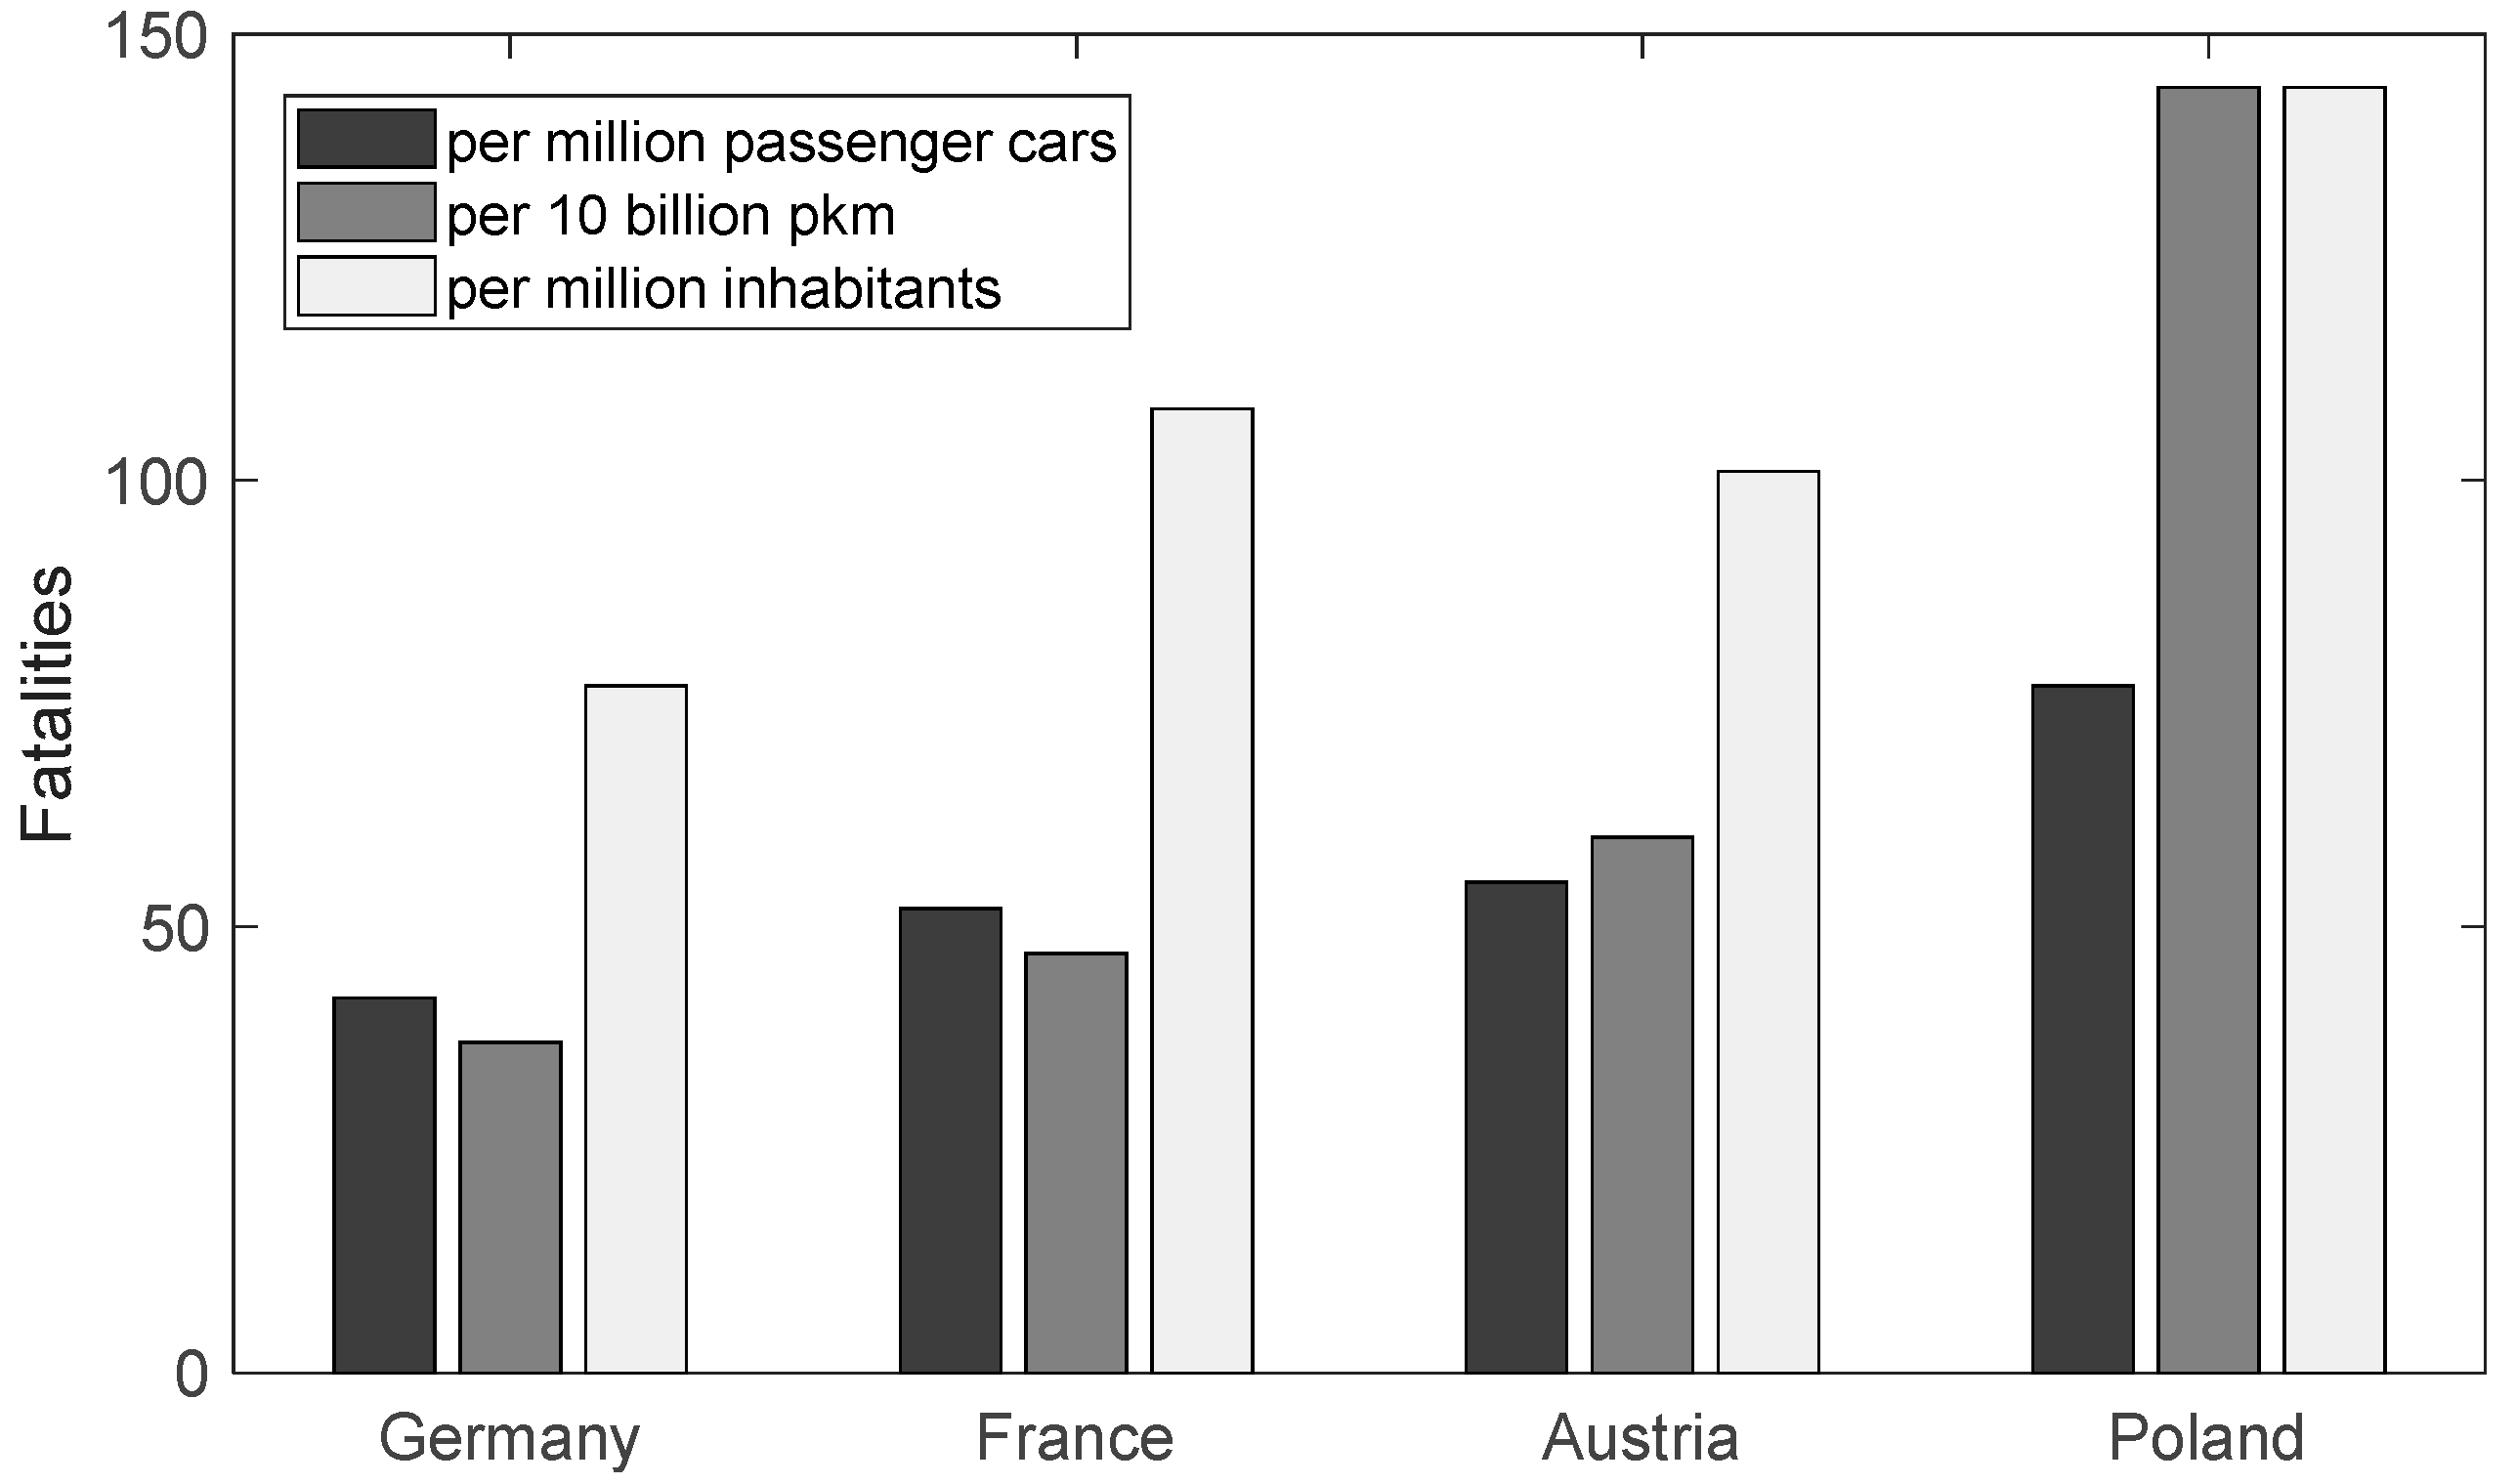
In all countries included in Figure 6, there is a decrease in the number of fatalities. However, considering the number of accidents in relation to the number of passengers and inhabitants, it can be observed that in the case of Poland, the presented results are not very favourable (Figure 7). Achieving a level of road safety such as in the old EU will require intensive action.
4. Case of the Analysed City
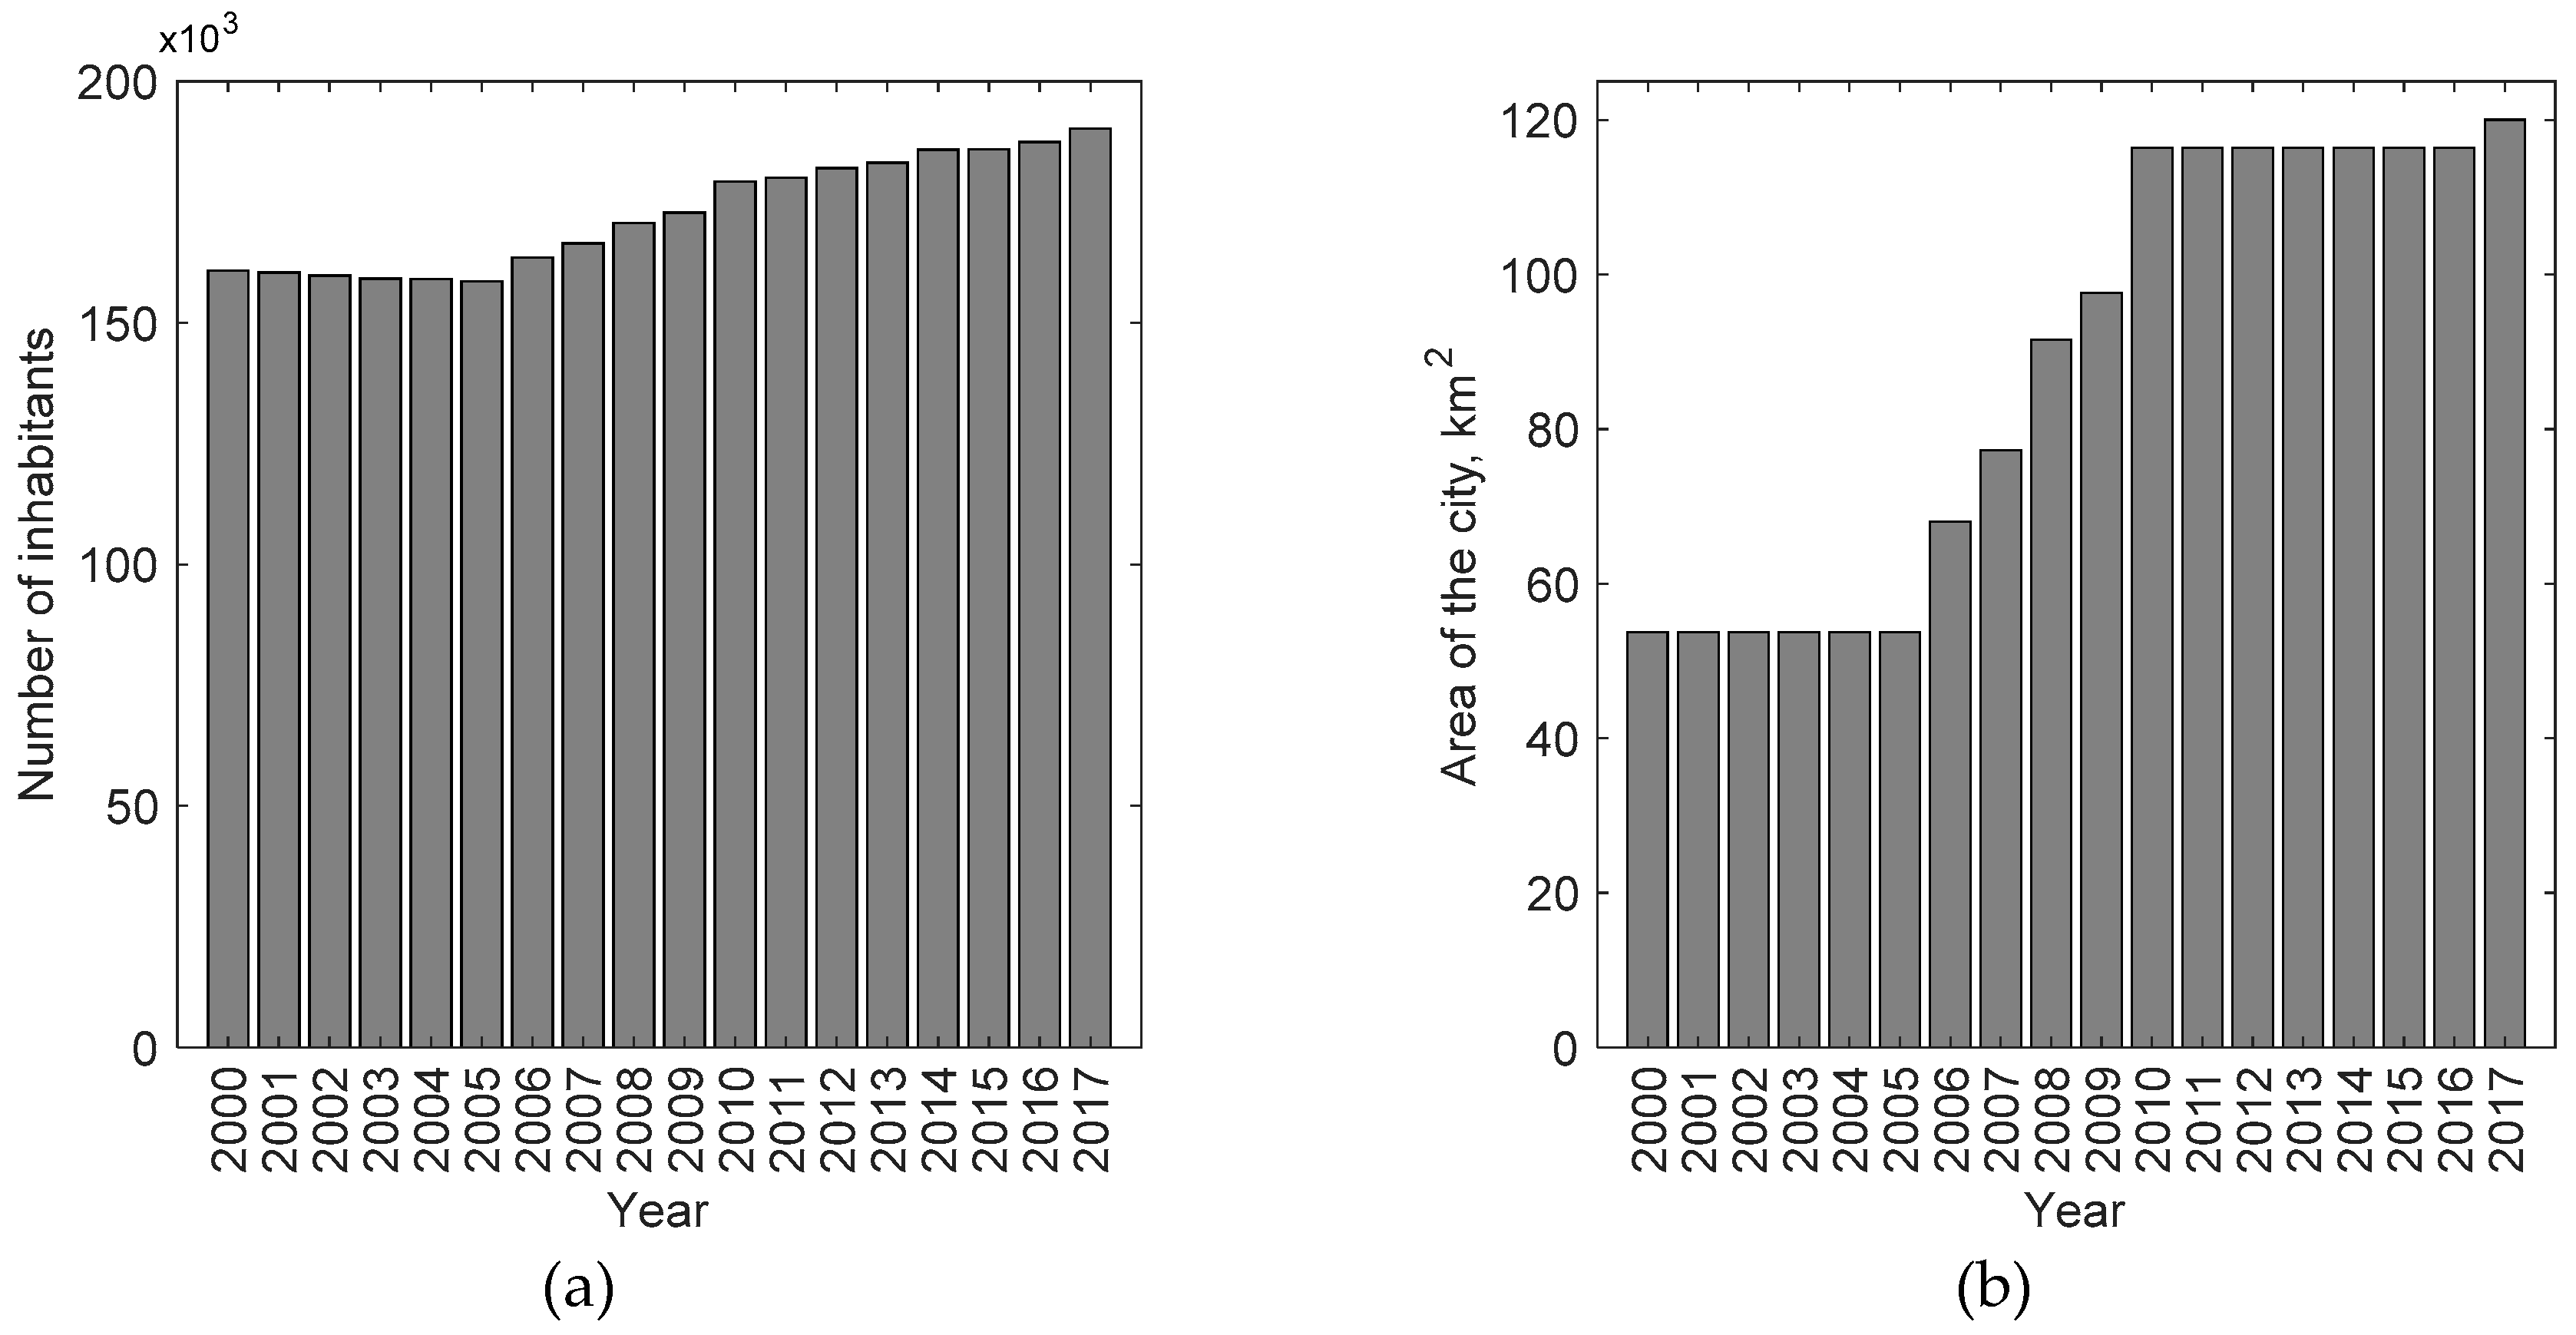
Rzeszow is the capital of the Subcarpathian voivodeship (a voivodeship is the area administered by a voivode in several countries of central and eastern Europe). The city forms a hub for several important road transport routes, near Poland’s borders with Slovakia and Ukraine. Rzeszow is the largest city in South-East Poland, with an area of 120.4 sq. km and a population of 190,203 (30 June 2018) [45]. It is an important centre of economic, commercial, industrial, cultural and academic life. There are five higher education institutions operating in Rzeszow. The total number of students in the 2016/17 academic year was 41,787.
Rzeszow has a visibly formed zone of intercity development, with a radial-concentric layout, with the industrial and residential districts being visibly separated. The city is divided into 30 districts. The population density is one of the lowest among medium-sized cities in Poland. There are many recreational and green areas within the city. The left-bank part of Rzeszow is characterised by higher density development, including mainly residential buildings. In recent years, there has been a continuous increase of population, as shown in Figure 8a. Extending the borders of the city and expanding its area contribute greatly to increases in population, as shown in Figure 8b.
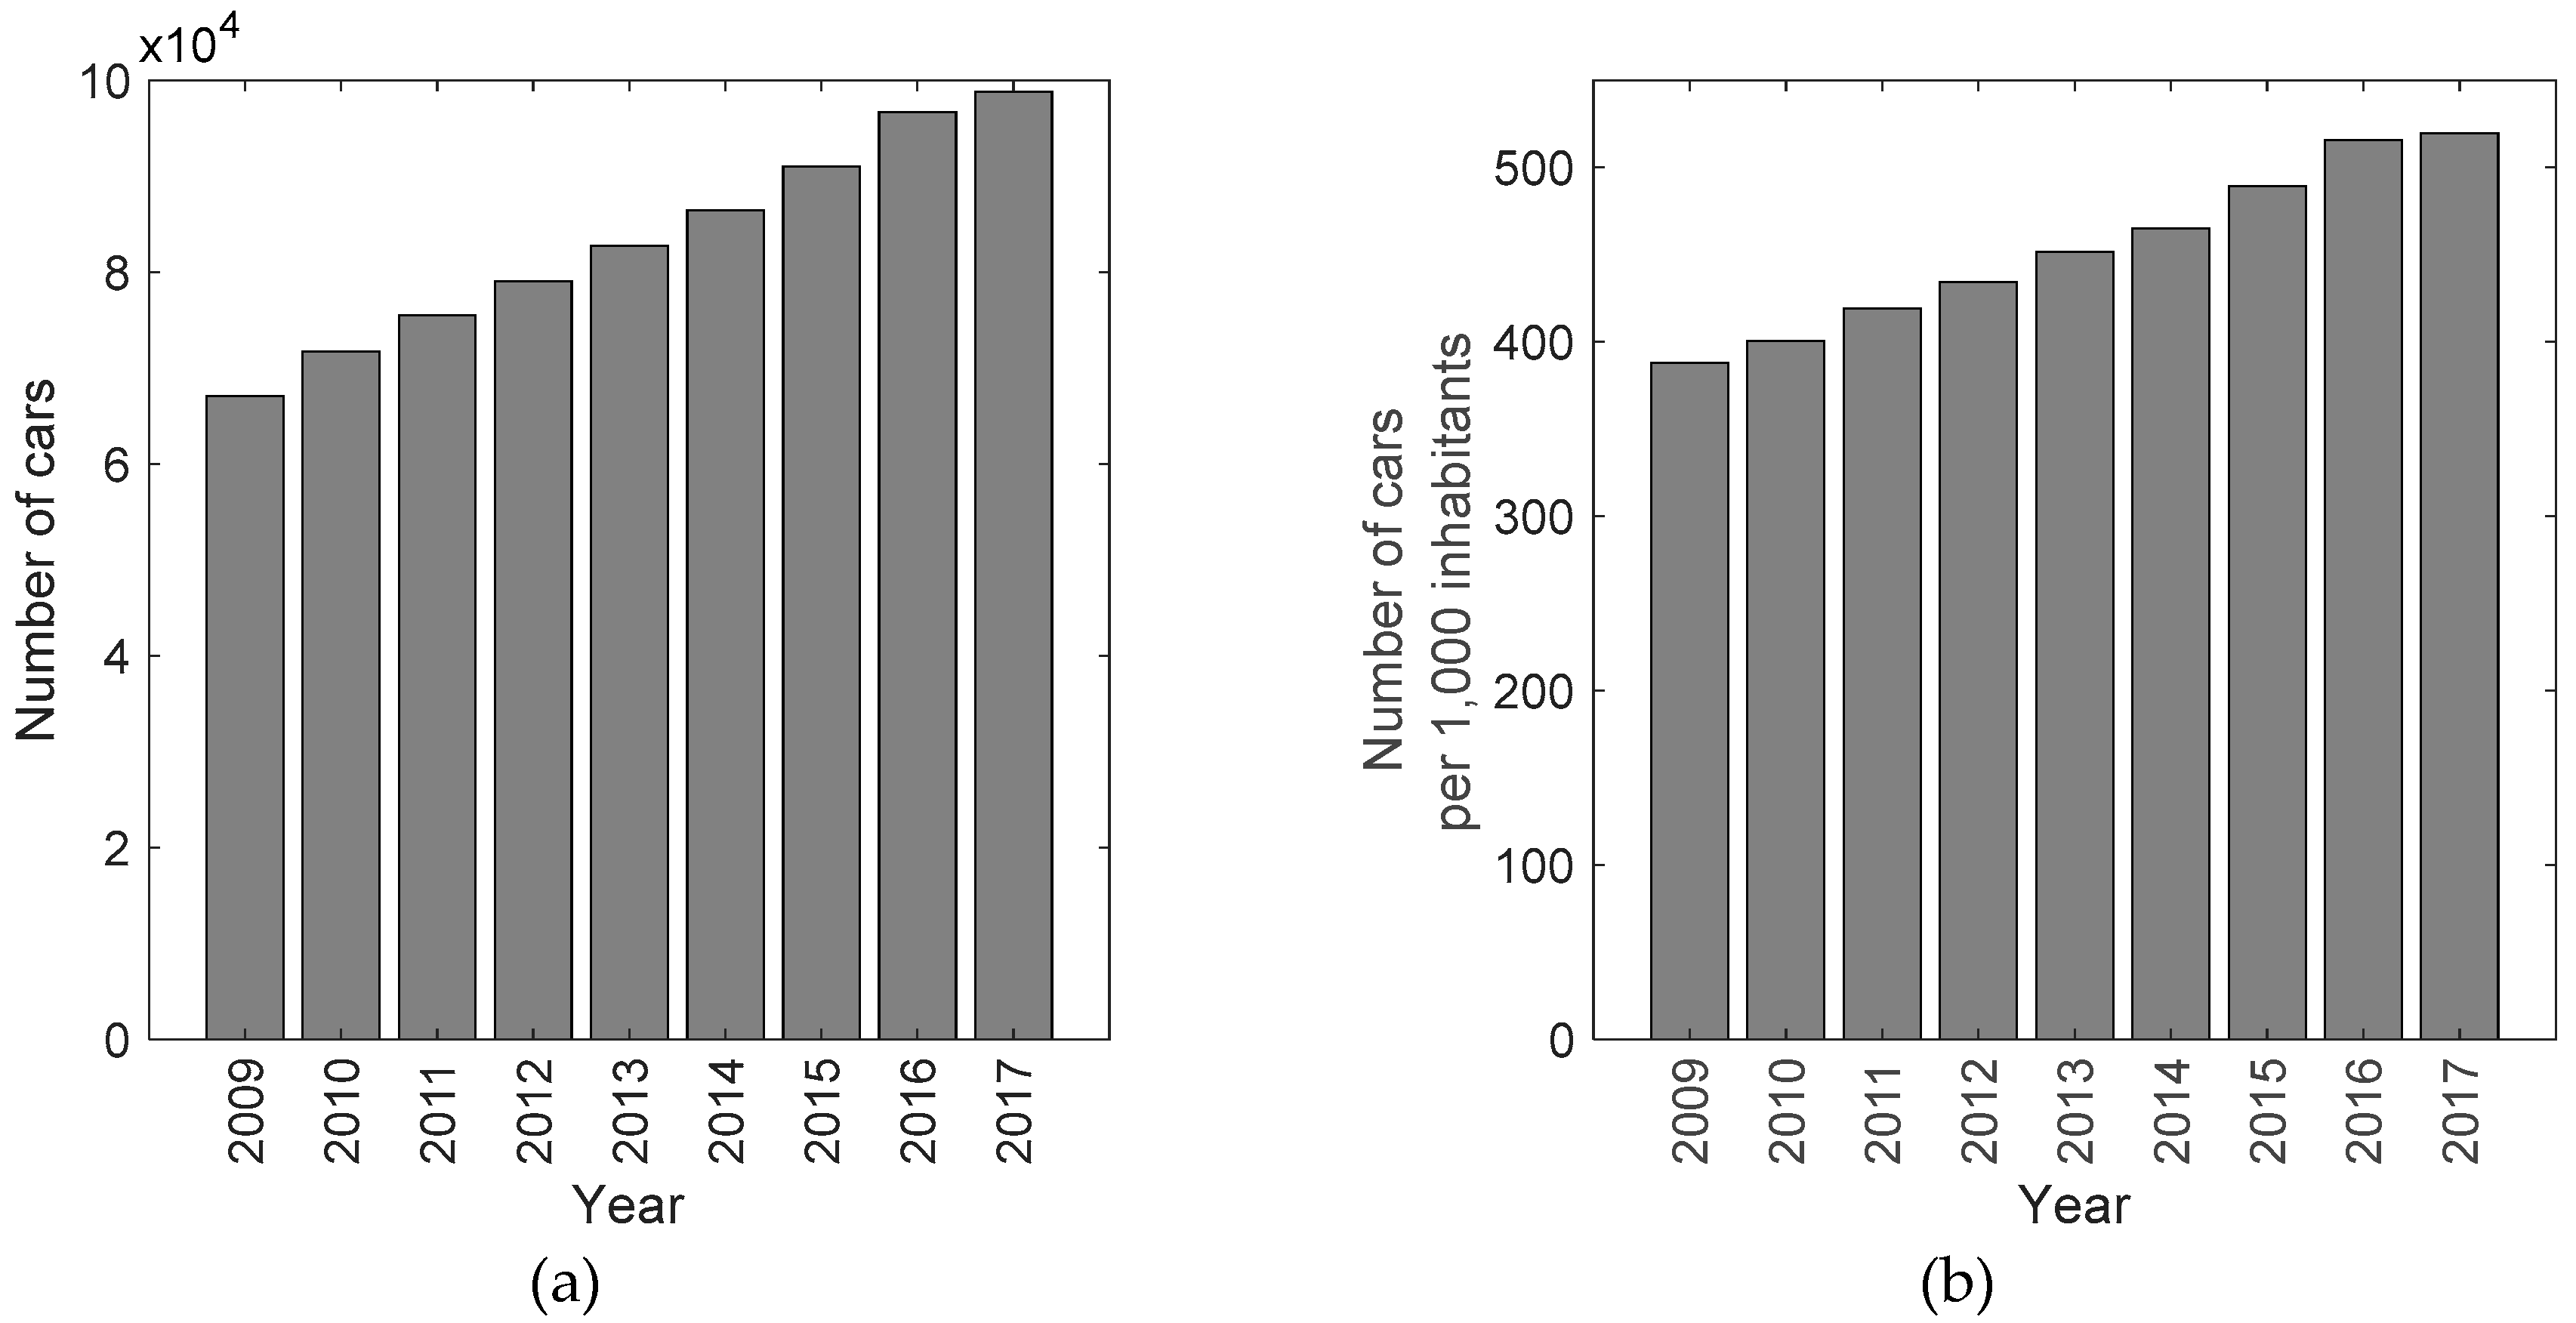
Along with the growth in the number of inhabitants (Figure 8a), there was also a growth in the number of registered passenger cars (Figure 9a).
In the analysed years, the number of inhabitants increased by 18% and the number of registered cars increased by 47%.
The increase in the registered number of cars also caused a change in saturation rate per 1000 inhabitants as shown in the Figure 9b.
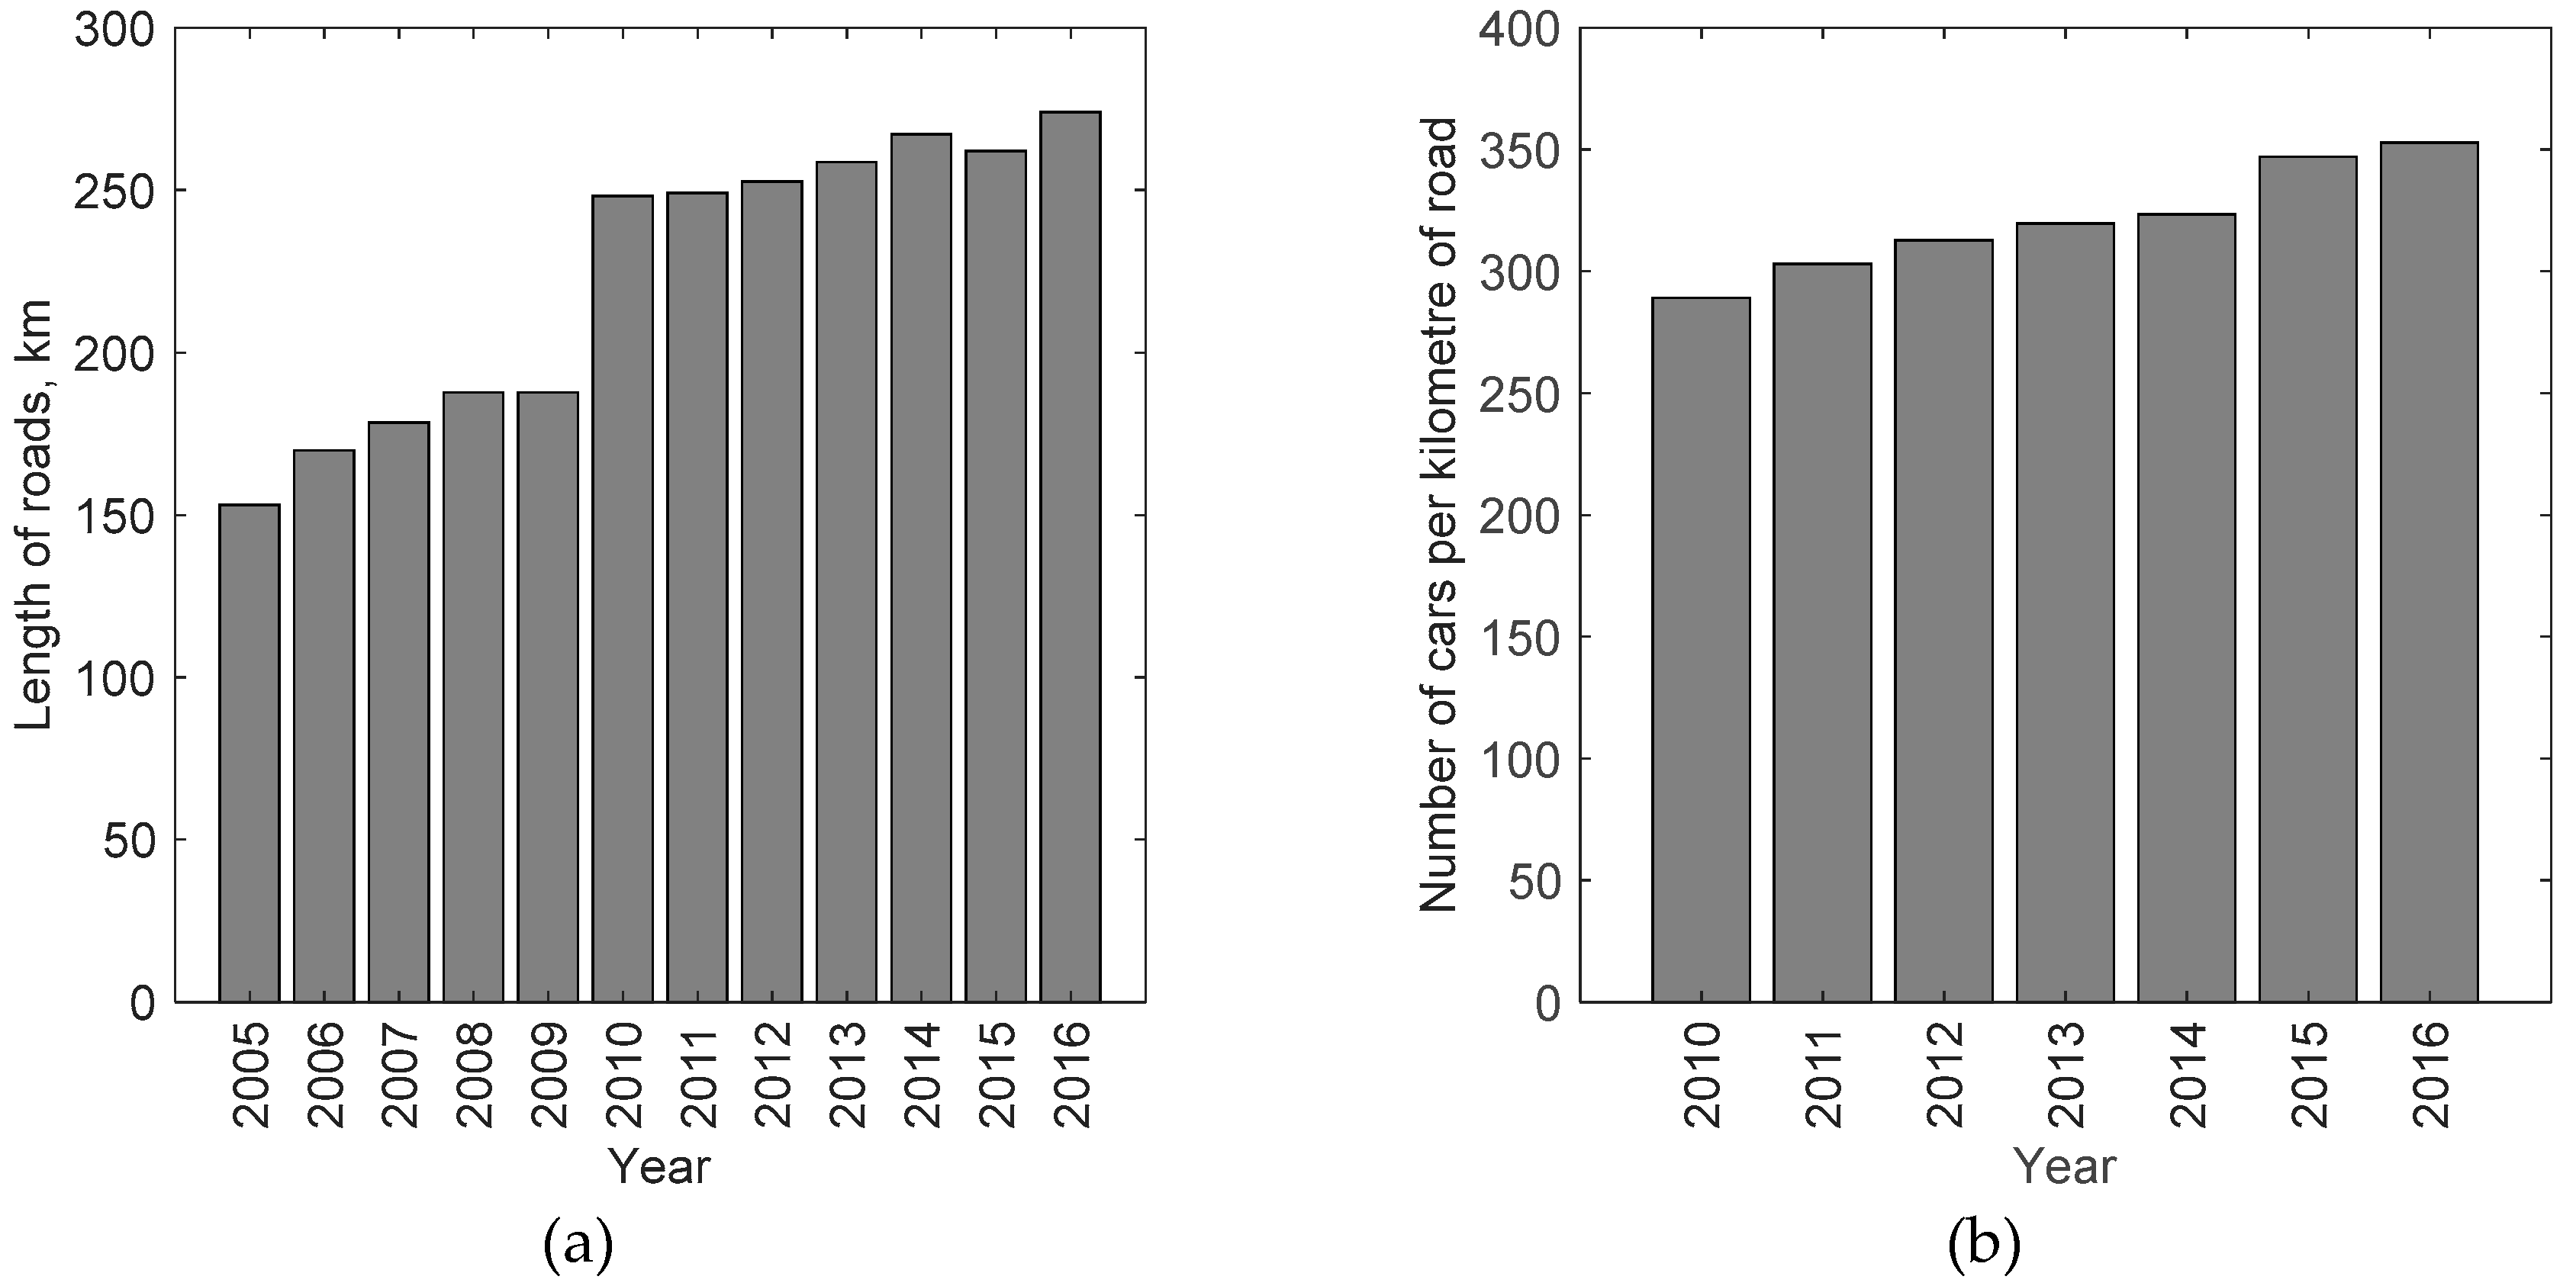
Rzeszow’s road infrastructure in 2016 comprised around 274 km of hard-paved roads (Figure 10a). The period from 2010 to 2016 saw a 10% increase in the total road length. The same time period saw a 35% growth in the number of registered passenger cars. The more intense growth in passenger car numbers in relation to the growth in road length causes greater traffic density, which results, to a large degree, from the number of cars per kilometre of road. In 2016 this was 353 cars per kilometre of road, and constituted a 22% growth in relation to 2010 (Figure 10b).
The rapid change in the total length of roads between 2009 and 2010, as shown in Figure 8a, results from neighbouring urbanised areas being incorporated into the city.
An increase in the area and population of a city generates large amounts of passengers. The transport lines of other carriers also cross the city area; however, they focus only on transporting passengers to and from Rzeszow, and it can be assumed that they do not participate in fulfilling transport needs within the territory of the city.
The public transport of Rzeszow in December 2017 [46] comprised 46 regular bus lines, 3 special lines operated by the Municipal Transport Company (MTC) and 3 night lines. These public transport lines involved the use of 179 buses. The share of low-floor and low-entry buses was 87.2% of that number. The share of buses powered by natural gas was 37.4%. Meanwhile, the average age of the fleet was 8 years.
Among these bus lines, 6 formed a group of priority lines, whose frequency during the peak period ranged between 10 and 15 minutes. Within the system of urban transport, we can additionally differentiate basic lines, with a frequency ranging between 20 and 30 minutes and supplementary lines. The urban transport of Rzeszow is characterised by two peak periods—in the morning, between 06:30 and 08:30 and in the afternoon, between 2:00 PM and 4:00 PM.
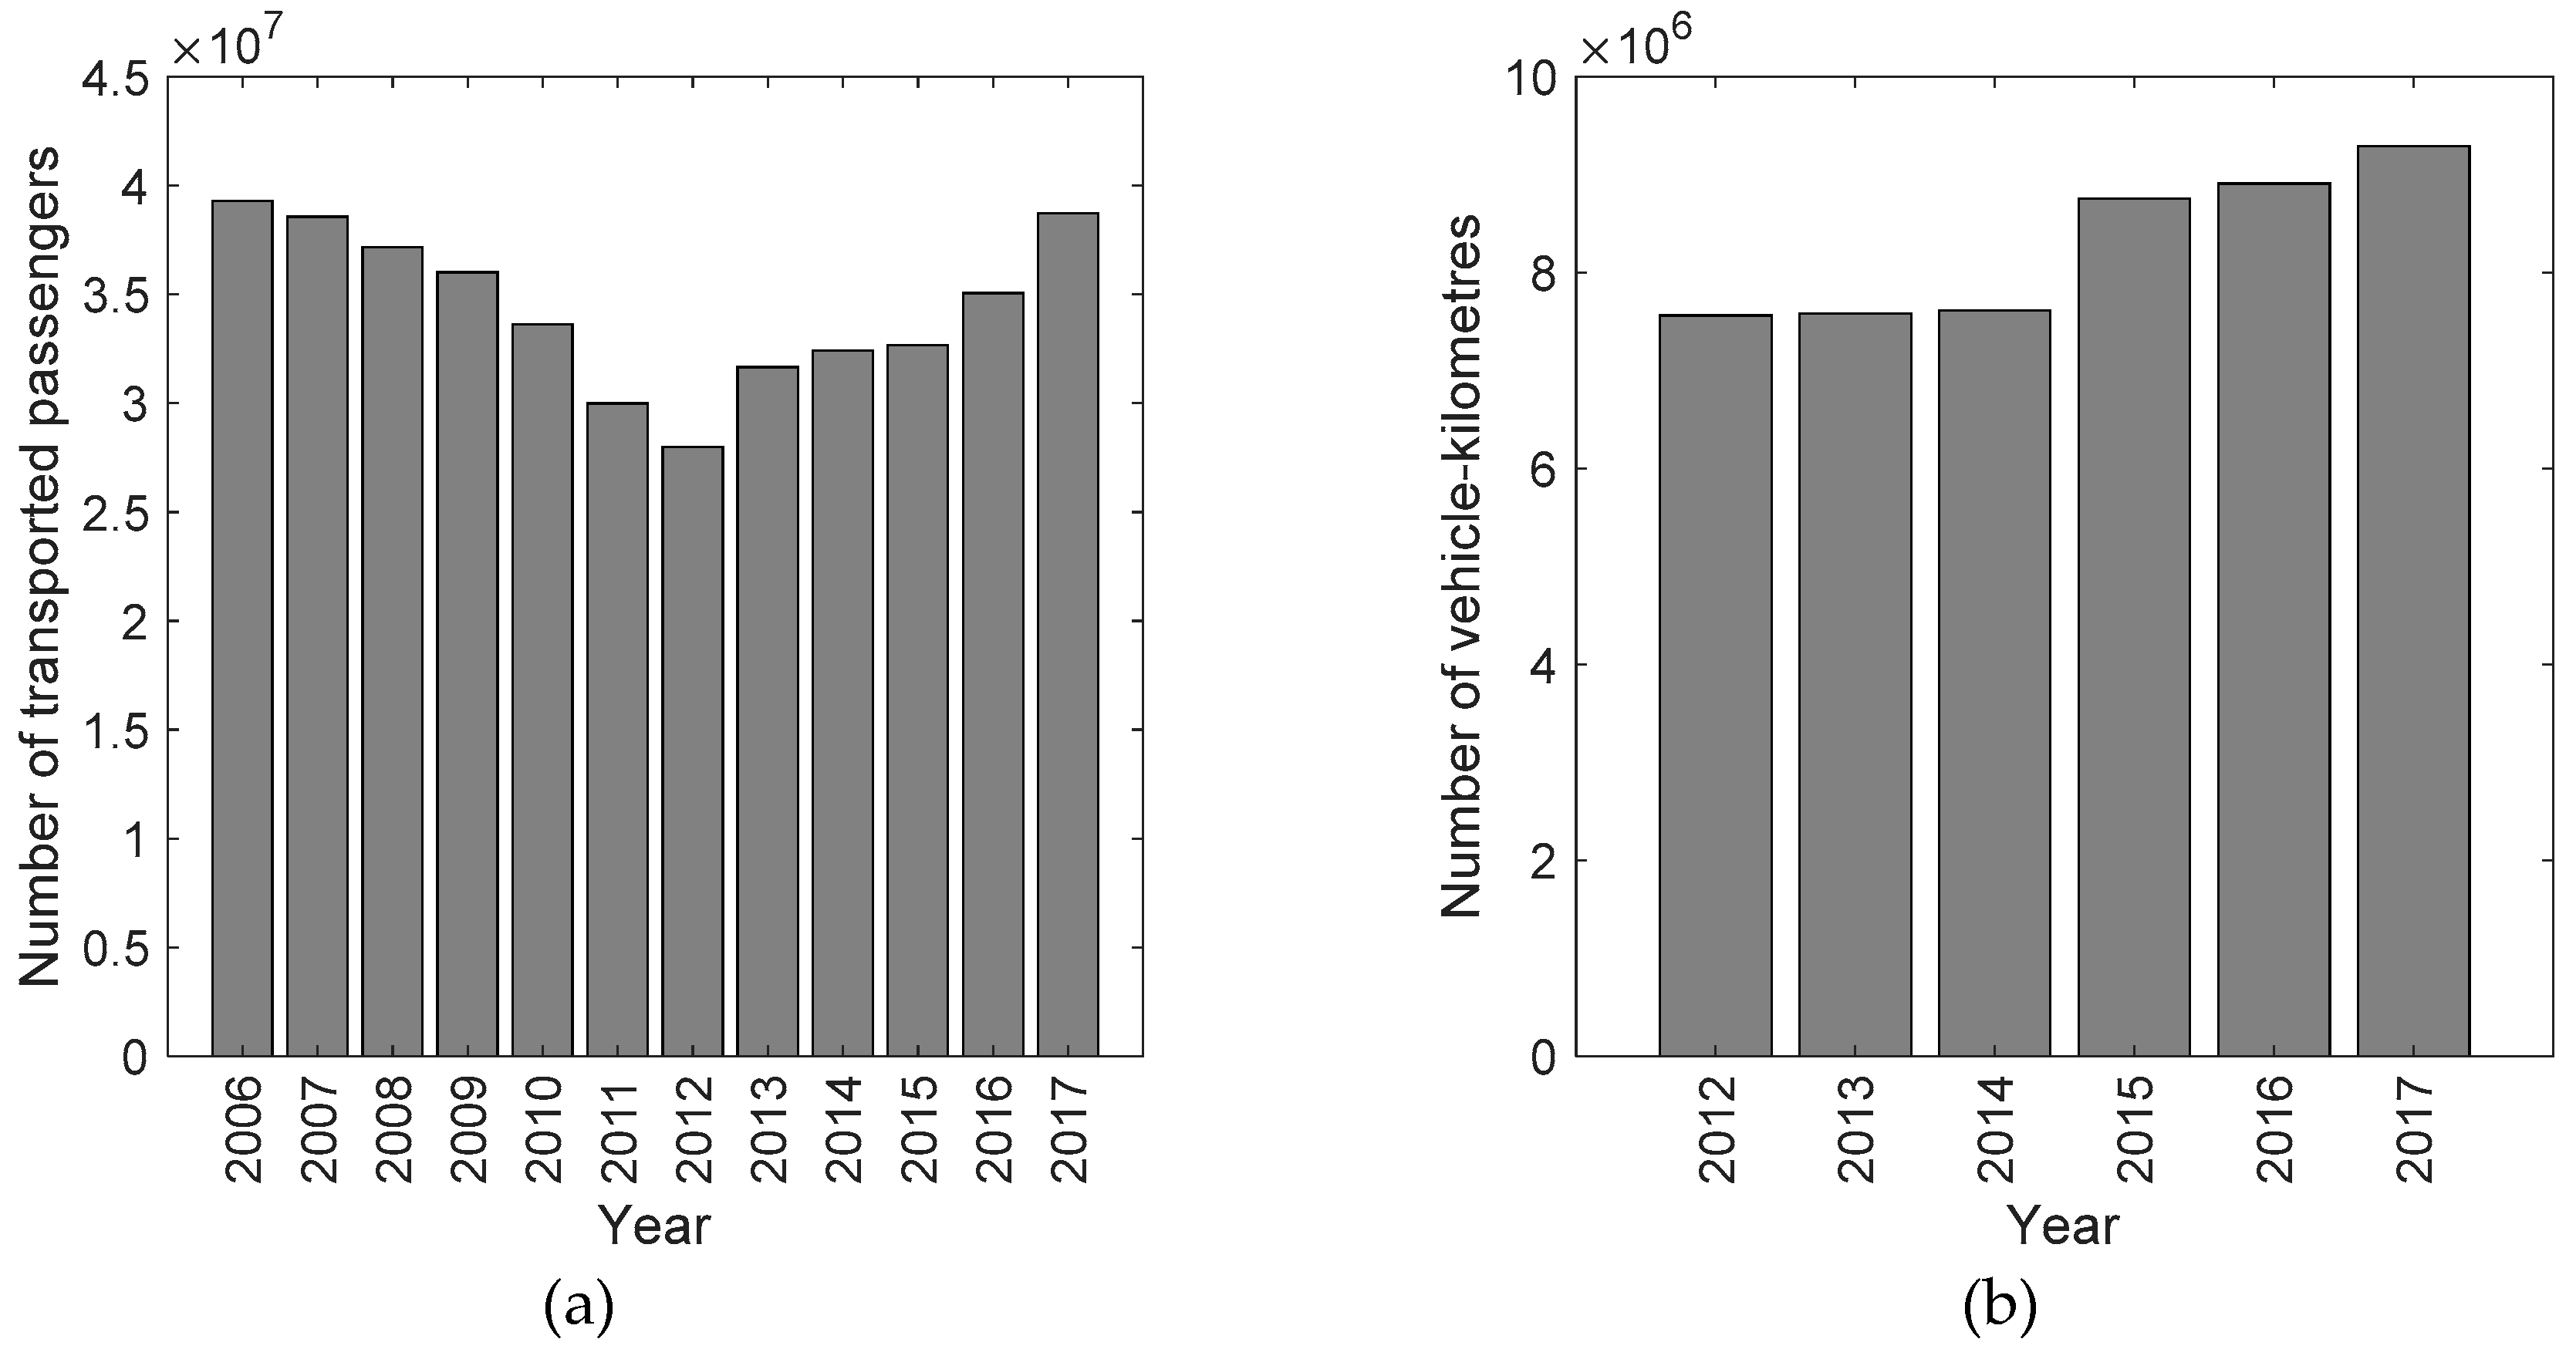
Until 2012, the transportation lines offered by MTC Rzeszow were in decline, as shown in Figure 11a. This occurred in spite of the constant increase in the number of inhabitants. The increasing transportation needs with increasing numbers of inhabitants were fulfilled mainly by individual transport. This tendency was unfavourable in terms of energy consumption and the emission of harmful substances. In 2013, the authorities of the city took decisive measures aimed at improving the functioning of urban transport in Rzeszow. Since then, a systematic growth in passengers using public transport has been observed.
What largely contributed to this growth was the increase in road performance, expressed in vehicle-kilometres (Figure 11b). In the period between 2012 and 2017, the number of vehicle-kilometres travelled increased by almost 20%.
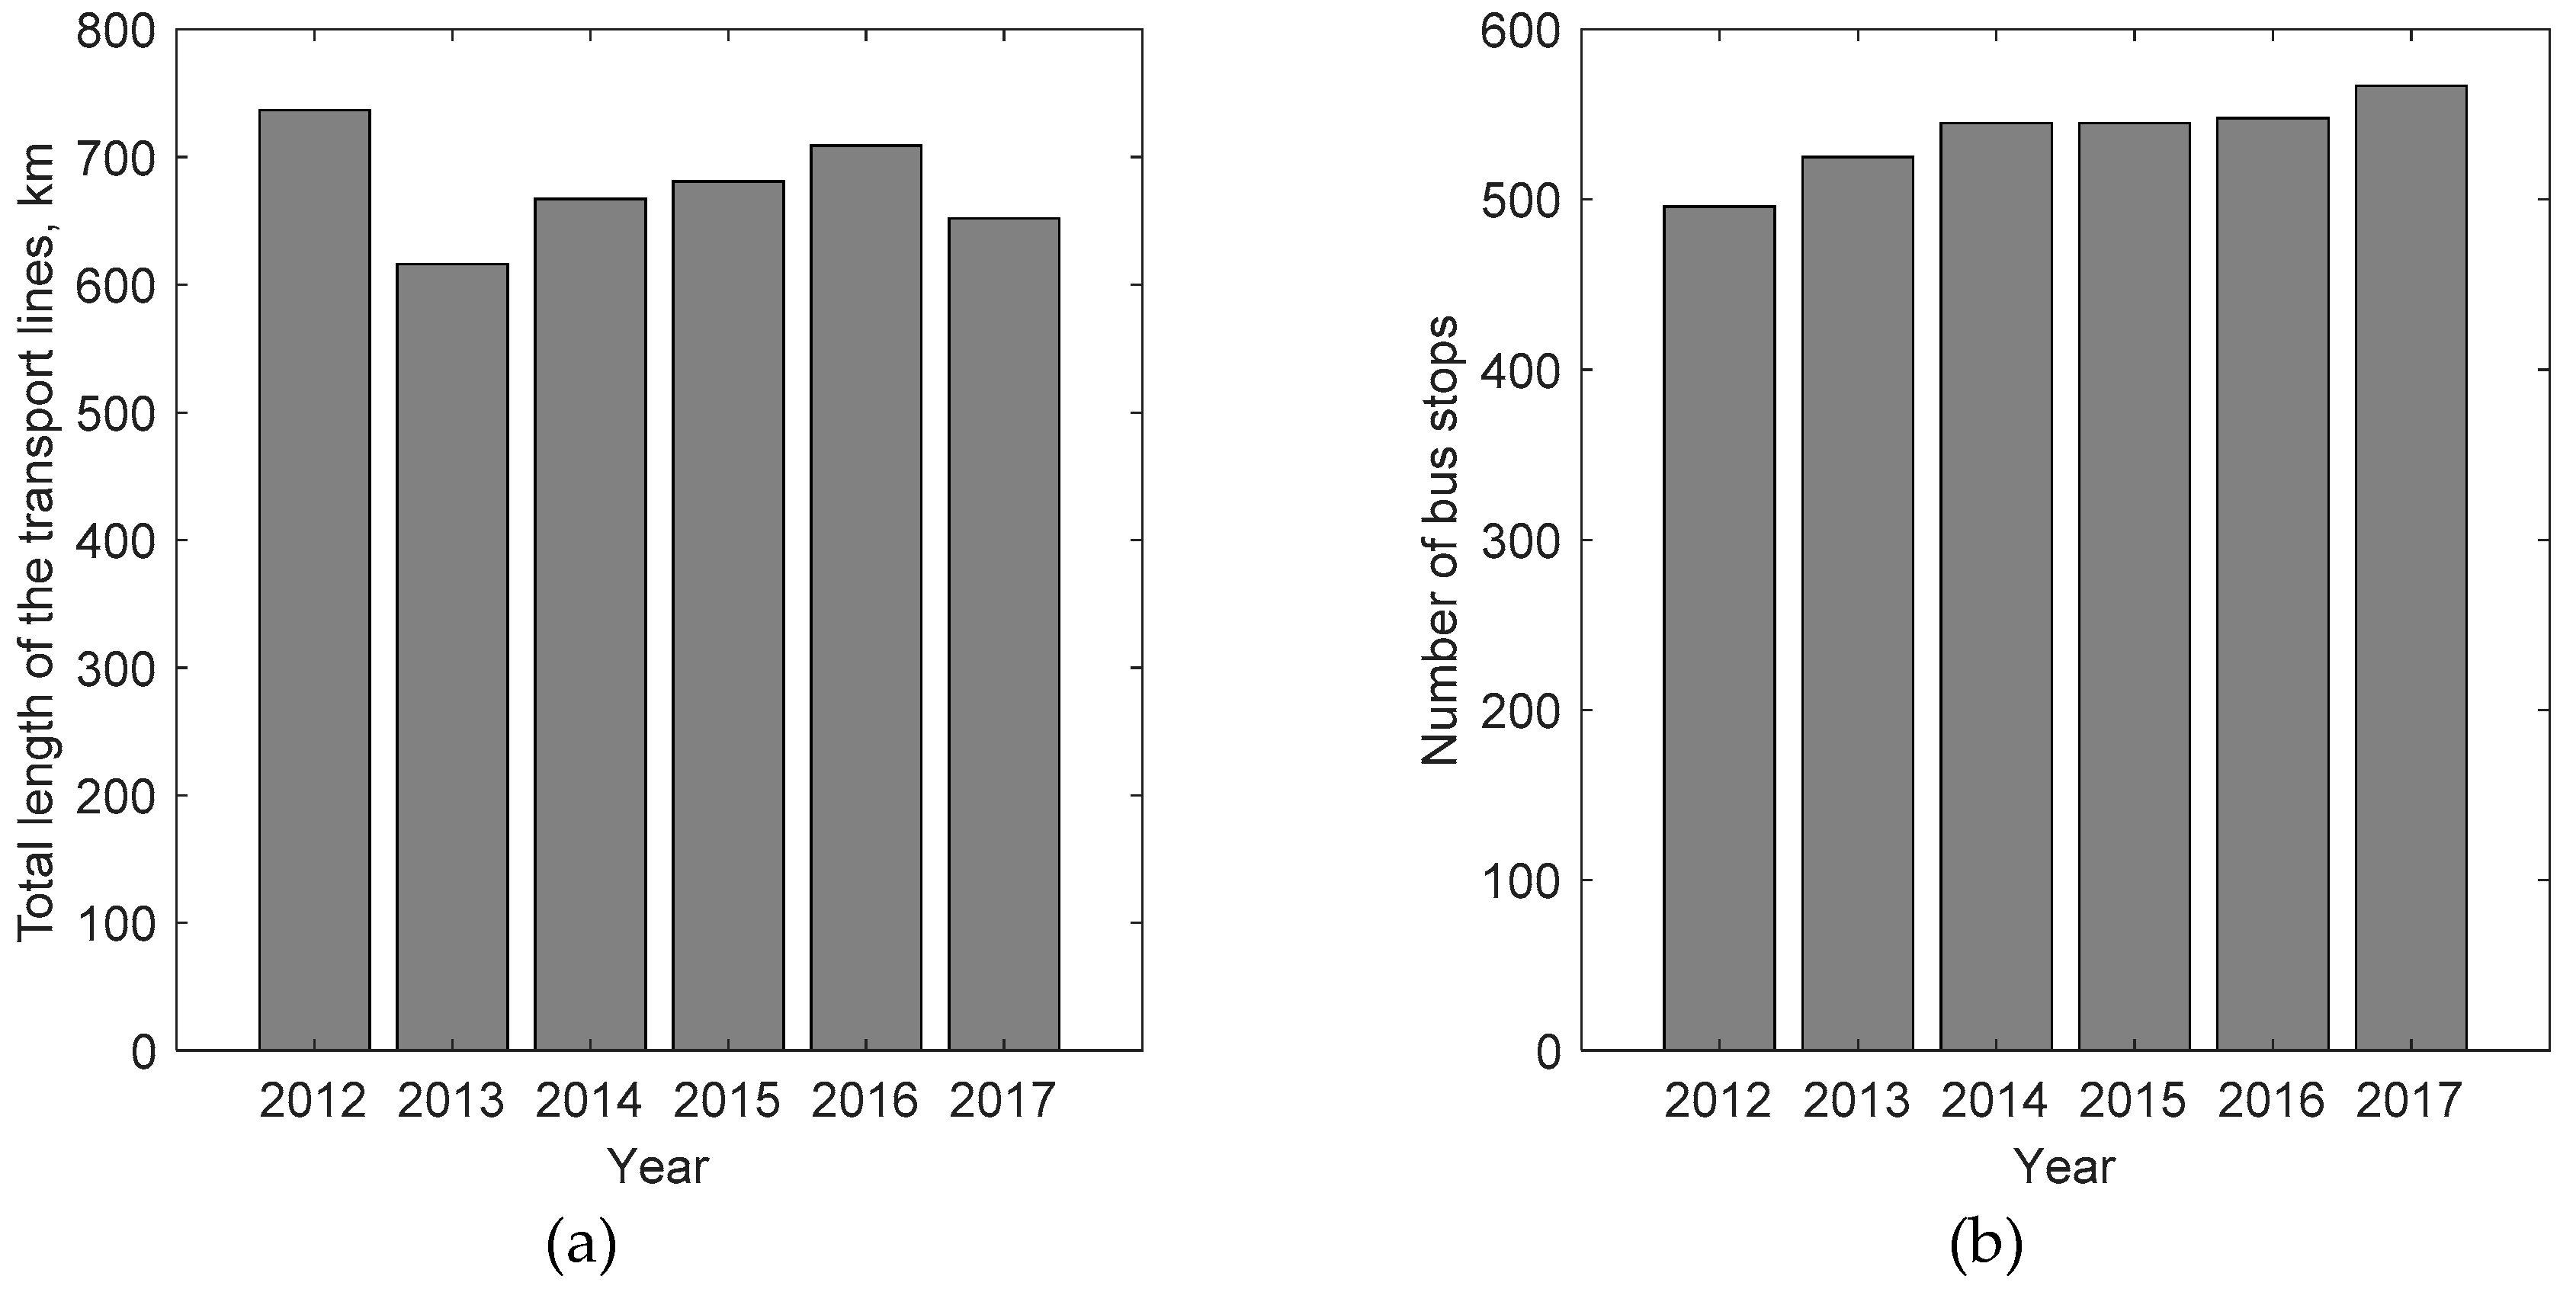
The total length of the lines on which passengers were carried by MTC Rzeszow was 652 km in 2017 (Figure 12a). This was less than in 2012, when the urban transport company also provided services into the territories of neighbouring municipalities. In 2013, aside from rare cases, city buses did not leave the territory of the city.
A total of 567 bus stops form part of the infrastructure of the MTC Rzeszow transport network (Figure 12b).
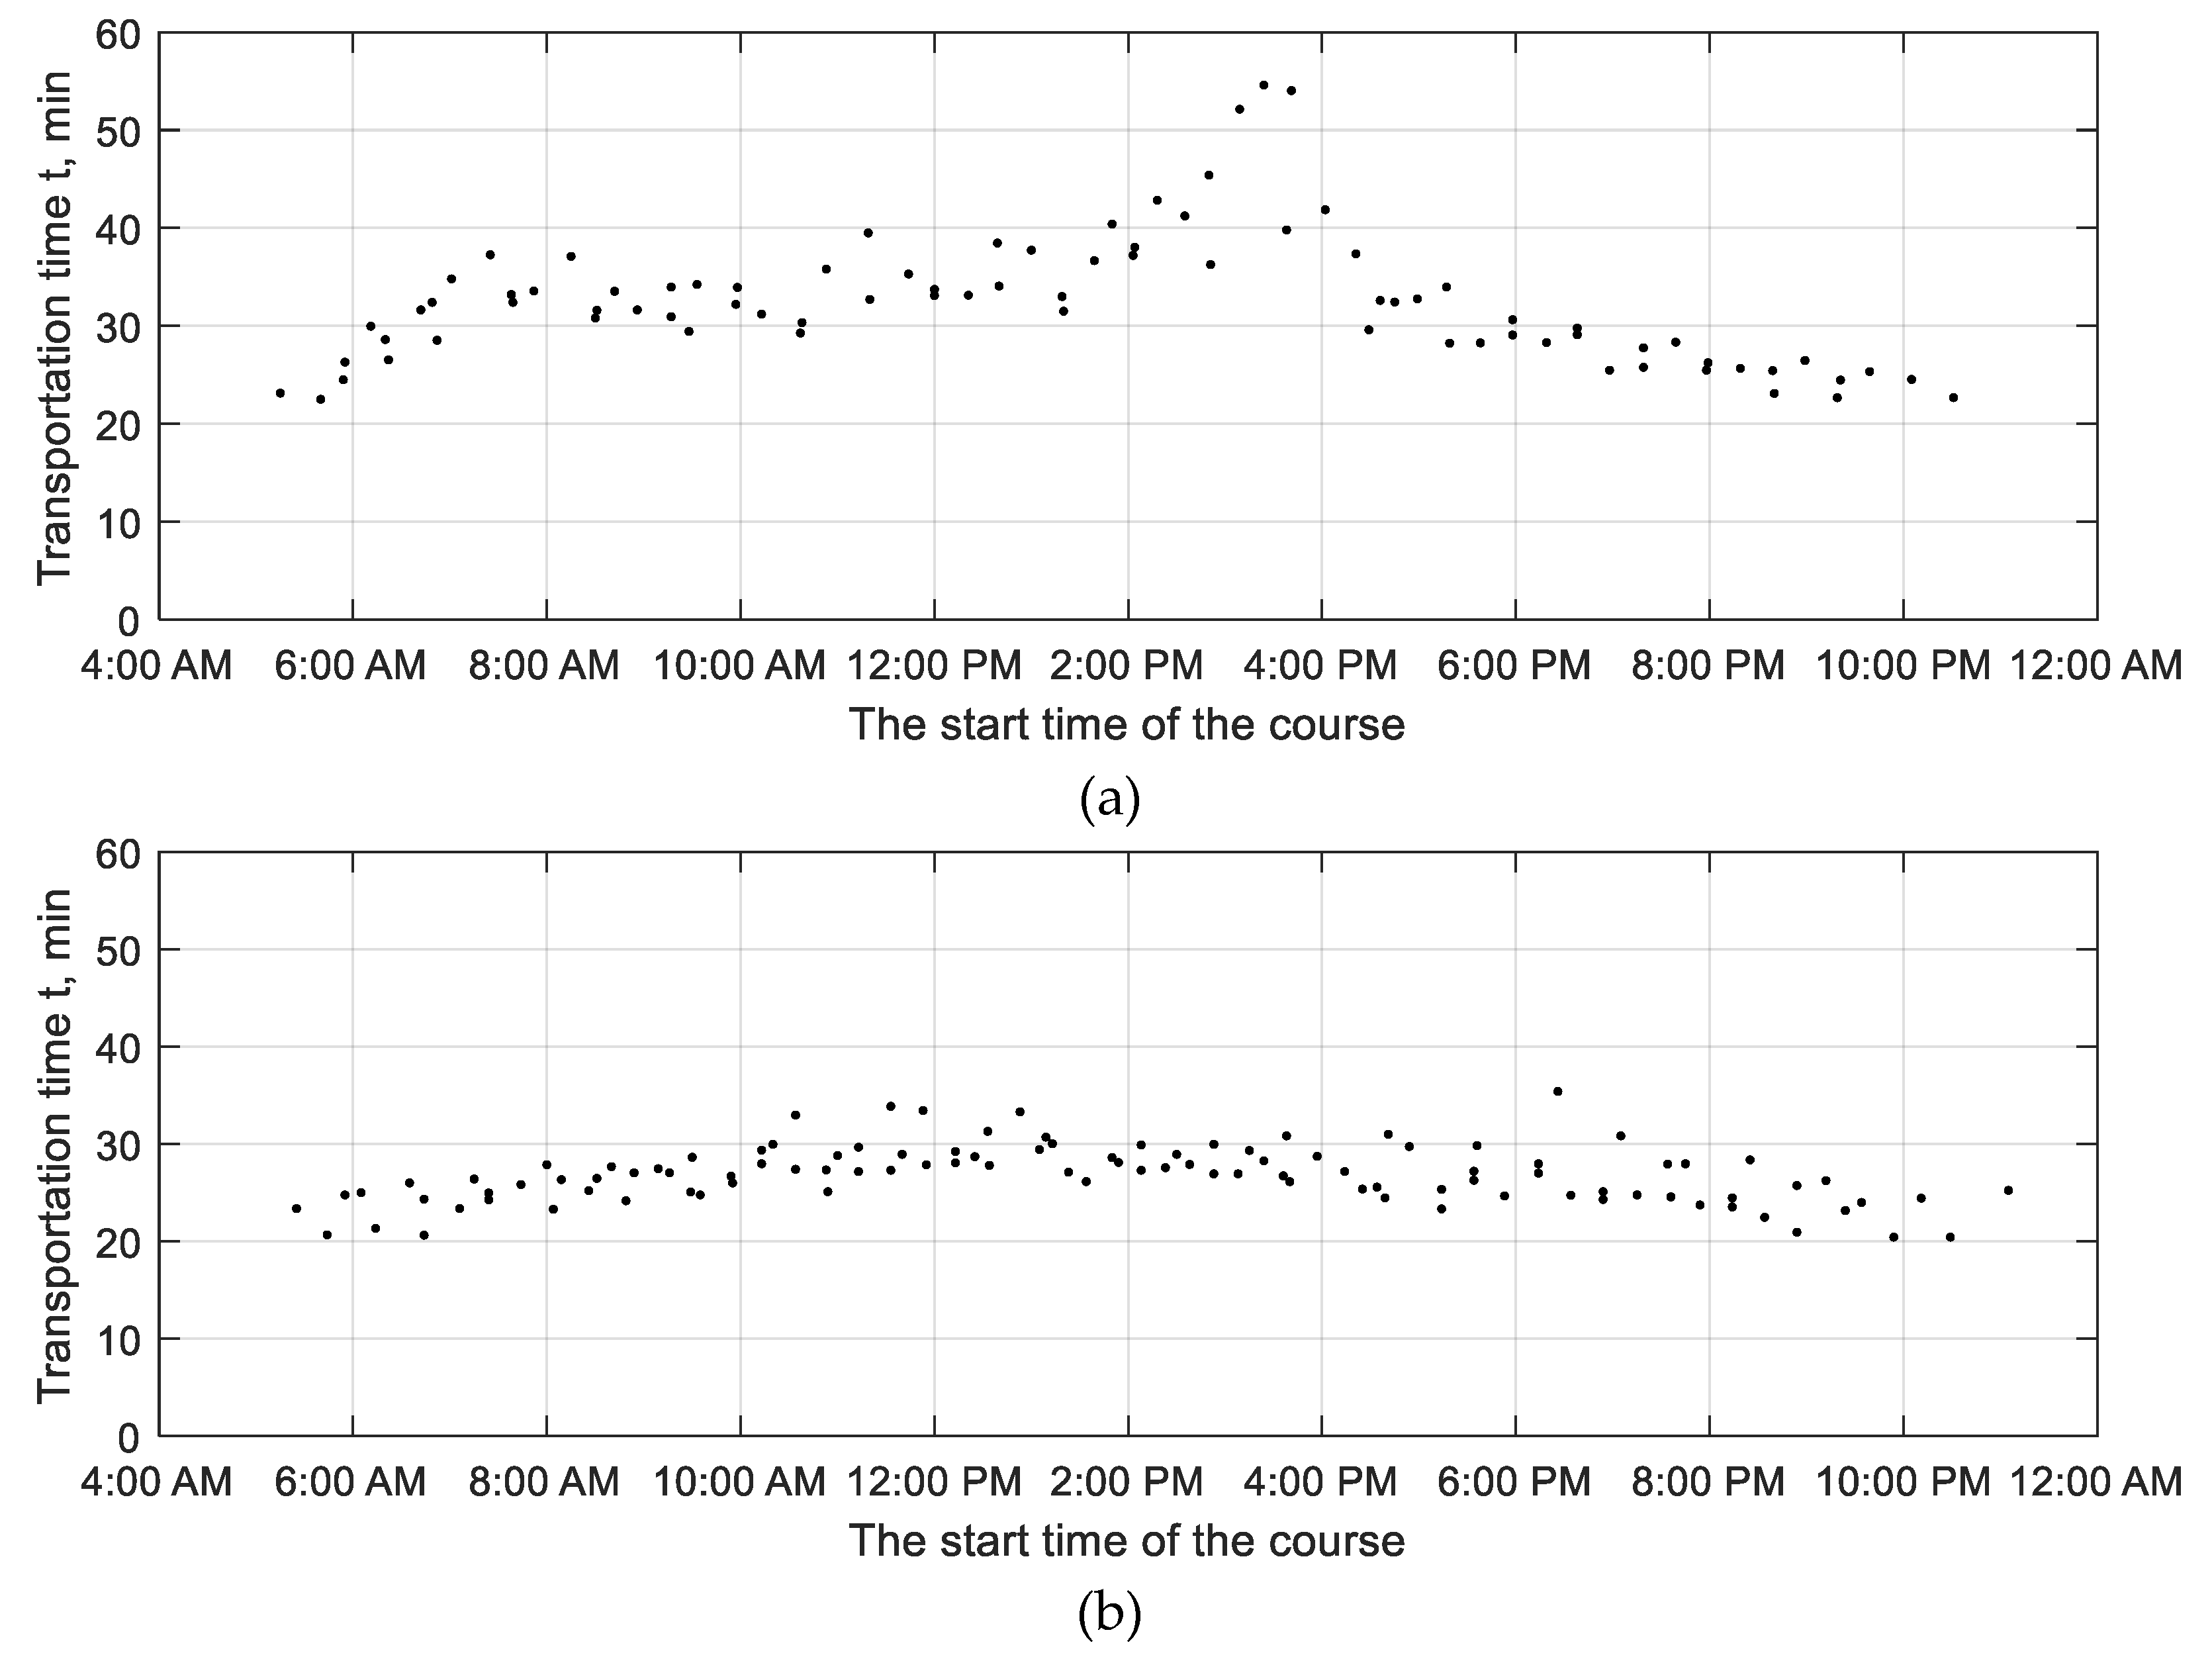
The city of Rzeszow bears witness to practically all unfavourable effects of urban development related to the functioning of transport. The increase in the number of vehicles and traffic intensity contributes to road congestion and higher journey times. The effects of congestion are clearly evident when one compares the journey times of Route 0 buses driving towards the city centre on work days and on holidays [47]. Figure 13 shows a sudden increase in the journey time throughout the afternoon rush hours, an increase of at least 40% with respect to other periods of the day. On holidays, as shown in Figure 13, the journey times between 10:00 AM and 8:00 PM did not differ much. Compared to journey times on work days, journey times on holidays were 10 to 20% shorter, afternoon rush hours notwithstanding.
The large number of vehicles in road traffic contributes to generating significant levels of noise. Currently, there is a large number of inhabitants and residential units exposed to roadway noise [48]. Table 1 shows relevant data concerning the number of residential units, the number of people residing in those units, and the area of Rzeszow exposed to roadway noise. The Leq coefficient was applied to assess the data in the noise column during day.
The highest noise levels occurred along the main city roads. Relevant data recorded on primary city roads running from the north to the south of the city are shown in Table 2.
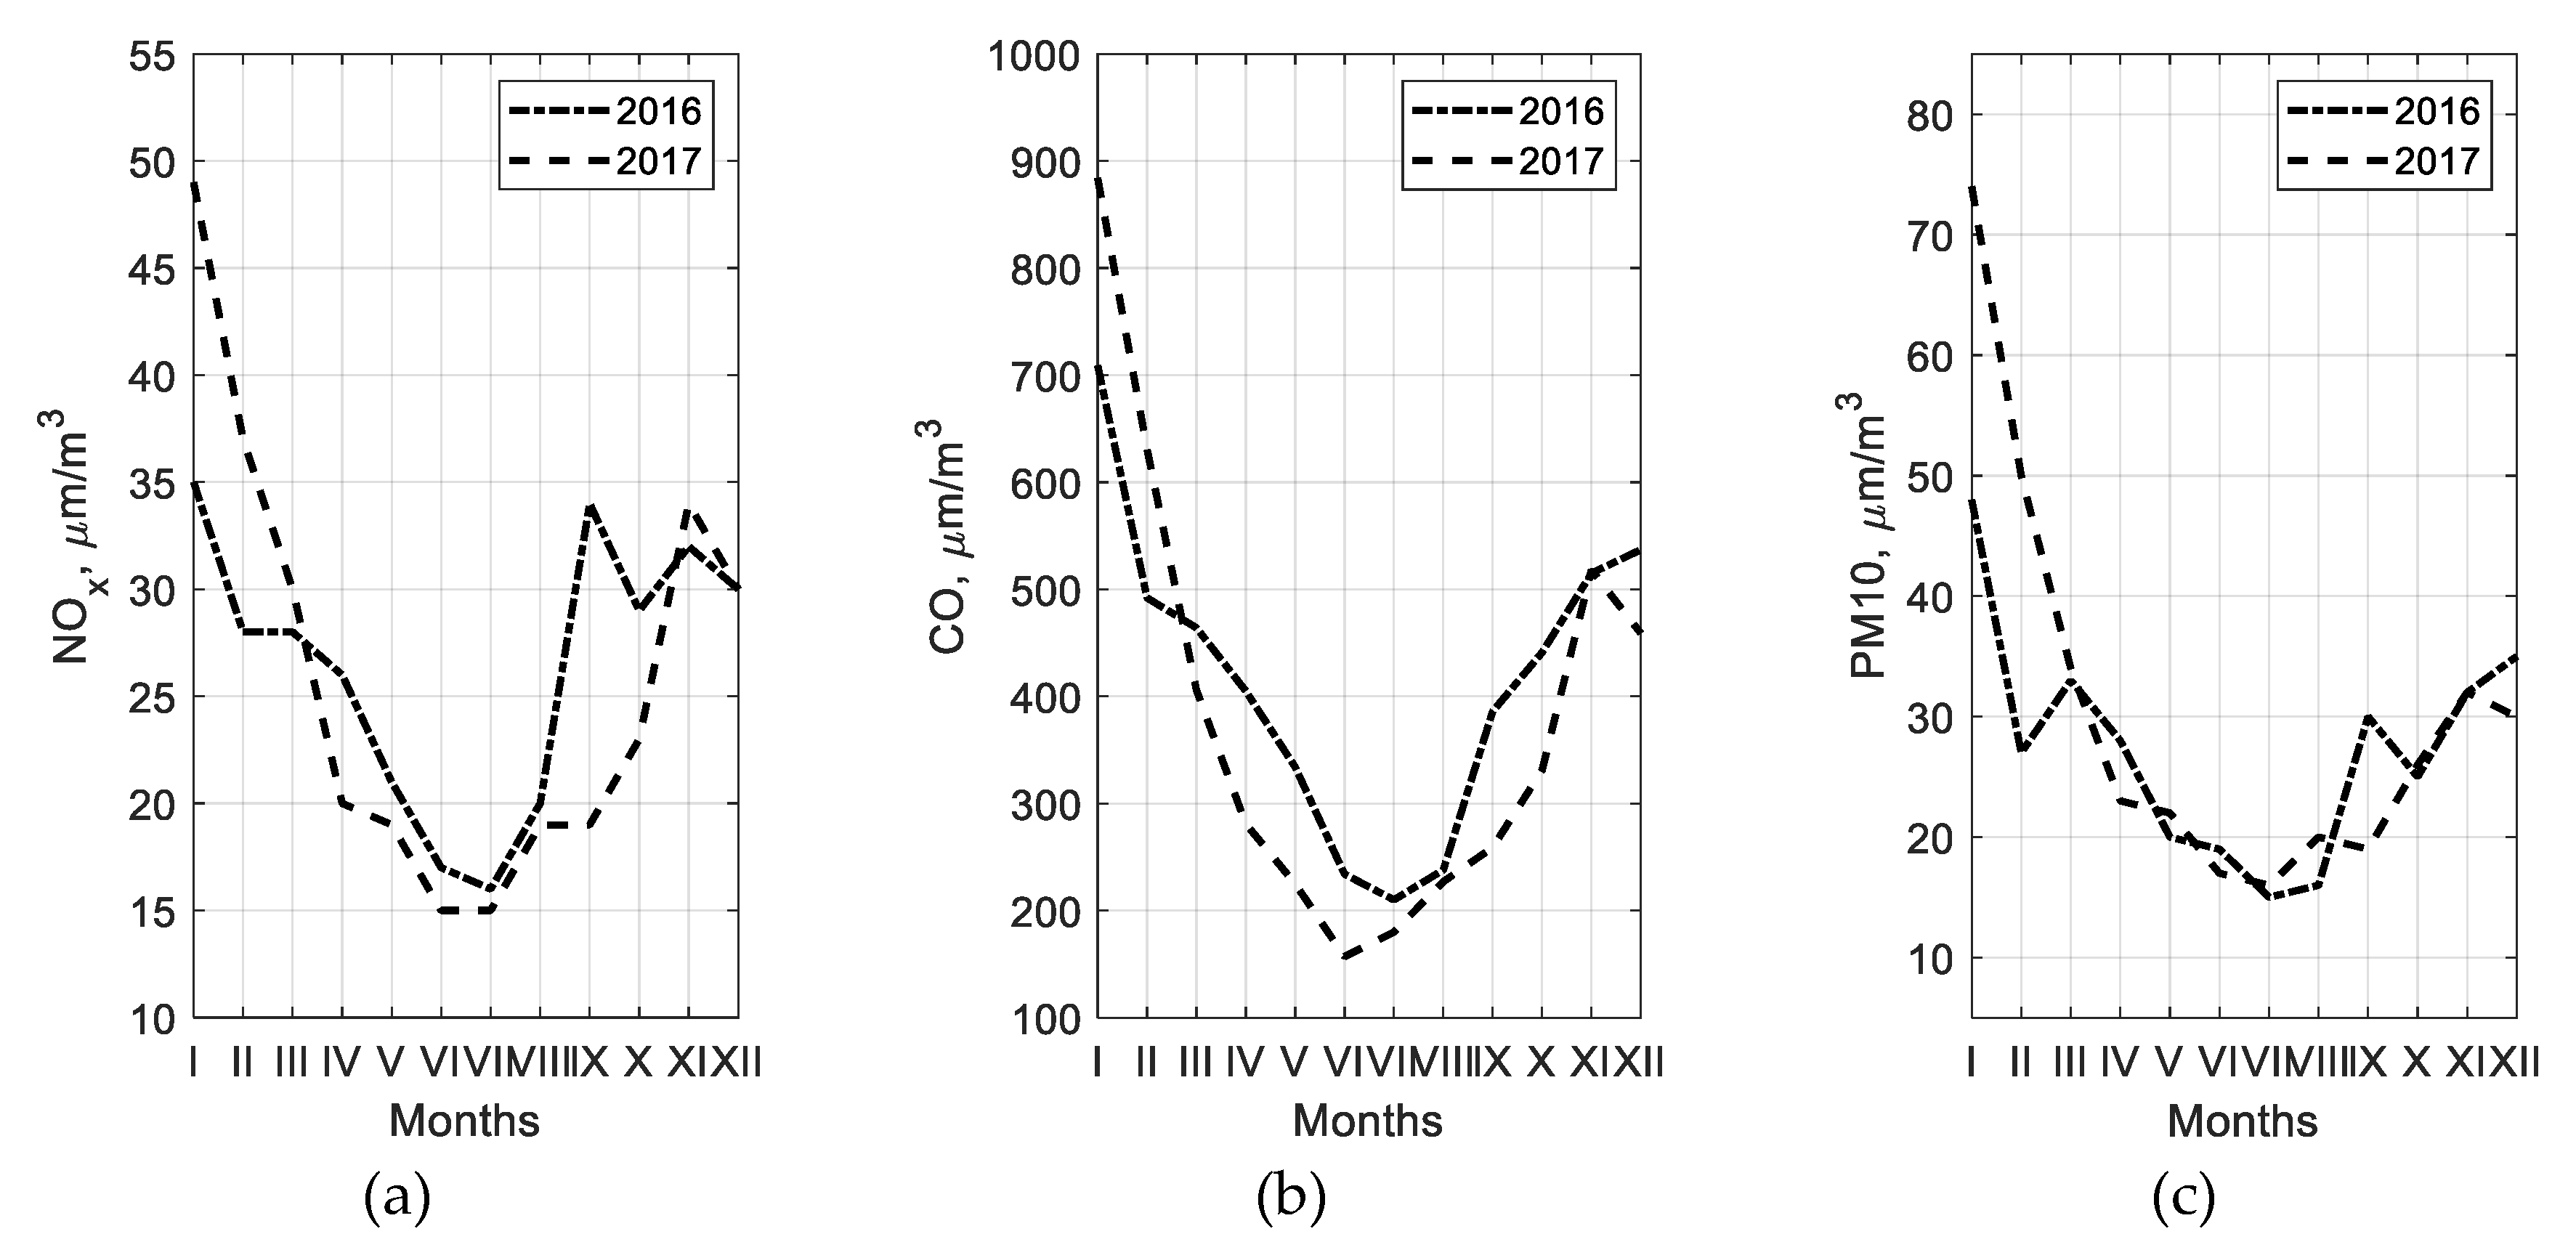
So far, there are no data to demonstrate the direct influence of road vehicles on air pollution in Rzeszow. The station monitoring the emissions makes general measurements, which take into account various sources of pollution, including both road vehicles and local heat sources [48]. This is clearly evidenced in Figure 14. The summer months see a clear decrease in emissions of some of the substances and therefore road vehicles can be assumed to be the main source of pollution in these months. With other heat sources active in winter months, the levels of emissions rise almost fourfold.
The summer months of 2017 saw a decrease in CO and NOx emissions compared to 2016.
5. Results and Planned Effects of the Actions Taken by the City’s Authorities
The overall objective of the city’s authorities is to change the transport preferences of its inhabitants, and thereby reduce the number of journeys by passenger cars. The actions by the authorities which aim to develop sustainable public transport can be classified into the areas in which relevant steps are taken.
The most significant areas include:
- developing the transport infrastructure (bus lanes, cycle lanes and parking lots),
- developing IT and Traffic Management systems,
- exchanging the public transport fleet.
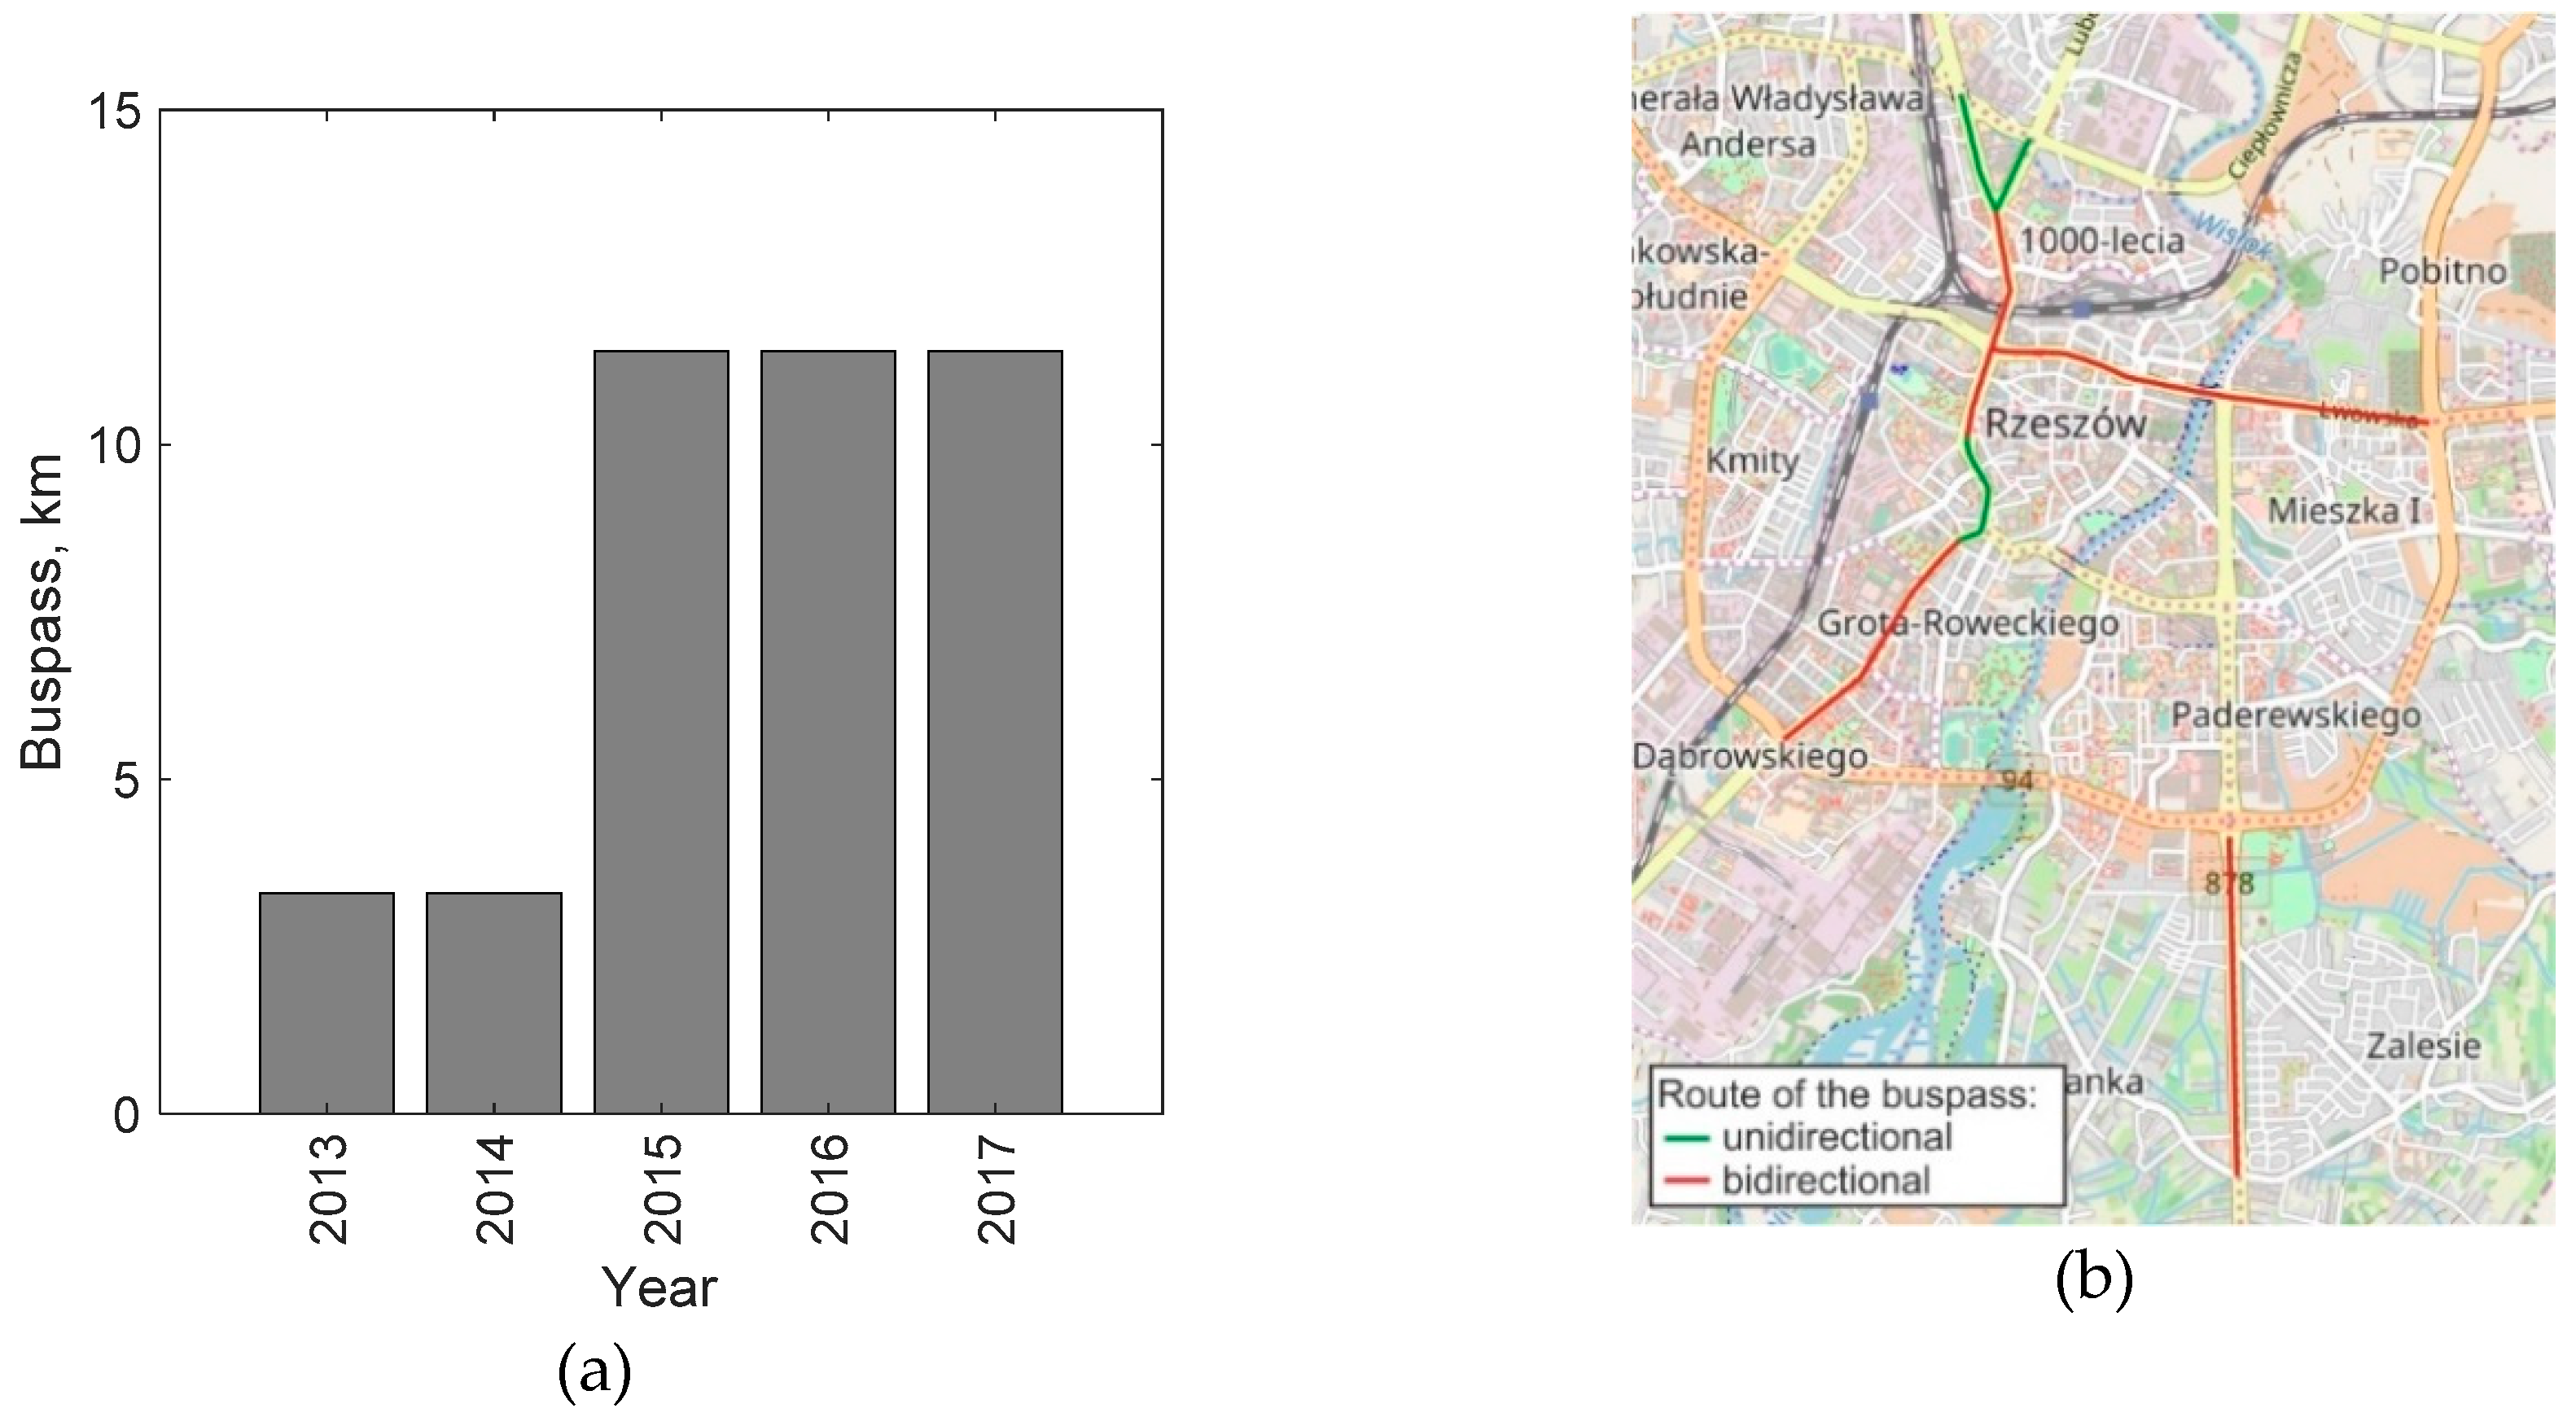
The implementation of all these actions has been supported by relevant EU funding, under the “European Funds - for the development of Eastern Poland” programme between 2007 and 2013 [49]. As part of this programme, with respect to transport infrastructure, the local transport network was restructured and the infrastructure was modernised with public transport in mind. A total of 11.4 km of bus pass were created, ensuring more efficient functioning of public transport during the peak periods.
The differences in bus pass lengths in recent years are shown in Figure 15a, along with their routes in the city’s area in Figure 15b. Furthermore, the network of cycle lanes was also developed throughout the years in which the programme was operational. This is shown in Figure 16a, while Figure 16b shows the routes of the cycle lanes throughout the city’s area.
With respect to IT and Traffic Management systems, the Integrated Traffic and Public Transportation Management System was designed and implemented along with a dedicated ICT platform [46]. It covers:
- Area Traffic Control System, comprising:
- a system for controlling traffic lights, to ensure fluid traffic flow and minimise waiting times at intersections,
- a system for prioritising public transport vehicles, to give the right of way to such vehicles,
- an information system for drivers that makes use of variable messages, to allow drivers to be quickly notified of impediments, changes in traffic organisation or recommended diversions;
- Public Transport Management System, to locate each vehicle in the city and to count the number of passengers, to give operators an opportunity to better manage service standards;
- Passenger Information System, to provide public transport passengers with information and notifications, in an efficient way. Information displays on bus stands could show the time remaining until the bus on a given route arrives, for example;
- Electronic Fare Collection System, with the aim of making public transport easier for the passengers by introducing e-tickets.
New modern buses were purchased with respect to modernising the public transport fleet. As part of the task, 80 modern ecological buses meeting the EEV emission standards were purchased, including:
- 30 12-metre buses powered by diesel fuel,
- 30 12-metre buses powered by natural gas,
- 20 10-metre buses powered by diesel fuel.
On 14 June 2017 [49] a new agreement of funding the project of the City of Rzeszow Municipality, called “The development of the public transportation system in Rzeszow” was concluded, concerning funds awarded within Operational Programme Eastern Poland 2014–2020. The project involves the purchase of 50 modern and ecological buses adjusted to the needs of disabled people. The purchase will include 10 zero-emission electric buses, to be used by the most overburdened bus lines running through the centre of the city. An appropriate system for charging batteries will be also installed in the bus depot and at the ends of the lines. As part of the programme, selected crossings, the road and pedestrian-bicycle infrastructure and bus bays will be rebuilt, along with an exchange of bus shelters. As part of the project, the Intelligent Transportation System of Rzeszow, which serves to manage the traffic and public transport within the territory of the city of Rzeszow, will be expanded with new functions. The project is to be completed on 31 December 2018.
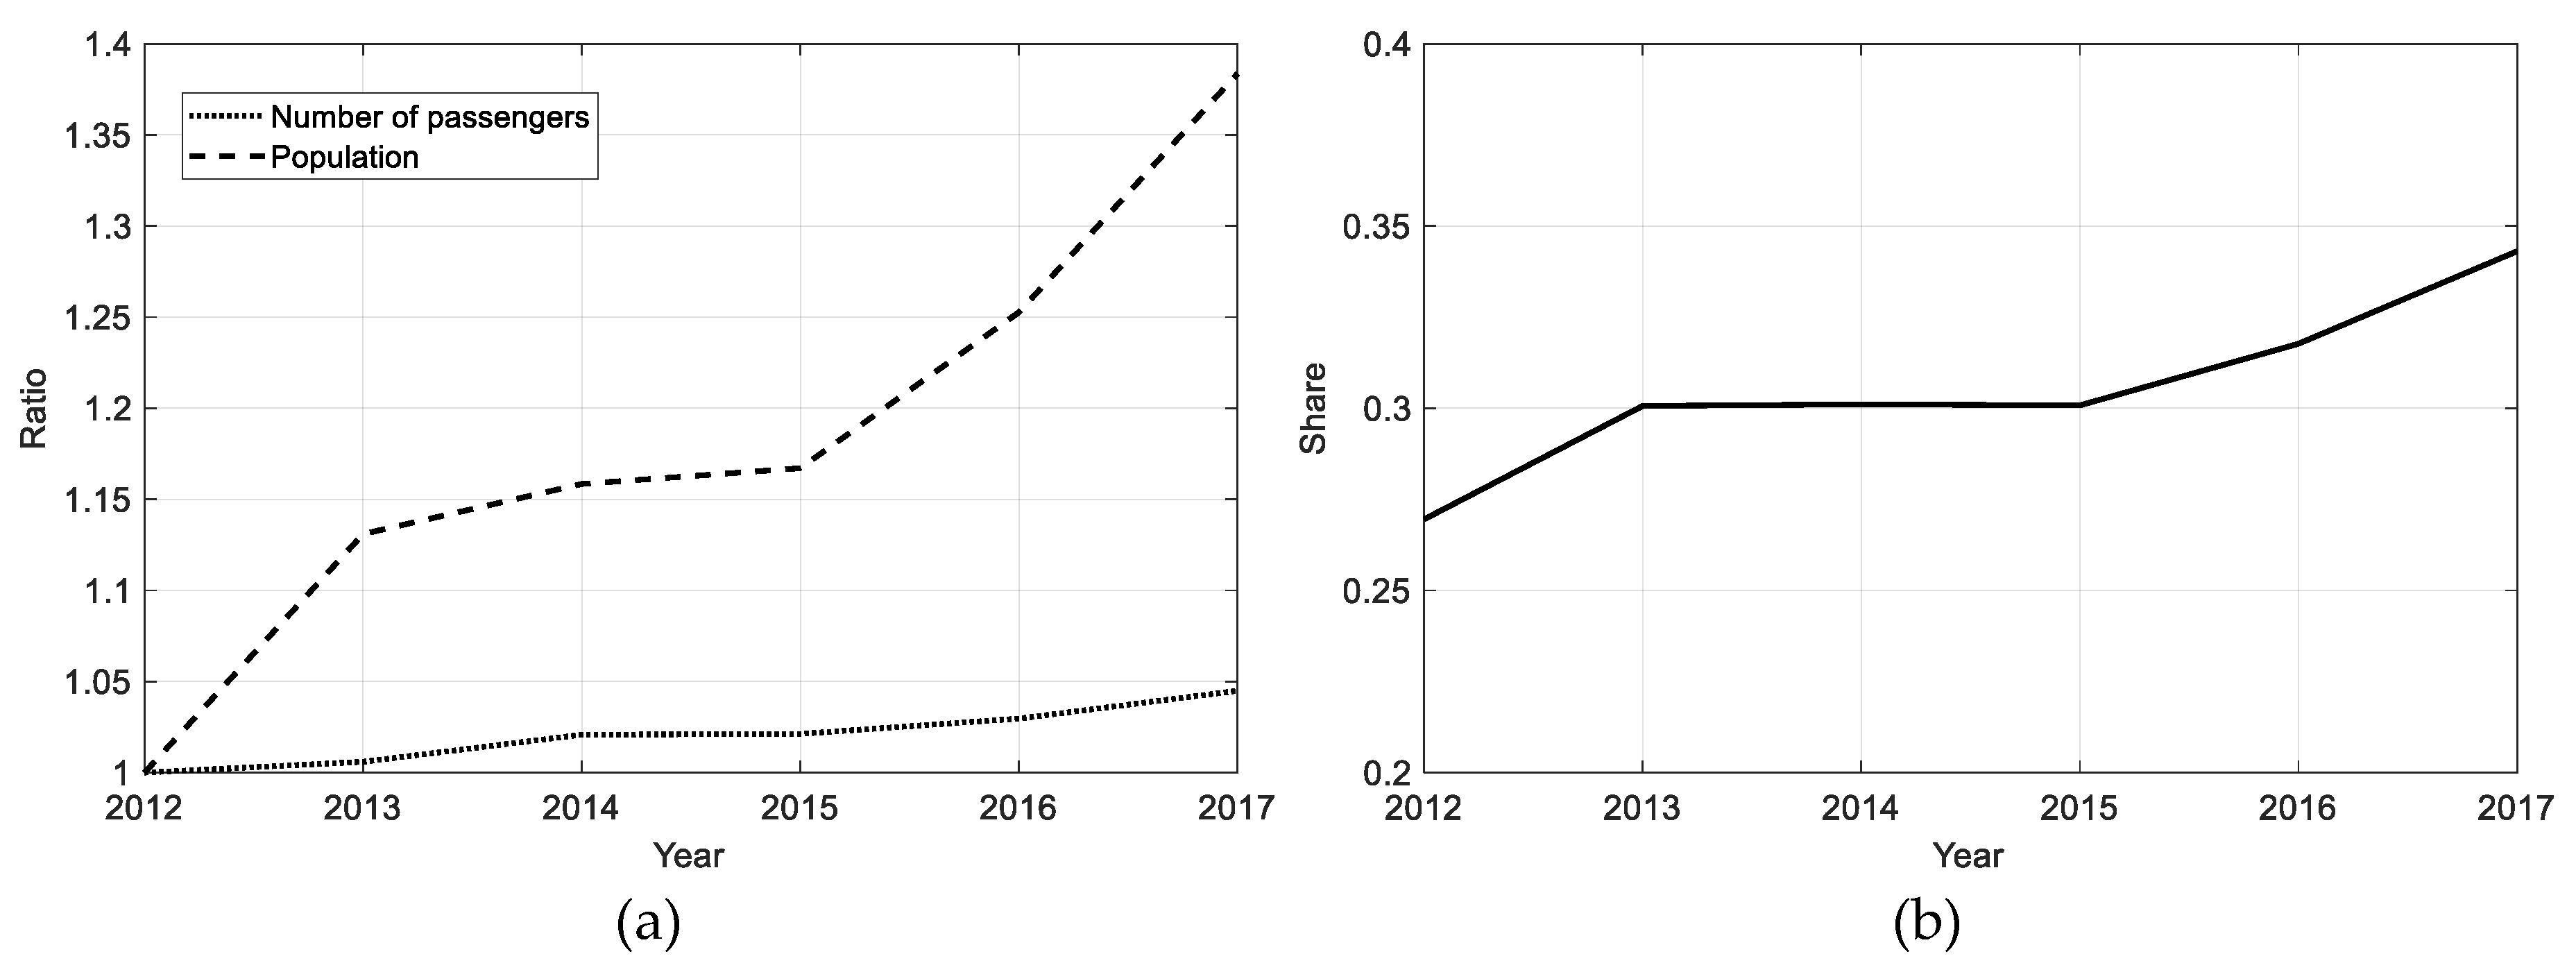
The actions taken so far by Rzeszow’s authorities to make public transport more attractive to the public have yielded some positive effects. 2012 was the last year in which there was visible decrease in the number of journeys taken by public transport. The years following saw a constant increase. The comparison of graphs illustrating Rzeszow’s population growth and the increase in the number of transported passengers evidences that the increase of transported passengers was more dynamic, as shown in Figure 17a. Suitable actions by the city’s authorities also contributed to greater interest in public transport with respect to journeys within the city. Taking into account the average traffic rate (determining the number of passenger journeys, according to the source [50]), an increase in the share of public transport was observed as shown in Figure 17b.
The data presented on the graphs clearly show that the steps taken by the city’s authorities have been effective. In the period of interest, there was a 38% increase in number of transported passengers.
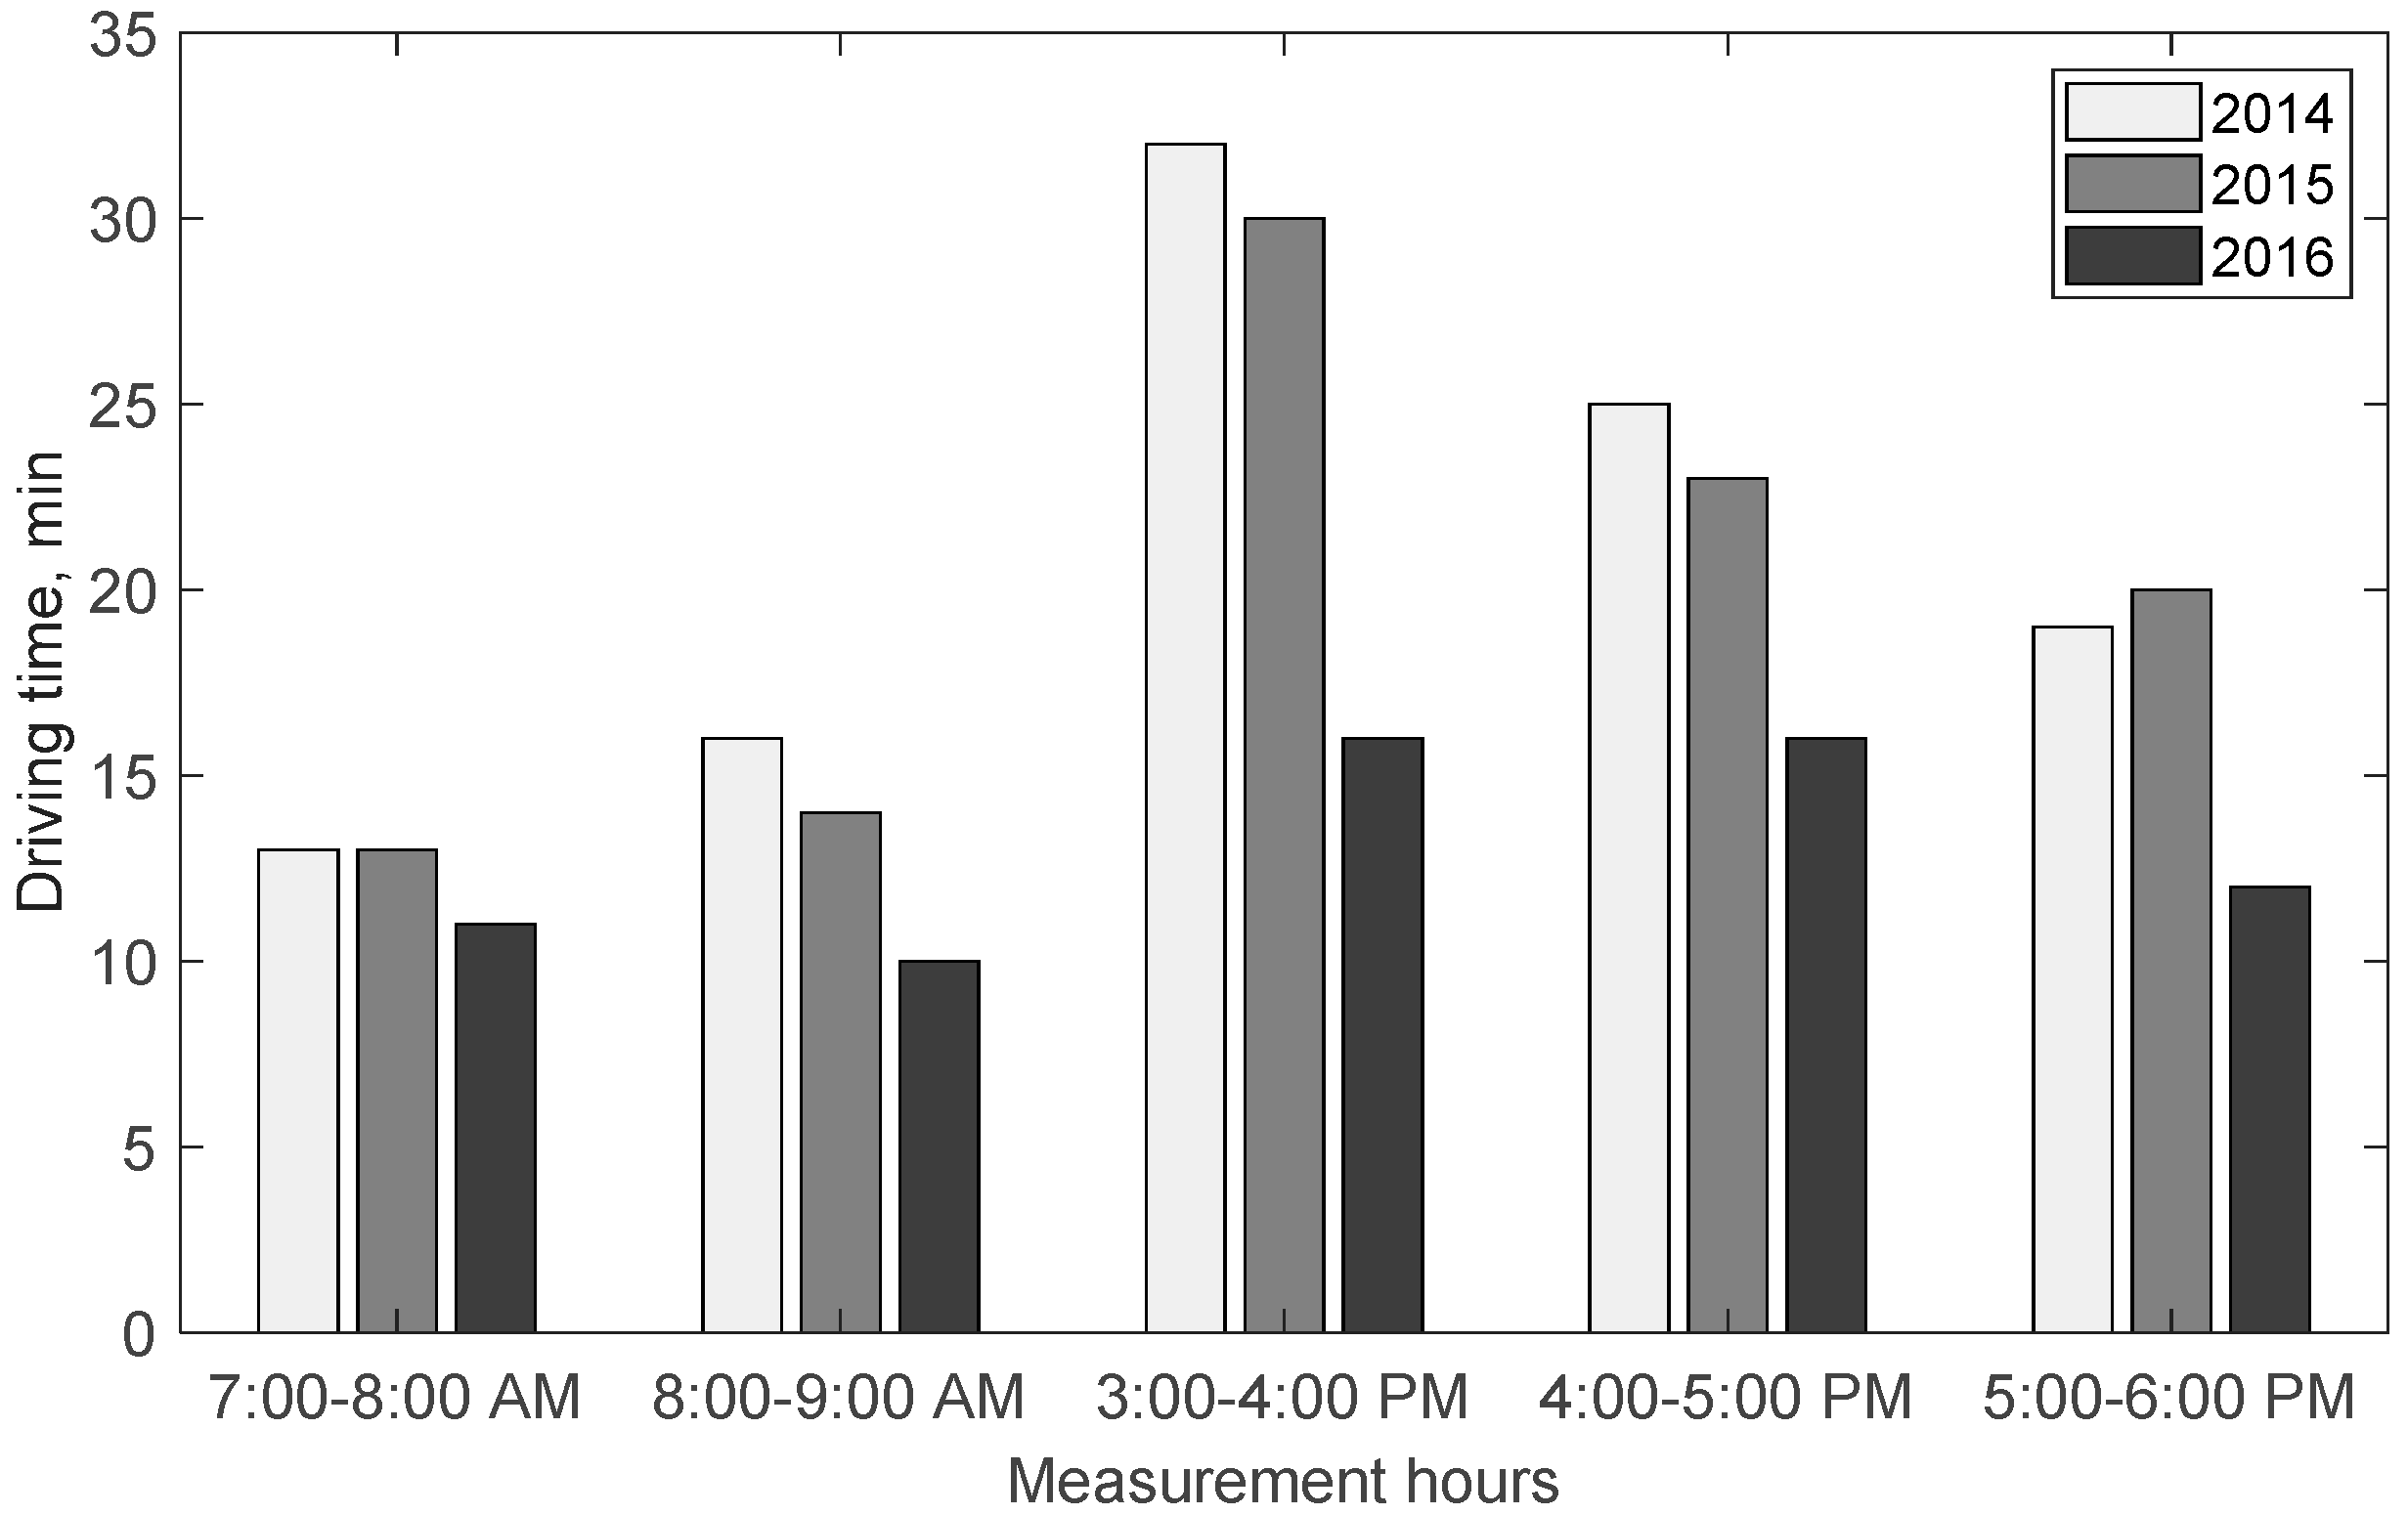
The effects visible in Figure 17a in the form of an increase in the number of passengers transported and in Figure 17b in the form of an increase share of in public transport journeys with respect to all journeys taken, result from many actions taken by the city’s authorities. Certainly, one of the more significant actions was reducing the public transport journey times during rush hours by introducing bus lanes and an integrated traffic control system. Figure 18 shows the difference in journey times for Route 18 buses, which run through the heart of the city, resulting from the introduction of bus lanes and an integrated traffic control system.
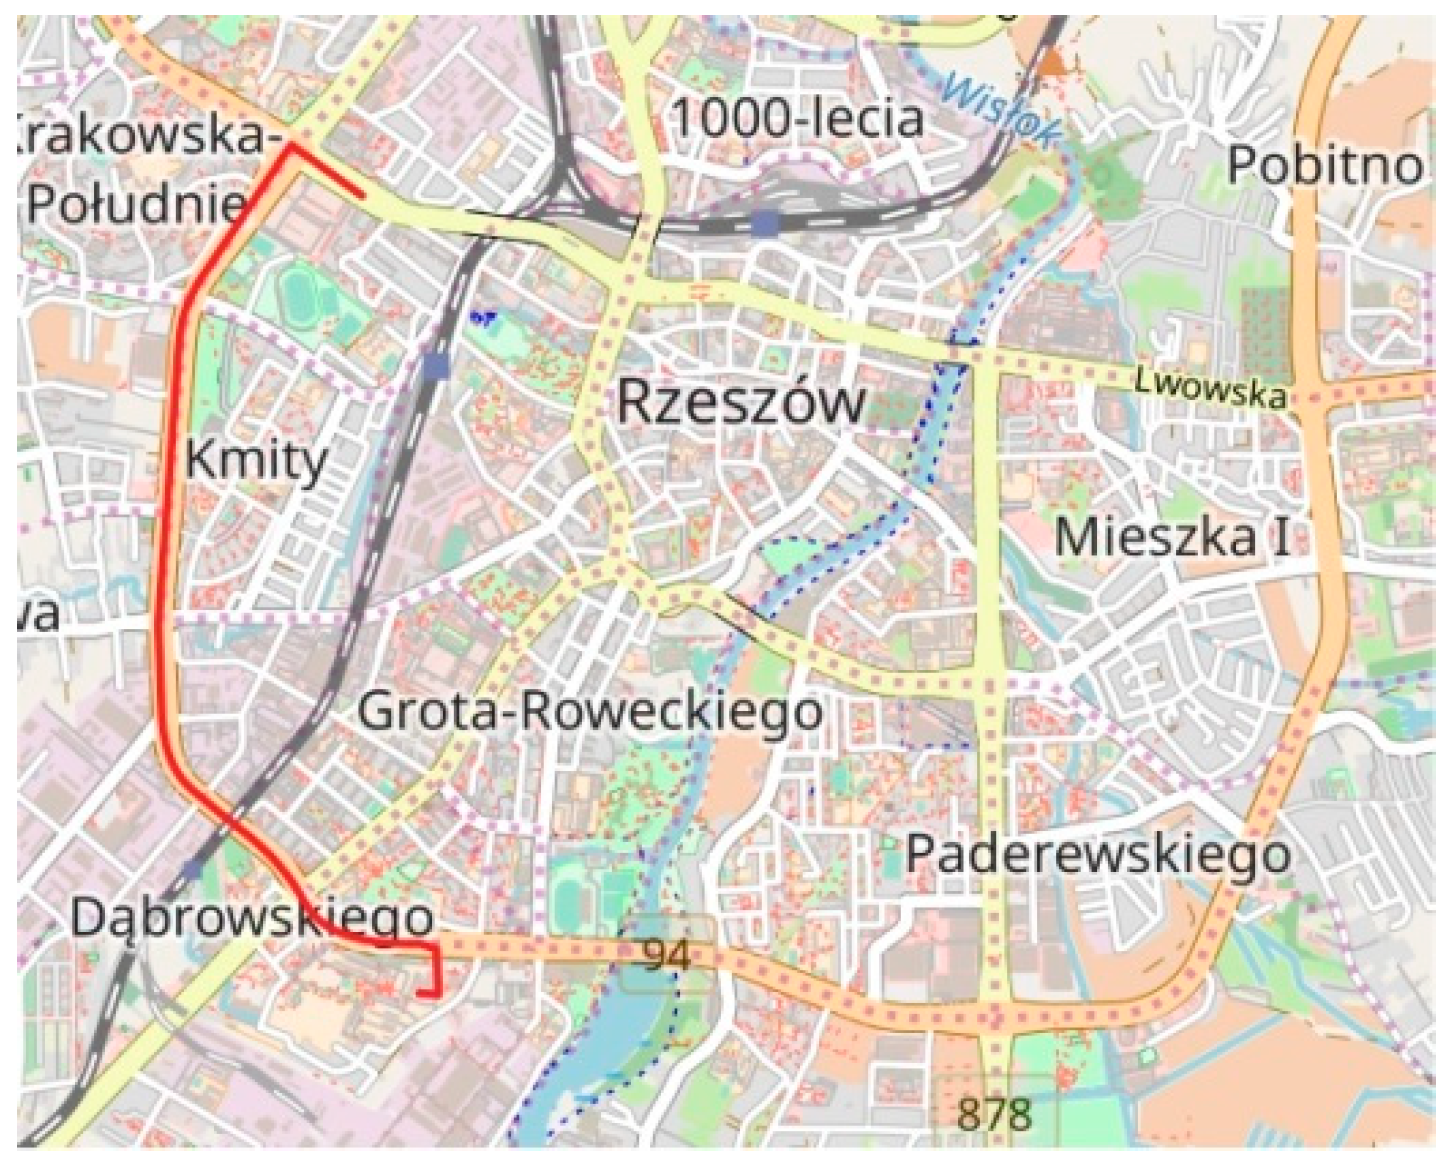
Another important course of action that the city’s authorities have taken to limit the number of journeys taken using private and public means of transport are investments in cycling routes. The development of the cycling route network contributed to an increase in the interest of taking journeys by bicycle. Apart from the significant health and ecological aspects, journeys by bicycle also resulted in reducing journey time in many cases. This is evidenced by the results for just one cycling route, as shown in Figure 19.
The route is 4.1 km long. It features a cycling lane throughout the entirety of its distance. The route is mostly flat, as the total level difference amounts to 16m. The route passes along one of the most heavily trafficked roads in Rzeszow. This road constitutes one part of the ring road in the city centre and reduces journey times from the northern to the southern part of the city. Traffic jams often occur on this route.
The results of the research concerning journey times for different means of transport on this route are presented in Table 3.
Journeys by bus take into account the time necessary for interchanges. Public transport does not operate on this route after 7:00 PM hours.
An analysis of the data included in Table 3 leads to the conclusion that only in the evening hours is it possible to complete the distance by car faster than by bicycle. Outside evening hours, the bicycle is definitely the faster means of transport, as well as being a zero-emission vehicle. The increase in the numbers of journeys taken by bicycle, and their percentage with respect to the total number of journeys taken, also contributes to reducing atmospheric pollution in the city.
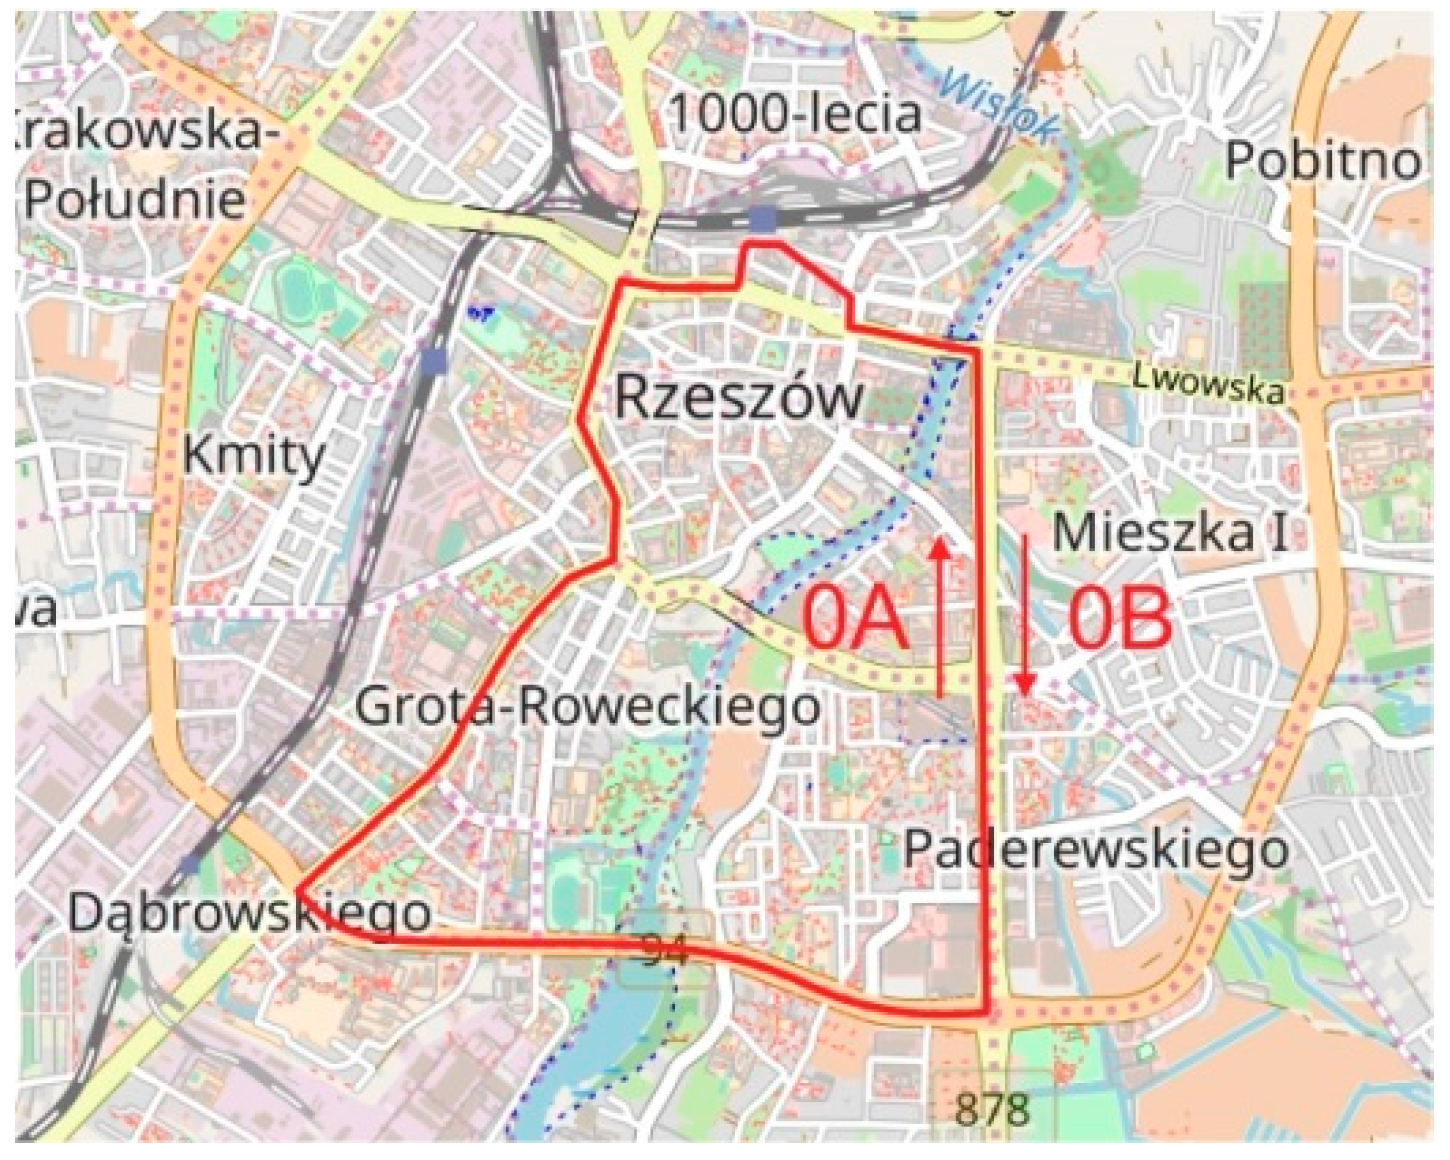
The final (continuous) course of action taken by the city’s authorities was investing in more ecological and convenient vehicles. The autumn of 2018 will see 10 electric zero-emission buses being put into service. The plans envisage using these buses on one of the most heavily used bus routes in Rzeszow: Route 0A and 0B. It has a circular shape and runs around the central part of the city. It begins at the main railway station and goes in both the clockwise and the counter-clockwise directions around the city, as shown in Figure 20.
A total of 88 journeys in each direction are made each working day. With an average route distance of 9.5 km, the buses travel 1,672 km along this route on each working day. At an average fuel consumption of 43 dm3 per 100 km, the buses consume 719 dm3 of diesel fuel per working day. Taking into account the working days and holidays (when there are half the number of journeys), the total yearly consumption amounts to around 180 tonnes of fuel. The introduction of electric buses on these routes should bring a decrease in fuel consumption, and limit the emission of harmful substances into the atmosphere.
6. Conclusions
The information and results of the author’s own research included in this article show that the actions taken by Rzeszow’s authorities with the aim of developing sustainable transportation are consistent and durable. Technical and organizational factors were used for this. These actions are supported by appropriate EU funds [19]. They lead to an increase in the attractiveness of public transport and the development of zero-emission transport, which also includes bicycle transport. Compared to other cities, the share of cycling is very low, and in this area further decisive action by the municipal authorities is required to develop this type of transport. Investments in bicycle paths without appropriate action to change transport habits are insufficient. The increase in the number of passengers using public transport has been greater than the growth in the city’s population in recent years. This positive effect has been achieved largely thanks to the steps taken by the city’s authorities, which has resulted in reducing public transport journey times and allowing traffic in congested areas to become more fluid. In the immediate perspective, it is predicted that public transport will be linked with individual bicycle, pedestrian, car and railway transportation by means of transport hubs. This will create an “eco-mobility chain”. Energy efficiency will further be improved with the planned and carried out purchases of modern buses (including buses with unconventional drives). With the energy efficiency of public transport improved, the negative effects on the environment can be reduced, especially concerning the emission of greenhouse gases and other toxic substances. The consistent implementation of all actions described in Section 5 on the part of the city’s authorities will have a significant impact on improving the quality of life in Rzeszow and on caring for the natural environment.
Author Contributions
Conceptualization, M.S., M.D. and P.D.; Formal analysis, M.S., M.D. and P.D.; Investigation, M.S., M.D. and P.D.; Visualization, M.S., M.D. and P.D.; Writing—original draft, M.S., M.D. and P.D.
Funding
This research received no external funding.
Conflicts of Interest
The authors declare no conflict of interest.
References
- European Commission. Report Brussels, 17.12.2013 COM (2013) 913 Final. Available online: https://ec.europa.eu (accessed on 1 September 2018).
- Mendiluce, M.; Schipper, L. Trends in passenger transport and freight energy use in Spain. Energy Policy 2011, 39, 6466–6475. [Google Scholar] [CrossRef]
- Pan, W.; Xue, Y.; He, H.; Lu, W. Impacts of traffic congestion on fuel rate, dissipation and particle emission in a single lane based on Nasch Model. Phys. A 2018, 503, 154–162. [Google Scholar] [CrossRef]
- Thomas, S. How green are electric vehicles? Int. J. Hydrog. Energy 2012, 37, 6053–6062. [Google Scholar] [CrossRef]
- Xia, T.; Nitschke, M.; Zhang, Y.; Shah, P.; Crabb, S.; Hansen, A. Traffic-related air pollution and health co-benefits of alternative transport in Adelaide, South Australia. Environ. Int. 2015, 74, 281–290. [Google Scholar] [CrossRef] [PubMed]
- Zhang, K.; Batterman, S. Air pollution and health risks due to vehicle traffic. Sci. Total Environ. 2013, 450–451, 307–316. [Google Scholar] [CrossRef]
- Khan, J.; Ketzel, M.; Kakosimos, K.; Sørensen, M.; Jensen, S. Road traffic air and noise pollution exposure assessment—A review of tools and techniques. Sci. Total Environ. 2018, 634, 661–676. [Google Scholar] [CrossRef]
- Kickhöfer, B.; Kern, J. Pricing local emission exposure of road traffic: An agent-based approach. Transp. Res. Part D 2015, 37, 14–28. [Google Scholar] [CrossRef]
- Olsson, L.; Hjalmarsson, L.; Wikström, M.; Larsson, M. Bridging the implementation gap: Combining backcasting and policy analysis to study renewable energy in urban road transport. Transp. Policy 2015, 37, 72–82. [Google Scholar] [CrossRef] [Green Version]
- Jochem, P.; Babrowski, S.; Fichtner, W. Assessing CO2 emissions of electric vehicles in Germany in 2030. Transp. Res. Part A 2015, 78, 68–83. [Google Scholar]
- Nurhadi, L.; Borén, S.; Ny, H. A sensitivity analysis of total cost of ownership for electric public bus transport systems in Swedish medium sized cities. Transp. Res. Procedia 2014, 3, 818–827. [Google Scholar] [CrossRef]
- Strielkowski, W. Social and Economic Implications for the Smart Grids of the Future. Econ. Sociol. 2017, 10, 310–318. [Google Scholar] [Green Version]
- Chowdhury, S.; Ceder, A.; Schwalger, B. The effects of travel time and cost savings on commuters’ decision to travel on public transport routes involving transfers. J. Transp. Geogr. 2015, 43, 151–159. [Google Scholar] [CrossRef]
- Corazza, M.; Guida, U.; Musso, A.; Toz, M. A European vision for more environmentally friendly buses. Transp. Res. Part D Transp. Environ. 2016, 45, 48–63. [Google Scholar] [CrossRef]
- Erdoğan, S.; Miller-Hooks, E. A Green Vehicle Routing Problem. Transp. Res. Part E 2012, 48, 100–114. [Google Scholar] [CrossRef]
- Fulda, A.S.; Nimal, E. Node: Methodology for energy balance for a transportation hub and its neighbourhood. Transp. Res. Procedia 2014, 4, 25–41. [Google Scholar] [CrossRef]
- Nosal, K.; Solecka, K. Application of AHP method for multi-criteria evaluation of variants of the integration of urban public transport. Transp. Res. Procedia 2014, 3, 269–278. [Google Scholar] [CrossRef]
- Poliak, M.; Poliaková, A.; Mrníková, M.; Šimurková, P.; Jaśkiewicz, M.; Jurecki, R. The Competitiveness of Public Transport. J. Compet. 2017, 9, 81–97. [Google Scholar] [CrossRef] [Green Version]
- Eißel, D.; Chu, C. The future of sustainable transport system for Europe. AI Soc. 2014, 29, 387–402. [Google Scholar] [CrossRef]
- Anderson, L. Effects of using renewable fuels on vehicle emissions. Renew. Sustain. Energy Rev. 2015, 47, 162–172. [Google Scholar] [CrossRef]
- Simionescu, M.; Albu, L.L.; Raileanu Szeles, M.; Bilan, Y. The impact of biofuels utilisation in transport on the sustainable development in the European Union. Technol. Econ. Dev. Econ. 2017, 23, 667–686. [Google Scholar] [CrossRef]
- Androniceanu, A. The quality of the urban transport in Bucharest and how to improve it in accordance with the expectations of the citizens. Theor. Empir. Res. Urban Manag. 2016, 11, 5–18. [Google Scholar]
- Beirao, G.; Cabral, J.A. Understanding attitudes towards public transport and private car: A qualitative study. Transp. Policy 2007, 14, 478–489. [Google Scholar] [CrossRef]
- Fallde, M.; Eklund, M. Towards a sustainable socio-technical system of biogas for transport: The case of the city of Linkoping in Sweden. J. Clean. Prod. 2015, 98, 17–28. [Google Scholar] [CrossRef]
- Haywood, L.; Koning, M.; Prud’homme, R. The economic cost of subway congestion: Estimates from Paris. Econ. Transp. 2018, 14, 1–8. [Google Scholar] [CrossRef]
- Nurhadi, L.; Borén, S.; Ny, H. Advancing from efficiency to sustainability in Swedish medium-sized cities: An approach for recommending powertrains and energy carriers for public bus transport systems. Procedia Soc. Behav. Sci. 2014, 111, 1218–1225. [Google Scholar] [CrossRef]
- Redman, L.; Friman, M.; Garling, T.; Hartig, T. Quality attributes of public transport that attract car users: A research review. Transp. Policy 2013, 25, 119–127. [Google Scholar] [CrossRef]
- Siedler, H. Can bus rapid transit be a sustainable means of public transport in fast growing cities? Empirical evidence in the case of Oslo. Transp. Res. Procedia 2014, 1, 109–120. [Google Scholar] [CrossRef]
- Europen Platform on Mobility Management. Available online: http://www.epomm.eu (accessed on 27 December 2018).
- Hülsmann, F.; Regine Gerike, R.; Ketzel, M. Modelling traffic and air pollution in an integrated approach—The case of Munich. Urban Clim. 2014, 10, 732–744. [Google Scholar] [CrossRef]
- EU Transport in Figures, Statistical Pocketbook 2017. Available online: https://ec.europa.eu (accessed on 1 September 2018).
- Can, A.; Leclercq, L.; Lelong, J. Dynamic estimation of urban traffic noise: Influence of traffic and noise source representations. Appl. Acoust. 2008, 69, 858–867. [Google Scholar] [CrossRef] [Green Version]
- Börjesson, M.; Eliasson, J.; Hugosson, M.B.; Brundell-Freij, K. The Stockholm congestion charges—5 years on. Effects, acceptability and lessons learnt. Transp. Policy 2012, 20, 1–12. [Google Scholar]
- Kaddoura, I.; Nagel, K. Simultaneous internalization of traffic congestion and noise exposure costs. Transportation 2018, 45, 1579–1600. [Google Scholar] [CrossRef]
- Mussone, L.; Grant-Muller, S.; Laird, J. Sensitivity analysis of traffic congestion costs in a network under a charging policy. Case Stud. Transp. Policy 2015, 3, 44–54. [Google Scholar] [CrossRef] [Green Version]
- Prud’homme, R.; Koning, M.; Lenormand, L.; Fehr, A. Public transport congestion costs: The case of the Paris subway. Transp. Policy 2012, 21, 101–109. [Google Scholar] [CrossRef]
- The Most Traffic Jam Prone Cities in Europe. Available online: https://www.statista.com (accessed on 1 October 2018).
- TomTom Traffic Index. Available online: https://www.tomtom.com/en_gb/trafficindex/ (accessed on 1 September 2018).
- Road Traffic Remains Biggest Source of Noise Pollution in Europe. Available online: https://www.eea.europa.eu (accessed on 1 September 2018).
- Halonen, J.; Hansell, A.; Gulliver, J.; Morley, D.; Blangiardo, M.; Fecht, D.; Toledano, M.; Beevers, S.; Anderson, H.; Kelly, F.; et al. Road traffic noise is associated with increased cardiovascular morbidity and mortality and all-cause mortality in London. Eur. Heart J. 2015, 36, 2653–2661. [Google Scholar] [CrossRef] [PubMed] [Green Version]
- European Environment Agency. Available online: https://www.eea.europa.eu (accessed on 1 September 2018).
- Kyçyku, A.; Lajqi, S.; Hoxha, G. Analytical calculation of vehicles noise in the road traffic and graphical presentation. IFAC-PapersOnLine 2016, 49, 52–57. [Google Scholar]
- Hamet, J.-F.; Besnard, F.; Doisy, S.; Lelong, J.; Duc, E. New vehicle noise emission for French traffic noise prediction. Appl. Acoust. 2010, 71, 861–869. [Google Scholar] [CrossRef]
- Ramírez, A.; Domínguez, E. Modeling urban traffic noise with stochastic and deterministic traffic models. Appl. Acoust. 2013, 74, 614–621. [Google Scholar] [CrossRef]
- Statistical Office in Rzeszów. Available online: http://rzeszow.stat.gov.pl/ (accessed on 1 September 2018).
- Board of Urban Transport in Rzeszow. Available online: http://ztm.rzeszow.pl/ (accessed on 1 June 2018).
- Smieszek, M.; Dobrzanska, M.; Dobrzanski, P. An Analysis of Transportation Times and the Loading of the Selected Line of Urban Communication in Rzeszow. Adv. Mech. Eng. Transp. 2016, 2, 18–23. [Google Scholar]
- Regional Inspectorate for Environmental Protection in Rzeszow. Available online: https://stacje.wios.rzeszow.pl/ (accessed on 1 June 2018).
- Operational Programme Eastern Poland 2014–2020. Available online: http://www.transport.rzeszow.pl (accessed on 1 June 2018).
- Smieszek, M.; Dobrzanska, M.; Dobrzanski, P. Analysis of changes in public transport of the European Union on the example of selected cities. Humanit. Soc. Sci. 2016, 21, 137–151. [Google Scholar]
Figure 1.
CO2 emissions from various types of road vehicle in EU Member States with respect to 1990 (base year).
Figure 1.
CO2 emissions from various types of road vehicle in EU Member States with respect to 1990 (base year).

Figure 2.
CO2 emissions from road vehicles in respective EU Member States.


Figure 4.
Percentage increase in journey times arising from congestion in selected European cities.

Figure 5.
The influence of the number of cars in traffic on the noise generated.

Figure 6.
Road fatalities in selected countries over the years [31].
Figure 6.
Road fatalities in selected countries over the years [31].

Figure 7.
Road fatalities in selected countries taking into account the chosen indicators for 2015.

Figure 8.
Development of the city in recent years: (a) number of inhabitants, (b) area of the city.

Figure 9.
Number of registered passenger cars within the territory of the city: (a) in general, (b) per 1 000 inhabitants.
Figure 9.
Number of registered passenger cars within the territory of the city: (a) in general, (b) per 1 000 inhabitants.

Figure 10.
The total: (a) length of roads in Rzeszow, (b) number of cars per kilometre of road.

Figure 11.
The number of: (a) transported passengers, (b) vehicle-kilometres.

Figure 12.
Transport lines in Rzeszow: (a) total length, (b) number of bus stops.

Figure 13.
Journey times for Route 0 buses on: (a) work days (b) holidays.

Figure 14.
Emission of selected substances into the atmosphere (a) NOx, (b) CO, (c) PM10.

Figure 15.
Length and route of the bus pass.

Figure 16.
Length and route of the cycle lanes marked on the map of the red colour.

Figure 17.
Indices characterising public transport in Rzeszow: (a) dynamics of the increase in the number of transported passengers and the city’s population growth, (b) share of public transport in the total number of trips.
Figure 17.
Indices characterising public transport in Rzeszow: (a) dynamics of the increase in the number of transported passengers and the city’s population growth, (b) share of public transport in the total number of trips.

Figure 18.
Journey time for Route 18 buses from Dabrowskiego to Lubelska Street—before and after the introduction of bus pass and an integrated traffic control system.
Figure 18.
Journey time for Route 18 buses from Dabrowskiego to Lubelska Street—before and after the introduction of bus pass and an integrated traffic control system.

Figure 19.
The cycle route which was taken into account (red colour).

Figure 20.
Outline of the 0A and 0B bus routes (red color).


Table 1.
Number of residential units, number of people residing in these units, and the area of Rzeszow exposed to roadway noise (assessed using the Leq coefficient).
Table 1.
Number of residential units, number of people residing in these units, and the area of Rzeszow exposed to roadway noise (assessed using the Leq coefficient).
| Noise Level [dB] | Number of Residential Units | Number of People | City Area [km2] |
|---|---|---|---|
| 55–60 | 18,345 | 55,600 | 8.872 |
| 60–65 | 15,554 | 44,000 | 6.363 |
| 65–70 | 1928 | 4800 | 3.734 |
| 70–75 | 646 | 1500 | 1.213 |
| >75 | 0 | 0 | 0.273 |
Table 2.
Comparison of roadway noise levels during the day.
| Street | Equivalent Continuous Sound Level Leq [dB] Measurements | |
|---|---|---|
| 6:00 AM–10:00 PM | 10:00 PM–6:00 AM | |
| Gen. Jaroslawa Dabrowskiego | 66.7 | 63.3 |
| Leopolda Lisa-Kuli | 69.1 | 59.1 |
| Marszalkowska | 64.2 | 60.8 |
| Podkarpacka | 64.0 | 54.6 |
Table 3.
An overview of journey times on the route of interest.
| Time of Day/Means of Transport | Time [min]: | ||
|---|---|---|---|
| Bicycle | Car | Bus | |
| 7:30 AM | 15 | 25 | 30 |
| 4:00 PM | 15 | 35 | 41 |
| 8:00 PM | 15 | 8 | - |
© 2019 by the authors. Licensee MDPI, Basel, Switzerland. This article is an open access article distributed under the terms and conditions of the Creative Commons Attribution (CC BY) license (http://creativecommons.org/licenses/by/4.0/).
Share and Cite
MDPI and ACS Style
Smieszek, M.; Dobrzanska, M.; Dobrzanski, P. Rzeszow as a City Taking Steps Towards Developing Sustainable Public Transport. Sustainability 2019, 11, 402. https://doi.org/10.3390/su11020402
AMA Style
Smieszek M, Dobrzanska M, Dobrzanski P. Rzeszow as a City Taking Steps Towards Developing Sustainable Public Transport. Sustainability. 2019; 11(2):402. https://doi.org/10.3390/su11020402
Chicago/Turabian StyleSmieszek, Miroslaw, Magdalena Dobrzanska, and Pawel Dobrzanski. 2019. "Rzeszow as a City Taking Steps Towards Developing Sustainable Public Transport" Sustainability 11, no. 2: 402. https://doi.org/10.3390/su11020402
Note that from the first issue of 2016, this journal uses article numbers instead of page numbers. See further details here.