Feasibility Analysis of Behind-the-Meter Energy Storage System According to Public Policy on an Electricity Charge Discount Program


1
School of Electrical Engineering, Korea University, Anam Campus, 145 Anam-ro, Seongbuk-gu, Seoul 02841, Korea
2
Regional Cooperation Division, Korea Energy Agency, 388 Poeun Dae-ro, Suji-gu, Yongin-si, Gyunggi-do 16842, Korea
3
Department of Electrical Engineering, Hanbat National University, 125 Dongseo-daero, Yuseong-gu, Daejeon 34158, Korea
*
Author to whom correspondence should be addressed.
Sustainability 2019, 11(1), 186; https://doi.org/10.3390/su11010186
Submission received: 29 November 2018
/
Revised: 18 December 2018
/
Accepted: 21 December 2018
/
Published: 1 January 2019
(This article belongs to the Special Issue Smart Energy Management for Smart Grids)
Abstract
:Energy storage systems are crucial in dealing with challenges from the high-level penetration of renewable energy, which has inherently intermittent characteristics. For this reason, various incentive schemes improving the economic profitability of energy storage systems are underway in many countries with an aim to expand the participation rate. The electricity charge discount program, which was introduced in 2015 in Korea, is one of the policies meant to support the economic feasibility of demand-side energy storage systems. This paper quantitatively evaluated the impact of the electricity charge discount program on the economic feasibility of behind-the-meter energy storage systems. In this work, we first summarized how electricity customers can benefit from behind-the-meter energy storage systems. In addition, we represented details of the structure that make up the electricity charge discount program, i.e., how the electricity charge is discounted through the discount scheme. An optimization problem that establishes a charge and discharge schedule of an energy storage system to minimize each consumer’s electricity expenditure was defined and formulated as well. The case study results indicated that the electricity charge discount program has improved the profitability of behind-the-meter energy storage systems, and this improved profitability led to investment in behind-the-meter energy storage systems in Korea. As a result of the electricity charge discount program, Korea’s domestic demand side energy storage system market size, which was only 27 billion dollars in 2015 in Korea, has grown to 825 billion dollars in 2018.
1. Introduction
In the 2016 Paris Climate Change Agreement, South Korea committed to a 37% reduction target by 2030 [1]. In order to achieve this, Korea announced the 3020 Renewable Energy Implementation Plan on December 2017 [2,3]. The renewable portfolio standard (RPS) was strengthened, while the proportion of renewable energy generation was increased, and the aging coal plant shut down plan was begun in Korea [2,4]. However, integrating renewable energy resources with the power system can negatively affect the power system, due to the inherent intermittency of renewable energy resources and rapid variation of renewable energy generation [4]. Particularly in an isolated power system with relatively low power system inertia, like Korea, the negative impact of intermittent renewable energy resources may have greater leverage [5]. As one of the various solutions to relieve the impact of renewable energy resources integration, global leaders—such as the U.S. and Germany—are promoting the expansion of energy storage system (ESS) applications [6]. Korea has also been supporting ESS businesses and technologies. Plans to disseminate 1.7 GW ESS by 2020 through the research and development (R&D) investment of $5.7 billion and the establishment of institutional incentives were announced in 2010 [7]. A renewable energy certificate (REC) is given to ESSs that are linked to renewable energy, such as wind and photovoltaic power [8]. In the transmission and distribution networks, ESS has provided the primary and secondary frequency regulation service and substitution for upgrade of decrepit distribution network facilities. The ESS supply business is proceeding annually with government subsidies, and electricity charge discount programs are provided for using ESS to reduce consumers’ electricity bills.
ESS is a solution to various challenges associated with power systems. ESS applications improve the flexibility and reliability of the power system [9,10]. First of all, ESS does not require external excitation to start. This makes ESS suitable for providing a black start service. Case studies of black start services of ESSs in medium voltage distribution networks are discussed in Manganelli et al. [11]. Further, upgrades of transmission and distribution network facilities can be deferred through ESS installation [12,13,14].
ESS is more useful for providing frequency regulation services than conventional generators due to the fast ramping capability of ESS [15,16]. The determination scheme of the optimal cost-effective size of ESS to provide a primary frequency reserve has been studied [17,18]. In the New York Independent System Operator’s market, an ESS is more profitable on load frequency control service than energy arbitrage on the customer side [19].
According to Moore and Shabani [6], the ESS capacity should be 10 to 20 percent of the total intermittent renewable energy generation in order to avoid power system disturbance caused by the integration of renewable energy generation. Mitigating the fluctuation of intermittent renewable energy generation through ESSs has been studied in Zhao et al., Beaudin et al., Barton and Infield and Suberu et al. [20,21,22,23]. The determination of the size and location of ESS installation for integrating wind power generation has also been studied in Nguyen and Lee and Dvorkin et al. [24,25]. Nguyen and Lee [24] examined a method of dispatching wind power generation while minimizing the size of ESS connected with wind power and Dvorkin et al. [25] conducted a study for the determination of the size and location of ESS installation so as to maximize profit through energy arbitrage through surplus power from renewable generation variation.
Numerous studies have been carried out on ESS applications as demand-side energy resources, and these have mainly focused on reducing each customer’s electricity expenditure. The charge and discharge scheduling of behind-the-meter ESS for a smart home’s electricity bill minimization is studied in Longe et al. [26]. The proposed energy scheduling and distributed storage (ESDS) algorithm of Longe et al. [26] aims to reduce electricity bills while increasing customer satisfaction. Studies on charge and discharge scheduling algorithms further considered the operation and wear-out costs of batteries [27,28]. The proposed scheduling schemes are established in consideration of the fact that repetitive charge and discharge of ESS degrade each battery’s lifetime. In Babacan et al. [29], the scheduling algorithm of the behind-the-meter ESS aiming to minimize each customer’s electricity expenditure, as well as mitigate the fluctuation of net demand load with solar photovoltaic generation, is proposed and demonstrated. In addition, an optimization scheme for sizing the behind-the-meter ESS in peak shaving application for a base charge reduction of electricity bills is proposed and demonstrated in Martins et al. [30].
ESS applications on the demand side bring economic benefits to electricity customer first. Further, large amounts of demand-side ESSs improve public value, such as a power system’s flexibility and reliability [31,32]. The increase of ESS capacity on the demand side in the power system provides controllability of the demand loads that increases the demand-side management capability, resolves the fluctuation of distributed generation and uncertainty of loads, and reduces tangible and intangible costs for power system operation. For these reasons, governments in various countries around the world have implemented policies encouraging the dissemination of ESS [6,33]. These governments have initiated subsidies, released loan support funds, and introduced incentive programs in tax credit and electricity tariff systems.
Subsidies to supplement the low profitability of ESS with high initial investment costs are the most direct way to improve the economic feasibility of ESS. In Germany, one-third of the installation costs for ESS with solar panels are subsidized. In Japan, since the Great East Japan Earthquake, federal government and municipal governments have enhanced subsidy programs for the purpose of widely spreading household emergency power sources. In California, USA, the Self-Generation Incentive Program (SGIP) offers subsidies for advanced ESSs [33]. In Korea, more than 85 MW, 210 MWh ESSs have been installed through government subsidies of more than $53.6 billion.
These governments have also enforced mandatory installation schemes. In California, the major power suppliers in the state are obliged to install 1325 MW of ESSs by 2020, and they are currently issuing orders to install ESSs, which are equivalent to 1% of the peak time power requirement for small businesses [33]. This installation obligation will be gradually strengthened from 2.25% of the electricity supply in 2014 to 5% in 2020. In Korea, ESS has been mandatory in the public sector since 2017. All of the public buildings in Korea with a contract power of 1000 kW or more should install an ESS [34]. The capacity of installed ESS should be more than five percent of the building’s contract power. ESS has to be preferentially considered as a back-up power source of public buildings when back-up power is installed at public buildings. In addition, the states of Oregon and Massachusetts have also enforced mandatory programs for ESS [33].
Financial incentives are introduced and initiated in Korea for improving the economic effectiveness of behind-the-meter ESSs. Up to a six percent investment tax credit is given to electricity customers who install an ESS with a high efficiency certification at their own sites. Through the ESS electricity charge discount program (ECDP), electricity customers can earn benefits through not only load shifting and peak reduction, but also using the electricity charge discount. Institutional incentive and technological advancement in the market environment have improved the economic feasibility of ESS applications and driven investment in ESS projects.
The aim of this paper is to analyze the impact of the Korea’s public policies on enhancing the economic feasibility of behind-the-meter ESS to disseminate ESS to the demand side. A behind-the-meter ESS is an ESS placed at the bottom of the receiving end. It is electrically connected to the electricity customer, not to the utility. The incentive policy for improving the economic feasibility of behind-the-meter ESS leads to the expansion of demand-side customers as a whole.
This paper conducts a sensitivity analysis of the behind-the-meter ESS’s economic feasibility according to the ESS ECDP. Since the release of ESS ECDP in 2015, the duration of ESS ECDP has been extended, and the discount rate has been increased. After 2020, the incentives of ESS ECDP will be gradually decreased and finally expire in 2026. This paper attempts to verify that the ESS ECDP affects the profitability of behind-the-meter ESS and that increased profitability through ECDP leads to increased scale of investment in ESS on the demand side.
ESS ECDP is described in Section 2 and the cost-benefit structure of behind-the-meter ESS is modeled and formulated in Section 3. Section 4 quantitatively analyzes the sensitivity of the economic feasibility according to ESS ECDP in stages. Finally, the impact of public policy on demand-side ESS is reviewed in Section 5. This paper provides governments with the impact of public policy on the ESS as a reference for decision making regarding ESS diffusion.
2. Energy Storage System (ESS) Electricity Charge Discount Program (ECDP)
2.1. Benefits of Behind-the-Meter ESS
The benefits of ESS on the demand side are generated through the sale of stored power, demand response, and electricity bill reduction [30]. Since December 2014 in Korea, consumers can sell less than 1000 kW of electric power from their behind-the-meter ESSs to the Korea Electric Power Corporation (KEPCO). In this case, less than 50% of the total annual stored energy is allowed to be sold to the KEPCO, and the settlement of sold power is calculated using the system marginal price (SMP). However, on average, the SMP has been lower than the electricity usage rate at peak time since 2015 in Korea. In addition, following the initiation of ESS ECDP, the self-consumption of stored power in ESS at the peak load time can earn discounts on the base charge as well as electricity bill reduction through peak reduction and load shifting. Therefore, consumers are more motivated to utilize self-consumption than sell stored power.
In the case of the demand response, ESS is not used as a sole resource, as it is used with various resources such as light, electric motors, and other facilities. In addition, since the reduced peak load by ESS is already reflected in the baseline decision, which is the basis of the demand response settlement calculation, ESS is not useful as a demand response resource. For these reasons, electricity bill management is the dominant factor for giving customers benefits through ESS rather than the cases of the sale of stored power or demand response.
In Korea, a time of use (TOU) rate is applied to electricity customers, excluding households. The TOU rates consist of the base charge, which is charged according to the peak load, and the usage charge, which is charged according to the electricity usage. In the TOU rates system, one’s electricity bill can be reduced through peak reduction and load shifting with the ESS charge–discharge scheme. The base charge is saved by discharging the ESS to lower the peak load. The usage charge is reduced by load shifting, which means that ESS charge with low-cost electricity at light load time and discharge at peak load time then replaces expensive electricity purchases. Consequently, the ESS operator would establish an optimal ESS charge–discharge schedule that maximizes the benefits of the ESS by determining whether to use the limited ESS resources for peak reduction for base charge savings or for load shift in order to reduce usage charge.
2.2. ESS Electricity Charge Discount Program
The ESS ECDP has been implemented in Korea since 2015 to encourage expansion of the installation of ESS on the demand side. It is designed to establish a structure to give back to ESS investors according to the contribution of behind-the-meter ESS to the power system such as reduced peak demand, increased power system flexibility, and improved load management capability. The ESS ECDP consists of base charge discount and usage charge discount for ESS charge. If an ESS reduces the peak load through discharging at peak load time, then the base charge of the electricity bill is discounted by reflecting the peak load reduction. The electricity rate for electricity usage to charge ESS at light load time is discounted.
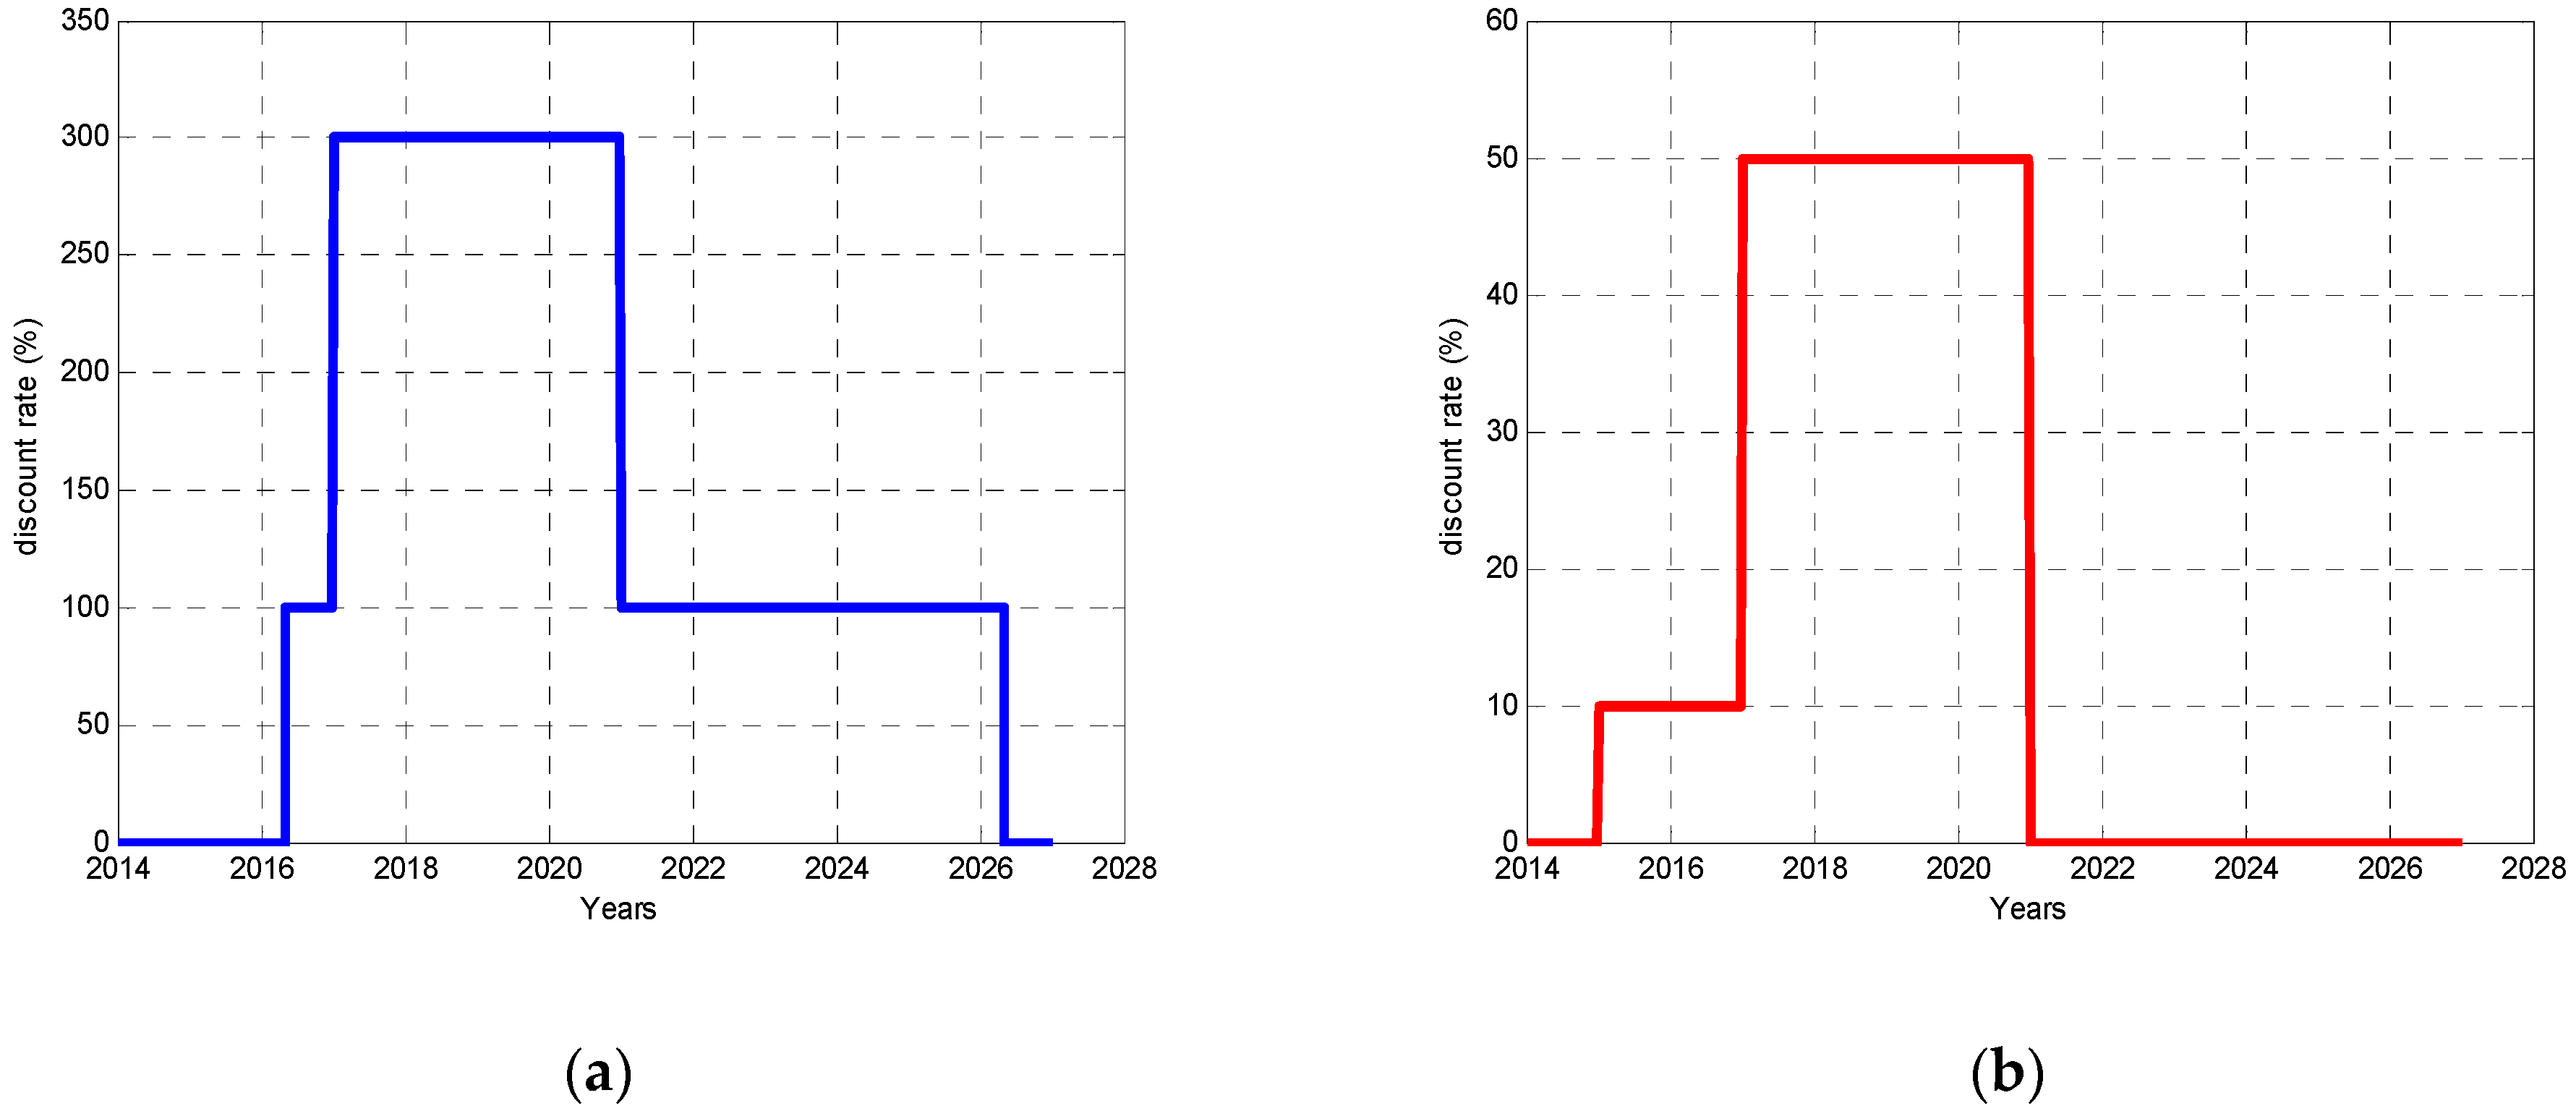
The effectiveness of the ESS ECDP depends on the discount period and the discount rate. All of the discounts are available during the discount period, and therefore, upon expiration of the discount period, a behind-the-meter ESS can only save base charge through peak load reduction and reduce usage charge through energy arbitrage, i.e., load shifting. Since it was initiated, the range and effectiveness for the ESS ECDP have been strengthened in stages. The ESS ECDP began with a 10% discount on the electricity usage for charging ESS in 2015, and it was extended to base charge discount so as to return the peak reduction contribution of ESS to the ESS owner with base charge reduction benefit in 2016. On 1 January 2017, the Korean government implemented a policy to temporarily increase the discount rate of ECDP for the purpose of enhancing the effectiveness of the incentive system, and in May, announced a one-year extension of the applicable period of the increased discount rate. With the initiation of the increased discount rate of ECDP, a weight to the discount rate depending on the battery storage capacity has been introduced. This weight is determined by the ratio of ESS battery storage capacity to contract power of the electricity customer. Table 1 summarizes the range of ECDP, discount rate, and period in four stages, and these are depicted by year in Figure 1. Table 2 describes the weights according to the ratio of contract power to battery storage capacity.
Before the initiation of ESS ECDP, the benefits of behind-the-meter ESS relied on load shifting and peak reduction. These were not enough to attract investors to invest in demand-side ESSs. However, the ESS ECDP significantly increases the profitability of behind-the-meter ESSs.
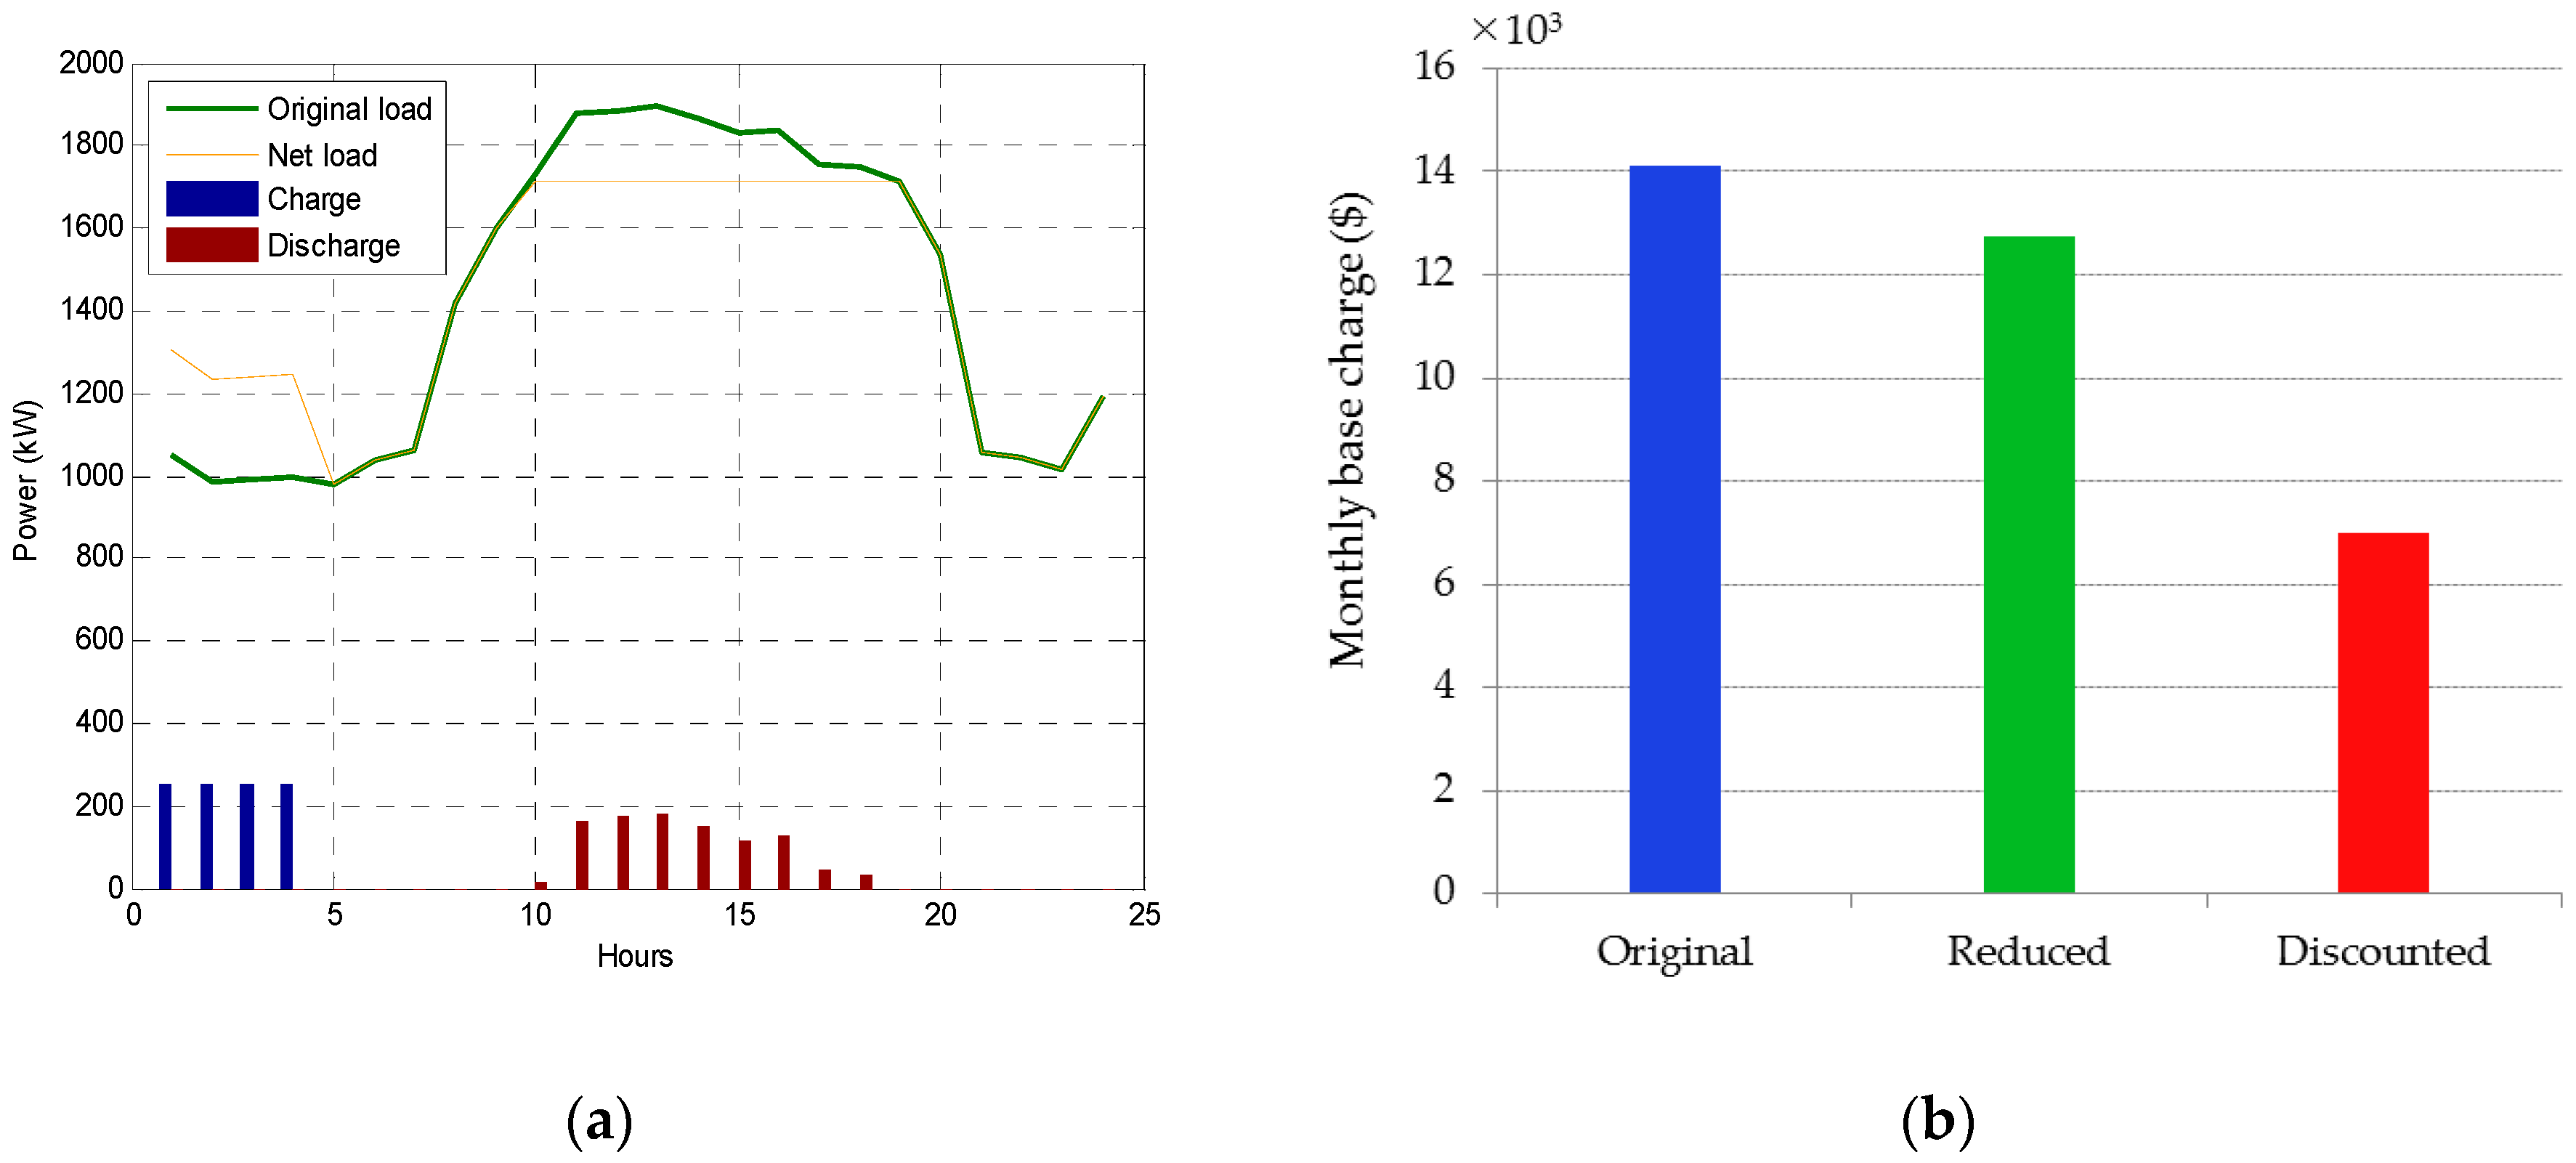
Figure 2 illustrates schematically how ESS benefits consumers, i.e., the profit-making structure via peak reduction and load shifting through behind-the-meter ESS. The green line shown in Figure 2a is a typical load pattern of the commercial building with a contract power of 3000 kW. A 250 kW, 1000 kWh ESS is applied to the building in order to reduce electricity bills, and the schedule of charge and discharge for this ESS is drawn in green and red bars, respectively. The orange line is a net load pattern that reflects the ESS charge and discharge on the original load pattern.
First of all, as shown in Figure 2a, the ESS reduces the original peak of 1898 kW to 1715 kW through discharging at the peak time period. This peak reduction also reduces the base charge of the electricity bill.
The electric power charged in the ESS in a light load time period, which is low in its electricity usage rate, is used by discharging at a peak load time period, in which an electricity usage rate is expensive. ESS provides benefits as much as the difference in electricity usage charges for these two time periods. A discount for electricity usage to charge ESS improves the profitability of arbitrage through load shifting.
Figure 2b provides information on the benefit generation structure through peak reduction. The base charge of the electricity bill for the original peak, the blue bar, is reduced to the green bar via ESS discharging at peak time. In addition, ECDP provides additional discounts on the base charge by reflecting the contribution of the peak load reduction. The red bar in Figure 2b is the base charge, which is the final payment of the customer. Compared to the original base charge, the final base charge was reduced by about 50.3%. This is a reduction of about 45.0% additional savings compared to 9.6%, which is the base charge reduction through the peak load reduction of the ESS without ECDP. Details in the improvement of profitability of behind-the-meter ESSs due to ECDP and the resulting expansion of ESSs on the demand side are discussed in Section 4.
3. Problem Definition and Formulation
This chapter defines and formulates the cost-benefit structure of a behind-the-meter ESS as well as the optimization problem for electricity bill minimization. In this chapter, in terms of minimizing the electricity bill, the cost is defined as the electricity charge for charging the ESS. In addition, the benefits are the base charge and usage charge reduction, and discounts for electricity charge through the ESS ECDP. The optimization problem, which establishes a schedule of behind-the-meter ESS for minimizing electricity bills, is organized so as to analyze the effectiveness of ESS ECDP on the profitability of behind-the-meter ESSs. Furthermore, the correlation between ESS profitability and diffusion effects is derived to assess the extent to which economic improvements in behind-the-meter ESS affected the spread of demand-side ESSs.
3.1. Base Charge Reduction
The base charge for electricity is charged monthly, depending on the peak load, in kW, regardless of electricity usage, in kWh. It is calculated as the product of the annual peak load and the unit base rate. If the annual peak load is under 30% of the contract power, the base charge is calculated based on 30% of the contract power. As a short peak power occurring in summer or winter becomes the basis for the base rate calculation of the following year, thorough peak load management is required.
With the ESS, the base charge can be lowered by simultaneously discharging at the time when the peak load occurs. When the load exceeds a predetermined level, the ESS starts to discharge and the load no longer increases. However, due to the storage capacity limit of ESSs, it is important to set an appropriate level of the peak load control value by considering the forecasted load.
Meanwhile, peak reduction through a ESS not only leads to savings in the base charge, but also has the effect of improving the customer’s load factor, which is defined in Equation (1). A higher load factor, i.e., thorough peak management, improves the customer’s economic feasibility [35].
The base charge savings through peak reduction are represented as follows:
The effectiveness of the base charge reduction through ESS differs depending on each electricity customer’s load factor. Due to the limited storage capacity of the ESS, the base charge reduction through peak load reduction can be better for electricity customers with a low load factor than those with a high load factor.
3.2. Usage Charge Reduction
The usage charge reduction stems from load shifting, a type of arbitrage transaction. This is to reduce the electricity bill based on the difference between the two rates by charging the ESS at the light load time with a low electricity rate and discharging the ESS at the peak load time with a high electricity rate. The usage charge reduction through load shifting is formulated in Equation (3):
3.3. Elecricity Charge Discount
ESS ECDP is applied in two ways, as described above, with a discount on the base charge and usage rate for charging the ESS. The base charge discount is calculated by multiplying the electricity base rate and peak load reduction as in Equation (4). The peak load reduction is predetermined by the electricity company, KEPCO, in Korea as in Equation (5). Discounts on usage charges are granted only for electricity usage to charge ESS at light load times. The discount for usage charge is represented as Equation (6).
3.4. Electricity Bill Minimization
The purpose of behind-the-meter ESSs is to minimize electricity bills, which can be achieved by maximizing benefits through ESSs. Since ESS has a capacity limit, the ESS operator should resolve the optimization problem of allocating limited stored energy considering all the benefit-making options: peak reduction, arbitrage, and ECDP. The problem of electricity bill minimization through behind-the-meter ESS is defined as Equation (7). Then, the decision variables of the cost minimization problem are the kW powers of ESS charging and discharging.
subject to
3.5. Economic Feasibility Evaluation
The effectiveness of the ESS ECDP on the profitability of behind-the-meter ESS is analyzed through economic feasibility evaluation in this paper. In order to evaluate the economic feasibility of behind-the-meter ESS, the cost and profit of behind-the-meter ESS are defined and represented as follows:
- cost:
- and profit:
3.6. Correlation Coefficient
The correlation between the economic feasibility of behind-the-meter ESS and the installation capacity of ESS on the demand side is analyzed in order to verify the effectiveness of the ESS ECDP, which is a public policy aiming to expand ESS diffusion. The closer the relationship of economic feasibility of ESS and installed capacity of demand-side ESS, the closer the correlation coefficient is to 1. A positive correlation coefficient means positive correlation and a negative correlation coefficient means inverse correlation. The correlation coefficient between the economic feasibility of behind-the-meter ESS and the dissemination of demand side ESS is carried out in this work.
4. Case Studies
In this section, the impact of the ESS ECDP on the improvement of the economic feasibility of the behind-the-meter ESS is quantitatively analyzed. Furthermore, the way in which this economic improvement led to actual ESS dissemination on the demand side is evaluated. All the simulations and calculations in this paper are conducted with MATLAB 7.10.0 (R2010) of MathWorks in Natick, Massachusetts, U.S.A. Also, all the figures provided in this paper are also drawn through same program.
4.1. Load Analysis and ESS Scheduling
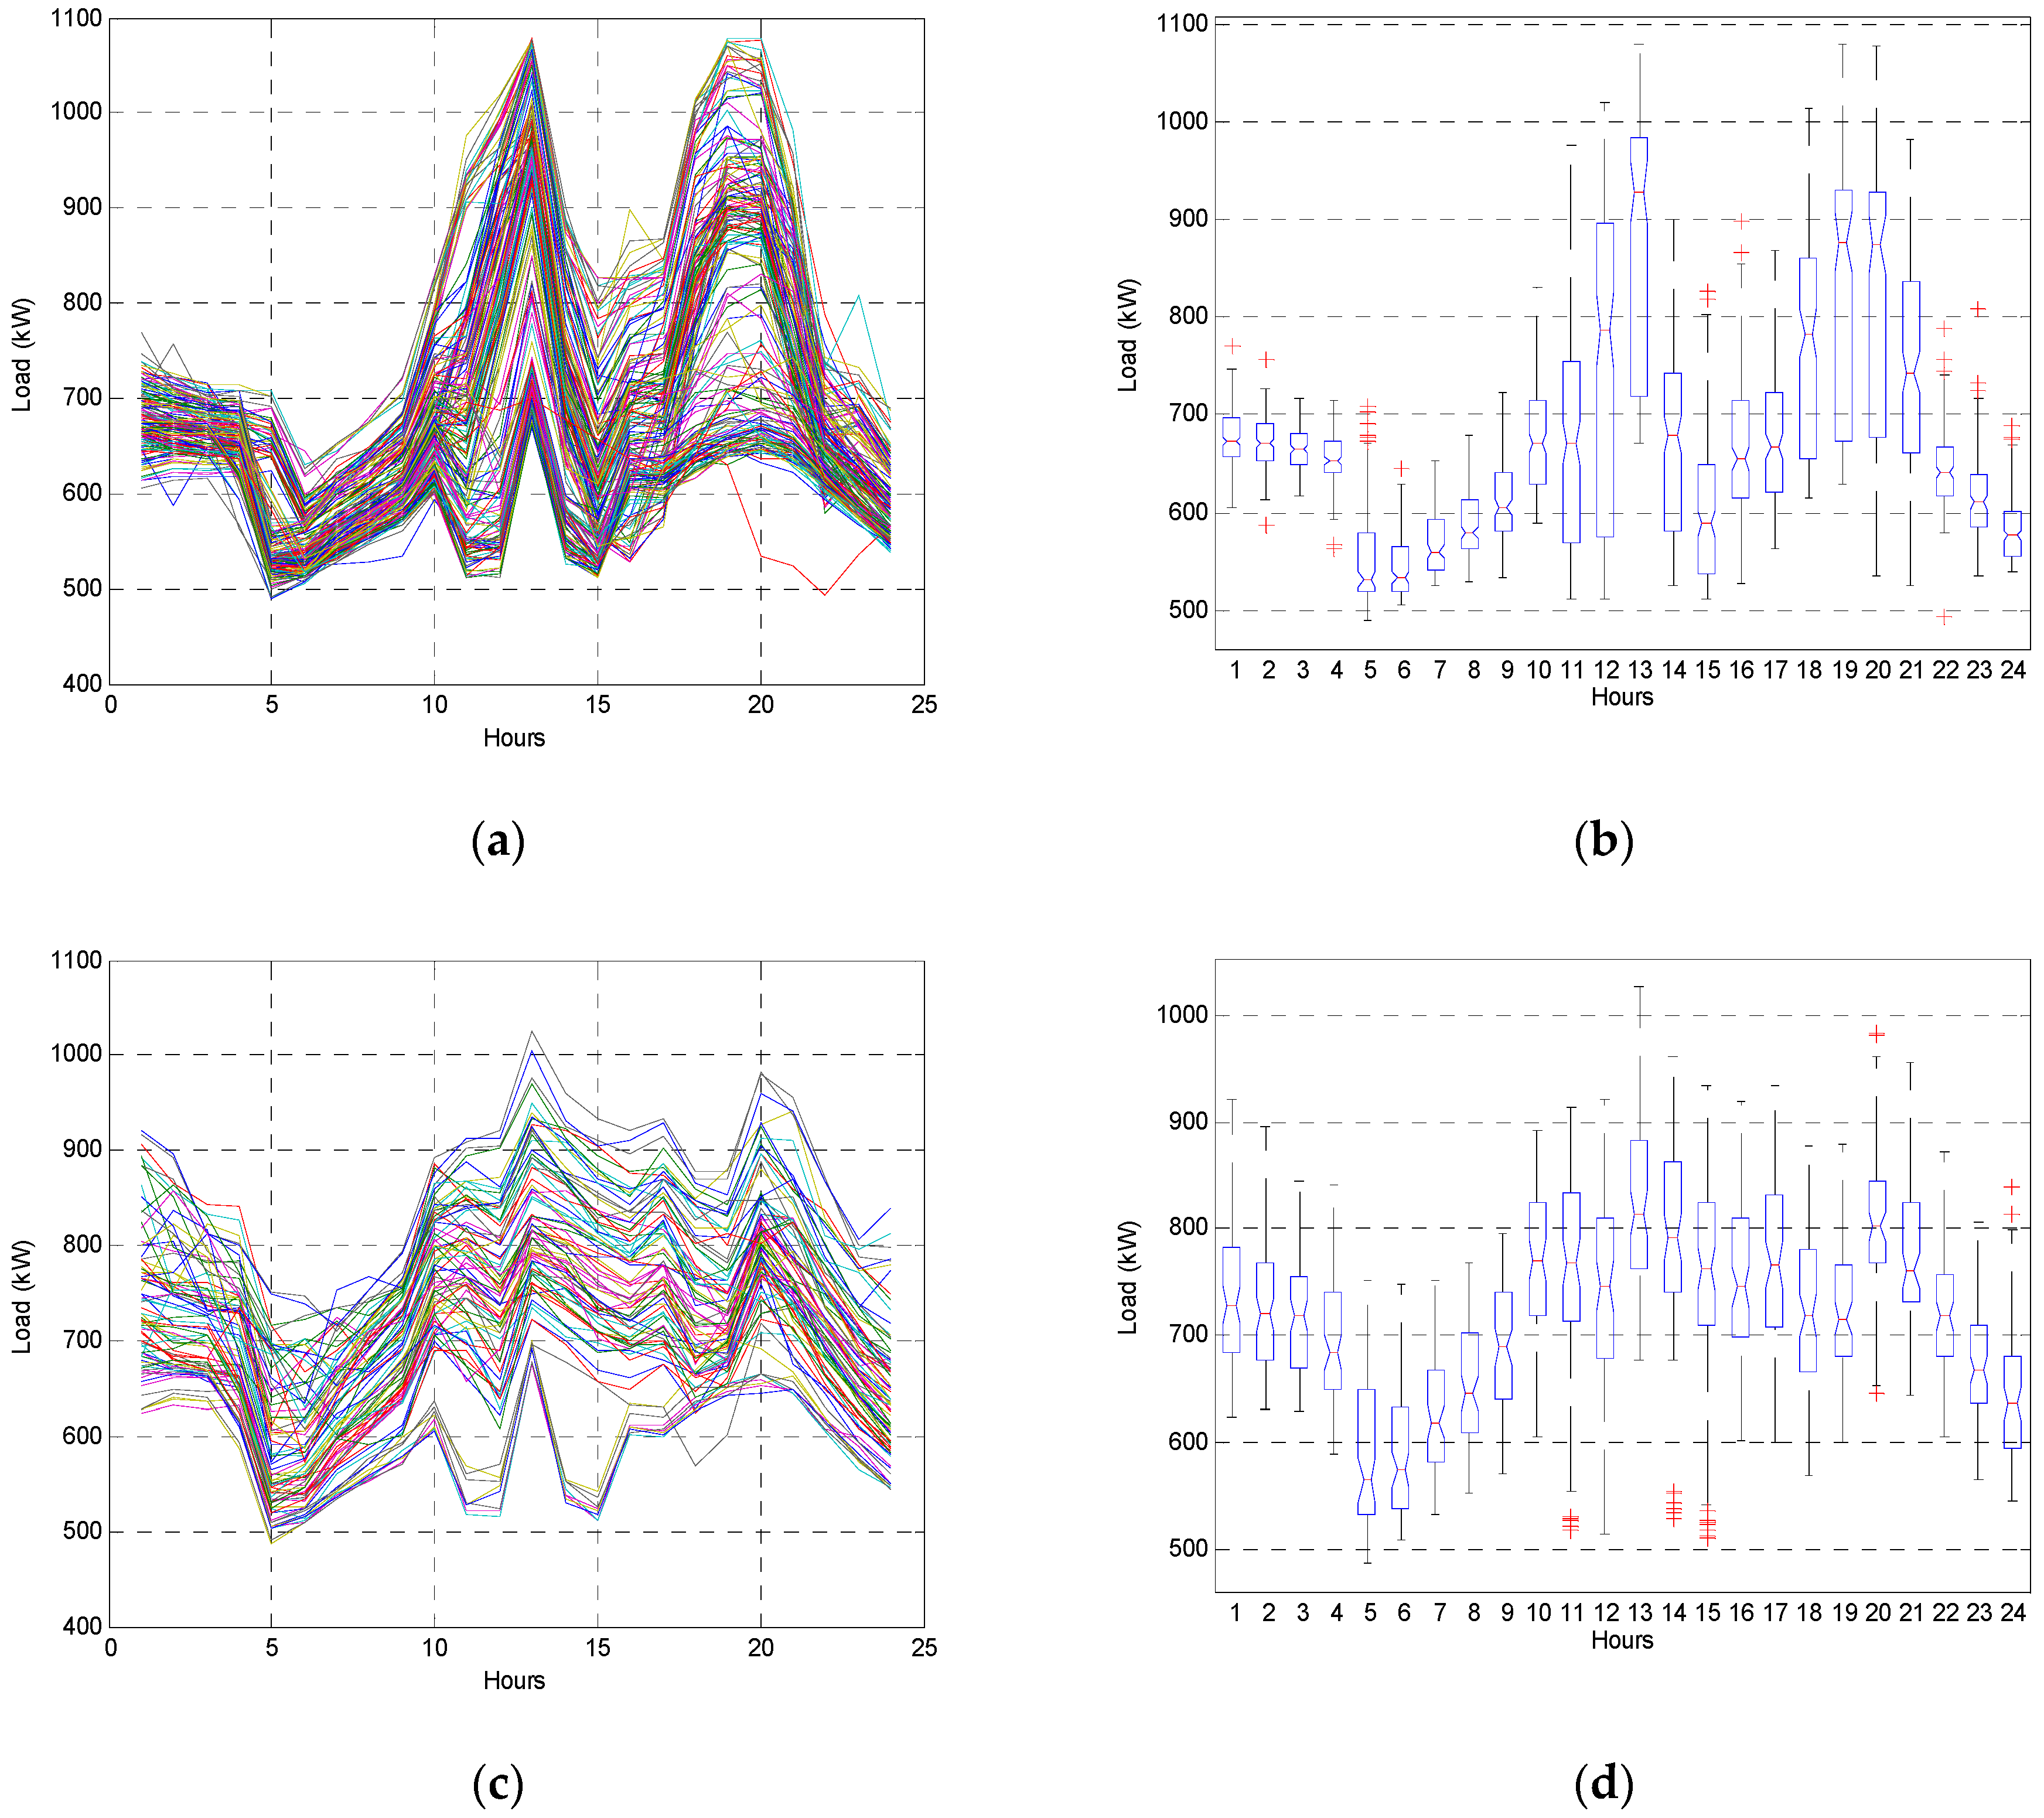
A complex center with 2500 kW of contract power was selected as a sample for the evaluation of economic feasibility. Figure 3 shows the 24-h load patterns and its distribution for each hour of the actual load of the building for a year. In winter, the load pattern is different from the other seasons because of the different peak time period applied to electricity charge and heating demand in the evening and at night. Therefore, the loads are analyzed separately for spring, summer, autumn, and winter. The peak load usually occurs as the flow of outside visitors increases around lunch and dinner time. Due to the characteristics of this building, which has many night shifts, the load at all times is kept above a certain level, except for in the early morning hours. This building is subject to the electricity tariff, A-level high voltage with option II, as summarized in Table 3 and Table 4.
4.2. ESS Scheduling
An overview of the behind-the-meter ESS in this work is given in Table 5. Excluding pumped-storage hydro power plants and uninterruptible power supplies, more than 99% of ESSs in Korea are lithium-ion battery ESS. In addition, in order to meet the High-efficiency Appliance Certification criteria for ESS in Korea, the ESS should have a round-trip efficiency of over 89%. Given the service characteristics of ESS applications, behind-the-meter ESS for peak reduction and load shifting is suitable to have a storage time of about two to five hours [36]. A 250 kW, 1000 kWh ESS capable of sustaining the rated power for four hours is considered for this study.
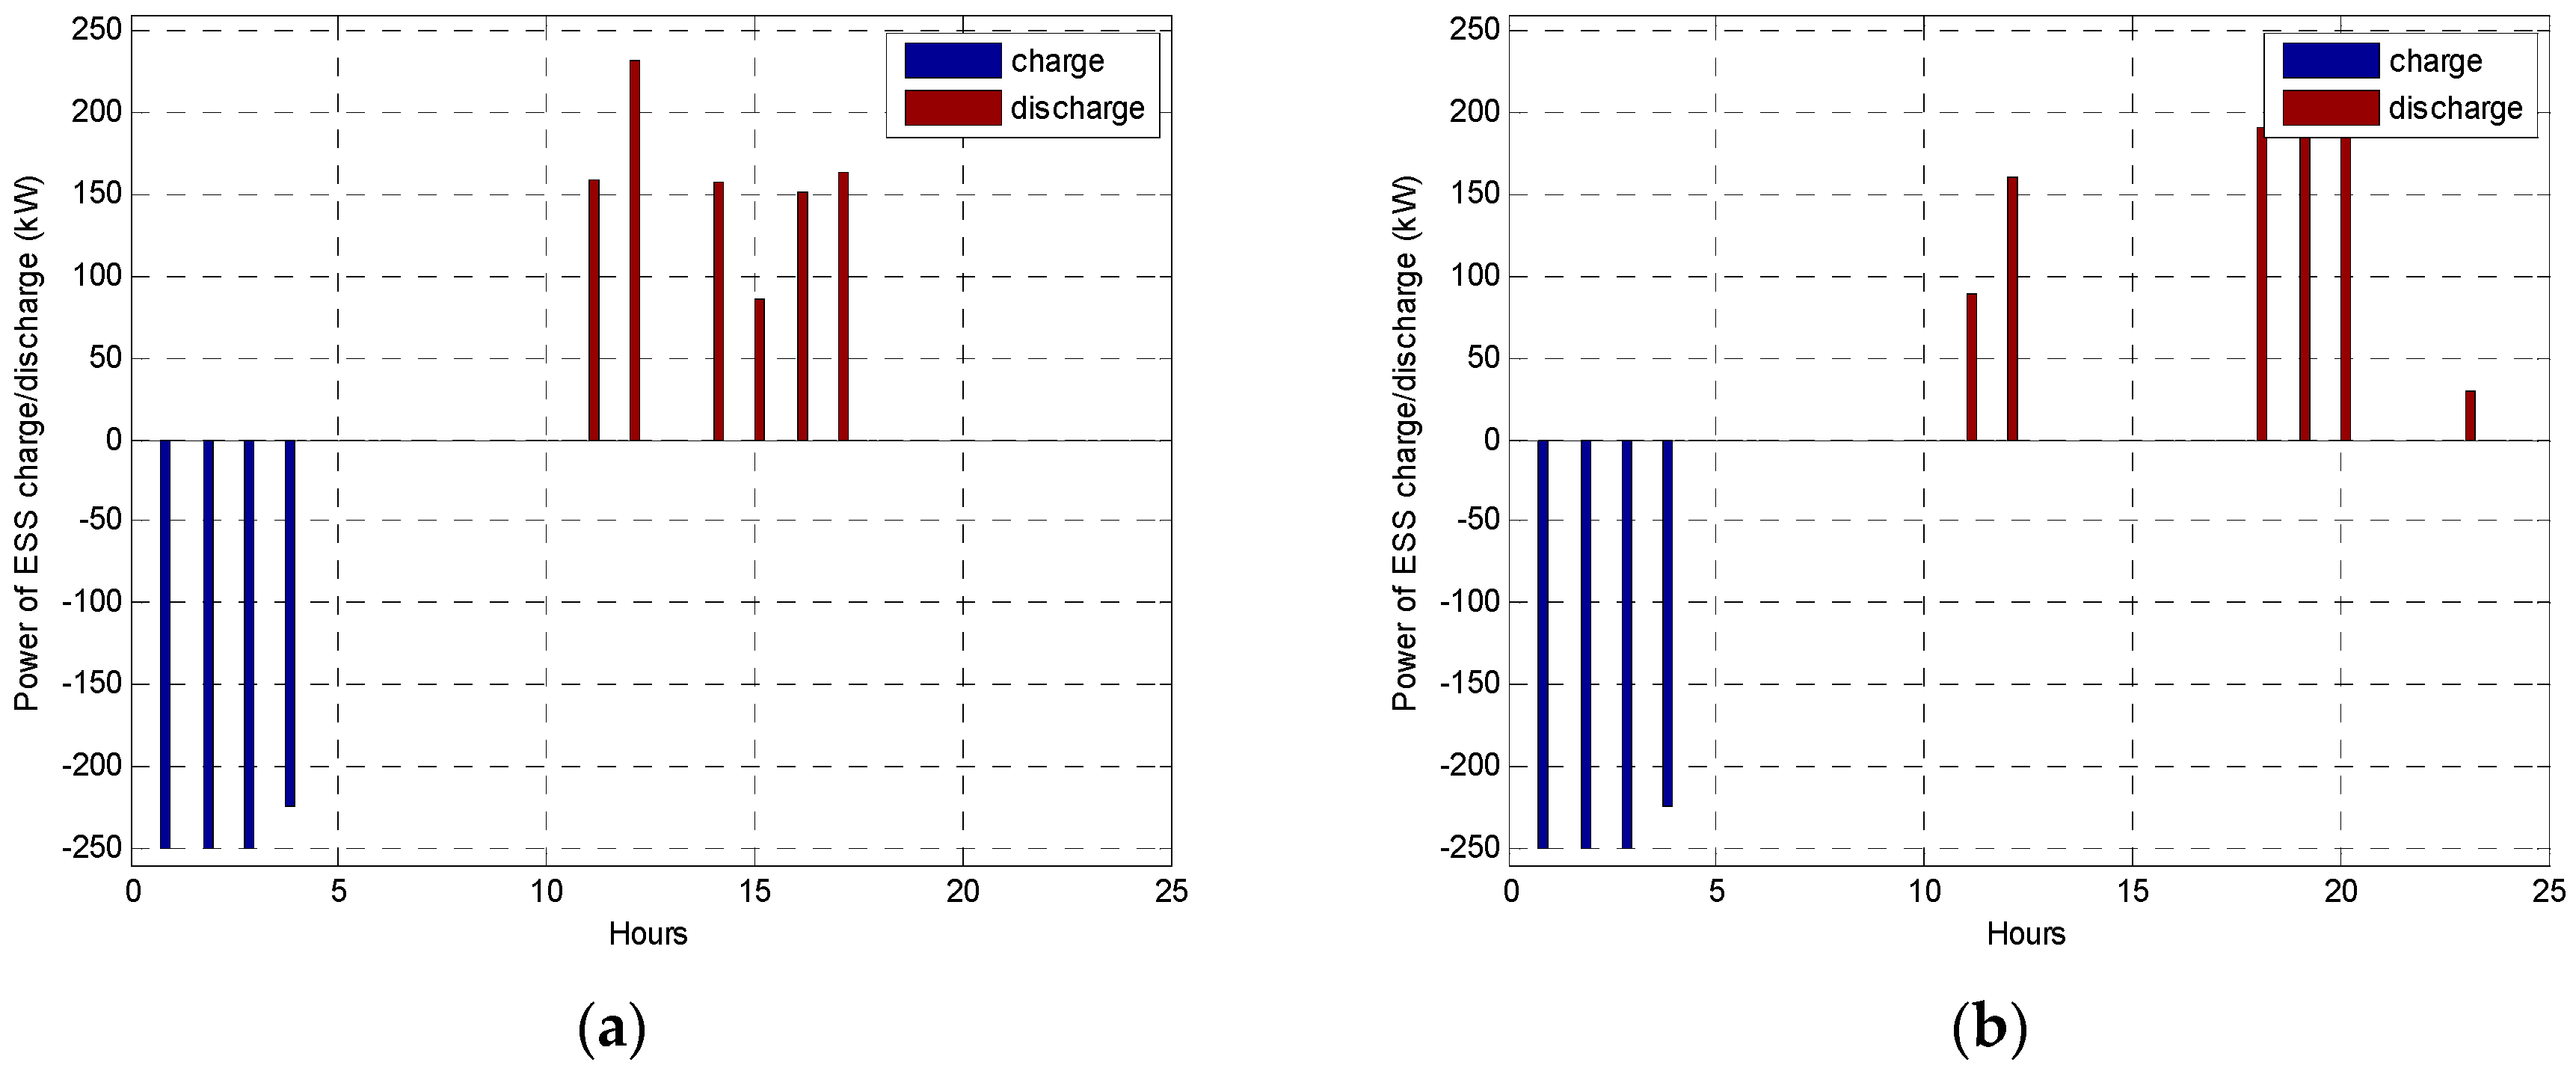
The optimization problem for the ESS charge–discharge scheduling was solved, and the results are shown in Figure 4. Since the base charge saving and base charge discount through peak reduction are more profitable than arbitrage through load shifting, the ESS is mainly discharged at the peak time period. In addition, since the maximum load occurring at the light load time is not considered in the calculation of the base charge, the ESS charged from midnight to its rated power without considering any additional calculations for charging. If the ESS charge is made at a light load time, there is no variation in the economics of how and when it is charged. Thus, it is more effective for the operator to set the charging schedule in consideration of the operating aspect and the life cycle of the ESS.
4.3. Economic Feasibility of ESS without Subsidies or Fixed Cost
Since the initiation of the ESS ECDP in Korea, discounts are strengthened in stages. In this work, the economic feasibility of ESS ECDP of each stage is analyzed.
The cases for analysis are summarized in Table 6. Case 1 is the case without discount before the ESS ECDP initiation. Cases 2 to 5 are cases of ESS ECDP in stages, as shown Table 1 after ESS ECDP initiation. Cases 4 and 5 reflect a temporarily raised discount rate for base charge discount. In Cases 4 and 5, a discount rate of 300% is initially applied, and then a discount rate of 100% is applied after the end of the 300% discount period.
In this study, the impact of the improved profitability of behind-the-meter ESS through the ESS ECDP on the dissemination of demand side ESSs in Korea is analyzed. Subsidies that have been provided to behind-the-meter ESSs should be considered so as to analyze the correlation of economic feasibility with the dissemination of ESS in real cases. In order to consider the cash discount rate in the case study, the discount rate is assumed to be 3%. In this work, the capital cost of ESS is fixed at $625,000.
In order to assess only the effect of the ESS ECDP, controlled cases without other considerations, such as cost degradation and governmental subsidy, were analyzed. Economic feasibility evaluation is conducted in terms of payback period, benefit-cost ratio, internal rate of return (IRR), and net present value (NPV). The results are carried out in Table 7. Cases 1, 2, and 3 did not achieve payback during the lifetime of the ESS. Thus, in these cases, the ESS project is not profitable. In Cases 4 and 5, ECDP’s incentives ensure that the ESS project is economically viable.
4.4. Economic Feasibility of ESS in Real Cases
Regarding the real cases, subsidies and price decrease are considered. The value of subsidies for behind-the-meter ESS is given as 80% of the total cost of ESS installation since 2012, and it is decreased by year. The real cases in this work including subsidies are summarized in Table 8. Further, details in the price decrease of ESS in the domestic market in Korea are shown as Figure 5. In this work, the actual effect of the market environment and public policy including the ESS ECDP on economic feasibility are evaluated. The results are shown in Table 9 and Table 10. Table 9 represents the results of analysis of ESS economic feasibility in private markets excluding government subsidies for ESS private investment and ESS economics comparison. Table 10, on the other hand, shows the economic feasibility evaluation results of ESS considering government subsidies.
According to Table 9, which is the result of the ESS economic feasibility evaluation in the private market excluding government subsidies, ESS is worth the investment only in Cases 4 and 5 that were implemented the ESS ECDP with a 300% base charge discount and 50% usage charge discount. Until then, a behind-the-meter ESS is not profitable.
In Table 10, even though ECDP was introduced in Case 2, the economic feasibility of Case 2 is lower than that of Case 1. This is because the government subsidy rate for behind-the-meter ESS decreased from 70% to 50% in Case 2. It can be concluded that the economic feasibility of the ESS project is more dependent on subsidies than institutional incentives before the incentive programs are fully implemented. In Case 3, compared to Case 2, the subsidy rate was maintained, and the effect of improving the economic efficiency was significantly increased by introducing the base charge discount.
In Case 4 and 5 of real case studies, the profitability of a behind-the-meter ESS drastically increased regardless of whether government subsidies were given or not. Therefore, it can be inferred that private capital investment in behind-the-meter ESS would have been influenced. In other words, it is analyzed in Section 4.5 whether improved economic feasibility leads to the diffusion of demand-side ESSs.
4.5. Corealations between Economic Feasibility and Dissemination of a Behid-the-Meter ESS
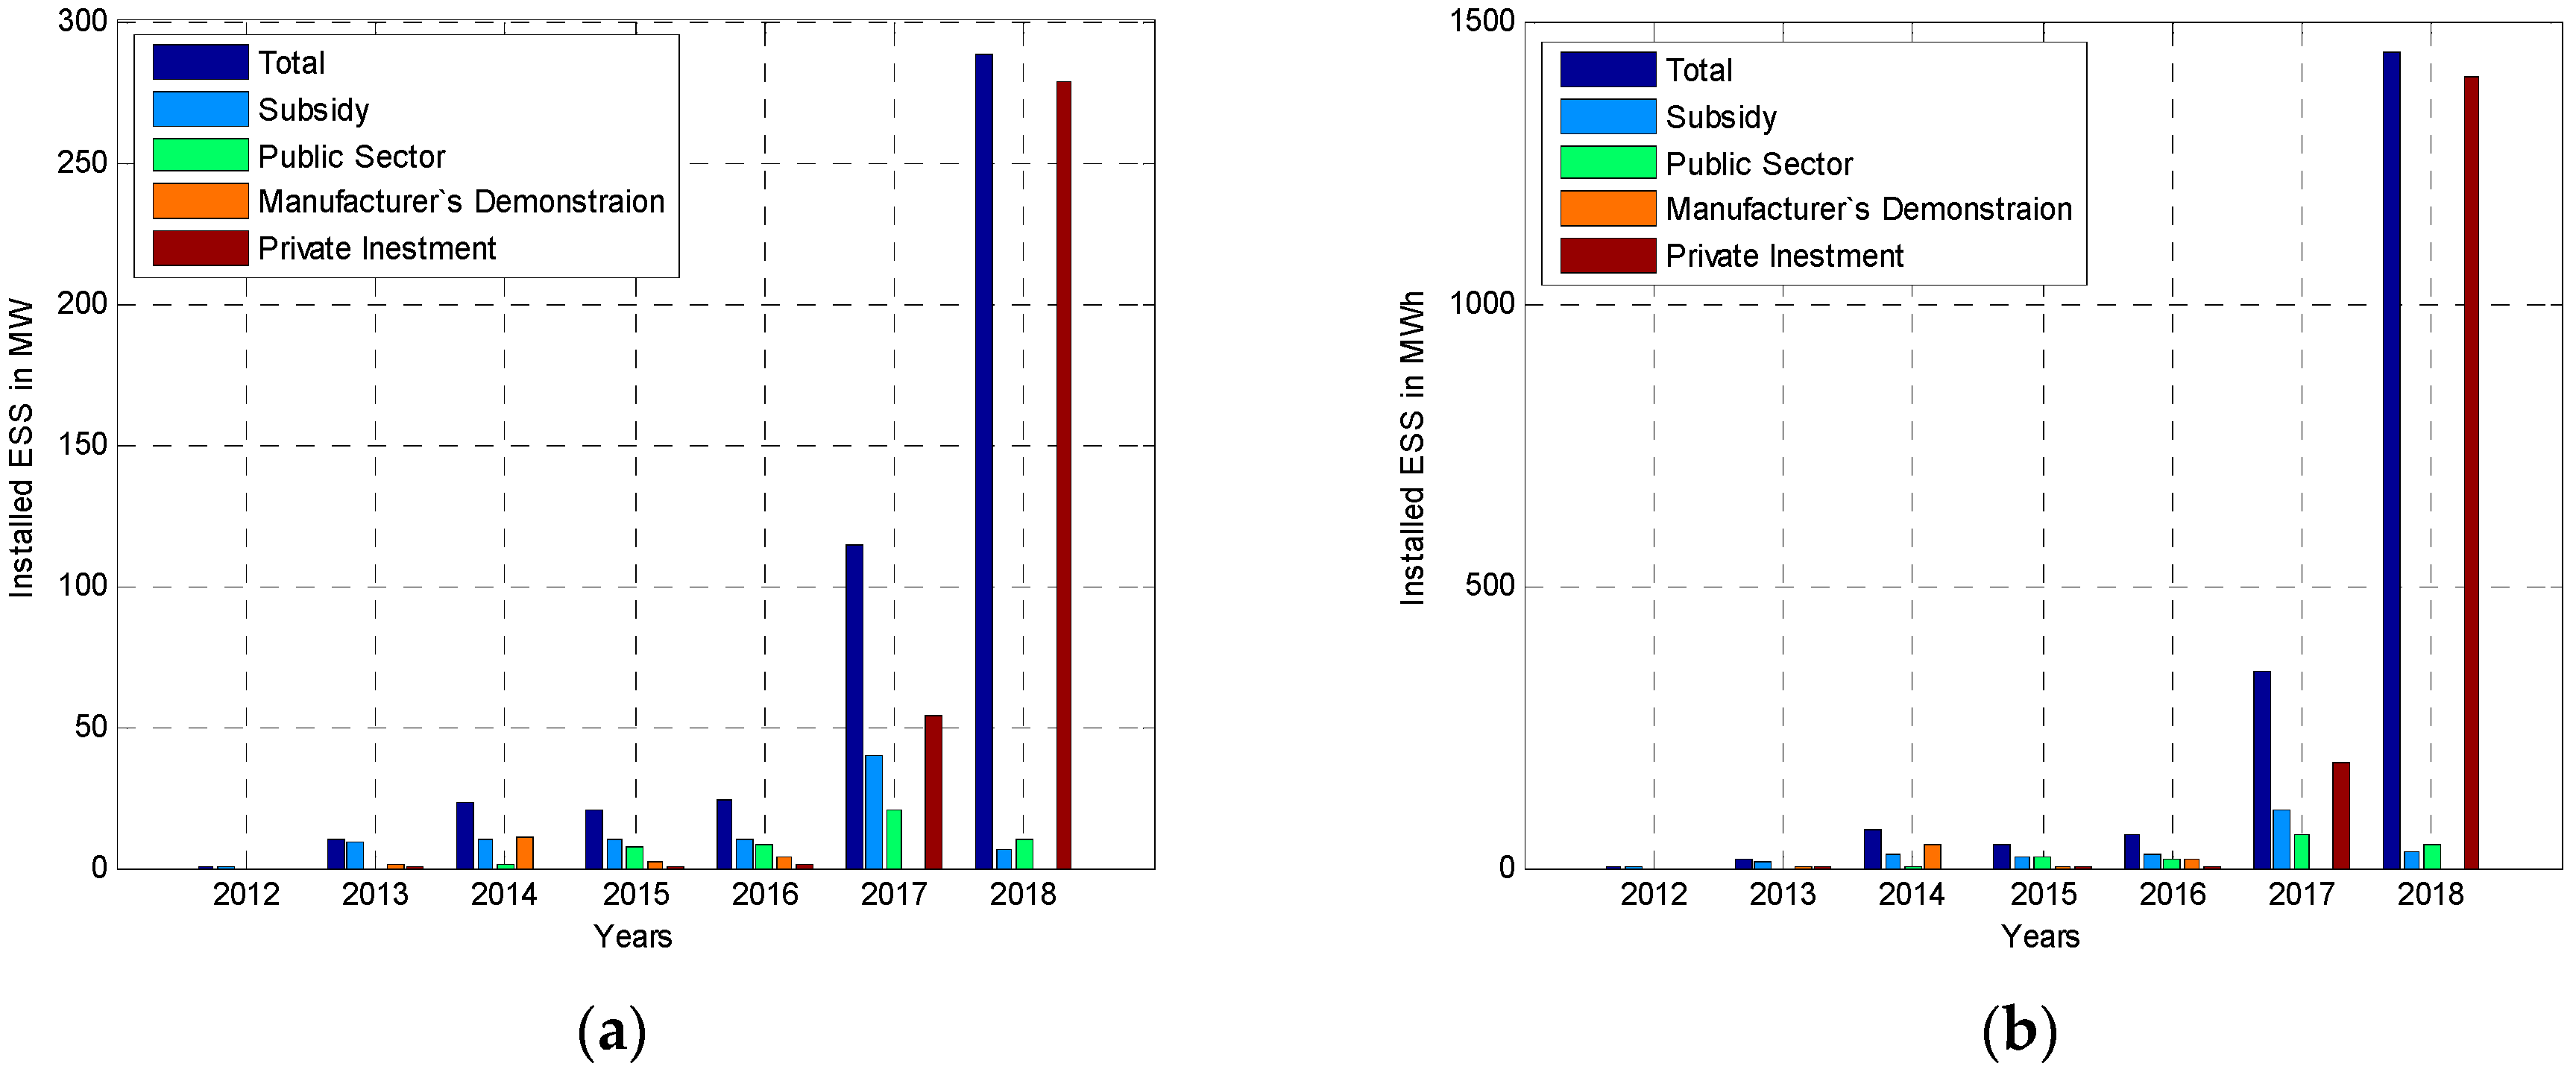
Figure 6 shows the capacity of domestic ESS installation on demand side according to the investor by year. The light blue bar in Figure 6, which is marked as “Subsidy,” means the capacity of ESS installed by governmental subsidy program. Except for “Subsidy,” no others are given government subsidies. The green bar labeled “Public Sector” refers to the ESS installed by the public organizations in line with the government’s demand-side ESS diffusion policy. “Manufacturer’s Demonstration,” which is orange bar, represents a leading investment by ESS makers to take advantage of future market share. The dark red one labeled “Private Investment” is the amount of ESS installed for consumer’s economic profit, such as electricity bill management, and a government subsidy is not given here. Finally, the correlation coefficient of IRR and ESS investment is shown in Table 11.
5. Discussion
Based on the actual case of installing 250 kW and 1000 kWh ESS at the contract power of a 2500 kW complex center, we examined whether the ESS ECDP, the incentive policy for the expansion of the demand side ESS, acted as intended by the Korean government. As shown in Table 7, an ESS’s economic feasibility is improved as the discount rate is raised and the discount period is extended. According to the results of case studies shown in Table 9, without government subsidies, incentives of a 300% base rate discount and 50% charge rate discount should be given for positive profitability. On the other hand, Case 1 of Table 10, which receives 70% of government subsidies, is profitable because it can save a considerable amount of investment cost without the incentive. However, this is not constrained by the limited government budget, and therefore cannot lead to continued ESS market expansion.
Considering that it usually takes less than a year of 1 MWh-sized behind-the-meter ESS installation processes, the improved profitability of behind-the-meter ESS due to the ESS ECDP enhancement is immediately connected to the demand side ESS dissemination of the following year. As shown in Figure 6, the amount of ESS installation on the demand side has increased noticeably from 2017, where in Case 4, the incentive of the ESS ECDP was strengthened and the behind-the-meter ESS had positive profitability. The extension of the ESS ECDP in May 2017 further improved the economic efficiency of behind-the-meter ESSs, as in Case 5, resulting in the explosion of demand-side ESSs in 2018.
We can see in Figure 6 that the private sector investment contributed more to the growth of the Korean domestic demand side ESS market than any other sectors. We can also infer from this study that it is effective to build a market structure that can secure return on investment in order to form the demand side ESS market as a private led market.
As a result, the ESS ECDP for improving the economic feasibility of behind-the-meter ESSs in order to diffuse the ESS on the demand side in Korea has directly attracted investment in demand-side ESSs. The ESS ECDP initiated in 2015 to promote private sector investment in the behind-the-meter ESS has resulted in the growth of Korea’s demand-side ESS market, which was only $27 billion in 2015, to $825 billion in 2018. In addition, after the advanced ESS ECDP initiation in 2017, which provides an IRR of at least 5% as in Case 4 of Table 9, the private sector ESS investment, which had not existed before 2015, had risen to $105 billion in 2017 and $783 billion in 2018. These were about 54% and 95% of the total market, respectively. These results suggest that it is possible to promote the private investment on the domestic demand side ESS with public policy on behind-the-meter ESS.
6. Conclusions
This paper shows that public policy to support the profitability of behind-the-meter ESS in Korea drives increased installation in demand-side ESSs. In order to clarify this, we first described the ESS ECDP, the representative public policy to enhance the profitability of behind-the-meter ESSs in Korea. In addition, we defined the cost–benefit structure of demand side ESS and formulated the cost minimization problem for electricity bill reduction. Finally, we clarified how ESS ESCP affects the profitability of a behind-the-meter ESS and how the improvement of profitability of a behind-the-meter ESS influences increased investment in behind-the-meter ESSs. Since the Korean government has continued subsidies and incentives to support the profitability of behind-the-meter ESSs, investment in demand-side ESSs has increased in Korea. In particular, the investment has led by the private sector and amounted to $783 billion, about 95% of the total domestic demand side ESS market for the seven months from January to July 2018.
The results of this paper can be used as reference for policymaking in countries considering ESS diffusion through institutional effort to expand renewable energy supply. When the countries intending to promote the spread of ESS diffusion through public policy determined the level of incentive degree in view of the targeted amount of ESS installation, the results represented in this paper can be referenced.
Previous studies aiming to maximize the economic efficiency of ESS resources on the demand side have mainly focused on the optimization of the charging–discharging schedule of ESSs in combination with other distributed resources such as photovoltaic generation and electric vehicles. However, this paper quantitatively evaluates the impact of policy decision-making on the economic performance of a behind-the-meter ESS, thereby broadening the approach to the study of the demand-side ESSs. Furthermore, studies on the effects of public policy promoting ESS applications on the supply side, such as renewable portfolio standards (RPS), can be considered in further study.
Author Contributions
Conceptualization, B.-K.J. and G.J.; Methodology, B.-K.J.; Software, B.-K.J.; Validation, B.-K.J., S.J. and G.J.; Formal Analysis, B.-K.J.; Investigation, B.-K.J.; Resources, B.-K.J.; Data Curation, B.-K.J.; Writing—Original Draft Preparation, B.-K.J.; Writing—Review and Editing, S.J. and G.J.; Visualization, B.-K.J.; Supervision, G.J.; Project Administration, S.J. and G.J.; Funding Acquisition, S.J.
Funding
This work was supported by Korea Electric Power Corporation Grant (R18XA06-40), and National Research Foundation Grant (No. 2018R1C1B5030524) funded by the Korean government.
Conflicts of Interest
The authors declare no conflict of interest.
Nomenclature
| Load power on day d at time t in kW | |
| Discharging power of ESS on day d at time t in kW | |
| Charging power of ESS on day d at time t in kW | |
| Storage capacity of the ESS in KWh | |
| Base charge savings through peak load reduction in US dollars | |
| Usage charge savings through load shifting in US dollars | |
| Base charge discount amount in US dollars | |
| Unit rate for base charge of electricity bill in US dollars per kW | |
| Unit rate for electricity usage at peak load time period in US dollars per kWh | |
| Unit rate for electricity usage at medium load time period in US dollars per kWh | |
| Unit rate for electricity usage at light load time period in US dollars per kWh | |
| Days of the month | |
| Weekdays of the month | |
| Life years of the ESS | |
| Peak load time period | |
| Medium load time period | |
| Light load time period | |
| The time of peak load occurrence | |
| Weight of discount rate | |
| Base charge discount rate | |
| Usage charge discount rate for ESS charging | |
| Depth of discharge of battery storage of the ESS |
References
- Intended Nationally Determined Contribution (INDC). Available online: http://www4.unfccc.int/Submissions/INDC/Published%20Documents/Republic%20of%20Korea/1/INDC%20Submission%20by%20the%20Republic%20of%20Korea%20on%20June%2030.pdf (accessed on 30 June 2015).
- Cornot-Grandolphe, S. South Korea’s New Electricity Plan: Cosmetic Changes or a Breakthrough for the Climate? Institut Francais des Relations Internationales (ifri): Paris, France, 2018. [Google Scholar]
- Renewables Now. Available online: https://renewablesnow.com/news/south-korea-eyes-20-renewables-share-by-2030-594850/ (accessed on 18 December 2017).
- Oilprice.com. Available online: https://oilprice.com/Latest-Energy-News/World-News/South-Korea-Starts-Phasing-Out-Old-Coal-Plants.html (accessed on 28 February 2018).
- Ulbig, A.; Borsche, T.S.; Andersson, G. Impact of Low Rotational Inertia on Power System Stability and Operation. IFAC Proc. 2014, 47, 7290–7297. [Google Scholar] [CrossRef] [Green Version]
- Moore, J.; Shabani, B. A Critical Study of Stationary Energy Storage Policies in Australia in an International Context: The Role of Hydrogen and Battery Technologies. Energies 2016, 9, 674. [Google Scholar] [CrossRef]
- Lee, S.I. Plans for Energy Storage System Market Creation; Korea Energy Economics Insitute: Ulsan, Korea, 2015. [Google Scholar]
- Renewable Portfolio Standards (RPS). Available online: http://www.energy.or.kr/renew_eng/new/standards.aspx (accessed on 1 January 2019).
- Denholm, P.; Jorgenson, J.; Hummon, M.; Jenkin, T.; Palchak, D. The Value of Energy Storage for Grid Applications; National Renewable Energy Laboratory: Denver West Parkway Golden, CO, USA, 2013.
- Berrada, A.; Loudiyi, K.; Zorkani, I. Valuation of energy storage in energy and regulation markets. Energy 2016, 115, 1109–1118. [Google Scholar] [CrossRef]
- Manganelli, M.; Nicodemo, M.; D’Orazio, L.; Pimpinella, L.; Carmen Falvo, M. Restoration of an Active MV Distribution Grid with a Battery ESS: A Real Case Study. Sustainability 2018, 10, 2058. [Google Scholar] [CrossRef]
- Schoenung, S.M.; Eyer, J. Benefit/Cost Framework for Evaluating Modular Energy Storage; Sandia National Laboratories: Albuquerque, NM, USA, 2008.
- Eyer, J. Electric Utility Transmission and Distribution Upgrade Deferral Benefits from Modular Electricity Storage; Sandia National Laboratories: Albuquerque, NM, USA, 2009.
- Oprea, S.; Bara, A.; Uta, A.I.; Pirjan, A.; Carutasu, G. Analyses of Distributed Generation and Storage Effect on the Electricity Consumption Curve in the Smart Grid Context. Sustainability 2018, 10, 2264. [Google Scholar] [CrossRef]
- Kottick, D.; Blau, M.; Edelstein, D. Battery energy storage for frequency regulation in an island power system. IEEE Trans. Energy Conv. 1993, 8, 455–459. [Google Scholar] [CrossRef]
- Zhang, F.; Hu, Z.; Xie, X.; Zhang, J.; Song, Y. Assessment of the Effectiveness of Energy Storage Resources in the Frequency Regulation of a Single-Area Power System. IEEE Trans. Power Syst. 2017, 32, 3373–3380. [Google Scholar] [CrossRef]
- Mercier, P.; Cherkaoui, R.; Oudalov, A. Optimizing a Battery Energy Storage System for Frequency Control Application in an Isolated Power System. IEEE Trans. Power Syst. 2009, 24, 1469–1477. [Google Scholar] [CrossRef]
- Oudalov, A.; Chartouni, D.; Ohler, C. Optimizing a Battery Energy Storage System for Primary Frequency Control. IEEE Trans. Power Syst. 2007, 22, 1259–1266. [Google Scholar] [CrossRef]
- Walawalkar, R.; Apt, J.; Mancini, R. Economics of electric energy storage for energy arbitrage and regulation in New York. Energy Policy 2007, 35, 2558–2568. [Google Scholar] [CrossRef]
- Zhao, H.; Wu, Q.; Hu, S.; Xu, H.; Rasmussen, C.N. Review of energy storage system for wind power integration support. Appl. Energy 2015, 137, 545–553. [Google Scholar] [CrossRef] [Green Version]
- Beaudin, M.; Zareipour, H.; Schellenberglabe, A.; Rosehart, W. Energy storage for mitigating the variability of renewable electricity sources: An updated review. Energy Sustain. Dev. 2010, 14, 302–314. [Google Scholar] [CrossRef]
- Barton, J.P.; Infield, D.G. Energy storage and its use with intermittent renewable energy. IEEE Trans. Energy Conv. 2004, 19, 441–448. [Google Scholar] [CrossRef]
- Suberu, M.Y.; Mustafa, M.W.; Bashir, N. Energy storage systems for renewable energy power sector integration and mitigation of intermittency. Renew. Sustain. Energy Rev. 2014, 35, 499–514. [Google Scholar] [CrossRef]
- Nguyen, C.; Lee, H. Optimization of Wind Power Dispatch to Minimize Energy Storage System Capacity. J. Electr. Eng. Technol. JEET 2014, 9, 1080–1088. [Google Scholar] [CrossRef] [Green Version]
- Dvorkin, Y.; Fernandez-Blanco, R.; Kirschen, D.S.; Pandzic, H.; Watson, J.; Silva-Monroy, C.A. Ensuring Profitability of Energy Storage. IEEE Trans. Power Syst. 2017, 32, 611–623. [Google Scholar] [CrossRef]
- Longe, O.M.; Ouahada, K.; Rimer, S.; Harutyunyan, A.N.; Ferreira, H.C. Distributed Demand Side Management with Battery Storage for Smart Home Energy Scheduling. Sustainability 2017, 9, 120. [Google Scholar] [CrossRef]
- Yan, L.; Baek, M.; Park, J.; Park, Y.; Roh, J.H. An Optimal Energy Storage Operation Scheduling Algorithm for a Smart Home Considering Life Cost of Energy Storage System. J. Electr. Eng. Technol. JEET 2017, 12, 1369–1375. [Google Scholar] [CrossRef]
- Choi, Y.; Kim, H. Optimal Scheduling of Energy Storage System for Self-Sustainable Base Station Operation Considering Battery Wear-Out Cost. Energies 2016, 9, 462. [Google Scholar] [CrossRef]
- Babacan, O.; Ratnam, E.L.; Disfani, V.R.; Kleissl, J. Distributed energy storage system scheduling considering tariff structure, energy arbitrage and solar PV penetration. Appl. Energy 2017, 205, 1384–1393. [Google Scholar] [CrossRef]
- Martins, R.; Hesse, H.C.; Jungbauer, J.; Vorbuchner, T.; Musilek, P. Optimal Component Sizing for Peak Shaving in Battery Energy Storage System for Industrial Applications. Energies 2018, 11, 2048. [Google Scholar] [CrossRef]
- Staffell, I.; Rustomji, M. Maximising the value of electricity storage. J. Energy Storage 2016, 8, 212–225. [Google Scholar] [CrossRef] [Green Version]
- Sioshansi, R.; Denholm, P.; Jenkin, T.; Weiss, J. Estimating the value of electricity storage in PJM: Arbitrage and some welfare effects. Energy Econ. 2009, 31, 269–277. [Google Scholar] [CrossRef]
- Winfield, M.; Shokrzadeh, S.; Jones, A. Energy policy regime change and advanced energy storage: A comparative analysis. Energy Policy 2018, 115, 572–583. [Google Scholar] [CrossRef]
- Current Status and Prospects of Korea’s Energy Storage System Industry 2017 KOTRA. Available online: http://www.investkorea.org/kotraexpress/2017/07/Industry.html (accessed on 31 December 2018).
- Uddin, M.; Romlie, M.F.; Abdullah, M.F.; Halim, S.A.; Bakar, A.H.A.; Kwang, T.C. A review on peak load shaving strategies. Renew. Sustain. Energy Rev. 2018, 82, 3323–3332. [Google Scholar] [CrossRef]
- Pearre, N.S.; Swan, L.G. Technoeconomic feasibility of grid storage: Mapping electrical services and energy storage technologies. Appl. Energy 2015, 137, 501–510. [Google Scholar] [CrossRef]
Figure 1.
(a) Discount rate of base charge discount. (b) Discount rate of usage charge discount.

Figure 2.
(a) Peak reduction and load shifting through behind-the-meter ESS. (b) Base charge reduction.
Figure 2.
(a) Peak reduction and load shifting through behind-the-meter ESS. (b) Base charge reduction.

Figure 3.
(a) Daily loads in spring, summer, and fall. (b) Distributions of loads in spring, summer, and fall. (c) Daily loads in winter. (d) Distributions of loads in winter.
Figure 3.
(a) Daily loads in spring, summer, and fall. (b) Distributions of loads in spring, summer, and fall. (c) Daily loads in winter. (d) Distributions of loads in winter.

Figure 4.
(a) ESS charge-discharge schedule in spring, summer, and fall; (b) and in winter.

Figure 5.
(a) Total cost of behind-the-meter ESS installation. (b) Cost of power conditioning system (PCS) and battery storage of ESS.
Figure 5.
(a) Total cost of behind-the-meter ESS installation. (b) Cost of power conditioning system (PCS) and battery storage of ESS.

Figure 6.
Korea’s annual domestic ESS market size by source of investment in (a) MW, and (b) MWh.


Table 1.
Summary of ESS ECDP in Korea.
| Stages | ESS ECDP | Discount Rate | Discount Period | |
|---|---|---|---|---|
| Base | Charging | |||
| Stage 1 | Charging rate discount was initiated | - | 10% | 1.1.2015–12.31.2017 |
| Stage 2 | Base charge discount was initiated | 100% | - | 4.1.2016–3.31.2026 |
| Stage 3 | Temporarily enhanced discount rate was additionally applied with a weight factor | 300% | 50% | 1.1.2017–12.31.2019 |
| Stage 4 | Applicable period of additional discount was extended | 300% | 50% | 1.1.2017–12.31.2020 |
Table 2.
Weight of ESS ECDP.
| Battery Capacity/Contract Power (%) | Weight |
|---|---|
| More than 10% | 120% |
| Between 5 and 10% | 100% |
| Less than 5% | 80% |
Table 3.
Electricity Tariff for a Building with A-level High Voltage, Option II.
| Base Charge ($/kW) | Usage Rate (cent/kWh) | |||
|---|---|---|---|---|
| Time | Summer | Spring, Fall | Winter | |
| 7.43 | Light Load Time | 5.01 | 5.01 | 5.63 |
| Medium Load Time | 9.73 | 7.02 | 9.75 | |
| Peak Load Time | 17.06 | 9.76 | 14.88 | |
Table 4.
Time Table for TOU Price in Korea.
| Time | Summer, Spring, Fall | Winter |
|---|---|---|
| Light Load Time | 23:00–09:00 | 23:00–09:00 |
| Medium Load Time | 09:00–10:00 | 09:00–10:00 |
| 12:00–13:00 | 12:00–17:00 | |
| 17:00–23:00 | 20:00–22:00 | |
| Peak Load Time | 10:00–12:00 | 10:00–12:00 |
| 13:00–17:00 | 17:00–20:00 | |
| 22:00–23:00 |
Table 5.
Specification of ESS and Conditions of Analysis.
| Battery type | Lithium-ion |
| Rated power | 250 kW |
| Storage capacity | 1000 kWh |
| Round-trip efficiency | 89% |
| Life cycles | 3000 cycles (≈12 years) |
| Depth of discharge (DOD) | 95% |
| Maintenance cost | 0.2% of capital cost, annually |
Table 6.
Controlled Cases for ESS’s Economic Feasibility Analysis.
| Discounts | Case I | Case II | Case III | Case IV | Case V |
|---|---|---|---|---|---|
| Base charge discount | - | - | 100% | 300%, 100% | 300%, 100% |
| Period of base charge discount (years) | - | - | 10 | 3, 7 | 4, 6 |
| Usage charge discount for the ESS charge | - | 10% | 10% | 50% | 50% |
| Period of usage charge discount (years) | - | 3 | 3 | 3 | 4 |
Table 7.
Results of economic feasibility analysis in controlled cases.
| Results | Case I | Case II | Case III | Case IV | Case V |
|---|---|---|---|---|---|
| Payback years | - | - | - | 6.85 | 5.73 |
| B/C ratio | 0.483 | 0.489 | 0.861 | 1.03 | 1.08 |
| IRR (%) | −14.2 | −14.1 | −3.6 | 1.21 | 3.28 |
| NPV (thousand US dollars) | −389 | −385 | −105 | 24.6 | 63.5 |
Table 8.
Real Cases for ESS’s Economic Feasibility Analysis.
| Parameters | Case I | Case II | Case III | Case IV | Case V |
|---|---|---|---|---|---|
| Base charge discount | - | - | 100% | 300%, 100% | 300%, 100% |
| Period of base charge discount (years) | - | 10 | 3, 7 | 4, 6 | |
| Usage charge discount for ESS charge | - | 10% | 10% | 50% | 50% |
| Period of usage charge discount (years) | - | 3 | 3 | 3 | 4 |
| Governmental subsidy for ESS (only for subsidy program) | 70% | 50% | 50% | 30% | 30% |
| Cost of ESS with 0.25 MW, 1 MWh (thousand US dollars) | 786.6 | 629.5 | 622.3 | 558.9 | 558.9 |
Table 9.
Results of Real Cases in Private Market: Without Subsidies.
| Results | Case I | Case II | Case III | Case IV | Case V |
|---|---|---|---|---|---|
| Payback years | - | - | - | 5.72 | 4.63 |
| B/C ratio | 0.38 | 0.49 | 0.86 | 1.15 | 1.21 |
| IRR (%) | −18.4 | −14.2 | −3.50 | 5.76 | 8.29 |
| NPV (thousand US dollars) | −584 | −390 | −102 | 104 | 143 |
Table 10.
Results of Real Cases in Government-Driven Market: With Subsidies.
| Results | Case I | Case II | Case III | Case IV | Case V |
|---|---|---|---|---|---|
| Payback years | 7.52 | - | 4.99 | 3.01 | 3.00 |
| B/C ratio | 1.28 | 0.971 | 1.73 | 1.65 | 1.73 |
| IRR (%) | 5.75 | −0.65 | 16.4 | 25.7 | 30.3 |
| NPV (thousand US dollars) | 79.2 | −11.0 | 273 | 306 | 345 |
Table 11.
Correlations between IRR and ESS Investment.
| Correlation Coefficient (with IRR) | Total | Private Only | ||
| kW | kWh | kW | kWh | |
| 0.8093 | 0.7513 | 0.7431 | 0.7113 | |
© 2019 by the authors. Licensee MDPI, Basel, Switzerland. This article is an open access article distributed under the terms and conditions of the Creative Commons Attribution (CC BY) license (http://creativecommons.org/licenses/by/4.0/).
Share and Cite
MDPI and ACS Style
Jo, B.-K.; Jung, S.; Jang, G. Feasibility Analysis of Behind-the-Meter Energy Storage System According to Public Policy on an Electricity Charge Discount Program. Sustainability 2019, 11, 186. https://doi.org/10.3390/su11010186
AMA Style
Jo B-K, Jung S, Jang G. Feasibility Analysis of Behind-the-Meter Energy Storage System According to Public Policy on an Electricity Charge Discount Program. Sustainability. 2019; 11(1):186. https://doi.org/10.3390/su11010186
Chicago/Turabian StyleJo, Byuk-Keun, Seungmin Jung, and Gilsoo Jang. 2019. "Feasibility Analysis of Behind-the-Meter Energy Storage System According to Public Policy on an Electricity Charge Discount Program" Sustainability 11, no. 1: 186. https://doi.org/10.3390/su11010186
Note that from the first issue of 2016, this journal uses article numbers instead of page numbers. See further details here.