1. Introduction
It is difficult to imagine an economic or financial mechanism that fits the definition of the free market better than the stock exchange and foreign currency exchange [
1,
2]. Being located at the core of capitalism, the stock exchange and the foreign currency exchange provide a very distinctive projection of the whole market, extracting its essential part, financial operations, and providing a way of managing and earning money on a higher level of economic abstraction. However, these financial mechanisms can also be sometimes very detached from the real economy and can produce fictitious capital through the use of very sophisticated financial instruments [
3].
As long as both of the mentioned mechanisms have existed, there has also been present a desire to research, invent and make use of a procedure that would give some insights into the future behavior of the exchange rates and stock prices [
4]. In reality, in which any information can decide between profit and loss and fortunes are made, or lost, in a couple of minutes (or seconds), such a method would be an invaluable asset. If there is an opportunity to make an income, people are usually more eager to donate their money for such research, so it is not very surprising that over the years, many attempts were made to create index prediction mechanisms and some automatic financial management systems.
Some of these projects were more successful, some less, but in general, we can say that vast advancements have been made in this field. Nowadays, more and more responsibility for financial decisions lies with computer programs, which have become a critical part of the financial and economic reality. In this paper, some known algorithms supporting investment decisions are analyzed, and a new approach using the parameterized greedy strategy and the evolutionary algorithm was proposed and extensively tested using real-world data from the Forex market.
Potentially, the financial sector of the economy should play a significant role in promoting sustainable development. Financial institutions are responsible for allocating financial resources, so it should be an essential task to support sustainable economic development, taking into account the preservation of natural resources and social responsibility [
5]. The financial system accumulates enormous amounts of financial resources, which should be used primarily for financing the real economy and its development. These resources could be theoretically allocated for environmentally-friendly projects, which help to protect the natural environment and to preserve natural resources. Furthermore, the financial resources could be potentially allocated only to socially-responsible companies, which take into account the social and ecological impact of their economic activities (companies that apply corporate social responsibility policies), thus promoting social and environmental sustainability [
5,
6]. Corporate social responsibility, reflected in sustainability reporting, which includes the measurement and disclosure of activities supporting sustainable development, found its way to the stock exchange markets in the form of socially-responsible stock market indices (SRI) used in addition to traditional stock market indices (TI) [
7].
However, there is substantial evidence that the potential opportunities presented above are unfortunately quite distant from the reality. The most important is the general lack of compatibility between the very nature of the financial system and activities that promote sustainable development by taking into account the environmental and social impact of economic activities [
5,
8,
9]. Such incompatibility is mainly caused by the fact that the primary goal of the financial institutions, and the financial system as a whole, is getting fast and massive profits. Such an objective is incompatible with sustainable development activities, which require long time investments [
8,
9]. Focusing on the short-term goals has a harmful, and sometimes even a catastrophic, impact on the real economy and the financial system itself, as the 2008 financial crisis showed. Preferring short-term goals also leads to avoiding the primary purpose of the financial system, which should be financing the development of the real economy. Unfortunately, the financial institutions prefer investments with the use of financial instruments that produce fictitious capital and eventually lead to speculative bubbles and financial crises because they generate fast and massive profits [
3]. Some authors show that the influence of the financial system on sustainable development in developing countries is very weak or non-existent [
5]. It was also argued that the socially-responsible stock market indices have a lower efficiency when compared to the traditional stock market indices [
7]. The lower efficiency of the socially-responsible stock market indices was also observed in the case of emerging markets [
7]. Some authors argued that despite including the environmental, social and governance (ESG) criteria in investment decisions, we do not see a real shift towards business practices that take into account sustainable development [
6]. The authors also argued that the possible way out of this deadlock could be the redirection of financial institutions toward long-term goals of sustainable development and the increase of the reliability of the environmental, social and governance (ESG) measurements [
6].
The research on using bio-inspired artificial intelligence techniques for generating investment strategies can also be put into a broader context. In this paper, we analyze the credibility and validity of the efficient market hypothesis and its impact on different research areas, including sustainable development. Recently, the credibility of the efficient market hypothesis has been strongly undermined by the 2008 financial crisis, speculative bubbles and financial market crashes [
10,
11]. Some of the economists argue that the old theory of finance is dead and we need new, more realistic, theories and models of finance, which can be used for reliable predictions of future events. The relationship of these issues with the research presented in this study is two-fold. Firstly, if the proposed techniques are to succeed fully and the future asset price trends are to be predicted, then the efficient market hypothesis would be false. On the other hand, the evidence in the form of the 2008 financial crisis and the newly-proposed models of finance shows that the hypothesis has some serious flaws and that the financial market is not efficient and unpredictable. Such conclusions can potentially have a significant impact on other areas of our lives. An example of this is the sustainable development policy, in which attempts to incorporate the financial markets and institutions were made [
6].
The paper is organized as follows. First, we will introduce selected issues connected with the financial markets and the investment strategies, including the efficient market hypothesis and its impact on the research presented in this paper, as well as on other areas of our lives. Next, the evolutionary algorithms are presented. Then, we will provide an overview of research on bio-inspired artificial intelligence algorithms for solving economic and financial problems.
In the next part of the paper, the system for the evolutionary optimization of Forex investment strategies is presented, and the evolutionary algorithm and all the novel mechanisms and techniques introduced to apply the algorithm to greedy strategy optimization are presented. The most important of the proposed techniques include the mechanisms for maintaining the population diversity, a mechanism for protecting the best individuals in the population, the mechanisms preventing the excessive growth of the population, the mechanisms for the initialization of the population after moving the time window and a mechanism for choosing the best strategies used for trading.
In the last part of the paper, the results of experiments carried out with the use of real-world Forex data are presented. The experiments were aimed at comparing different variants of the techniques and algorithms used in the system, as well as comparing the results obtained by the optimized greedy strategy with the results obtained by the buy-and-hold strategy and, consequently, verifying the credibility of the efficient market hypothesis.
1.1. The Financial Markets: Stock Exchange and Forex
Investments can be made in many different segments of the financial market. The most popular of them is the stock exchange market and the foreign exchange market, Forex. On both of these markets, the prices prediction techniques and the new strategies of the income maximization are used with quite high intensity.
The predominant factor that plays a role in establishing prices on markets such as the stock and foreign exchange is the law of supply and demand. On these markets, the price of a given value results from the analysis of purchase and sale orders in a given session. Investors place their orders giving a price limit, which they are willing to pay (maximum for purchase, minimum for sale). When a limit of a price is not specified, an order will be realized with the price determined for that particular session. The computer system analyzes lists of orders and calculates prices, trying to meet the following conditions (in hierarchical order) [
1,
4]:
- (1)
The maximal value circulation, in other words, the amount of value taking part in a transaction.
- (2)
The minimal difference between the amount of value in purchase and sale orders, possible to realize at the current price rates.
- (3)
The minimization of difference between the computed price and the previous one.
The process takes place during every session, and the price that is the result is set as a value price in this particular quotation. In the case of the stock exchange market, the session lasts for the entire day, while on Forex market, quotations of the rates are performed hourly.
In a real trading system, the brokerage commissions must also be taken into account [
1]. All orders are placed via brokers, which take a small fee for their actions. It is a very important factor, which reduces the profits from transactions. Every algorithm that searches for an optimal strategy and does not take into account those commissions would possibly look for solutions composed of a large number of small transactions. When the commissions are not taken into account, such strategies might provide a large profit, but in reality, they would be quite useless.
1.1.1. The Stock Exchange Market
The stock exchange is the market for transactions involving securities such as stocks, paper obligations, options and others. The stock is the basic security representing a capital of a joint stock company. The price of a stock, at least in theory, reflects its potential to generate the dividend [
12]. By the dividend, we mean the yearly profit gained from the possessed stocks, which results from a company profits; it is the simplest way to make money on stocks. However, in practice, the prices of stocks behave in a more complex and “mysterious” way, being the resultant of many different factors, often linked to each other on a feedback basis [
2]. For that reason, the fluctuations of the stocks prices can be sometimes very high and unexpected.
The investors quickly noticed that taking advantage of these stock price changes, they can make a higher profit than from the dividends. The transactions in which the potential gain is based on predicting the future prices are called the speculations [
1].
1.1.2. The Foreign Exchange Market
The term “Forex” is used to describe the international currency market [
1,
4]. On this market, the exchange rates are established. The most important participants in the currency market are investors, which focus only on the pure speculation. Another group of the participants consists of central banks, which sell or buy currency to prevent the excessive increase or decrease of the exchange rate of a particular currency.
Forex is the most significant market in the world, having a turnover reaching about 4.5 trillion American dollars daily. It is a decentralized market, without a single global entity controlling the turnover. Thanks to this market being open 24 h a day from 11:00 p.m. on Sunday to 10:00 p.m. on Friday (according to Greenwich mean time), it is a fundamental feature in the context of the trading algorithms. In the case of the stock market, there can occur significant differences between the closing price on the given day and the opening price on the next day. Such differences result from events that took place in the period when the stock market was not operating. Such “unexpected” changes, from the algorithm’s point of view (which analyzes only the subsequent values), might introduce a “misleading” factor [
1,
4].
The most significant advantage of the Forex market is its great fluency, causing selling or buying any amount of a currency at any moment of time to not pose a problem. The stock exchange does not have as much liquidity, so the orders do not have any realization guarantee. Such a feature can be considered as another obstacle for the algorithm because another condition is introduced, to which the automatic procedure must adapt.
The Forex market investments are short-term in comparison to the ones on the stock market. Usually, currencies are kept by the investors for only a few hours. In such a short time, the market is more predictable.
The last trait differentiating Forex from the stock exchange market is the “two-sided” nature of the currency rates. A decrease of Currency A relative to the Currency B exchange rate indicates an increase of the Currency B to A exchange rate. There are no “bull” or “bear” markets because there always exists a possibility of trading any currency.
1.1.3. The Efficient Market Hypothesis
The fundamental question that must be asked while considering the financial markets investment strategies is if the market is efficient [
13]?
According to the efficient market hypothesis [
13,
14], the competition among its numerous intelligent participants leads to a situation in which, at any given moment, current prices of particular assets are reflecting the effects of all the information about events (which took place or were predicted) that can influence the prices. In other words, every piece of information that could have any influence while predicting the future stocks prices was evaluated and taken into account by the investors, whose orders of purchasing and selling stocks had already corrected the current price.
If the hypothesis is correct, then the future stock prices are entirely unpredictable, and all of the investment strategies are useless. On the other hand, finding a strategy that is continually winning or at least gives profits higher than the buy-and-hold strategy would give the basis for overthrowing the efficient market hypothesis. During the forty years of its existence, the hypothesis could not have been proven or overthrown [
14].
However, the recent events, like capital market booms and crashes and the 2008 world-scale financial crisis, have severely undermined and discredited the efficient market hypothesis and capital market theories, which are the basis for our understanding of asset pricing and risk [
10,
11]. Some economists still try to treat the 2008 financial crisis, speculative bubbles and financial market crashes as singularities and argue that there is nothing wrong with the current theories and models of finance [
10].
There is, however, a group of economists, including some of the leading ones, who argue that the mainstream theory and models of finance, including the efficient market hypothesis, are no longer valid [
10]. Some researchers try to find a way out of this situation by proposing behavioral-based models of finance [
2], while others try to propose a new unified theory of finance and asset pricing models based on the rational behavior and more realistic assumptions.
For example, the authors of [
15] try to formulate the theory that can take into account the fact that private investors rarely invest directly in stocks, bonds and derivatives. They usually delegate investment decisions to professional agents, like banks, brokers, etc. Such agents rarely have the same interests as the investors, and they usually have more and better information. The authors of [
15] were able to explain the momentum, a tendency for trending in prices, which can cause speculative bubbles and crashes. The authors of [
16] described the momentum as the “premier unexplained anomaly” in the mainstream asset pricing models.
The efficient market hypothesis and the myth of the rational market [
17] lies at the very core of promoting the market-based methods for solving many problems that our civilization faces, including ecological and social ones. The disproving of the efficient market hypothesis would also undermine the free market environmentalism [
18], which promotes free market and property rights as the best mechanisms for sustainable development, preserving natural environment, ecosystems and conserving the natural resources. If the efficient market hypothesis is false, then the financial market is not efficient and rational. As a result, asset prices often significantly deviate from their real values, which deludes the investors and possibly results in asset bubbles and financial crises. The deviation of asset prices from their real values causes that the financial resources cannot be efficiently allocated because deluded investors do not have any reliable information on which companies or projects in which they should invest. It is an illusion to expect that in such a situation the investors will make rational decisions and choose companies that take into account social and environmental effects of their activities. In such a case, the market-based methods, as not rational and not efficient, cannot be the basis of any sustainable development policies, which require rational decisions and predictable mechanisms.
As in the case of finance, there would be a need for new, more realistic models and theories, which can be the basis for new and effective sustainable development policies. Furthermore, the attempts to incorporate the financial markets and institutions into the framework of sustainable development (for example, compare [
6]) will have to be rethought and reformulated taking into account the new models and theories of finance that are currently proposed by some of the economists.
1.1.4. The Financial Analysis and Investment Strategies
The existence of speculation causes even the smallest changes in stock prices to have a significant influence on the market turnover and the investors’ behavior and decisions [
1]. Taking into account the trends of stock prices or exchange rates is such an important factor in investors’ decisions, that it is used to influence the prices of stocks or exchange rates of currencies during the so-called “speculation attacks”. The effect of such an attack is a change of exchange rates and prices, which does not have any grounds in the real economic situation of a company or a currency.
The analysis of trends of exchange rates or stocks prices has gained significance to such a degree, that it is treated as equal to the analysis of a real condition of a company or a currency [
1]. It has been the basis of one of the most important prediction techniques, the technical analysis. The second technique is the fundamental analysis, which takes into account over-the-counter (OTC) factors and evaluates the real condition of the entity represented by the particular asset. The technical analysis, on the other hand, focuses only on the rate and price history, introducing different methods of interpretation and indicators signalizing the future exchange rates and stocks prices.
The fundamental analysis lays outside the scope of the algorithmic approach because the factors taken into account are too hard to be systematized and obtained. However, it is worth noting that despite those difficulties, there were some attempts to include the information other than the exchange rate history during the analysis. In [
19], the authors experimented with the technique of processing the information published on the two popular Internet business and finance information portals: Yahoo! and Lycos Finance.
The technical analysis has a more algorithmic nature. The theory comes from the observation done by R. N. Elliot in 1939 [
20], that prices of a stock are changing periodically, according to the subsequent numbers from the Fibonacci sequence. From this moment, the technical analysis found many followers, and a large number of theories describing the rates’ behavior were created. The profitability of the technical analysis is the subject of controversy. Though its theoretical basis was not found, there exist research works justifying its usage for short-term investment strategies (for example [
21]). As the reason for defending it, a slightly positive correlation of profits on the market in the short-term perspective is pointed out. It is a phenomenon similar to weather forecasting: after a sunny day, there is a minimally larger probability that another sunny day would occur. It is also possible that the stock market includes some simple elements appearing in a specific order (some patterns), so its behavior is similar to cellular automatons and fractals (although it seems that it changes completely at random). If this is true, then searching for an optimal investment strategy is justified [
12].
Paulos [
12] also points out another encouraging argument supporting the existence of a winning strategy, the Parrondo paradox from game theory. The paradox is that there can be two games, both statistically leading to a defeat, and there exists a strategy, which is winning when playing those games alternately.
A large number of dependencies and the fact that most of them are non-linear cause the long-term prediction of exchange rates to be doomed to fail, similarly as in the case of weather forecasting. Nonetheless, it does not exclude the existence of a strategy that is profitable in the short term. The strategies used by the investors are usually too simple to take into account the complexity of the inner market processes. The investors often use simple spreadsheets or calculators to find specific chart formations.
A computer program can perform a much more thorough analysis, taking into account a massive amount of different factors. From this point of view, the search for trading algorithms seems attractive. An additional advantage of these algorithms is the complete lack of any psychological factors: they do not care about the resources available for the given investment account and can take a risk (justified by the possessed information), which may seem very dangerous at first, but leads to high profits in the future. On the other hand, decisions of human investors are often non-deterministic and non-objective, which results from human nature [
2].
Greedy strategies are a specific type of investment strategy. They take a higher risk in periods of temporary decrease in the profit rate, with the assumption that it will return to a normal level in the longer term. Thanks to that behavior, the greedy strategies can systematically gain the advantage over strategies that back down from the market in the case of a profit rate decrease. However, a high risk connected with the use of such strategies rather discourages their usage. It is hard for a human investor to manage such a strategy because it is not objective due to the risk taken.
The fluctuations of profit rates are occurring very often. Therefore, the chances for a systematic profit obtained from a greedy strategy are quite high. Unfortunately, there is always a risk of a situation in which the price of stocks will never bounce off the bottom and start rising again. The decision to further buy stocks is becoming more and more difficult because it can be the cause of bankruptcy. Finding the optimal parameters for such a strategy is a complicated matter, especially for a human influenced by emotions.
1.2. Evolutionary Algorithms
The evolutionary algorithms have been developed for over fifty years [
22,
23,
24,
25,
26,
27,
28,
29]. During this period, a few different approaches emerged, but all of them shared the same inspiration: Darwin’s theory of evolution [
30].
In general, an evolutionary algorithm is a probabilistic technique, in which a population of individuals
is generated in each iteration
t [
23,
28,
29]. Every individual
represents a possible solution to a problem being solved. The solution is encoded within the individual’s “genotype”. Every individual
is evaluated with the use of a fitness function (which is based on a problem that is being solved), and the value of this function computed for the given individual is called the individual’s “fitness”. The individuals with a better fitness value are more likely to become “parents”. The offspring is created with the use of genetic operators, which ensure that new solutions constantly appear in the population. The genetic operators include “mutation”, which introduces changes to the individual’s genotype, and “recombination” (sometimes called “crossover”), which mixes parents’ genotypes in a specific way during reproduction. All these mechanisms cause the population to evolve in such a way that the solutions encoded within individuals’ genotypes are getting better and better; the average fitness of the individuals from the population increases with time. The whole population evolves toward regions of a solution space in which the optima of a problem being solved are located.
The pseudocode of the basic version of the evolutionary algorithm is presented in Algorithm 1. Not every evolutionary algorithm must exactly follow this scheme, but usually the basic operations—like a modification of the population gene pool (the reproduction, mutation and recombination operators) and the selection of the individuals for the next generation—can be distinguished [
22,
23,
24,
26].
| Algorithm 1: The basic version of the evolutionary algorithm. |
![Sustainability 10 01460 i001]() |
During the reproduction process, some of the individuals are selected to become parents. Next, the offspring are generated from the parents, and their genotypes are subject to changes, which are introduced by genetic operators. These operators include recombination (crossover) and mutation [
31,
32]. The recombination is performed in such a way that it mixes the genotypes of the selected parents, and the result is the offspring’s genotypes with features coming from different parents [
31]. After generating the offspring, there is a need for fitness evaluation for these newly-created individuals. The time needed for performing this operation should be carefully monitored, because in many cases, the fitness function depends on some complex calculations, or even computer simulations, estimating or calculating the efficiency of the analyzed solution encoded within an individual’s genotype.
The crossover and mutation operators cause individuals with new solutions encoded within their genotypes to emerge in the population [
31,
32]. Afterward, an “inspection” of the population is performed, and the “worst” (with the lowest fitness value) individuals are removed. The individuals with the best fitness are selected to form the base population for the next step of the algorithm; the next generation of individuals is established. The rule is generally such that the individuals with the better fitness have a higher chance of being selected for the future generation population. The individuals are selected from the offspring only or the offspring and some part of the population of parents. The latter mechanism is generally better because we do not lose good solutions that are present in the population of parents.
The stopping condition of the algorithm can be specified as reaching a maximal number of steps, obtaining a satisfactory value of maximal fitness in the population or a lack of a significant improvement of the population during a specified number of steps [
23].
The spectrum of applications of the evolutionary algorithms is quite extensive, thanks to their potential ability to solve any optimization problem [
23,
33,
34]. At the same time, it is a straightforward and entirely intuitive idea, and applying it is not rather sophisticated, at least in the case of some optimization problems. The evolutionary algorithms are even used for finding solutions to some NP-complete problems (like transport optimization and scheduling) and designing the architecture of a neural network. In the case of the evolutionary algorithm, it is sufficient to define a fitness function, a representation of a solution and evolutionary operators, and the algorithm will direct the population towards regions of a solution space where optima are located. Of course, in the case of some practical applications, it can be a challenging task to define a proper representation of a solution or to develop correctly-working genetic operators.
Of course, using the evolutionary algorithm for solving optimization problems imposes certain conditions on the nature of the problem [
23,
29]. First of all, multiple solutions of the problem must exist, and the evaluation function must be provided; it is necessary for comparing the solutions and for directing the population towards areas of a solution space where optima are possibly located. The second essential condition is the ability to encode a solution within individual’s genotype and to define the genetic operators, which modify the genotype and introduce a random factor to the whole procedure.
1.2.1. The Classification of Evolutionary Algorithms
The classical evolutionary algorithms can generally be grouped into four categories: genetic algorithms, genetic programming, evolutionary programming and evolution strategies [
23] (see
Figure 1).
The evolution strategies do not require any particular representation of a solution within the genotype; the floating point numbers are used to represent a solution, so the evolution strategies are very well suited for continuous optimization problems [
35]. In the original version of evolution strategies, the population consisted of one individual; the offspring was generated with the use of mutation operator; and then, the parent and the offspring competed for a place in the next generation population. In the contemporary versions of evolution strategies, there are
parents and
children produced with the use of recombination and mutation operators. There are two kinds of evolution strategies, which differ from each other in a way that the individuals for the next generation population are chosen. In the
strategy, the individuals for the next generation are selected from the offspring only, and in the case of the
strategy, the individuals for the next generation are chosen from the parents and offspring.
Genetic programming and evolutionary programming are important branches of evolutionary algorithms [
23,
26]. In both cases, the individual’s genotype contains a computer program solving a given problem. The task of both algorithms is to optimize those programs. Genetic programming is a relatively new concept introduced by J. R. Koza [
36]. Instead of building an algorithm for searching a solution space of a given problem, J. R. Koza proposed an evolutionary technique of searching for the best possible algorithm. The genetic programming uses a tree structure for representing the single solution; of course, in this case, the solution is a whole computer program. The nodes of this tree are functions, and children of a given node are arguments of the function.
In the original evolutionary programming approach, the programs were represented as finite state machines, the states, transitions, inputs triggering transitions and outputs of which were modified by a mutation operator. Over time, evolutionary programming became similar to evolution strategies [
23]; now, it uses the floating-point number representation of a solution and mutation as the only genetic operator.
The general public attention was mainly focused on the genetic algorithms [
22,
37,
38]. The significant feature of this class of evolutionary algorithms is their tendency to maintain a general form, that is mostly independent of the problems being solved. The genotype usually consists of sequences of binary numbers, so a solution of the given problem has to be expressed in the binary numeral system; of course, in the case of some problems, it can be hard to achieve. The recombination operator creates the offspring genotypes by “cutting” the parents’ genotypes into several randomly-chosen positions and mixing them; for example, the first part of the child genotype comes from the first parent; the second part comes from the second parent; the third one comes from the first parent, and so on. The genetic algorithms are at the same time criticized for their universal nature because in some specific cases, it is often necessary to maintain some additional, “unnatural” mechanisms to guarantee that all the solutions satisfy the problem’s constraints [
23]. However, their theoretical basis is usually better developed than it is in the case of other evolutionary techniques [
37].
For that reason, in the case of many practical problems, the most natural representation and some dedicated genetic operators (which take into account some additional constraints) are used. Such an approach dramatically simplifies the process of controlling the correctness of a solution. The evolutionary algorithm constructed in such a way does not necessarily fit into one of the categories mentioned above (see
Figure 1), but it turns out that it can give quite satisfying results [
23].
1.2.2. Agent-Based Evolutionary Algorithms
A realization of evolutionary processes in a multi-agent system leads to a very interesting group of evolutionary algorithms named evolutionary multi-agent systems (EMAS) [
39]. A basic agent-based evolutionary algorithm is composed of agents and the environment. All agents are located within the environment and can interact with it, as well as with other agents.
The selection process is realized with the use of resources. Resources are available in the environment and are in the possession of agents. The environment gives resources to agents, or they exchange the resources between themselves. The rule is such that a higher amount of resources always goes to agents that have better fitness. In such a way, better-fitted agents always have more resources, which are needed to survive and to perform every action, like reproduction or migration within the environment. The resources also play the role of a mechanism of limiting an excessive growth of the population [
40]. If the total amount of resources in the system is constant, then the maximal number of agents that can live within the system is limited because every agent has to possess some of the resources to survive; the agents that do not have any resources die and are removed from the system.
The agents have to search for reproduction partners that are ready for reproduction. An agent is prepared for reproduction if it possesses a minimal amount of resources that are needed for performing this activity. The agents can migrate within the environment in search for partners or resources. If two agents that are ready for reproduction meet in the environment, they can reproduce. As an effect of reproduction, offspring are produced with the use of recombination and mutation operators from classical evolutionary algorithms. During reproduction, parents give children some amount of their resources.
Co-evolutionary multi-agent systems (CoEMAS) [
41] comprise an extended version of the basic EMAS model. In the CoEMAS model, more than one species can exist within the population, and sexes can exist within each species. The usage of such extended mechanisms leads to a system in which we can model the co-evolution of species and sexual selection, which vastly extends the possibilities of using such algorithms. Agent-based co-evolutionary algorithms were applied to multi-modal optimization [
42,
43], multi-objective optimization [
44,
45,
46] and multi-objective portfolio optimization [
47].
1.2.3. The Specificity of Evolutionary Algorithms
The evolutionary algorithms differ significantly from purely random search algorithms because they combine both directed and stochastic searching approaches. For that reason, those algorithms are also more reliable than the existing direct search algorithms [
23]. Another advantage is the constant presence of many sub-optimal solutions in the population. In such a way, the population continually provides solutions from different regions of the solution space. It is especially useful in the case of multi-modal problems; there even exist some specific mechanisms for the evolutionary algorithms (niching and speciation techniques) that allow for finding many solutions of a given problem simultaneously [
23,
29].
Niching and speciation techniques work in such a way that they split the population into sub-populations, which are located within neighborhoods of local minima of a given problem. The splitting can be done by using the following three approaches. In the first case, the fitness of individuals is modified in such a way that the more individuals similar to each other in the population, the more they lower each other’s fitness (fitness sharing technique) [
48]. The second mechanism modifies the way the individuals are selected for the next generation population. In this technique, the individuals have to compete against other individuals that are similar to them (crowding mechanism) [
49]. The third mechanism groups individuals by their location in a solution space in such a way that similar individuals have to compete against each other, but there is no competition between individuals that belong to different groups [
50].
The evolutionary algorithms are optimization techniques that are very general [
23]. Theoretically, the only element that depends on a problem domain is the fitness function. However, in many real cases, it often turns out that some other mechanisms are also problem dependent, like for example the representation of a solution or the genetic operators. The whole algorithm can work without any knowledge about the problem being solved (such a feature of the evolutionary algorithms dramatically simplifies the implementation of software libraries and frameworks for evolutionary computations), and such libraries can provide very general mechanisms, which can be then fine-tuned by the prospective users.
There are also some problems connected with the evolutionary algorithms and their applications in some areas [
23,
26]. Two main ones are the premature convergence and the stagnation of the population. The premature convergence is a situation in which the evolutionary algorithm loses the ability to search a solution space before finding a solution that is located near the global optimum. The stagnation, on the other hand, is a lack of significant improvement of the best individuals’ fitness during consecutive generations. Both phenomena are disadvantageous and reduce the effectiveness of the algorithm significantly.
The two parameters influence the level of premature convergence and the stagnation: the population diversity and the selection pressure [
14]. Both of them are firmly connected. The intense selection pressure reduces the population diversity and can cause premature convergence. On the other hand, weak selection pressure can lead to stagnation.
The intensity of premature convergence and stagnation is also dependent on the shape of the fitness function surface. In the case of some of the optimization problems, a fitness function has a surface that provides an easy way to find global optimum, while the others have such a fitness function that leads the population towards areas that are very distant from the global optimum. If we want to minimize the impact of these disadvantageous phenomena, it is necessary to experiment with the fitness function type, the mutation range or the selection method. However, the “no free lunch” theorem states that there is no general recipe for solving all of the problems that can potentially be solved with the use of evolutionary algorithms [
51,
52].
1.2.4. Evolutionary Operators
The most popular operators that modify children’s genotypes are mutation and recombination [
31,
32]. However, there are some research works (for example, [
53,
54,
55]) that did not strictly follow this convention, and as a result, many different genetic operators were proposed. In fact, the results of experiments showed that a specialized algorithm well suited to a specific problem could give much better results than the general version of the evolutionary algorithm.
The process of choosing parents can take many different forms [
23,
26]. In general, the created offspring should possess such parent traits (as a result of applying the recombination operator) that it would have better fitness and the whole population would evolve towards the areas where the global optimum is located.
The fitness proportionate selection (also called the “roulette wheel selection”) is a popular method of selecting the parents [
23,
26]. The parents are selected at random, and the probability of choosing the given individual is proportional to its fitness value.
Another technique of choosing the parents is the stochastic universal sampling [
23]. In this technique, the axis is divided into sections, and the length of each section is proportional to the fitness value of a given individual. Then, a random point between zero and
(where
F is the total fitness of the population and
N is the number of parents that we want to select) on the axis is selected; this would be the starting point (
S). The first random point selects the first parent; the individual is selected when the point is generated within the section that represents the given individual. The next points that select the consecutive parents are generated in the evenly-spaced intervals, according to the following formula
.
As opposed to the previously-mentioned techniques, the truncation selection was not inspired by nature, but cattle breeders invented it during the selection of the best individuals from large populations [
23,
26]. In this technique, the individuals are sorted according to their fitness. Only the best individuals are chosen as parents. The parameter of this reproduction technique is the threshold indicating how many individuals would become parents. This method has one main advantage over the others. It results from the observation that in the population, a group of super-individuals often resides, whose fitness greatly exceeds the average fitness. In such a case, the probability of selecting an individual outside of this group significantly drops. In the truncating selection, premature convergence can be avoided because the individuals are chosen by their positions in the ranking and not by their fitness value.
The tournament selection is an interesting solution, which is based on performing tournaments among the groups of individuals [
23,
26]. The groups are created by dividing the population into equal parts. From each group, one or more best individuals are chosen.
After selecting the candidates for parents, the recombination of their genetic material is performed [
31]. The technique of recombination is determined by a method of encoding a solution in the genotype. It can take into account the specificity of the problem. If knowledge about the problem is not taken into consideration, it can lead to a situation where individuals that are incorrect from the perspective of this particular problem are created. There exist some techniques to manage with such incorrect individuals. Among them, one can distinguish the penalty technique (lowering the fitness value) and the repair functions.
The mutation operator is responsible for introducing a random factor to the algorithm, which increases the population diversity and helps to explore new areas of a solution space [
31,
32]. In this way, it prevents premature convergence to local optima. The mutation randomly changes some parts of the children’s genotype. Of course, it has to be constructed following the representation that was used.
After performing the selection, crossover and mutation operations, the process of selecting individuals for the next generation population follows [
23]. If the size of the population is to be controlled, then a group of individuals must be chosen from the current generation population and the children created during the reproduction. The size of the population does not need to be necessarily constant. One of the most interesting methods of maintaining a dynamic size of the population is assigning an “age” value to the individuals’ genotypes, which determines after how many generations they will be removed from the population.
2. Previous Research on Bio-Inspired Artificial Intelligence Techniques for Economic and Financial Problems
Recently, an increased interest in research on bio-inspired artificial intelligence techniques can be observed [
56,
57,
58]. Evolutionary algorithms, as techniques that belong to the group of bio-inspired artificial intelligence techniques, are also of interest to researchers working in various fields [
33,
34]. As a result, there is a rapid growth of research on economic and financial applications of bio-inspired artificial intelligence techniques [
59,
60,
61,
62,
63]. In this section, we will focus on the selected research in the area of evolutionary algorithms and their applications in investment decision support systems.
In [
64], the genetic algorithm was used for selecting the parameters for indicators, which were used in the generated trade models. The authors compared three algorithms: the genetic algorithm, the genetic algorithm with the fitness sharing technique developed by X. Yin and N. Germay [
65] and the genetic algorithm with the fitness sharing technique developed by the authors of [
64] themselves. The best results were obtained with the use of the latter one, which had the best generalization capabilities.
The genetic algorithm was used for the investment decision support in [
66]. The algorithm was used for selecting the company in which we can invest. The proposed system was making a decision based on historical data, using some logical operations. The genetic algorithm was used to select the proper logical operations in a given market situation.
In [
67], the genetic algorithm for finding trading rules for the S&P 500 index was proposed. The rules used by the authors were composed of a function (organized as a tree) and a returned value, which indicated whether the stocks should be bought or sold. The following components of the rules were used: functions operating on historical data, numerical or logical constants and logical functions (used to build the more complex rules). The genetic algorithm selected structures and parameters for the rules.
Quantum-inspired evolutionary algorithms (a very interesting modification of the standard evolutionary approach) were used for option pricing model calibration in [
68].
The evolutionary algorithm for the design and optimization of a neural network used for automated trading (buying and selling of financial instruments) was proposed in [
69]. The obtained trading rules were not very sophisticated, but their systematic execution could lead to some substantial returns.
The authors of [
70] used genetic programming for predicting bankruptcy. The genetic programming algorithm constructed a function based on historical data, which was used for assessing the condition of a particular company: whether it is heading toward some financial problems or bankruptcy. The authors claimed that approximately 75% of test data were classified correctly.
In [
71], the evolutionary algorithm was compared with selected simple investing strategies and the stock market index. The results showed that the proposed evolutionary technique outperformed the basic version of the buy-and-hold strategy and the market index in some cases.
The authors of [
72] used the multi-objective genetic algorithm for portfolio optimization. They used the Markowitz model and two objectives for assessing the given portfolio: the risk and the rate of return.
In [
73], the NSGA-II multi-objective evolutionary algorithm was used to solve multi-objective problems constructed with the use of three higher moment models (the mean-variance skewness with three objectives, mean-variance skewness kurtosis with four objectives and mean-variance skewness kurtosis with eight objectives) and three median models with two objectives (the median value at risk, median conditional value at risk and median mean absolute deviation). The authors used the real-world financial data from the Egyptian Index (EGX). The results of experiments showed that the median models outperformed the higher moment models for data coming from the emerging economy stock market.
Jansen [
14] provided a thorough review of the current state of research on applying the evolutionary algorithms in the processes of investment strategies’ generation. His entire work was mainly focused on the verification of the efficient market hypothesis. Jansen introduced a division of the strategies into two groups: the strategies related to allocating securities and the trading strategies. The first one focuses on choosing the investment target (companies on the stock market or currency on the Forex market), and the second one focuses on determining a purchase or sale time. In this paper, we will focus on the latter category of strategies.
All the results in [
14] were compared to the buy-and-hold strategy, which has only one step: buying a specific amount of given assets. Afterward, we can observe if those assets can generate a profit or a loss. Jansen chose such a comparative indicator because, as he stated, finding a strategy that consequently wins with the buy-and-hold strategy undermines the efficiency of the market, at least in the period in which that strategy operates.
Jansen paid particular attention to these approaches, which tried to apply the generated strategies on unknown periods of time and taking into account the provisions from transactions. Usually, all authors agree that an algorithm can quickly find an optimal strategy for the training period, but for other periods of time, the results are mixed. Furthermore, many of the authors emphasize that the results obtained by the evolutionary algorithms are quite impressive when it comes to periods of time when the losses are generated, which means they are quite useful in creating strategies that back down from the bear market.
Another conclusion that arises from [
14] is that too complicated implementations of the genetic algorithms lead to the worse results because the generated strategies are over-specialized; they are very well adapted to the particular period, on which they were trained, but at the same time, they are poorly suited to the other periods. It was also noticed that the best strategies are found after 25 to 75 generations and that running the evolutionary algorithm for too long may lead to over-specialization.
The paper [
74] is especially worth mentioning. In this paper, the idea of a moving time window was utilized. Instead of looking for an optimal long-term strategy, the proposed algorithm was trained on a short time window from the past and was searching for a good strategy for the nearest future. The time window was successively moved together with the subsequent quotations, to guarantee that the found strategies are well adapted to the current trend. The authors reported that the results were positive and the buy-and-hold strategy was beaten. Additionally, two approaches to dealing with the population after the shift of the time window were tested: the initialization of the population and using the old population. Maintaining of the old population proved to provide increasingly better strategies.
The agent-based co-evolutionary genetic programming approach was applied to the investment strategies generation in [
75,
76]. The genotype with the tree structure was used. The nodes of the tree were functions, and their arguments were the children of a particular node. The value returned by the functions served as an argument for the parent node. A Boolean value indicating whether to buy or to sell the assets was returned by the root node. The tree leaves were composed of zero-argument functions and constants. The whole set of functions and constants, which the individual genotype consisted of, was extensive. It included mathematical and logical functions, as well as functions calculating different technical analysis indicators; see
Figure 2. The mutation and recombination operators were based on swapping the complete tree segments (sub-trees), with the assumption of the arguments compatibility. In the experiments, the buy-and-hold strategy remained unbeaten for random time periods. However, the proposed agent-based co-evolutionary approach was the best when it came to generalization capabilities; it provided the most general rules, which performed well in all possible market conditions.
The main drawback of the above approach proved to be the existence of a large number of absurd strategies among the results, which had to be filtered by the investor. The results were also very dependent on the set of implemented indicators and functions, available as “building blocks”, from which the genotype was constructed.
In [
77], the agent-based co-evolutionary algorithm for multi-objective portfolio optimization was proposed. The algorithm used the predator-prey interactions between individuals to maintain the high population diversity, which helped to adapt to the quickly-changing conditions of the economic environment. The algorithm was able to generate more robust solutions than the other techniques that were also used during the experiment.
In [
78], the agent-based co-operative co-evolutionary algorithm was applied to the multi-objective portfolio optimization problem. The agent-based approach was compared with SPEA2and NSGA-II multi-objective evolutionary algorithms. Selected standard multi-objective test problems and the multi-objective portfolio optimization problem were used during the experiments. The results showed that the agent-based algorithm obtained better results in the case of multi-objective test problems, while in the case of the portfolio optimization problem, the results were mixed: neither the agent-based approach, nor classical algorithms could obtain good results for all the types of optimization problems.
The agent-based co-evolutionary algorithm with sexual selection [
79] was applied to the multi-objective portfolio optimization problem. The proposed technique was compared experimentally with the genetic algorithm, the co-evolutionary algorithm and the trend-following algorithm. During the experiments, historical data from the Warsaw Stock Exchange were used. The trend-following algorithm obtained good results for unstable times because it guaranteed that the losses were minimized. However, during the stock market rise, it was outperformed by the other algorithms. The proposed agent-based multi-objective co-evolutionary algorithm obtained quite good results. It maintained a high level of population diversity and proposed sustainable strategies, where the risky and safe moves were mixed.
The optimization of the greedy strategies is not a very popular area of research. Furthermore, the review of research works provided by Jansen [
14] suggests that the Forex market was explored to a lesser extent than the stock market when it comes to the algorithms generating investment strategies and that the previous results were quite promising. In the previous research works (for example [
80,
81,
82,
83]) that analyzed the Forex market, techniques generating enormous profit were proposed, even if we take into account the transaction costs. Various authors also stated that the Forex market is mainly characterized by a lack of efficiency, which opens the way to the application of bio-inspired artificial intelligence algorithms for investment strategies’ generation.
The main achievements that differentiate the approach proposed in this paper from the approaches presented above and from our research presented in previous papers are the following:
- (1)
Using the parameterized greedy strategy as the investment strategy in the proposed system.
- (2)
The optimization of the greedy strategy with the use of the evolutionary algorithm.
- (3)
The design and implementation of the evolutionary algorithm adapted for the special task of greedy strategy optimization, including all of the necessary mechanisms and techniques.
- (4)
The design and implementation of the Forex market model used during experiments.
- (5)
Using the real data from the Forex market to verify whether the proposed approach works properly.
- (6)
Taking into account the transaction costs.
- (7)
The experimental comparison of the results obtained by the optimized greedy strategy with the results obtained by the buy-and-hold strategy.
The novel mechanisms introduced in this paper to apply the evolutionary algorithm to the greedy strategy optimization include:
- (1)
The genotype representation of greedy strategy parameters (see
Section 3.2.1).
- (2)
Four version of the fitness function used to evaluate the solutions encoded within genotypes of individuals (see
Section 3.2.3).
- (3)
The mechanism of reducing the mutation probability for better-fitted individuals to protect them from random mutations (see
Section 3.2.4).
- (4)
The mechanism of maintaining population diversity based on the removal of the offspring with duplicated genotypes (see
Section 3.2.5).
- (5)
The mechanism preventing excessive growth of the population (the proposed evolutionary algorithm uses the variable population size) based on the counter of the lifespan of each individual. The lifespan is reduced for individuals belonging to a group of the worst individuals. The size of this group is dynamically increased when the population is too large and decreased otherwise (see
Section 3.2.6).
- (6)
The mechanism of maintaining population diversity based on removing duplicates of individuals (individuals with the same genotype), especially from the group of best individuals. This mechanism also prevented the excessive growth of the population (see
Section 3.2.6).
- (7)
The mechanism of moving the time window with maintaining the population (see
Section 4.2.1).
- (8)
The mechanism of moving the time window with resetting the population (see
Section 4.2.2).
- (9)
Three mechanisms of exchanging a strategy used for trading (see
Section 4.2.1).
- (10)
The mechanism of using the lifespan of an individual while exchanging a trading strategy (see
Section 4.2.2).
3. The System for Evolutionary Optimization of Forex Investment Strategies
Taking into consideration the research presented in the previous sections, a system for generating investment strategies that utilizes the most promising concepts and allows us for exploring the least-known regions of the research domain was proposed.
One of the fundamental assumptions was to take into account the realistic provisions from transactions and to verify the system with the use of real data. During the experiments, the data would be divided into training and test sets (periods of time) to validate the potential abilities of the system to generate profit. As a source of the experimental data, the international currency market (Forex) was chosen.
It was decided to abandon genetic programming, and instead of creating new strategies constructed from primitive functions, we chose to optimize the existing, parameterized strategies. The idea behind this decision was to prevent the creation of absurd decision trees. The genotype in the proposed solution is a vector of the strategy parameter values. The values of parameters determine the behavior of the strategy. The scheme of the strategy itself is not subjected to any changes.
The model utilizing a time window was assumed; it was similar to the one proposed in [
74]. As was said previously, generating short-term strategies gives generally better results. The time window serves as a mechanism for optimizing the strategy parameters based on a particular (not very long) period from the nearest past. Each chosen strategy is used for trading within a specified period. Two variants of this approach were implemented:
- (1)
The model with maintaining the old population after the time window is shifted.
- (2)
The model with initialization of a new population when the time window is shifted.
In the first model, the time window was moved accordingly with every quotation, and afterward, the population was evolved by a few generations. Such a solution promised better results, because of the population’s “genetic memory” and the constant development of well-adapted individuals.
In the second model, the evolution was only performed when it was necessary to generate a new strategy. In such a situation, an utterly new population was initialized, trained for the given number of generations (between 30 and 50), and afterward, the best strategy was chosen and used. The process was repeated if there was a need to select a new strategy.
The strategy was used until an event indicating the necessity for generating a new strategy occurred. A few variants of such event indicators were used:
Additionally, for the model that maintained the population after the time window was shifted, the following indicators were used:
removal of an individual representing a particular strategy from the population,
decrease of the lifespan of an individual representing a particular strategy (this meant that its fitness was far from the best one).
3.1. The Forex Market Model
For our investment experiments, we used the international currency market, which was chosen because of the reasons mentioned above. The system was provided with the historical quotations of the EUR/USD pair in the period from 2001 to 2010. The data contained the exchange rates, with hourly frequency, from Monday till Friday, non-stop (24 h per day). The EUR/USD pair was chosen for its popularity, the low spread (provisions from transactions) and the high variability.
For the research results to be realistic, the provisions from transactions, which are present on every market, were taken into account in the model. For the EUR/USD pair, the provisions vary from two to six PIPSpoints (PIPS point is the smallest possible rate change: 0.0001), which for an exchange rate around 0.9 to 1.4 gives the provision on a level equal to about 0.01% to 0.06%. To simplify that, the constant rate, equal to 0.03%, was assumed.
In the created model, investors can register. Each of them is informed about a new quotation. Investors decide on the possible purchases and sales. They also have access to all the quotations from the past. Every investor uses a different strategy, making the decisions based on the provided data: the exchange rate and its history.
3.2. The Optimization of Investment Strategies
The greedy strategy was used in the proposed system as the investment strategy. It was optimized with the use of the evolutionary algorithm. Below, the genotype, the fitness function, the genetic operators and the population initialization strategies are presented.
3.2.1. Genotype
The greedy strategy was parameterized, to enable the best possible adaptation of this strategy to the market conditions. In the beginning, quite a few parameters were distinguished, but with time, it turned out that some of them always have the same optimal value found by the evolutionary algorithm. They were replaced with the constant (optimal) values to reduce the number of dimensions in the solution space. Thanks to that, the size of the population could be reduced, which resulted in the better performance of the algorithm.
The strategy for purchasing at the time of the exchange rate decrease has been described by the following parameters:
greed: the coefficient specifying how much of the given currency should be bought in the case of an exchange rate decrease,
enteringValue: the amount of the given currency purchased on the position opening,
maxLoss: the maximum value of loss, which indicates when the position should be closed in order to avoid bankruptcy,
desiredEarn: the expected amount of profit, which, of course when achieved, also indicates that the position should be closed,
lossTolerancy: the loss threshold (if the loss resulting from the change of the exchange rate is so small that it does not exceed the threshold, then no action is performed); the parameter created to avoid small transactions.
All of the above parameters were used as the elements of the genotype in the evolutionary algorithm.
The pseudocode of the described greedy strategy is presented in Algorithm 2. It is used for each new quotation on the market. If the value of invested financial resources equals zero, then the position is opened. Foreign currency is bought (quoteCurrency) in the amount determined by the amount (enteringValue) of the base currency (baseCurrency). If a position is already opened, then it is checked whether the current exchange rate resulted in a profit or a loss. If a profit is generated, then the condition of closing the position because of the expected profit is checked. If there is a loss and the lossTolerancy threshold is exceeded, then the condition of closing the position because of the maximal loss is checked. If the loss is less than maximal, then the strategy forces the purchase of currency in the amount proportional to the loss and the greed parameter.
| Algorithm 2: The pseudocode of the parameterized greedy strategy. |
![Sustainability 10 01460 i002]() |
The presented set of parameters allows for such a configuration of the strategy that it backs down from the market in periods of time when the investments are unprofitable.
3.2.2. Initialization of the Population
The initialization of the population consists of creating the individuals with initial values of parameters encoded within their genotypes. If we know a problem that is being solved, then we can generate such genotypes that the individuals would have higher fitness just from the beginning of their existence. However, in the case of the investment system, we do not have such knowledge, and thus, we have chosen the initialization with random values generated uniformly within the valid ranges.
3.2.3. The Fitness Function
The fitness function should reflect the usefulness of a strategy, mainly its ability to generate profit. Unfortunately, it can only evaluate the effectiveness of the strategy in the past periods of time, which of course does not give any guarantee that the strategy would perform well in the future time periods. That is why a good fitness function should take into consideration the risk, which results from applying the given strategy, as well as its ability to be applied with success in different market conditions. The following fitness functions were tested:
the absolute profit gained during the training period,
the profit in comparison to the buy-and-hold strategy profit gained during the training period,
the proportion of the number of position closings with profit to the total number of position closings,
the number of position closings with profit multiplied by the absolute profit.
The first and the most straightforward idea was to assume that the value of fitness is equal to the profit gained during the training period. It quickly became apparent that the resulting strategy was over-specialized: it was fitted very well to the particular period that was used during the training, but it did not work well in other periods. This was an effect very similar to the “overtraining” observed in the case of neural networks. In the training period, the profit was very high, but moving the time window even one hour forward reduced it significantly. It turned out that the parameters were chosen in such a way that the purchase action was performed in the most profitable moments of this period, and not in the way that takes into account the current trend of the exchange rate.
Another idea was to compare the profit obtained with the use of the optimized strategy to the profit obtained by the buy-and-hold strategy. In the case of the buy-and-hold strategy, in the beginning, the investments were made at the level of a maximum amount invested by the greedy strategy during the whole period. However, this approach also did not completely eliminate the problem with over-specialization.
The third proposition was supposed to overcome the over-specialization by favoring the position closings with profit in general, independently of the final profit. However, the measure in the form of a percentage of position closings with the profit made the most favorable single position closing with the profit; the maximum possible value 1.0 was reached in such a case. For this reason, the fourth approach was introduced: it was the third approach with the absolute risk factor added.
Finally, after extensive experimental verification, the first approach was chosen because for the short periods of time, the effect of over-specialization was not as strong as expected.
3.2.4. The Mutation
In the proposed algorithm, each of the individuals can be mutated, according to the mutation probability, which is proportional to the mutationFactor parameter reduced by the value of the fitness factor. The aim of lowering the mutation probability is to protect the better-adapted individuals from random mutations, which can worsen the solution represented by a given individual. The loss of the best individuals was observed when the mechanism of reducing the mutation probability was not used.
The mutation operator chooses randomly and modifies one of the genes from the genotype of an individual that is appointed for the mutation. A larger number of genes of a given individual changing simultaneously did not improve the performance of the algorithm, because it introduced chaotic behavior of the population (one of the genes could be improved, while the other could be made worse). The modification of the gene was based on the operation of multiplying its value by a random factor chosen from the uniform distribution within the range
. As was stated in [
23], such a method promotes the more efficient searching of the solution space than the generation of entirely new values.
The mutation operator can produce genotypes that do not belong to the feasible region. The technique of repairing genes by transforming a “damaged” gene to the closest valid one was used. No other, more sophisticated mechanisms were needed because the feasible region was connected and convex.
3.2.5. The Recombination
The individuals that would become parents are chosen using the tournament selection. The parents’ genotypes are used during the recombination operation in order to obtain the children’s genotypes. The amount of individuals selected for the recombination is proportional to the crossbreedFactor parameter. If the value of this parameter is equal to 0.2, then it means that after every recombination operation, the population grows by 20% (such a number of children is produced). This parameter also influences the size of the tournament. In the proposed algorithm, the uniform crossover was used as a recombination operator [
31]. The value of each gene of the newly-created genotype comes from one of the randomly-selected parents.
It was sometimes observed that during the recombination, individuals with the same genotype were created. The scenario of such a situation was presented in
Figure 3. This phenomenon had a very negative impact on the search performance. Thus, the mechanism of duplicates’ removal was used.
3.2.6. The Operation of Choosing Individuals for the Next Generation Population
The reproduction and crossover operations increase the size of the population exponentially. It was necessary to develop a mechanism for keeping the number of individuals within the desired range. The first solution to this problem was to use a simple removal of such a number of the worst individuals (individuals with the lowest fitness value) that was needed to keep the population size within desired boundaries.
Next, a counter of the lifespan for each individual was introduced. The value of this parameter was reduced for individuals that belonged to the group of the worst individuals. The size of this group was modified according to the needs: it was significantly increased when the population became too large and decreased otherwise.
Moreover, the duplicates of a given individual (the individuals with the same genotype) were removed from the population to maintain the population diversity, particularly within the group of the best individuals. It also helped to reduce the excessive usage of the computational resources.
4. The Results of Experiments
All the experiments were conducted with the use of a PC equipped with the 64-bit dual-core processor Intel Core 2 Duo T8100 clocked at 2.10 GHz and 4 GB of RAM, with Linux OS. The system and the algorithms were written in Java SE 6.
The experiments were carried out to investigate the two following issues:
the performance of the proposed evolutionary algorithm itself,
the efficiency of the proposed system for evolutionary optimization of Forex investment strategies during different periods and the comparison of the obtained results with the results of the buy-and-hold strategy.
4.1. The Performance of the Evolutionary Algorithm
4.1.1. The Parameters
In the beginning, the capability of the system to optimize the parameters of the greedy strategy and the potential of the strategy to generate profits were tested. The evolutionary optimization of the strategy parameters using data from different time periods was performed, and the results of the trade decisions were compared to those of the buy-and-hold strategy.
Generally, the results were very promising. In
Figure 4,
Figure 5 and
Figure 6, the performance of the optimized greedy strategy (blue line) compared with the performance of the buy-and-hold strategy (green line) during three exemplary periods is presented. The buy-and-hold strategy was buying currencies up to the maximum amount invested by the greedy strategy on the analyzed period. For example, if the greedy strategy purchased 1000 EUR during the whole trade period, the same amount of money would be used by the buy-and-hold strategy. The scale on the left refers to the exchange rate, while the scale on the right refers to the profit (loss) in comparison to the initial funds of each strategy.
In each of the three
Figure 4,
Figure 5 and
Figure 6, the greedy strategy has achieved higher profit than the buy-and-hold strategy. The best results are obtained during the loss and rebound periods. This is particularly visible in
Figure 6—the greedy strategy increases the profits during each rebound of the exchange rates.
The presented results were achieved with the desired number of individuals in the population equal to 1000 (the algorithm used variable population sizes), the mutation factor equal to 0.8, the crossbreed factor equal to 0.4, 100 iterations of the algorithm and 2 iterations as the maximum lifespan of the individual (see
Table 1). The above parameter values were determined during a series of preliminary experiments (aimed at the calibration of the algorithm), the results of which have not been included in this paper. The ranges of the parameter values tested during preliminary experiments are presented in
Table 1.
It was observed that increasing the desired population size did not lead to better results of the optimization; it only extended the time needed for the computations. With 500 individuals in the population, the obtained results were almost as good as in the case of a larger population.
Similarly, in the case of the number of iterations of the algorithm, the algorithm approached the optimal solution after just 30 steps. Using another 20 iterations of the algorithm sometimes caused a slight improvement in the quality of the solution. Using more iterations was unproductive in most cases. In
Figure 7, the best fitness value (red line), the average fitness value (blue line) and the standard deviation during subsequent iterations of the algorithm are presented.
A better insight into changes that take place in the population during the run of the algorithm is presented in
Figure 8,
Figure 9,
Figure 10,
Figure 11,
Figure 12,
Figure 13,
Figure 14 and
Figure 15. The figures show the fitness distribution bar charts (the upper parts of the figures) and the location of the individuals within the solution space (the lower parts of the figures) for the iterations of 0, 10, 20, 30, 40, 50, 70 and 90, during the selected run of the algorithm.
The points on the lower charts represent the individuals, and the colors correspond to their fitness values. The coordinates of a given point are the value of the desiredEarn parameter of the strategy and the value of the enteringValue parameter. In the iteration of 0, we can see that the values of parameters are equally distributed within their feasible ranges. The points that stand out are the products of mutation.
In the subsequent iterations, the feasible solution space is explored; it can be seen that the “cloud” of individuals is moving within the solution space. The process of gathering the individuals in the neighborhood of the local maximum starts just after the 30th iteration, and it is continued till the 50th iteration when the individuals are focused around the local maximum. The consecutive iterations paradoxically lead to the dispersion of the population. This can result from the fact that the algorithm does not find any better solutions; the application of the crossover operator does not lead to improvement of the solutions; and the mutation operator still introduces some random changes to the genotypes, which causes the population to spread.
4.1.2. The Influence of Crossover and Mutation Operators
During the reproduction process, a single descendant is created from the two selected parents. Because the minimal size of the tournament is two (the boundary case), the conclusion arises that in a single tournament selection process, only 50% of the individuals can be chosen at most. Therefore, the number of selected parents is always limited to half of the population. Such a condition also restricts the number of descendants (crossbreedFactor) to 0.25 of the population size. Such a value was too small when compared to the chosen mutationFactor. It resulted in a slow convergence: the search process was somewhat random, instead of heading the population towards the better solutions. For this reason, it was decided to increase the number of descendants to two for every pair of parents. This improved the performance of the evolutionary algorithm significantly.
The crossover parameter (crossbreedFactor) was still restricted to 0.5. Such a value also restricted the tournament selection to the boundary case, where the size of the tournament was equal to two. The small tournament size led to the crossing-over of a large number of individuals with low fitness, which complicated the process of searching for the better solutions. At the same time, the small number of individuals subjected to crossover was slowing down the convergence speed. The range from 0.3–0.4 proved to be the optimal value for the crossover parameter.
In the case of mutation, the most critical issue was the reduction of the mutation probability for the well-adapted individuals. Without this element, the loss of a very good individual was often observed because it was subjected to mutation. After securing the best individuals, the optimal value of the mutationFactor was within the range
. In reality, about 1/3–1/4 of the individuals from the population were subjected to mutation as a result of applying the mechanism of reducing the mutation probability for the well-adapted individuals.
Figure 16 presents the mechanism of mutation probability reduction applied in the algorithm.
The function reducing the mutation probability was constructed in such a way that it affected mostly the best individuals from the population.
4.1.3. The Size of the Population
During the development of the evolutionary algorithm, two mechanisms of removing individuals from the population were compared: immediate removing and using a maximum lifetime for the individuals. It turned out that the immediate removal of individuals from the population was flawed because it limited the ability of individuals representing good solutions to transfer their genes to offspring.
Therefore, the lifetime counter was introduced, which significantly increased the solution space search performance; unfortunately, it was necessary to solve the issue of controlling the population size. The first idea was to reduce the counter for the individuals with fitness below the population average, but such an approach did not guarantee full control over the population size.
Figure 17 presents a typical fitness value distribution in the population. On the horizontal axis, the fitness value is presented, and on the vertical axis, the fraction of the population with the given fitness value is presented. It can be deduced that there exists a small group of individuals with a very low fitness values (the barely visible bars within the 0–0.25 range). Such a phenomenon results in lowering the average fitness of the population. As a consequence, the larger part of the population (individuals with the fitness value from 0.25 to 0.35) has the fitness above the average. There are not many individuals with the fitness below the average, which would eventually be removed using the above-mentioned method of reducing the lifespan. That is why the mechanism of lifespan reduction was rather inefficient and led to the uncontrolled growth of the population.
It seems that this problem could be solved with the use of the median value instead of the average. Unfortunately, it turned out that if the median was used, the effect still existed, although it was significantly weaker.
In the end, the solution inspired by the harmonic motion in physics was chosen. “Reducing force”, which influences the population, is proportional to the deviation from the equilibrium position. The equilibrium position is the desirable size of the population (populationSize), and the reducing force reduces the individuals’ lifespan. The number of individuals, whose lifespan is reduced, is proportional to the deviation from the desired population size. It turned out that this solution worked perfectly.
A different issue, mentioned while describing the crossover operator, was the generation of genotypes’ duplicates. It was necessary to implement a mechanism for getting rid of the individuals with the same genotypes from the population. The operation of finding the N worst individuals in the population, which was needed for the reduction of the lifespan, required sorting the individuals according to their fitness value in ascending order. The collection of individuals remained sorted, and this fact could be used to efficiently find the duplicates within the population by merely comparing neighboring individuals (the operation with linear complexity). Removing of the duplicates resulted in a larger diversity among the best individuals, and the gene pool of the population was more diverse. When the duplicates were not removed, it was observed that very often, most of the best individuals were duplicates of the same genotype. This caused the wasting of computational resources, and the ability of the evolutionary algorithm to search for better solutions and to avoid local optima was limited.
After introducing the above-mentioned improvements, an interesting effect was observed concerning the population size. During the initial iterations, the size of the population grew significantly above the desired level. This was caused by the fact that no individual had died yet. The large size of the population helped with enlarging the area of the solution space that could be searched in the initial phase when the population was scattered across the entire solution space. In the end, the population size stabilized at a level that was slightly higher than the desired populationSize parameter (see
Figure 18).
4.2. Profit Generation on the Forex Market
After adjusting the parameters of the evolutionary algorithm and verifying the performance of the greedy strategy optimization, the system with a moving time window was implemented to check the ability to generate a profit in realistic conditions.
4.2.1. Using the Time Window with the Mechanism of Maintaining the Population
Firstly, the variant with maintaining the population was applied. The population consisted of 500 individuals, and it was trained for 30 iterations in the initial time window. Next, the training period was ended, and quotations were started. The best strategy from the population was chosen and used during the trade. With each subsequent quotation, the population was evolved for ten iterations in the updated time window in order to take into account the latest exchange rates.
The moving time window influenced the fitness function; the shape of the function and locations of its optima were changed. Thus, the reevaluation of the fitness of each individual in the population was needed. Without this step, the population would not evolve towards the optimal solutions.
The chosen strategy was used until one of the following conditions was met:
the individual representing the strategy was removed from the population,
the lifespan of the individual, which represented the strategy, was shortened; this indicated that the individual no longer belonged to the best-fitted individuals,
the strategy generated a loss greater than the maxLoss parameter.
Each of these conditions was a sign that the strategy used is not well adapted to the current conditions.
Figure 19,
Figure 20,
Figure 21 and
Figure 22 present the trade performed by a few example strategies generated by the system. The period of their usage varied from one day (
Figure 19) to one week (
Figure 22). The blue line represents the gain or loss resulting from using the optimized greedy strategy, and the green line represents the results of the buy-and-hold strategy (it is overlapped by the red line representing the exchange rates).
In
Figure 19, a one-day trade period can be observed. As can be seen, the optimized greedy strategy generated by the proposed evolutionary algorithm brings profits during the period when the EUR/USD exchange rate goes up. Profit generation is caused by the fact that this strategy invested in EUR when it was less expensive, and during a boom, profits are generated. The buy-and-hold strategy also brings profits, but they are generally below the level of the profits generated by the optimized greedy strategy. There is a point at which the profits of both strategies are equal; this is the moment from which the decline of the exchange rate starts. However, even after that, the optimized greedy strategy could generate larger profits for some time. Only at the very end of the trading period, it generated larger losses than the buy-and-hold because it invested in EUR, which was less expensive due to the falling exchange rate. If there were another change in the exchange rate trend at the end of the trading period, we probably could see that the optimized greedy strategy would bring even larger profits because it invested in EUR when it was inexpensive.
In
Figure 20, we can see the results of a two-day period trade. In the beginning, the generated greedy strategy is investing in EUR because of the favorable exchange rate. Positive results of such behavior can be observed after a while. When the exchange rate significantly and rapidly declines, the previous investments are paying off. After several fluctuations caused by small increases and decreases in the exchange rate, the profits substantially increase, and in this case, the generated greedy strategy beats the buy-and-hold strategy.
In
Figure 21, the results of a three-day trade period can be observed. The generated greedy strategy invested in EUR at the very beginning of this trade period because of a favorable exchange rate. As can be seen, the investment made is paying off, and the strategy generates profit at a steady level during two-thirds of the period. When the profit generated by the buy-and-hold strategy almost equates the profit made by the optimized greedy strategy, the exchange rate starts to fall, and despite small fluctuations, it never recovers till the end of this period. Such circumstances cause also the profit generated by both investment strategies to decrease almost steadily (with negligible fluctuations) till the end of the period. The profit made by the optimized greedy strategy is lower at the end because this strategy, as always, invests in the period of falling currency exchange rates hoping for the recovery and higher profits in the future.
In
Figure 22, a one-week trade period can be observed. At the beginning of this period, the generated greedy strategy invested heavily in EUR because of the favorable exchange rate. The generated profit was quite large during almost the whole investment period. At the moment in which the buy-and-hold strategy obtained the same profit, the exchange rate started to decrease. This resulted in a decreased amount of profit in the case of both strategies. However, the generated greedy strategy started additional investment in EUR because of the favorable exchange rate. Because the exchange rate started to fluctuate at this point, the generated greedy strategy could not fully recover from a loss, despite the temporary increases of the generated profit. The fact that there was no recovery of the exchange rate till the end of the period caused, in the end, the generated greedy strategy to be unable to undo the losses.
In some cases, the optimized greedy strategy generated loss at the end of investment periods. However, it is worth noting that usually, the optimized greedy strategy was bringing profit for some time; in such a case, the position should be closed. In some cases, it was generating profits till the end, and it won with the buy-and-hold strategy at the end. In some cases, the final loss was caused by the specificity of the greedy strategy and the mechanism of exchanging the strategy. The greedy strategy must first run into debt to generate the profit, and exchanging the strategy took place when the loss exceeded the maxLoss. If the value of the maxLoss parameter was too small, then the strategy was changed without any chance to undo the loss by selling a currency that it invested in during a favorable exchange rate period.
When moving the time window and continuing the evolution process, the issue of overtraining of the population appeared. After a long trade, the number of generations used in the evolutionary algorithm was quite high. Such a large number of generations caused the population to be concentrated in the neighborhood of one of the optima. The population diversity vanished, and the generated strategies were no longer rational.
For that reason, a new variant of the mechanism with training an utterly new population (resetting the population) after moving the time window was proposed and tested, and the results are presented in the following section.
4.2.2. Using the Time Window with the Mechanism of Resetting the Population
In the model with resetting the population, the population and the evolution process was reinitialized in situations in which the change of the strategy was necessary. The evolutionary algorithm was run for up to 30 iterations, with the population of 500 individuals. The time window with a size of 24 and 48 quotations was tested. There was no difference between the results obtained with the use of different time windows.
From the obtained results, it was decided to change the approach to exchanging the strategies. The results showed that some of the generated strategies did not bring satisfying profits (losses) for an extended period. Therefore it was decided that an additional factor should be taken into account when exchanging a strategy. This other factor was the too long lifespan of an individual representing the strategy that did not generate the profit.
A few experiments were done with the use of different historical exchange rates of the EUR/USD pair. In
Figure 23, an exemplary trade period (from February 2009–March 2009) was shown. It presents the general tendencies also observed during the other trade periods.
The horizontal axis presents subsequent Forex market sessions. The axis on the left applies to the red and green lines, which show the profits obtained by the optimized greedy strategy and the buy-and-hold strategy, respectively. The axis on the right applies to the blue line, which presents the level of investment of the greedy strategy during the trade.
During the experiment, the trade investor model with a 10,000 USD starting fund was created. The investor utilized the optimized greedy strategy for making the decisions of purchasing and selling. The level of investment in a given moment indicates how many USD are currently exchanged for EUR. The greedy strategy buys additional units of EUR currency when it considers them to be inexpensive (these are the moments when the blue line goes up). After some time, the position is closed, which means selling off the entire EUR currency that has been bought and exchanging it for USD. This moment is visible in the
Figure 23, when the blue line goes down to zero.
The level of the investor’s profit (the red line) is defined as the difference between the amount of USD possessed in the moment of exchanging the strategy and the starting amount of USD (10,000). Therefore, the red line presents the total amount of USD after exchanging the strategy, reduced by the starting amount of 10,000 USD. Whenever the red line approaches a positive value, it means that the strategy used generated profit. The strategy was exchanged to a new one after the first negative closure. The new strategy was trained on data from the last 24-hour trading period. The exchange strategy was also carried out when the strategy was used for more than 24 h.
The course of EUR investments and generated profits shown in
Figure 23 confirms the general trends discussed in
Section 4.2.1. The generated greedy strategy always tries to buy EUR currency when the exchange rate of the EUR/USD pair is decreased. The results of such behavior can be two-fold. If the exchange rate quickly recovers, then the optimized greedy strategy immediately generates profits, and its profitability is usually at a higher level than the profitability of the buy-and-hold strategy (
Figure 23, periods of Quotations 19–154 and 235–262). However, if the exchange rate does not recover or recovery is slow, the optimized greedy strategy generates loses. Such a case is spectacularly visible in
Figure 23 during the period of Quotations 154–235. During such market conditions, the buy-and-hold strategy would usually have the advantage over the optimized greedy strategy.
The comparison with the buy-and-hold strategy is somewhat problematic because it is hard to decide what amount of money it should invest at the beginning. The average level of investment of the greedy strategy during its usage was used. The green line presents the profit (or loss), which would be achieved by the investor if the position were closed at the given moment of time. Because of the problems with the comparison of the greedy strategy with the buy-and-hold strategy, it is hard to draw any conclusions when it comes to the market efficiency. The optimized greedy strategy undoubtedly has the potential, because the periods in which it generated profits are visible, and the profits are even higher than the averaged profits of the buy-and-hold strategy. It is also worth noting that the presented results of both strategies take into account the provisions from transactions.
For the more extended trade periods, the proposed system, sooner or later, generated greater losses when compared to the buy-and-hold; however, it was impossible to avoid such behavior. This resulted from the fact that when the evolutionary algorithm generated some unreasonable strategies, they were tested only during the training period. Such a strategy usually generated losses during the real trade.
5. Summary and Conclusions
The research presented in this paper aimed to propose, realize and test the system for generating Forex investment strategies using evolutionary algorithms. A generic evolutionary algorithm was created, and then, it was adapted for the greedy strategy optimization. The customization included all the mechanisms that were necessary for the algorithm to work correctly with the greedy strategy and to optimize it.
These mechanisms included the genotype representation of the greedy strategy parameters, four versions of the fitness functions, the mechanism for reducing the mutation probability for better fitted individuals, the mechanisms preventing the excessive growth of the population, the mechanisms for maintaining the population diversity, the mechanisms for population initialization after moving the time window and the mechanisms for the exchange strategy used for trading.
The proposed evolutionary algorithm showed very high effectiveness in optimizing the strategies. During experiments with the proposed algorithm, a few improvements were introduced. These improvements had a positive effect on the performance of the algorithm and the exploration of the solution space. Noteworthy are such modifications as controlling the population size by shortening the lifespan of individuals belonging to a group of the worst individuals (the size of this group is dynamically increased when the population is too large) and reducing the mutation frequency in accordance with individuals’ fitness values.
Two types of approaches to continuing the process of evolution after moving the time window were compared during the experiments. In the first approach, the individuals were preserved, and in the second one, the population was reinitialized. It was observed that the mechanism of maintaining the population caused the population diversity to lower, and as a result, the population was not tracking the optima of the fitness function. Much better results were obtained when the newly initialized individuals were used after every shift of the time window.
The optimized greedy strategies revealed their potential in generating profit during the trade. Creating a complete investment system that would potentially generate profit with the use of such strategies undoubtedly requires further research. The proposed system was not able to overcome the buy-and-hold strategy during all the trading periods in which the experiments were carried out, but it was able to generate larger profit during quite long periods of time.
The experiments showed that for any given trading period, the optimized greedy strategy could be found with the use of the evolutionary algorithm. Such an optimized greedy strategy can generate more substantial profit than the buy-and-hold strategy. A very interesting direction of future research would be creating a system that would automatically detect the similarity of the current trend to that used during strategy training.
The question concerning the “two-sided” nature of the currency market (If a given strategy generated the profit for the EUR/USD pair, would it also generate the profit for the USD/EUR pair during the same trading period?) remains open.
Unfortunately, the obtained results do not provide any new evidence of the falseness of the efficient market hypothesis. However, as we said before, in the opinion of many economists, the hypothesis has been severely discredited due to the recent events like speculative bubbles, crashes and the 2008 financial crisis. Alternative, more realistic theories and models of finance are proposed by some of the economists that are disillusioned by the mainstream theory of finance. Such turbulent times will probably also result in reformulation of concepts, models and policies in other areas of science, which are strongly influenced by the efficient market hypothesis, for example, in the concept of sustainable development mentioned earlier in this paper.
Some of the researchers rightly point out that the general goals of the financial institutions are contradictory to those of sustainable development [
5,
8,
9]. Such a phenomenon is caused by the fact that the financial system is oriented towards fast and massive profits, and sustainable development requires long-term policies. Some authors [
6] argued that this contradiction can be removed, or at least mitigated, by the reorientation of the financial institutions’ investment decisions towards long-term goals. However, it seems to be an almost impossible task taking into account the intrinsic nature of the financial markets and institutions. There is, however, one thing that is particularly interesting from the point of view of research on automatic and intelligent investment algorithms. It is the lower efficiency of the socially-responsible stock market indices when compared to traditional stock market indices [
7]. The lowered efficiency of these indices means that the asset prices of companies that take into account the objectives of sustainable development to a greater extent are more predictable and less susceptible to chaotic changes. Thus, the use of artificial intelligence techniques to predict the asset prices of such companies is possible and desirable.
The weakened credibility of the efficient market hypothesis also encourages further research on the automatic generation of investment strategies and the use of bio-inspired artificial intelligence techniques for such tasks. If the hypothesis is false, then the financial market is not efficient and unpredictable, and the asset prices can be predicted; only the imperfections and limitations of our models prevent us from doing so [
11].


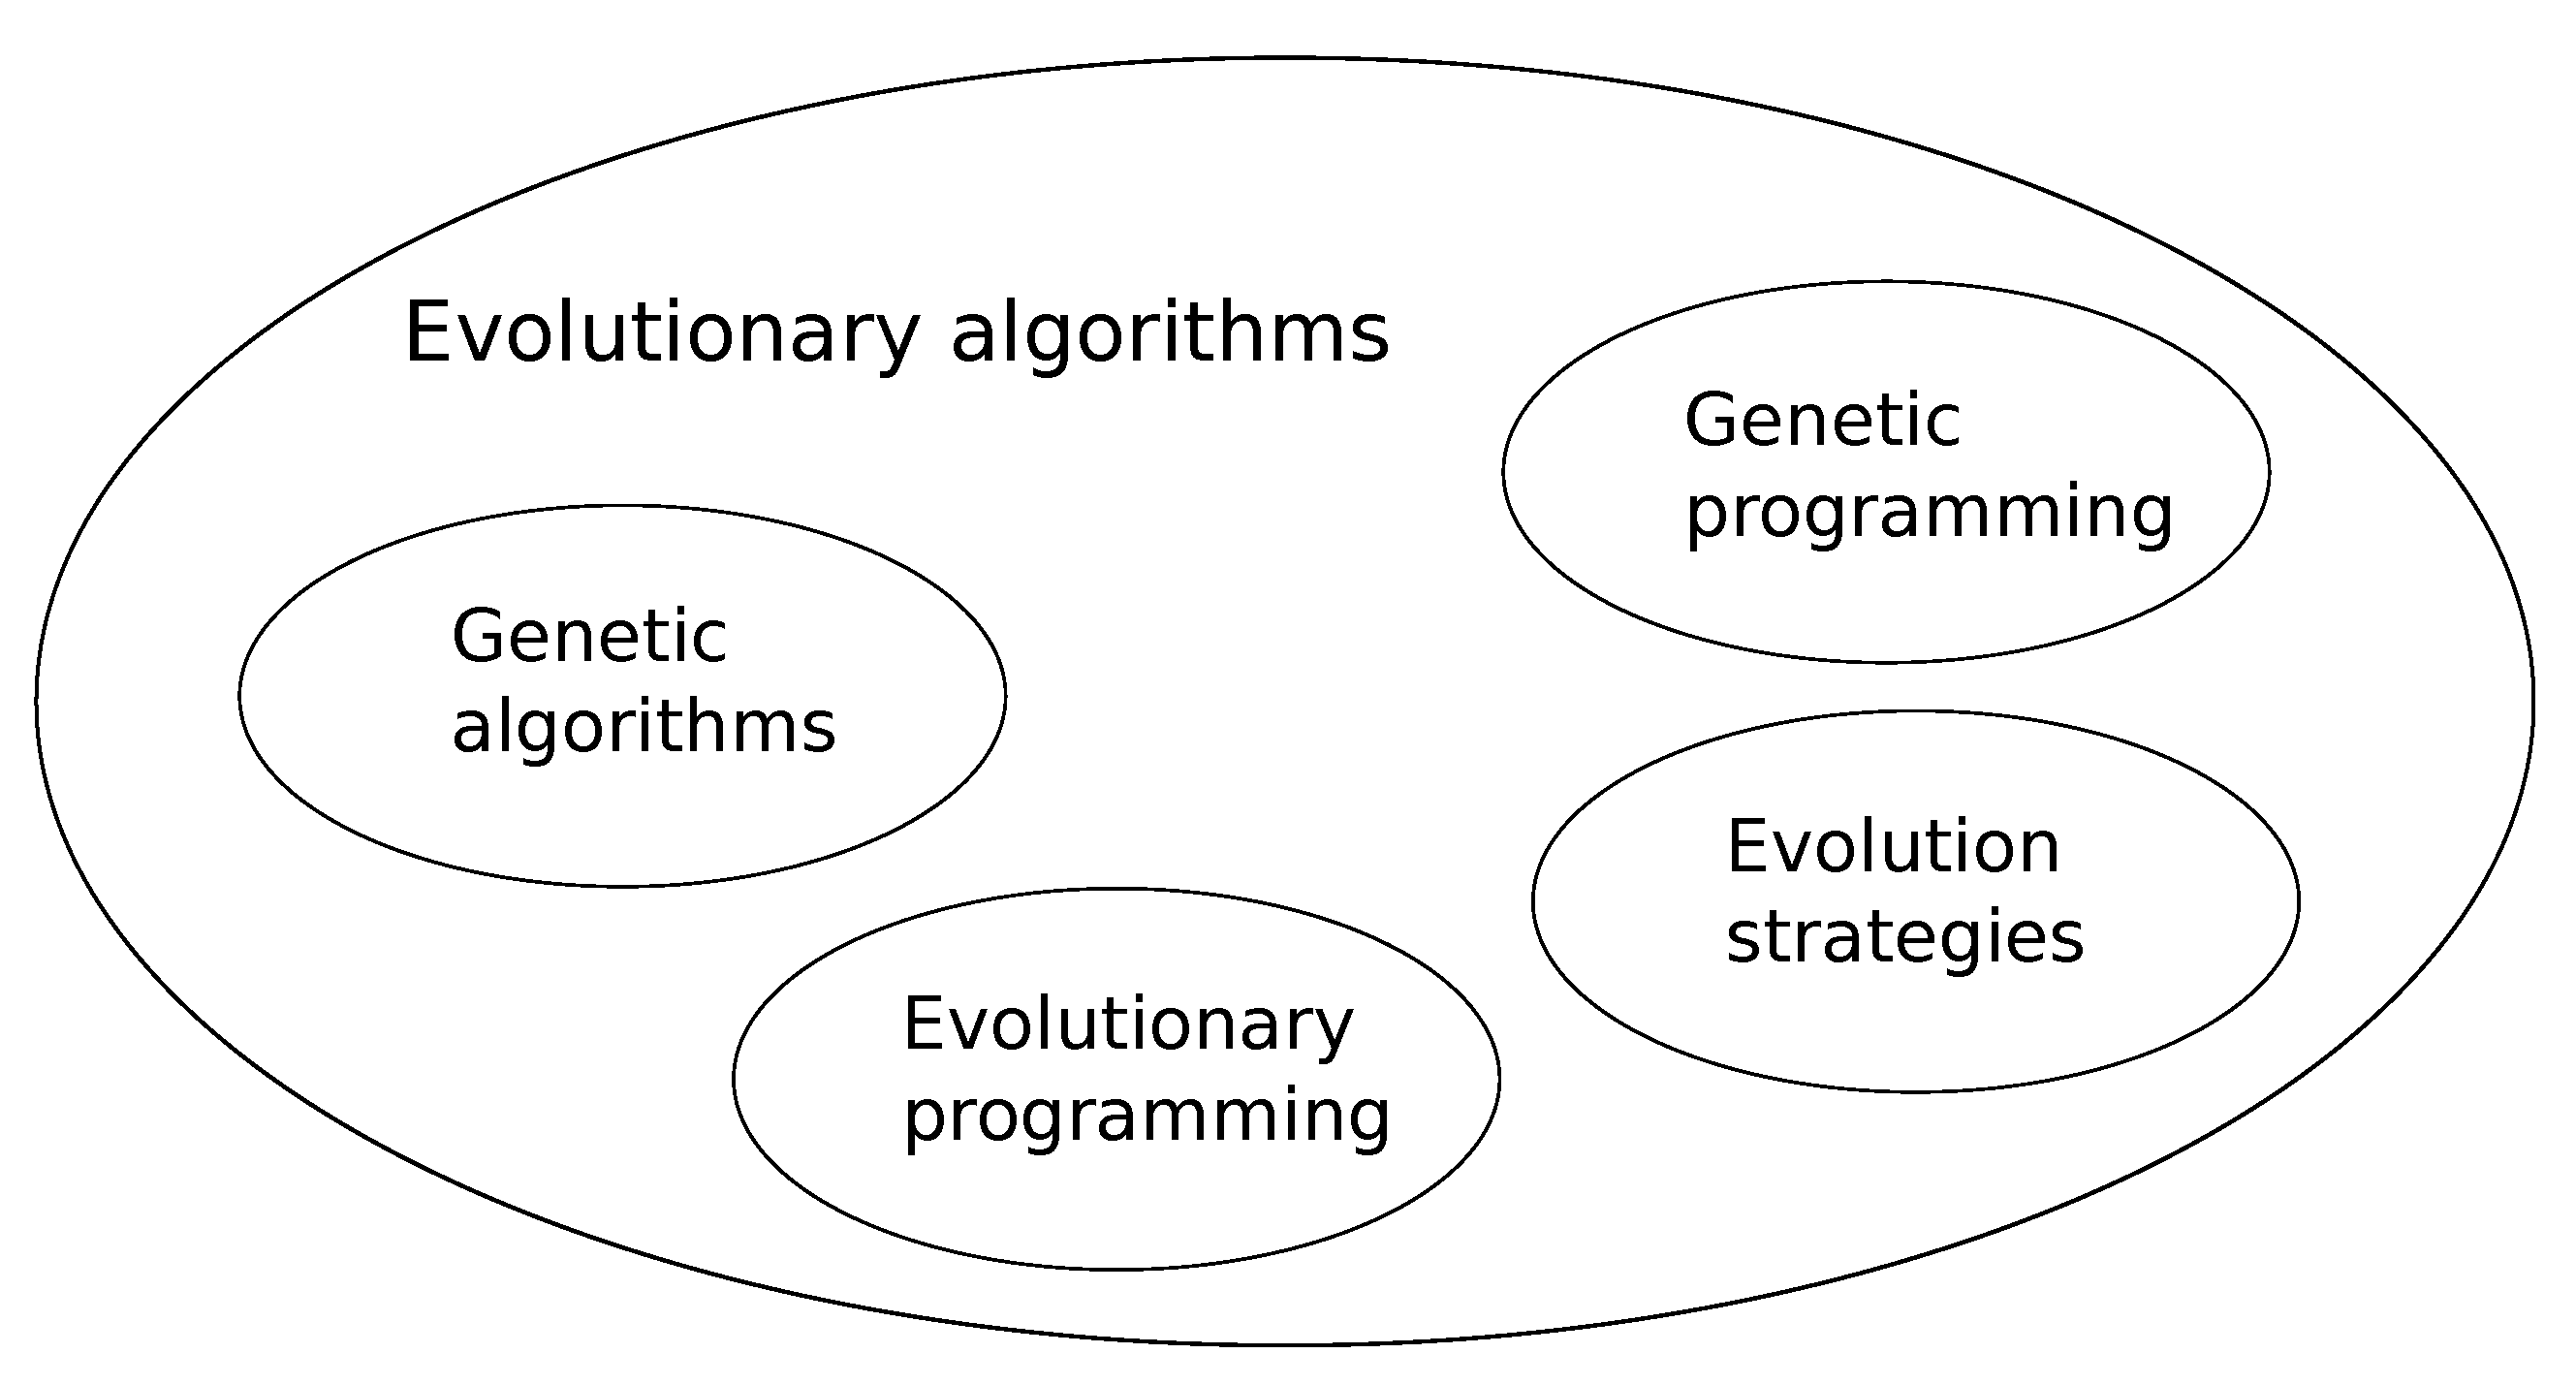
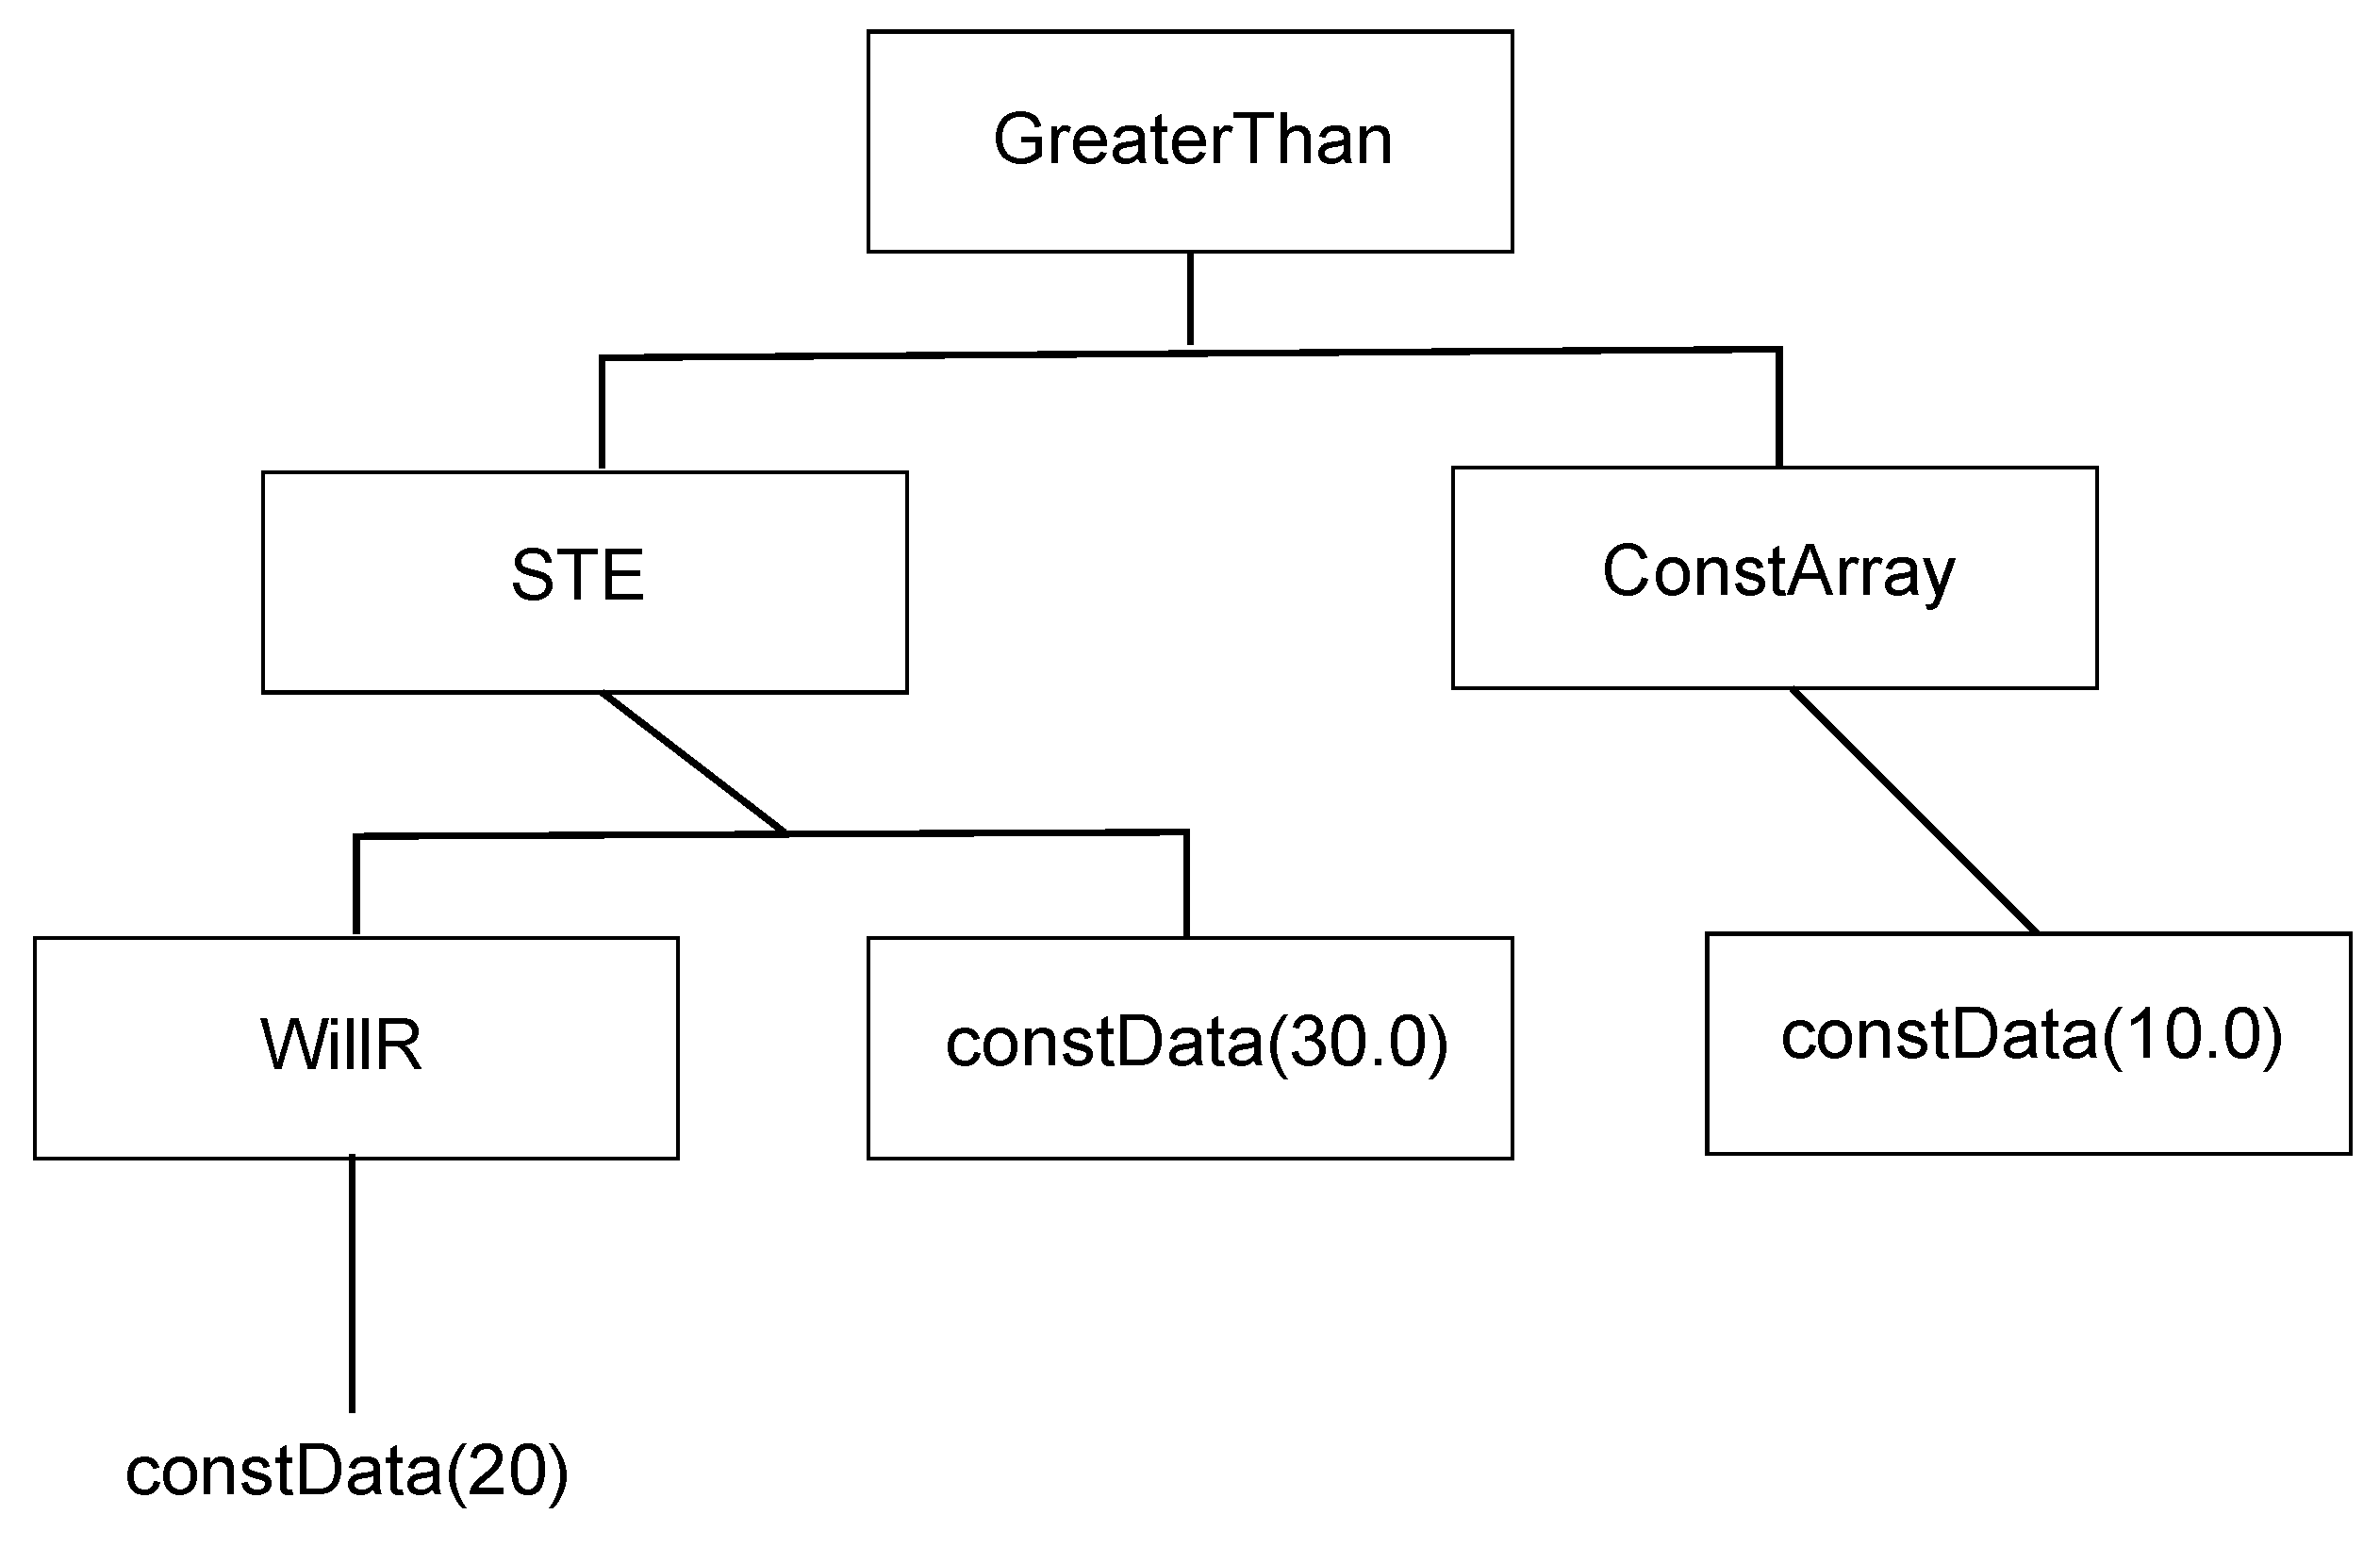
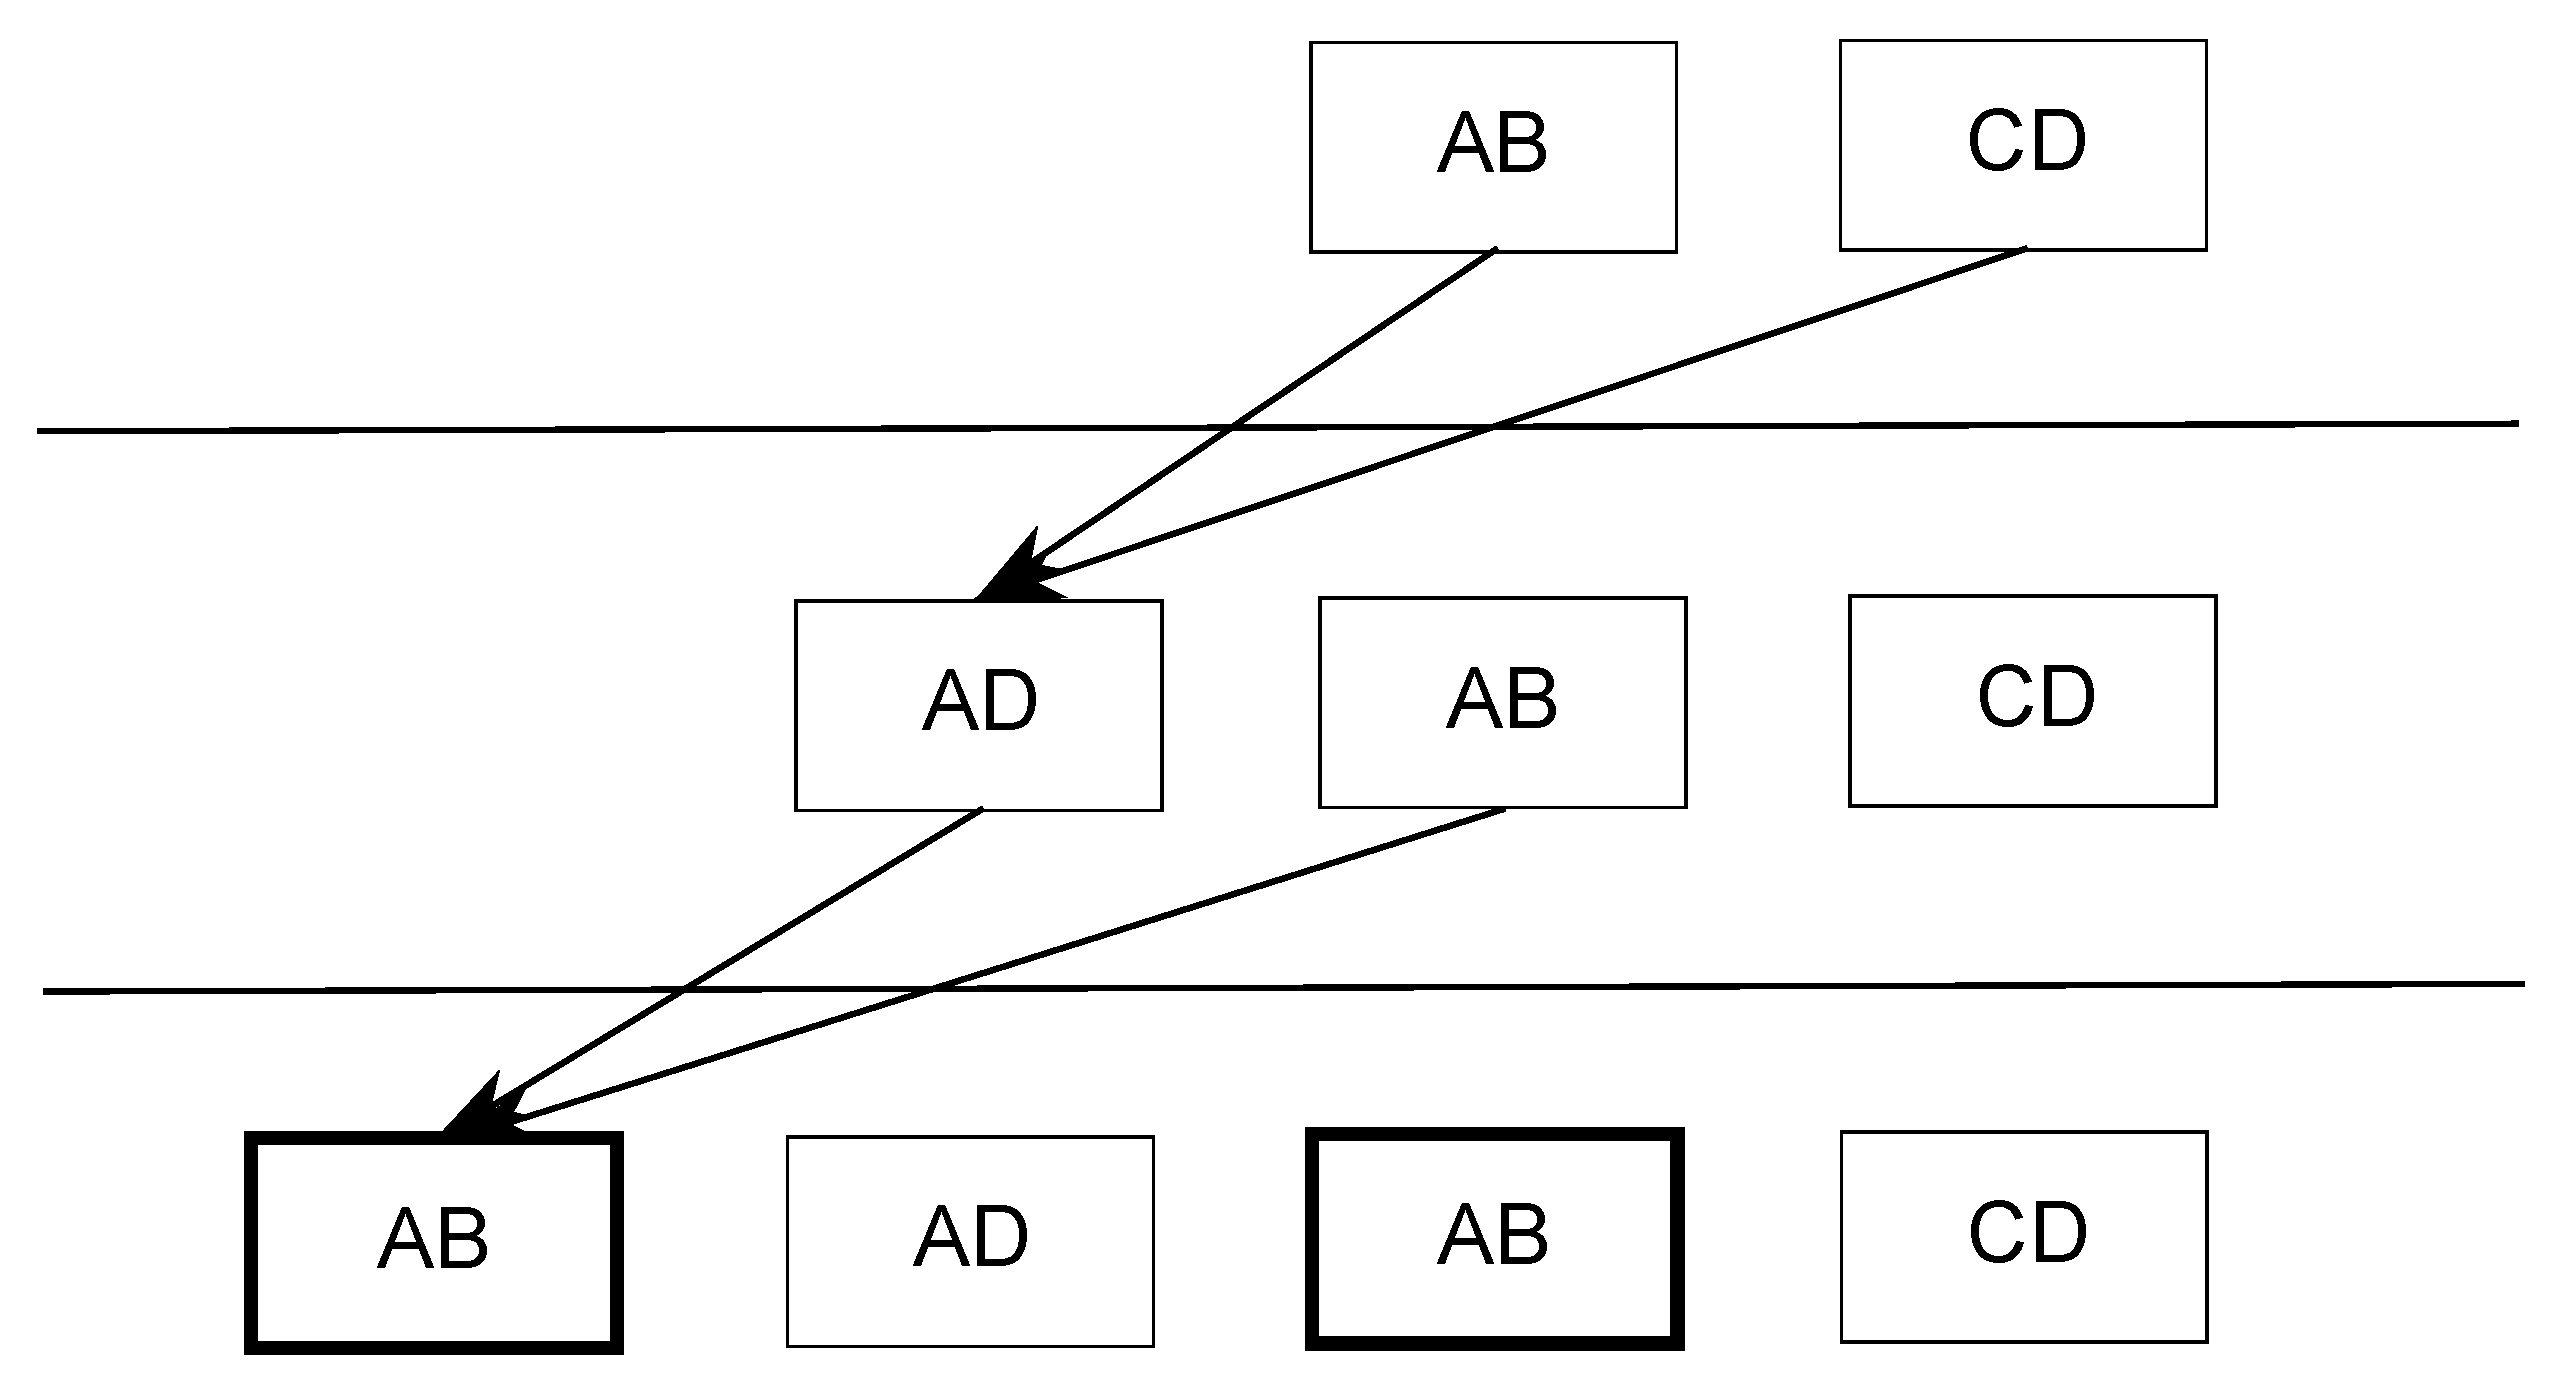
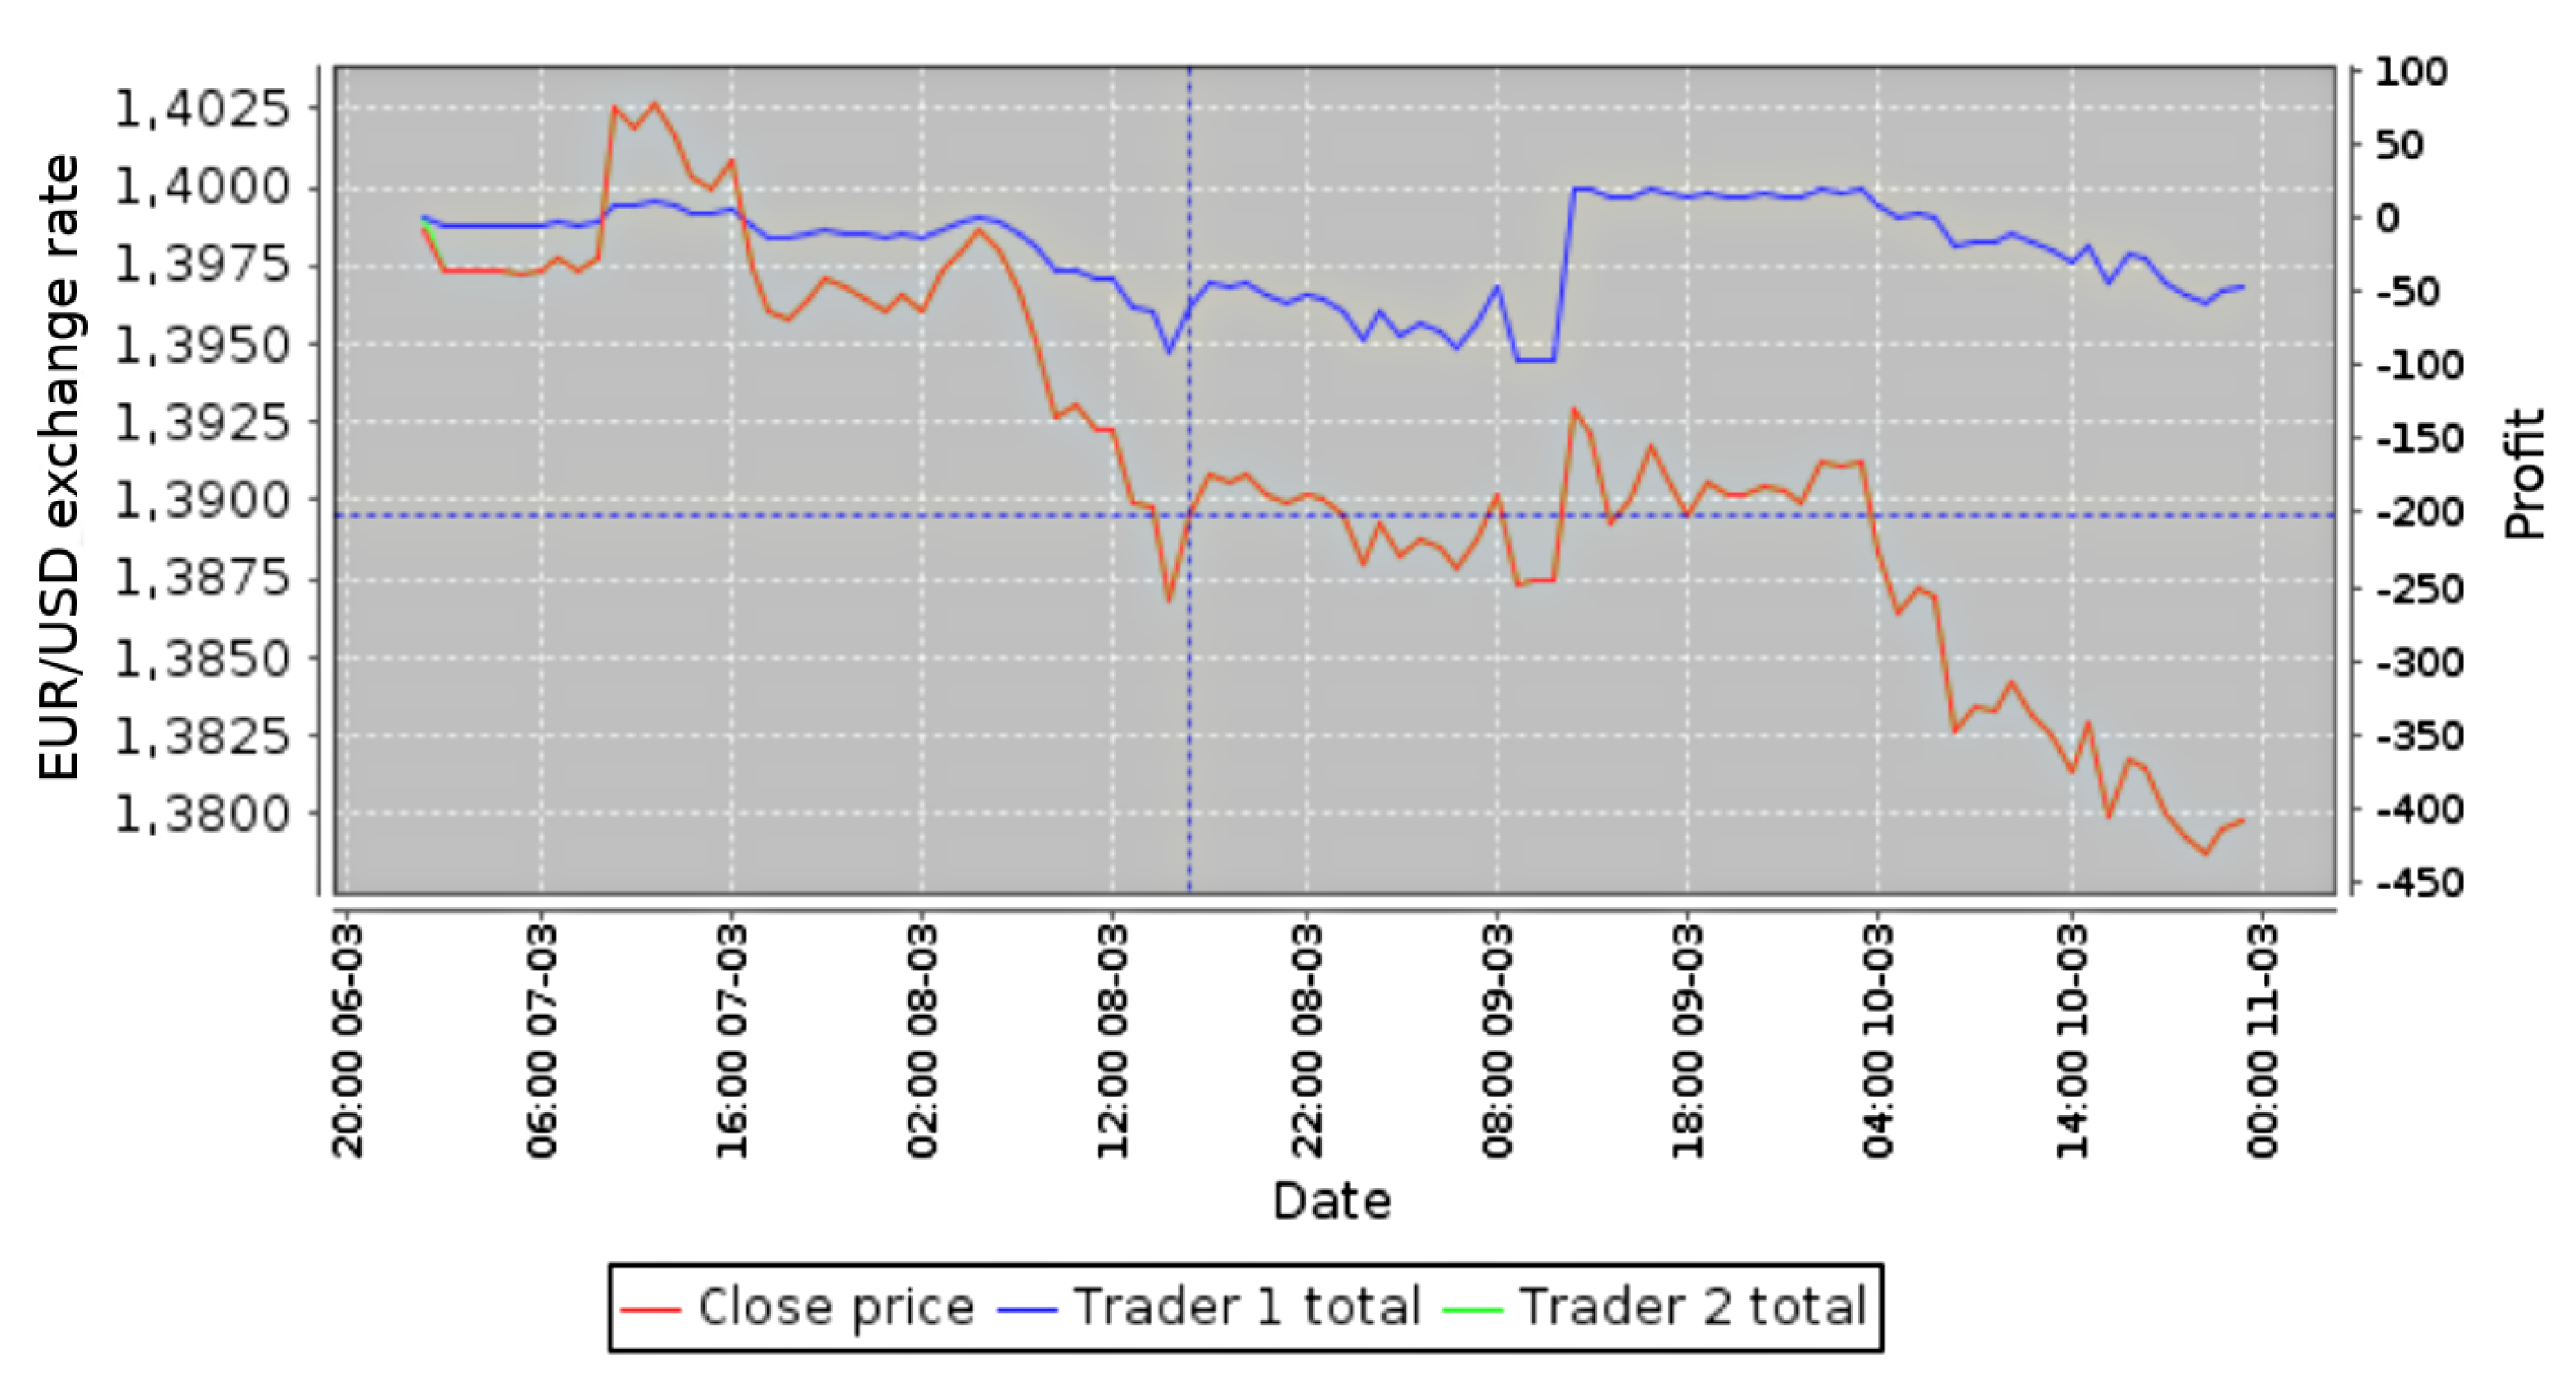
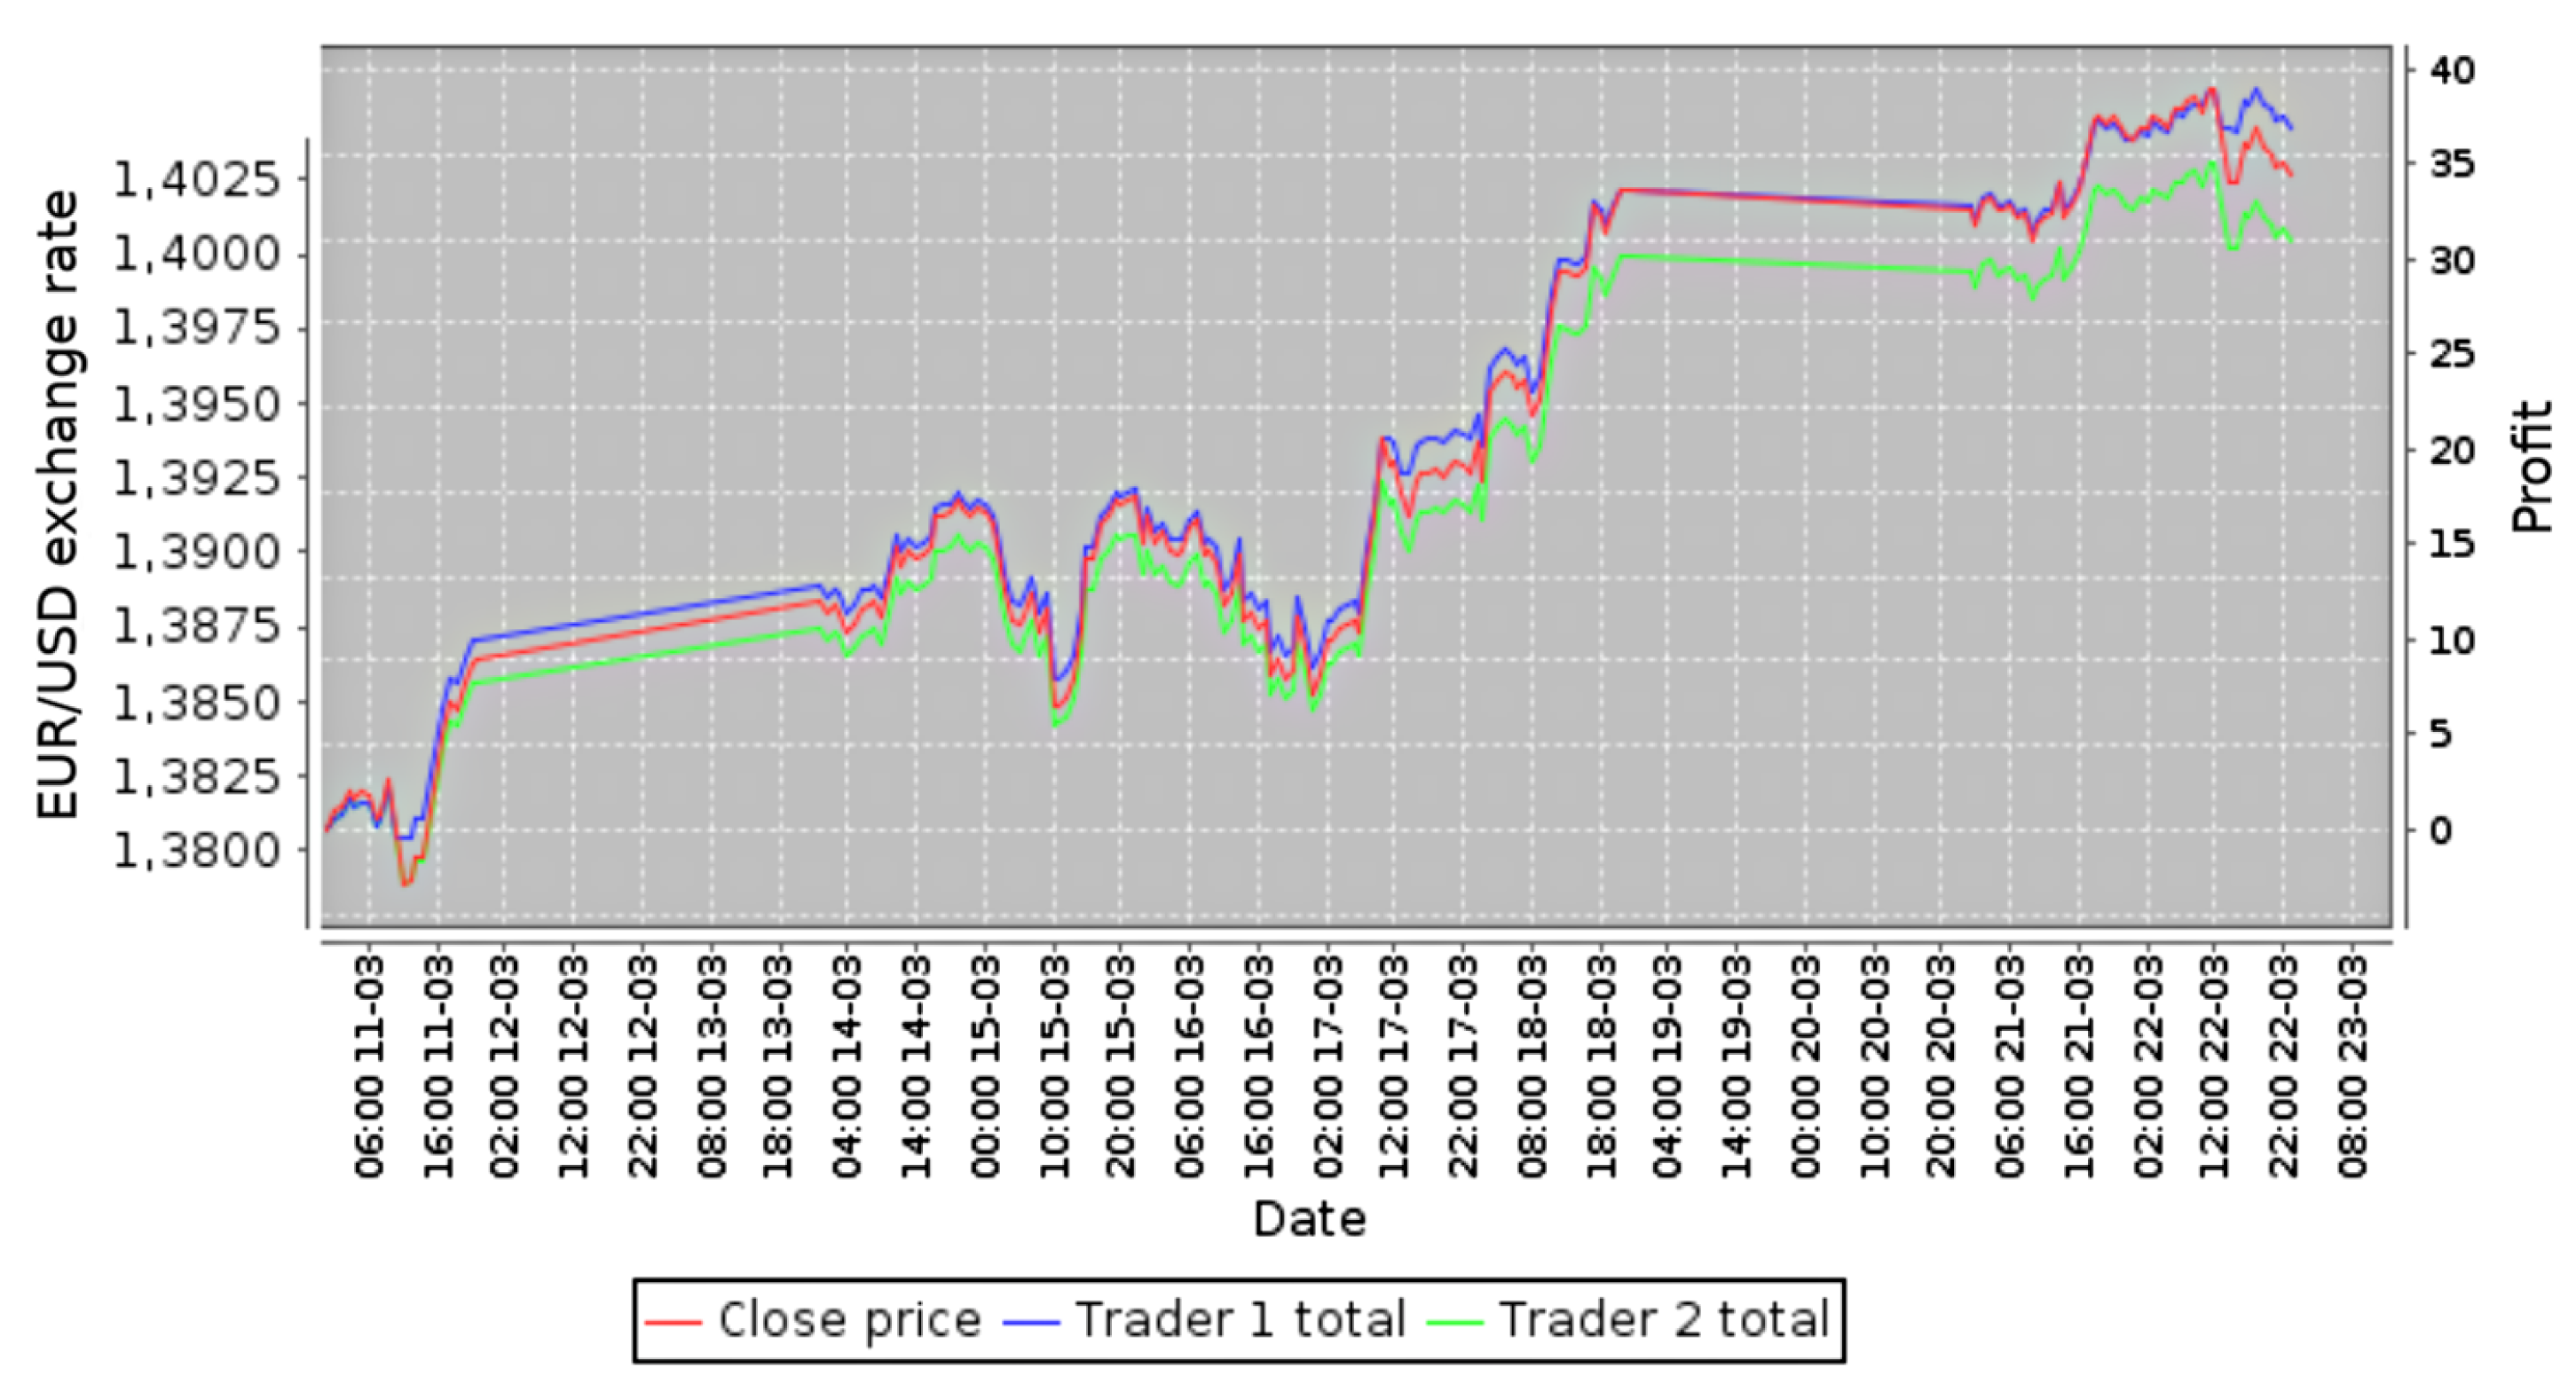
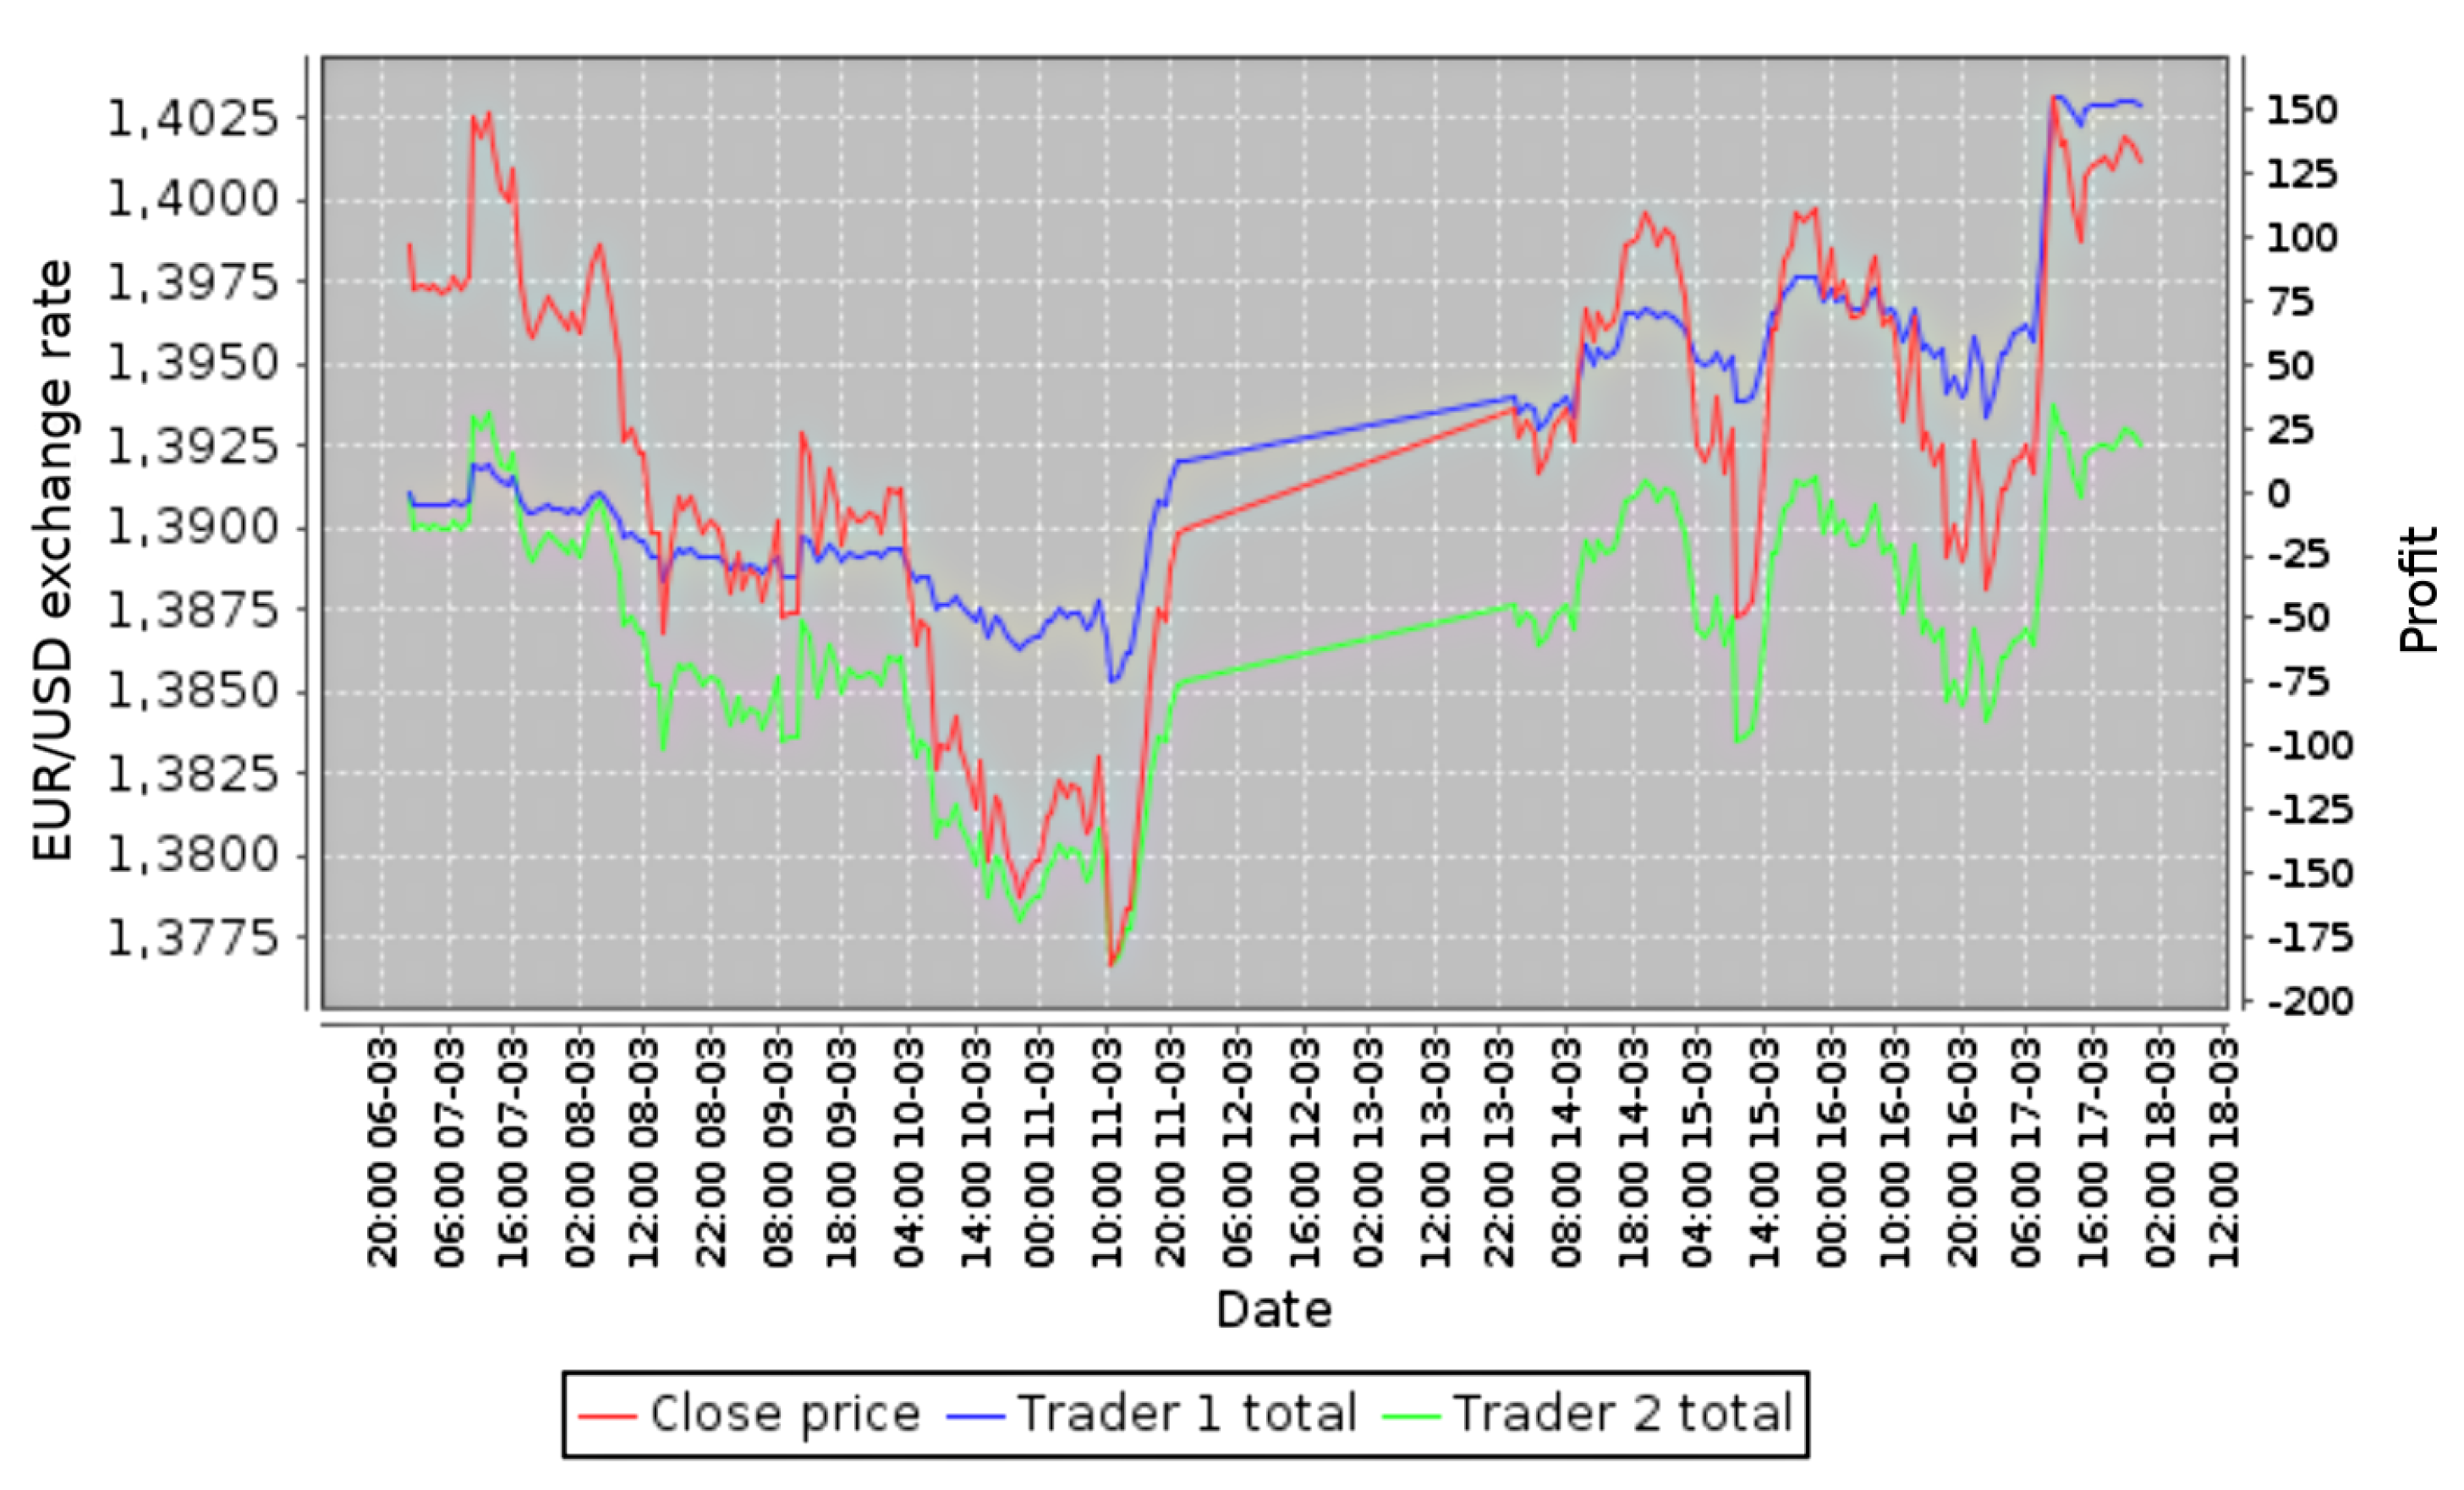
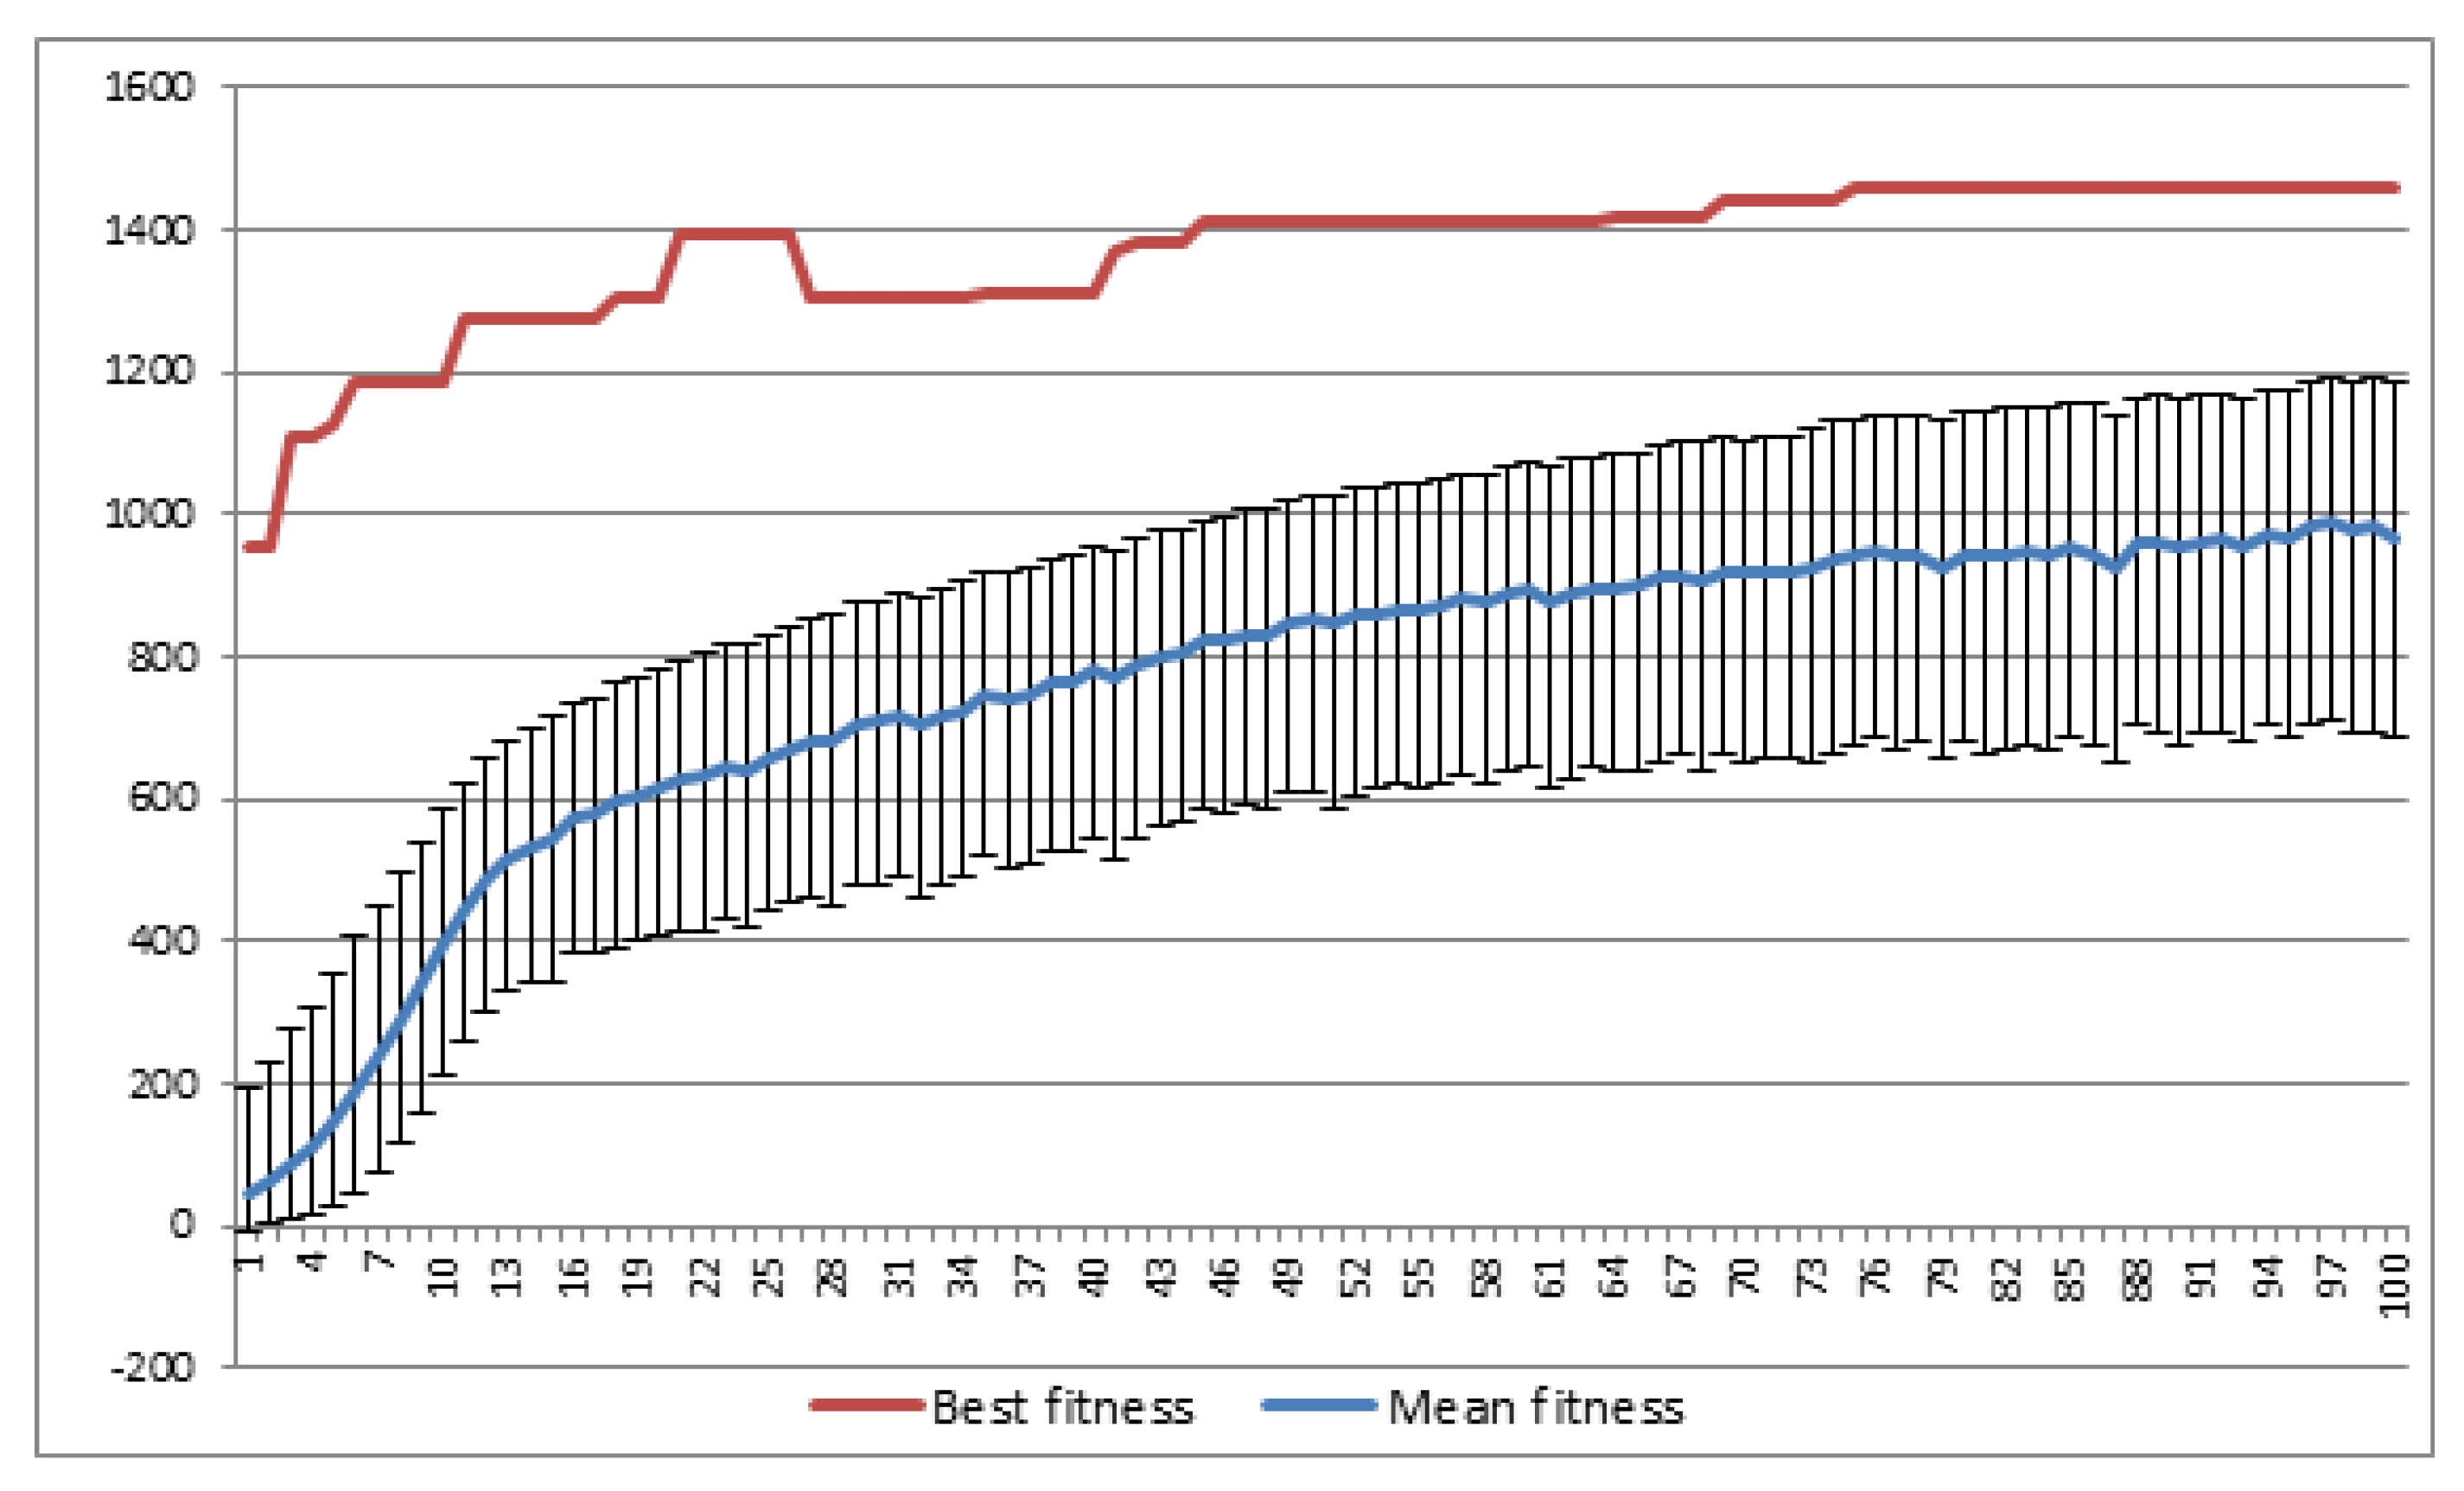
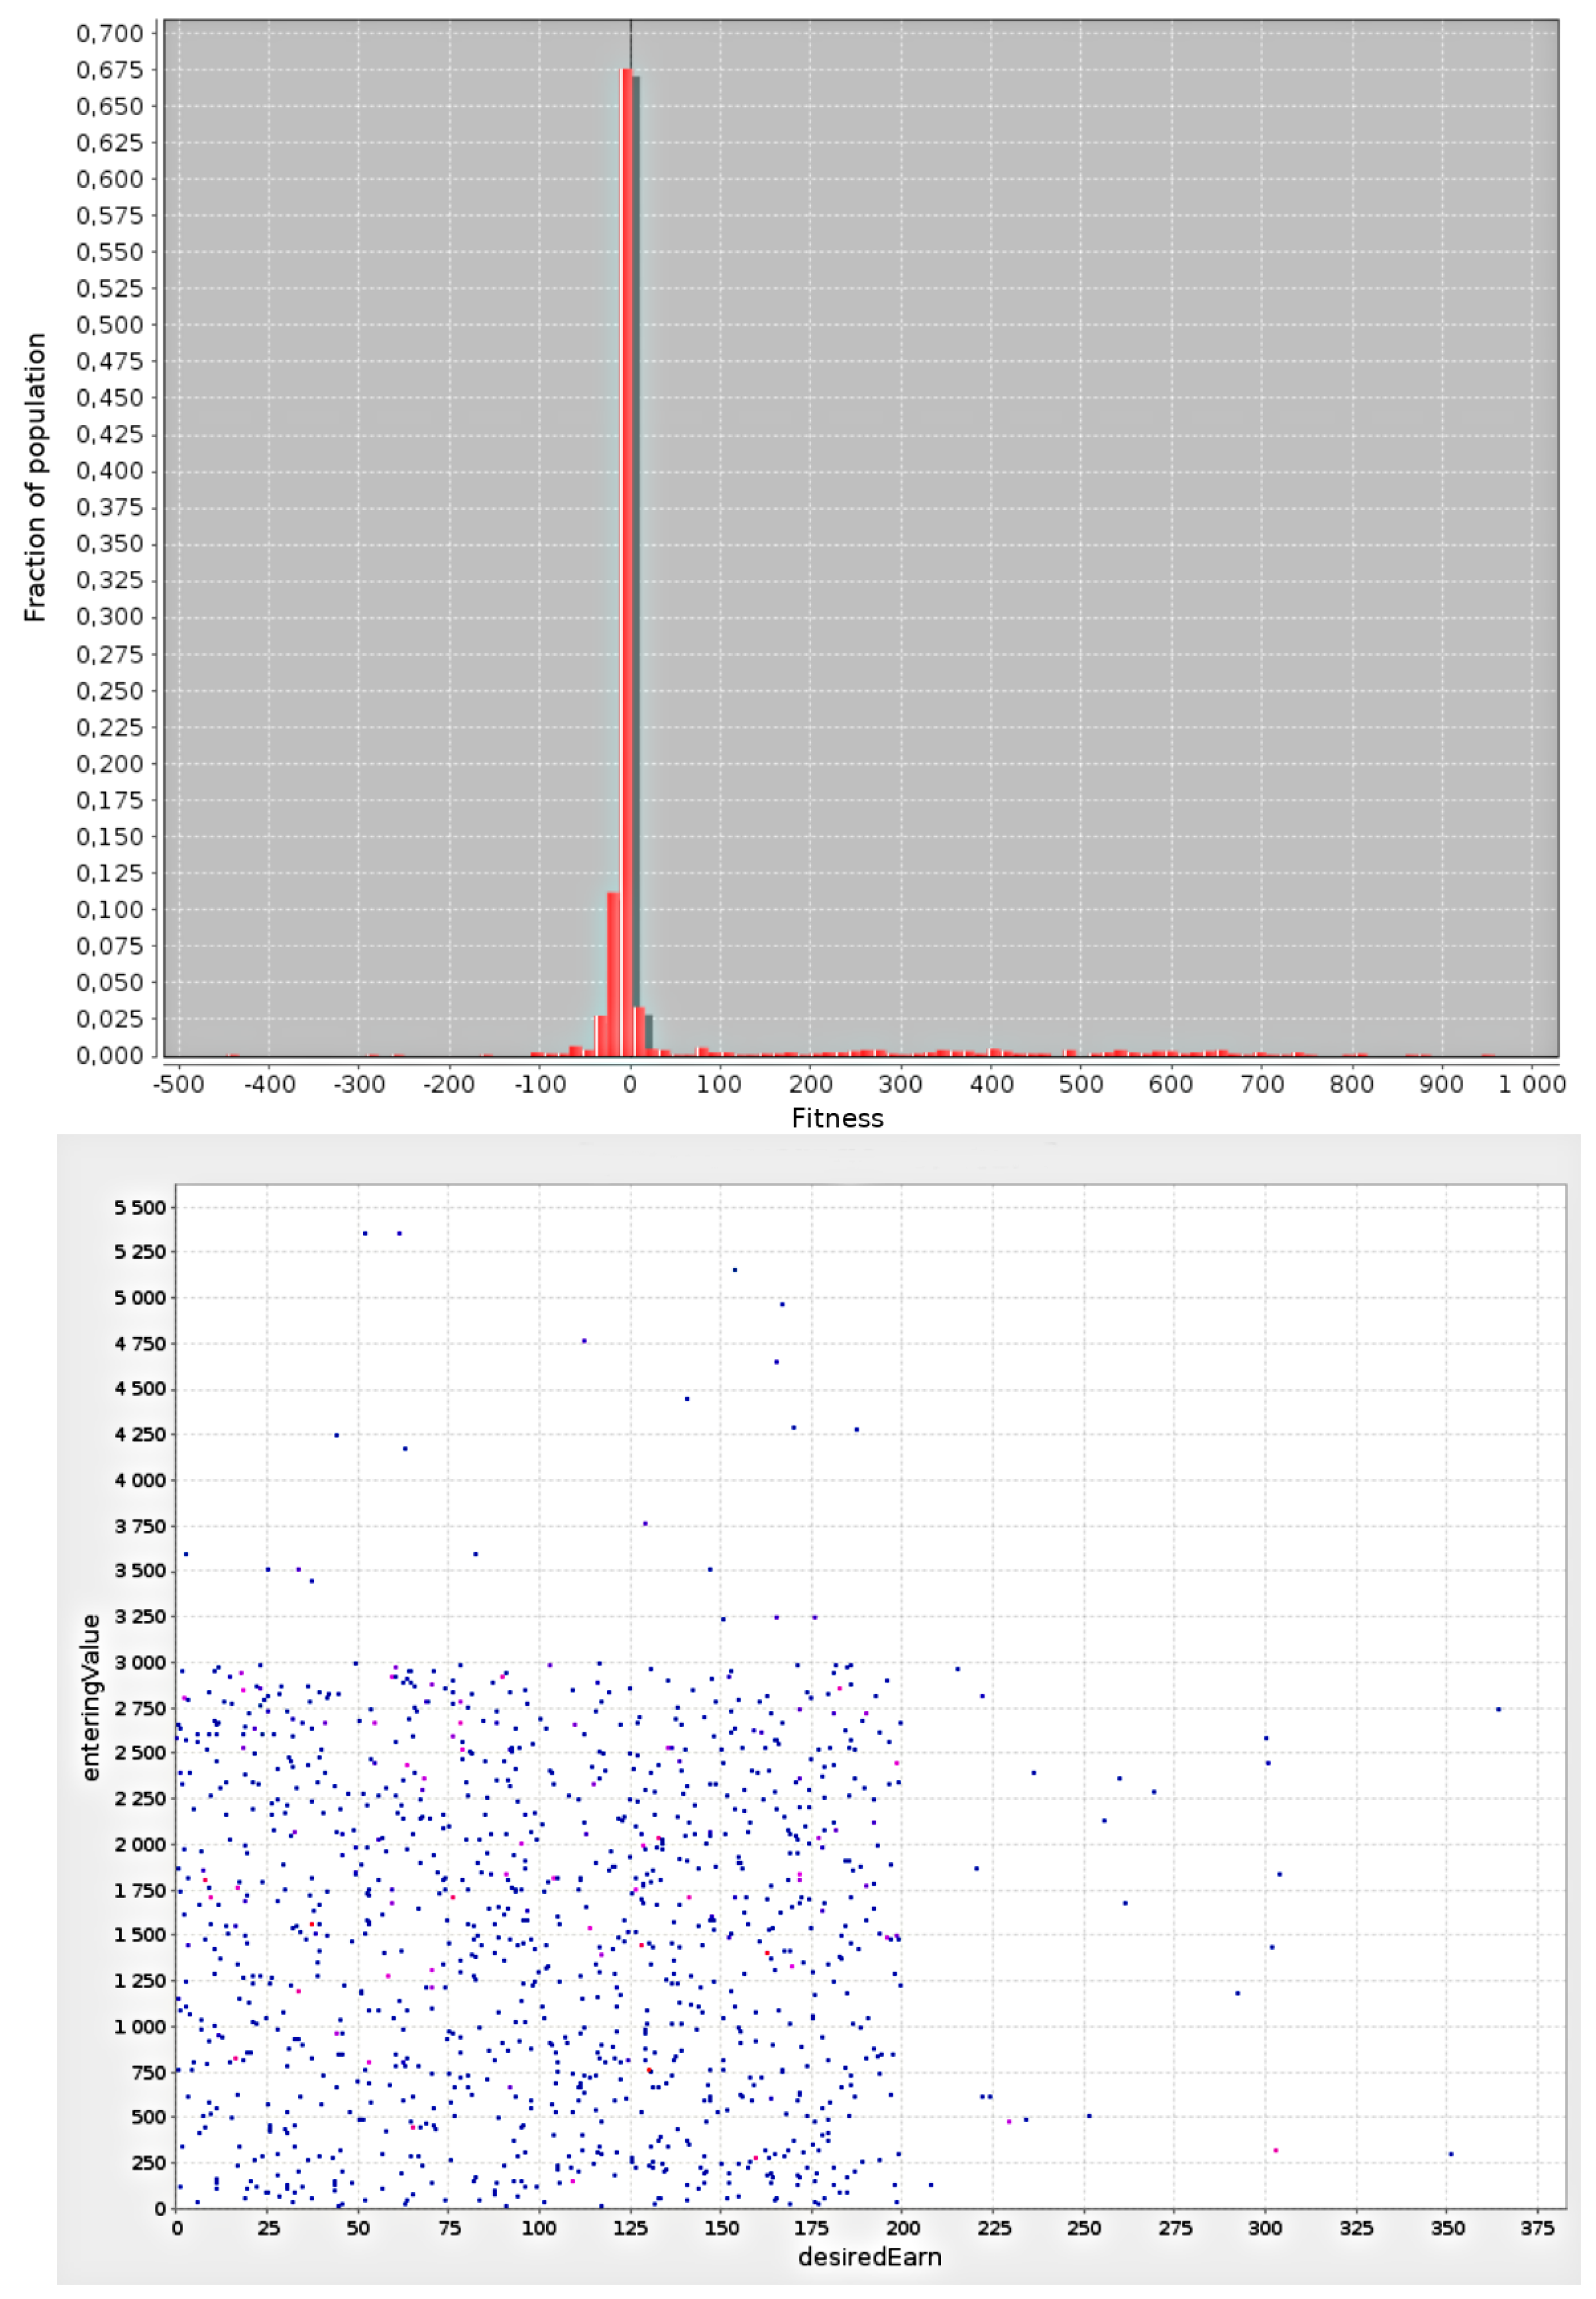
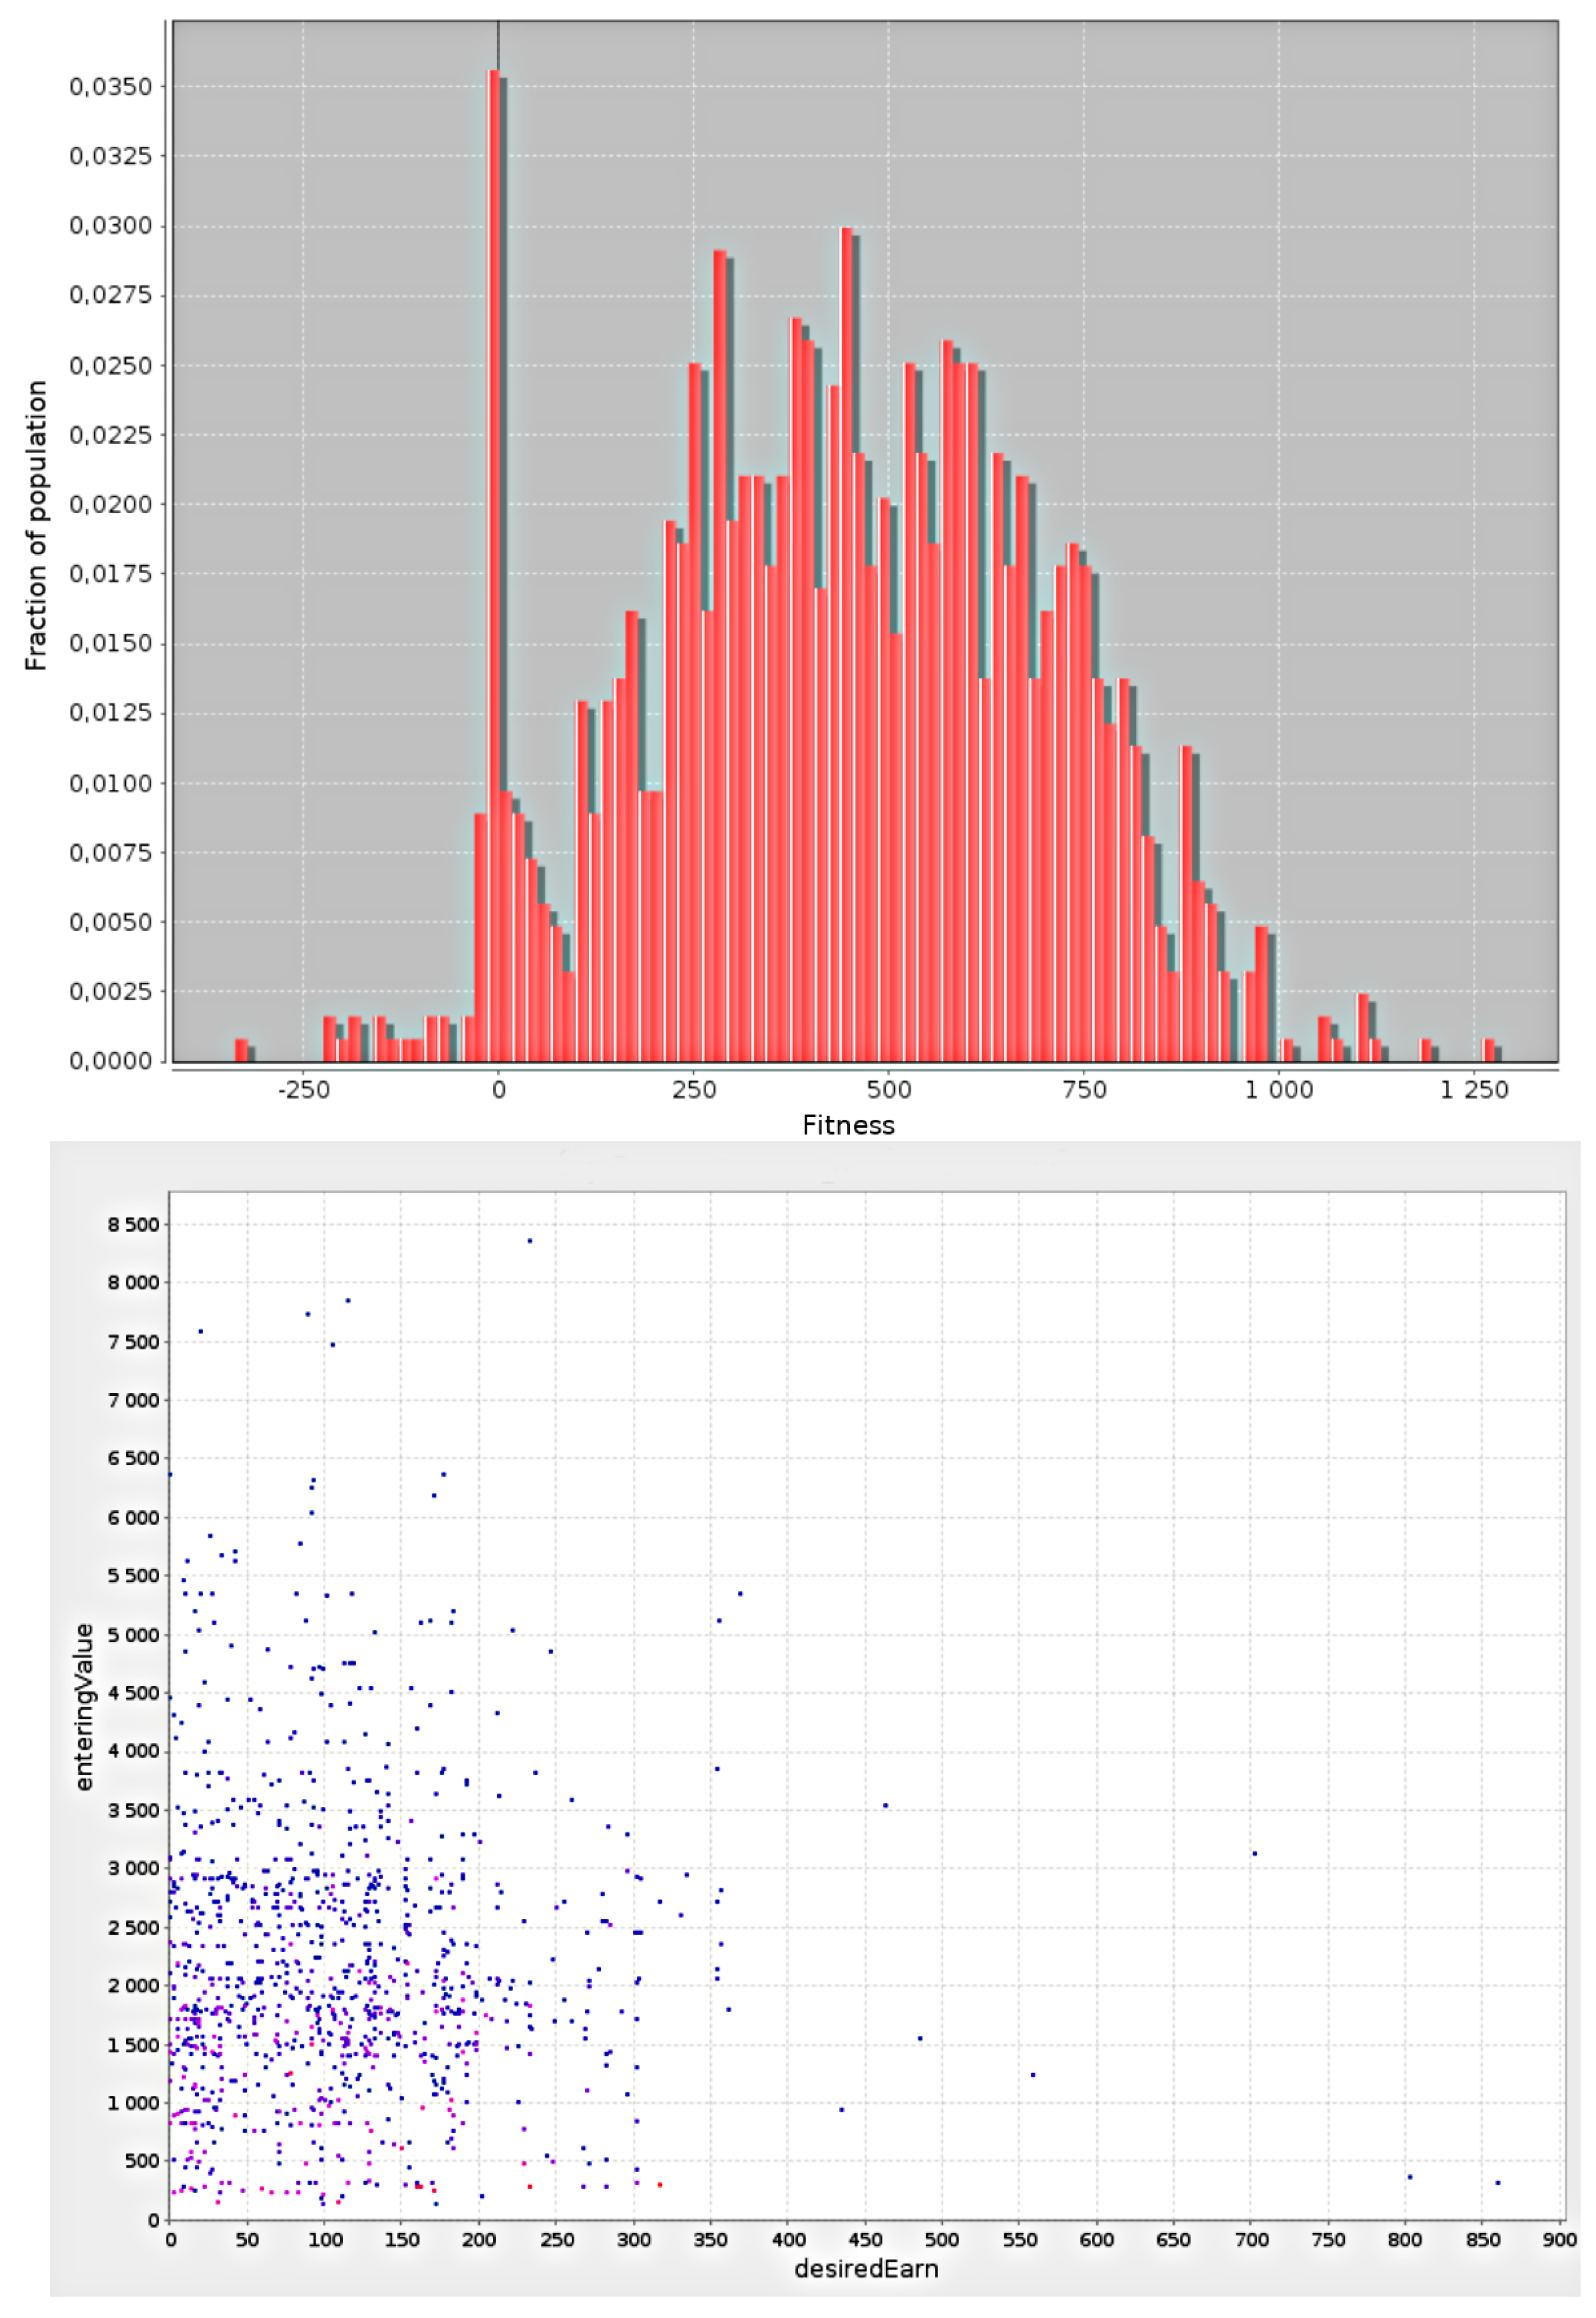
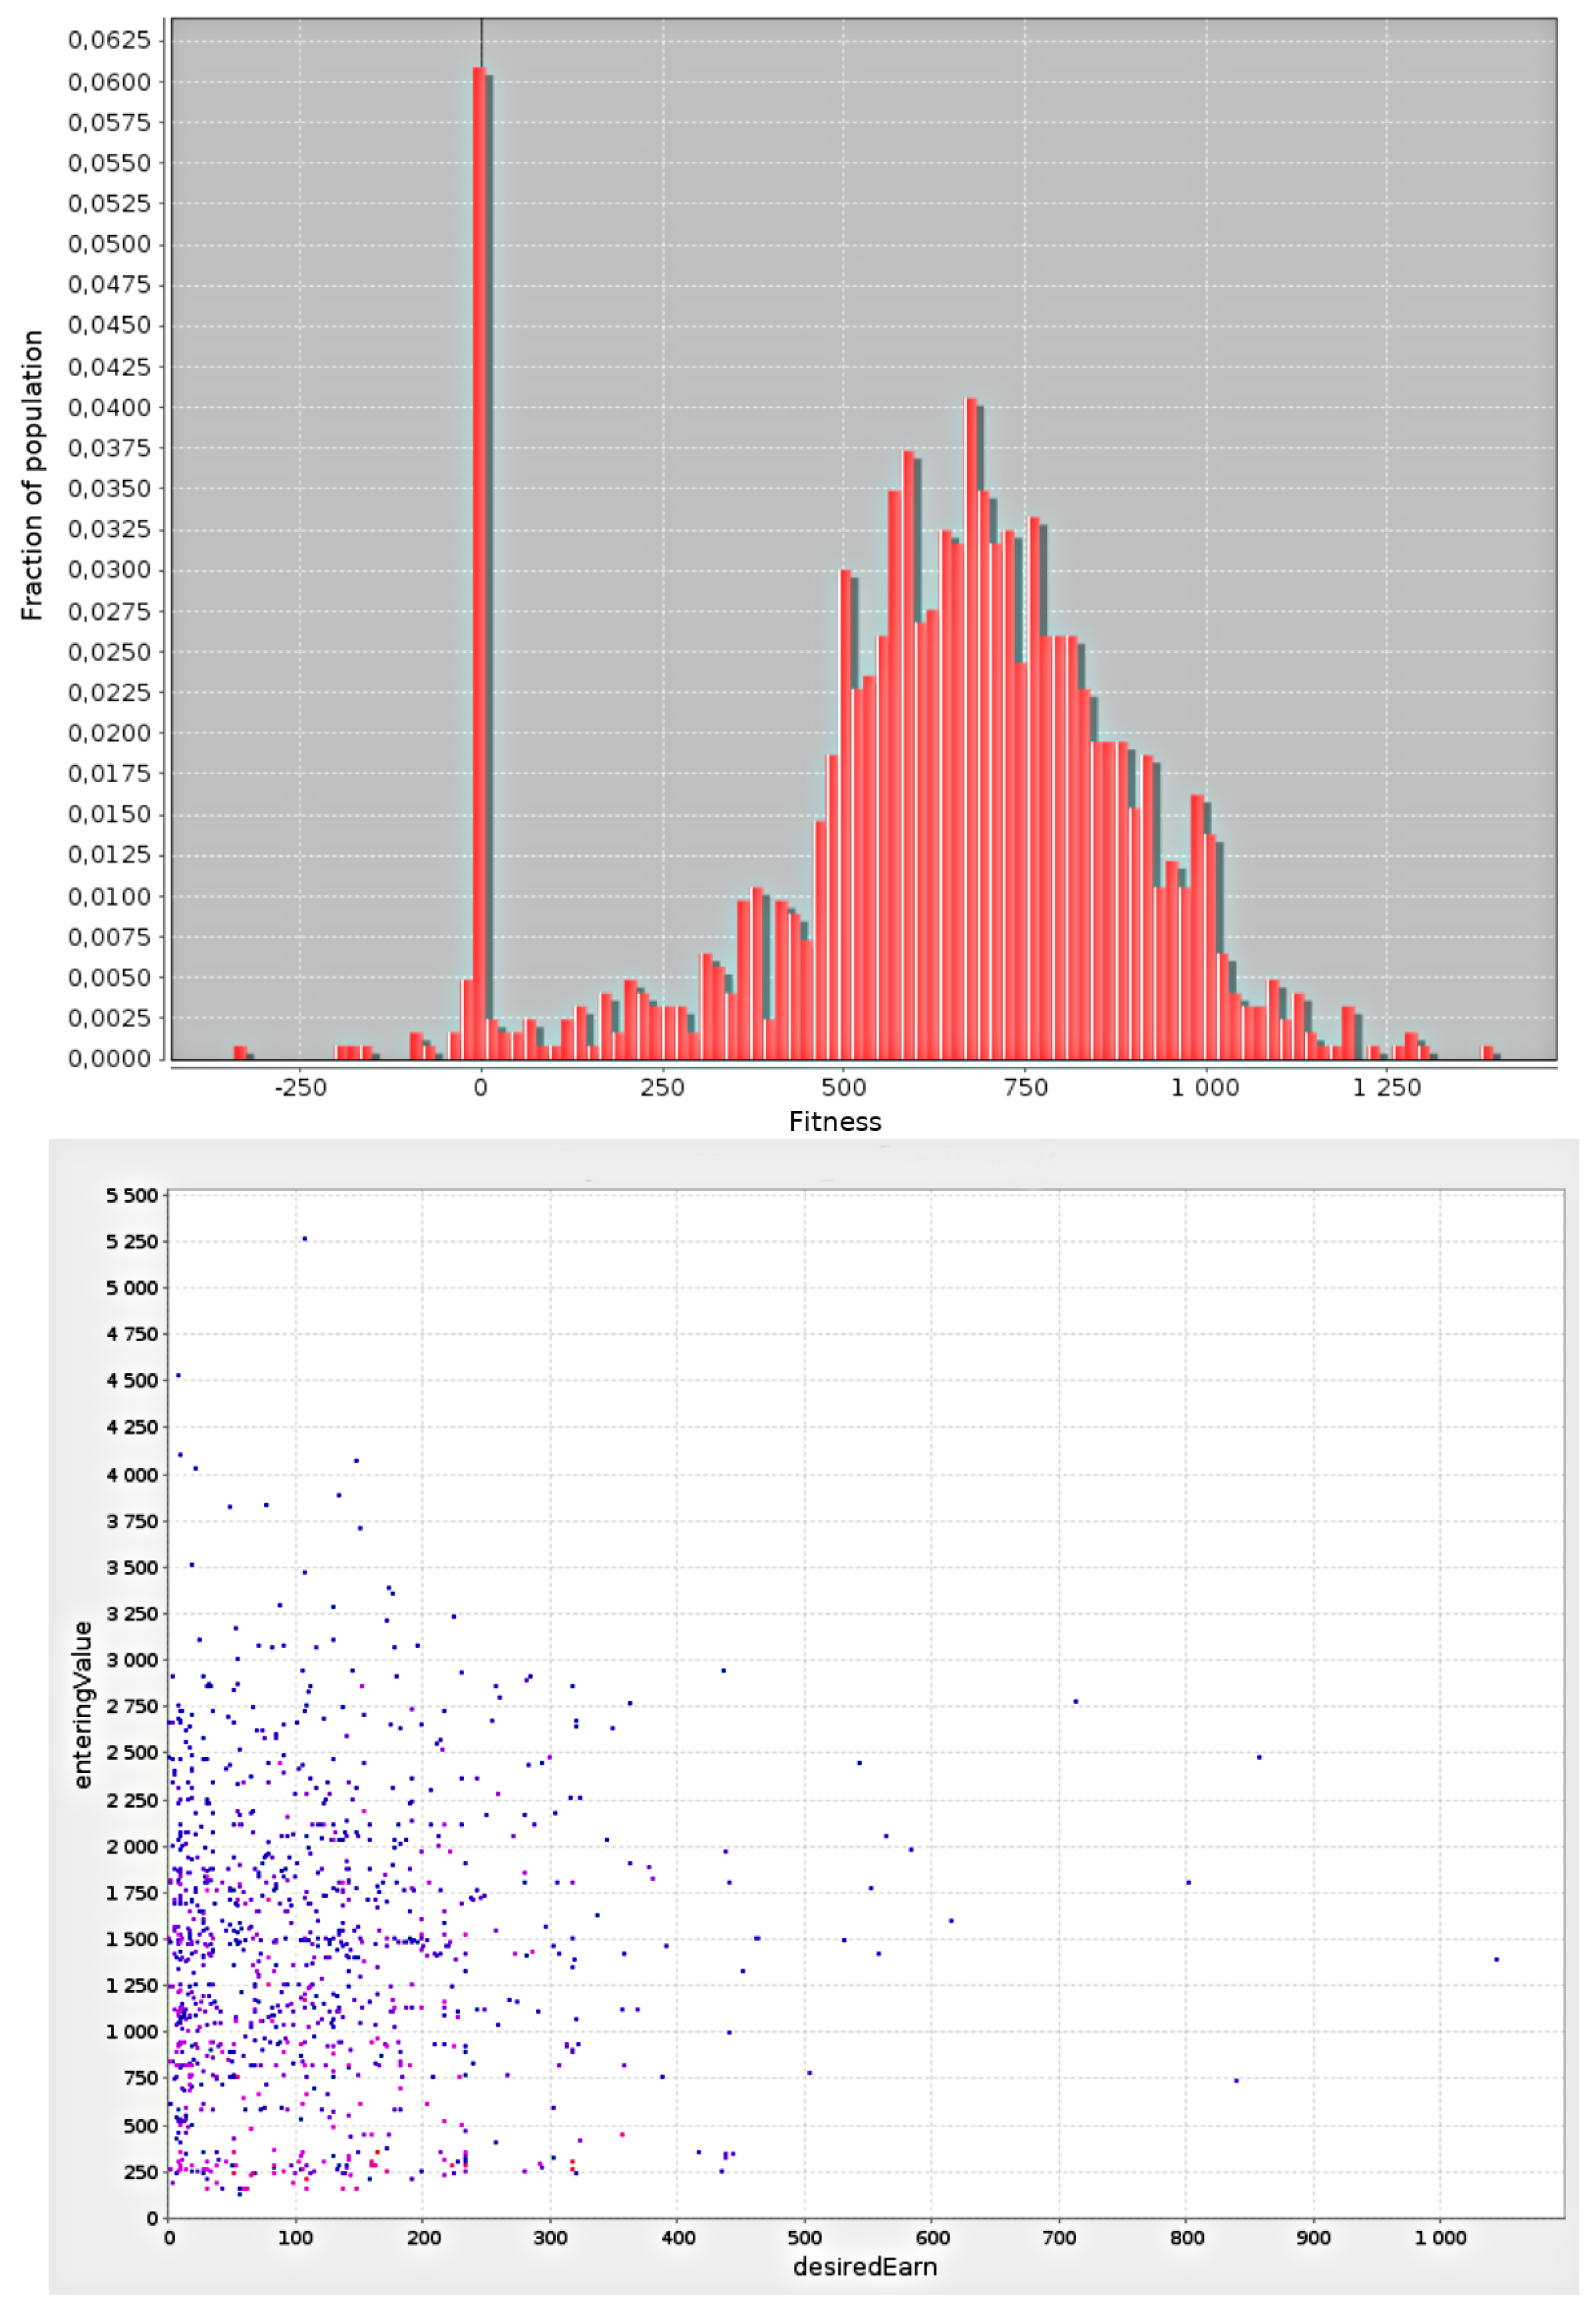
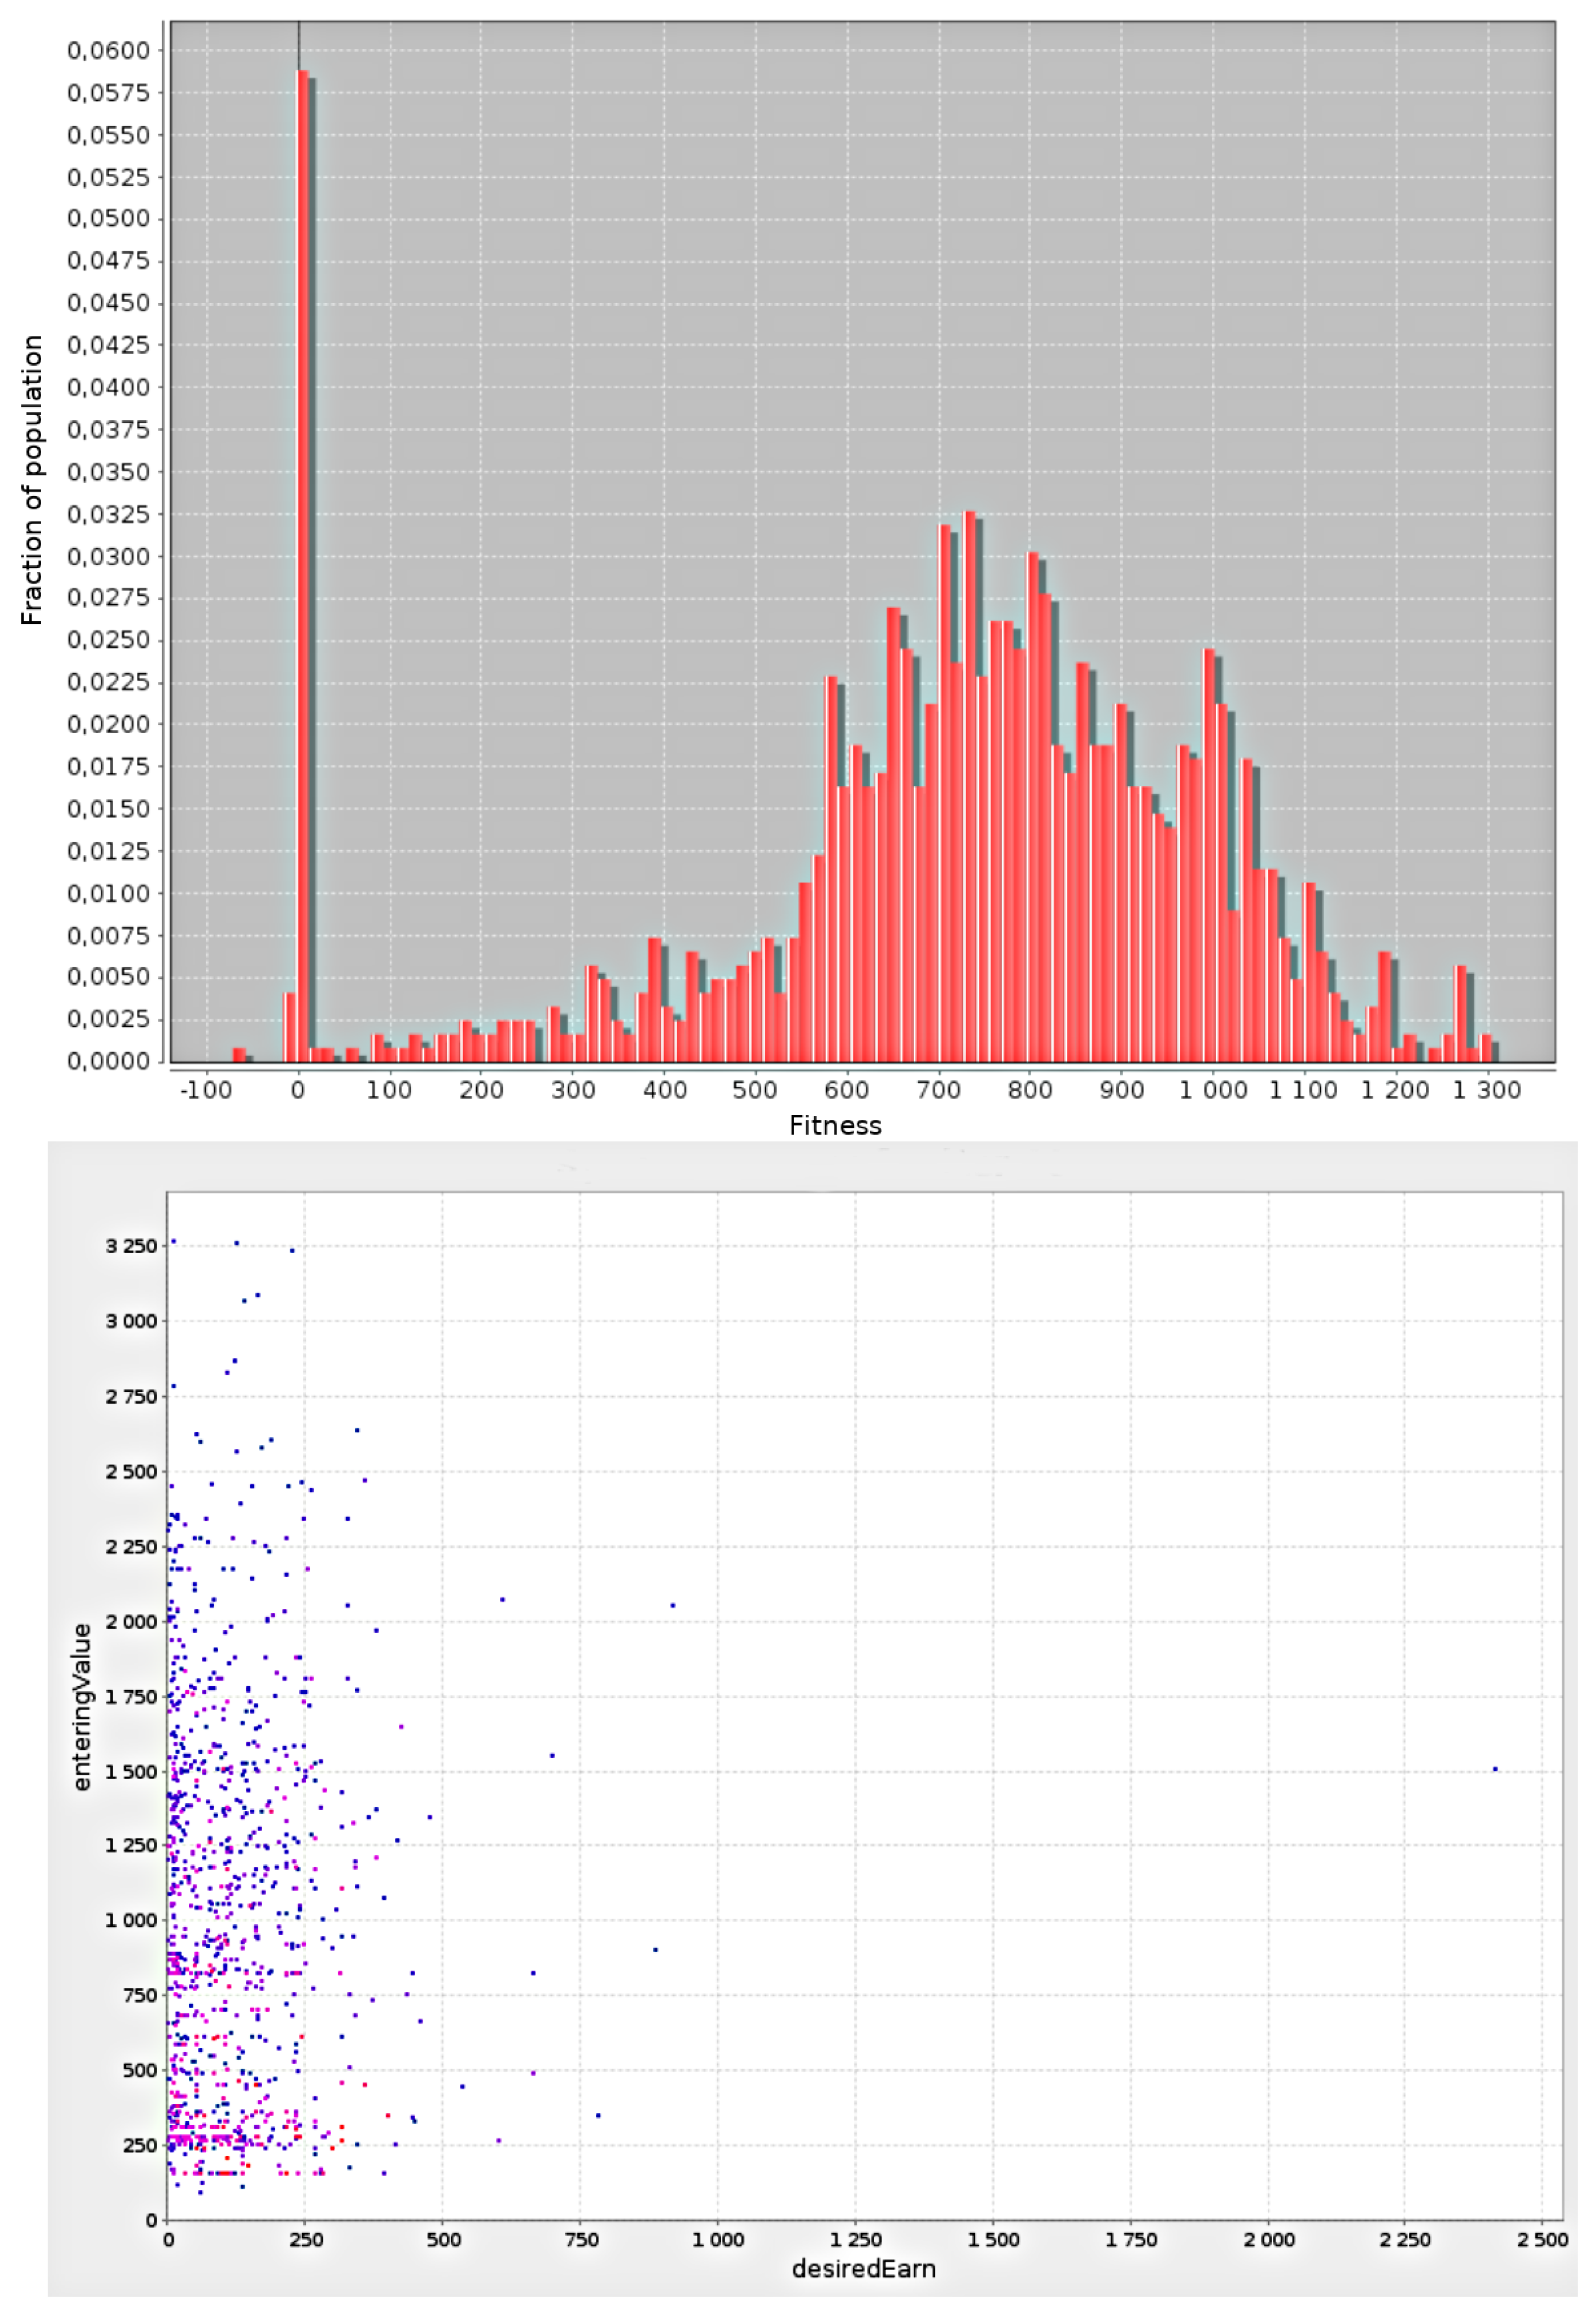
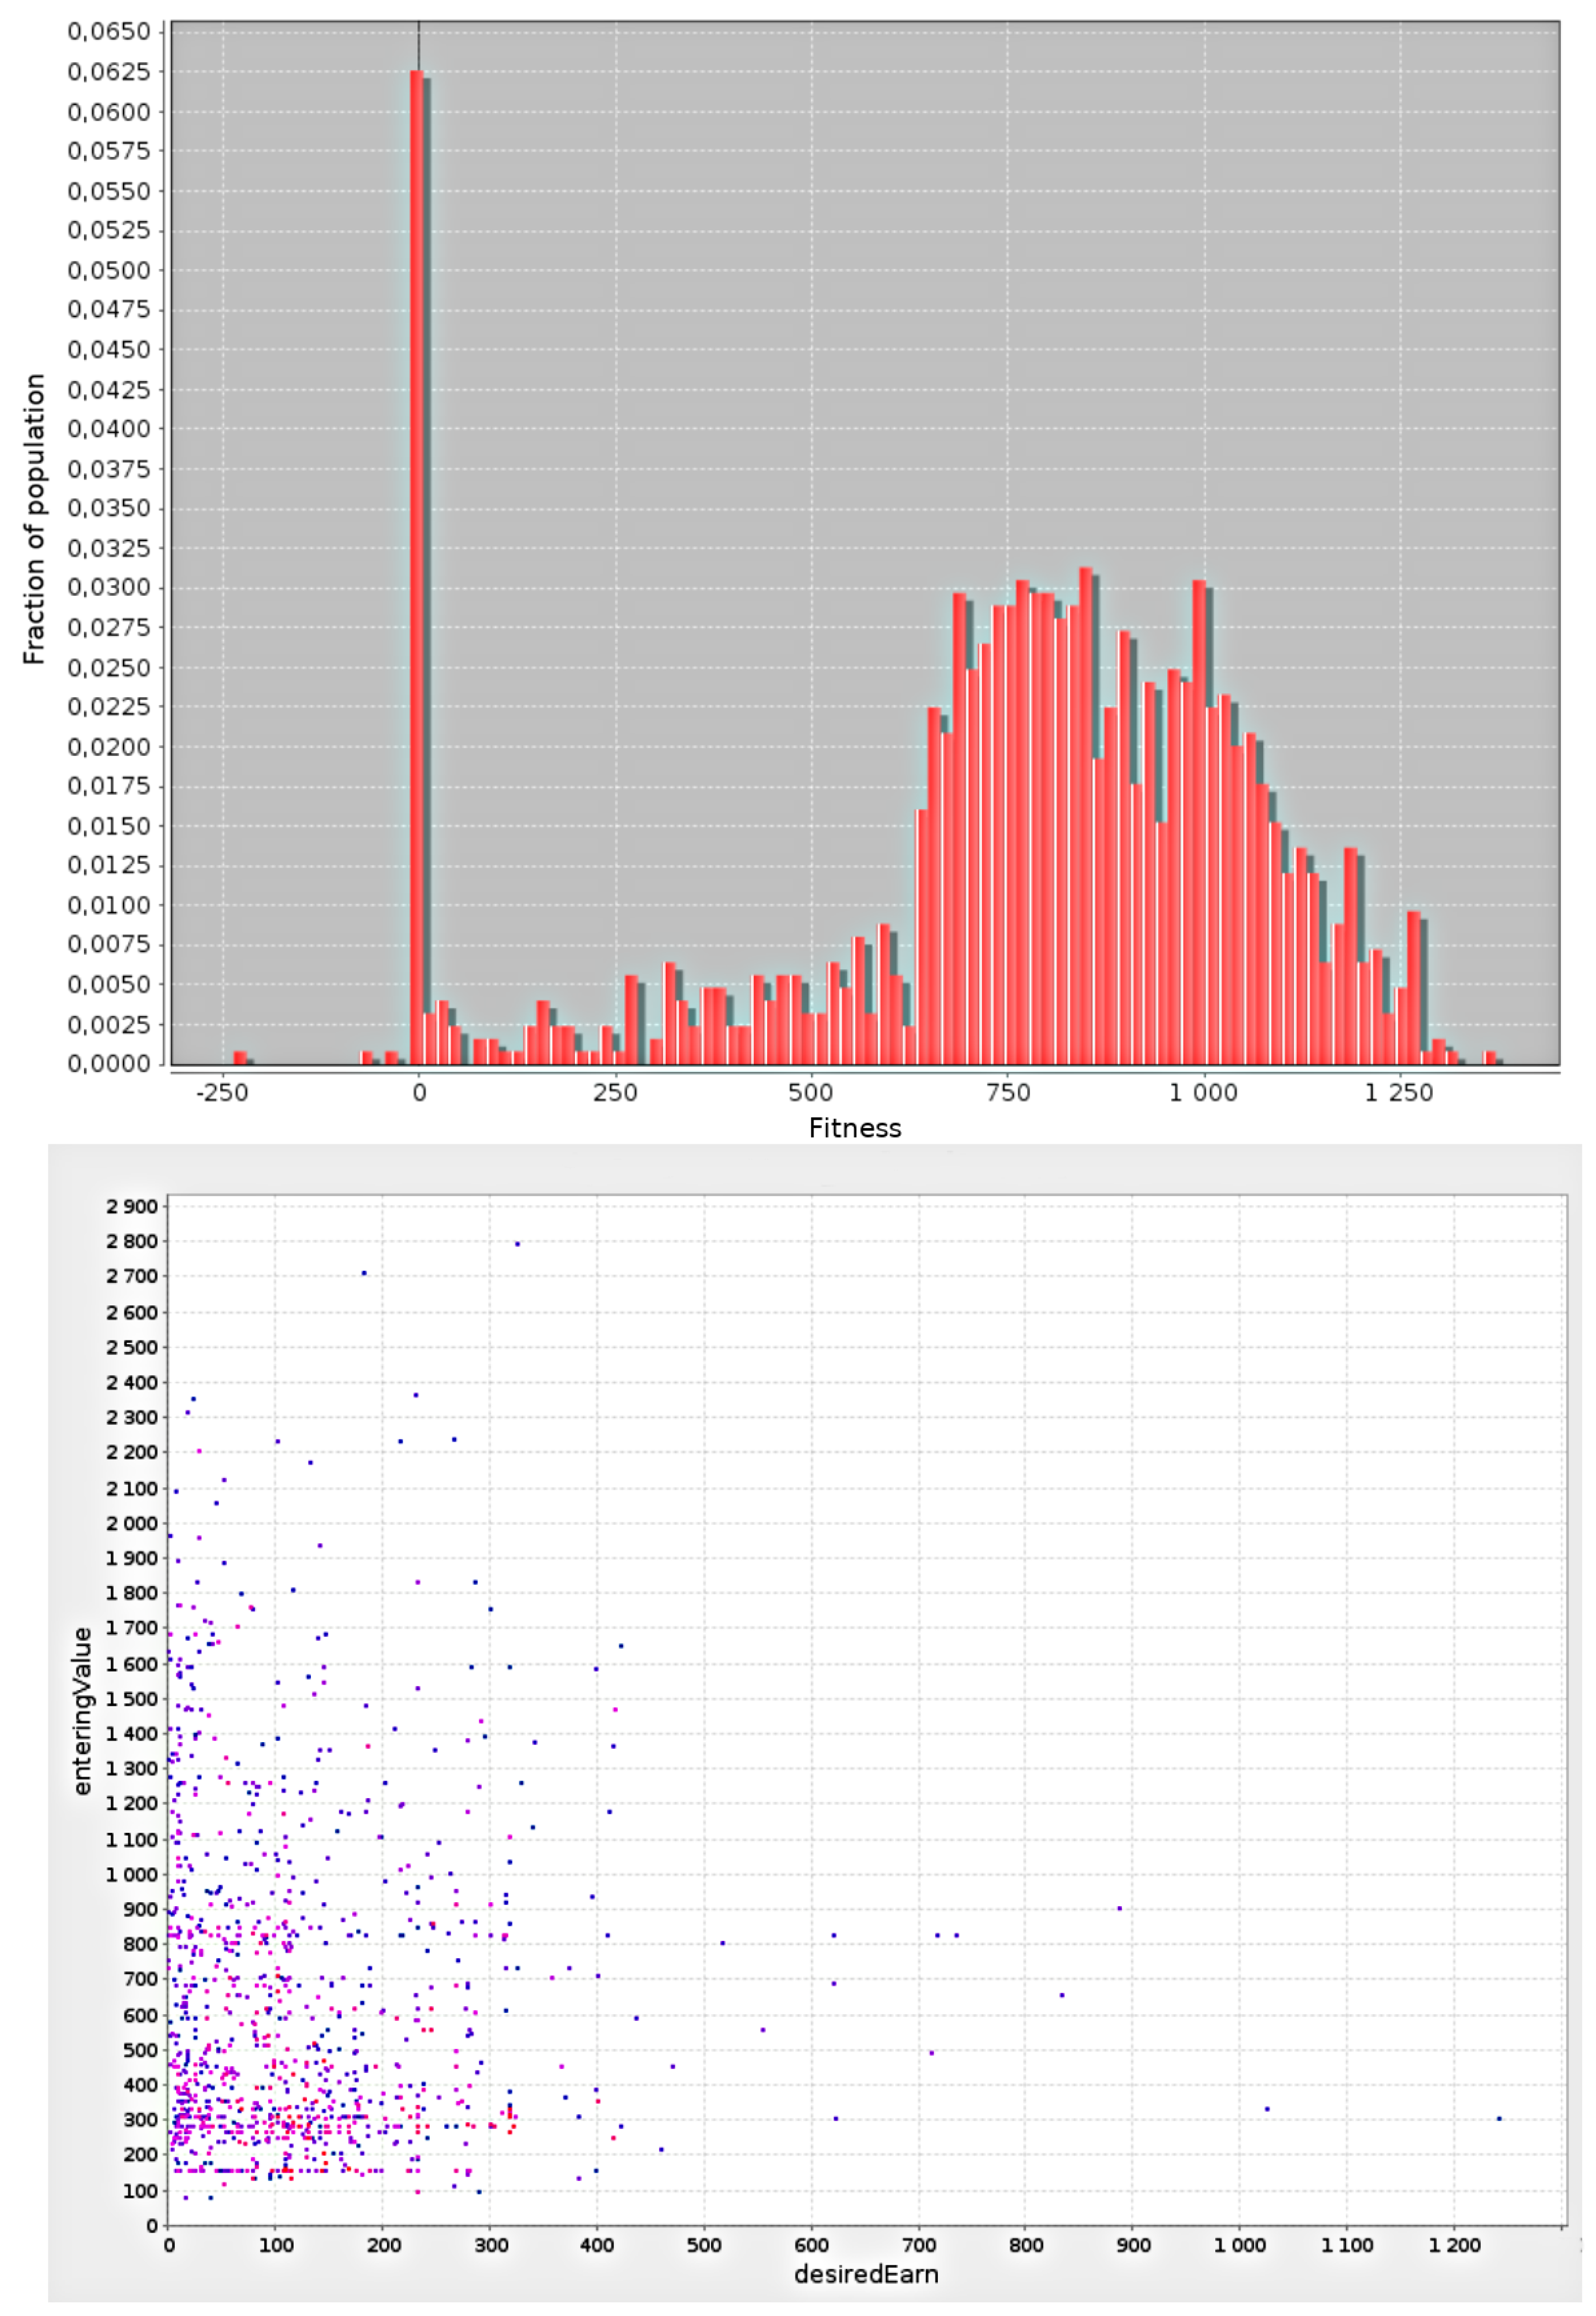
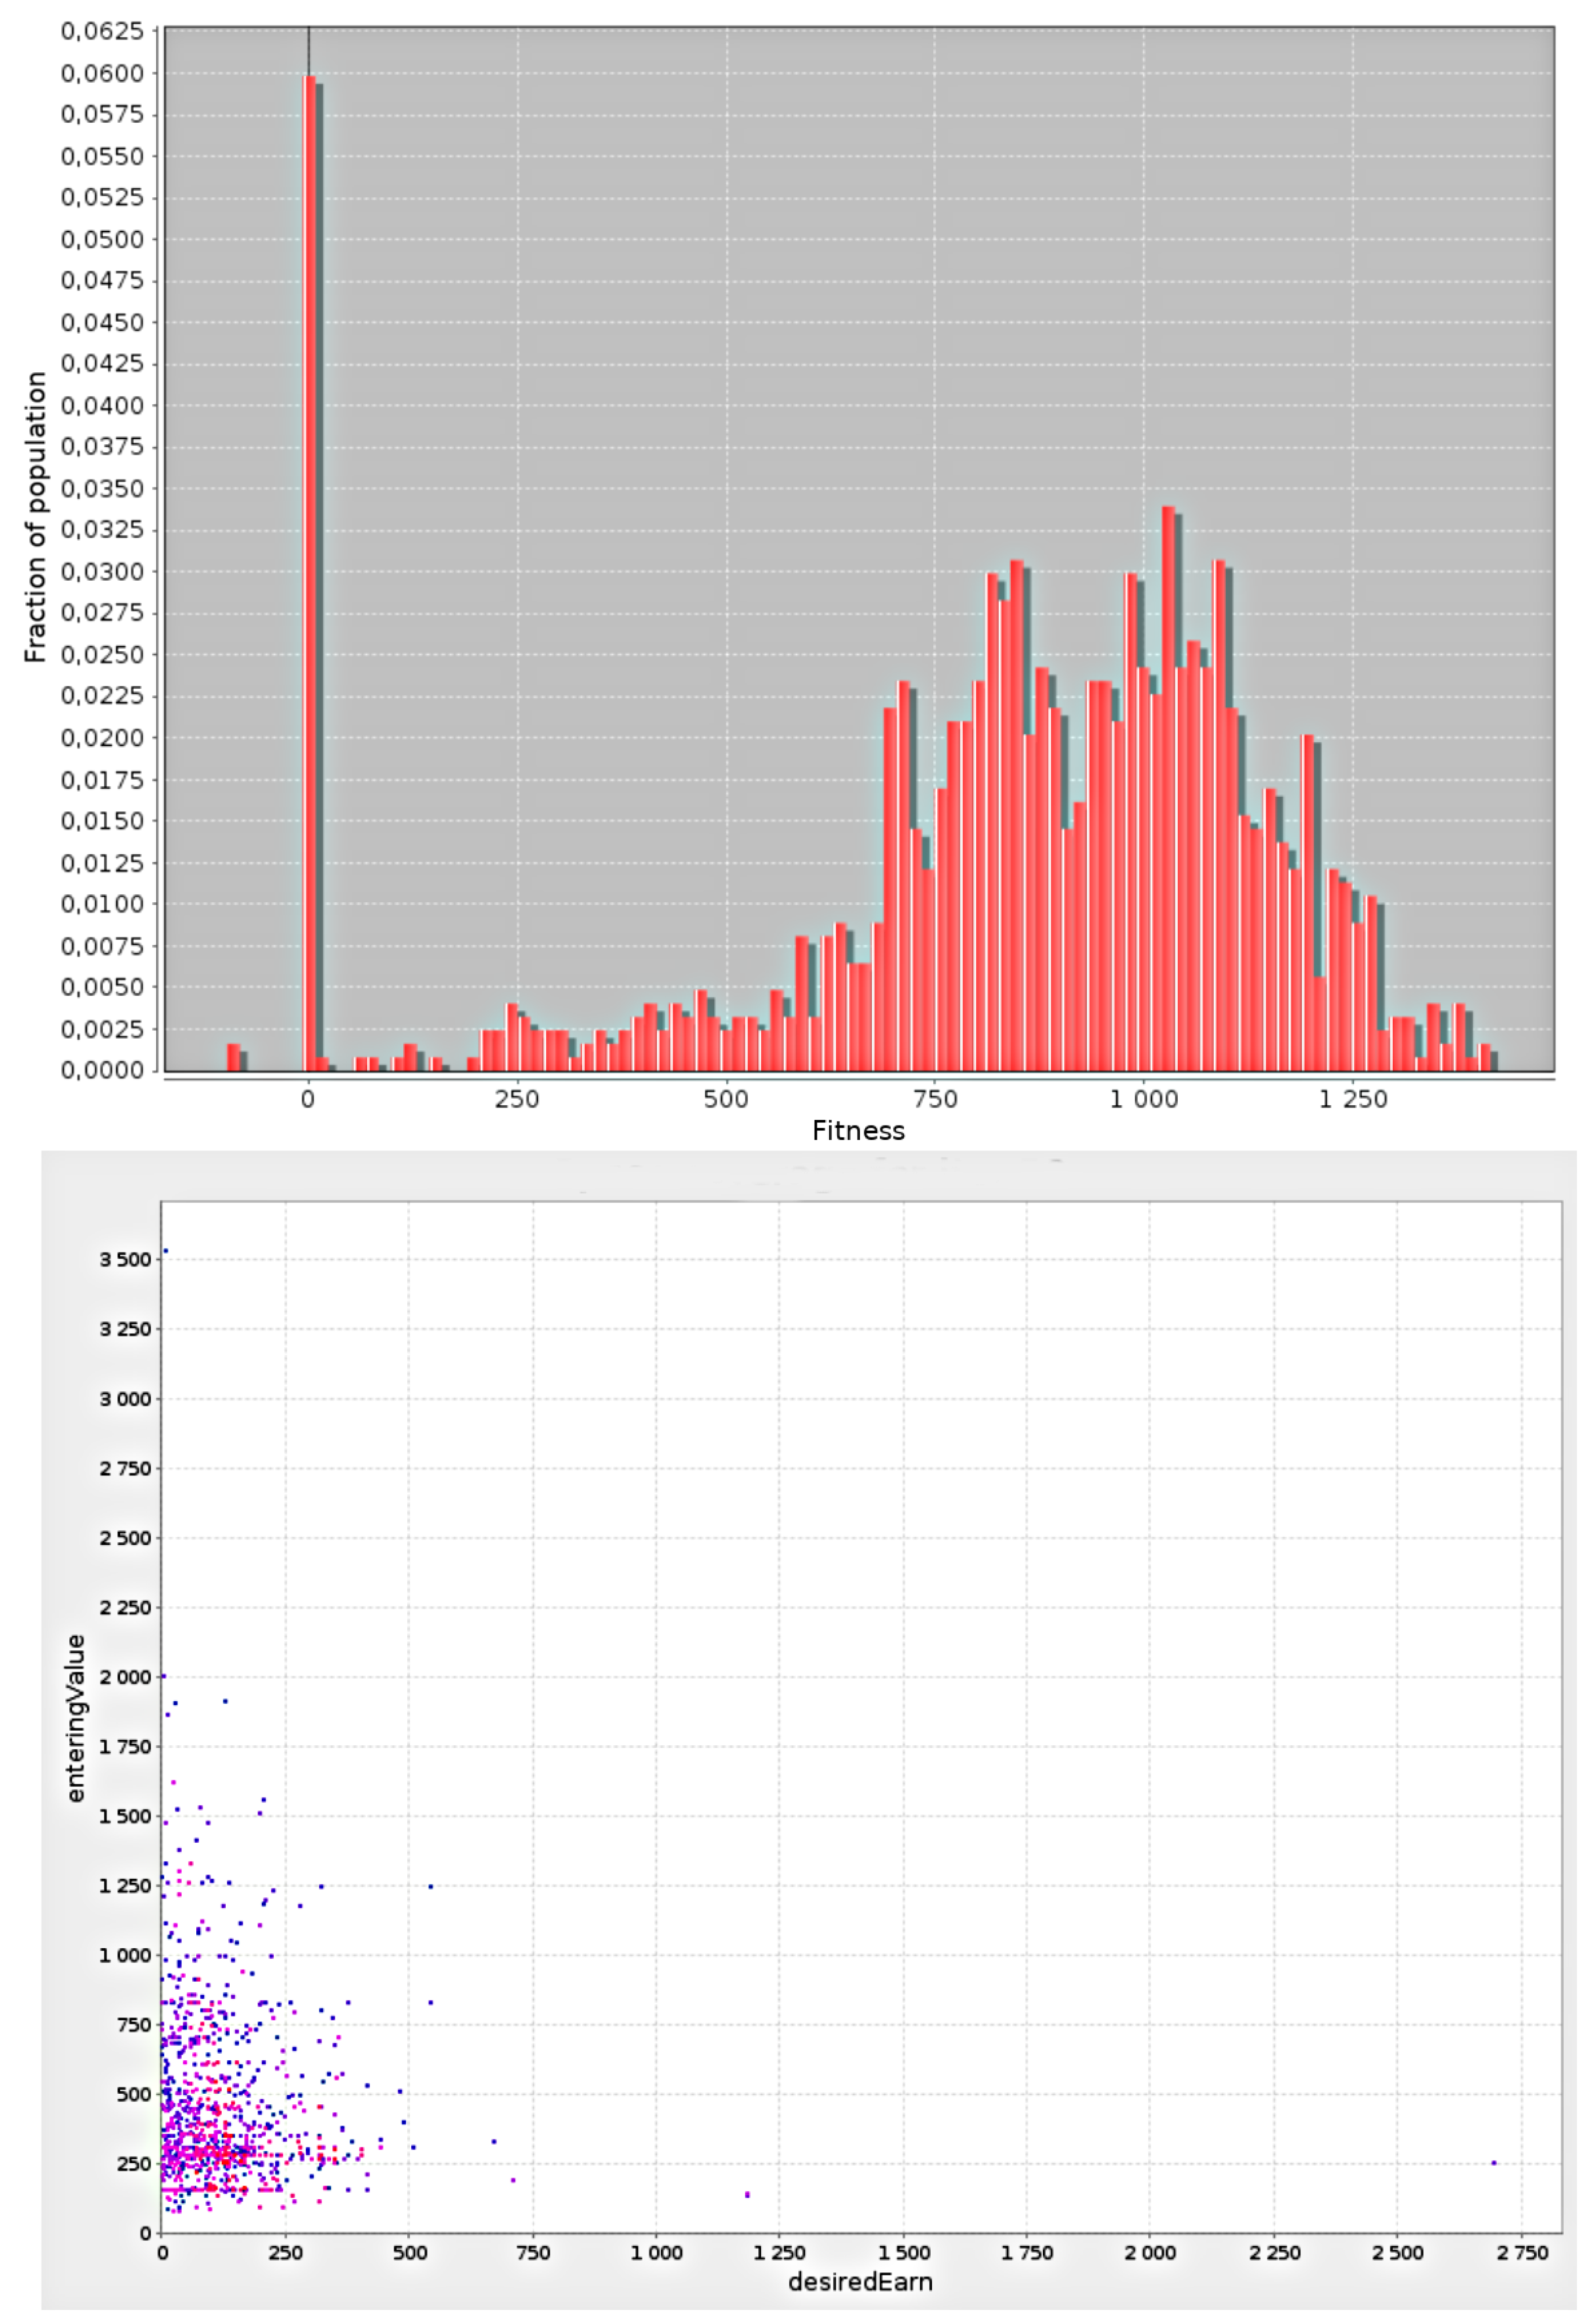
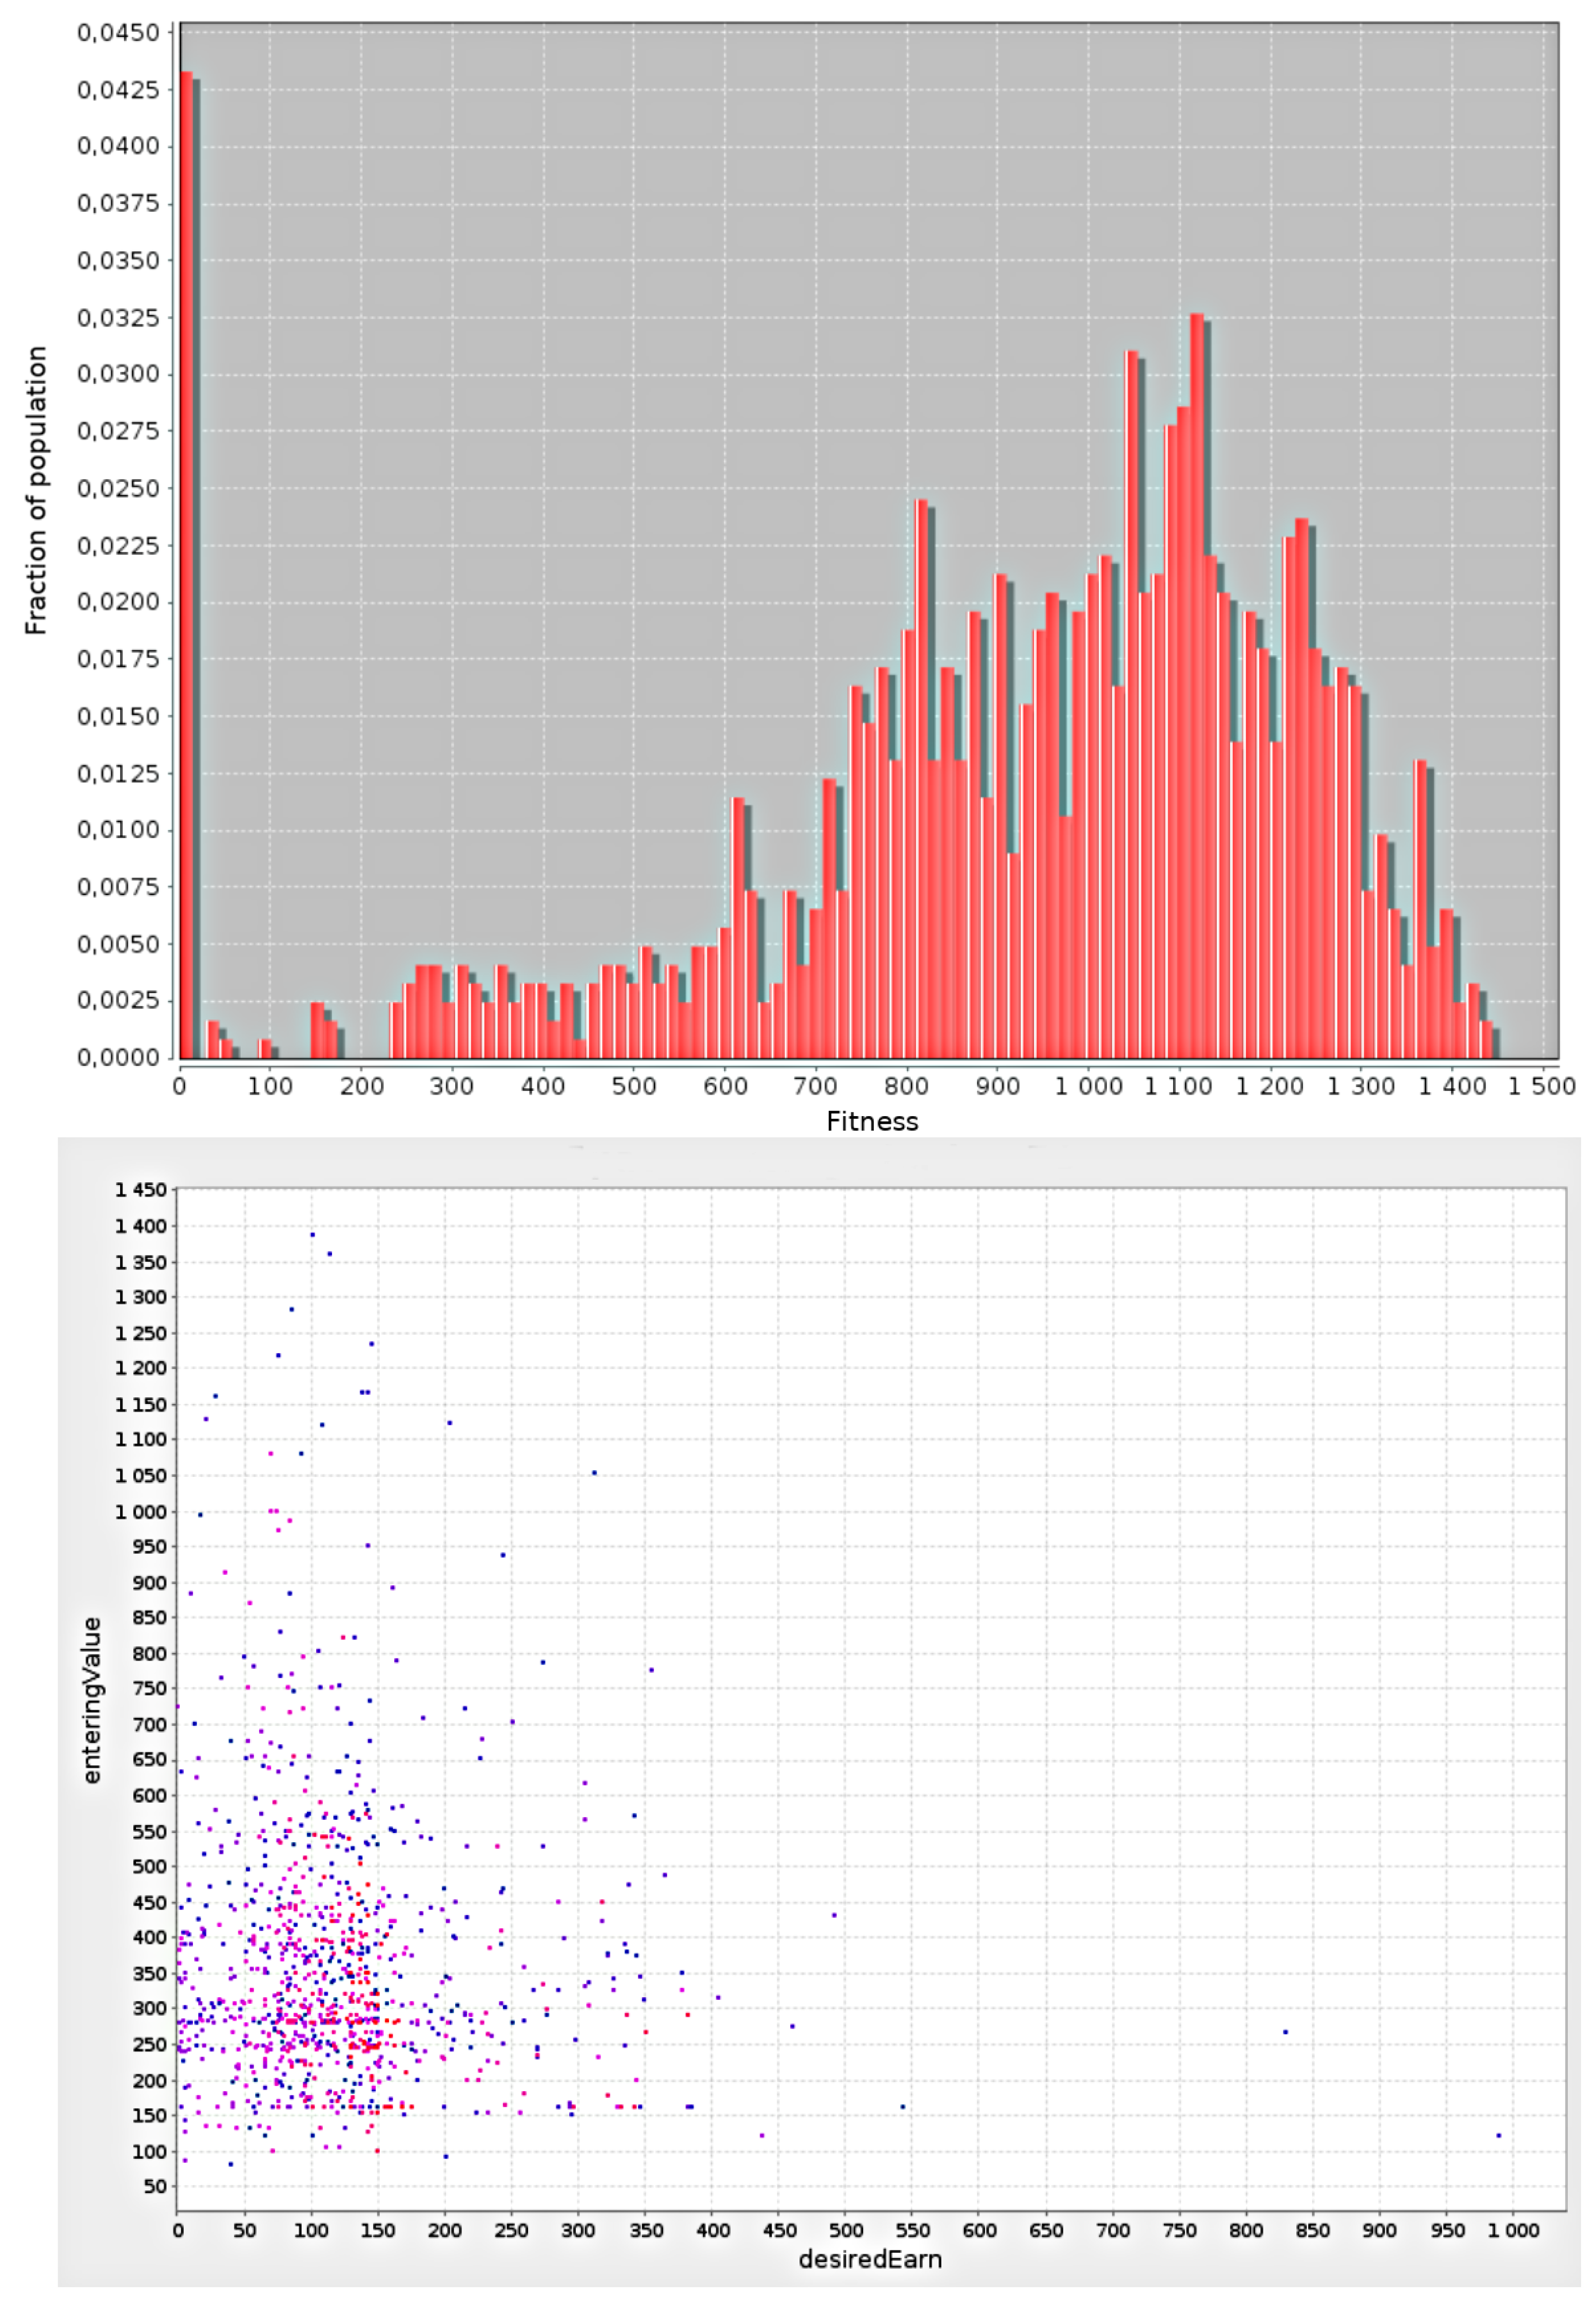
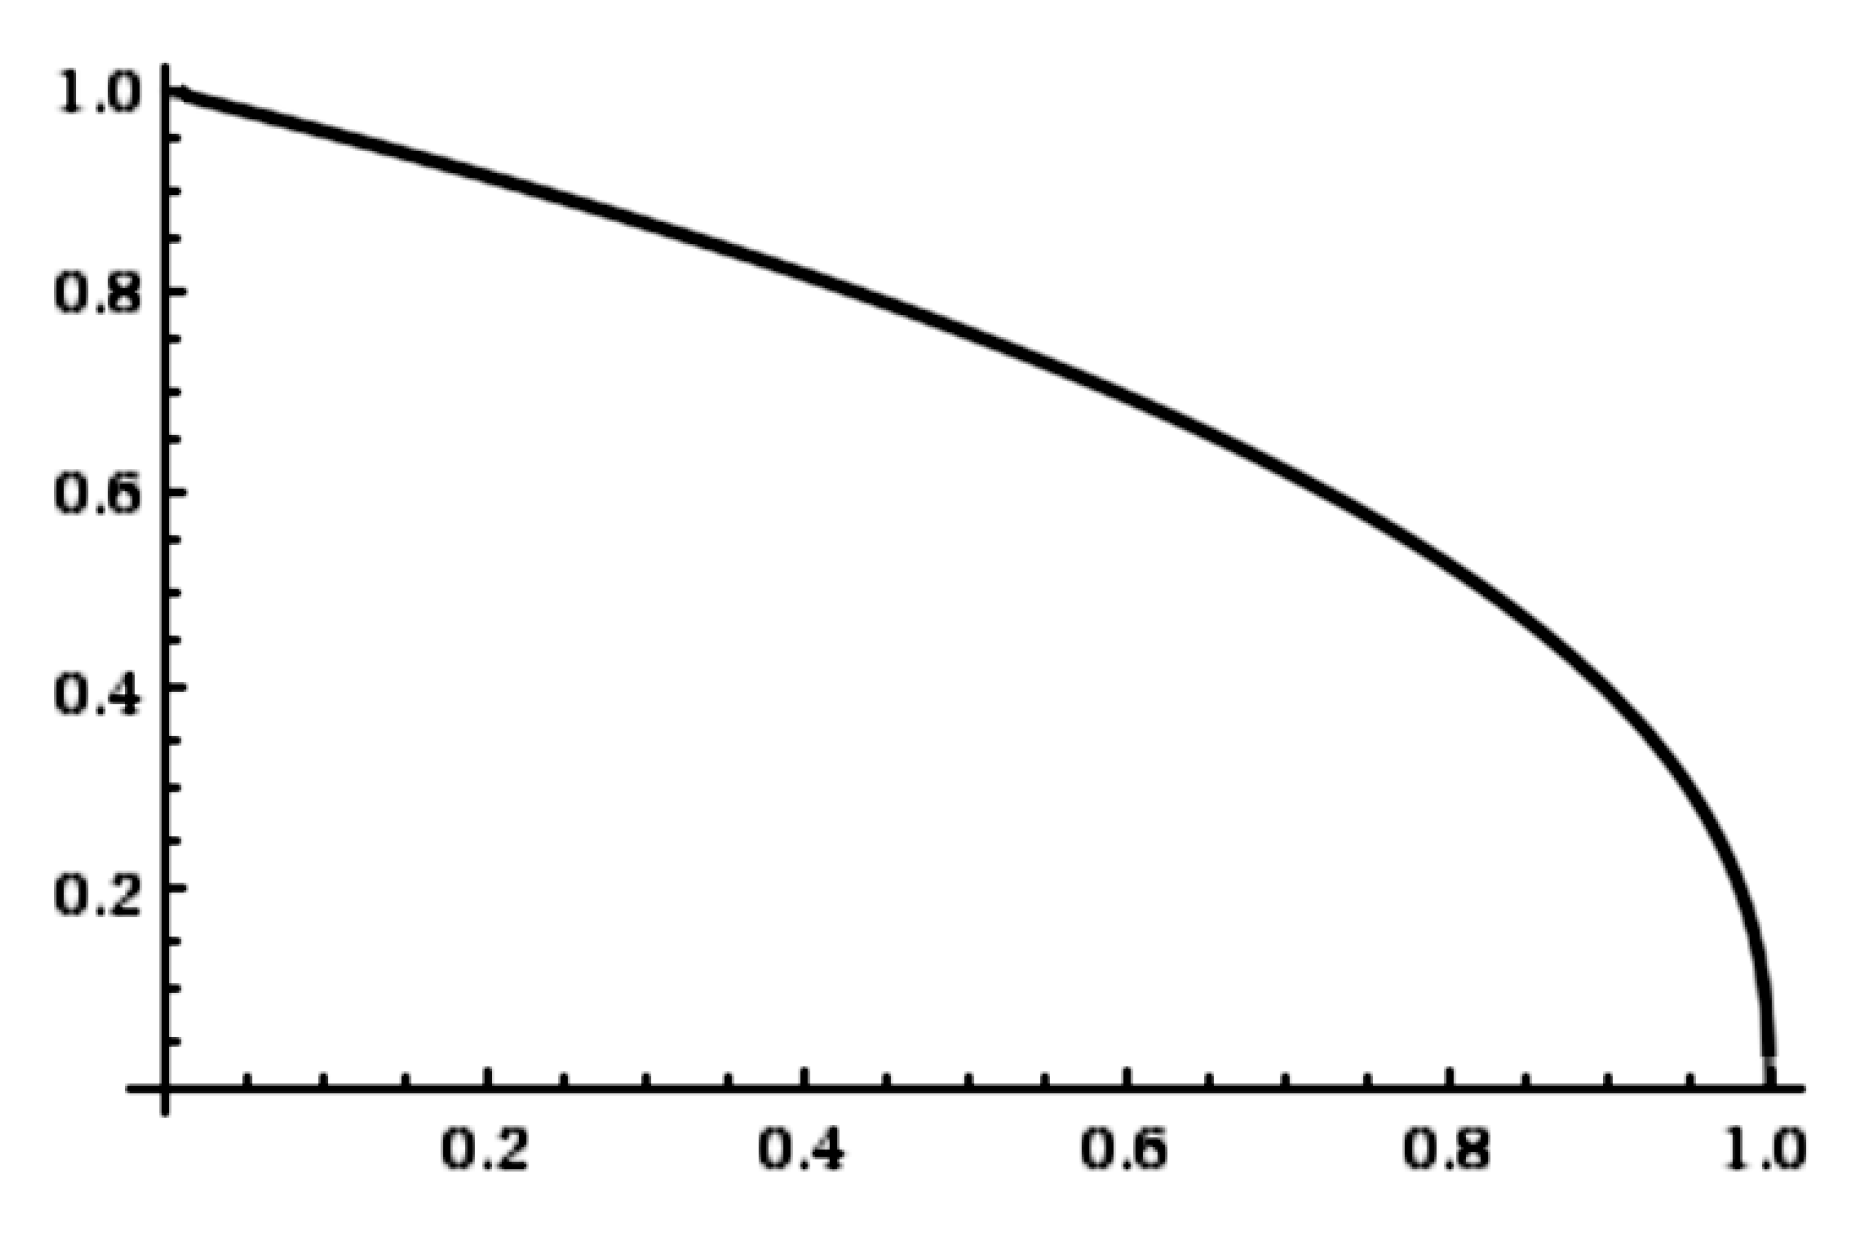
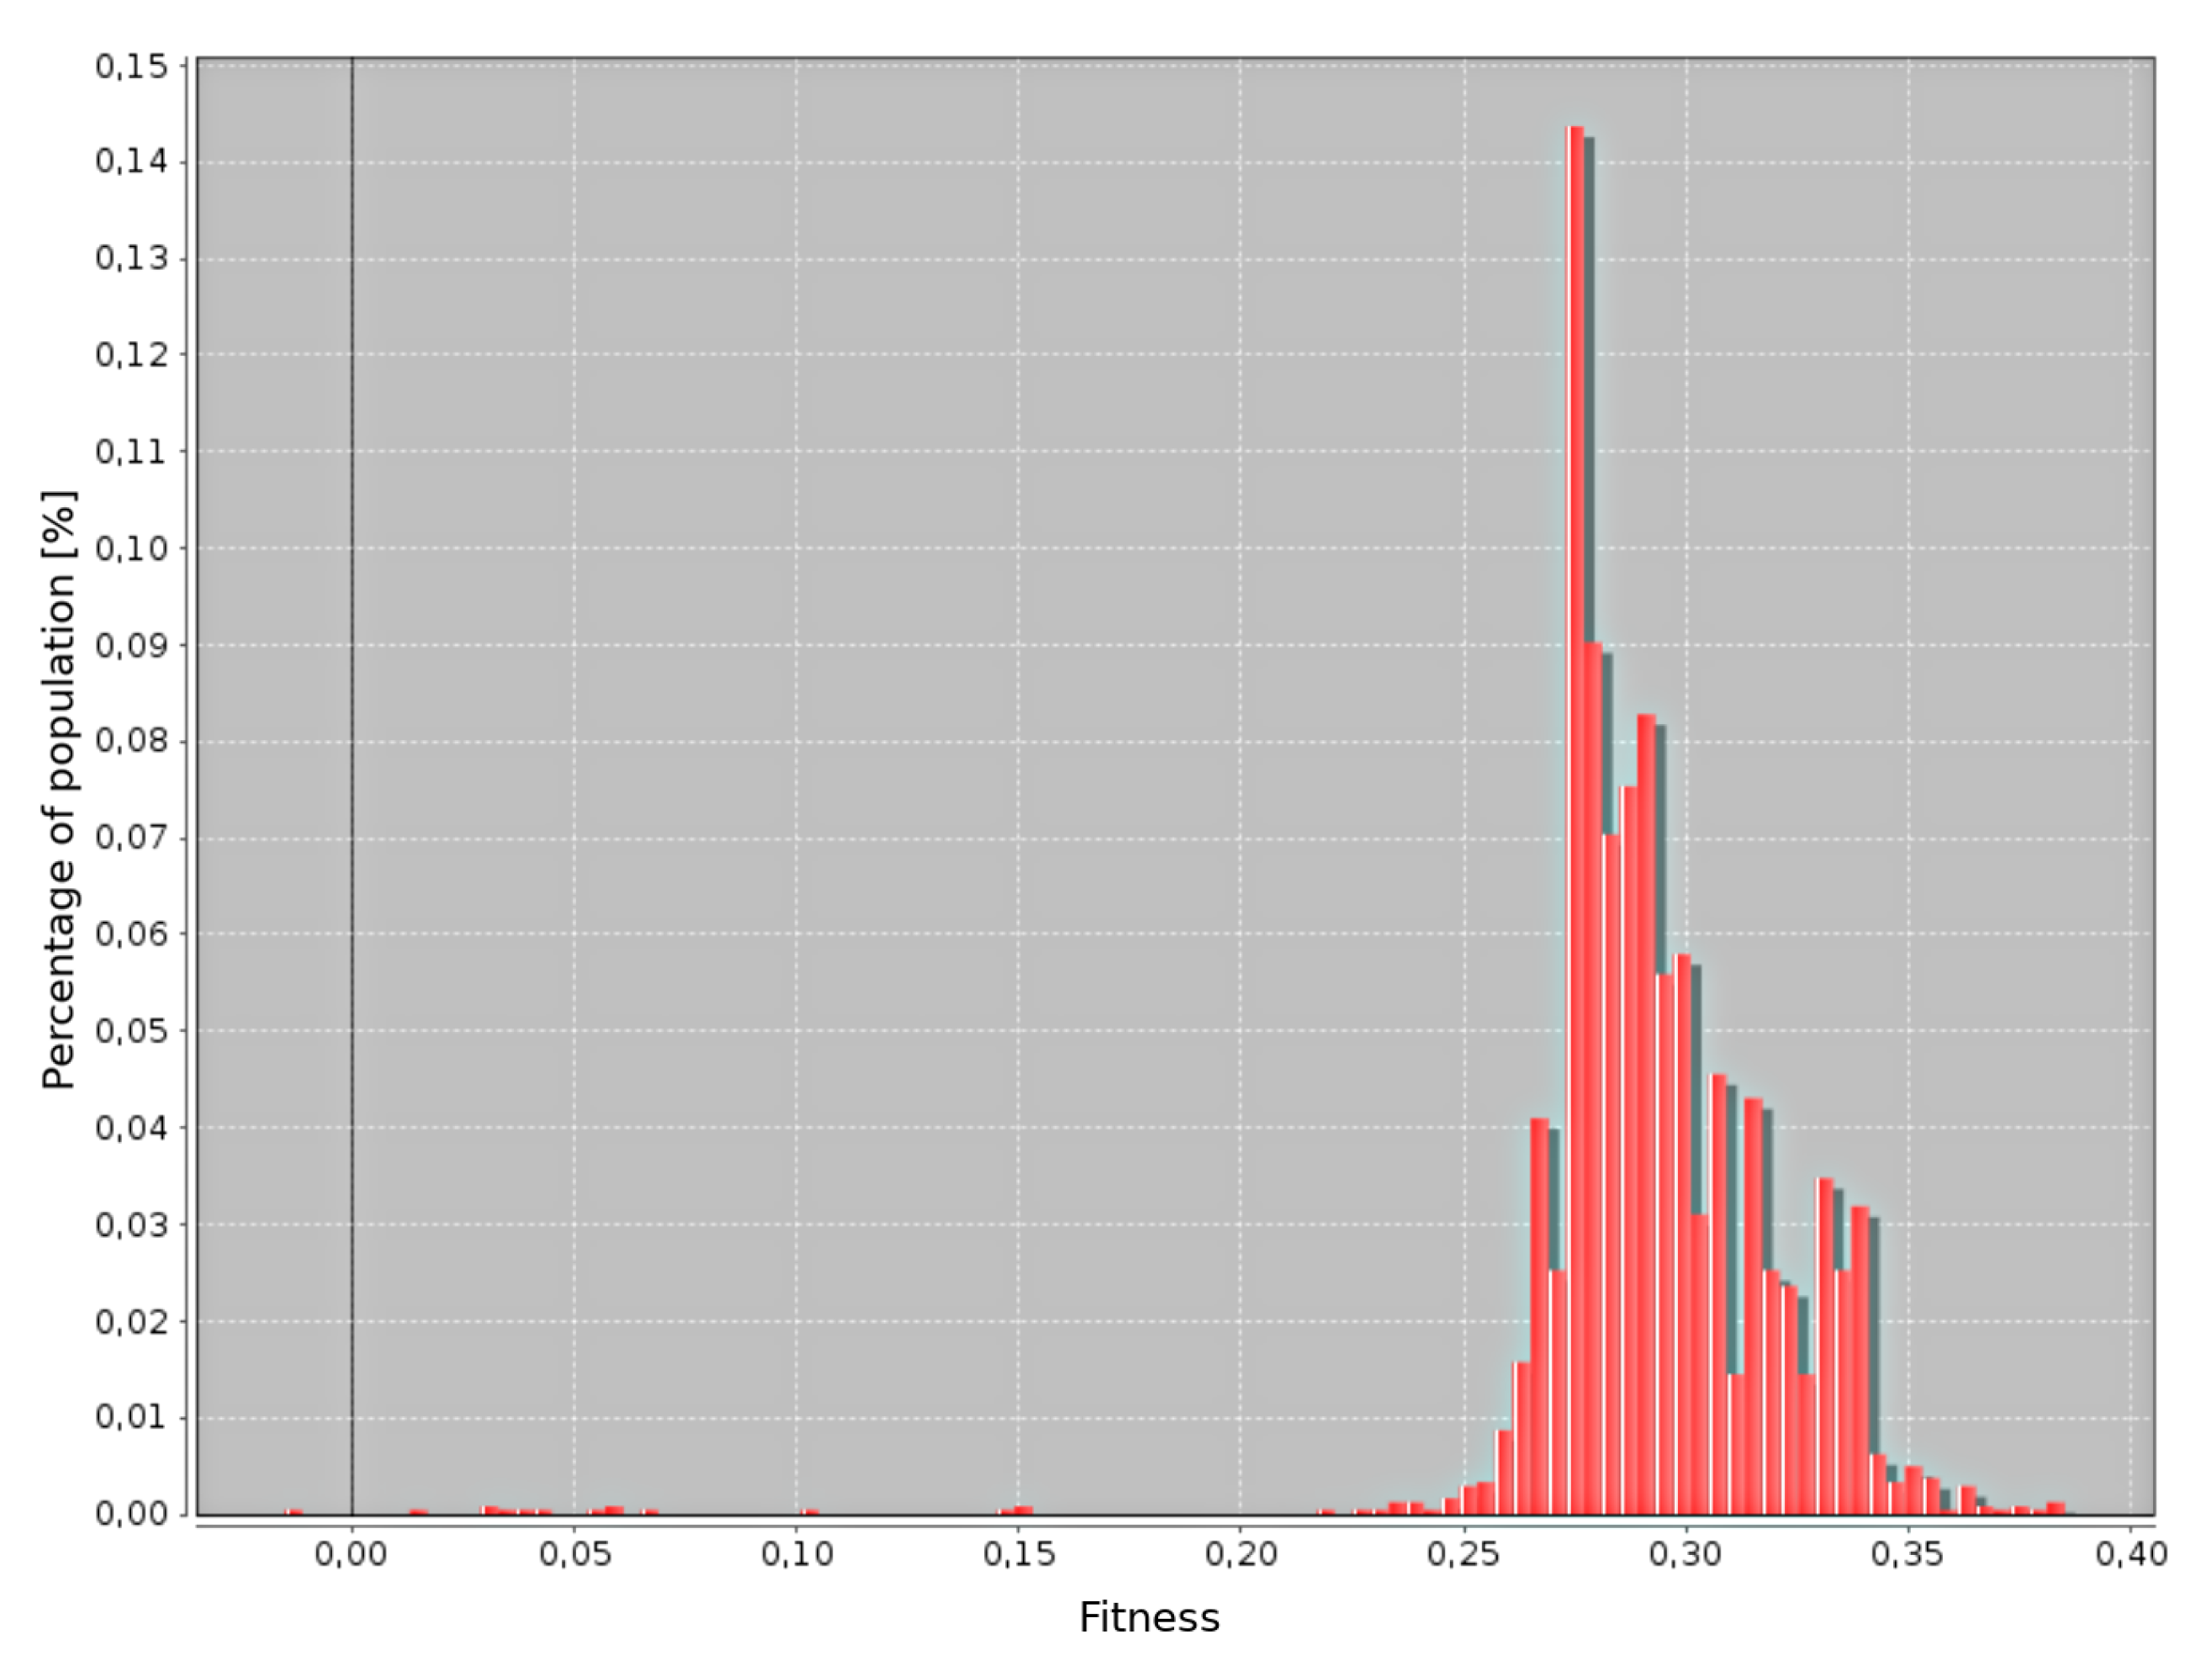
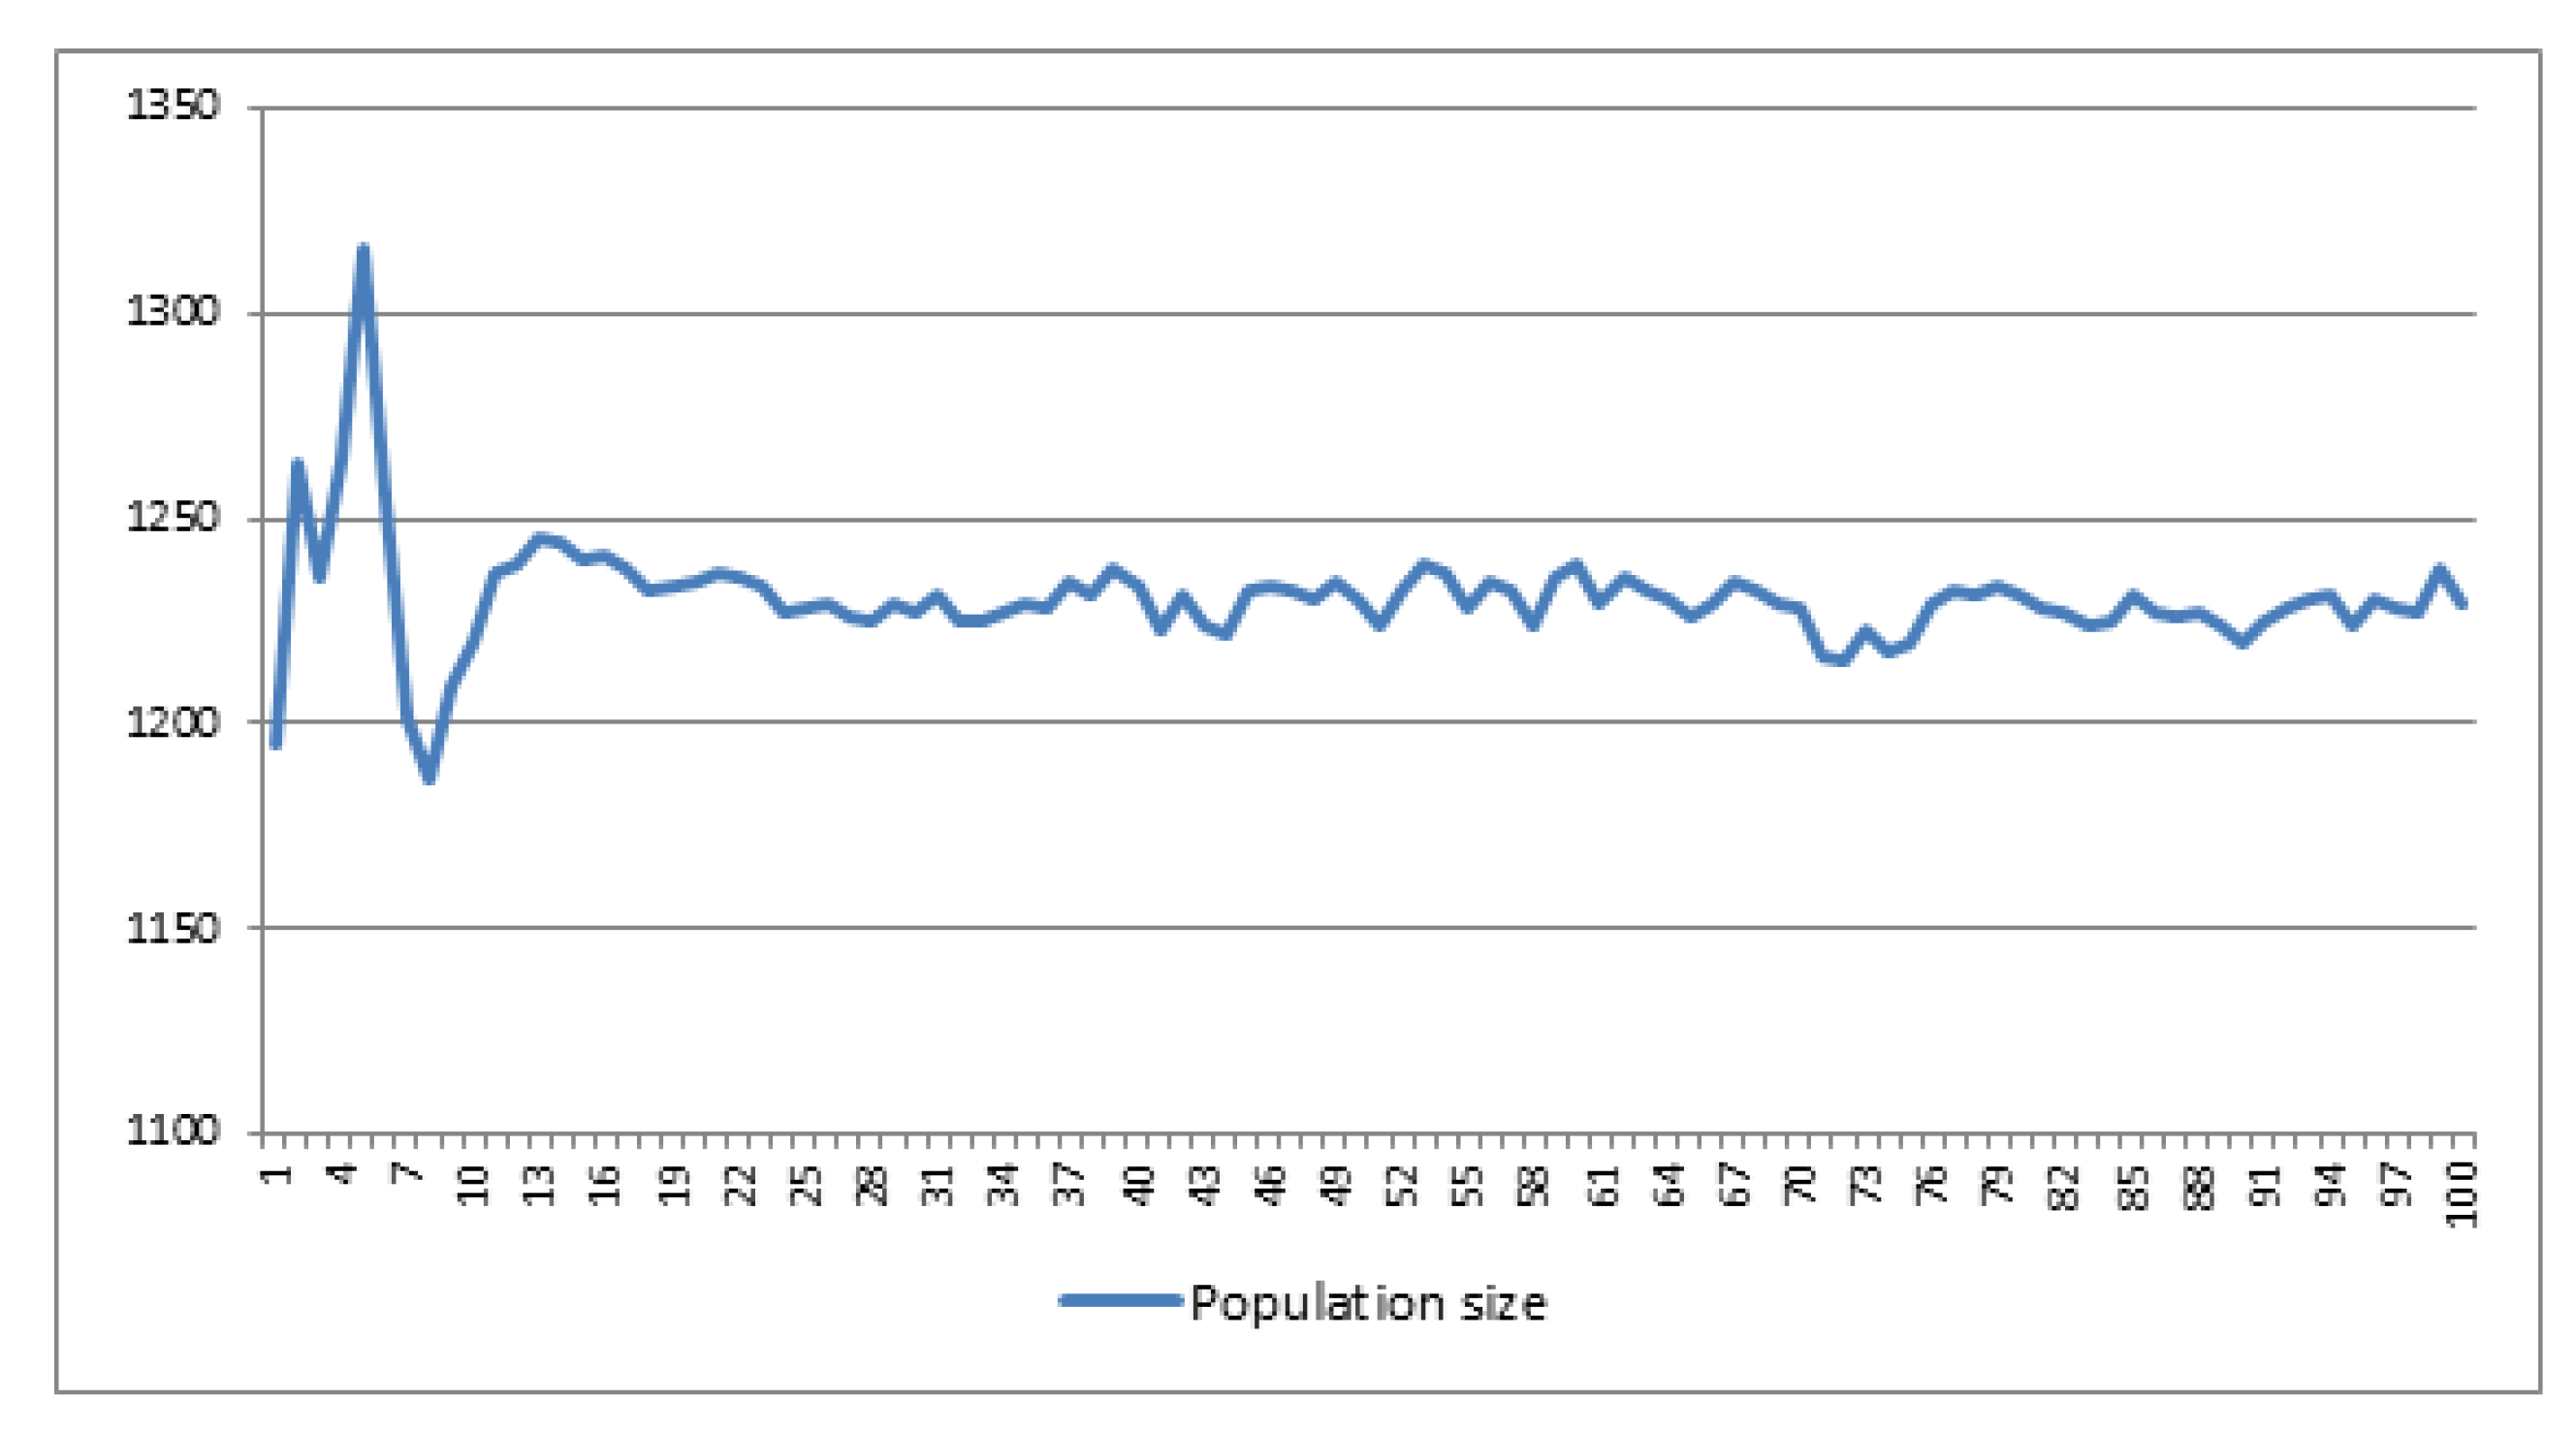
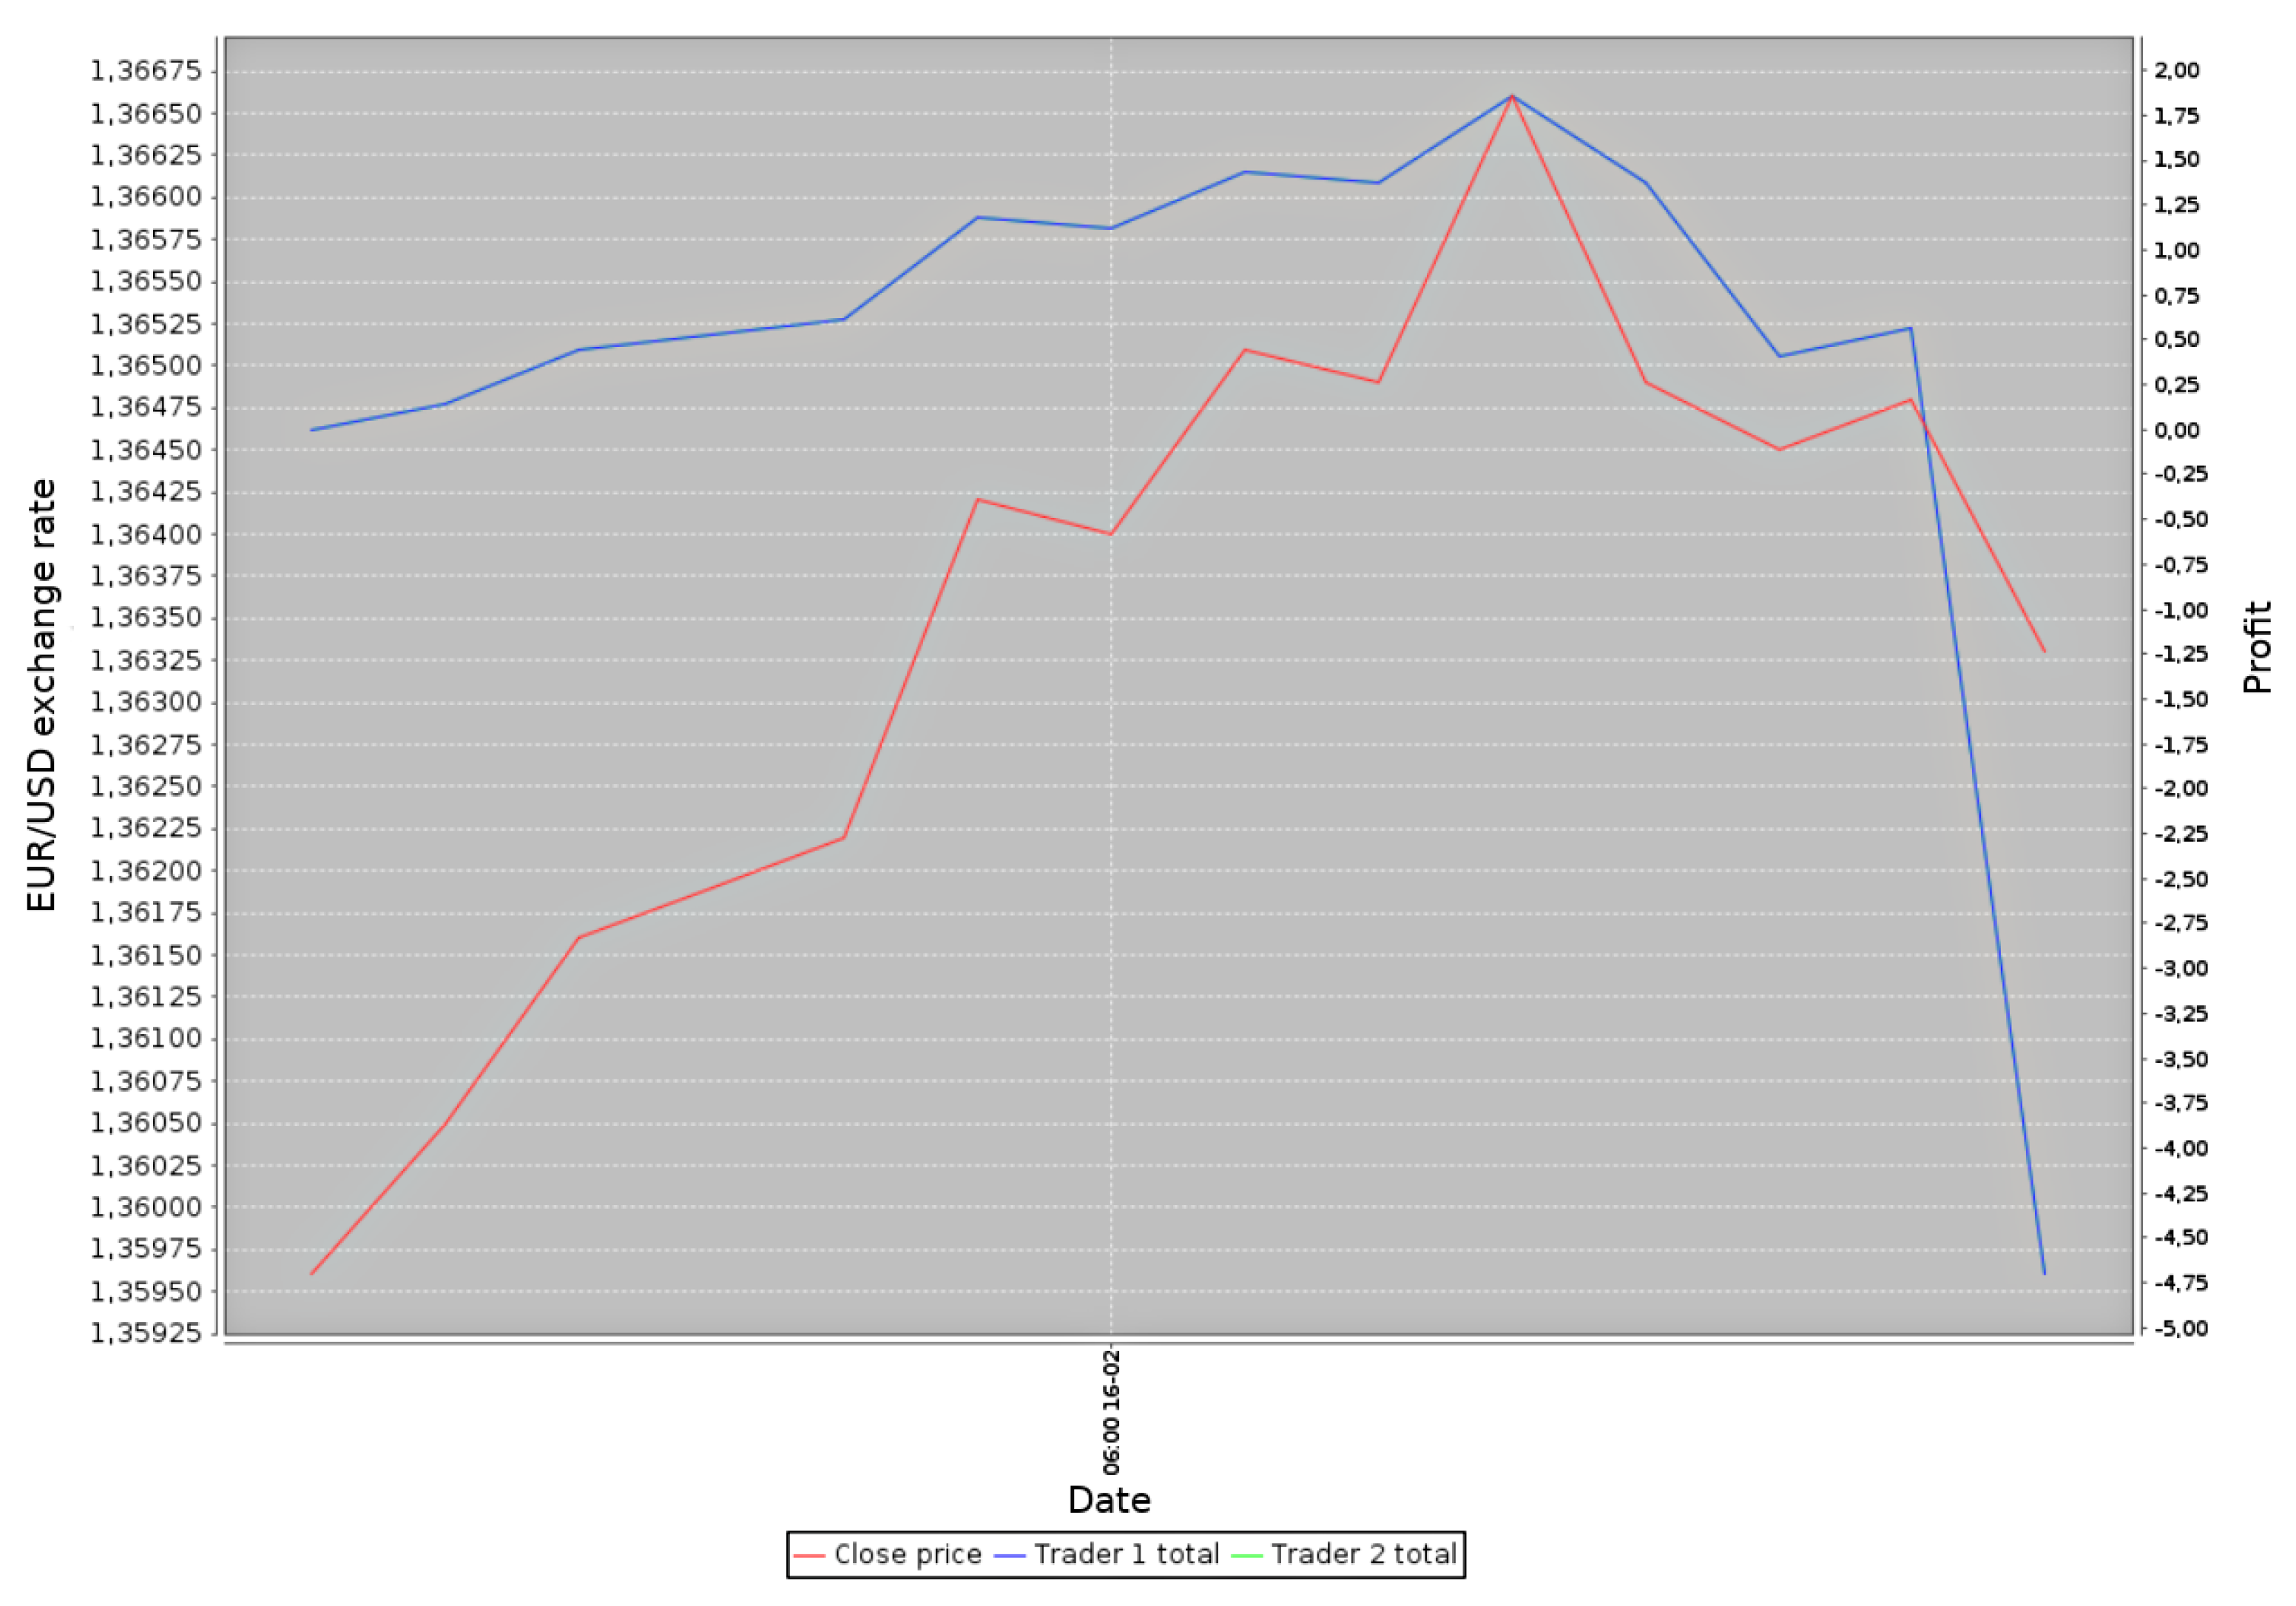
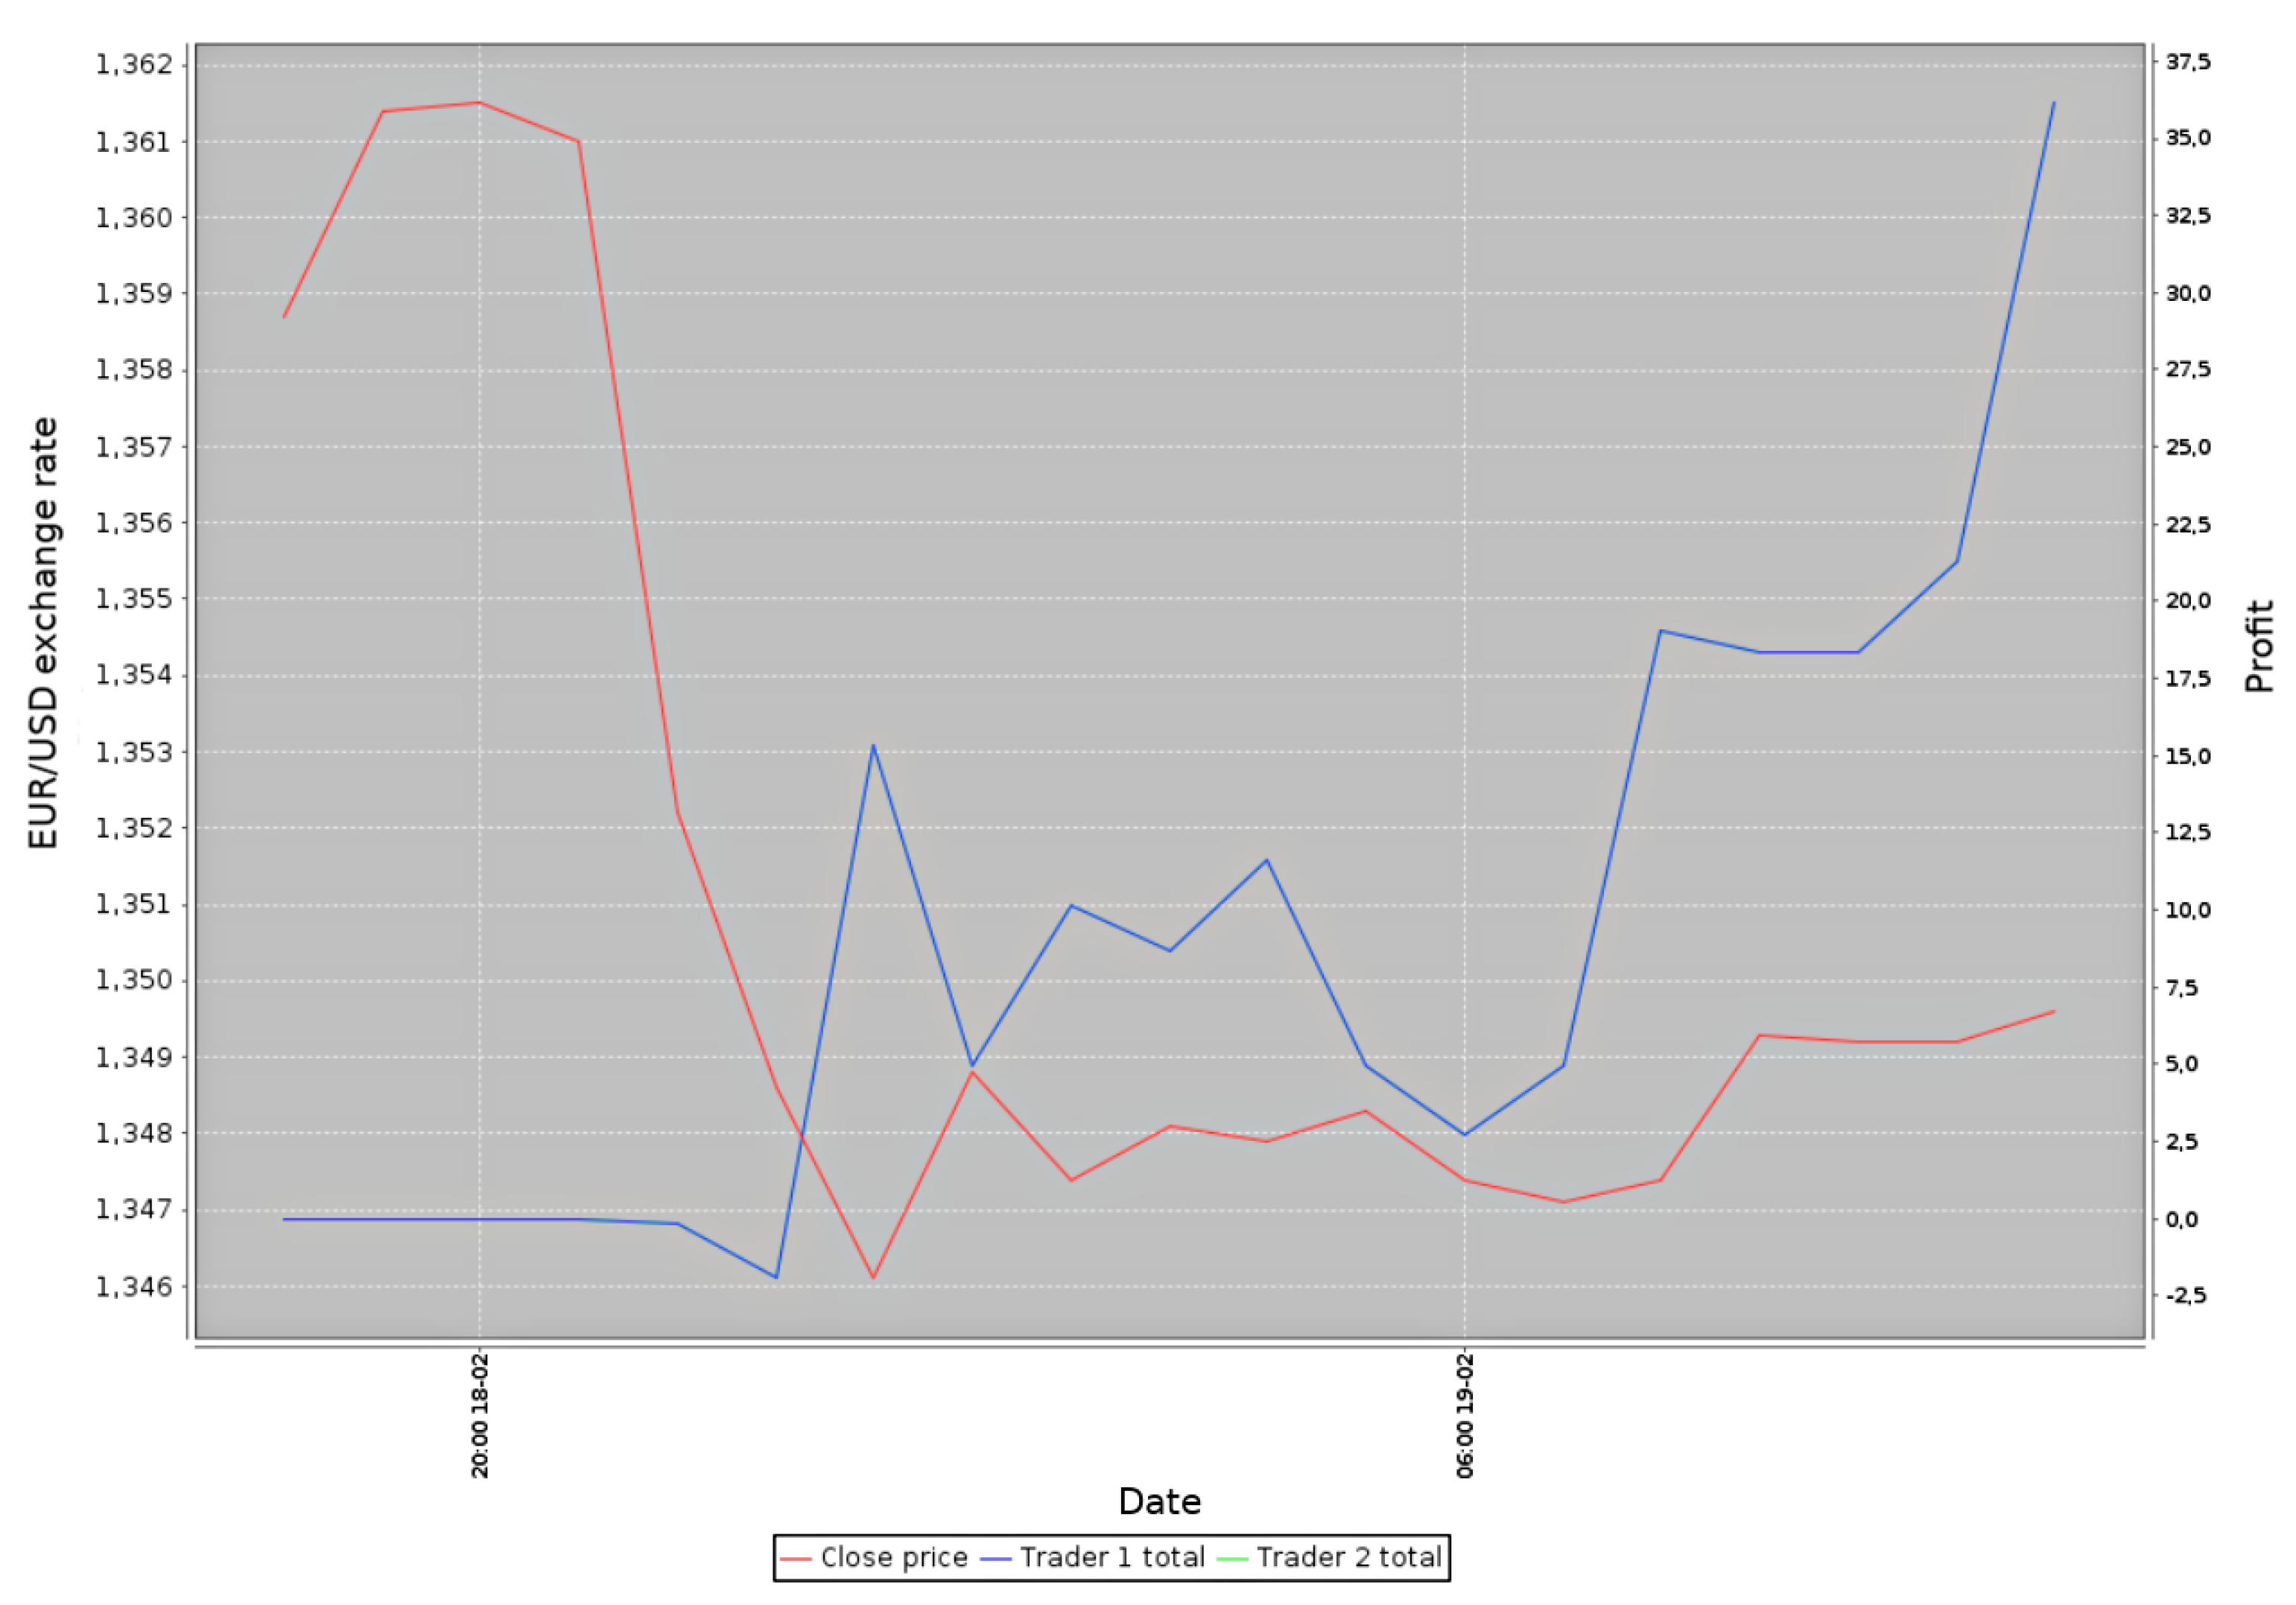
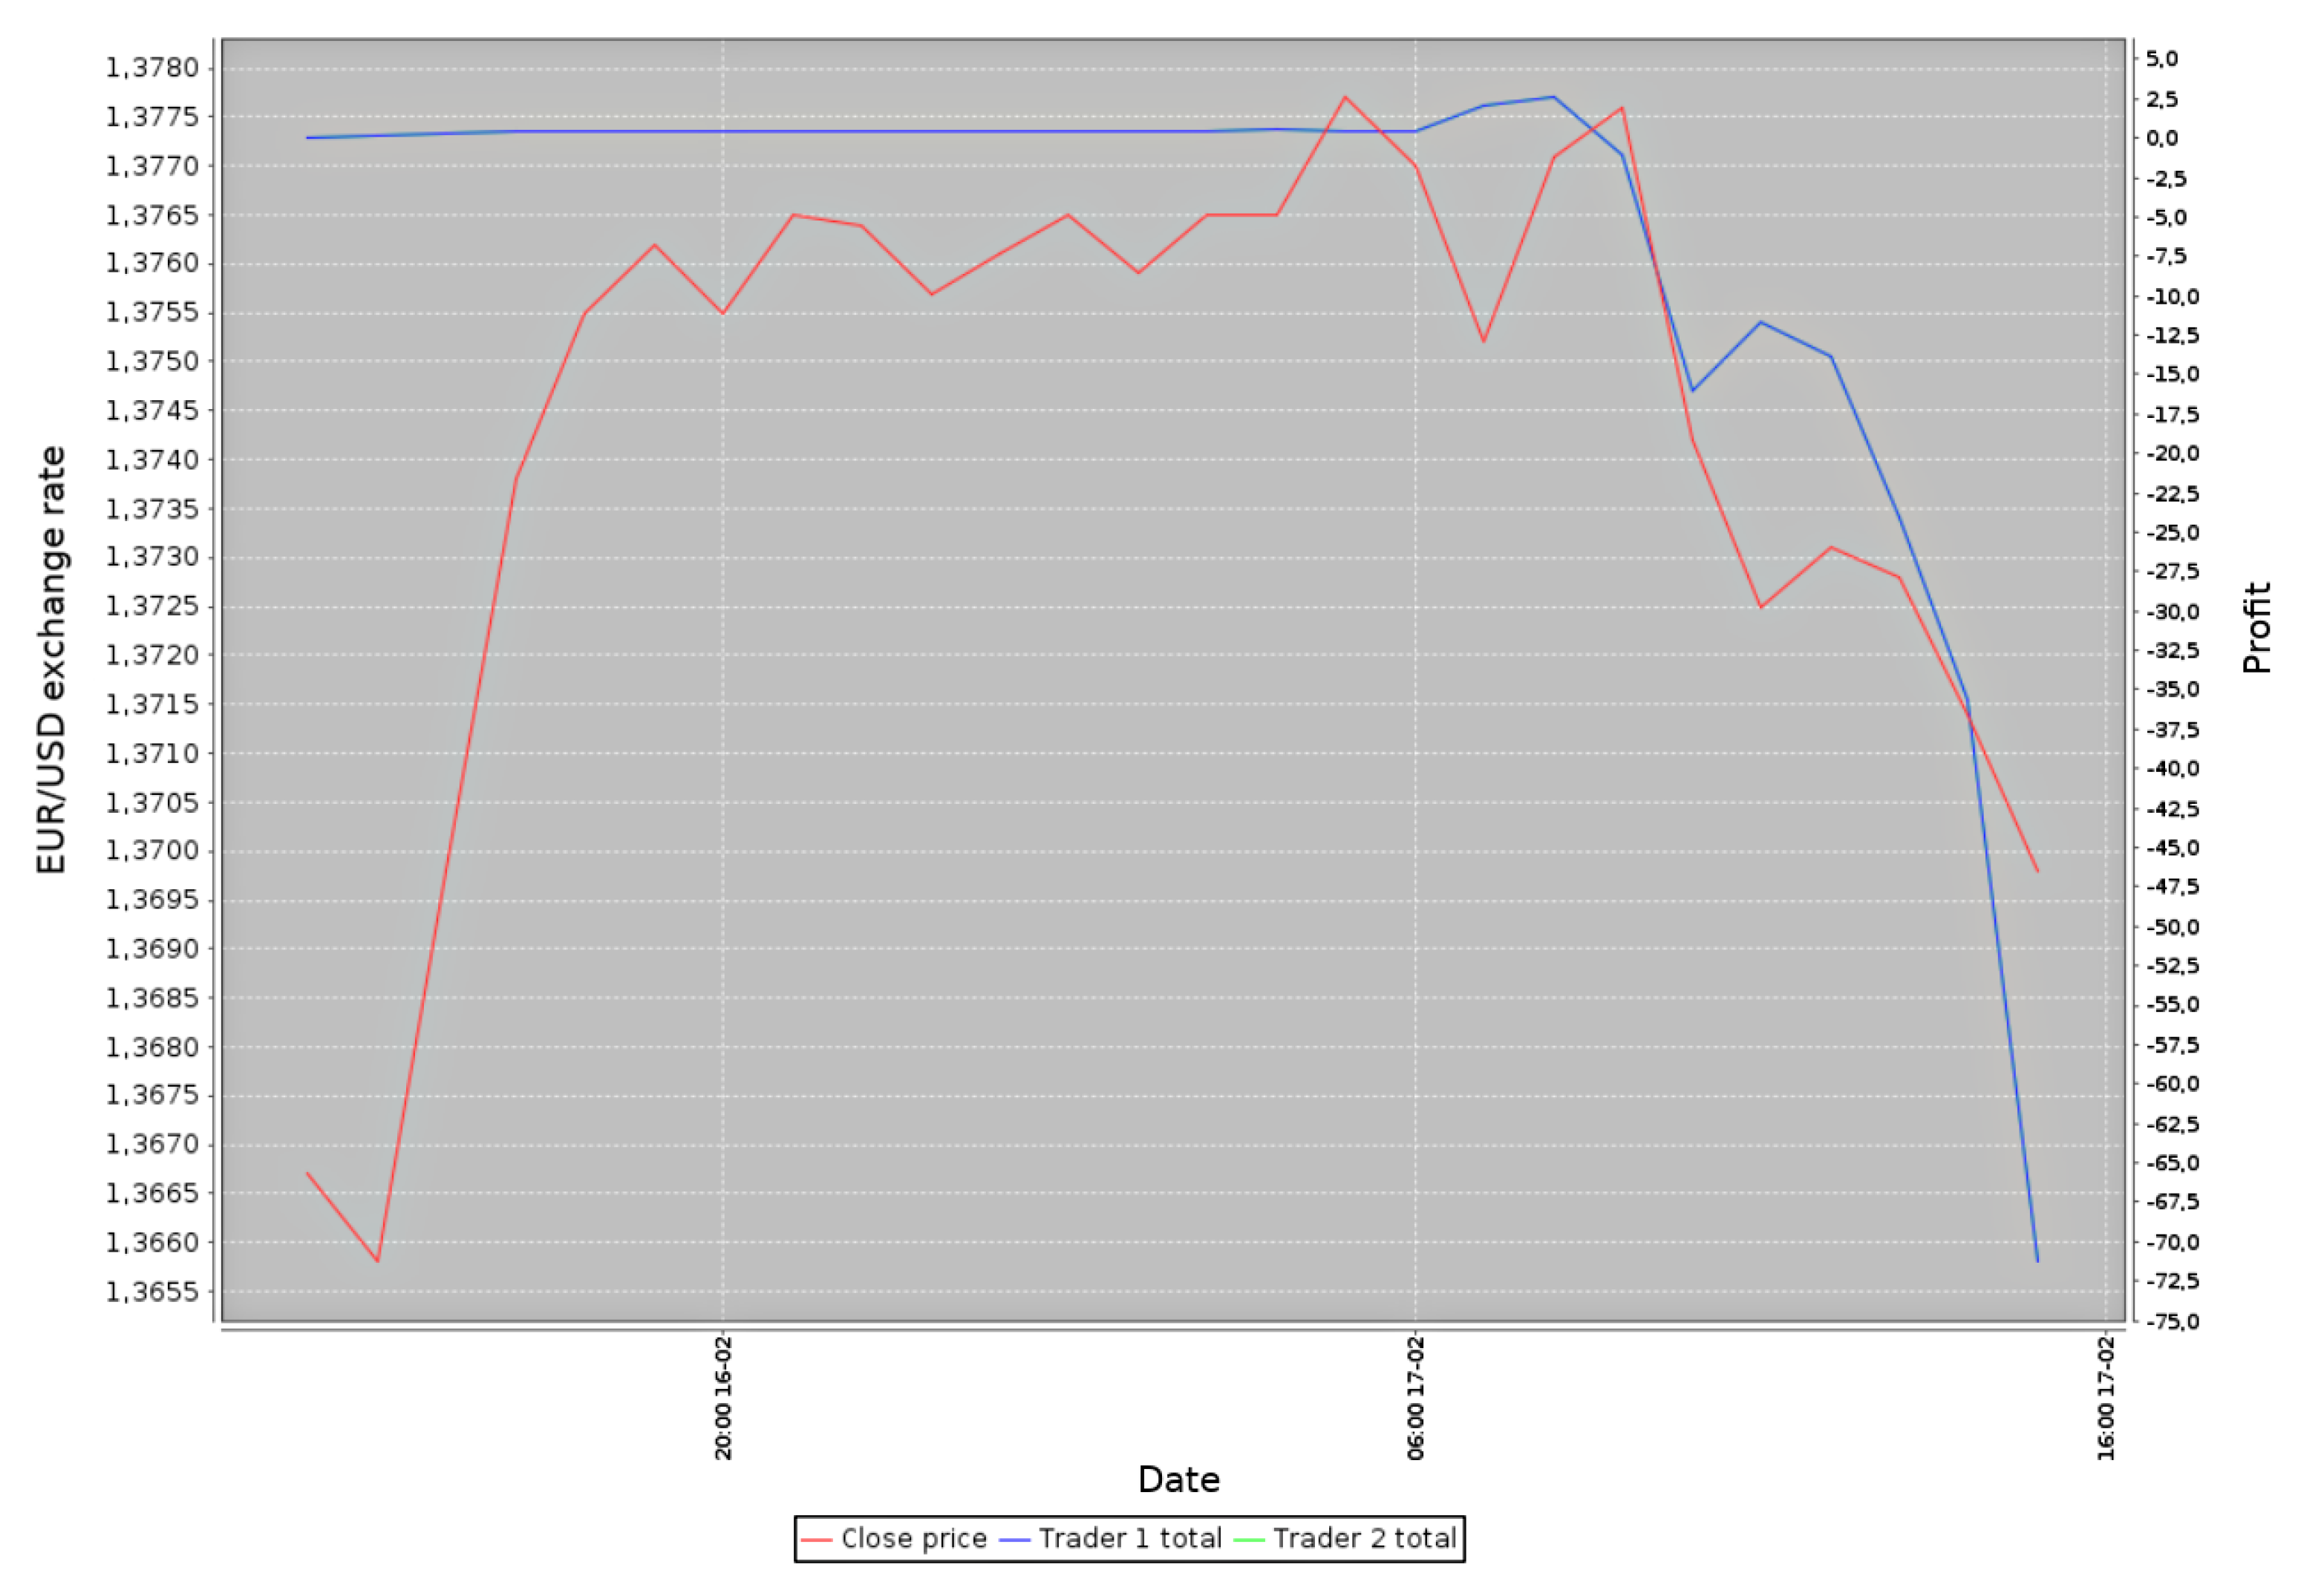
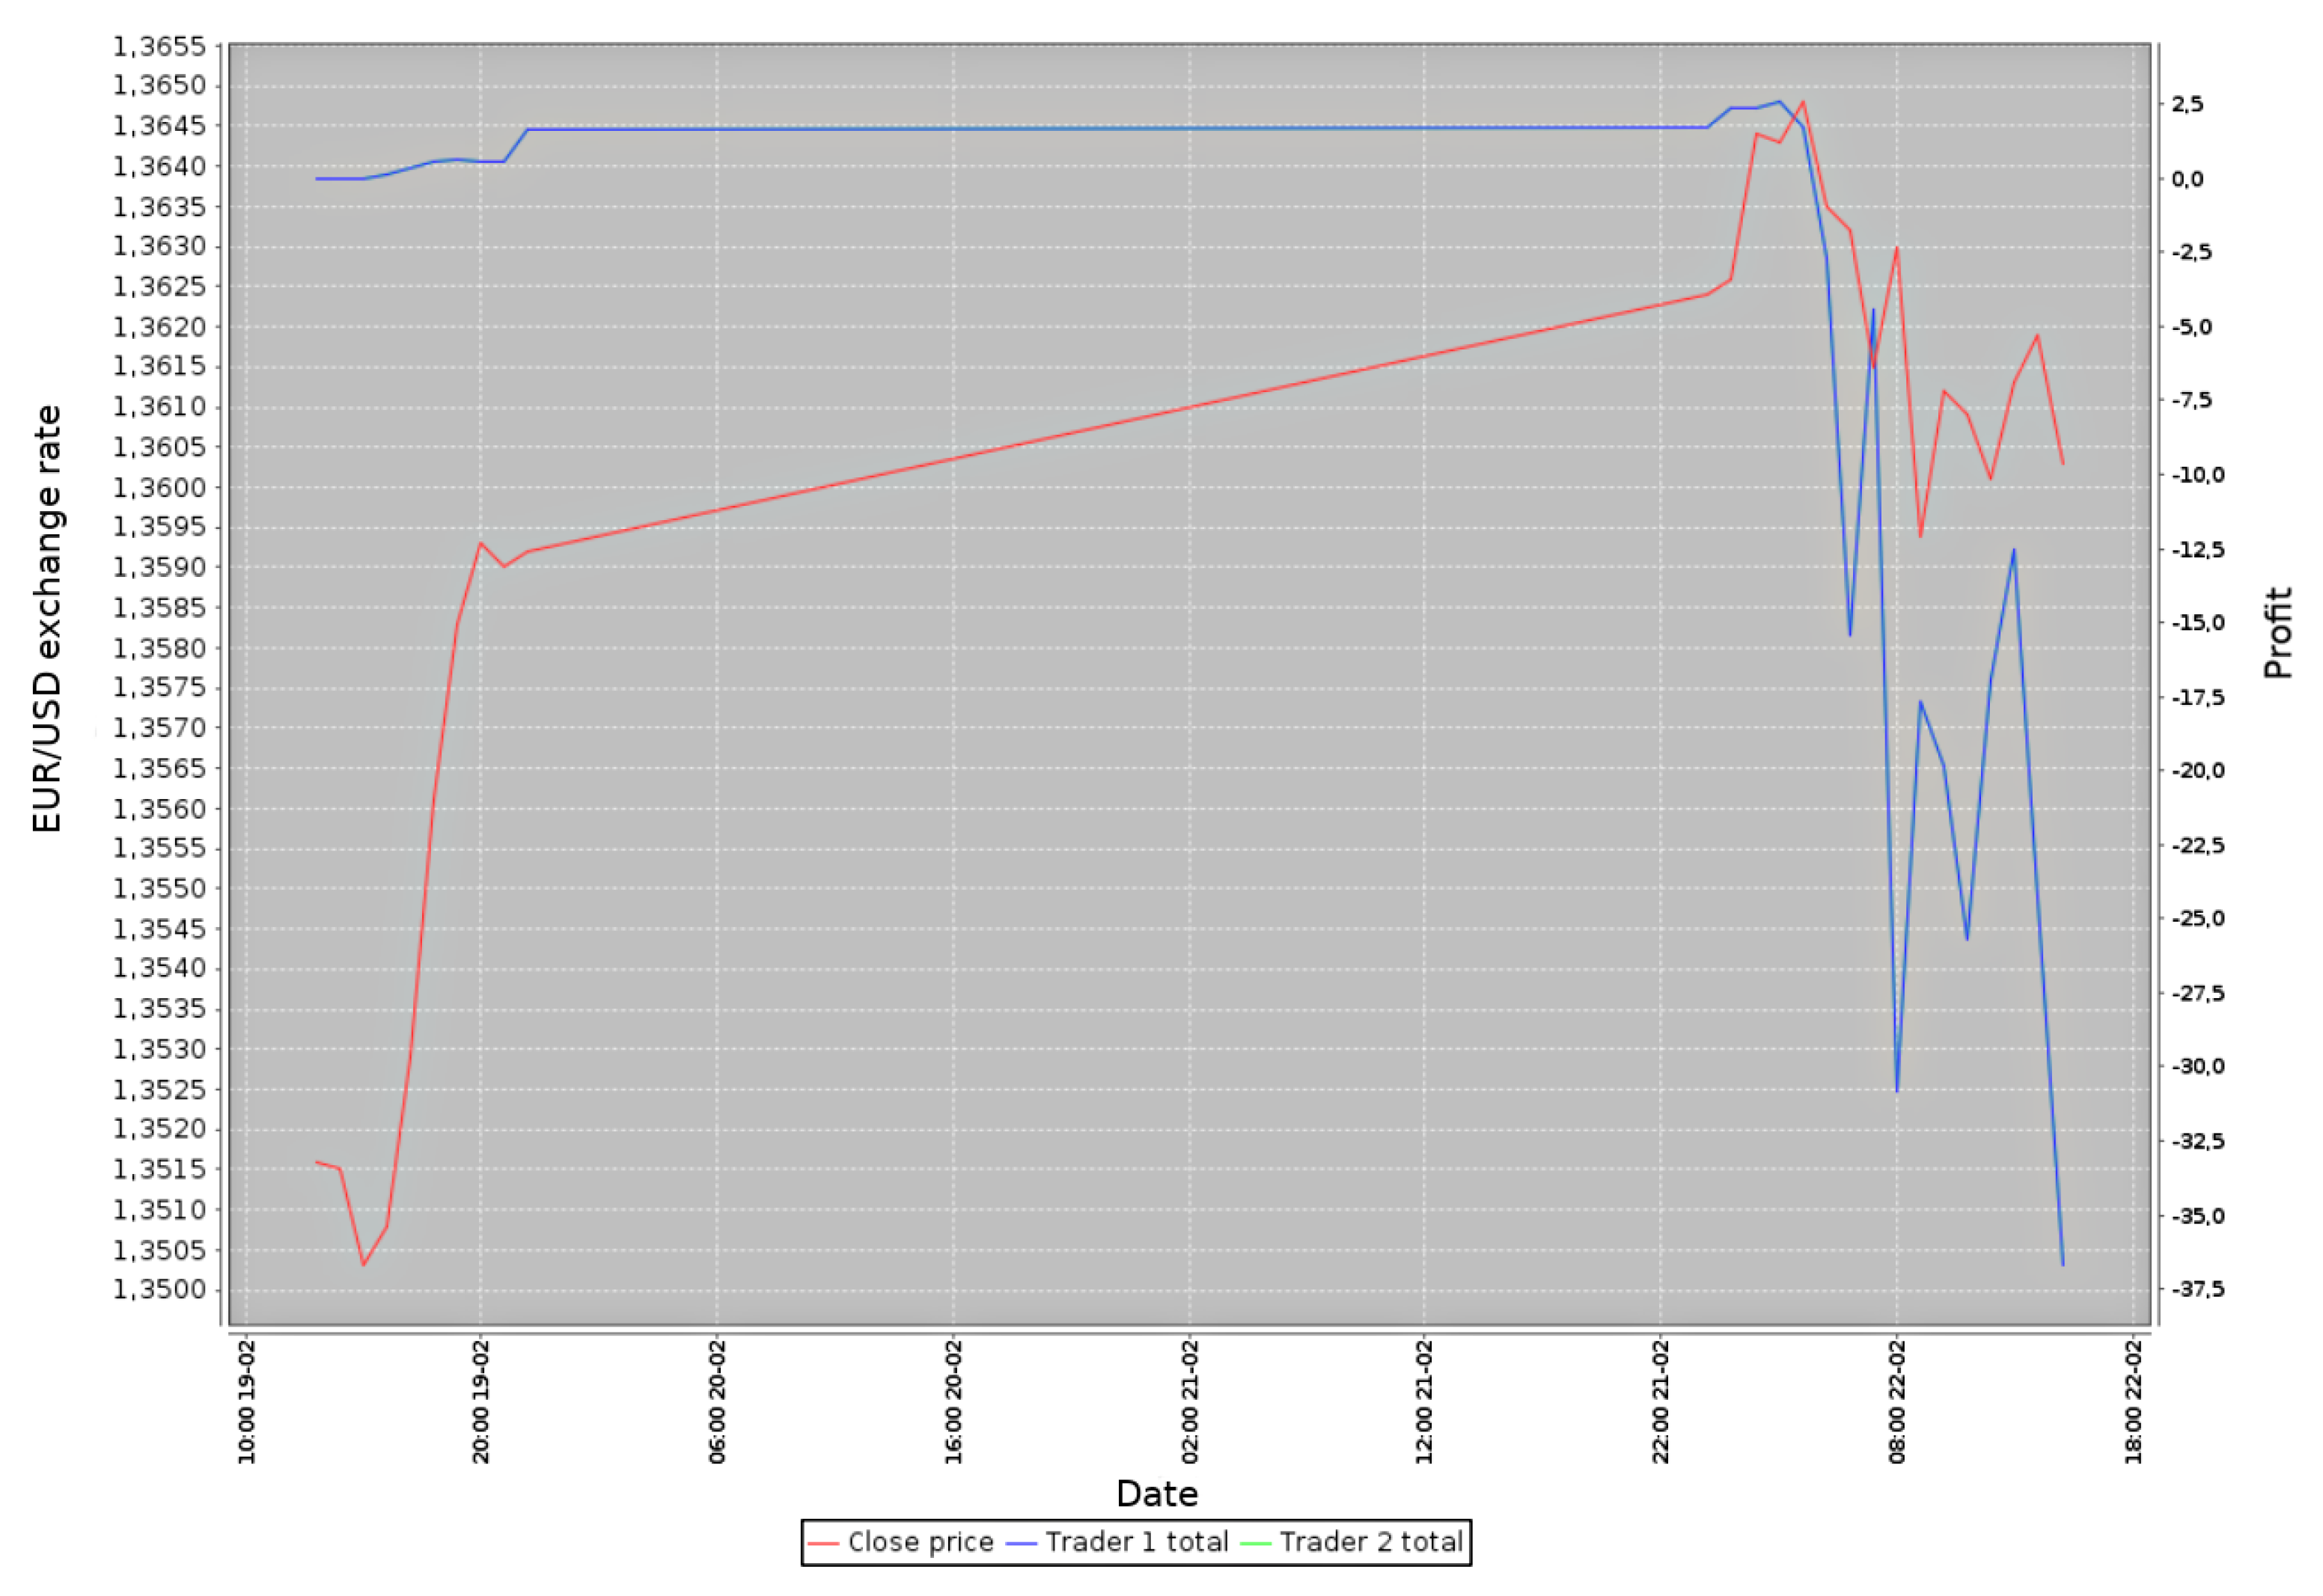
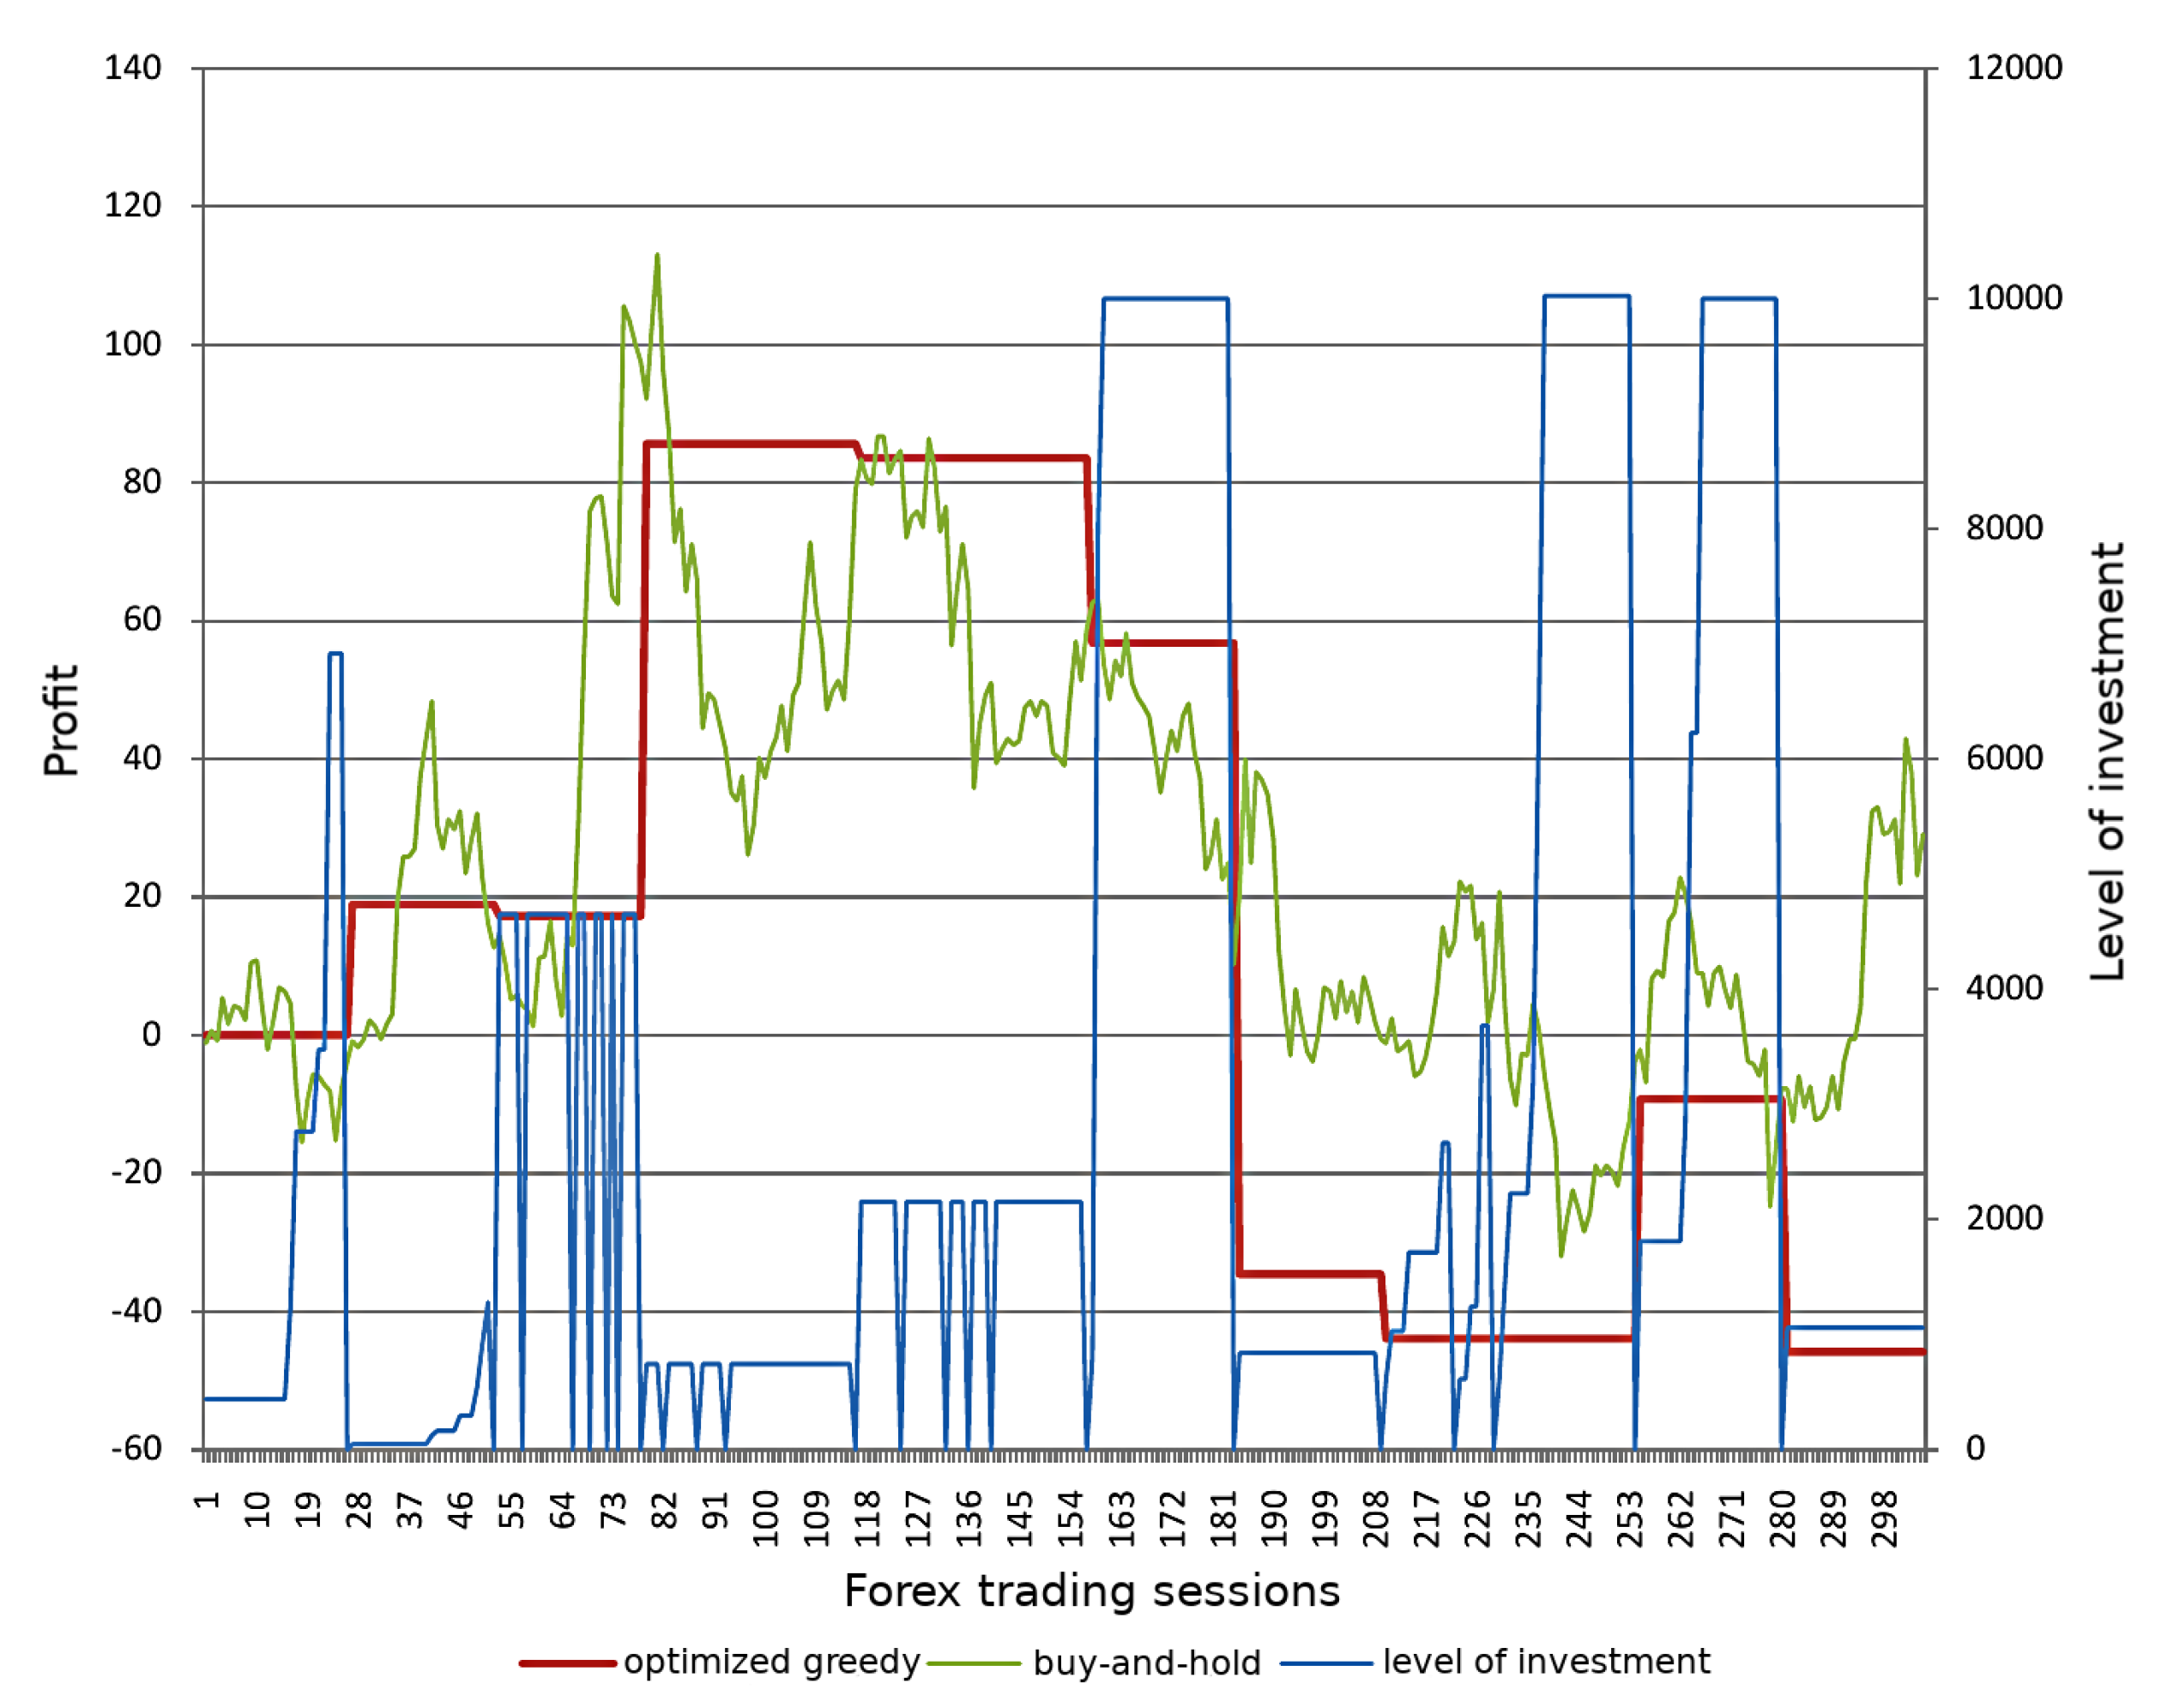