Multi-Criteria Evaluation of Irrigated Agriculture Suitability to Achieve Food Security in an Arid Environment

 ,
,
Abstract
:1. Introduction
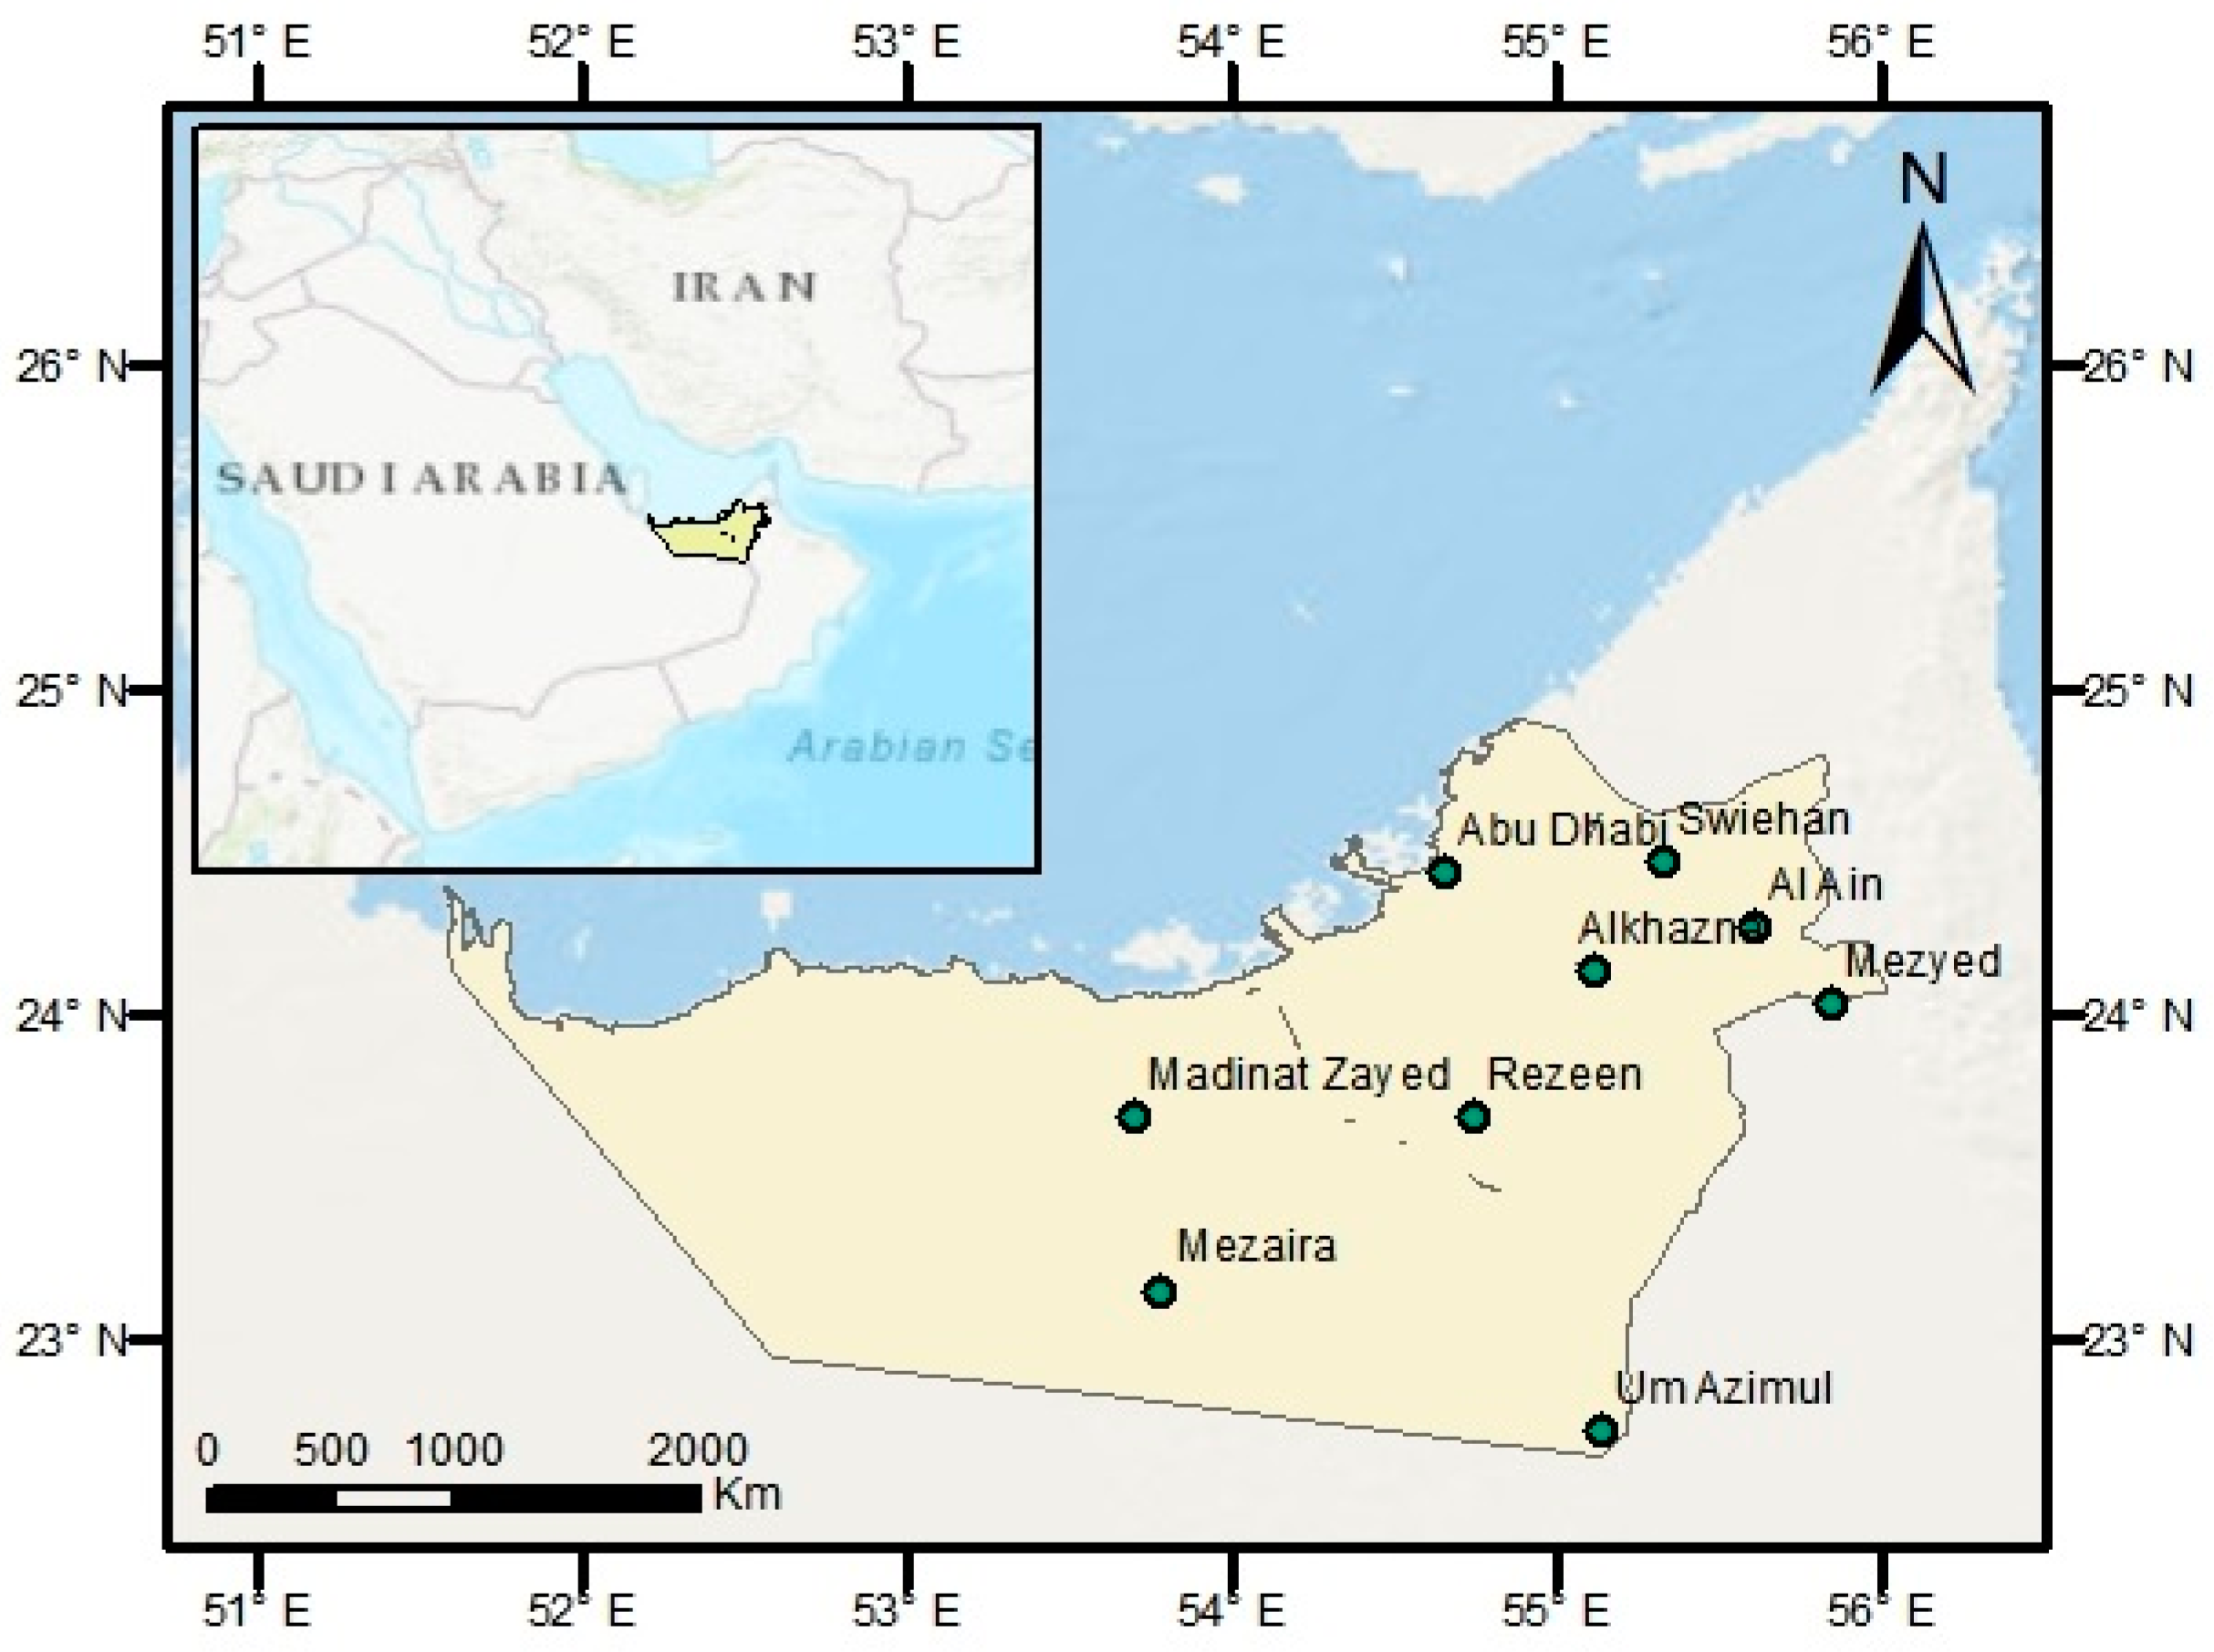
1.1. Study Area
1.2. Datasets Sources and Processing
2. Methodology
2.1. Methods
2.1.1. Multi-Criteria Decision Making (MCDM)/AHP
- (a)
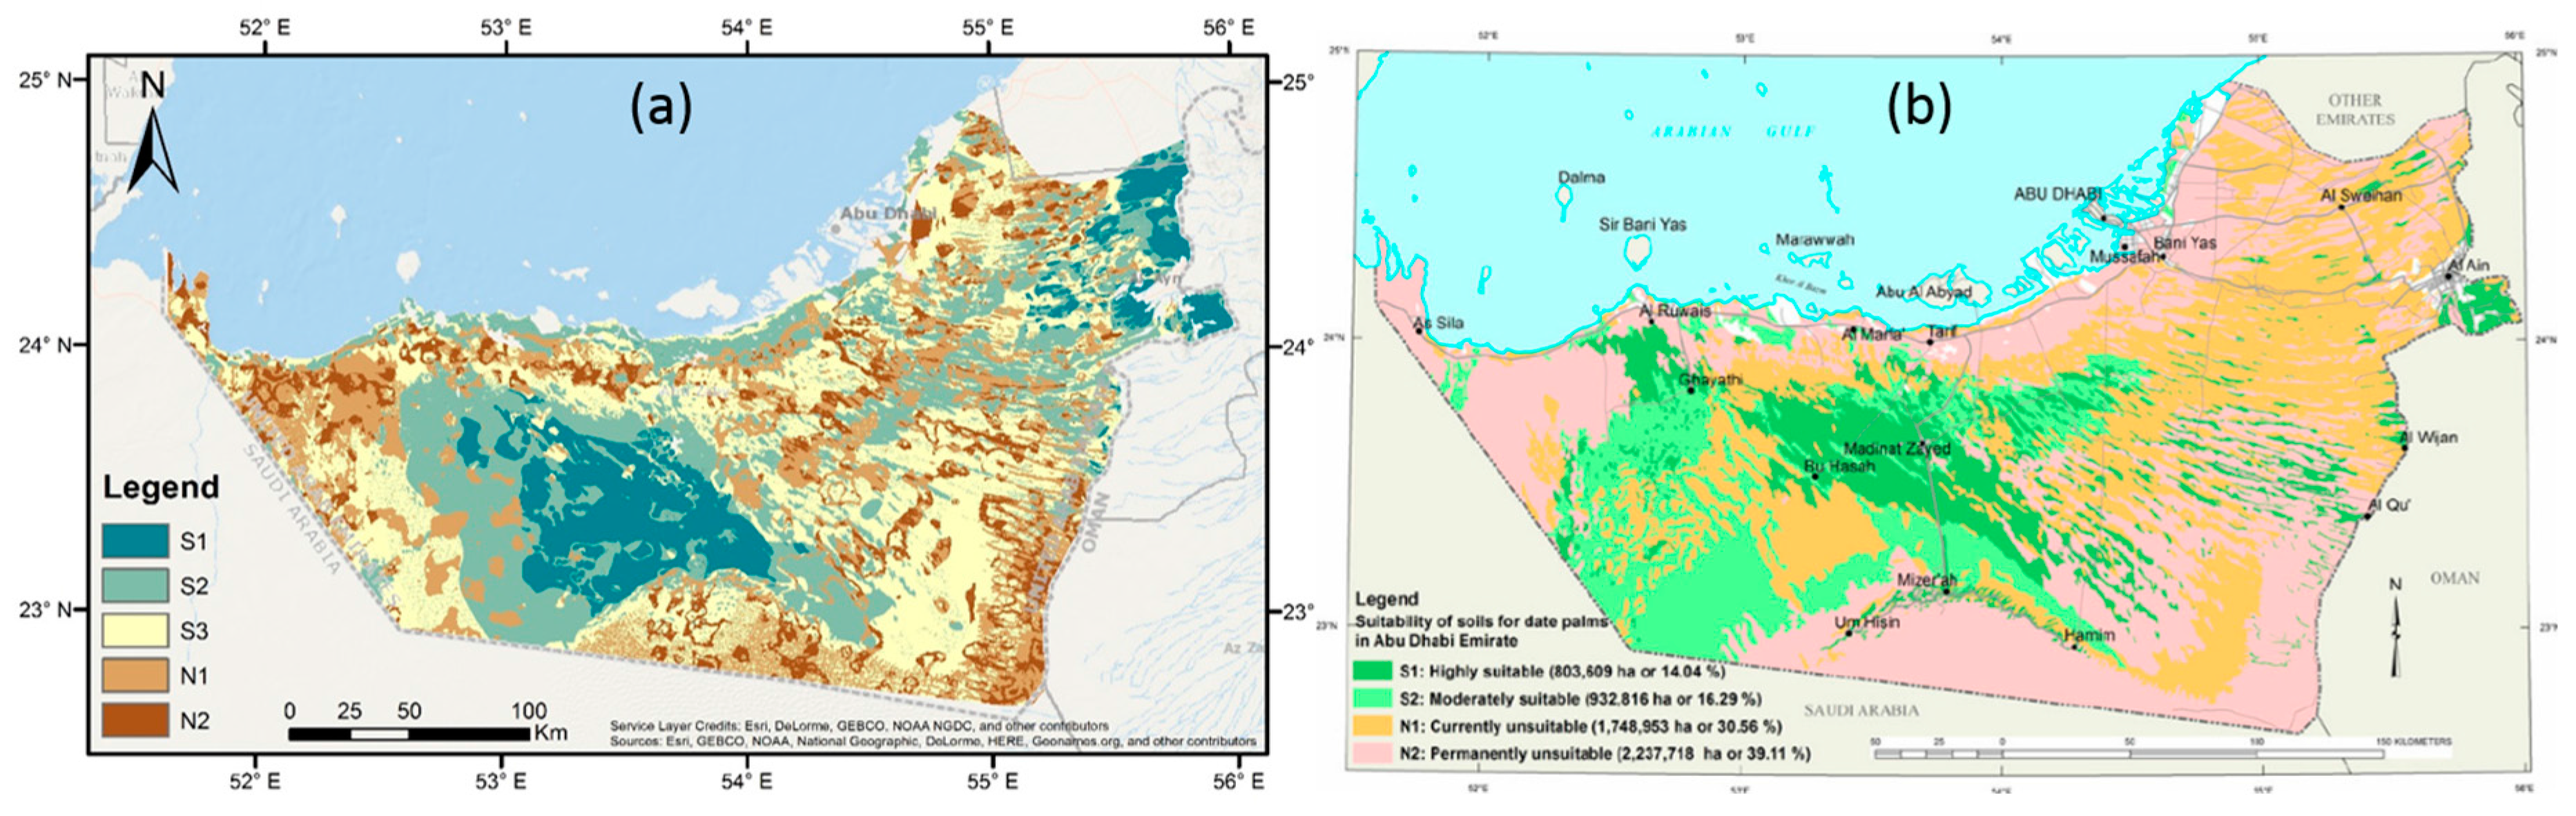
- Defining Land suitability classification. The commonly used land suitability classification approach is the “Framework for Land Evaluation” proposed by the Food and Agriculture Organization of the United Nations-FAO in the 1970s [72]. This classification is based on land characteristics mainly in relation to different crops and it categorizes land into five main classes as given in Table 2. They are stated as highly suitable (S1), moderately suitable (S2), marginally suitable (S3), currently unsuitable (N1) and permanently unsuitable (N2). The land suitability for irrigated agriculture in the Emirate is classified into five main categories ranging from most suitable to permanently unsuitable for irrigated agriculture based on eight different
- (b)
- Selection of evaluation criteria. Based on literature review, expert opinion, data availability and accessibility a set of 16 criteria was selected.
- (c)
- Selection of crops and criteria ranking. Various food crops such as date palms, tomatoes, cucumbers and other vegetables and fruits are grown in the UAE [73]. Most of the agriculture in the UAE involves dates, as it is one of the top cultivators in the world with over 40 million date palm trees [74]. Vegetable production is the second largest category at over 71 thousand tons [32]. In this study, in addition to dates palm, vegetables and fruits, cereals are also selected since this is a staple food crop [75] and are mostly imported from other countries. Based on its adaptive capacity to harsh environmental conditions and due to its liquid wax and oil in its seeds, it is widely used in the industrial sector in biodiesel fuel, as engine lubrication and for pharmaceutical compounds, jojoba was selected to be used on experimental basis in order to analyze its impacts on future climate scenarios. Jojoba (Simmondsia Chinensis) is a member of the family Simmondsiaceae, genus Simmondsia [76]. The plant is very well adapted to the harsh desert environment and is capable of growing in very hot, very cold and very dry deserts. It can survive very low temperatures, down to −5 °C and very high, up to 50 °C. However, optimal growth requires a regular, if minimal irrigation. It is a shrub and typically grows to 1–2 m tall. The leaves have an oval shape, 2–4 cm long, usually thick, waxy and glaucous gray-green in color. It has small and greenish-yellow flowers, with 5–6 sepals and no petals. Jojoba blooms from March to May and is normally harvested by hand with an average yield of 3.5 tons/ha [77].
- (d)
- Defining the threshold value per criteria per crop. After defining the selected criteria and the crops, the threshold values for evaluation criteria in each of the five suitability classes per crop are determined based on literature review as shown in Table 3. This table is used later to create the criteria maps per crop. Then, all criteria and sub-criteria are assessed and classified into five main categories as follows: very critical, critical, important, preferable and optional in order to define their relative importance per crop. The results of assessing and classifying all criteria per crop presented in Table 4 were used to define the analytical hierarchical structure subsequently.
- (e)
- Defining the hierarchical structure and assessing the weights. In order to apply the AHP method the problem has to be structured hierarchically at all levels. According to Saaty [78], AHP constructs a rating scale associated with the priorities for the various items compared. This step includes four stages:
- (i)
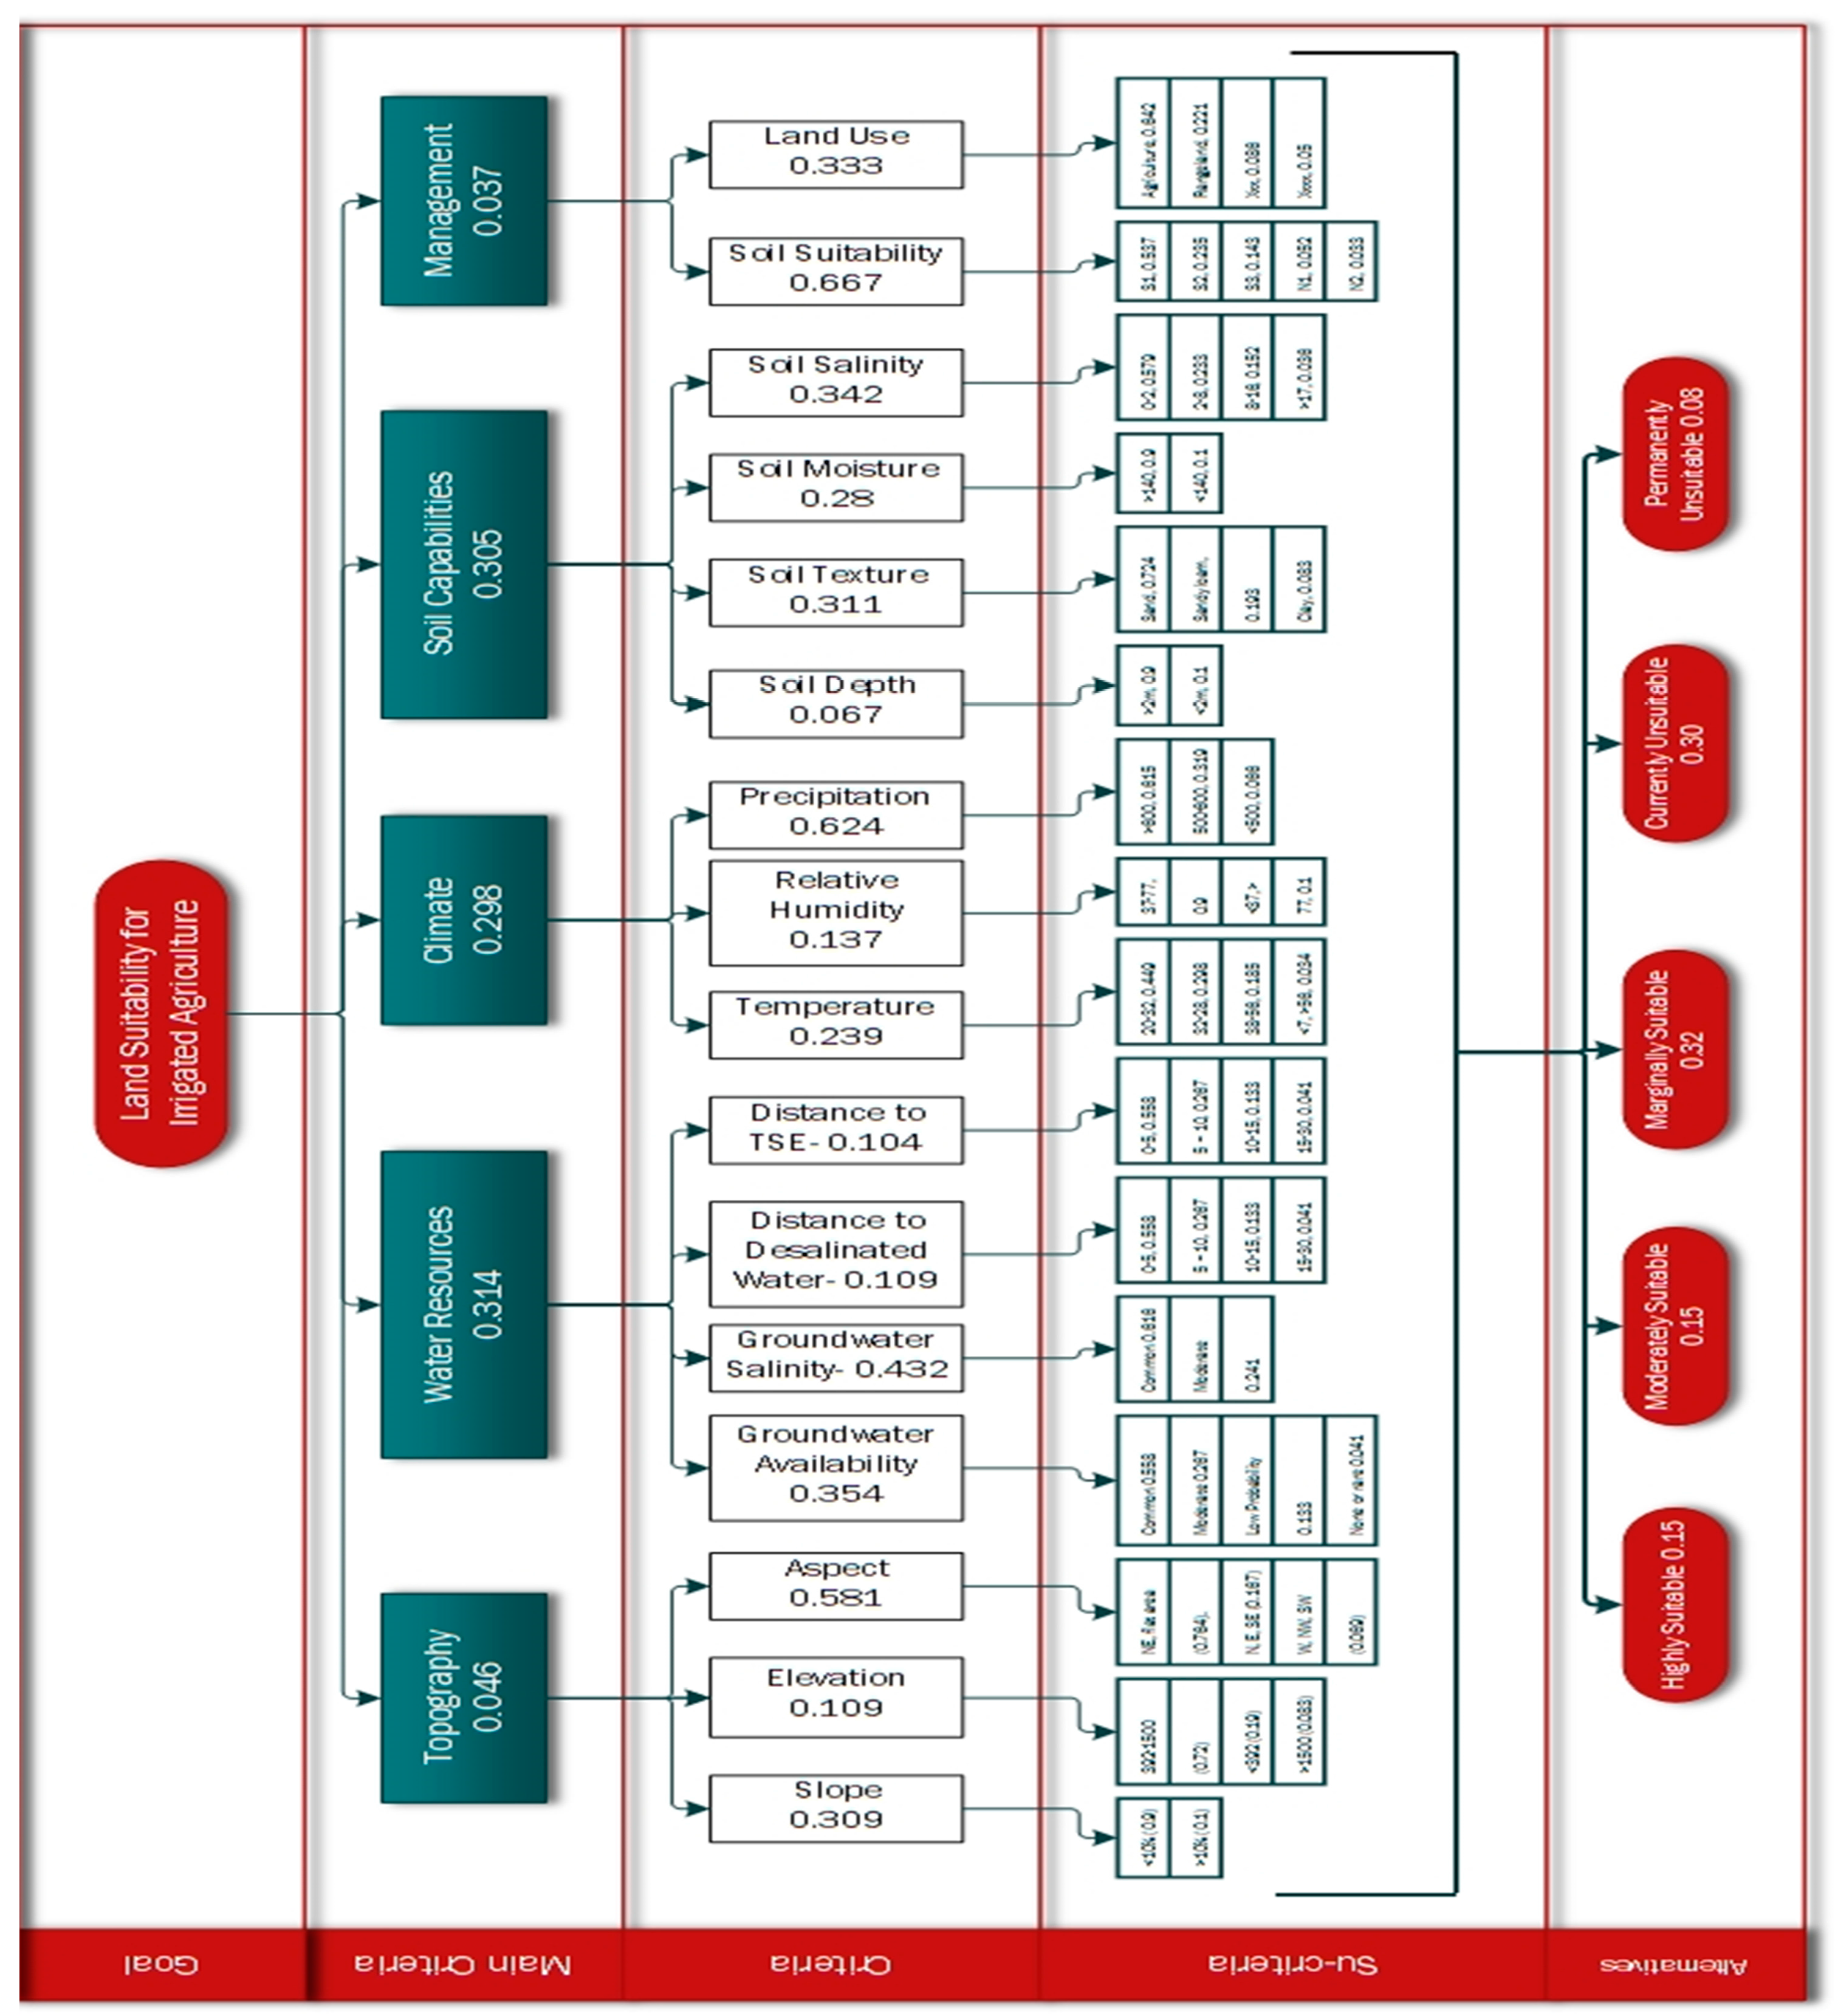
- Modeling Stage (constructing hierarchy): A hierarchical structure is built as a decomposition structure that includes main criteria, criteria and sub-criteria to be used to define land suitability. At the main criteria level, the decomposition process consists of defining categories of the analyzed compound item. In total, five main criteria are defined: climate, water resources, land capability, topography and management. Then, the decomposition continues to define the criteria under each one of these five main criteria. For example, the climate main criterion is decomposed into averages of rainfall, temperature and relative humidity. The aim of decomposing the main criteria into criteria and then to sub-criteria is to define those factors that are affecting land suitability which is quantifiable by a number of a specific value. For example, it is difficult to define a quantitative value or classify how the climate, in general, affects land suitability. However, when it is decomposed into rainfall, temperature and relative humidity, each of these criteria can be classified into sub-criteria that can be easily quantified to be used in subsequent evaluation steps presented in Table 3.
- (ii)
- Prioritization Stage (standardization of criteria): this step entails defining the numerical representation of the relationships between two elements that share the same parent. It starts by comparing each pair of criteria and sub-criteria using Saaty’s developed 9-point scale measurement, shown in Table 5, in order to express individual preferences [78]. This step eventually leads to the development of a square pairwise comparisons matrix, in which all elements are compared with themselves [79]. These comparisons allow independent evaluations of each factors’ contribution [80], thus helping to simplify the decision-making process [81]. This requires comprehensive knowledge and literature review to provide the best judgment of the relative intensity of importance of one evaluation factor against another. The input for this step is the pairwise comparison matrix A, of n criteria, using Saaty’s developed 9-point scale. It can be defined as follows:where A is the matrix with aij elements, i and j are the criteria or sub-criteria and aij = Wi/Wj for all i and j. The developed matrix has the property of reciprocity (Table 6) and can be mathematically expressed as [82]:A = [aij], i,j = 1, 2, 3, …, n;aij = 1/aji
- (iii)
- Assigning weights: defining of the criterion weights is a fundamental step in the MCDM/AHP process. The criterion weights are usually defined based on the overall goal of the study. The used AHP technique derives the weights by comparing their relative importance. Using the pairwise comparison matrix, the AHP calculates each criterion weights [83] using the Eigenvector corresponding to the largest eigenvalue of the matrix and then normalizing the sum of the components as shown in Equation (3):for each crop, three sets of pairwise matrices are formed as follows: 1 for the main criteria, 5 for the criteria and 16 for the sub-criteria. In total, 22 pairwise matrices are formed per crop. Based on these matrices, relative weights for main criteria, criteria and sub-criteria are derived.
- (iv)
- Matrix Consistency Check. It is critical to check the consistency of the matrices that are built. To do so, two figures should be calculated and checked. First, a consistency ratio [56] is calculated and used as an indicator of the degree of consistency or inconsistency. The largest eigenvalue of the matrix called (λmax) is always greater than, or equal to, the number of rows or columns (n). The second method is to calculate the consistency index (CI) which measures the consistency of pairwise comparison and can be calculated and written as [102]:where n is the number of elements being compared in the matrix, λmax is the largest eigenvalue of the matrix and CI is the consistency index. Then, the calculated CI is used to calculate the consistency ratio coefficient [56]. The calculated CR coefficient should be less than 10% which indicates the overall consistency of the pairwise comparison matrix [79].CI = (λmax − n)/(n − 1);where RI is the Random index developed by Saaty for different numbers of n as shown in Table 7. It provides the average of the resulting consistency index depending on the number of elements in the matrix [79]. If the calculated value of the CR is less than 10% (0.1), this means that the pairwise matrix has adequate consistency. If the CR value is greater than or equal to 10% then the AHP may not yield meaningful results and the pairwise matrix should be revised and changed to reduce the inconsistency below the 10% [79].CR = CI/RI;
2.1.2. GIS Data Processing
- (a)
- Land suitability model builder. ArcGIS is used to build a land suitability model. The GIS Model Builder function is used to organize and integrate all spatial processes to model the land suitability. The 16 different layers were integrated into the GIS environment as information layers and overlaid to produce overall land suitability assessment for a particular crop. The suitability analysis for the different criteria weights was integrated within the GIS Model Builder. Using the weights calculated using the AHP method; the ArcGIS system links the suitability results to the different shapefiles of the same area by area’s index. Each model operates in sixteen layers but with different weights per crop.
- (b)
- Combining land suitability rating using a GIS Overlay Function. After the weights associated with the criteria are calculated and the maps of these criterion weights are generated, the ArcGIS Weighted Overlay function, which is an intersection of standardized and differently weighted layers, is used to generate the unified final land suitability maps [54]. The weights present and quantify the importance of the suitability criteria considered in relation to each other. The suitability scores assigned for the sub-criteria within each criteria layer were multiplied with the weights assigned for each criterion and main criterion to calculate the suitability index and generate the final suitability map.
3. Results and Discussions
3.1. Output Maps for Land Suitability for Irrigated Agriculture
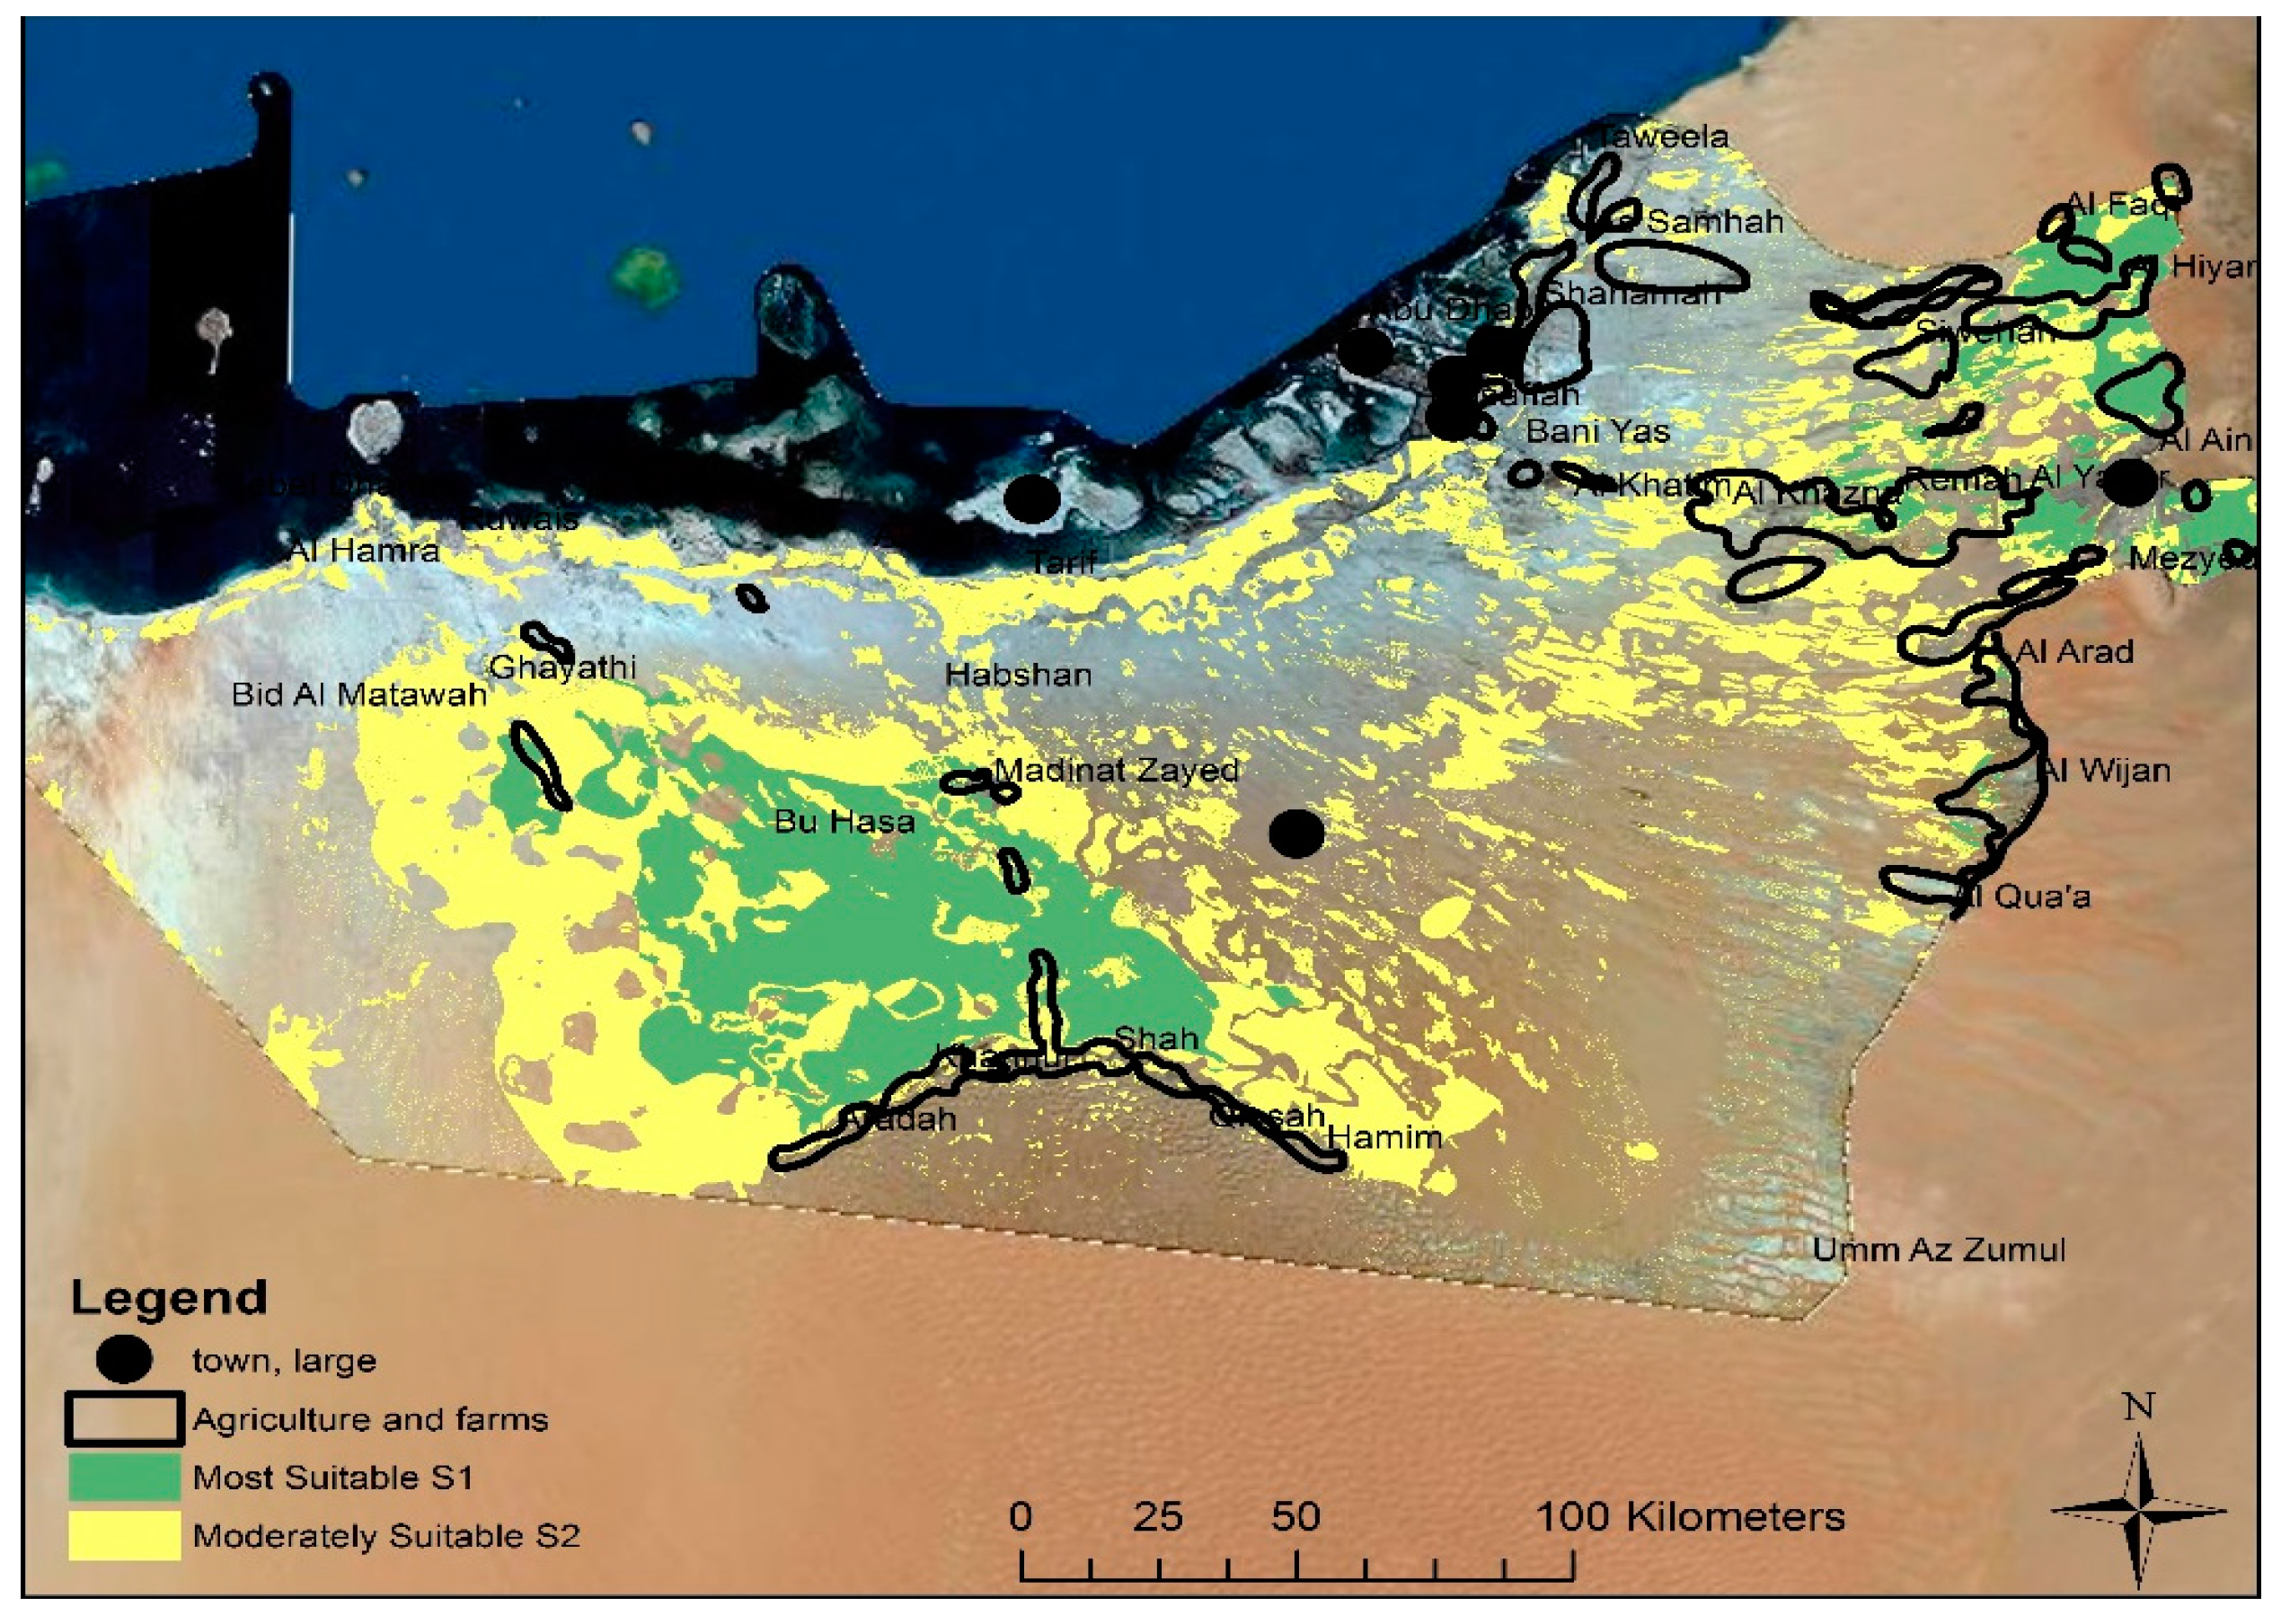
3.1.1. Date Palm
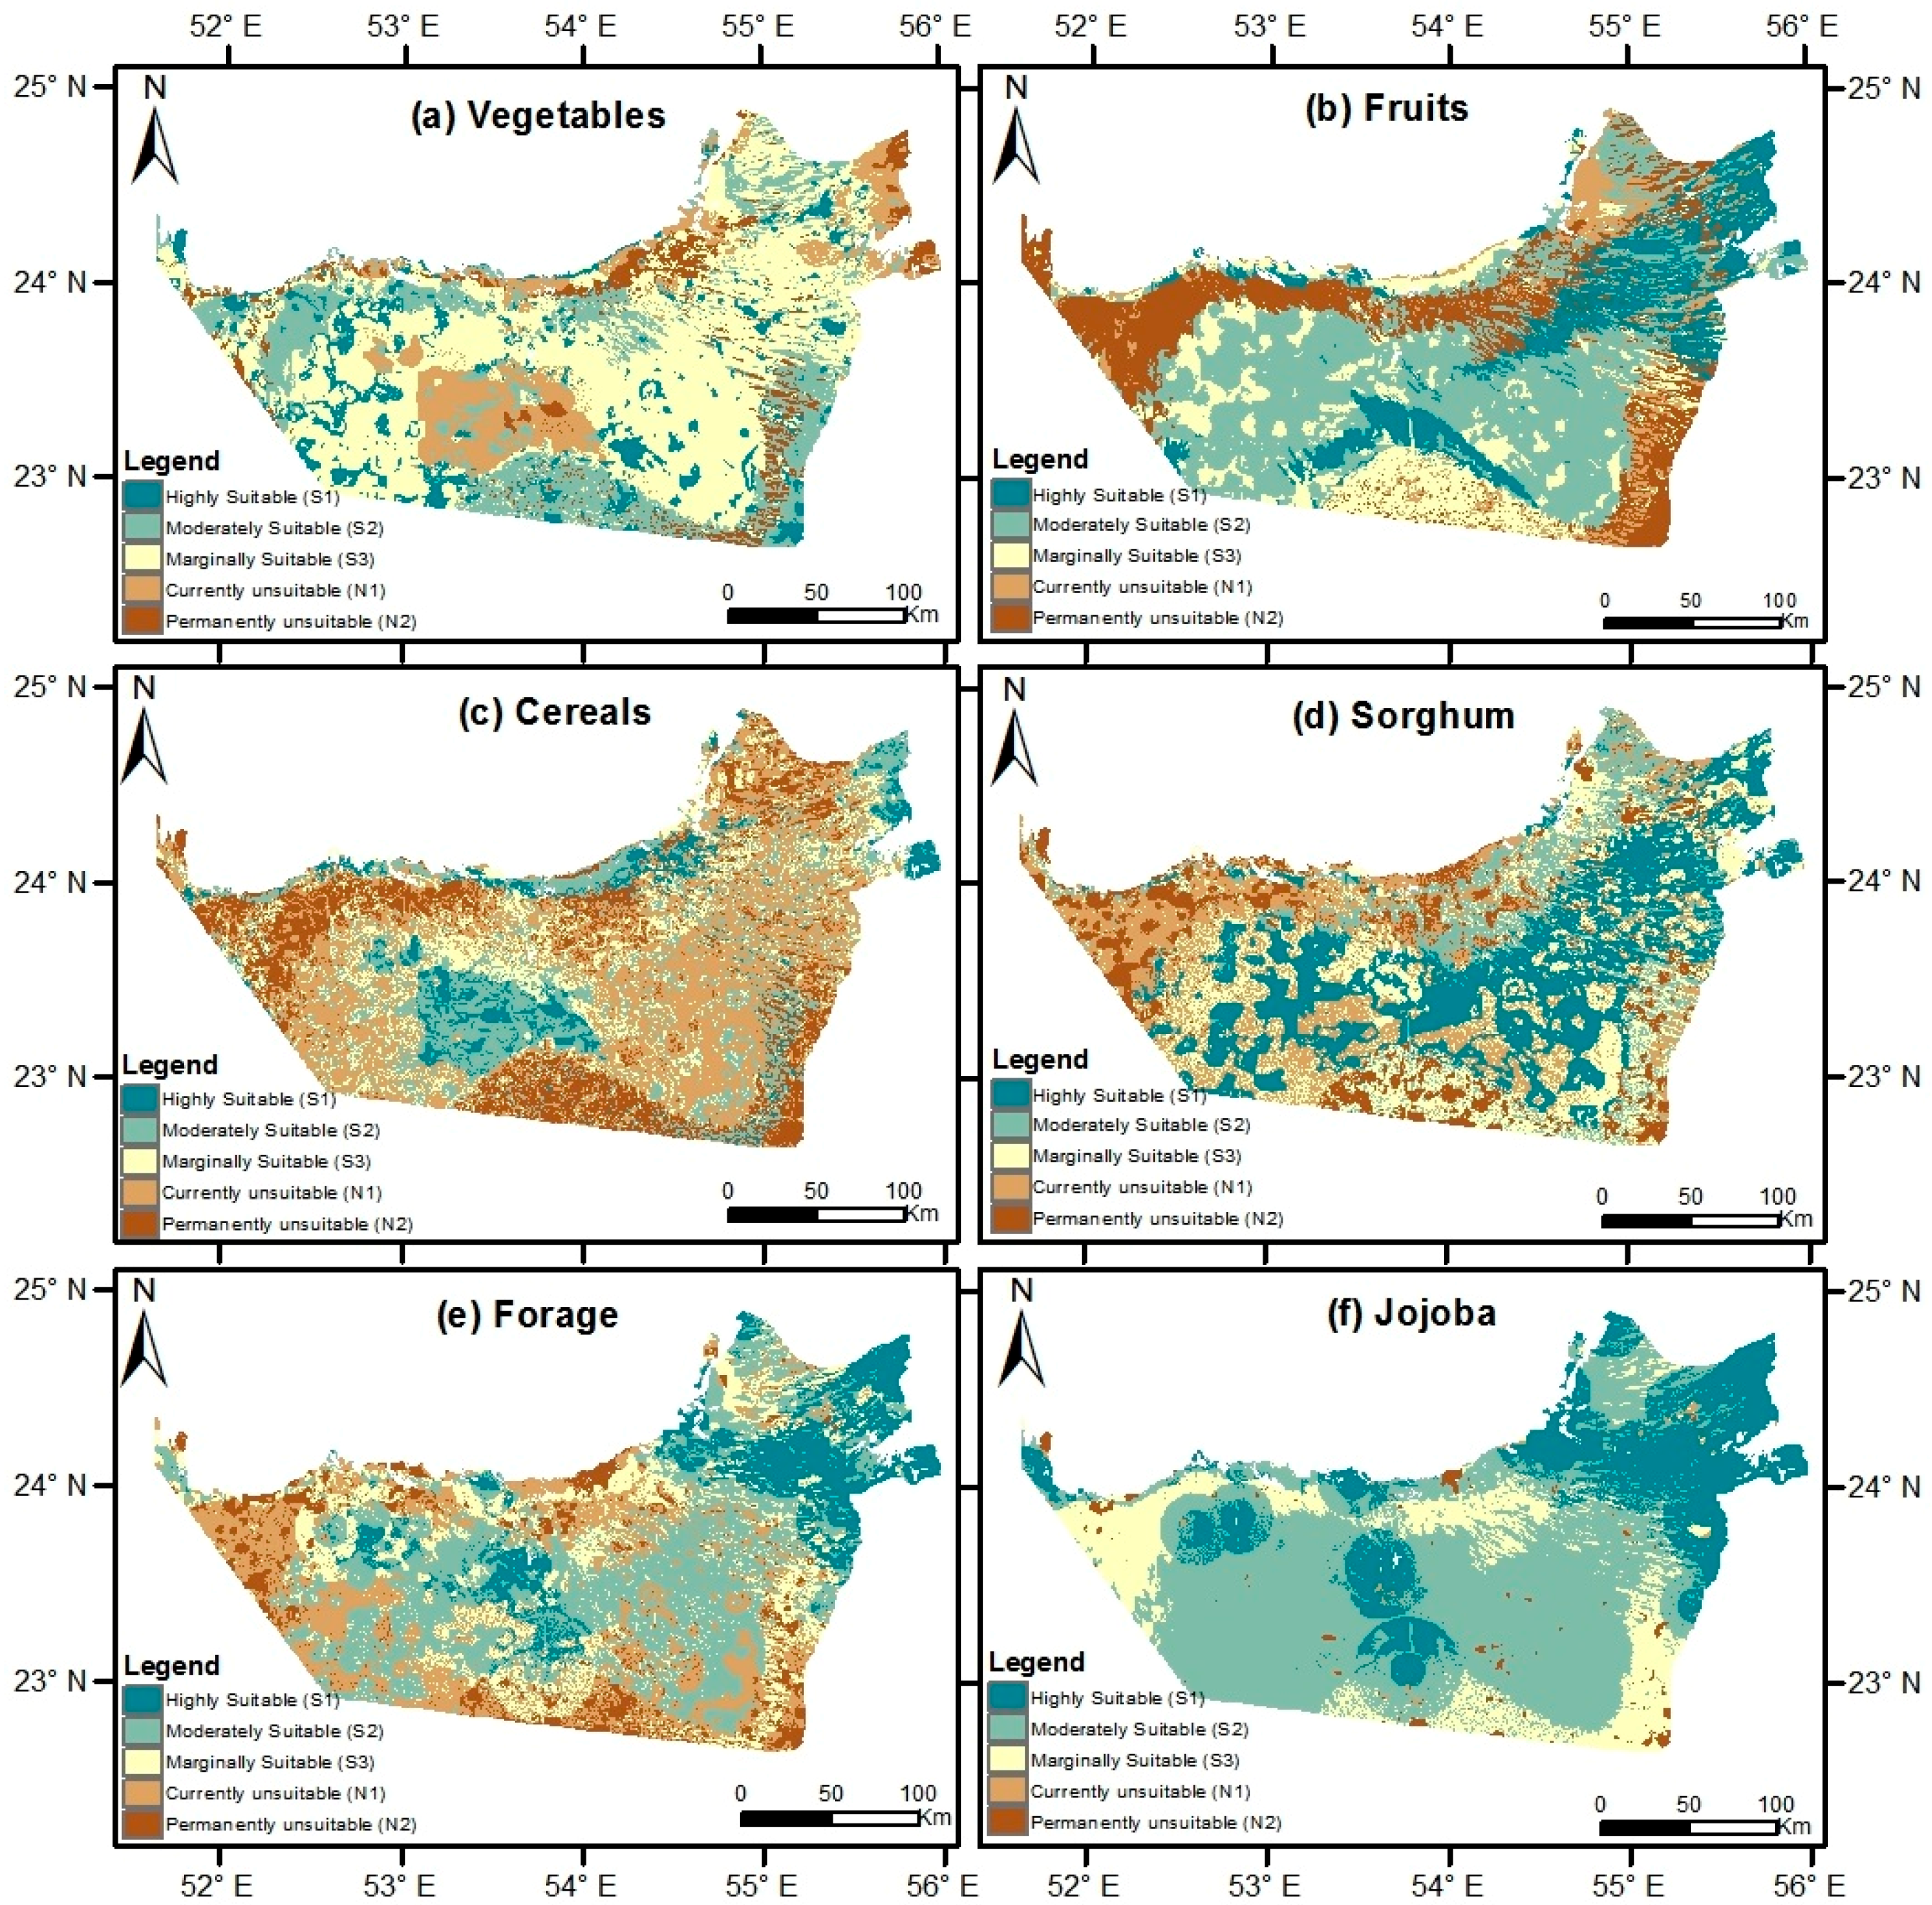
3.1.2. Suitability Maps for Other Crops in the Study Area
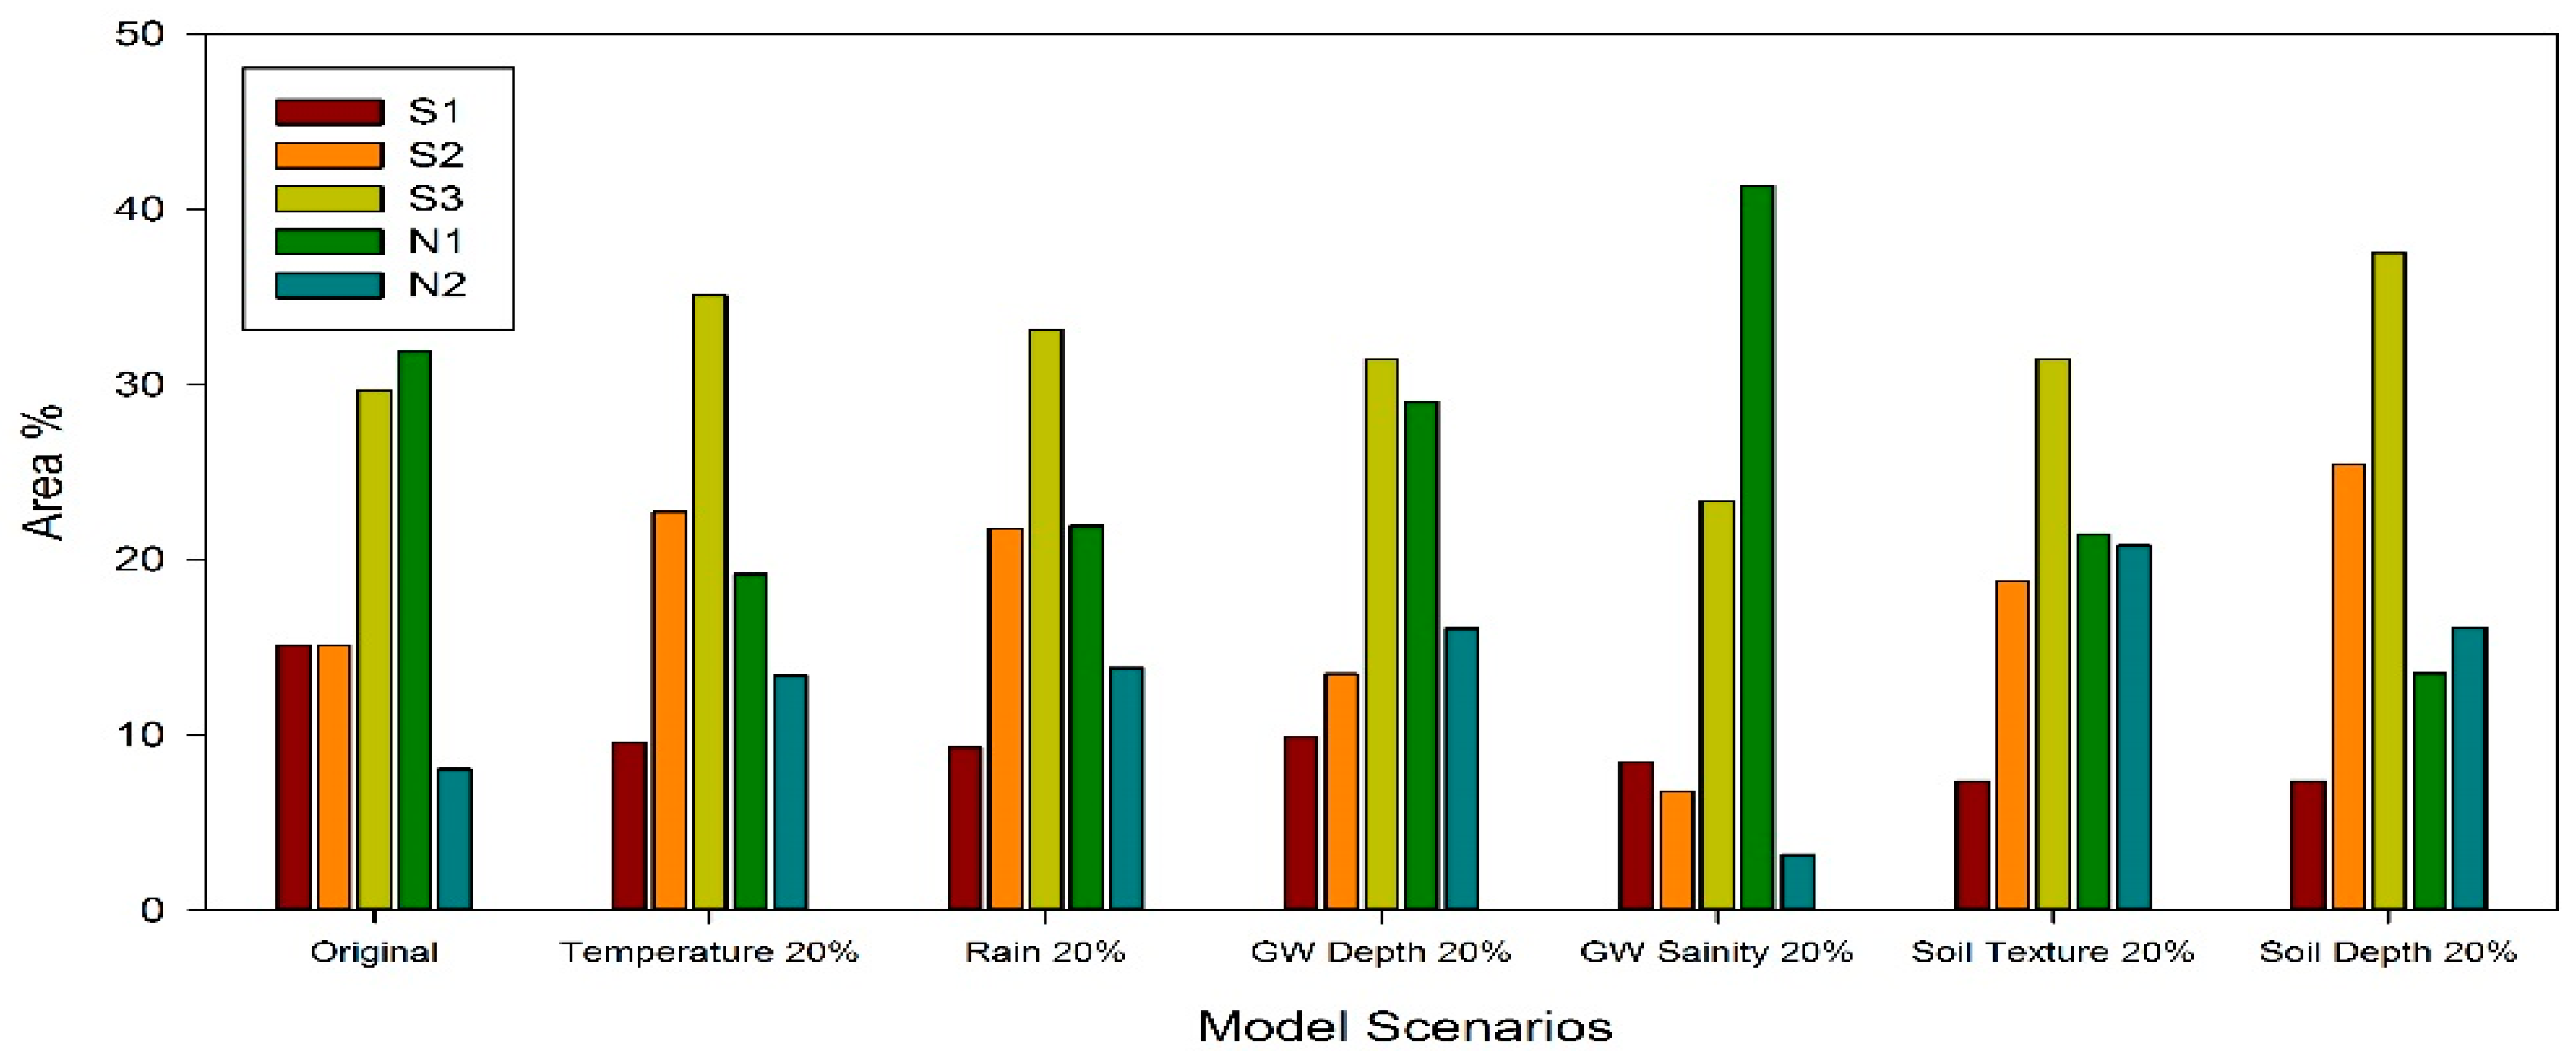
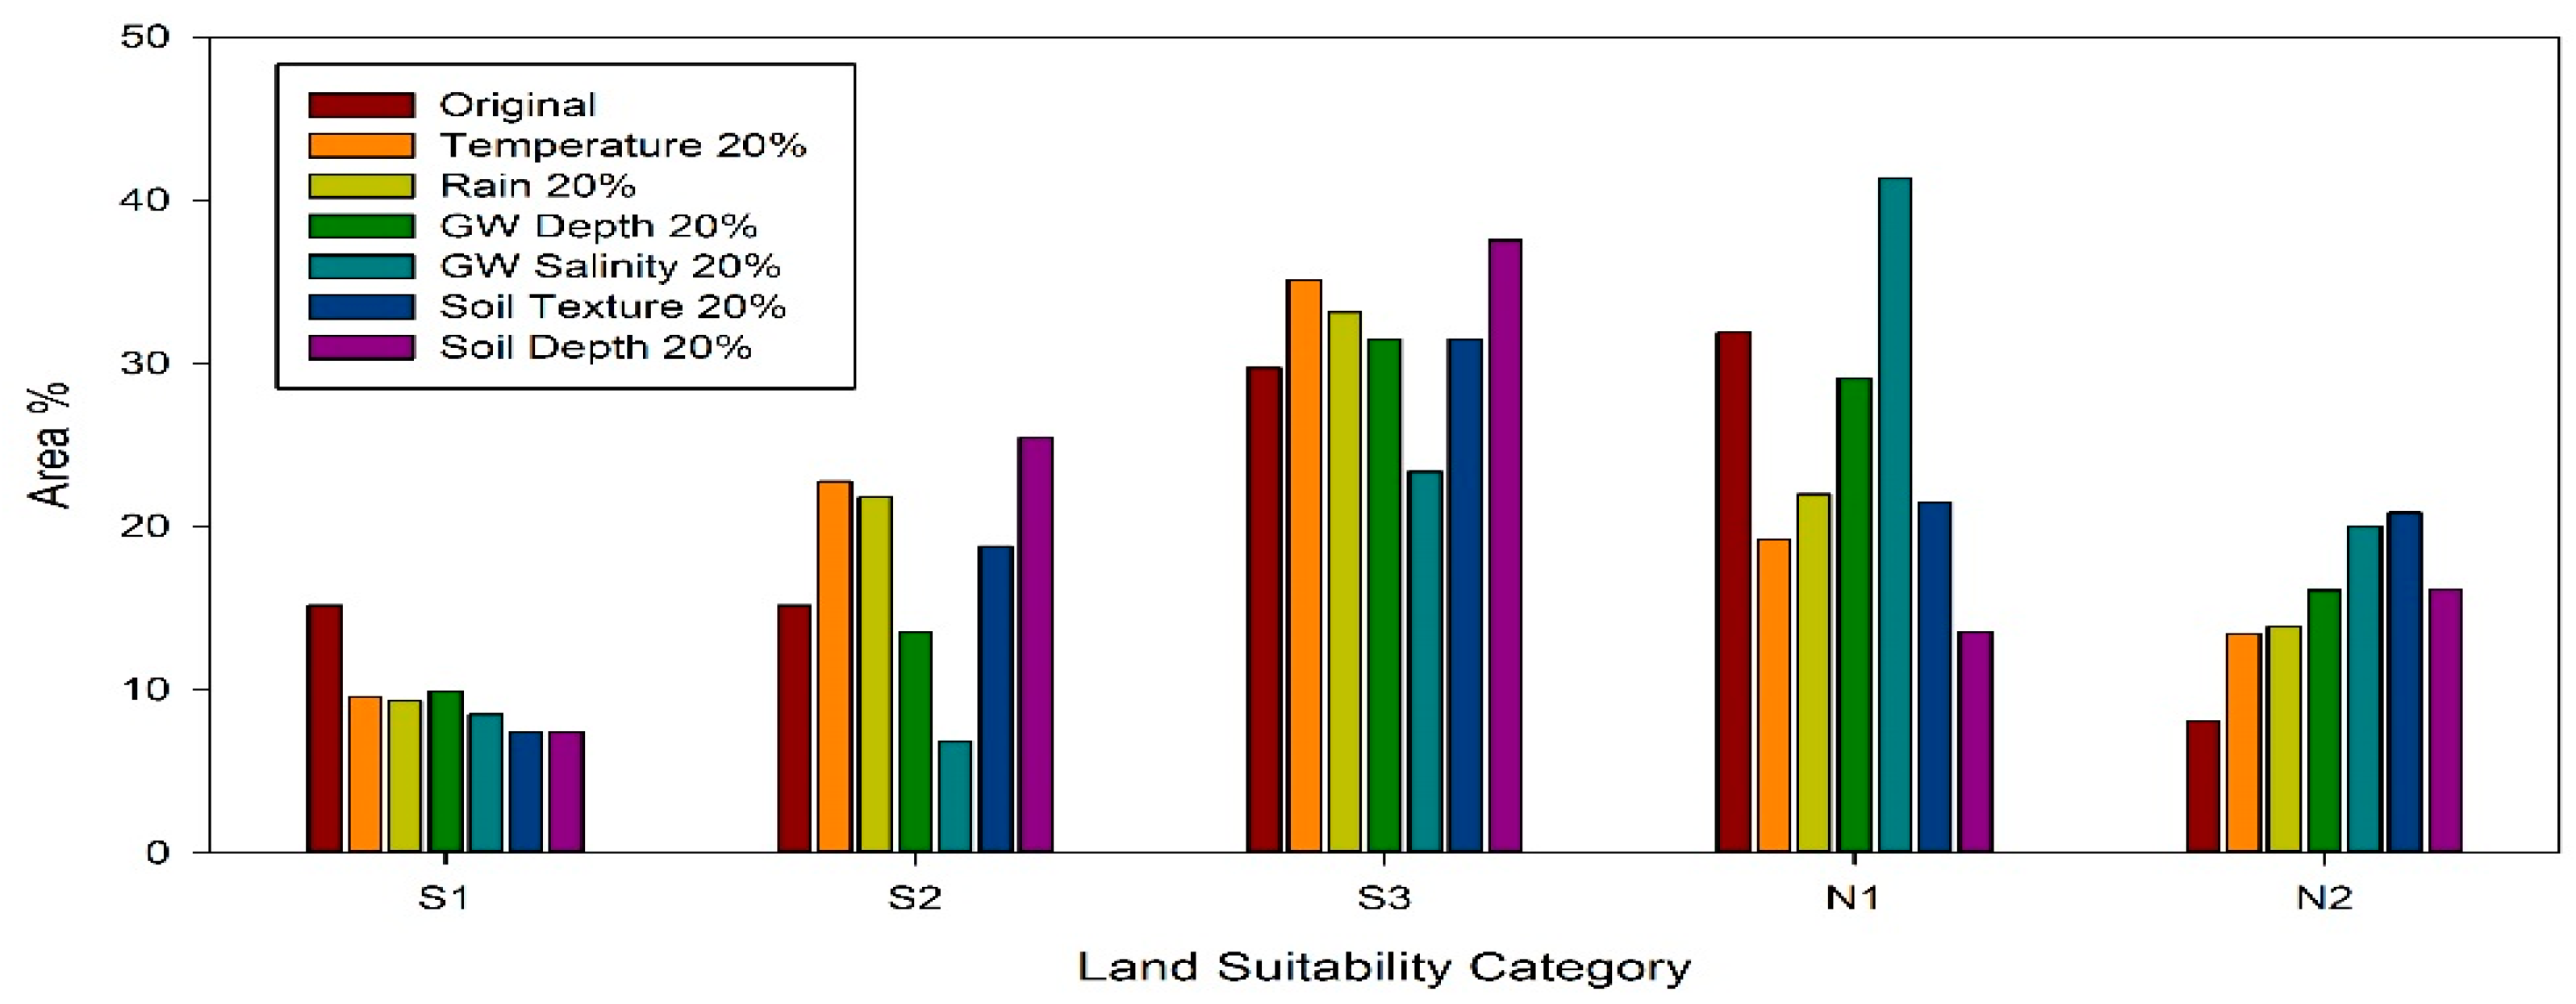
3.2. Sensitivity Analysis of the AHP-GIS Technique
4. Conclusions
Acknowledgments
Author Contributions
Conflicts of Interest
References
- Shihab, M. Economic development in the UAE. In United Arab Emirates: A New Perspective; Trident Press Ltd.: London, UK, 2001; pp. 249–259. [Google Scholar]
- World Bank Open Data. 2015. Available online: https://data.worldbank.org/ (accessed on 15 August 2017).
- Environment Agency—Abu Dhabi. The Water Resources Management Strategy for the Emirate of Abu Dhabi 2014–2018; EAD: Abu Dhabi, UAE, 2014. [Google Scholar]
- FCSA. United Arab Emirates Regional Statistics 2015. Available online: http://opendata.fcsa.gov.ae/iyamhlc/united-arab-emirates-regional-statistics-2013?emirates=united%C2%A0arab%C2%A0emirates (accessed on 3 March 2018).
- Abdelfattah, M.A. Integrated suitability assessment: A way forward for land use planning and sustainable development in Abu Dhabi, United Arab Emirates. Arid Land Res. Manag. 2013, 27, 41–64. [Google Scholar] [CrossRef]
- Matthew, F. For UAE, hope in deep ocean water desalination. Gulf News, 28 September 2016. [Google Scholar]
- Food and Agriculture Organization of the United Nations. Irrigation in the Middle East Region in Figures—For The United Arab Emirates; Aquastat Survey; FAO: Rome, Italy, 2008. [Google Scholar]
- Environment Agency—Abu Dhabi. Maximizing Recycled Water Use in the Emirate of Abu Dhabi: Annual Policy Brief 2013. Available online: https://www.ead.ae/Publications/Maximizing%20Recycled%20Water%20Use%20in%20the%20Emirate%20of%20Abu%20Dhabi/recycled-water-PB-Eng.pdf (accessed on 3 March 2018).
- Malczewski, J. Multiple criteria decision analysis and geographic information systems. In Trends in Multiple Criteria Decision Analysis; Springer: New York, NY, USA, 2010; pp. 369–395. [Google Scholar]
- Elsheikh, R.; Shariff, A.R.B.M.; Amiri, F.; Ahmad, N.B.; Balasundram, S.K.; Soom, M.A.M. Agriculture land suitability evaluator (ALSE): A decision and planning support tool for tropical and subtropical crops. Comput. Electron. Agric. 2013, 93, 98–110. [Google Scholar] [CrossRef] [Green Version]
- Chen, Y.; Yu, J.; Khan, S. Spatial sensitivity analysis of multi-criteria weights in GIS-based land suitability evaluation. Environ. Model. Softw. 2010, 25, 1582–1591. [Google Scholar] [CrossRef]
- Mustafa, A.; Singh, M.; Sahoo, R.; Ahmed, N.; Khanna, M.; Sarangi, A.; Mishra, A. Land suitability analysis for different crops: A multi criteria decision making approach using remote sensing and GIS. Researcher 2011, 3, 1–24. [Google Scholar]
- Aldababseh, A.; Temimi, M.; Maghelal, P.; Branch, O.; Wulfmeyer, V. Evaluation of Land Capability and Suitability for Irrigated Agriculture in the Emirate of Abu Dhabi, UAE, Using an Integrated AHP-GIS Model. In Proceedings of the AGU Fall Meeting, New Orleans, LA, USA, 11 December 2017. [Google Scholar]
- Abdelfattah, M.A.; Kumar, A.T. A web-based GIS enabled soil information system for the United Arab Emirates and its applicability in agricultural land use planning. Arabian J. Geosci. 2015, 8, 1813–1827. [Google Scholar] [CrossRef]
- Yager, R.R. On ordered weighted averaging aggregation operators in multicriteria decisionmaking. IEEE Trans. Syst. Man Cybern. 1988, 18, 183–190. [Google Scholar] [CrossRef]
- Jiang, H.; Eastman, J.R. Application of fuzzy measures in multi-criteria evaluation in GIS. Int. J. Geogr. Inf. Sci. 2000, 14, 173–184. [Google Scholar] [CrossRef]
- Massam, B.H. Multi-criteria decision making (MCDM) techniques in planning. Prog. Plan. 1988, 30, 1–84. [Google Scholar] [CrossRef]
- Store, R.; Kangas, J. Integrating spatial multi-criteria evaluation and expert knowledge for GIS-based habitat suitability modelling. Landsc. Urban Plan. 2001, 55, 79–93. [Google Scholar] [CrossRef]
- Montgomery, B.; Dragićević, S.; Dujmović, J. A Soft Computing Logic Method for Agricultural Land Suitability Evaluation. In Proceedings of the GeoComputation 2015 Conference, Dallas, TX, USA, 20–23 May 2015. [Google Scholar]
- Dujmović, J.; Scheer, D. Logic Aggregation of Suitability Maps. In Proceedings of the 2010 IEEE International Conference on Fuzzy Systems (FUZZ), Barcelona, Spain, 18–23 July 2010. [Google Scholar]
- Feizizadeh, B.; Blaschke, T. Land suitability analysis for Tabriz county, Iran: A multi-criteria evaluation approach using GIS. J. Environ. Plan. Manag. 2013, 56, 1–23. [Google Scholar] [CrossRef]
- Ghobadi, M.; Babazadeh, R.; Bagheri, V. Siting MSW landfills by combining AHP with GIS in Hamedan province, western Iran. Environ. Earth Sci. 2013, 70, 1823–1840. [Google Scholar] [CrossRef]
- Bozdağ, A.; Yavuz, F.; Günay, A.S. AHP and GIS based land suitability analysis for Cihanbeyli (Turkey) county. Environ. Earth Sci. 2016, 75, 813. [Google Scholar] [CrossRef]
- Norouzi, H.; Temimi, M.; AghaKouchak, A.; Azarderakhsh, M.; Khanbilvardi, R.; Shields, G.; Tesfagiorgis, K. Inferring land surface parameters from the diurnal variability of microwave and infrared temperatures. Phys. Chem. Earth Parts A/B/C 2015, 83, 28–35. [Google Scholar] [CrossRef]
- Bojorquez-Tapia, L.A.; Diaz-Mondragon, S.; Ezcurra, E. GIS-based approach for participatory decision making and land suitability assessment. Int. J. Geogr. Inf. Sci. 2001, 15, 129–151. [Google Scholar] [CrossRef]
- Joerin, F.; Thériault, M.; Musy, A. Using GIS and outranking multicriteria analysis for land-use suitability assessment. Int. J. Geogr. Inf. Sci. 2001, 15, 153–174. [Google Scholar] [CrossRef]
- Akıncı, H.; Özalp, A.Y.; Turgut, B. Agricultural land use suitability analysis using GIS and AHP technique. Comput. Electron. Agric. 2013, 97, 71–82. [Google Scholar] [CrossRef]
- Bunruamkaew, K.; Murayam, Y. Site suitability evaluation for ecotourism using GIS & AHP: A case study of Surat Thani province, Thailand. Procedia Soc. Behav. Sci. 2011, 21, 269–278. [Google Scholar]
- Collins, M.G.; Steiner, F.R.; Rushman, M.J. Land-use suitability analysis in the United States: Historical development and promising technological achievements. Environ. Manag. 2001, 28, 611–621. [Google Scholar] [CrossRef] [PubMed]
- Acting Director of the Abu Dhabi Global Environmental Data Initiative. Food Security and Climate Change; National Report; AGEDI: Abu Dhabi, UAE, 2015; Available online: https://www.ccr-group.org/food-background (accessed on 3 March 2018).
- FAO. UAE’s Food Diversification Policy Development. Draft Policy Document Presented in a National Stakeholder’s Consultation Workshop. Available online: http://www.fao.org/neareast/news/view/en/c/472131/ (accessed on 1 March 2018).
- SCAD. Abu Dhabi Emirate: Facts and Figures. Available online: https://www.abudhabi.ae/portal/public/en/abu-dhabi-emirate/abu-dhabi-emirate-facts-and-figures (accessed on 28 Febraury 2018).
- Mohsen Sherif, M.A.; Shetty, A.; Rezaul, K. Analysis of rainfall, PMP and drought in the United Arab Emirates. Int. J. Climatol. 2014, 34, 1318–1328. [Google Scholar] [CrossRef]
- UAE Ministry of Energy. Third National Communication Under the United Nations Framework Convention on Climate Change; MoEng: Abu Dhabi, UAE, 2012.
- FAO AquaStat. UAE—Geography, Climate and Population; FAO: Rome, Italy, 2008. [Google Scholar]
- Aldababseh, A.; Temimi, M. Analysis of the long-term variability of poor visibility events in the UAE and the link with climate dynamics. Atmosphere 2017, 8, 242. [Google Scholar] [CrossRef]
- Chaouch, N.; Temimi, M.; Weston, M.; Ghedira, H. Sensitivity of the meteorological model WRF-ARW to planetary boundary layer schemes during fog conditions in a coastal arid region. Atmos. Res. 2017, 187, 106–127. [Google Scholar] [CrossRef]
- Wood, W.; Alsharhan, A. Water Resources Perspectives: Evaluation, Management and Policy; Elsevier: New York, NY, USA, 2003; Volume 50. [Google Scholar]
- Sherif, M.; Kacimov, A.; Javadi, A.; Ebraheem, A.A. Modeling groundwater flow and seawater intrusion in the coastal aquifer of Wadi Ham, UAE. Water Resour. Manag. 2012, 26, 751–774. [Google Scholar] [CrossRef]
- Environment Agency—Abu Dhabi. Abu Dhabi Environment Vision 2030; EAD: Abu Dhabi, UAE, 2012. [Google Scholar]
- Al Shahi, F.A. Assessment of Groundwater Resources in Selected Areas of Al-Ain in the UAE. Thesis, United Arab Emirates University, Abu Dhabi, UAE, 2002. [Google Scholar]
- Aldababseh, A.; Svetinovic, D. Food security goal analysis using multi-objective reasoning: Treated sewage water case study. In Proceedings of the 6th International Workshop on Requirements Engineering for Sustainable Systems co-located with 23rd International Conference on Requirements Engineering (RE 2017), Lisbon, Portugal, 4–8 September 2017. [Google Scholar]
- Ministry of Environment and Water. UAE State of Green Economy. National Report 2014. Available online: http://www.moew.gov.ae/assets/e3bd136a/uae-state-of-green-economy-report-2014.aspx (accessed on 27 February 2018).
- Dawoud, M.A.; Sallam, O.M.; Abdelfattah, M.A. Treated wastewater management and reuse in arid regions: Abu Dhabi case study. In Proceedings of the 10th Gulf Water Conference, Doha, Qatar, 22–24 April 2012. [Google Scholar]
- Shahid, S.A.; Abdelfattah, M.A.; Wilson, M.A.; Kelley, J.A.; Chiaretti, J.V. United Arab Emirates Keys to Soil Taxonomy; Springer: New York, NY, USA, 2014. [Google Scholar]
- Environment Agency—Abu Dhabi. Spatial Database; EAD: Abu Dhabi, UAE, 2017. [Google Scholar]
- Shahid, S.A.; Abdelfattah, M.A. A comparative characterization and classification of soils in Abu Dhabi coastal area in relation to arid and semi-arid conditions using USDA and FAO soil classification systems. Arid Land Res. Manag. 2007, 21, 245–271. [Google Scholar]
- Abdelfattah, M.A. Pedogenesis, land management and soil classification in hyper-arid environments: Results and implications from a case study in the United Arab Emirates. Soil Use Manag. 2013, 29, 279–294. [Google Scholar] [CrossRef]
- Letey, J. Relationship between soil physical properties and crop production. In Advances in Soil Science; Springer: New York, NY, USA, 1958; pp. 277–294. [Google Scholar]
- Adem, H. Horticulture: Establishing a Fruit or Nut Orchard; Farm Services Victoria, Department of Environmental and Primary Industries: Victoria, Australia, 2012. [Google Scholar]
- Espadafor, M.; Lorite, I.; Gavilán, P.; Berengena, J. An analysis of the tendency of reference evapotranspiration estimates and other climate variables during the last 45 years in southern Spain. Agric. Water Manag. 2011, 98, 1045–1061. [Google Scholar] [CrossRef]
- Chen, Y.; Khan, S.; Paydar, Z. To retire or expand? A fuzzy GIS-based spatial multi-criteria evaluation framework for irrigated agriculture. Irrig. Drain. 2010, 59, 174–188. [Google Scholar] [CrossRef]
- Bizuwerk, A.; Peden, D.; Taddese, G.; Getahun, Y. GIS Application for Analysis of Land Suitability and Determination of Grazing Pressure in Upland of the Awash River Basin, Ethiopia; International Livestock Research Institute (ILRI): Addis Ababa, Ethiopia, 2005. [Google Scholar]
- Yalew, S.G.; van Griensven, A.; Mul, M.L.; van der Zaag, P. Land suitability analysis for agriculture in the Abbay Basin using remote sensing, GIS and AHP techniques. Model. Earth Syst. Environ. 2016, 2, 1–14. [Google Scholar] [CrossRef]
- Weltzin, J.F.; Loik, M.E.; Schwinning, S.; Williams, D.G.; Fay, P.A.; Haddad, B.M.; Harte, J.; Huxman, T.E.; Knapp, A.K.; Lin, G. Assessing the response of terrestrial ecosystems to potential changes in precipitation. AIBS Bull. 2003, 53, 941–952. [Google Scholar] [CrossRef]
- Creswell, R.; Martin, F.W. Dryland Farming: Crops & Techniques for Arid Regions; ECHO: Fort Myers, FL, USA, 1998. [Google Scholar]
- National Centers for Environmental Information. NOAA’S U.S. Integrated Surface Global Hourly Data, 1982–2016; NCEI: Asheville, NC, USA, 2016.
- Gornall, J.; Betts, R.; Burke, E.; Clark, R.; Camp, J.; Willett, K.; Wiltshire, A. Implications of climate change for agricultural productivity in the early twenty-first century. Philos. Trans. R. Soc. Lond. B Biol. Sci. 2010, 365, 2973–2989. [Google Scholar] [CrossRef] [PubMed]
- Salim, M. Effects of salinity and relative humidity on growth and ionic relations of plants. New Phytol. 1989, 113, 13–20. [Google Scholar] [CrossRef]
- Ayers, R.S. Water Quality for Agriculture; FAO and UN: Rome, Italy, 1985. [Google Scholar]
- Rhoades, J. Salinity: Electrical conductivity and total dissolved solids. Methods Soil Anal. Part 3 Chem. Methods 1996, 417–435. [Google Scholar]
- Bresler, E. Control of soil salinity. In Optimizing the Soil Physical Environment Toward Greater Crop Yields; Hillel, D., Ed.; Academic Press: New York, NY, USA, 1972; pp. 101–132. [Google Scholar]
- Denmead, O.; Shaw, R.H. Availability of soil water to plants as affected by soil moisture content and meteorological conditions. Agron. J. 1962, 54, 385–390. [Google Scholar] [CrossRef]
- Robins, J.; Domingo, C. Some effects of severe soil moisture deficits at specific growth stages in corn. Agron. J. 1953, 45, 618–621. [Google Scholar] [CrossRef]
- United States Geological Survey. Aster Global Digital Elevation Model; USGS: Reston, VA, USA, 2016.
- Malcolm, D.C. Sire Factors and the Growth of Sitka Spruce. Ph.D. Thesis, University of Edinburgh, Edinburg, UK, 1970. [Google Scholar]
- Kumhálová, J.; Matejkova, S.; Fifernová, M.; Lipavsky, J.; Kumhála, F. Topography impact on nutrition content in soil and yield. Plant Soil Environ. 2008, 54, 255. [Google Scholar] [CrossRef]
- Sauer, T.; Havlík, P.; Schneider, U.A.; Schmid, E.; Kindermann, G.; Obersteiner, M. Agriculture and resource availability in a changing world: The role of irrigation. Water Resour. Res. 2010, 46. [Google Scholar] [CrossRef]
- Lal, R. Soil degradative effects of slope length and tillage methods on alfisols in western Nigeria. I. Runoff, erosion and crop response. Land Degrad. Dev. 1997, 8, 201–219. [Google Scholar] [CrossRef]
- Begum, F.; Bajracharya, R.M.; Sitaula, B.K.; Sharma, S. Seasonal dynamics, slope aspect and land use effects on soil mesofauna density in the mid-hills of Nepal. Int. J. Biodivers. Sci. Ecosyst. Serv. Manag. 2013, 9, 290–297. [Google Scholar] [CrossRef]
- King, P.; Grealish, G.; Shahid, S.A.; Abdelfattah, M.A. Land evaluation interpretations and decision support systems: Soil survey of Abu Dhabi Emirate. In Developments in Soil Classification, Land Use Planning and Policy Implications: Innovative Thinking of Soil Inventory for Land Use Planning and Management of Land Resources; Shahid, S.A., Taha, F.K., Abdelfattah, M.A., Eds.; Springer: Dordrecht, The Netherlands, 2013; pp. 147–164. [Google Scholar]
- Food and Agriculture Organization of the United Nations. A Framework for Land Evaluation; FAO: Rome, Italy, 1977. [Google Scholar]
- Radan, S. Abu Dhabi farmers gear up for next agricultural season. Khaleej Times, 20 July 2015. [Google Scholar]
- UAEU. Date Palm Culture in UAE. Available online: https://www.uaeu.ac.ae/en/dvcrgs/research/researchcenters/dpdrud/datepalmculture.shtml (accessed on 28 February 2018).
- FAO. Staple Foods: What Do People Eat? Available online: http://www.fao.org/docrep/u8480e/u8480e07.htm (accessed on 1 March 2018).
- Meyer, S.E. Simmondsia chinensis (link) schneid.: jojoba. In The Woody Plant Seed Manual: Agricultural Handbook No. 727; Bonner, F.T., Karrfalt, R.P., Eds.; USDA Forest Service: Washington, DC, USA, 2008; pp. 1049–1051. [Google Scholar]
- Gaber, A.; El-Maraghy, H.M.; Aly, M.; Rashed, N.A.; El-Din, A. Induction of somatic embryogenesis and DNA fingerprinting of jojoba. Arab J. Biotechnol. 2007, 10, 341–354. [Google Scholar]
- Saaty, T.L. Analytic Hierarchy Process; Wiley Online Library: New York, NY, USA, 1980. [Google Scholar]
- Saaty, T.L. How to make a decision: The analytic hierarchy process. Interfaces 1994, 24, 19–43. [Google Scholar] [CrossRef]
- Pereira, J.M.; Duckstein, L. A multiple criteria decision-making approach to GIS-based land suitability evaluation. Int. J. Geogr. Inf. Sci. 1993, 7, 407–424. [Google Scholar] [CrossRef]
- Albayrak, E.; Erensal, Y.C. Using analytic hierarchy process (AHP) to improve human performance: An application of multiple criteria decision making problem. J. Intell. Manuf. 2004, 15, 491–503. [Google Scholar] [CrossRef]
- Ahamed, T.N.; Rao, K.G.; Murthy, J. GIS-based fuzzy membership model for crop-land suitability analysis. Agric. Syst. 2000, 63, 75–95. [Google Scholar] [CrossRef]
- Abdi Vishkaee, F.; Flamant, C.; Cuesta, J.; Oolman, L.; Flamant, P.; Khalesifard, H.R. Dust transport over Iraq and northwest Iran associated with winter shamal: A case study. J. Geophys. Res. Atmos. 2012, 117, D03201. [Google Scholar] [CrossRef]
- Salah, A.; Van Ranst, E.; Hisham, E. Land Suitability Assessment for Date Palm Cultivation in the Eastern Nile Delta, Egypt Using an Automated Land Evaluation System and GIS. In Proceedings of the Second International Conference on Date Palms, Al-Ain, UAE, 25–27 March 2001. [Google Scholar]
- Fipps, G. Irrigation Water Quality Standards and Salinity Management Strategies; Texas FARMER Collection: TX, USA, 2003. [Google Scholar]
- Asian Vegetable Research and Development Center. Vegetable Production Training Manual; AVRDC: Tainan, Taiwan, 1990; p. 447. [Google Scholar]
- YARA. Crop Nutrition: Tomato Agronomic Principles; YARA: Oslo, Norway, 2016. [Google Scholar]
- Oebker, N.F.; Call, R.E. Ten Steps to a Successful Vegetable Garden; University of Arizona Cooperative Extension: Tucson, AZ, USA, 2016; p. AZ1435. [Google Scholar]
- Masabni, J.; Strang, J. Orchard Site Rating Sheet; University of Kentucky Cooperative Extension Service: Lexington, KY, USA, 2007. [Google Scholar]
- Hasey, J. Fruit and Nut Varieties for Low-Elevation Sierra Foothills; Division of Agric. Natural Resources, University of California: La Jolla, CA, USA, 2009; p. 8396. [Google Scholar]
- Mickan, F. Crop Production; Department of Environment and Primary Industries: Melbourne, Australia, 2006. [Google Scholar]
- Ontario Ministry of Agriculture, Food and Rural Affairs. Cereal Production in Ontario. 2016. Available online: http://omafra.gov.on.ca/english/crops/field/cereal.html (accessed on 1 March 2018).
- Food and Agriculture Organization of the United Nations (FAO). World Food Situation. 2016. Available online: http://www.fao.org/worldfoodsituation/csdb/en/ (accessed on 28 February 2018).
- Food and Agriculture Organization of the United Nations (FAO). Land & Water: Sorghum. 2017. Available online: http://www.fao.org/land-water/databases-and-software/crop-information/sorghum/en/ (accessed on 2 March 2018).
- Food and Agriculture Organization of the United Nations (FAO). Land & Water: Alfalfa. 2017. Available online: http://www.fao.org/land-water/databases-and-software/crop-information/alfalfa/en/ (accessed on 3 March 2018).
- Shewmaker, G.E.; Allen, R.G.; Neibling, W.H. Alfalfa Irrigation and Drought; University of Idaho: Moscow, ID, USA, 2013. [Google Scholar]
- Ball, D.M.; Collins, M.; Lacefield, G.; Martin, N.; Mertens, D.; Olson, K.; Putnam, D.; Undersander, D.; Wolf, M. Understanding Forage Quality; American Farm Bureau Federation: New York, NY, USA, 2001; Volume 1. [Google Scholar]
- Yermanos, D. Jojoba—A brief survey of the agronomic potential. Calif. Agric. 1973, 27, 10–13. [Google Scholar]
- Ash, G.; Albiston, A.; Cother, E. Aspects of jojoba agronomy and management. Adv. Agron. 2005, 85, 409–437. [Google Scholar]
- Allawzi, M.; Abu-Arabi, M.; Al-Zoubi, H.; Tamimi, A. Physicochemical characteristics and thermal stability of Jordanian jojoba oil. J. Am. Oil Chem. Soc. 1998, 75, 57–62. [Google Scholar] [CrossRef]
- Undersander, D.J.; Oelke, E.A.; Kaminski, A.R.; Doll, J.D.; Putnam, D.H.; Combs, S.M.; Hanson, C.V. Alternative Field Crops Manual: Jojoba; University of Wisconsin-Madison Cooperative Extension: Madison, WI, USA, 1990. [Google Scholar]
- Saaty, R.W. The analytic hierarchy process—What it is and how it is used. Math. Model. 1987, 9, 161–176. [Google Scholar] [CrossRef]
- Food and Agriculture Organization of the United Nations (FAO). FAOSTAT-Crops. Available online: www.fao.org/faostat/ (accessed on 27 February 2018).
- Holland, J. The environmental consequences of adopting conservation tillage in Europe: Reviewing the evidence. Agric. Ecosyst. Environ. 2004, 103, 1–25. [Google Scholar] [CrossRef]
- Mikkelsen, R.; Page, A.; Bingham, F. Factors affecting selenium accumulation by agricultural crops. Selenium Agric. Environ. 1989, 65–94. [Google Scholar]
- Newman, J.L. The Ecological Basis for Subsistence Change among the Sandawe of Tanzania; National Academies: Washington, DC, USA, 1970; Volume 36. [Google Scholar]
- Chen, C. Management of Forage for Animal Production Under Tree Crops. In Proceedings of the Integrated Tree Croping and Small Ruminat Production System, Medan, North Sumatra, Indonesia, 9–14 September 1990; University of California: Davis, CA, USA, 1990; pp. 10–23. [Google Scholar]
- Harsh, L.; Tewari, J.; Patwal, D.S.; Menna, G. Package of Practices for Cultivation of Jojoba (Simmondsia Chinensis) in Arid Zone; Central Arid Zone Research Institute: Jodhpur, India, 1987. [Google Scholar]
- Ghosh, A.; Chaudhary, D.; Reddy, M.; Rao, S.; Chikara, J.; Pandya, J.; Patolia, J.; Gandhi, M.; Adimurthy, S.; Vaghela, N. Prospects for jatropha methyl ester (biodiesel) in India. Int. J. Environ. Stud. 2007, 64, 659–674. [Google Scholar] [CrossRef]
- Malek, C. Agriculture is the largest consumer of water in Abu Dhabi. The National, 22 January 2013. [Google Scholar]
- Becker, K.; Wulfmeyer, V.; Berger, T.; Gebel, J.; Münch, W. Carbon farming in hot, dry coastal areas: An option for climate change mitigation. Earth Syst. Dyn. 2013, 4, 237–251. [Google Scholar] [CrossRef]
- Bauddh, K.; Singh, R.P. Growth, tolerance efficiency and phytoremediation potential of Ricinus communis (L.) and Brassica juncea (L.) in salinity and drought affected cadmium contaminated soil. Ecotoxicol. Environ. Saf. 2012, 85, 13–22. [Google Scholar] [CrossRef] [PubMed]
- Magnussen, S.; Reed, D. Knowledge Reference for National Forest Assessments: Modeling for Estimation and Monitoring; FAO: Rome, Italy, 2004; p. 111. [Google Scholar]
- Saaty, T.L.; Vargas, L.G. Sensitivity analysis in the analytic hierarchy process. In Decision Making with the Analytic Network Process; Springer: New York, NY, USA, 2013; pp. 345–360. [Google Scholar]
- Field, P.; Strassberg, M.; Harvey, K. Integrating mediation in land use decision making. Screening 2009, 30, 10. [Google Scholar]
- Saif, O.; Mezher, T.; Arafat, H.A. Water security in the GCC countries: Challenges and opportunities. J. Environ. Stud. Sci. 2014, 4, 329–346. [Google Scholar] [CrossRef]
- Pirani, S.I.; Arafat, H.A. Interplay of food security, agriculture and tourism within GCC countries. Glob. Food Secur. 2016, 9, 1–9. [Google Scholar] [CrossRef]
- Basha, G.; Ouarda, T.; Marpu, P. Long-term projections of temperature, precipitation and soil moisture using non-stationary oscillation processes over the UAE region. Int. J. Climatol. 2015, 35, 4606–4618. [Google Scholar] [CrossRef]
- Kang, Y.; Khan, S.; Ma, X. Climate change impacts on crop yield, crop water productivity and food security—A review. Progress Nat. Sci. 2009, 19, 1665–1674. [Google Scholar] [CrossRef]
- Hollinger, S.E.; Angel, J.R. Weather and crops. Emerson Nafziger (compiling). In Illinois Agronomy Handbook, 24th ed.; University of Illinois at Urbana-Champaign: Champaign, IL, USA, 2009. [Google Scholar]


| Main Categories | Attribute Criteria | Description | Source | Justification |
|---|---|---|---|---|
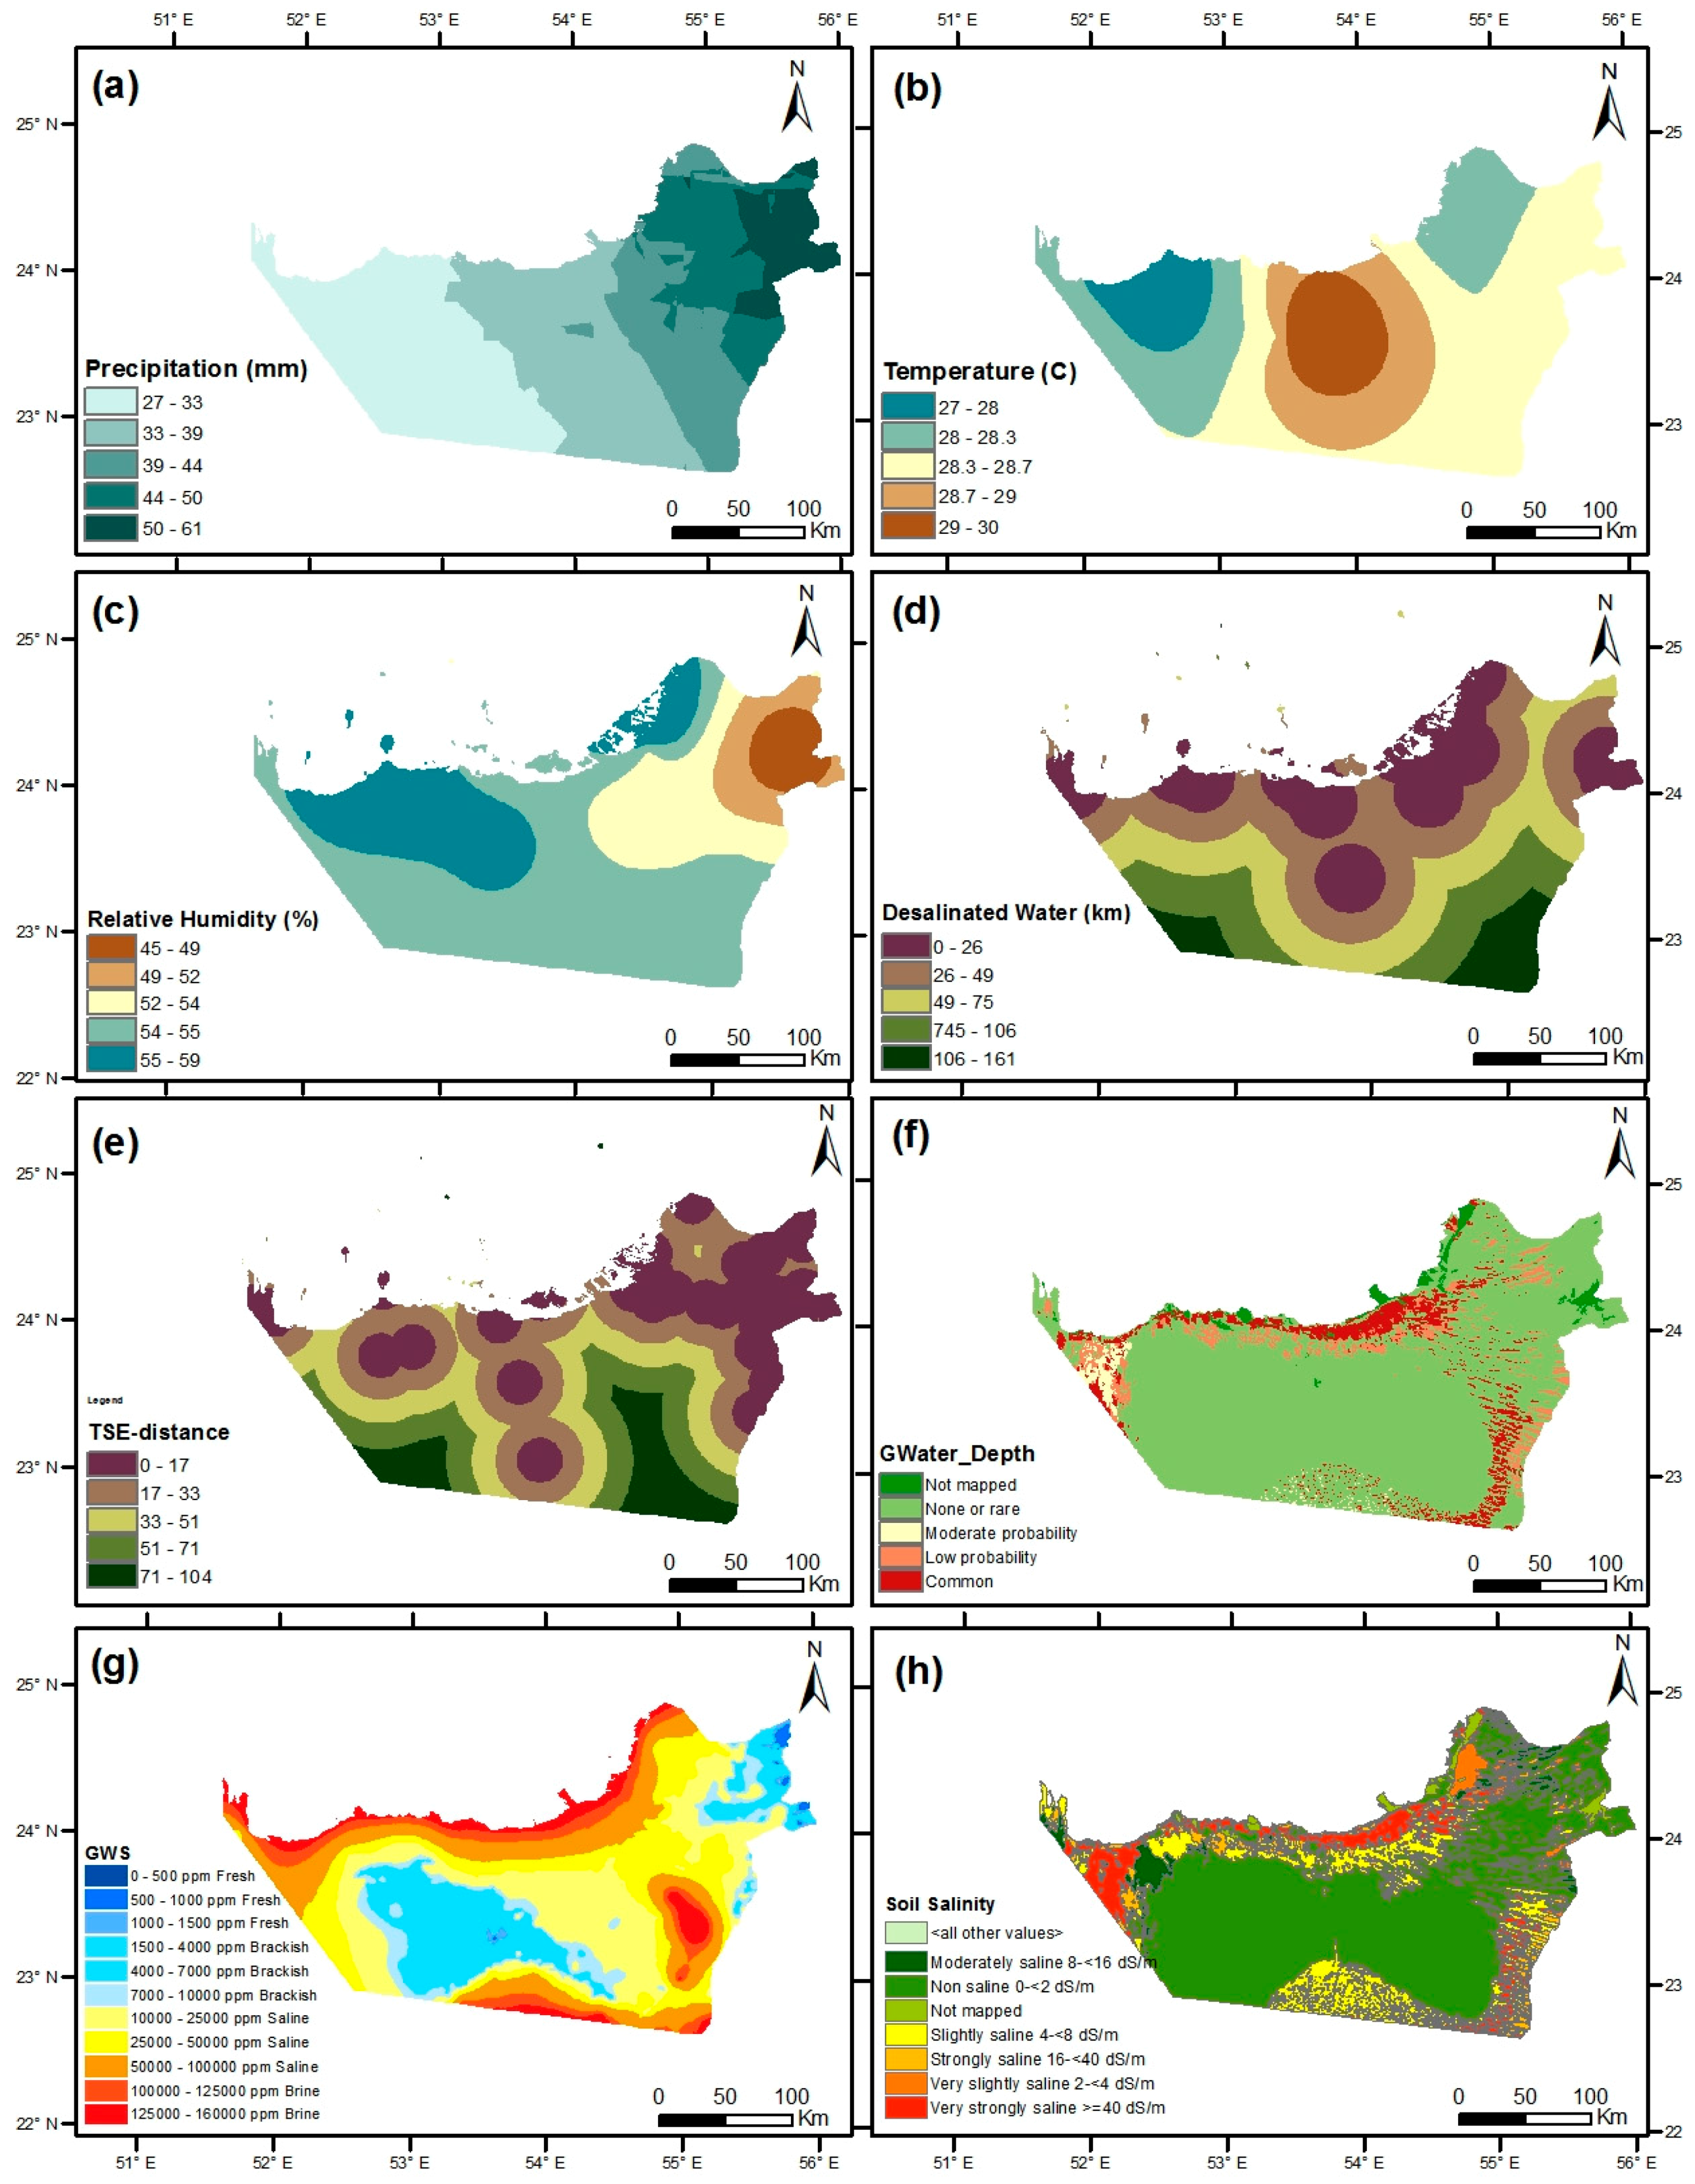
| Climate | Precipitation | Numerical data sets containing precipitation (2003–2015) | NCSM, 2017 | Precipitation affects the growth and yield of plants and crops [55]. In an arid region, precipitation must be greater than 250 mm for profitable production of crops, without any supplementary irrigation [56]. Therefore, supplementary irrigation is crucial for agriculture in the UAE. |
| Average Temperature | Numerical datasets containing hourly temperature observations | NOAA’s NCEI (https://www.ncdc.noaa.gov/) [57]. | [58]. | |
| Relative Humidity | Numerical datasets containing hourly temperature observations | NOAA’s NCEI (https://www.ncdc.noaa.gov/) [57]. | Relative Humidity affects plants’ growth, impacts plants’ flowering, productivity and total yield [59] | |
| Water Resources | Groundwater level | Spatial dataset containing groundwater levels | EAD, 2016 | Groundwater level measured by the depth of the upper surface of the water table. |
| Distance to Wastewater treatment plants | Spatial datasets containing the wastewater treatment plants names, locations, capacity and owners | EAD, 2016 | The government has initiated several programs to encourage the reuse of treated wastewater in agriculture, forestry and urban design sectors | |
| Groundwater Salinity | Spatial dataset containing groundwater salinity categories | EAD, 2016 | Groundwater salinity is one of the most critical water quality factors that affect plant growth and crops productivity. Water with high salinity means that less water is available to plants even if the soil is wet as plants capacity to absorb water decreases as salinity increases [60]. | |
| Distance to desalination plants | Numerical datasets containing the desalination plans, locations, capacity, purpose and owners | The DesalData.com, through MIST subscription. | Data are obtained online for all plants across the UAE but only the main plants are taken onward for further analysis based on the purpose of desalination, owner and location. In addition to the name of the desalination plants, several other parameters are provided for each plant, including longitude, latitude, the capacity of water produced per day, owner and purpose of desalination and year of establishment. | |
| Land Capability | Soil Salinity | Spatial datasets containing soil salinity | EAD, 2016 | Soil salinity represents the accumulation of salts (soluble and readily dissolvable salts) in the soil [61]. It is one of the critical factors to consider in irrigated agriculture, mainly in arid and semi-arid regions [62]. |
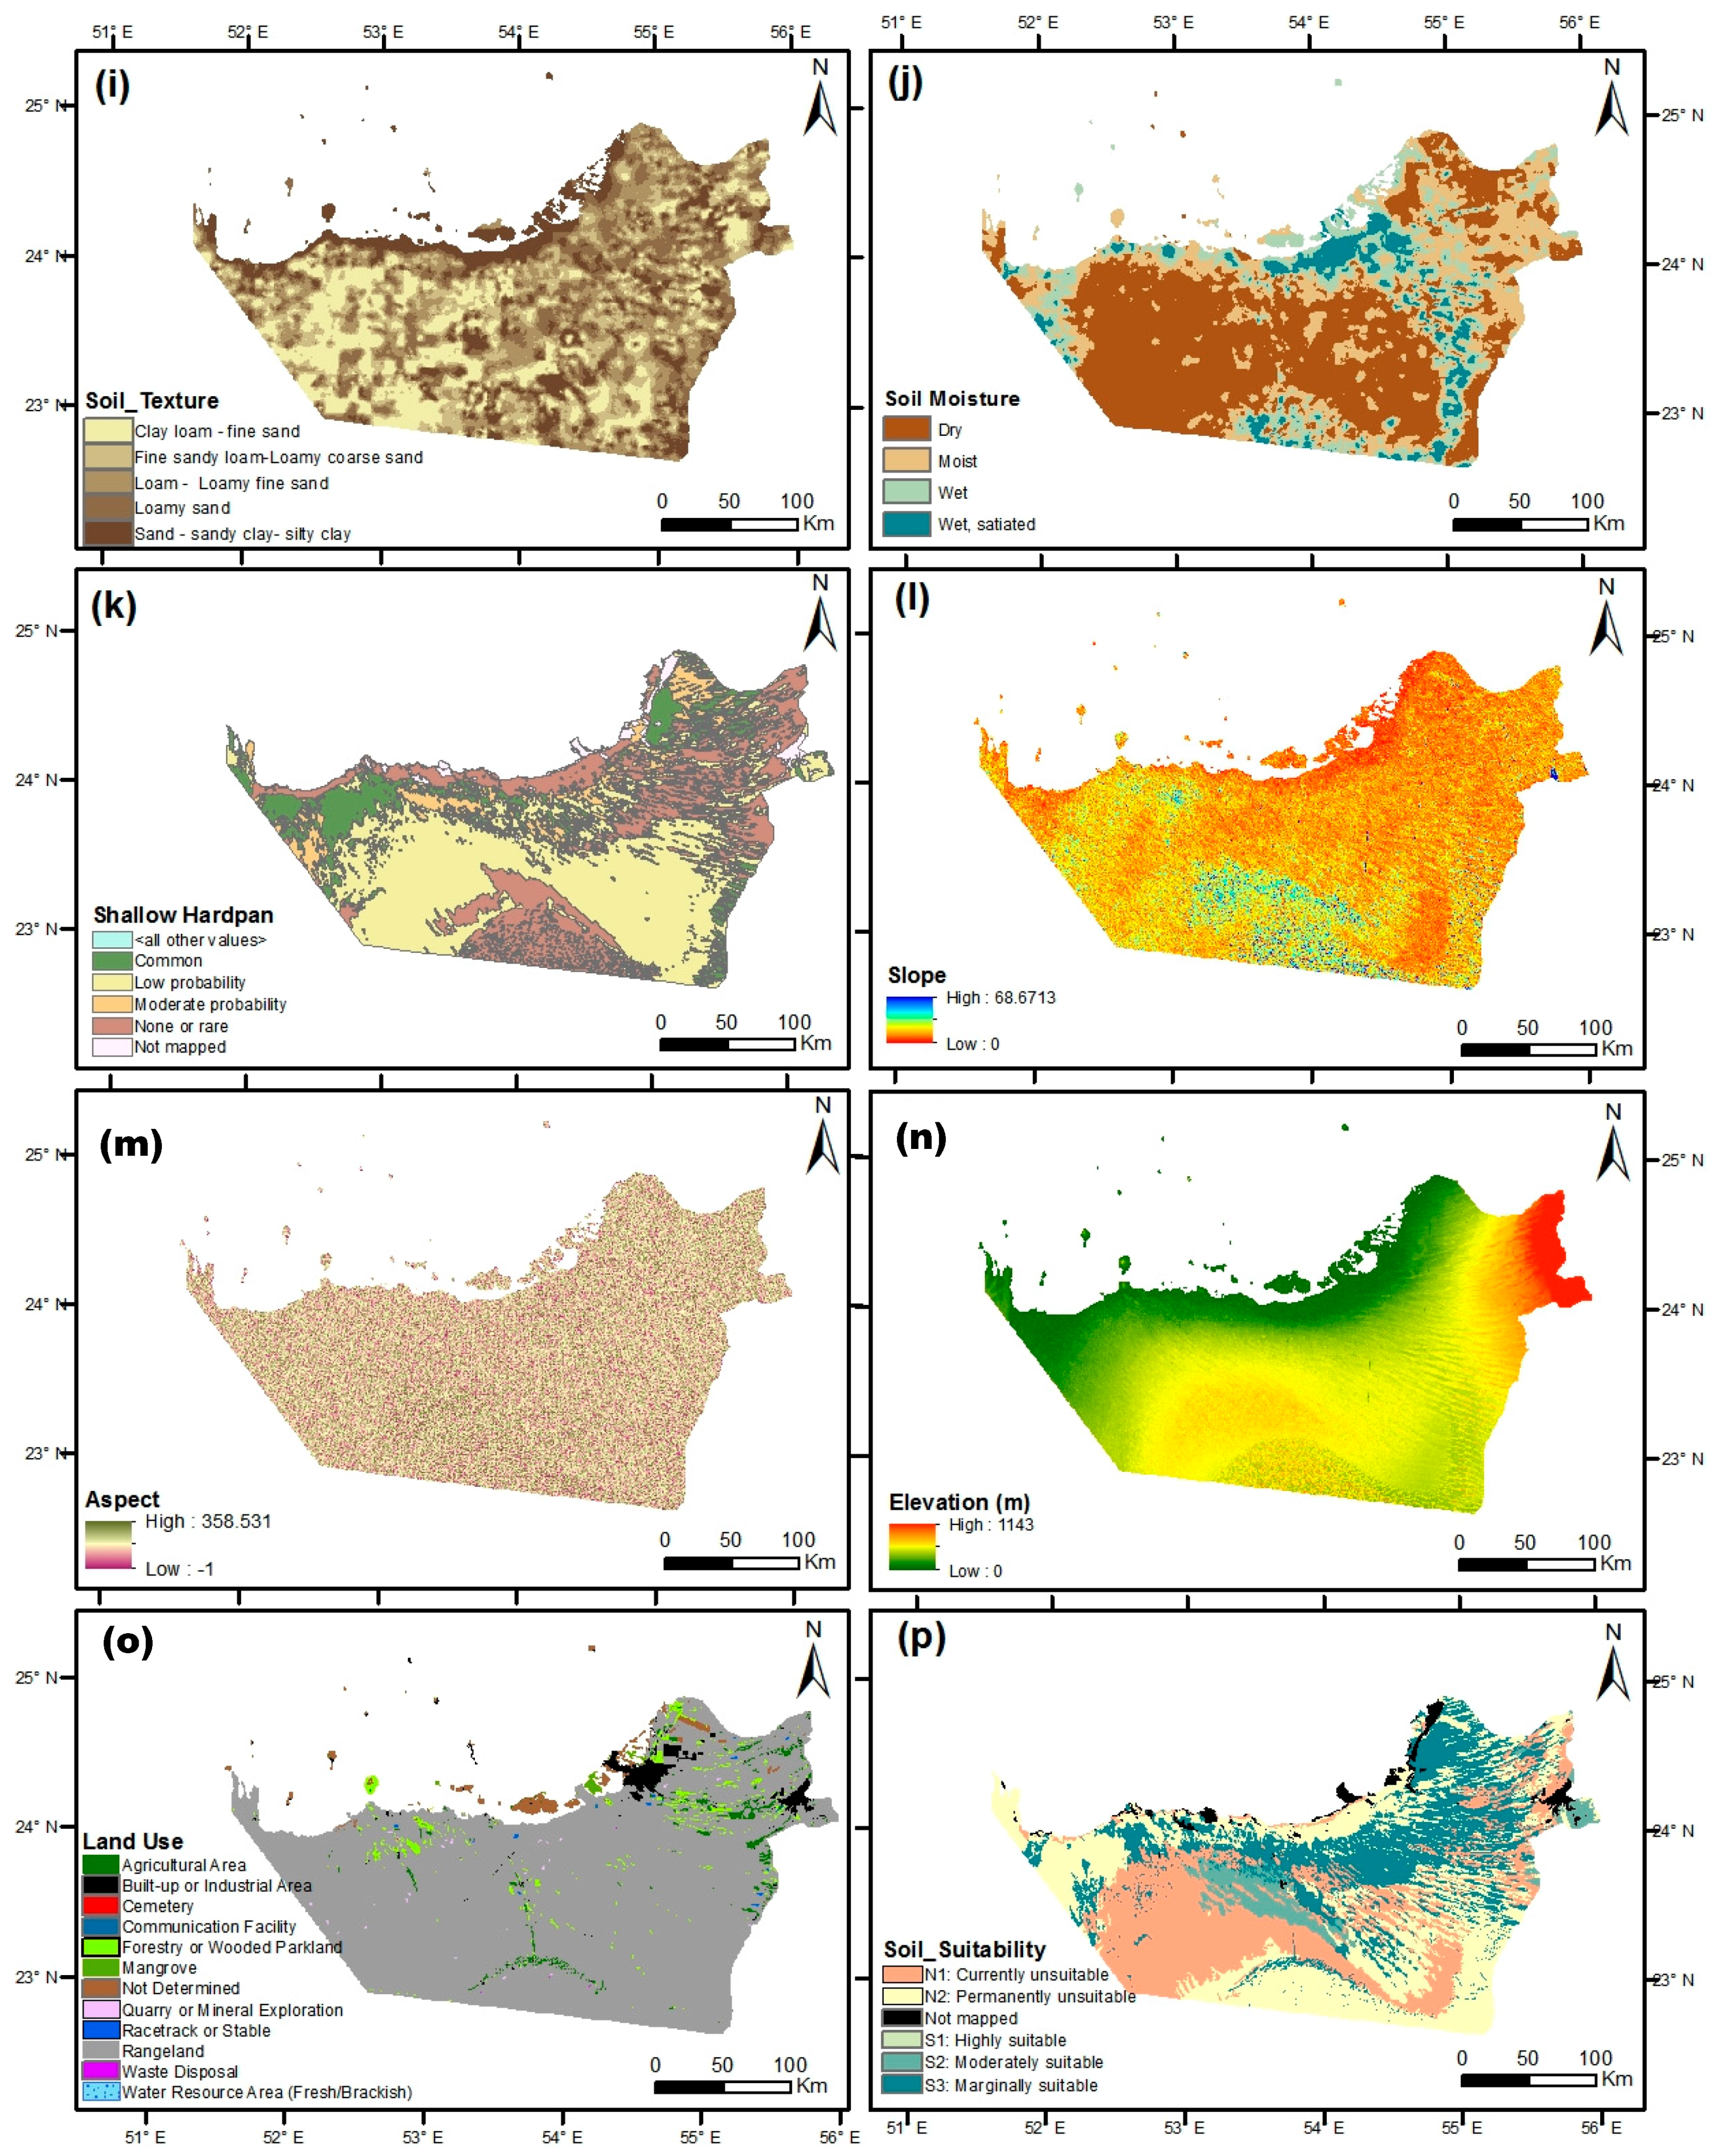
| Soil texture | Numerical datasets containing soil texture at specific locations all over Abu Dhabi Emirate | EAD, 2016 | Soil Texture affects soil ability to drain water, retain moisture, grow crops, be aerated and react to changes climate. | |
| Soil water content | Numerical datasets containing soil water content at specific locations all over Abu Dhabi Emirate | EAD, 2016 | Evaporation has a directly proportional relationship with soil moisture content; it increases with increasing soil moisture [63]. Severe soil moisture deficits affect specific growth stages which affect plant growth and productivity [64]. | |
| Soil Depth | Spatial datasets containing soil depth | EAD, 2016 | Soil Depth is another critical criterion that defines land suitability for irrigated agriculture and it changes significantly among different soil types [49]. | |
| Topography | Elevation | Derived from the DEM data (30 m resolution) | [65] | Elevation changes affect critical environmental factors like temperature thus affecting plants respiration and photosynthesis [66]. Land elevation also has a direct impact on the soil nitrogen and organic carbon content and thus has an indirect relationship with crop yields [67] |
| Surface slope | Derived from the DEM data (30 m resolution) | [65] | The slope degree could be considered a restriction to land capability for irrigated agriculture [68] as it negatively restricts management and machinery applications such as irrigation, tillage and drainage [69] and determines the type of the irrigation system to be used and the flow rate, hence affecting crop yields and irrigation cost [68]. Slope also affects land productivity as high steep lands suffer from soil loss. | |
| Aspect | Derived from the DEM data (30 m resolution) | [68] | Land aspect is a driver in agricultural productivity, as plants need sun exposure at specific intervals in their lifespan in order to maintain some of their crucial processes. It also has significant effects on the soil quality [70]. | |
| Management | Land Use | Derived from MODIS | MODIS, 2016 | The map is generated from the Moderate Resolution Imaging Spectroradiometer (MODIS) Land Cover Data Base. The spatially aggregated data for each year in the period 2001–2012 is used at 0.5° × 0.5° resolution. |
| Land suitability for agriculture | Abu Dhabi Emirate soil classification for irrigated agriculture suitability | [71] | The land suitability for irrigated agriculture is classified into five main categories ranging from most suitable to permanently unsuitable for irrigated agriculture based on eight different soil parameters. |
| Class | Description |
|---|---|
| Highly suitable (S1) | This soil is capable of producing sustained high yield. It is usually well-drained, deep, fine sandy-textured and has low soluble salts, gypsum content, calcium carbonate content, sodicity and neutral pH. |
| Moderately Suitable (S2) | This soil has a lower productive capacity than S1. It usually has a sandy texture, deep, well or excessively drained, slightly saline, non-sodic and has low gypsum content. |
| Marginally suitable (S3) | This soil is moderately deep, it has a sand to sandy load textures and is single grained or massive. It is typically slightly saline and has moderate gypsum content. It usually occurs in moderately steep gradient. |
| Currently unsuitable (N1) | This soil has high gypsum content, high steep gradients and high relief. It also has a shallow rooting depth with hardpans close to the surface. |
| Permanently unsuitable (N2) | This is a very shallow soil, associated with rock outcrops and on very steeply sloping land and a very high relief. It is usually very poorly drained, have the shallow depth to gypsum and strongly saline. |
| Soil | Topography | Climate | Water Resources | Management | References | |||||||||||||
|---|---|---|---|---|---|---|---|---|---|---|---|---|---|---|---|---|---|---|
| Crop Type | Suitability Index | Conductivity (Millimhos/cm at 25 C) | Soil Texture | Soil Depth/Hardpan (m) | Soil water content/Soil Moisture | Elevation | Surface slope% | Aspect | Precipitation (mm) | Temperature (C) | Relative Humidity (%) | Groundwater availability | Distance to TSE Facility (km) | Distance to Desalinated Water (km) | Groundwater Salinity (ppm) | Soil Capabilities | Land Use 1 | |
| Date Palm | S1 | 0–2 | Sand | >2 m | >140 mm | −392 to 1500 | <10% | NE | 500–600 | 20–32 | 37–77 | Common | 0–10 | 0–10 | <7630 | S1 | 1 | [84,85] [84] [85] |
| S2 | 2 to 4 | Sandy loam | <2 | <140 mm | <392 | E | <500 | 32–38 | <37 | Moderate probability | 10–20 | 10–20 | 7630–12,530 | S2 | ||||
| S3 | 8 to 16 | Clay | >1500 | SE | <63 | 38–56 | >77 | Low probability | 20–30 | 20–30 | 12,530–22,400 | S3 | 2 | |||||
| N1 | >17 | >10% | 0-7 | None or rare | >30 | >30 | >22,400 | N1 | 3 | |||||||||
| N2 | <0 or >56 | Not mapped | N2 | 4 | ||||||||||||||
| Vegetable | S1 | 0.02–0.4 | Loamy, loamy sand | 0.6 | >5% | 2134 | <0.1 | NE | 3600 | 15–20 | <50 | Common | 0–10 | 0–10 | <2380 | S1 | 1 | [85] [86] [87] [88] [89] |
| S2 | 0.4–0.6 | LL, LT | 0.4 | <5% | 0.1–1 | E | 20–30 | 50–60 | Moderate probability | 10–20 | 10–20 | 2380–3150 | S2 | |||||
| S3 | 0.8–1.2 | heavy clay | 0.25 | 1.0–1.5 | SE | 70–15 | 60–90 | Low probability | 20–30 | 20–30 | 3150–4480 | S3 | 2 | |||||
| N1 | 1.2–3.2 | >1.5 | NW, SW | >40 | >90 | None or rare | >30 | >30 | >4480 | N1 | 3 | |||||||
| N2 | >3.2 | 0 | Not mapped | N2 | 4 | |||||||||||||
| Fruits | S1 | <1.5 | coarse loam, loamy sand, find loam | >0.9 | >2.5% | 1066–1828 | 02–12.0% | NE | 900–1000 | 15–20 | <50 | Common | 0–10 | 0–10 | <250 | S1 | 1 | [50] [89] [90] [84] |
| S2 | 1.5–2.7 | Sand to Clay | <0.9 | <2.5% | 100–1066 | 0–2% | E | <900 | 20–30 | 50–60 | Moderate probability | 10–20 | 10–20 | 250–750 | S2 | |||
| S3 | 2.7–5.5 | Silt clay | 1828–5000 | 12–18% | SE | <15–12.5 and >30 | 60–90 | Low probability | 20–30 | 20–30 | 750–3000 | S3 | 2 | |||||
| N1 | >5.5 | 18–30 | <12.5 | >90 | None or rare | >30 | >30 | >3000 | N1 | 3 | ||||||||
| N2 | >30 | Not mapped | N2 | 4 | ||||||||||||||
| Cereal | S1 | 1.21–1.6 | Sand | 1–1.5 | Good | 2500–3000 | <0.1 | NE | 600–800 | 15–20 | 50–90 | Common | 0–10 | 0–10 | <4480 | S1 | 1 | [91] [91] [92] [93] [85] |
| S2 | 1.6–6 | Loam | 1.5–2.5 | 5% | <2500 | 0.1–1 | E | 450–600 | 20–25 | <50, >90 | Moderate probability | 10–20 | 10–20 | 4480–6100 | S2 | |||
| S3 | >6 | Clay | 2.0–5.0 | SE | 10.0–15.0 | Low probability | 20–30 | 20–30 | 6100–8400 | S3 | 2 | |||||||
| N1 | NW, SW | <10 | None or rare | >30 | >30 | >8400 | N1 | 3 | ||||||||||
| N2 | Not mapped | N2 | 4 | |||||||||||||||
| Sorghum | S1 | 1.21–1.6 | Loamy | 1–1.5 | Good | <1500 | 0.1–0.5 | NE | >150 | 25–35 | 30–50 | Common | 0–10 | 0–10 | <1890 | S1 | 1 | [94] [85] |
| S2 | 5.1–7.2 | <1 | 5% | 1500–1800 | 0.5–2.0 | E | <150 | 25–15 | <30, >50 | Moderate probability | 10–20 | 10–20 | 1890–2380 | S2 | ||||
| S3 | 11 | Very heavy clay | 2.0–5.0 or <0.1 | SE | 25–37 | Low probability | 20–30 | 20–30 | 2380–5040 | S3 | 2 | |||||||
| N1 | 18 | NW, SW | <10 | >30 | >30 | >5040 | N1 | 3 | ||||||||||
| N2 | >37 | None or rare | N2 | 4 | ||||||||||||||
| Forage | S1 | 1.21–3.4 | Sandy Loam, Loamy | 1–2 m | 5–10% | 1200–4000 | leveled | NE | 800–1000 | 25 | 10.0–12 | Common | 0–10 | 0–10 | <3990 | S1 | 1 | [95,96] [85] [97] |
| S2 | 3.4–5.4 | SL, S | >2 | <1200 | <0.1 | E | <800 | 25–30 & 10–25 | 12.0–40 | Moderate probability | 10–20 | 10–20 | 3990–6300 | S2 | ||||
| S3 | 5.4–8.8 | Clay loam | SE | >30 | 40–60 | Low probability | 20–30 | 20–30 | 6300–9100 | S3 | 2 | |||||||
| N1 | 8.8–15.5 | NW, SW | >30 | >30 | >9100 | N1 | 3 | |||||||||||
| N2 | 15.5 | Shallow hardpan | None or rare | N2 | 4 | |||||||||||||
| Jojoba | S1 | Sand, loamy sand | >2.0 | >0.64% | 0–1500 | <5.0 | NE | 200–380 | 27–30 | 75–52 | Common | 0–10 | 0–10 | <2000 | S1 | 1 | [98,99] [100] [101] | |
| S2 | Heavy soil | 0.9–1.0 | <0.64% | E | 76–200 and > 380 | 30–40 | Moderate probability | 10–20 | 10–20 | 2000–7000 | S2 | 2 | ||||||
| S3 | 6.0–10.0 | Silt, clay, silty loam, sand | SE | <76 | 40–50 | None or rare | 20–30 | 20–30 | S3 | 2 | ||||||||
| N1 | <−1 up to −5 | >30 | >30 | N1 | 3 | |||||||||||||
| N2 | <−9 | Not mapped | N2 | 4 | ||||||||||||||
| Crop | Conductivity (Millimhos/cm at 25 °C) | Soil Texture | Soil Depth | Soil Water Content | Elevation | Surface Slope | Aspect | Precipitation (mm) | Temperature (°C) | Relative Humidity (%) | Groundwater Table | Distance to TSE | Distance to Desalinated Water | Groundwater Salinity | Soil Suitability | Land Use |
|---|---|---|---|---|---|---|---|---|---|---|---|---|---|---|---|---|
| Date Palm | 3 | 2 | 2 | 3 | 5 | 5 | 4 | 5 | 2 | 4 | 1 | 4 | 2 | 2 | 2 | 3 |
| Vegetable | 2 | 2 | 3 | 3 | 4 | 3 | 3 | 2 | 1 | 5 | 2 | 3 | 2 | 2 | 2 | 3 |
| Fruits | 1 | 2 | 2 | 4 | 4 | 3 | 3 | 3 | 2 | 5 | 3 | 5 | 2 | 2 | 2 | 3 |
| Cereal | 3 | 2 | 3 | 1 | 5 | 2 | 4 | 3 | 3 | 5 | 2 | 5 | 3 | 2 | 2 | 3 |
| Sorghum | 5 | 2 | 2 | 3 | 5 | 2 | 4 | 3 | 1 | 5 | 3 | 2 | 3 | 5 | 3 | 3 |
| Forage | 3 | 3 | 5 | 2 | 5 | 3 | 4 | 5 | 2 | 2 | 3 | 2 | 3 | 5 | 3 | 3 |
| Jojoba | 4 | 3 | 2 | 4 | 5 | 5 | 4 | 5 | 1 | 5 | 5 | 2 | 3 | 5 | 3 | 3 |
| Intensity of Importance | Definition | Explanation |
|---|---|---|
| 1 | Equal importance | Two activities contribute equally to the objectives |
| 3 | Moderate importance | Experience and judgment slightly favor one activity over another |
| 5 | Strong importance | Experience and judgment strongly favor one activity other another |
| 7 | Very strong or demonstrated importance | An activity is favored very strongly over another, its dominance demonstrated in practice |
| 9 | Extreme importance | The evidence favoring one activity over another is of the highest possible order of affirmation |
| 2,4,6,8 | For compromise between the above values | Sometimes one needs to interpolate a compromise judgment numerically because there is no good word to describe it |
| Reciprocals of above | If activity i has one of the above nonzero numbers assigned to it when compared with activity j, then j has the reciprocal value when compared with i. | A comparison is mandatory by choosing the smaller element as the unit to estimate the larger one as a multiple of that unit. |
| Rational | Rations arising from the scale | If consistency were to be forced by obtaining n numerical value to span the matrix |
| 1.1–1.9 | For tied activities | When elements are close and nearly indistinguishable; moderate is 1.3 and extreme is 1.9 |
| Main Categories | Soil Capability—SC | Climate—C | Water Resources—WR | Topography—T | Management—M | Sum | Soil Capability—SC | Climate—C | Water Resources—WR | Topography—T | Management —M | Sum | Priority | Rank |
|---|---|---|---|---|---|---|---|---|---|---|---|---|---|---|
| SC | 1 | 1 | 1 | 6 | 9 | 18 | 0.3048 | 0.3039 | 0.3076 | 0.2857 | 0.32142 | 1.524 | 30.50% | 2 |
| C | 1 | 1 | 1 | 6 | 8 | 17 | 0.3048 | 0.3039 | 0.3076 | 0.2857 | 0.28571 | 1.488 | 29.80% | 3 |
| WR | 1 | 1 | 1 | 7 | 9 | 19 | 0.3048 | 0.3039 | 0.3076 | 0.3333 | 0.32142 | 1.571 | 31.40% | 1 |
| T | 0.17 | 0.17 | 0.14 | 1 | 1 | 2.48 | 0.0518 | 0.0516 | 0.0430 | 0.0476 | 0.03571 | 0.23 | 4.60% | 4 |
| M | 0.11 | 0.12 | 0.11 | 1 | 1 | 2.34 | 0.0335 | 0.0364 | 0.0338 | 0.0476 | 0.03571 | 0.187 | 3.80% | 5 |
| N | 1 | 2 | 3 | 4 | 5 | 6 | 7 | 8 | 9 | 10 |
|---|---|---|---|---|---|---|---|---|---|---|
| RI | 0 | 0 | 0.52 | 0.89 | 1.11 | 1.25 | 1.35 | 1.40 | 1.45 | 1.49 |
| Goal | Main Criteria | Weight | CR | Criteria | Weight | CR | Sub-Criteria | Weight | Category | CR | Total Weight |
|---|---|---|---|---|---|---|---|---|---|---|---|
| Land Suitability for Irrigated Agriculture-LSIAI-date palm | Soil Capability | 0.305 | 0.33 | Soil Texture | 0.311 | 2.50 | Sand | 0.724 | S1 | 6.8 | 0.068631 |
| Sandy Loam | 0.193 | S2 | 0.018321 | ||||||||
| Clay | 0.083 | S3 | 0.007819 | ||||||||
| Soil Moisture, mm/m | 0.28 | >140 | 0.900 | S1 | 0 | 0.076831 | |||||
| <140 | 0.100 | S2 | 0.008494 | ||||||||
| Soil Salinity (dS/m) | 0.342 | 0–2 | 0.579 | S1 | 9.9 | 0.060302 | |||||
| 2–8 | 0.233 | S2 | 0.024240 | ||||||||
| 8–16 | 0.152 | S3 | 0.015878 | ||||||||
| >17 | 0.036 | N1 | 0.003798 | ||||||||
| Soil Depth, m | 0.067 | >2 m | 0.900 | S2 | 0 | 0.018385 | |||||
| <2 m | 0.100 | N1 | 0.002033 | ||||||||
| Climate | 0.298 | Precipitation, mm per year | 0.624 | 1.9 | >600 | 0.615 | S2 | 6.8 | 0.114212 | ||
| 500–600 | 0.319 | S1 | 0.059168 | ||||||||
| <500 | 0.066 | S3 | 0.012218 | ||||||||
| Temperature, °C | 0.239 | 20–32 | 0.449 | S1 | 7.9 | 0.031957 | |||||
| 32–38 | 0.298 | S2 | 0.021163 | ||||||||
| 38–56 | 0.185 | N1 | 0.013172 | ||||||||
| zero to 7 | 0.034 | S3 | 0.002406 | ||||||||
| >56 | 0.034 | N2 | 0.002406 | ||||||||
| Relative Humidity, % | 0.137 | 37–77% | 0.900 | S1 | 0 | 0.036818 | |||||
| <37, >77% | 0.100 | S2 | 0.004070 | ||||||||
| Water Resources | 0.314 | Groundwater Availability | 0.354 | 0.9 | Common | 0.558 | S1 | 6.3 | 0.062180 | ||
| Moderate Probability | 0.267 | S2 | 0.029767 | ||||||||
| Low Probability | 0.133 | S3 | 0.014804 | ||||||||
| None or rare | 0.041 | N1 | 0.004610 | ||||||||
| Groundwater Salinity (ppm) | 0.432 | <7630 | 0.616 | S1 | 5.5 | 0.083714 | |||||
| 7630–12,530 | 0.241 | S2 | 0.032737 | ||||||||
| 12,530–22,400 | 0.098 | S3 | 0.013306 | ||||||||
| >22,400 | 0.045 | N1 | 0.006045 | ||||||||
| Distance to Desalinated Water (m) | 0.109 | 0–10,000 | 0.558 | S1 | 6.3 | 0.019179 | |||||
| 10,000–20,000 | 0.267 | S2 | 0.009182 | ||||||||
| 20,000–30,000 | 0.133 | S3 | 0.004566 | ||||||||
| >30,000 | 0.041 | N1 | 0.001422 | ||||||||
| Distance to TSE (m) | 0.104 | 0–10,000 | 0.558 | S1 | 6.3 | 0.018284 | |||||
| 10,000–20,000 | 0.267 | S2 | 0.008753 | ||||||||
| 20,000–30,000 | 0.133 | S3 | 0.004353 | ||||||||
| >30,000 | 0.041 | N1 | 0.001356 | ||||||||
| Topography | 0.046 | Aspect | 0.581 | 0.4 | NE, flat area | 0.764 | S1 | 6.8 | 0.020428 | ||
| N, E, SE, | 0.167 | S2 | 0.004456 | ||||||||
| W, NW, SW | 0.069 | S3 | 0.001853 | ||||||||
| Slope % | 0.309 | <10% | 0.900 | S1 | 0 | 0.012804 | |||||
| <140 mm/m | 0.100 | S2 | 0.001416 | ||||||||
| Elevation, m | 0.109 | 392–1500 | 0.724 | S1 | 6.8 | 0.003639 | |||||
| <392 | 0.193 | S2 | 0.000971 | ||||||||
| >1500 | 0.083 | S3 | 0.000415 | ||||||||
| Management | 0.037 | Soil Suitability | 0.667 | 0 | Most Suitable | 0.537 | S1 | 8.8 | 0.013414 | ||
| Moderately Suitable | 0.235 | S2 | 0.005871 | ||||||||
| Marginally Suitable | 0.143 | S3 | 0.003557 | ||||||||
| Currently Unsuitable | 0.052 | N1 | 0.001293 | ||||||||
| Unsuitable | 0.033 | N2 | 0.000823 | ||||||||
| Land use | 0.333 | Agricultural Land | 0.642 | S1 | 5.2 | 0.008010 | |||||
| Forestry and Rangeland | 0.221 | S2 | 0.002764 | ||||||||
| Waste Disposal & Stable | 0.086 | S3 | 0.001078 | ||||||||
| Buit-up Area, Mangrove, Commercial and Cemetery | 0.050 | N1 | 0.000627 |
| Acronym | Full Name | Acronym | Full Name | Acronym | Acronym | Acronym | Full Name | Acronym | Full Name |
|---|---|---|---|---|---|---|---|---|---|
| S | Weight index of Soil capability main criteria | C | Weight index of Climate main criteria | W | Weight index of Water main criteria | T | Weight index of Topography main criteria | M | Weight index of Management main criteria |
| S1Cwi | Weight index of soil texture criteria | C1Cwi | Weight index of precipitation criteria | W1Cwi | Weight index of groundwater criteria | T1Cwi | Weight index of aspect criteria | M1Cwi | Weight index of soil suitability criteria |
| S1SCwi | Weight index of texture sub-criteria | C1CCwi | Weight index of precipitation sub-criteria | W1WCwi | Weight index of groundwater sub-criteria | T1CCwi | Weight index of aspect sub-criteria | M1MCwi | Weight index of soil suitability sub-criteria |
| S2Cwi | Weight index of soil moisture | C2Cwi | Weight index of temperature criteria | W2Cwi | Weight index of groundwater salinity criteria | T2Cwi | Weight index of slope criteria | M2Cwi | Weight index of land use criteria |
| S2SCwi | Weight index of moisture sub-criteria | C2CCwi | Weight index of temperature sub-criteria | W2WCwi | Weight index of groundwater salinity sub-criteria | T2TCwi | Weight index of slope sub-criteria | M2MCwi | Weight index of land use sub-criteria |
| S3Cwi | Weight index of soil salinity | C3Cwi | Weight index of relative humidity criteria | W3Cwi | Weight index of desalinated water availability criteria | T3Cwi | Weight index of elevation criteria | ||
| S3SCwi | Weight index of salinity sub-criteria | C3CCwi | Weight index of relative humidity sub-criteria | W3WCwi | Weight index of desalinated water availability sub-criteria | T3TCwi | Weight index of elevation sub-criteria | ||
| S4Cwi | Weight index of soil depth | W4Cwi | Weight index of TSE availability criteria | ||||||
| S4SCwi | Weight index of depth sub-criteria | W4WCwi | Weight index of TSE availability sub-criteria |
| Land Suitability Category | Date Palm | Vegetables | Fruits | Cereals | Sorghum | Forage | Jojoba | |||||||
|---|---|---|---|---|---|---|---|---|---|---|---|---|---|---|
| Area/Ha | % | Area/Ha | % | Area/Ha | % | Area/Ha | % | Area/Ha | % | Area/Ha | % | Area/Ha | % | |
| S1 | 867,477 | 15 | 405,574 | 7 | 936,917 | 16 | 406,374 | 7 | 1,035,275 | 18 | 825,664 | 14 | 1,425,119 | 25 |
| S2 | 867,477 | 15 | 732,286 | 13 | 2,246,343 | 39 | 1,162,680 | 20 | 1,198,128 | 21 | 2,035,884 | 36 | 3,212,172 | 56 |
| S3 | 1,701,156 | 30 | 2,715,090 | 47 | 959,493 | 17 | 914,341 | 16 | 732,835 | 13 | 1,017,942 | 18 | 995,321 | 17 |
| N1 | 1,825,082 | 32 | 1,239,253 | 22 | 451,526 | 8 | 2,223,767 | 39 | 2,024,022 | 35 | 1,402,498 | 25 | 22,621 | 0 |
| N2 | 461,903 | 8 | 630,892 | 11 | 1,128,816 | 20 | 1,015,934 | 18 | 732,835 | 13 | 441,108 | 8 | 67,862 | 1 |
| Land Suitability Category | AED Map [14] | This Study Map | Difference % | |||
|---|---|---|---|---|---|---|
| Area | % | Area | % | |||
| Most suitable | S1 | 803,609 | 14.04% | 867,477 | 15% | 0.9600% |
| Moderately suitable | S2 | 932,816 | 16.29% | 867,477 | 15% | −1.2900% |
| Marginally suitable | S3 | - | - | 1,701,156 | 30% | 30% |
| Not suitable | N1 | 1,748,952 | 30.56% | 1,825,082 | 32% | 1.4400% |
| Permanently not suitable | N2 | 2,237,718 | 39.11% | 461,903 | 8% | −31.1100% |
| Original | Temperature = 20% | Rain = 20% | Groundwater Depth = 20% | Groundwater Salinity = 20% | Soil Texture = 20% | Soil Depth = 20% | |
|---|---|---|---|---|---|---|---|
| S1 | 15% | 10% | 9% | 10% | 8% | 7% | 7% |
| S2 | 15% | 23% | 22% | 14% | 7% | 19% | 25% |
| S3 | 30% | 35% | 33% | 31% | 23% | 31% | 38% |
| N1 | 32% | 19% | 22% | 29% | 41% | 21% | 14% |
| N2 | 8% | 13% | 14% | 16% | 20% | 21% | 16% |
© 2018 by the authors. Licensee MDPI, Basel, Switzerland. This article is an open access article distributed under the terms and conditions of the Creative Commons Attribution (CC BY) license (http://creativecommons.org/licenses/by/4.0/).
Share and Cite
Aldababseh, A.; Temimi, M.; Maghelal, P.; Branch, O.; Wulfmeyer, V. Multi-Criteria Evaluation of Irrigated Agriculture Suitability to Achieve Food Security in an Arid Environment. Sustainability 2018, 10, 803. https://doi.org/10.3390/su10030803
Aldababseh A, Temimi M, Maghelal P, Branch O, Wulfmeyer V. Multi-Criteria Evaluation of Irrigated Agriculture Suitability to Achieve Food Security in an Arid Environment. Sustainability. 2018; 10(3):803. https://doi.org/10.3390/su10030803
Chicago/Turabian StyleAldababseh, Amal, Marouane Temimi, Praveen Maghelal, Oliver Branch, and Volker Wulfmeyer. 2018. "Multi-Criteria Evaluation of Irrigated Agriculture Suitability to Achieve Food Security in an Arid Environment" Sustainability 10, no. 3: 803. https://doi.org/10.3390/su10030803