Improving Sustainability through a Dual Audit System

1
Faculty of Management and Economics, Kunming University of Science and Technology, Kunming 650500, China
2
Department of Accounting, College of Business and Economics, Chung-Ang University, Seoul 06974, Korea
*
Author to whom correspondence should be addressed.
Sustainability 2018, 10(1), 137; https://doi.org/10.3390/su10010137
Submission received: 29 November 2017
/
Revised: 4 January 2018
/
Accepted: 5 January 2018
/
Published: 8 January 2018
(This article belongs to the Section Economic and Business Aspects of Sustainability)
Abstract
:As a consequence of a large-scale accounting fraud, China implemented a dual audit system for listed companies issuing foreign stocks (B shares and H shares) from 2001 to 2006, before adopting Chinese-IFRS in 2007. At the end of 2010, the EU proposed that listed corporations over a certain size should be required to implement a joint audit system. However, only a few countries have implemented this system, and thus, data and references are extremely limited. The dual audit system is called the “twin” of the joint audit system. We analyze whether the dual system improves a company’s earnings quality. Earnings quality is studied by means of real earnings management, and the variable of loss aversion. We find that real earnings management of dual audited enterprises is lower than that of single audited (A-share) enterprises, and the inclination toward loss aversion of enterprises in the foreign share market has not increased significantly relative to the A-share enterprises after the abolition of the dual audit system. The results indicate that a dual audit system improves earnings quality. We expect that the conclusions of this research will resolve the issues and concerns about the joint audit system.
1. Introduction
Improving accounting transparency in the capital markets has long been one of the major concerns of regulatory agencies worldwide. A joint audit system was put into trial use in countries such as Canada, Denmark, and Sweden, but is currently only implemented by France for listed companies of a specific size. To improve the quality of accounting information and to rebuild the trust of external users of corporate accounting information, the European Union (EU) published its Green Paper on audit policy, “Audit policy: lessons from the crisis at the end of 2010” [1]. The draft stressed that a joint audit is the most powerful audit approach, and in addition to reducing financial system social investment failure costs, it could also enhance the confidence of investors in the financial market. The draft required that listed companies with more than 100 million Euros in assets hire two accounting firms to participate in a joint audit of the company’s financial statements, and that at least one of the accounting firms be a non-Big Four firm.
The joint audit approach, as advocated by the EU, has given rise to wide concerns in both academic and practical circles. If it is widely implemented by other countries, a joint audit needs to be supported by a rich theoretical basis and empirical conclusions. However, due to data limitations, scholars from various countries have been unable to achieve consensus on the implementation effects of a joint audit. A dual audit, which has been called the sister system of a joint audit, is the simplest form of a joint audit, and its implementation effects are like those of a joint audit. The dual audit and joint audit systems originated together [2]. In 2001, the Chinese government began to require dual audits for foreign capital share companies (B share and H share companies). With the introduction of new accounting standards in 2007, dual audits were eliminated for B share and H share companies in 2006 and 2010, respectively. However, because successive instances of accounting fraud occurred in major global companies, such as Enron and Xerox, the dual audit (or joint audit) is being considered once again as an emerging trend in audit systems in practitioner circles, both at home and abroad.
In this study, data of companies listed in China from 2001 to 2014 are used to conduct empirical tests to examine these problems. The results show that earnings management of foreign capital share listed companies subject to dual audits is less than that of A-share listed companies not subject to a dual audit system. After the cancellation of the dual audit requirement, there was no difference in earnings management between foreign capital share and A-share listed companies, indicating that the dual audit effectively limited earnings management of listed companies. We also compared earnings management for foreign stock companies and foreign capital share listed companies during the dual audit period and for the period after the dual audit was abolished. The relevant regression coefficient showed a significantly negative correlation, further supporting the above conclusion.
In the robustness tests, we found that the foreign share market, which had long been under the dual audit system, had a more conservative attitude toward earnings management. Moreover, the inclination toward loss aversion of A share firms steadily increased from 2002 to 2014. In contrast, foreign share firms with dual audit experience did not exhibit much change in the distribution of risk-aversion. In this study, theoretical and empirical evidence is provided to improve accounting transparency, and enrich the earnings management literature for listed companies. The study conclusions have important theoretical and practical significance.
2. Sustainability and Accounting Transparency
As the social influence of corporations grows, there has been an increase in the interest in and demand for corporate social responsibility (CSR) worldwide. In the globalization era, competition has become increasingly fierce, and for companies to maintain their competitive edge, management transparency and the implementation of ethical management have become important factors for corporate sustainability, along with basic factors such as product prices and quality. CSR is sometimes used synonymously with sustainability.
To ensure sustainability, companies should approach stakeholders in an integrated manner rather than individually. In other words, to achieve sustainability, companies must focus on all aspects of their business, including corporate governance, accounting and transparency of transactions, business ethics, labor relations, environmental management, and social contributions. Figure 1 illustrates the components of corporate sustainability. This study focuses on the relationship between financial transparency and sustainability [3,4].
To ensure transparency in accounting and improve sustainability, companies, auditors, and supervisory authorities should all play a role. However, auditors are sometimes unable to act appropriately due to independence issues. To prevent this problem, many countries are implementing rules that restrict non-audit services and enhance audit committee roles. In addition, dual audits and audits of corporate accounting can be used to increase audit transparency and sustainability. When dual audits are required, an additional auditor, who is independent of the statutory auditors, is appointed. Among the components of sustainability and CSR, this study focuses on the relationship between sustainability and the enhancement of accounting transparency through dual audits. To verify this relationship, this study uses firm data to analyze the effect of a dual audit system on financial transparency (earnings management).
3. Context and Setting of Dual Audits in China
The Chinese securities market has a unique dual structure, with markets traded by Chinese nationals, and markets traded by foreign investors. Figure 2 shows the stock types in the Chinese stock market. Securities that can be traded by Chinese nationals are referred to as A stock, and securities that can only be traded by foreign investors are called foreign stock. Foreign stock listed on the Shanghai and Shenzhen stock exchanges is referred to as B shares, and foreign stock listed on the Hong Kong Stock Exchange is referred to as H shares.
As a consequence of a large-scale accounting fraud in China, a dual audit system was introduced in 2001. This double audit system was applied only to listed financial companies and foreign equity firms that issued B and H stock. In this dual audit system, companies were subject to statutory audits and supplementary audits. An accounting firm that conducted a statutory audit was legally responsible for reviewing the truthfulness and completeness of accounting information disclosure.
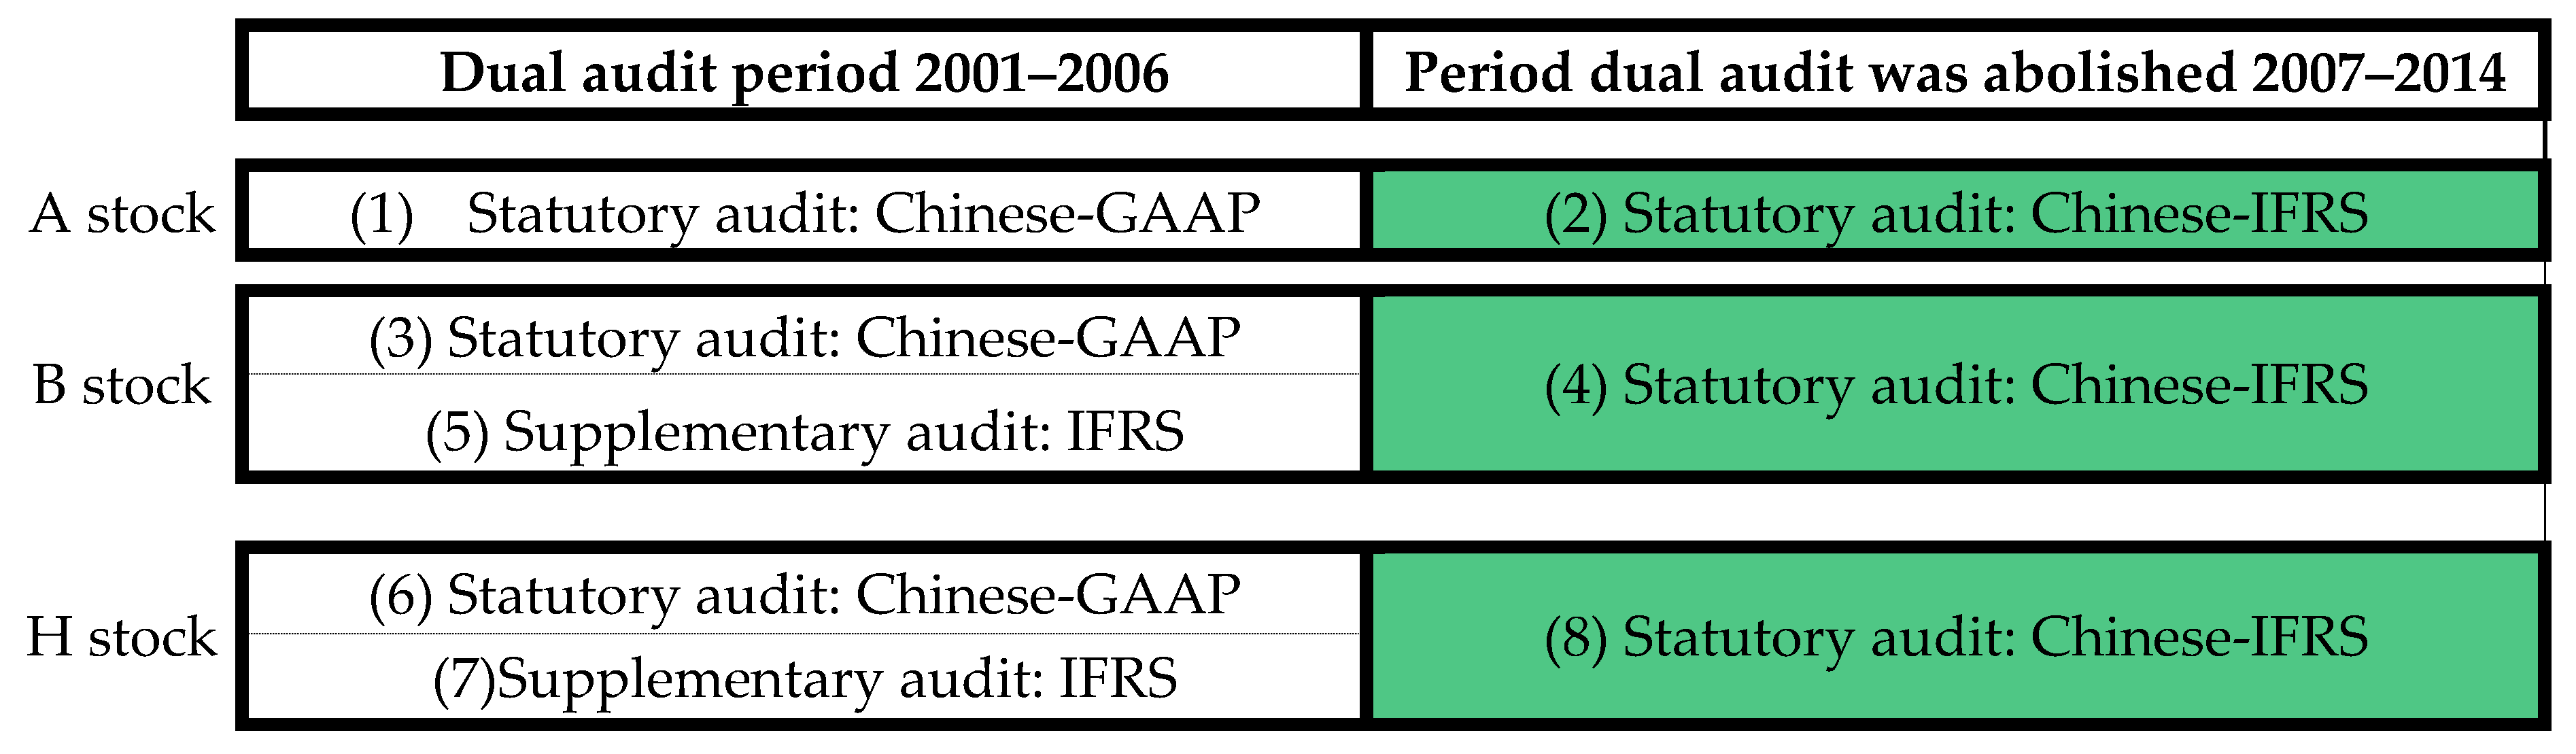
As shown in Figure 2, from 2001 to 2006 companies issuing foreign stock were required to prepare financial statements using two standards: Chinese-GAAP and IFRS. Chinese-GAAP financial statements were subject to statutory audits, and IFRS financial statements were subject to supplementary audits. Companies issuing A stock for domestic investors received statutory audits on financial statements prepared in accordance with Chinese GAAP.
In 2007, the financial authorities introduced Chinese-IFRS to enhance accounting transparency. As Chinese-IFRS was adopted, the authorities began to abolish the dual auditing system in stages. This is because Chinese-IFRS and IFRS are basically the same accounting standards, and therefore, the quality of accounting information provided to foreign investors is the same under both standards. The financial authorities eliminated the dual audit system for B shares in 2007. In addition, dual auditing was discontinued for companies issuing H shares in 2011. This study examined the effect of a dual audit on earnings quality for companies issuing foreign shares (B shares and H shares). Therefore, in the period from 2007 to 2010, H stock companies are excluded from the sample for consistent analysis.
For companies to improve corporate sustainability, it is necessary for them to take into consideration not only traditionally important financial performance, but also performance related to ethical and social issues. Promotion of sustainability can be accomplished by activating communication with external parties, such as by disclosing accurate accounting information to stakeholders.
In this study, we compare foreign equity companies with A-share companies to verify whether a dual audit improves earnings quality. We then compare the period of the dual audit for A stock corporations with the period after the dual audit was discontinued. Even though a dual audit has a positive effect on earnings quality, it is difficult to distinguish between the effects of a dual audit and the characteristics of a foreign stock company. Therefore, we also included a comparison of the periods for foreign equity firms.
According to previous research, earnings management through real activity is used to measure earnings quality. As an additional measure, we use loss avoidance tendency, which has also been used in other studies as an indicator of earnings quality.
The empirical analysis proceeds as follows. First, during the dual audit period (from 2001 to 2006), the earnings quality gap between foreign-invested companies and A-companies is verified. A foreign-funded company with dual audits is expected to have less earnings management than an A-valued company audited only according to Chinese-GAAP. To eliminate the influence of accounting standards, we compare Chinese-GAAP financial statements of foreign-capital stock companies (B stock and H stock) with Chinese-GAAP financial statements of A-share companies, as shown in Figure 2 ((3) and (6) compared to (1)). Second, we examine the difference in earnings quality between foreign-invested companies and A-listed companies after the elimination of the dual audit (2007–2014). If a foreign-equity enterprise receives a single audit, it is expected that there will be no difference in earnings management compared to an A-stock company (as illustrated in Figure 2, (4) and (8) compared to (2)). Finally, to exclude the effects of the characteristics of foreign-owned enterprises, we compare periods for foreign equity companies by comparing the earnings management of foreign stock companies before and after the dual audit (as illustrated in Figure 2, (3) and (6) compared to (4) and (8)).
4. Literature Review and Hypotheses Development
Since the EU issued its audit policy Green Paper in 2010, scholars around the world have gradually begun research on joint audits. The International Auditing and Assurance Standards Board (IAASB) suggested that the global financial crisis was caused by problems such as the weakness of external audits, the market share of the Big Four accounting firms, audit independence, and the low quality of audits, among others. Therefore, when the EU proposed a joint audit model, the IAASB focused on analyzing the effect of a joint audit, including the function of a joint audit as it relates to audit quality, the incremental audit cost of introducing a joint audit model, and the change in audit market concentration brought about by a joint audit. Ultimately, the IAASB concluded that a joint audit could effectively improve audit quality, increase market share for small accounting firms, and strengthen the competitiveness of the audit market, although it could also bring about a certain increase in audit cost. Ittonen and Tronnes [5] found that the choice of accounting policies in a joint audit model would decrease accrual manipulation; that is, a joint audit could effectively restrain earnings management of listed companies, and improve the quality of accounting information. Zerni [6] found that a joint audit could not only lower earnings management of listed companies, but also improve their credit ratings. This improvement was due to the belief of most credit raters that a joint audit not only provides better audit quality, but also adds a layer of “guaranty”, since two independent accounting firms would share the risk of audit failure. Baldauf and Steckel [7] also proposed that a joint audit model could improve the audit quality of the cooperating auditors and the accuracy of relevant information. These studies support the importance of a joint audit. When they undertake a joint audit, two independent accounting firms effectively monitor and supervise each other, which could not only improve the independence of the accounting firms and control earnings management of listed companies, but also improve accounting transparency in the financial markets.
Unlike the previously mentioned research findings, some researchers view a joint audit negatively. Because a joint audit model requires two independent auditors to jointly issue a unified audit report, when the audit fails, the responsibilities of the two auditors cannot be clearly identified, which is the most obvious disadvantage of a joint audit. Deng et al. [8] and other researchers found that a joint audit has always resulted in the phenomenon that auditors with lower competence get a “free ride” by relying on the auditors with higher competence; this weakens auditing independence, since an audit report issued jointly by two independent auditors of different capabilities is the result of mutual negotiation. In 2003, the South Korean Government also considered introducing a joint audit model, but it was never implemented because no relevant measures could be proposed to clarify the responsibilities between the auditors.
In short, if a joint audit is to be widely implemented around the world, a rich theoretical basis and empirical conclusions are needed to support it. At present, there are no lateral or longitudinal research results that use large samples to demonstrate the implementation effects of a joint audit because of research data limitations. As such, definitive conclusions cannot be made.
The main feature of a dual audit or joint audit model is that there are two independent auditors. The difference between the two audit models lies in the fact that a dual audit requires two auditors to respectively issue their own independent audit opinions, while a joint audit requires the two auditors to jointly issue a unified audit report through mutual negotiation. In a dual audit, two auditors issue two independent audit reports, which can avoid the problem of identification of the responsibilities of the two auditors in the case of an audit failure, or the phenomenon of the auditor with lower competence getting a “free ride”.
The studies about a dual audit can be divided into two perspectives. Xin [9] pointed out that an audit has commercial characteristics, and thus needs to be capitalized, and the government should not select accounting firms for listed companies when the companies are subject to audit. Therefore, the dual audit method not only goes against the stipulations of such rules as those of the Certified Public Accountant (CPA), but also violates the law of market economy in terms of “fairness” and “impartiality”. Wu [10] used audit comments to replace auditor independence, and the research results showed that there was no obvious difference in the audit comments of the authorized auditor and the supplementary auditor, suggesting that a dual audit has little effect. Cheng and Liu [2] indicated that since there is little cost for illegal behaviors in China, the accounting firm will compromise with the listed company for its own economic interest. Therefore, a dual audit does not improve audit quality; instead, it weakens the influence of audit quality.
Unlike the perspectives of previous studies, the Chinese scholar Zhang [11] pointed out that in the compulsory dual audit mode, accrued earnings management in the B-share stock market was significantly lower than in the A-share stock market. There is no significant difference between the two securities markets after the elimination of the dual audit requirement, which indicates that the dual audit can effectively control earnings management of listed companies. Fang [12] showed that a dual audit occurred under the conditions of deregulation, originating from investors who were worried about the decline of audit quality caused by the deregulation of the dual audit. The cancellation of the dual audit as “bad news” had an impact on the securities market. In another paper, Fang [12] also suggested that the deregulation of the dual audit reduced the auditing cost of listed companies, resulting in some companies that needed high quality audits giving up their audit arrangement and lowering audit quality. The chief reason for various conclusions about a dual audit model is that previous studies generally focus on horizontal comparisons over the short term. Most studies simply analyze the cross-sectional data for a certain year. Therefore, in this study, to improve accuracy, the sample volume is expanded, and real earnings management indicators are analyzed both vertically and horizontally.
In this study, the earnings management of the foreign capital share stock market and the A-share stock market are compared in a dual audit model. Dual audits were performed in China for the foreign capital share stock market, so that companies that issued foreign capital shares needed to be assessed by both a statutory audit from a domestic accounting firm and a supplementary audit from an international accounting firm at the same time. The B share enterprises were subject to dual audits from 2001 to 2006, and dual audits were required for H shares from 2001 to 2010. In the years between 2007 and 2010, China gradually eliminated audits for B share and H share companies. Since then, foreign shares have only needed to be assessed through a statutory audit, the same practice that is used for A-shares. During the period of dual audits, if a dual audit system could effectively curb earnings management in the capital market, earnings management of the foreign capital share stock market would be lower than that of the A-share stock market; thus, earnings management of the two markets would show a significantly negative correlation.
After the cancellation of the dual audit requirement, there is no difference in audit requirements between the two markets, suggesting that earnings management will not continue to show a negative correlation. Therefore, the following two hypotheses are put forward.
Hypothesis 1.
In a dual audit model, earnings management of the foreign capital share stock market and the A-share stock market presents a significantly negative correlation.
Hypothesis 2.
After the elimination of the dual audit requirement, earnings management of the foreign capital share stock market and the A-share stock market presents no significantly negative correlation.
5. Materials and Methods
5.1. Sample Description
The data and sample are obtained from the Wind database. The sample consists of A-share and foreign share (B-share and H-share) companies on the Shanghai and Shenzhen stock markets from 2001 to 2014. Considering the uniqueness of the financial industries, we exclude the banking and insurance industries to avoid noise. Our sample includes data from the following 15 industries: electronic and electric trade, metal, pharmaceutical, wood, agriculture and farming, information technology, wholesale and retail, construction, real estate, social services, and other industries. We collect our financial data for the sample period from 2001 to 2014, eliminating abnormal data and observations that are missing data. Our final sample consists of 16,822 data—year observations.
Earnings management is the act of intentionally influencing the process of financial reporting to obtain some private gain. Earnings management involves the alteration of financial reports to mislead stakeholders about the organization’s underlying performance, or to influence contractual outcomes that depend on reported accounting numbers [13]. Earnings management has a negative effect on earnings quality [14], and may weaken the credibility of financial reporting [15]. In accounting, many researchers have made various attempts to measure proxy variables of earnings management [16]. Roychowdhury [17], and Cohen and Zarowin [18] defined abnormal real activity that occurred according to changes in company conditions, such as investment activities, as real earnings management, after classifying real activities into normal activities and abnormal activities.
Real earnings management is not easily identified by regulators; it is the most elusive of all forms of earnings management. Firms can properly report cash flow from operations (CFO), costs of production, and selling and administrative expenses during the production and management process, while these factors can be classified as normal manipulations and abnormal manipulations. Real earnings management consists of abnormal real activity manipulation, and can be further broken down into abnormal manipulations of cash flow from operations, costs of production, and selling and administrative expenses [19,20,21,22,23,24].
As in Roychowdhury [17], Cochen and Zarowin [18], and Cristhian et al. [25], we focus on the following model to calculate real earnings management. We first generate the normal levels of cash flow from operations (Equation (1)), cost of production (Equation (2)), and selling and administrative expenses (Equation (3)). Abnormal CFO is actual CFO minus the normal level of CFO, while abnormal cost of production is actual cost of production minus the normal level of cost of production, and abnormal selling and administrative expenses is computed as actual selling and administrative expenses minus the normal level of selling and administrative expenses.
In the above equations, CFOt is cash flow from operations in period t as defined above; PRODt represents production costs in period t, defined as the sum of changes in operating costs and stock; SGEt represents the sum of selling expenses and administrative expenses. To eliminate effects of scale, ΔREVt is defined as the change in prime operating revenue in period t; REVt is operating revenue in period t; REVt − 1 represents operating revenue in period t − 1, and ΔREVt − 1 is defined as the change in prime operating revenue of period t − 1.
Consistent with Cohen and Zarowin [18] and Cristhian et al. [25], we find exceptionally high levels of costs of production result in exceptionally low levels of cash flows. When we calculate the aggregated variable, simultaneously adding and subtracting abnormal costs of production and abnormal operating cash flows leads to repetitive computations of the variables. We usually use the sum of abnormal costs of production with selling expenses and administrative expenses, or the sum of abnormal operating cash flows with selling expenses and administrative expenses to analyze abnormal aggregated variables.
Our sample is distributed among 15 industries. In addition to manufacturing, the sample also includes wholesale and retail, construction, real estate, social services, and other industries, so we use the sum of abnormal operating cash flow with selling expenses and administrative expenses as the abnormal aggregated variable in the model. This variable can be used in all industries in this study, so to maintain direction consistency, we first take abnormal operating cash flow and selling expenses and administrative expenses multiplied by (−1).
EMt = abCFOt × (−1) + abSGEt × (−1)
EMt represents the metric of real earnings management in period t, abCFOt is abnormal operating cash flow, calculated as actual operating cash flow minus normal operating cash flow, and abSGEt represents abnormal selling expenses and administrative expenses in period t, which is equal to actual selling and administrative expenses minus normal selling and administrative expenses.
5.2. Mode and Description of Variables
As implemented in Cohen and Zarowin [18], we express EMt as the dependent variable, and build a regression model as follows to examine our hypotheses.
EMt = a0 + a1DUALt + a2LEVt + a3SIZEt + a4OCFt + a5LOSSt + a6LARGEt + a7STATEt + a8BOARDt + a9BIG4t + a10Yeart + et
In this formula, DUALt represents the experimental variable, and the other variables are used as control variables as in related literature; year represents an annual variable to control for year effects. The controls include both financial and non-financial variables. Financial variables represent firm financial characteristics such as leverage, total assets, operating cash flow, and current profit or loss, that are likely associated with the dependent variable [26,27,28,29,30,31,32,33,34]. The non-financial variables include the largest shareholder, whether the firm is state-owned, frequency of board meetings, and whether the audit firm is a big four audit firm [35,36,37,38,39,40,41]. The specific definitions of the variables are shown in Table 1.
6. Results
6.1. Descriptive Analysis
Table 2 shows the descriptive analysis of the major variables. The mean of the dependent variable is −0.091, which represents earnings management of foreign firms and A-share firms. As indicated, we find the dependent variable’s value is negative. The level of real earnings management in foreign share firms is less than that of A-share firms, but the results of the t-test show no significant difference. Because univariate analysis did not provide a sufficient basis for inferences, we use multivariate analysis for further inspection.
Table 2 shows there is a significantly negative correlation among the scale of the company (SIZE), whether the company is state-owned or not (STATE), and whether the audit firm is one of the Big Four or not (BIG4). This suggests the average scale of companies and the shareholdings of the largest shareholder of foreign share firms are smaller than for A-share companies. The ratio of state-owned businesses in A-share firms is higher than for foreign share firms. A-share firms are more likely to appoint Big Four accounting firms as their auditor.
6.2. Correlation Analysis
Table 3 shows that there is a negative correlation between the real earnings management variable and the dual audit system, but the negative correlation between them is not significant. The correlations among variables is under 37%, which indicates that the negative correlation between them is not significant. Highly significant correlations may lead to multicollinearity among variables. Consistent with most research, we use the variance inflation factor (VIF) to estimate whether there is multicollinearity among the variables. If the VIF is less than 10, there is no significant correlation or multicollinearity among variables. The VIFs are less than 2, which indicates that multicollinearity is not a problem in this model.
6.3. Regression Analysis
6.3.1. Regression Analysis: Dual Audit Period
To test the hypotheses, we perform a regression analysis using real earnings management (EM) as the dependent variable in our model. This corresponds to a comparative analysis of (1) versus (3) and (6) in Figure 2. The first analysis compares all foreign share firms and A-share companies during the dual audit period. In the second analysis, we use the median of EM as a criterion to classify the size of groups for foreign share firms and A-share companies. Then, using a comparative analysis of firms greater than the median to those less than the median, we examine whether there is a significant difference. The results of the regression analysis are presented in Table 4.
If Hypothesis 1 is supported, the regression results should show a significantly negative correlation during the period of the dual audit system. From Table 4, DUAL demonstrates a significant correlation at the 1% level. This indicates that the level of real earnings management of foreign share firms is less than real earnings management of A-share firms during the period the dual audit system was implemented, suggesting that a dual audit system can effectively suppress the level of real earnings management. Hypothesis 1 was supported.
6.3.2. Regression Analysis: Period after Dual Audit System
Consistent with the method used to test Hypothesis 1, the sample was divided into three groups during the period when the dual audit system was eliminated. If double audits are no longer required, the regression results should not be correlated because the foreign share market and A-share market should have no difference in earnings management. This corresponds to a comparative analysis of (2) versus (4) and (8) in Figure 2. Thus, if Hypothesis 2 is supported, the regression results for DUAL should show no significantly negative correlation after the dual audit system was eliminated.
Table 5 shows that DUAL has no significantly negative correlation in the all firms group or large firms group. In contrast, DUAL is significantly positively correlated at the 10% level in the small firms group. We find foreign share firms and A-share firms both implement single audits after the dual audit system was eliminated. Thus, the level of earnings management between them is not different. In contrast, compared with A-share firms, foreign share firms whose level of earnings management falls below the median are more likely to manage earnings; Hypothesis 2 was supported.
6.3.3. Further Verification: Manufacturing Firms
Real earnings management indicators are calculated using operational cash flows, production costs, and sales expenses. Using a sample limited to manufacturing firms can produce more accurate results. Our original sample is comprised of 15 industries, which include both manufacturing and service industries. Service industry firms are excluded from further testing, and the sample used in this regression analysis includes only manufacturing firms. If Hypothesis 1 is supported, the regression result for DUAL should indicate a significantly negative correlation during the dual audit system period. Meanwhile, the regression result for DUAL after the dual audit system was eliminated should show no significantly negative correlation.
The results in Table 6 indicate that DUAL is significantly negatively correlated at the 1% level in the dual audit period, which shows that the level of real earnings management of foreign share firms is less than that of A-share firms during the period the dual audit system was in force. This suggests that a dual audit system can effectively suppress the level of real earnings management. However, foreign share firms and A-share firms all implement a single audit after the dual audit system was eliminated. These results further support our hypothesis.
7. Additional Analysis
7.1. Robustness Test 1: The Comparison of Dual Audit Companies before and after Implementation
To ensure the accuracy of our conclusions, we conducted robustness tests. If a dual auditing system effectively reduces the level of earnings management in capital markets, the level of earnings management in the foreign share market under the dual audit mode is less than the level of earnings management under the single audit mode. We conducted a longitudinal analysis for foreign share companies to compare the dual audit period and the period after the dual audit was abolished. This corresponds to a comparative analysis of (3) and (6) versus (4) and (8) in Figure 2. Thus, if Hypothesis 1 is supported, the regression results for DUAL should show a significantly negative correlation during the period the dual audit system was implemented.
However, foreign share companies adopt different accounting standards in the dual audit period compared to the period after the dual audit was eliminated (the accounting standards are Chinese-GAAP and Chinese-IFRS, respectively); therefore, we cannot determine whether the effect is caused by the dual audit or the different accounting standards. To make a clear distinction between the effects, we performed a comparative analysis on A-share firms around 2007, because the dual audit was abolished in 2007. If the results for earnings management are not significant before and after 2007, we can be sure that the effect is caused by the dual audit.
After comparing the dual audit period (3 and 6) and the post-dual audit period (4 and 8) for foreign share firms, we compare the dual audit period and the post-dual audit period for A-share firms with single audits. This corresponds to a comparative analysis of (1) versus (2) in Figure 2. If the transparency improvement effect on A-share firms is not significant, then the effect on foreign-invested companies can be attributed to the dual audit rather than accounting standard differences. From the previous results, we can avoid the confounding effect problem caused by different accounting standards (Chinese-GAAP versus Chinese-IFRS) used to prepare financial statements.
These results are shown in Table 7. Our research results show that the value of DUAL is significantly negatively correlated at the 1% level; supporting Hypothesis 1 (foreign share firms in Table 7). The regression analysis of A share firms in Table 7 indicates that A-share firms did not show a significant difference in earnings management before and after the change in accounting standards.
7.2. Robustness Test 2: Loss Aversion
We explore the degree of risk-aversion levels to observe earnings management in the stock market. Earnings management indexes, such as real and accrual-based earnings management, have measurement error issues. The results may also be affected by extreme values in samples, which can be removed. An analysis of listed firms’ degree of loss avoidance is more effective than only measuring whether firms implement earnings management, since the degree of loss avoidance is based on measuring the whole stock market rather than individual companies.
In economic and decision theory, loss aversion refers to an individual’s tendency to avoid losses to acquire equivalent gains. In accounting, Hayn [42] and Burgstahler and Dichev [43] showed that firms with net losses slightly below zero have reported net income through earnings management. These results indicate that firms adjust their earnings to avoid losses. The results of Burgstahler and Dichev [43] provided evidence that firms manage reported earnings to avoid earnings decreases and losses. Specifically, in cross-sectional distributions of earnings changes and earnings, they found unusually low frequencies of small decreases in earnings and small losses as well as unusually high frequencies of small increases in earnings and small positive income. Zhang et al. [44] found that the theory of the future assumes that decision-makers tend to focus on risk-aversion rather than income; when previous costs do not achieve a corresponding payback, decision-makers will undertake activities to avoid losses. Song and Park [45] found that the greater the degree of enterprises’ loss aversion, the higher their level of earnings management. They emphasized that the risk-aversion index not only refers to small loss enterprises but also includes small profit firms. Song et al. [46] also found that small loss enterprises are firms with a net profit on total assets of (−1%, 0), and small profit firms are those with a net profit on total assets of (0, 1%). We examine small loss enterprises and small profit firms based on Song et al. [46]. If listed companies can make only minor cost adjustments to turn a loss into a profit, the motivation for earnings management of listed companies should increase dramatically.
Table 8 shows the degree of loss aversion for firms (foreign share) with dual audit and those (A-share) with no dual audit for each period—the dual audit system period (2002–2006) and the period after the system was eliminated (2007–2014). Small loss enterprises and small profit enterprises in the A-share market increased by 78.66% (59 cases) and 45.03% (404 cases), respectively. This means that the inclination toward earnings management of A-share firms that are not dual audited steadily increased in the listing period. Meanwhile, foreign share firms with dual audit experience did not show much change in the distribution of risk-aversion, even after the dual audit system was abolished. That is, there was no change in the number of small loss enterprises, and the number of small profit enterprises increased by only 6.67% (8), even after the end of the dual audit system.
We find that, because of the strength of supervision, the foreign share market, which had long been under a dual audit system, has a more conservative attitude toward earnings management. This result supports our regression analysis, showing that the conclusion that the “dual audit system effectively inhibits earnings management in capital markets” is robust.
8. Conclusions
Providing accurate accounting information to a firm’s various stakeholders is an essential requirement for sound companies to be able to achieve sustainable growth, because it enables efficient allocation of resources throughout society. This study verified whether a dual audit system plays a significant role in helping companies achieve sustainable growth by improving the quality of accounting information.
The study’s findings are that the dual audit system reduced real earnings management of firms, used as a substitute variable for earnings quality. As a result of examining whether the effect of dual auditing persists even after the end of the dual audit system, the inclination for loss avoidance of companies that experienced dual auditing did not increase compared with companies that were not subject to dual auditing. These results indicate that the dual audit system improves the earnings quality of enterprises.
The findings of this study hold important theoretical and practical significance. Two “fatal weaknesses” exist in China’s securities market—“difficult listing” and “zero delisting”. The normal initial public offering (IPO) process in China involves lengthy procedures and frequent suspension. On 30 November 2015, the ninth resetting of the IPO process took place, which indirectly led to the prevalence of “back-door listing”. In addition, the popularity of special treatment (ST) enterprises is also a problem for China’s securities market that urgently needs to be solved. According to this study, it could be concluded that urging IPO and ST enterprises to be subject to dual audits could improve the accuracy of financial statement accounting information. Further, earnings management of enterprises could be curbed, improving the transparency of China’s securities market. In addition to China, the European Union (EU) also emphasizes implementation of a joint audit to rebuild trust in financial markets. The EU believes that the joint participation of two different accounting firms may lessen the possibility of audit failures when compared to a single audit model. However, few countries are adopting a joint audit for listed companies. With limited literature and data, the implementation effects of a joint audit have not been predictable. The results of this study may play an important enlightening role in encouraging measures to implement joint audits in the EU and other countries.
Acknowledgments
This paper is supported by the following foundation items: the fund project of introduced talents in Kunming University of Science and Technology (KKSY201508011), the new doctor research fund (BS2014013) and the support plan projects of forefront issues (QY2015008) through the Economics and Management School of Kunming University of Science and Technology.
Author Contributions
Sun Min Kang conceived and designed the experiments; Shun-Ji Jin performed the experiments, and analyzed the data; In Tae Hwang wrote the paper. All authors wrote the conclusions and recommendations of the paper.
Conflicts of Interest
The authors declare no conflicts of interest.
References
- European Commission. Green Paper: Audit Policy: Lessons from the Crisis; Publications Office of the European Union: Brussels, Belgium, 2010. [Google Scholar]
- Cheng, K.; Liu, Y.X. The influence on audit quality by “big four” and double auditing policy. Secur. Futures China 2013, 5, 212–214. [Google Scholar]
- International Federation of Accountants (IFAC). Professional Accountants in Business: At the Heart of Sustainability? Professional Accountants in Business Committee, 2006a; IFAC: New York, NY, USA, 2006. [Google Scholar]
- International Federation of Accountants (IFAC). Sustainability: The Role of the Professional Accountant in Business, Professional Accountants in Business Committee, 2006b; IFAC: New York, NY, USA, 2006. [Google Scholar]
- Ittonen, K.; Tronnes, P.C. Benefits and costs of appointing joint audit engagement partners. Auditing J. Pract. Theory 2014, 34, 23–46. [Google Scholar] [CrossRef]
- Zerni, M.; Haapamäki, E.; Jarvinen, T.; Niemi, L. Do joint audits improve audit quality? Evidence from voluntary joint audits. Eur. Account. Rev. 2012, 21, 731–765. [Google Scholar] [CrossRef]
- Baldauf, J.; Steckel, R. Joint audit and accuracy of the auditor’s report: An empirical study. Int. J. Econ. Sci. Appl. Res. 2012, 5, 7–42. [Google Scholar]
- Deng, M.; Lu, T.; Simunic, D.A.; Ye, M. Do joint audits improve or impair audit quality? J. Account. Res. 2014, 52, 1029–1060. [Google Scholar] [CrossRef]
- Xin, Z.Y. The research on the dual audit of listed companies in China. Financ. Trade Res. 2003, 2, 118–120. [Google Scholar]
- Wu, X. Audit Independence and Audit Pricing with Double Audit Pattern; China Financial and Economic Publishing House: Beijing, China, 2005. [Google Scholar]
- Zhang, P. Empirical research on the level of earnings management for A-share companies and B-share companies before and after the abolishment of duplicate auditing institution. Sci. Technol. Eng. 2012, 12, 1101–1104. [Google Scholar]
- Fang, J.X. Study on economic consequences of deregulation in China’s audit market: Evidence from B-share audit market. J. Financ. Econ. 2010, 36, 70–80. [Google Scholar]
- Schipper, K. Commentary on earnings management. Account. Horiz. 1989, 3, 91–102. [Google Scholar]
- Healy, P.M.; Wahlen, J.M. A review of the earnings management literature and its implications for standard setting. Account. Horiz. 1999, 13, 365–383. [Google Scholar] [CrossRef]
- Akers, M.D.; Giacomino, D.E.; Bellovary, J.L. Earnings management and its implications: Educating the accounting profession. CPA J. 2007, 77, 64–68. [Google Scholar]
- Munter, P. SEC sharply criticizes “earnings management” accounting. J. Corp. Account. Financ. 1999, 10, 31–38. [Google Scholar] [CrossRef]
- Roychowdhury, S. Earnings management through real activities manipulation. J. Account. Econ. 2006, 42, 335–370. [Google Scholar] [CrossRef]
- Cohen, D.; Zarowin, P. Accrual-based and real earnings management activities around seasoned equity offerings. J. Account. Econ. 2010, 50, 2–19. [Google Scholar] [CrossRef]
- Kim, J.B.; Sohn, B.C. Real earnings management and cost of capital. J. Account. Public Policy 2013, 32, 518–543. [Google Scholar] [CrossRef]
- Duellman, S.; Anwer, S.; Ahmed, M.A. An empirical analysis of the effects of monitoring intensity on the relation between equity incentives and earnings management. J. Account. Public Policy 2013, 32, 495–517. [Google Scholar] [CrossRef]
- Doukakis, L.C. The effect of mandatory IFRS adoption on real and accrual-based earnings management activities. J. Account. Public Policy 2014, 33, 551–572. [Google Scholar] [CrossRef]
- Brown, K.; Chen, V.Y.S.; Kim, M. Earnings management through real activities choices of firms near the investment–speculative grade borderline. J. Account. Public Policy 2015, 34, 74–94. [Google Scholar] [CrossRef]
- Li, C.; Tseng, Y.; Chen, T.K. Top management team expertise and corporate real earnings management activities. Adv. Account. 2016, 34, 117–132. [Google Scholar] [CrossRef]
- Sohn, B.C. The effect of accounting comparability on the accrual-based and real earnings management. J. Account. Public Policy 2016, 35, 513–539. [Google Scholar] [CrossRef]
- Cristhian, M.C.; Jory, S.R.; Ngo, T. Real earnings management activities prior to bond issuance. Bus. Res. Q. 2017, 20, 164–177. [Google Scholar]
- Dou, Y.W.; Khan, M.; Zou, Y. Labor unemployment insurance and earnings management. J. Account. Econ. 2016, 61, 166–184. [Google Scholar] [CrossRef]
- Du, X.Q.; Jian, W.; Lai, S.J. Do foreign directors mitigate earnings management? Evidence from China. Int. J. Account. 2017, 52, 142–177. [Google Scholar] [CrossRef]
- Lakshmana, I.; Yang, Y.W. Product market competition and earnings management: Evidence from discretionary accruals and real activity manipulation. Adv. Account. 2014, 30, 263–275. [Google Scholar] [CrossRef]
- Liu, M.Z.; Shi, Y.L.; Wilson, C.; Wu, Z.Y. Does family involvement explain why corporate social responsibility affects earnings management? J. Bus. Res. 2017, 75, 8–16. [Google Scholar] [CrossRef]
- Zhu, T.T.; Lu, M.T.; Shan, Y.W.; Zhang, Y.L. Accrual-based and real activity earnings management at the back door: Evidence from Chinese reverse mergers. Pac.-Basin Financ. J. 2015, 35, 317–339. [Google Scholar] [CrossRef]
- Abdelsalam, O.; Mitropoulos, P.; Elnahass, M.; Leventis, S. Earnings management behaviors under different monitoring mechanisms: The case of Islamic and conventional banks. J. Econ. Behav. Organ. 2016, 132, 155–173. [Google Scholar] [CrossRef]
- Buchner, A.; Mohamed, A.; Saadouni, B. The association between earnings forecast in IPOs prospectuses and earnings management: An empirical analysis. J. Int. Financ. Mark. Inst. Money 2017, 8, 1042–1056. [Google Scholar] [CrossRef]
- Kim, J.; Kim, Y.; Zhou, J. Languages and earnings management. J. Account. Econ. 2017, 63, 288–306. [Google Scholar] [CrossRef]
- Sundvik, D. Book-tax conformity and earnings management in response to tax rate cuts. J. Int. Account. Audit. Tax. 2017, 28, 31–42. [Google Scholar] [CrossRef]
- Bao, S.R.; Lewellyn, K.B. Ownership structure and earnings management in emerging markets—An institutionalized agency perspective. Int. Bus. Rev. 2017, 26, 828–838. [Google Scholar] [CrossRef]
- Beuselincka, C.; Deloof, M. Earnings management in business groups: Tax incentives or expropriation concealment? Int. J. Account. 2014, 49, 27–52. [Google Scholar] [CrossRef]
- Kuo, J.M.; Ning, L.T.; Song, X.Q. The real and accrual-based earnings management behaviors: Evidence from the split share structure reform in China. Int. J. Account. 2014, 49, 101–136. [Google Scholar] [CrossRef]
- Lin, Y.M.; Shen, C.A. Family firms’ credit rating, idiosyncratic risk, and earnings management. J. Bus. Res. 2015, 68, 872–877. [Google Scholar] [CrossRef]
- Nurwati, A.; Zaluki, A.; Campbell, K.; Goodacre, A. Earnings management in Malaysian IPOs: The East Asian crisis, ownership control and post-IPO performance. Int. J. Account. 2011, 46, 111–137. [Google Scholar]
- Hwang, I.T.; Kang, S.M.; Jin, S.J. A delisting prediction model based on nonfinancial information. Asia-Pac. J. Account. Econ. 2014, 21, 328–347. [Google Scholar] [CrossRef]
- Park, K.E. Pay disparities within top management teams and earnings management. J. Account. Public Policy 2017, 36, 59–81. [Google Scholar] [CrossRef]
- Hayn, C. The information content of losses. J. Account. Econ. 1995, 20, 125–153. [Google Scholar] [CrossRef]
- Burgstahler, D.; Dichev, I. Earnings management to avoid earnings decreases and losses. J. Account. Econ. 1997, 24, 99–126. [Google Scholar] [CrossRef]
- Zhang, Y.F.; He, G.; Lian, Y.L. Crisis shocks, loss aversion and support effect of family block holders. J. Financ. Econ. 2013, 39, 122–133. [Google Scholar]
- Song, I.M.; Park, Y.H. Quarterly pattern of earnings management: Loss avoidance and reversal. Korean Account. Rev. 2008, 33, 1–28. [Google Scholar]
- Song, I.M.; Paek, W.S.; Park, H.S. Earnings management for the avoidance of losses. Korean Account. J. 2004, 13, 29–51. [Google Scholar]
Figure 1.
Sustainability framework.

Figure 2.
Dual audit system and GAAP. Notes: In the case of H stock, the dual audit period is 2001–2010 and the period after the dual audit was abolished is 2011–2014.
Figure 2.
Dual audit system and GAAP. Notes: In the case of H stock, the dual audit period is 2001–2010 and the period after the dual audit was abolished is 2011–2014.


Table 1.
Variable definitions.
| Variable Types | Variable Name | Variable Meaning and Expression | |
|---|---|---|---|
| Dependent variable | EM | The variable of real earnings management | |
| Experimental variable | DUAL | During the period of dual audits from 2002 to 2006, when firms issue foreign shares (B shares), DUAL = 1, otherwise (A shares) DUAL = 0; Dual audits were abolished in the period from 2007 to 2014, therefore, when firms issue foreign shares (B shares), DUAL = 1, otherwise (A shares) DUAL = 0; For foreign-funded joint stock limited firms only, during the period of dual audits, DUAL = 1, otherwise DUAL = 0; | |
| Control variable | Financial variables | LEV | Capital structure: ratio of liabilities to assets. |
| SIZE | Scale of company: the natural logarithm of total assets | ||
| OCF | Operating cash flow ratio | ||
| LOSS | Current profit or loss | ||
| Non-financial variables | LARGE | Shareholding of the largest shareholder | |
| STATE | State-owned business or not: if it is a state-owned business, STATE = 1, otherwise STATE = 0 | ||
| BOARD | The frequency of board meetings | ||
| BIG4 | Big Four or not: if audit firm is Big Four, BIG4 = 1, otherwise BIG4 = 0 | ||
Notes: Our sample does not include H share firms in the period from 2007 to 2010, as these firms still used a dual audit system.
Table 2.
Descriptive analysis.
| Foreign Share Firm (N = 1791) | A Share Firm (N = 15,031) | Diff. (t-test) | ||||
|---|---|---|---|---|---|---|
| Mean | St. Dev. | Mean | St. Dev. | |||
| EM | −0.091 | 0.174 | −0.086 | 0.418 | −0.005 | (0.90) |
| LEV | 0.646 | 1.295 | 0.654 | 7.363 | −0.008 | (0.12) |
| SIZE | 22.247 | 1.719 | 21.593 | 1.251 | 0.654 *** | (−15.62) |
| OCF | 0.047 | 0.102 | 0.045 | 0.568 | 0.002 | (−0.50) |
| LOSS | 0.152 | 0.359 | 0.139 | 0.346 | 0.013 | (−1.43) |
| LARGE | 0.397 | 0.164 | 0.376 | 0.165 | 0.021 *** | (−5.03) |
| BOARD | 8.716 | 3.967 | 8.715 | 3.702 | 0.001 | (0.00) |
| STATE | 0.492 | 0.500 | 0.448 | 0.497 | 0.044 *** | (−3.53) |
| BIG4 | 0.298 | 0.457 | 0.028 | 0.163 | 0.270 *** | (−24.83) |
Notes: () represents t value testing whether there is a significant difference in the mean value of foreign share firms compared to A-share firms; *, **, and *** represent significance at the 10%, 5%, and 1% levels, respectively.
Table 3.
Correlation analysis.
| EM | DUAL | LEV | SIZE | OCF | LOSS | LARGE | BOARD | STATE | |
|---|---|---|---|---|---|---|---|---|---|
| DUAL | −0.004 | ||||||||
| LEV | −0.001 | 0.000 | |||||||
| SIZE | −0.017 ** | 0.152 *** | −0.085 *** | ||||||
| OCF | −0.068 *** | 0.002 | 0.008 | −0.005 | |||||
| LOSS | 0.034 *** | 0.011 | 0.035 *** | −0.198 *** | −0.015 * | ||||
| LARGE | −0.016 ** | 0.039 *** | 0.020 *** | 0.240 *** | 0.016 ** | −0.102 *** | |||
| BOARD | 0.029 *** | 0.000 | 0.001 | 0.190 *** | −0.011 | −0.019 | 0.075 *** | ||
| STATE | −0.024 *** | 0.027 *** | 0.000 | −0.001 | 0.023 *** | −0.028 *** | 0.287 *** | −0.106 *** | |
| BIG4 | −0.011 | 0.363 *** | −0.004 | 0.316 *** | 0.010 | −0.042 *** | 0.105 *** | 0.048 *** | −0.005 |
Notes: *, **, and *** represent significant correlation at the 10%, 5%, and 1% levels, respectively.
Table 4.
Regression analysis: dual audit period (from 2002 to 2006).
| All Firms | Large Firm Groups (EM > Median) | Small Firm Groups (EM < Median) | ||||
|---|---|---|---|---|---|---|
| Intercept | −0.270 *** | (−7.04) | −0.317 *** | (−5.93) | −0.528 *** | (−6.13) |
| DUAL | −0.021 *** | (−3.94) | −0.016 *** | (−2.99) | −0.020 *** | (−2.61) |
| LEV | 0.001 | (−0.56) | −0.040 *** | (−4.27) | 0.001 | (0.31) |
| SIZE | 0.007 *** | (3.92) | 0.014 *** | (5.45) | 0.020 *** | (4.77) |
| OCF | −0.088 *** | (−17.73) | −1.298 *** | (−65.62) | −0.056 *** | (−10.82) |
| LOSS | 0.001 | (−0.09) | −0.032 *** | (−6.02) | −0.007 | (−1.30) |
| LARGE | 0.017 * | (1.65) | 0.063 *** | (6.56) | 0.016 | (1.04) |
| BOARD | 0.002 *** | (3.40) | −0.001 ** | (−1.97) | 0.001 | (1.65) |
| STATE | −0.003 | (−0.86) | 0.002 | (0.61) | −0.008 * | (−1.53) |
| BIG4 | −0.036 *** | (−4.09) | −0.004 | (−0.60) | −0.034 * | (−1.81) |
| Year | YES | YES | YES | |||
| Adj R2 | 5.59% | 57.88% | 4.17% | |||
| F | 28.63 *** | 321.32 *** | 11.16 *** | |||
| VIF | 1.23 | 1.40 | 1.23 | |||
| N | 6530 | 3265 | 3265 | |||
Notes: () represents t-value; *, **, and *** represent significant correlation at the 10%, 5%, and 1% levels, respectively.
Table 5.
Regression analysis: period after dual audit was eliminated (from 2007 to 2014).
| All Firms | Large Firm Groups (EM > Median) | Small Firm Groups (EM < Median) | ||||
|---|---|---|---|---|---|---|
| Intercept | 0.237 *** | (2.61) | −0.402 *** | (−1.81) | 1.433 *** | (10.33) |
| DUAL | 0.015 | (0.88) | 0.007 | (0.24) | 0.033 * | (1.85) |
| LEV | 0.001 | (0.47) | −0.055 | (−1.08) | −0.004 ** | (−2.34) |
| SIZE | −0.017 *** | (−4.02) | 0.018 * | (1.79) | −0.075 *** | (−11.22) |
| OCF | −0.044 *** | (−5.75) | −1.634 *** | (−15.47) | −0.035 *** | (−6.12) |
| LOSS | 0.066 *** | (4.34) | 0.019 | (0.60) | 0.047 *** | (3.39) |
| LARGE | −0.003 | (−0.08) | −0.005 | (−0.10) | −0.015 | (−0.39) |
| BOARD | 0.004 *** | (3.34) | −0.002 | (−1.03) | 0.005 *** | (3.47) |
| STATE | 0.005 | (0.43) | 0.003 | (0.18) | 0.010 | (0.82) |
| BIG4 | 0.004 | (0.20) | 0.006 | (0.21) | −0.013 | (−0.33) |
| Year | YES | YES | YES | |||
| Adj R2 | 1.73% | 4.73% | 24.71% | |||
| F | 11.32 *** | 16.97 *** | 7.28 *** | |||
| VIF | 1.49 | 1.55 | 1.26 | |||
| N | 10,292 | 5146 | 5146 | |||
Notes: () represents t value; *, **, and *** represent significant correlation at the 10%, 5%, and 1% levels, respectively. The VIF value represents the largest value of VIF.
Table 6.
Regression analysis: manufacturing firms.
| Dual Audit Period (from 2002 to 2006) | Period after Dual Audit System Was Abolished (from 2007 to 2014) | |||
|---|---|---|---|---|
| Intercept | −0.193 *** | (−5.82) | 0.156 ** | (2.50) |
| DUAL | −0.019 *** | (−4.26) | 0.001 | (0.06) |
| LEV | 0.001 | (0.42) | −0.015 *** | (−7.33) |
| SIZE | 0.007 *** | (4.34) | −0.010 *** | (−3.31) |
| OCF | −0.991 *** | (−56.46) | −0.881 *** | (−28.78) |
| LOSS | −0.049 *** | (−12.13) | 0.027 *** | (2.85) |
| LARGE | 0.042 *** | (4.64) | −0.031 | (−1.36) |
| BOARD | −0.001 | (−1.26) | 0.000 | (0.37) |
| STATE | 0.005 | (1.46) | 0.002 | (0.21) |
| BIG4 | −0.014 * | (−1.87) | 0.002 | (0.13) |
| Year | YES | YES | ||
| Adj R2 | 44.82% | 15.11% | ||
| F | 238.97 *** | 71.83 *** | ||
| VIF | 1.31 | 1.49 | ||
| N | 4012 | 6473 | ||
Notes: () represents t value; *, **, and ** represent significant correlation at the 10%, 5%, and 1% levels, respectively. The VIF value represents the largest value of VIF.
Table 7.
Regression analysis: Comparison of Chinese-GAAP and Chinese-IFRS.
| DUAL Firms (B&H Foreign Share) | Non-DUAL Firms (A-Share) | |||
|---|---|---|---|---|
| Intercept | −0.207 *** | (−3.62) | 0.129 * | (1.91) |
| chGAAP | −0.027 *** | (−2.89) | −0.009 | (−0.78) |
| LEV | 0.005 * | (1.68) | 0.001 | (−0.52) |
| SIZE | 0.008 *** | (3.05) | −0.012 *** | (−3.83) |
| OCF | −0.837 *** | (−22.64) | −0.046 *** | (−7.72) |
| LOSS | 0.010 | (0.92) | 0.035 *** | (3.48) |
| LARGE | 0.025 | (1.08) | 0.006 | (0.25) |
| BOARD | −0.002 ** | (−2.07) | 0.004 *** | (3.72) |
| STATE | −0.009 | (−1.12) | 0.002 | (0.25) |
| BIG4 | −0.002 | (−0.20) | −0.011 | (−0.53) |
| Year | YES | YES | ||
| Adj R2 | 24.71% | 1.42% | ||
| F | 46.20 *** | 238.97 *** | ||
| VIF | 1.61 | 1.82 | ||
| N | 1791 | 15,031 | ||
Notes: If the accounting standards are Chinese-GAAP, then chGAAP = 1, and if they are Chinese-IFRS, then chGAAP = 0. () represents t value; *, **, and *** represent significant correlation at the 10%, 5%, and 1% levels, respectively. The VIF value represents the largest value of VIF.
Table 8.
Market distribution of small loss and profit companies.
| Dual Audit Period (from 2002 to 2006) | Period after Dual Audit Was Abolished(from 2007 to 2014) | Difference | ||
|---|---|---|---|---|
| Foreign share | Small loss firms | 12 | 12 | 0 (0.00%) |
| Small profit firms | 120 | 128 | 8 (6.66%) | |
| A-share | Small loss firms | 75 | 134 | 59 (78.66%) |
| Small profit firms | 897 | 1301 | 404 (45.03%) | |
© 2018 by the authors. Licensee MDPI, Basel, Switzerland. This article is an open access article distributed under the terms and conditions of the Creative Commons Attribution (CC BY) license (http://creativecommons.org/licenses/by/4.0/).
Share and Cite
MDPI and ACS Style
Jin, S.-J.; Hwang, I.T.; Kang, S.M. Improving Sustainability through a Dual Audit System. Sustainability 2018, 10, 137. https://doi.org/10.3390/su10010137
AMA Style
Jin S-J, Hwang IT, Kang SM. Improving Sustainability through a Dual Audit System. Sustainability. 2018; 10(1):137. https://doi.org/10.3390/su10010137
Chicago/Turabian StyleJin, Shun-Ji, In Tae Hwang, and Sun Min Kang. 2018. "Improving Sustainability through a Dual Audit System" Sustainability 10, no. 1: 137. https://doi.org/10.3390/su10010137
Note that from the first issue of 2016, this journal uses article numbers instead of page numbers. See further details here.