Increased Stress Levels in Caged Honeybee (Apis mellifera) (Hymenoptera: Apidae) Workers


1
Institut für Biologie, Martin-Luther-Universität Halle-Wittenberg, Hoher Weg 8, 06099 Halle (Saale), Germany
2
Department of Chemistry, University of Nairobi, Nairobi P.O. Box 30197-00100, Kenya
Stresses 2022, 2(4), 373-383; https://doi.org/10.3390/stresses2040026
Submission received: 20 July 2022
/
Revised: 13 September 2022
/
Accepted: 17 September 2022
/
Published: 22 September 2022
(This article belongs to the Section Animal and Human Stresses)
Abstract
:Honeybees, Apis mellifera, usually live in large colonies consisting of thousands of individuals. Within the colony, workers interact with their social environment frequently. The large workforce, division of labour, and other features may promote the ecological success of honeybees. For decades, artificial mini colonies in cages within the laboratory have become the gold standard, especially in experiments related to toxicology, effects of pesticides and pathogens. Experiments using caged bees and full-sized colonies yielded contradictory results. Here, the effect of cage experiments on the stress level of individual bees is analysed. Two different stress response were targeted, the heat shock response and the mobilization of energetic resources. While no differences were found for varying group sizes of bees, very strong effects emerged by comparing caged workers with bees from natural colonies. Caged workers showed increased levels of hsp expression and reduced haemolymph titres for trehalose, the energy storage sugar. These results reveal that the lack of the social environment (e.g., lack of queen, lack of sufficient group size) induce stress in caged bees, which might act synergistically when bees are challenged by additional stressors (e.g., pesticides, pathogens) resulting in higher mortality than observed under field conditions.
1. Introduction
Controlled laboratory experiments using caged workers of the honeybee (Apis mellifera) have become a gold standard in pathogen and pesticide research [1]. The effects of respective treatments on individuals can be tested under highly standardized conditions. Replicates can be performed easily due to the little space requirements for small hoarding cages. This also allows for the usage of incubators to keep abiotic factors like temperature and humidity at constant levels. Often, this kind of experiment is used for survival analysis upon the exposure to pathogens, pesticides, or other dietary supplements [1,2,3].
As honeybees usually live in large colonies consisting of several thousand individuals [4], hoarding cages within the laboratory might represent an unusual environment concerning the social context experienced by focal individuals. Cage experiments are often conducted using single or only a few individuals (10–30 worker bees) [3,5]. Although, there are recommendations for using 100 and even more workers, more than 75% of all studies use up to 40 workers and less than 10% use more than 100 workers [5].
As it is known that the social context influences a range of physiological traits in a range of species, and this might also be the case for caged workers. In Drosophila melanogaster, the density at which larvae are reared influences the levels of heat shock protein (HSP) expression, an indicator of stress, at the adult stage showing increased levels when larvae were kept at high densities [6]. However, Drosophila is a solitary species, so high-density conditions mark unnatural and artificial conditions.
In social insects, the natural condition is a high density of individuals with frequent social interactions, so the typical cage experiments mark unnatural and artificial conditions. Social-context dependent changes in physiology and behaviour have been found in social insects, e.g., in the primitively social bumble bees (Bombus sp.), it was demonstrated that solitarily kept individuals down-regulate certain genes with immune function [7] resulting in a functionally reduced immune response [8], which can be tissue specific [9]. Ants kept in isolation suffer from reduced life spans due to increased activity levels and hence energy consumption [10].
Individuals that are exposed to certain abiotic or biotic stressors might react towards this by a stress response [11]. Usually, these reactions are the response towards external or internal stimuli recognized by the peripheral sensory system [11]. A major connection between sensory information processing and the response towards the stressor is the release of octopamine to the haemolymph [12], a biogenic amine that might act as a stress hormone [11]. This, in turn, might be responsible for the expression of genes or the activation of proteins in organs in the periphery, e.g., the fat body. In Caenorhabditis elegans, an octopamine regulated gene expression response has been shown to act under starvation [13]. Other responses that are known to occur are the expression of HSPs upon exposure to heat or cold [14], but also as a response towards detrimental chemicals [15]. HSPs are molecular chaperones that help proteins to re-fold after heat or cold-induced denaturation.
Limitation of nutrients with the extreme form being starvation will result in the mobilization of energy storage molecules [16,17]. In insects, energy is stored in the form of trehalose, a disaccharide consisting of two α-glucose units bound via a 1,1-glucoside bond, stored in the fat body [18]. Energetic stress can also be elicited by infections in bees; for example, the intracellular microsporidian parasite Nosema sp. can lead to drastic reductions in haemolymph sugar levels, especially trehalose [19,20].
The hypothesis that the social context in experimental cage designs might increase stress levels in honeybee workers was tested in this study. Typical hoarding cages are used with solitary or small groups of workers. In these workers, HSP expression and mobilization of trehalose are measured as indicators of two different final branches of stress. These measurements are compared to controls from a full-sized natural colony.
2. Results
2.1. Positive Control Treatments
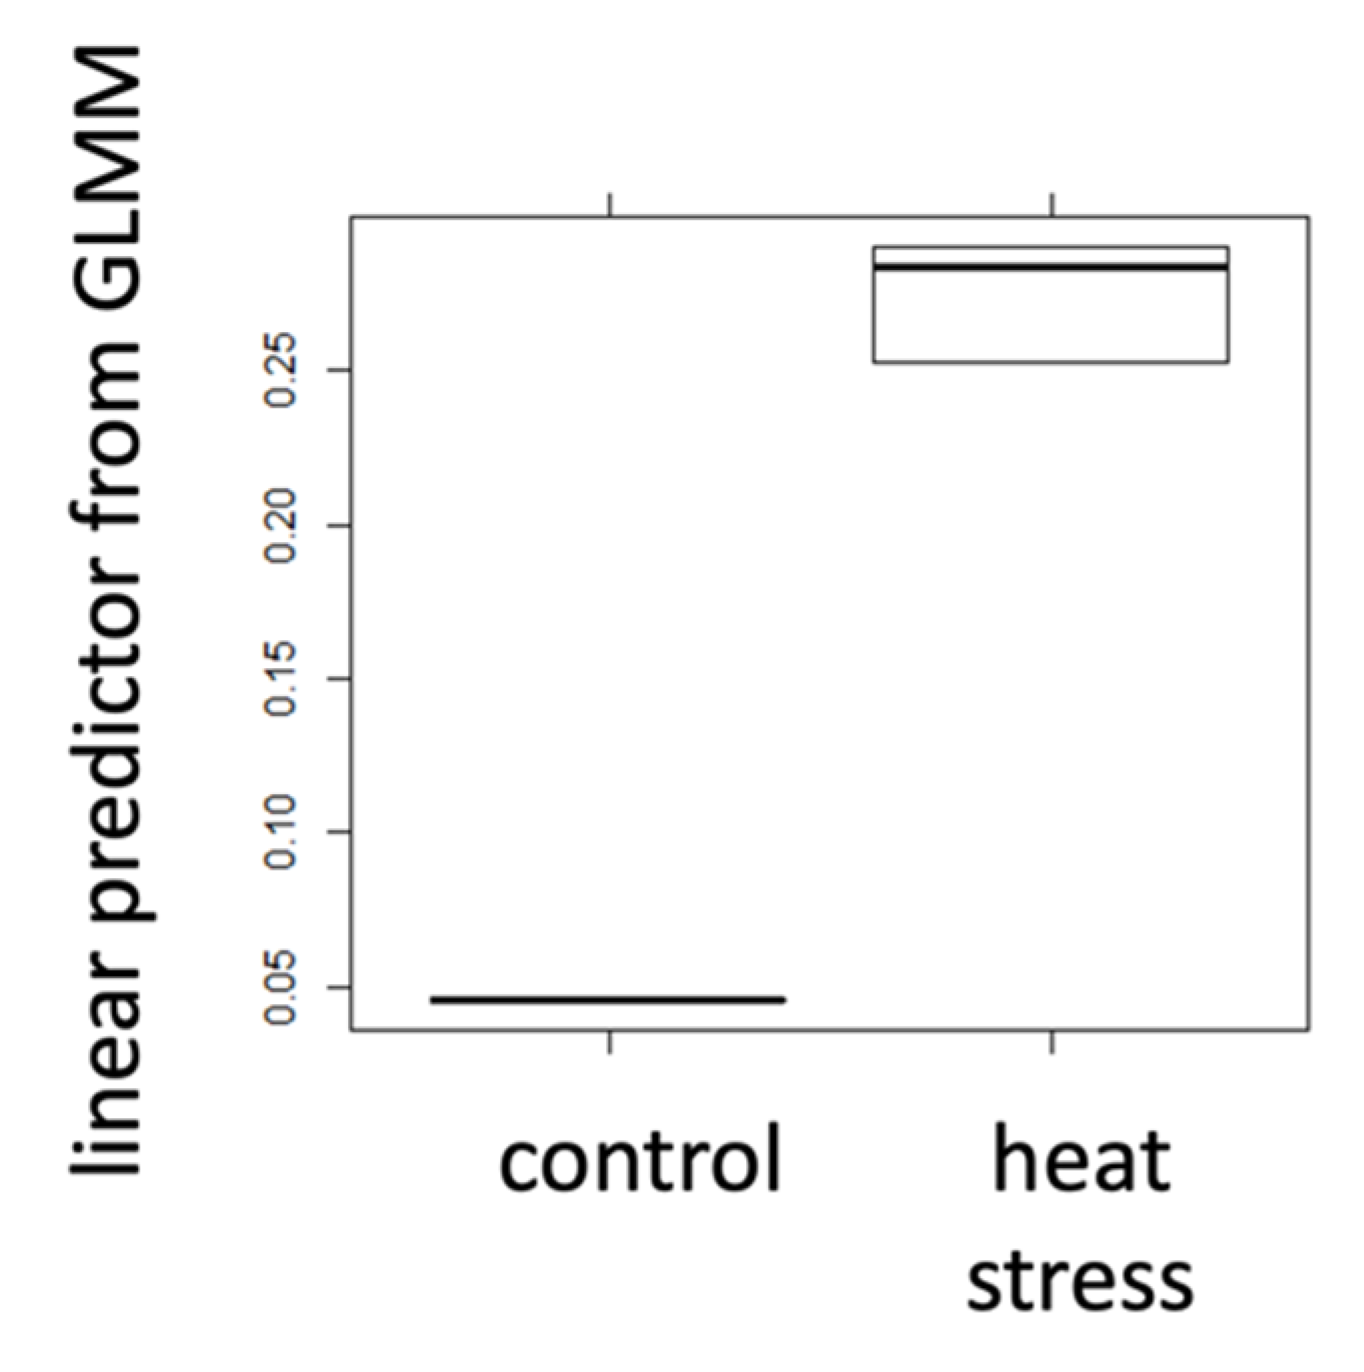
The hsp70AB gene expression was significantly upregulated (GLMM, AICnull model = −96.1; AICfull model = −102.3; ANOVA, p = 0.004) in the heat-treated honeybees (Figure 1) compared to control bees. Starved individuals showed a significantly lower free haemolymph glucose content (GLMM, AICnull model = 0.2; AICfull model = −3.5; ANOVA, p = 0.017) (Figure 2a) and trehalose titre (GLMM, AICnull model = −42.3; AICfull model = −46.1; ANOVA, p = 0.016), than control bees (Figure 2b) (details on null and full models: Table S1).
2.2. Caged Bees of Varying Group Sizes
Bees were kept in group sizes of 1; 10 and 30 bees in cages. Expression of hsp70AB did not differ between groups as the null model is not significantly different from the full model (GLMM, AICnull model = −128.7; AICfull model = −126.9; ANOVA, p = 0.70). Similarly, the titres of glucose (GLMM, AICnull model = 65.3; AICfull model = 67.2; ANOVA, p = 0.74) and trehalose (GLMM, AICnull model = −82.3; AICfull model = −80.4; ANOVA, p = 0.85) showed no association with group size in caged bees (details on null and full models: Table S2). In all cases, the inclusion of the factor group size lowered the explanatory power of the model indicated by the higher AIC for the full models.
2.3. Caged Bees vs. Bees from Natural Colony
As there was no detectable association between group sizes and expression level of hsp70AB or haemolymph titres of glucose or trehalose in the caged bees, they were pooled to compare caged bees with bees from the natural colony environment.
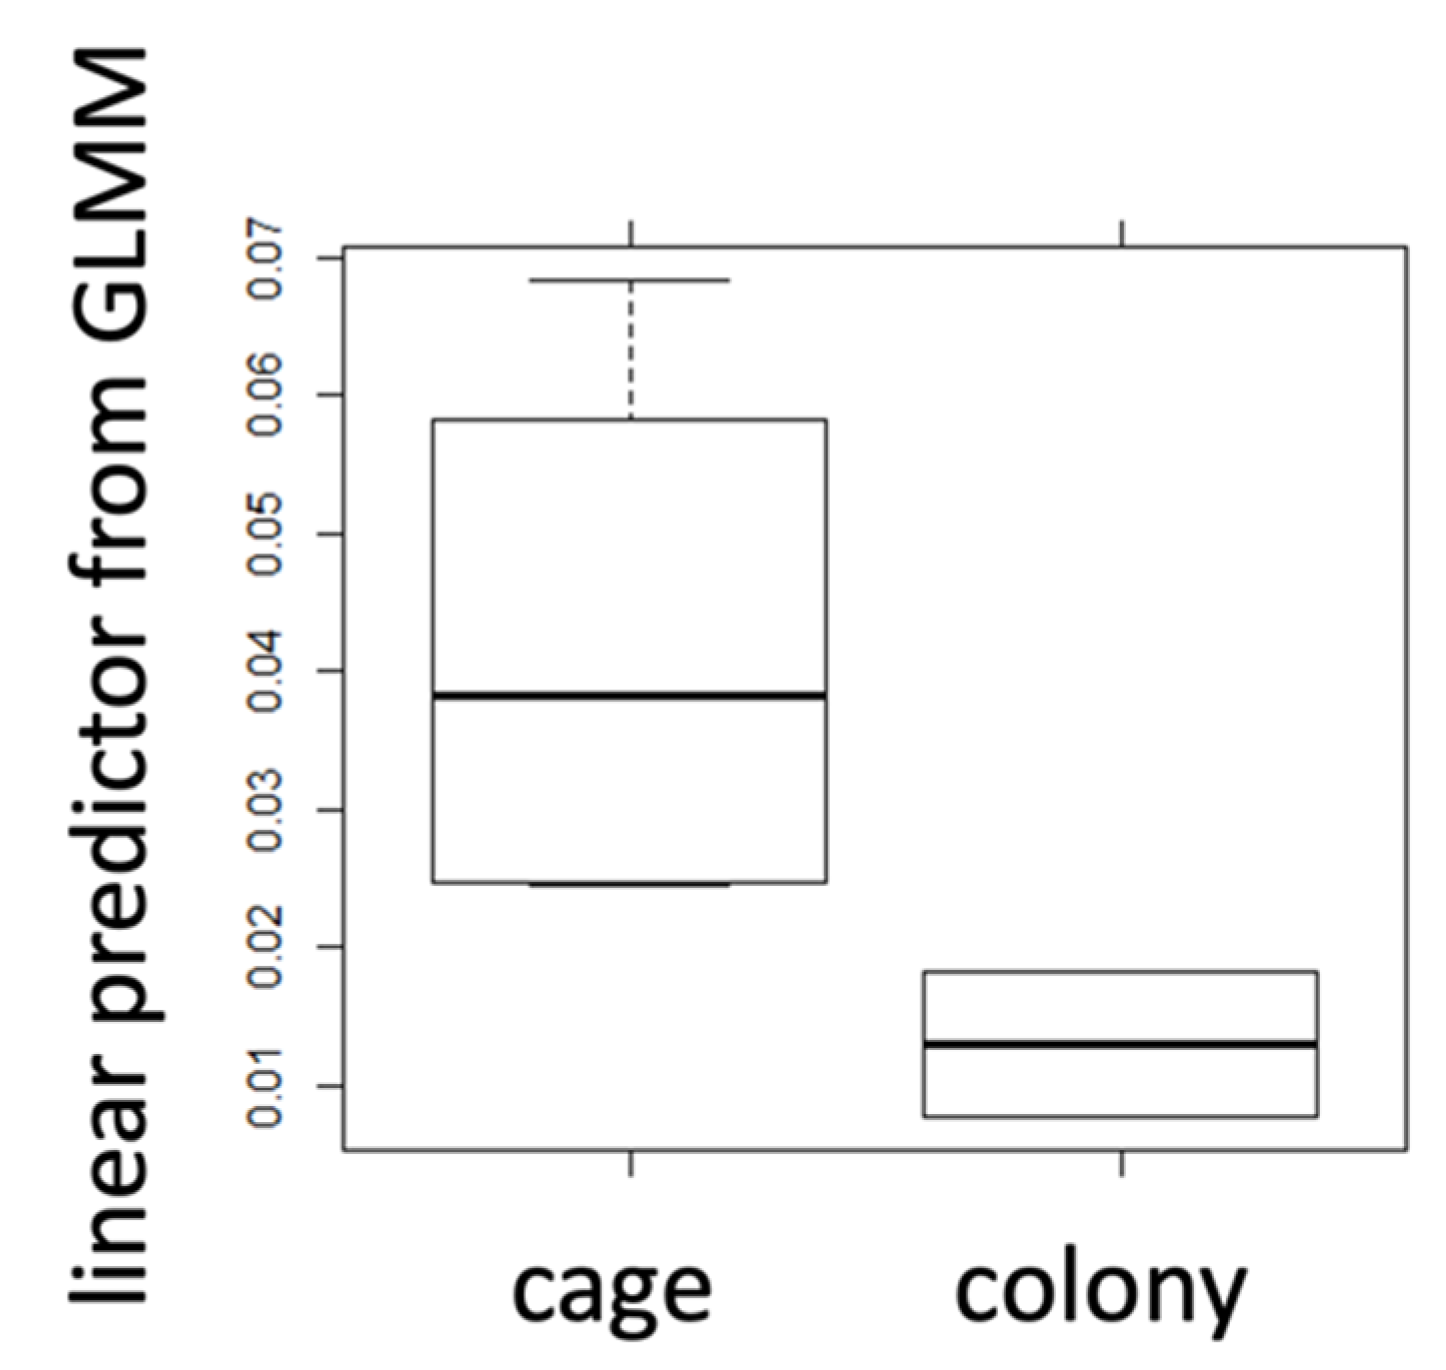
The gene expression levels for hsp70AB differed significantly between caged and colony bees (GLMM, AICnull model = −212.0; AICfull model = −218.1; ANOVA, p = 0.005) with caged bees showing increased expression levels (Figure 3). The comparison between caged bees and those originating from the natural colony environment for their haemolymph trehalose titres revealed a highly significant difference (GLMM, AICnull model = −72.9; AICfull model = −79.6; ANOVA, p = 0.003) with caged bees showing decreased levels of trehalose (Figure 2). In both cases, the AIC is lower for the full model, indicating that there is a better fit for the model including the factor source. For the haemolymph glucose titres, no significant difference was detectable (GLMM, AICnull model = 80.4; AICfull model = 81.6; ANOVA, p = 0.35) (Figure 4, Table 1) (details on null and full models: Table S3).
3. Discussion
Two different marker systems have been used to study the effect of caging worker honeybees in the laboratory on their internal stress levels. Typical group sizes for cage experiments were used (1; 10; and 30 bees) and no differences between the group size treatments were observed. Caged bees were compared to bees originating from the natural colony environment and significant stress levels were observed for caged bees indicated by reduced levels of the storage carbohydrate trehalose and increased levels of heat shock protein expression.
Social context is an important factor in biological systems. Conspecific individuals provide valuable information about the environment, but may also appear as competitors for resources. In social insects, the social environment provides information to individuals reacting to it upon reception. The most important individual within a colony is the queen, the only reproductive individual [21]. Workers perceive the information about the presence of the queen via pheromones and immediately react, if this signal is lost, by starting to rear a replacement queen [22]. However, not only the queens’ presence or absence might modulate worker behaviour. Other workers within the colony have a modulatory influence on each other. Older workers have been shown to produce a pheromone (ethyl oleate) that might influence the behavioural maturation of younger workers [23]. Under the influence of this pheromone young workers mature slowly and initiate foraging flights at a higher age than without this pheromone. Social context might also modulate prophylactic up-regulation of the immune system in workers [7,9].
The complete lack of social context might have drastic effects on individuals that are adapted to live within a social environment with frequent social interactions. Obligate social insects seem to be extremely adapted to social environments, as the removal of such drastically reduces survival. This has been shown recently in ants of the species Camponotus fellah. Socially isolated individuals faced higher mortality that might be induced by a disproportional intake and expenditure of energy resources [10]. Isolated ants showed increased activity patterns, although their intake of food was similar to ants kept in groups.
The depletion of energy resources was also observed in the experiment presented here. In caged bees, access to food was ensured and their haemolymph titres for free glucose did not differ from bees of the colony, suggesting that their food intake rate is similar. However, caged bees show reduced storage of carbohydrates in the form of trehalose, indicating that they have a higher energy expenditure than bees in a natural environment. This is like earlier observations that bees maintain glucose levels in the haemolymph at the expense of trehalose levels [24].
Increased stress in caged bees was revealed in a study by Alburaki et al. [25]. Caged bees show disruption in gene expression, especially for antioxidant genes.
The natural colony environment does not only consist of conspecific individuals that provide (mostly) chemical signals, but also wax comb and stored food products (nectar and pollen), influencing workers. However, in laboratory cage experiments, all these influences are usually avoided to manipulate bees under controlled conditions [1]. This may lead to disturbances in the perception of the environmental variables that influence the typical behaviour and physiology under natural conditions. Hence, the exclusion of typical stimuli might induce the neuronal regulated release of stress hormones, the most important one in insects being the biogenic amine octopamine [12]. Once this has been released into the haemolymph, it might activate long-term changes in peripheral organs and tissues [11]. In the present experiments, it has been shown that at least two different stress responses can be activated upon the loss of the natural environment, the depletion of stored energy resources and the activation of heat shock proteins ensuring protein integrity. These two different final branches of a stress response [11] signal a severe interference with the individual and group homeostasis in laboratory cage experiments.
However, the effects of the activation of these stress responses are not that strong compared to the positive controls (heat treatment, starvation), but still significant and detectable. The importance of such activation of stress responses might be seen in the light of typical experiments conducted using caged honeybee workers. During the past years, cage experiments using small experimental groups have become established in research on toxicological effects of different environmental chemicals bees are exposed to [1,5]. Especially in research on the effect of pesticides, cage experiments are used to determine effects on individual bees.
The study of the effects of pathogens on survival and general performance of bees is most often also conducted using caged workers. Under these circumstances, it becomes a crucial factor that the bees being tested are not impaired by other factors. If the effect of chemicals or pathogens on individual bees is tested, but they are already experiencing increased stress due to the lack of the natural environment, then the effects of the tested substances or pathogens might be tested on already weakened individuals. The prevailing increased stress levels might then act synergistically with the additional factors the bees are exposed to, eventually leading to increased mortality. This might be an explanation for an observed discrepancy in the results obtained using caged bee workers and those originating from the natural colony environment.
Strong interactive effects have been described for pesticides (fipronil and thiacloprid) used on bees previously infected by a microsporidian pathogen, Nosema ceranae [26]. This interaction effect has been claimed to increase the mortality of bees drastically. However, using the same experimental setup under in vivo conditions within the natural colony environment, Retschnig et al. [27] did not find any significant interaction effects. Furthermore, the effects induced by the pesticide, or the pathogen alone were much weaker than demonstrated before using caged bees [27]. Similar contradictory results have been found for the neonicotinoid pesticide thiamethoxam with deleterious effects at trace levels in laboratory trials, while field-based colonies near treated fields do not show any reduction in productivity [28].
The additional stress in caged bees, due to the lack of the natural environment, might potentiate the effects caused by additional stressors producing strong interactive effects that under natural conditions are simply not present. Hence, cage experiments need to be performed very cautiously and should be verified under natural, but at least under semi-natural conditions, to exclude any synergistically acting additional stressful components that might bias results. Cage experiments might be improved by including a piece of comb, brood and/or queen pheromones [29,30]. The use of larger group sizes might also be recommended, and new cage designs have been developed recently [31].
Clearly, the experiment has some shortcomings. Experiments on group size effects might need to be performed using experimental groups much larger than the maximum group size of 30 that was used here. However, in many laboratory studies, still sample sizes in the range of 10–30 bees are used [3,5]. Comparisons of cage experiments and natural colony environments need to address which components of the colony environment are influencing stress levels when missing (e.g., presence of comb, presence of the queen), which was not addressed in the present study.
4. Materials and Methods
4.1. Control and Treatment Groups
All worker bees were sampled from a colony of Apis mellifera carnica maintained at the apiary of the Martin-Luther-University Halle-Wittenberg, Germany, in autumn 2013. The bees that were used were winter bees, which are the bees reared in autumn to stay and survive the whole period of winter, and all of them are of the same physiological status. Bees of unknown age were collected from the frames and randomly distributed among hoarding cages to ensure mixed-age cohorts, which were set up either with a single worker (N = 10), or groups of 10 (N = 3) or 30 (N = 3) workers. The whole set-up was replicated twice. An overview of the samples, sample size and replicates is found in Table S5. The cages were made of stainless steel (9.5 cm × 8.5 cm × 5.5 cm for 1 and 10 bees and 14.5 cm × 12 cm × 5 cm for 30 bees) with ventilation holes in the back and on the sides, a removeable, acrylic front cover and a top hole for insertion of a 12 mL tube with sugar water. They were autoclaved before the start of the experiment. The bees used for the group colony were sampled in the same way as described above. Food in the form of sugar candy and water were provided ad libitum. Workers were exposed to this treatment for 7 days and, at the end, were immediately shock frozen in liquid nitrogen and stored at −80 °C until further processing.
4.2. Positive Control Treatments
Positive controls serve as test systems to ensure that the marker will react as expected towards certain stress that bees were exposed to. To test HSP expression, bees were exposed to heat and compared to controls kept under standard laboratory conditions. Bees of each group were kept in groups of 10 workers in hoarding cages as described above. Three replicates of the heat treatment were performed. Bees of the heat treatment group were exposed to 40 °C for 2 h in an incubator, while the control bees were kept at 34 °C. Afterwards, the treatment samples were immediately freeze killed using liquid nitrogen and stored at −80 °C until further processing.
Positive controls for energy mobilization, to be measured as the amount of free glucose and trehalose levels in the haemolymph, were set up with workers starving to recruit stored energy resources. Workers were kept in groups of ten individuals in hoarding cages and fed ad libitum with water and sugar candy. In starvation groups, sugar candy was removed for 4 h. Three replicates were performed. At the end of the experiment, bees were freeze killed and stored at −20 °C until further processing.
4.3. Hemolymph Collection
To study the impacts of stress-mediated changes in the energetic balance of honeybee metabolism, the contents of free glucose and trehalose in haemolymph were determined. We utilized all solitary workers, all individuals out of the 10 bee groups and 10 randomly chosen individuals out of the 30 bee groups (Table S5). Haemolymph was extracted by separating the heads from the thorax of frozen individuals. A gentle stick into the thorax cross-section facilitated the collection of a droplet of haemolymph that was absorbed by using 1 µL microcapillaries (Sigma-Aldrich, Schnelldorf, Germany). A slight lateral pressure on the thorax facilitated the leakage of haemolymph. The collected haemolymph was diluted 1:5 with sodium-cacodylate buffer (10 mM Na-cacodylate, 5 mM NaCl2, adjusted to pH 6.5) to avoid melanisation and stored at −80 °C until further usage.
4.4. Glucose/Trehalose Assay
Levels of haemolymph glucose and trehalose were assessed using the trehalose assay kit (Megazyme International, Wicklow, Ireland). The kit quantifies the content of free D-glucose by its conversion to gluconate-6-phosphate and NADPH by hexokinase + glucose-6-phosphatase. The absorbance of NADPH is determined at 340 nm in a microplate reader (Synergy MX, BioTek, Bad Friedrichshall, Germany) and is stoichiometric with the amount of D-glucose. To quantify the amount of trehalose, this disaccharide must be broken down by the addition of the enzyme trehalase, resulting in two glucose molecules. The resulting total D-glucose will then be determined as described above. The general procedure follows essentially the guideline given in the COLOSS Bee Book [32].
The haemolymph concentration needed for optimal determination of glucose/trehalose levels was determined using a dilution series and a comparison to single point standards for glucose (2 µg) and trehalose (1 µg). Samples were processed using a final dilution of 1:20 of the haemolymph/sodium cacodylate buffer solution (equals 1:120 dilution of pure haemolymph). Assays were performed by following the instructions of the manufacturer for the microplate assay procedure. Assay duration was modified by prolonging the first measurement to 15 min (D-glucose step) and the second measurement to 30 min (trehalose step). Samples were measured in duplicates, and blanks and standards were repeated on each microplate.
4.5. RNA Extraction, cDNA Synthesis and qRT-PCR
Samples chosen for RNA extraction and analysis of heat shock gene expression consisted of three individuals of each treatment, solitary, 10 bee, and 30 bee groups for both replicates (N = 42). Total RNA was extracted from the abdomen of experimental worker bees using an organic solvent extraction method based on Trizol reagent (Qiagen, Hilden, Germany) [33] and finally dissolved in 20 µL DEPC-water (0.1% v/v DEPC). The quality and quantity of the extracted RNA were determined using a spectrophotometer (Nanodrop 1000, peqlab, Erlangen, Germany). cDNA was synthesized using 1 µg total RNA, 80 U M-MLV Reverse Transcriptase (Promega, Mannheim, Germany) and 0.8 µg Oligo (dT)15 Primer (Promega, Mannheim, Germany). cDNA was purified using SureClean Plus (Bioline, Luckenwalde, Germany) according to the manufacturer’s instructions. The purified cDNA was re-dissolved in 20 µL DEPC-water (0.1% v/v DEPC). The quality and quantity of cDNA samples were determined using Nanodrop 1000 (peqlab, Erlangen, Germany).
To detect gene expression differences, three house-keeping genes (HKG), RPS5, rp49, and GAPDH, and one target gene out of the group of HSP was chosen, hsp70AB. cDNA was used at a concentration of 10 ng/µL for subsequent amplification using qRT-PCR. Each reaction contained: 1 µL cDNA, 5 µL SensiMixPlus SYBR & Fluorescein Kit (Bioline, Luckenwalde, Germany), 0.3 mM of each gene-specific primer and 3.4 µL DEPC-H2O (0.1% v/v DEPC). The thermal profile consisted of 1 cycle at 95 °C for 10 min, followed by 39 cycles at 95 °C for 15 sec (denaturation), 57 °C for 30 s (primer annealing) and 72 °C for 30 s (elongation) using a CFX ConnectTM Real-Time PCR Detection System (Bio-Rad, Munich, Germany). To verify the specificity of PCR amplifications, subsequent melting curve analyses were done reading the fluorescence units between 55 °C and 98 °C at 1 °C intervals. All amplifications showed only one peak during melting curve analysis, indicating a high specificity of the primers used for amplification of target genes. All samples showing differences higher than 0.5 Ct-values between replicates were run in another round of qRT-PCR using the same cDNA with another two replicate reactions.
4.6. Normalization of Gene Expression
To standardize gene expression measurements, several HKG were tested, which are expected to be not regulated by treatment conditions. Here, three HKG were used, RPS5, rp49, and GAPDH, which are potentially suitable as HKG in Apis mellifera [34]. Therefore, the cDNA of five randomly chosen samples (10 ng/µL) was used. Following the protocol of Buttstedt et al. [35], reactions were set up and run as described before. All samples with Ct-value differences higher than 0.5 between duplicates were repeated as described for the target gene (see above).
4.7. Statistical Data Analysis
Data on the glucose/trehalose assay were analysed using the Megazyme Mega-CalcTM software (Excel Add-in, https://www.megazyme.com/filesearch/?sSearch=trehalose&group=calc, accessed on 18 July 2022).
For evaluating the expression data for the house-keeping genes, Normfinder [36] was used on the pooled data set. This analysis revealed RPS5 and rp49 as being the most stable reference genes across treatments, and hence these two genes were further used for individual samples of the control and test treatments. Relative expression levels of hsp70AB were calculated using the ΔCt method [37] accounting for the differences in PCR efficiencies [38]. PCR efficiency was calculated using LinReg [39].
Hsp70AB gene expression levels, glucose, and trehalose titres of haemolymph of caged honeybee workers of groups consisting of 1; 10 or 30 workers were analysed using GLMMs. For this, the glmer function of the lme4 package was used with a family of distribution = Normal and the logit link function. For the positive control experiment, the treatment (stressor vs. control) was used as a fixed factor and cage as a random factor. For the experiment using varying group sizes, the group size was used as a fixed factor, and trial and cage were used as random factors to account for pseudo-replication. In the comparison of caged bees vs. bees from the natural colony environment, the source of bees was used as a fixed factor, while cage and trial were entered as random factors. A null model was used, including random factors only, and compared to the full model using an ANOVA for model comparison. Additionally, the Akaike Information Criterion (AIC) was used to determine which model best fits the data in case of a difference between null and full model. The distribution of the data was checked visually using QQ-plots for various distributions and fitted to the most promising distributions from visual inspections. Log-likelihood values from distribution fitting were used to determine the most likely distribution for the data. All analyses were carried out using R 3.2.2 [40] using the latest versions of the packages lme4 [41], MASS [42] and multcomp [43] and their respective dependencies.
Positive controls and comparisons between bees in cages and bees from the colony each comprise two groups only and were additionally compared using Welch’s t-test. As the p-value from this comparison is hardly comparable between treatments due to differences in sample sizes, the effect size for the difference in the means in terms of Cohen’s d [44] was calculated, which is dimensionless, ranging from 0 to infinity. Cohen’s d was subsequently used to calculate a correlation coefficient r, because it is easier to interpret, as it ranges from 0 to 1. This translates into a small effect at 0.1 < r < 0.25 and a huge effect at 1 > r > 0.33 [44].
Supplementary Materials
The following supporting information can be downloaded at: https://www.mdpi.com/article/10.3390/stresses2040026/s1, Table S1. GLMM null and full model for positive controls, Table S2. GLMM null and full model for cages with varying group size, Table S3. GLMM null and full model for cage vs. colony, Table S4. Welch t-test for positive controls and cage vs. colony, Table S5. Samples and sample sizes for different experiments.
Funding
I gratefully acknowledge the financial support for this research by the following organizations and agencies: Bundesministerium für Bildung und Forschung (BMBF) within the program FUGATO-Plus (FKZ: 0315126 to HMGL). The views expressed herein do not necessarily reflect the official opinion of the donor.
Data Availability Statement
The data presented in this study are openly available in FigShare at https://doi.org/10.6084/m9.figshare.20340993 (accessed on 20 July 2022).
Acknowledgments
I would like to thank J. Richter for help with field and laboratory work.
Conflicts of Interest
The author declares no conflict of interest.
References
- Williams, G.R.; Alaux, C.; Costa, C.; Csáki, T.; Doublet, V.; Eisenhardt, D.; Fries, I.; Kuhn, R.; McMahon, D.P.; Medrzycki, P.; et al. Standard methods for maintaining adult Apis mellifera in cages under in vitro laboratory conditions. J. Apic. Res. 2013, 52, 1–36. [Google Scholar] [CrossRef]
- Desneux, N.; Decourtye, A.; Delpuech, J.M. The Sublethal Effects of Pesticides on Beneficial Arthropods. Annu. Rev. Entomol. 2007, 52, 81–106. [Google Scholar] [CrossRef]
- Huang, S.K.; Csaki, T.; Doublet, V.; Dussaubat, C.; Evans, J.D.; Gajda, A.M.; Gregorc, A.; Hamilton, M.C.; Kamler, M.; Lecocq, A.; et al. Evaluation of cage designs and feeding regimes for honey bee (Hymenoptera: Apidae) laboratory experiments. J. Econ. Entomol. 2014, 107, 54–62. [Google Scholar] [CrossRef] [PubMed]
- Winston, M.L. The Biology of the Honey Bee; Harvard University Press: Cambridge, MA, USA, 1987. [Google Scholar]
- Lundin, O.; Rundlöf, M.; Smith, H.G.; Fries, I.; Bommarco, R. Neonicotinoid Insecticides and Their Impacts on Bees: A Systematic Review of Research Approaches and Identification of Knowledge Gaps. PLoS ONE 2015, 10, e0136928. [Google Scholar] [CrossRef] [PubMed]
- Sørensen, J.G.; Loeschcke, V. Larval crowding in Drosophila melanogaster induces Hsp70 expression, and leads to increased adult longevity and adult thermal stress resistance. J. Ins. Physiol. 2001, 47, 1301–1307. [Google Scholar] [CrossRef]
- Richter, J.; Helbing, S.; Erler, S.; Lattorff, H.M.G. Social context dependent immune gene expression in bumblebees (Bombus terrestris). Behav. Ecol. Sociobiol. 2012, 66, 791–796. [Google Scholar] [CrossRef]
- Ruiz-González, M.X.; Moret, Y.; Brown, M.J.F. Rapid induction of immune density-dependent prophylaxis in adult social insects. Biol. Lett. 2009, 5, 781–783. [Google Scholar] [CrossRef]
- Lattorff, H.M.G. Tissue specificity in social context-dependent lysozyme expression in bumblebees. Antibiotics 2020, 9, 130. [Google Scholar] [CrossRef] [PubMed]
- Koto, A.; Mersch, D.; Hollis, B.; Keller, L. Social isolation causes mortality by disrupting energy homeostasis in ants. Behav. Ecol. Sociobiol. 2015, 69, 583–591. [Google Scholar] [CrossRef]
- Even, N.; Devaud, J.M.; Barron, A.B. General Stress Responses in the Honey Bee. Insects 2012, 3, 1271–1298. [Google Scholar] [CrossRef] [PubMed] [Green Version]
- Davenport, A.P.; Evans, P.D. Stress-induced changes in the octopamine levels of insect haemolymph. Insect Biochem. 1984, 14, 135–143. [Google Scholar] [CrossRef]
- Suo, S.; Kimura, Y.; van Tol, H.H. Starvation induces cAMP response element-binding protein-dependent gene expression through octopamine-Gq signaling in Caenorhabditis elegans. J. Neurosci. 2006, 26, 10082–10090. [Google Scholar] [CrossRef] [PubMed]
- Elekonich, M.M. Extreme thermotolerance and behavioral induction of 70-kDa heat shock proteins and their encoding genes in honey bees. Cell Stress Chap. 2009, 14, 219–226. [Google Scholar] [CrossRef]
- Hranitz, J.M.; Abramson, C.I.; Carter, R.P. Ethanol increases HSP70 concentrations in honeybee (Apis mellifera L.) brain tissue. Alcohol 2010, 44, 275–282. [Google Scholar] [CrossRef]
- Crailsheim, K. Intestinal transport of sugars in the honeybee (Apis mellifera). J. Insect Physiol. 1988, 34, 839–846. [Google Scholar] [CrossRef]
- Woodring, J.; Boulden, M.; Das, S.; Gäde, G. Studies on Blood Sugar Homeostasis in the Honeybee (Apis mellifera, L.). J. Insect Physiol. 1993, 39, 89–97. [Google Scholar] [CrossRef]
- Thompson, S.N. Trehalose—The insect “blood” sugar. Adv. Insect Physiol. 2003, 31, 206–261. [Google Scholar] [CrossRef]
- Mayack, C.; Naug, D. Energetic stress in the honeybee Apis mellifera from Nosema ceranae infection. J. Invertebr. Pathol. 2009, 100, 185–188. [Google Scholar] [CrossRef]
- Mayack, C.; Naug, D. Parasitic infection leads to decline in hemolymph sugar levels in honeybee foragers. J. Insect Physiol. 2010, 56, 1572–1575. [Google Scholar] [CrossRef]
- Lattorff, H.M.G.; Moritz, R.F.A. Genetic underpinnings of division of labor in the honeybee. Trends Genet. 2013, 29, 641–648. [Google Scholar] [CrossRef] [Green Version]
- Lattorff, H.M.G.; Moritz, R.F.A. Context dependent bias in honeybee queen selection: Swarm versus emergency queens. Behav. Ecol. Sociobiol. 2016, 70, 1411–1417. [Google Scholar] [CrossRef]
- Leoncini, I.; Le Conte, Y.; Costagliola, G.; Plettner, E.; Toth, A.L.; Wang, M.; Huang, Z.; Bécard, J.M.; Crauser, D.; Slessor, K.N.; et al. Regulation of behavioral maturation by a primer pheromone produced by adult worker honey bees. Proc. Natl. Acad. Sci. USA 2004, 101, 17559–17564. [Google Scholar] [CrossRef] [PubMed]
- Blatt, J.; Roces, F. Haemolymph sugar levels in foraging honeybees (Apis mellifera carnica): Dependence on metabolic rate and in vivo measurement of maximal rates of trehalose synthesis. J. Exp. Biol. 2001, 204, 2709–2716. [Google Scholar] [CrossRef]
- Alburaki, M.; Karim, S.; Lamour, K.; Adamczyk, J.; Stewart, S.D. RNA-seq reveals disruption of gene regulation when honey bees are caged and deprived of hive conditions. J. Exp. Biol. 2019, 222, jeb207761. [Google Scholar] [CrossRef]
- Vidau, C.; Diogon, M.; Aufauvre, J.; Fontbonne, R.; Viguès, B.; Brunet, J.L.; Texier, C.; Biron, D.G.; Blot, N.; El Alaoui, H.; et al. Exposure to sublethal doses of fipronil and thiacloprid highly increases mortality of honeybees previously infected by Nosema ceranae. PLoS ONE 2011, 6, e21550. [Google Scholar] [CrossRef]
- Retschnig, G.; Williams, G.R.; Odemer, R.; Boltin, J.; Di Poto, C.; Mehmann, M.M.; Retschnig, P.; Winiger, P.; Rosenkranz, P.; Neumann, P. Effects, but no interactions, of ubiquitous pesticide and parasite stressors on honey bee (Apis mellifera) lifespan and behaviour in a colony environment. Environ. Microbiol. 2015, 17, 4322–4331. [Google Scholar] [CrossRef]
- Henry, M.; Cerrutti, N.; Aupinel, P.; Decourtye, A.; Gayrard, M.; Odoux, J.F.; Pissard, A.; Rüger, C.; Bretagnolle, V. Reconciling laboratory and field assessments of neonicotinoid toxicity to honeybees. Proc. R. Soc. B 2015, 282, 20152110. [Google Scholar] [CrossRef]
- Fischer, P.; Grozinger, C.M. Pheromonal regulation of starvation resistance in honey bee workers (Apis mellifera). Naturwissenschaften 2008, 95, 723–729. [Google Scholar] [CrossRef]
- Morgan, S.M.; Butz Huryn, V.M.; Downes, S.R.; Mercer, A.R. The effects of queenlessness on the maturation of the honey bee olfactory system. Behav. Brain Res. 1998, 91, 115–126. [Google Scholar] [CrossRef]
- Yang, K.C.; Peng, Z.W.; Lin, C.H.; Wu, M.C. A new design of bee cage for laboratory experiments: Nutritional assessment of supplemental diets in honey bees (Apis mellifera). Apidologie 2021, 52, 418–431. [Google Scholar] [CrossRef]
- Hartfelder, K.; Bitondi, M.M.G.; Brent, C.S.; Guidugli-Lazzarini, K.R.; Simões, Z.L.P.; Stabentheiner, A.; Tanaka, E.D.; Wang, Y. Standard methods for physiology and biochemistry research in Apis mellifera. J. Apic. Res. 2013, 52, 1–48. [Google Scholar] [CrossRef]
- Chomczynski, P.; Sacchi, N. Single-step method of RNA isolation by acid guanidinium thiocyanate-phenol-chloroform extraction. Anal. Biochem. 1987, 162, 156–159. [Google Scholar] [CrossRef]
- Lourenço, A.P.; Mackert, A.; Cristino, A.S.; Simões, Z.L.P. Validation of reference genes for gene expression studies in the honey bee, Apis mellifera, by quantitative real-time RT-PCR. Apidologie 2008, 39, 372–385. [Google Scholar] [CrossRef]
- Buttstedt, A.; Moritz, R.F.A.; Erler, S. More than royal food—Major royal jelly protein genes in sexuals and workers of the honeybee Apis mellifera. Front. Zool. 2013, 10, 72. [Google Scholar] [CrossRef]
- Andersen, C.L.; Ledet-Jensen, J.; Ørntoft, T. Normalization of real-time quantitative RT-PCR data: A model based variance estimation approach to identify genes suited for normalization—Applied to bladder- and colon-cancer data-sets. Canc. Res. 2004, 64, 5245–5250. [Google Scholar] [CrossRef]
- Pfaffl, M.W. A new mathematical model for relative quantification in real-time RT-PCR. Nucl. Acids Res. 2001, 29, e45. [Google Scholar] [CrossRef]
- Erler, S.; Popp, M.; Lattorff, H.M.G. Dynamics of Immune System Gene Expression upon Bacterial Challenge and Wounding in a Social Insect (Bombus terrestris). PLoS ONE 2011, 6, e18126. [Google Scholar] [CrossRef]
- Ramakers, C.; Ruijter, J.M.; Deprez, R.H.L.; Moorman, A.F.M. Assumption-free analysis of quantitative real-time polymerase chain reaction (PCR) data. Neurosci. Lett. 2003, 339, 62–66. [Google Scholar] [CrossRef]
- R Development Core Team. R: A Language and Environment for Statistical Computing; R Foundation for Statistical Computing: Vienna, Austria, 2008. [Google Scholar]
- Bates, D.; Maechler, M.; Bolker, B.; Walker, S. Fitting Linear Mixed-Effects Models Using lme4. J. Stat. Software 2015, 67, 1–48. [Google Scholar] [CrossRef]
- Venables, W.N.; Ripley, B.D. Modern Applied Statistics with S, 4th ed.; Springer: New York, NY, USA, 2002. [Google Scholar]
- Hothorn, T.; Bretz, F.; Westfall, P. Simultaneous Inference in General Parametric Models. Biomet. J. 2008, 50, 346–363. [Google Scholar] [CrossRef] [Green Version]
- Cohen, J. Statistical Power Analysis for the Behavioral Sciences, 2nd ed.; Lawrence Erlbaum Associates: Hillsdale, NJ, USA, 1988. [Google Scholar]
Figure 1.
Responses of heat stress markers within the positive control experiment. Hsp70AB gene expression is shown for a stressed (N = 30) and control bees (N = 10). The y-axis shows the linear predictor for the response variable derived from a GLMM controlling for pseudo-replication due to common cages.

Figure 2.
Responses of starvation stress markers within the positive control experiment. Glucose haemolymph titre (a) and trehalose haemolymph titre (b) are shown for stressed (N = 30) and control bees (N = 10). The y-axis shows the linear predictor for the response variable derived from a GLMM controlling for pseudo-replication due to common cages.

Figure 3.
Responses of heat stress marker for a comparison between all caged bees and bees originating from the natural colony environment. Hsp70AB gene expression is shown for caged (N = 42) and colony bees (N = 20) in the form of the linear predictor for the response variable derived from a GLMM controlling for pseudo-replication due to common cages and replicate trials.

Figure 4.
Responses of stress markers for a comparison between all caged bees and bees originating from the natural colony environment. Glucose haemolymph titre (a) and trehalose haemolymph titre (b) are shown for caged (N = 128) and colony bees (N = 20) in the form of the linear predictor for the response variable derived from a GLMM controlling for pseudo-replication due to common cages and replicate trials.


Table 1.
Overview for comparisons of positive controls (upper half) and cage vs. colony (lower half) for hsp70AB expression, glucose, and trehalose titres. Descriptive statistics for every group and statistical results for comparisons between test groups are presented. Mean—the arithmetic average, s.d. = standard deviation, N = sample size; t-test—refers to the p-value of Welch’s t-test (more details see Table S4); r—correlation coefficient derived from Cohen’s d; sign.—significance level for the effect size of difference in the means based on the size of r (n.s. < 0.1; * < 0.25; *** < 0.5).
| hsp70AB | Glucose | Trehalose | ||||
|---|---|---|---|---|---|---|
| heat | control | starvation | control | starvation | control | |
| mean | 0.267 | 0.045 | 0.173 | 1.441 | 0.292 | 0.957 |
| s.d. | 0.07 | 0.04 | 0.18 | 0.36 | 0.11 | 0.20 |
| N | 30 | 10 | 30 | 8 | 30 | 8 |
| t-test | 8.8 × 10⁻⁶ | 2.2 × 10⁻¹⁶ | 1.3 × 10⁻¹² | |||
| Cohen’s d | 16.79 | 11.27 | 12.11 | |||
| r | 0.76 | 0.65 | 0.67 | |||
| sign. | *** | *** | *** | |||
| cage | colony | cage | colony | cage | colony | |
| mean | 0.042 | 0.017 | 0.446 | 0.491 | 0.319 | 0.460 |
| s.d. | 0.05 | 0.01 | 0.32 | 0.35 | 0.19 | 0.24 |
| N | 42 | 20 | 128 | 20 | 128 | 20 |
| t-test | 0.009 | 0.55 | 0.002 | |||
| Cohen’s d | 1.34 | 0.45 | 1.86 | |||
| r | 0.23 | 0.05 | 0.18 | |||
| sign. | * | n.s. | * | |||
Publisher’s Note: MDPI stays neutral with regard to jurisdictional claims in published maps and institutional affiliations. |
© 2022 by the author. Licensee MDPI, Basel, Switzerland. This article is an open access article distributed under the terms and conditions of the Creative Commons Attribution (CC BY) license (https://creativecommons.org/licenses/by/4.0/).
Share and Cite
MDPI and ACS Style
Lattorff, H.M.G. Increased Stress Levels in Caged Honeybee (Apis mellifera) (Hymenoptera: Apidae) Workers. Stresses 2022, 2, 373-383. https://doi.org/10.3390/stresses2040026
AMA Style
Lattorff HMG. Increased Stress Levels in Caged Honeybee (Apis mellifera) (Hymenoptera: Apidae) Workers. Stresses. 2022; 2(4):373-383. https://doi.org/10.3390/stresses2040026
Chicago/Turabian StyleLattorff, H. Michael G. 2022. "Increased Stress Levels in Caged Honeybee (Apis mellifera) (Hymenoptera: Apidae) Workers" Stresses 2, no. 4: 373-383. https://doi.org/10.3390/stresses2040026