Effects of Strength vs. Plyometric Training on Change of Direction Performance in Experienced Soccer Players


Department of Sport Sciences and Physical Education, Nord University, 7600 Levanger, Norway
*
Author to whom correspondence should be addressed.
Sports 2020, 8(11), 144; https://doi.org/10.3390/sports8110144
Submission received: 18 August 2020
/
Revised: 19 October 2020
/
Accepted: 27 October 2020
/
Published: 30 October 2020
Abstract
:The purpose of this study was to compare how 6 weeks of strength- vs. plyometric training, which were matched upon direction of motion and workload, influences change of direction (COD) performance. Twenty-one experienced male soccer players (age: 22.2 ± 2.7) were pair-matched into a strength- (n = 10) and a plyometric (n = 11) training group. CODs of 45°, 90°, 135° and 180° performed from either a 4 m or 20 m approach distance were compared before and after intervention. Results showed no significant difference between groups. Significant effects were only found within the plyometric training group (−3.2% to −4.6%) in 90°, 135° and 180° CODs from 4 m and a 180° COD from a 20 m approach distance. Individual changes in COD performances showed that with the 4 m approach at least 55% and 81% of the strength and plyometric training group, respectively, improved COD performance, while with the 20 m approach at least 66% of both groups improved performance. This study showed that the plyometric training program can improve most CODs, with angles over 90°, although this is dependent on the distance approaching the COD. Considering the limited time of implementing physical conditioning, in addition to regular soccer practice in most soccer environments, the current plyometric training program can be advantageous in improving CODs at maximal intensity.
1. Introduction
The development of competitiveness in soccer requires an emphasis on physical conditioning [1]. Among multiple determinant factors in soccer, the sport requires substantial effort to improve forceful and explosive movements, also known as “maximal actions” [2,3]. The change of direction ability is one of these maximal actions and are considered essential for success in most team and individual sports [4]. Sheppard and Young [5] defined it as a pre-planned rapid whole-body movement with changes in velocity and direction. Change of direction (COD) is referred to as agility when the movement is unanticipated and involves games-specific perceptual and decision-making components [6]. Furthermore it was shown that agility is a discriminating factor between higher and lower levels of play in sports, while the differences are less substantial regarding COD [7,8]. Despite this, there will occur situations in games where CODs are pre-defined [9]. As such, training COD speed can increase the chances of evading opponents, creating space and scoring goals [10,11].
Many studies have investigated the effects of different physical training forms on COD ability and COD as a phenomenon [4,12,13,14,15,16]. Most studies generalized COD as one discrete ability, while not accounting for the specificity that different COD tasks represent [4,13,17]. For example, Reilly, Williams, Nevill and Franks [1] found COD to be a discriminating factor between different levels of play in young soccer players but the COD test can be regarded as biased to linear sprinting [6]. Additionally, the biomechanical demands of COD have shown to be angle- and velocity dependent, which influences the technical requirements, kinetics, kinematics and muscle activation in the task [18]. Thus, practitioners should assess COD ability across a spectrum of different angles when assessing COD ability.
In the literature, both strength- and plyometric training are popular methodologies that aim to develop physical aspects determining COD speed, which includes strength- and muscle power [4,19]. There is typically a restricted time to develop force in COD [19]. Thus, plyometric training which typically offers a high velocity training stimulus, due to a rapid eccentric to concentric muscle contraction [20,21] is specific to most COD movements [20]. Falch, Rædergård and van den Tillaar [15] reported in their meta-analysis assessing COD in court and field sports, improvements of 1% to 14% for plyometric training interventions and −2% to 12% for strength training interventions, where effect sizes varied from zero to very large. However, there is a need to expand the knowledge regarding strength- and plyometric training upon COD performance in soccer as most of the research was conducted in a young population [22] in which most participants were adolescents [23,24,25,26], which could be different from senior soccer players due to difference in training experience.
Consequently, the effects of these training methodologies are dependent upon the participants’ fitness characteristics, seasonal variations, training frequency, training volume and design and duration of the training protocol [15,26,27]. Among several factors stated, research supports the use of two training sessions a week for optimal adaptations to explosive sports specific skills for both strength and plyometric training [28,29] and it has been recommended that training exercises should be performed both unilaterally and bilaterally in multiple directions when training to improve COD ability [4]. Besides these important factors it is important to draw focus to which COD task being measured.
Bourgeois, McGuigan, Gill and Gamble [13] clarified that different COD tasks were either force or velocity oriented, depending upon the approaching speed and angle of direction change. It has been suggested that modest COD angles of <90° are more velocity oriented, while greater angles of >90° are more force oriented. Dos’Santos, Thomas, Comfort and Jones [18] reported that the larger the angle of direction change is, the longer the contact times and the greater the ground reaction forces are and angles larger than >90° were shown to reduce nearly all momentum [30]. Therefore, longer times spent with slower muscle contraction velocities are expected in larger-angle CODs and faster muscle contraction velocities are expected in smaller angle CODs (<90°) [31,32]. Thus, maximal strength training may be more beneficial at improving force-oriented CODs, whereas plyometric training that requires faster muscle contraction velocities might be more beneficial in improving velocity-oriented CODs.
To the best of the authors’ knowledge, no studies have investigated a continuum of different angles and approaching speeds and how this is influenced by maximal strength training and plyometric training. Therefore, the main objective of the present study was to compare how strength- vs. plyometric training, which were matched in regard to direction of motion and workload, influences different COD performances during the off- and preseason. It was hypothesized that plyometric training would be more effective at improving velocity-oriented CODs, while strength training would be equally effective as plyometric training at improving force-oriented CODs. A second hypothesis was that groups combined will elicit significant improvements in most CODs due to changes in physical strength and power capacities that influences the kinematics in the COD step. Practical findings may aid how strength and conditioning coaches and practitioners utilize training to improve different CODs, as CODs will vary across different sports and by player position. Potential findings may also lead to a better understanding of how physical training influences kinematics in the COD step.
2. Materials and Methods
2.1. Method
To investigate the effect of plyometric and strength training on velocity and force-oriented COD performances, A randomized controlled trial with pre- to post measurements was used, in which one group used strength training, while the other group employed plyometrics for a period of six weeks. The training groups were matched in terms of workload as measured by impulse () based upon the study of Ettema, et al. [33] and direction of motion to determine its effect on time to complete different changes of direction tests that were the dependent variable. The independent variables were performance changes in strength and plyometric tests from pre- to post test, in addition to changes in kinematics measured in the COD step.
2.2. Participants
Twenty-one experienced male soccer players from the 2nd to the 6th highest level play in the Norwegian soccer league participated in this study. Ten players participated in a strength training group (age: 22.2 ± 3.0 years, body mass: 77.1 ± 7.2 kg, height: 181.4 ± 6.0 cm) and eleven players participated in a plyometric training group (22.6 ± 2.6 years, body mass: 82.5 ± 7.3 kg, height: 182.3 ± 5.7 cm). Participants had at least 10 years of player experience in organized soccer. A minimum of two soccer training sessions a week in the regular season was required for participation, in addition to being familiar with strength and plyometric training. The participants had no injury or illness prior to familiarization to be included. Each participant was informed of the testing procedures and possible risks and written consent was obtained prior to the study. The study was conducted with the approval of the Norwegian Center for Research Data and conformed to the latest revision of the Declaration of Helsinki.
2.3. Procedures
Prior to the intervention study, the participants underwent two sessions of familiarization, where they performed a series of COD tests, maximal strength tests and plyometric tests. The pretest took place two to three weeks after the first familiarization day during the off- and preseason period. No intensive training was performed in the 36 h preceding testing and the participants ate a light meal two hours before testing. At pretest, body height and mass were measured before the participants dressed in inertial measurement unit-based body motion capture suits (Xsens Technologies B.V. Enschede, Netherlands). This was used to measure kinematic variables in COD and to check that knee joint angles in different strength tests did not differ at posttest compared to pretest. Afterwards, the participants performed a standardized warm-up protocol consisting of 5 min of general warm-up at a self-selected jogging/running speed followed by three runs of 20 m, performed at 60%, 70% and 80% of estimated maximal sprinting velocity with 60 s of rest in between. Then, a specific warm-up with four sprints of 15 m was performed. Each sprint was followed by a cut to the left and right with 65° and 110° angles of direction change, respectively, with 80% of self-assumed maximal effort and 1 min of rest in between. The COD tests applied in this study were based on a similar approach to that in Schreurs, et al. [34].
The participants had to approach the COD maneuver area from either 4 or 20 m with a left or right cut, where the angle of direction change was 45°, 90°, 135° or 180° (Figure 1). The athletes were instructed to complete each COD run as fast as possible. The COD test was performed on an indoor court surface (Taraflex Sport Evolution M 7.0 mm, Unisport, Finland). Each COD started with a standing start with the front foot placed 20 cm behind the timing gates (Brower Timing Systems, Salt Lake, UT, USA), which were 30 cm high and which were placed on each side of a 2 m-long line. Timing gates for measuring partial time and total time were 95 cm high. For an attempt to be approved, the participant had to perform the COD with both feet inside the COD area, without overstepping the rear end of the area or the turning cone (Figure 1), except for the 45° COD. The turning cone was removed when performing the 180° COD. The participants had one attempt at each condition but in the case of slipping or violations of the test requirements, one extra attempt was made. The participants had three to five minutes of rest between each run. Although it was rarely required, a test attempt resulting in a performance decrease of 0.1 s or more from the second familiarization day resulted in a reattempt to ensure maximum performance.
In addition to measuring COD times, joint kinematics were measured in 3D at 240 Hz (Xsens Technologies B.V. Enschede, The Netherlands). This system has been shown to be valid and reliable in these type of movements [35,36,37]. The calibration procedure was completed with participants performing the N-pose after inserting all possible anthropometric data listed in the Xsens software. Joint angles (hip flexion, hip abduction and knee flexion) was defined by joint angle displacement relative to the joint angles in static N-Pose. Together with the lean angle, which were define by the tibia angle relative to the floor, these two variables were analyzed from the right limb at the lowest center of mass displacement displayed in the COD step.
Center of mass displacement, defined as the largest displacement of center of mass displayed in the COD step while the right foot was in contact with the ground, was also collected together with the contact time. Contact time was visually verified by deriving the first frame of initial ground contact to the last frame of ground contact in the Xsens software of the right leg during the COD step. This was completed to obtain more information about eventual changes in kinematics that could explain possible changes in COD performances from pre- to post-test.
After the COD tests, the participants had a 30 min break where they consumed a light serving of instant oatmeal (396 kcal). After the break, four maximal dynamic strength and five plyometric tests were assessed in randomized order for each participant. It was decided that both COD, strength and plyometric test were performed within one session due to the fact that soccer players are accustomed to perform multiple high-intensity COD actions, typically over 30−40 per limb during a game [38]. Unilateral exercises were performed with the participants’ dominant leg, defined by their preferred leg for kicking a soccer ball, which was the right leg for all participants.
2.4. Strength Performances
Participants performed three different one-repetition maximum (1RM) back squat tests (Unilateral quarter squat, bilateral parallel squat and lateral squat), in addition to unilateral plantarflexion. The unilateral quarter squat was performed in a Powerline smith machine (PSM144X, Body-Solid, Forest Park, IL, USA) while the bilateral parallel squat and lateral squat was performed by lifting the Olympic barbell (20 kg) from a squat rack. At each 1RM attempt in the strength tests, a strength-experienced person was spotting the participants.
The squats were approved for each participant at posttest, when a maximal variation of ±3° in the knee joint compared to pre-test was found, measured with the Xsens software. Before each 1RM squat test, the participants performed one set of two repetitions at approximately 50% of 1RM and one set of one repetition at 80% of 1RM with 1–2 min of rest after each set, like previous research [39]. When attempting 1RM, up to three attempts were made. The weight chosen to be performed was estimated based on near-maximal loads performed on the second day of familiarization.
In consultation with each participant following successful 1RM attempts, the barbell load was increased by 2.5–5 kg until no further weight could be lifted. The researchers decided that 1RM was accomplished through one attempt if improvements were perceived to be unlikely trough additional attempts. This was based on the bar velocity visually controlled by the researcher, complied with participants self-perceived exertion. Participants had 3–4 min of rest between each 1RM attempt [40,41], which also applied to the rest periods when attending a new strength or plyometric tests.
In the unilateral quarter squat test (Figure 2A), the toe had to be pointed forward on the edge of the platform and the participants had to reach a valid depth [42]. The nondominant foot was to remain passive, hanging slightly backwards. Participants were free to flex their hips but no rotation of the hip joint was allowed. In the bilateral parallel squat (Figure 2B), the participants were instructed to reach a parallel depth, which corresponds to a visualized line between the trochanter major and the patella, which was parallel to the ground. A barbell was placed on the upper trapezius; this was the barbell position that was used for all the squat exercises. There was no standardization regarding stance and the participants used a self-taught stance or a stance that was moderated by the researchers during the familiarization.
In the lateral squat (Figure 2C), participants started with a hip-width stance followed by planting their dominant foot to the side. The lateral step had to be planted far enough so that the supporting limb could be fully extended. Unilateral plantar flexion required the participants to place the metatarsal bone over the edge of the gray platform (Figure 2D). They were “cued” to distribute the load on their big toe to prevent inversion of the ankle. The starting position was with the heel lowered on a wooden platform. On a signal, they extended the ankle maximally and were asked to hold that position for 2 s.
2.5. Plyometric Performances
Before each plyometric test (drop jump, unilateral CMJ, bilateral and unilateral hurdle jumps and skate jump), the participants performed two sets of the exercise at sub-maximal intensity with 1–2 min of rest in between. When testing, participants had three attempts with 2–3 min of rest between each test attempt, the best trial was used for analysis [43]. Jump height, ground contact time and reactive strength index (jump height in meters divided by contact time in seconds) were measured from the plyometric tests using a contact grid (Ergotest Innovation AS, Porsgrunn, Norway).
Drop jumps (Figure 3A) were performed with two legs with individualized drop heights of 30, 45 and 60 cm. The highest RSI score that the participants achieved on the second day of the familiarization was used to determine the optimal drop height [44]. Participants were instructed to keep arms akimbo, minimize the contribution of momentum created by forward leaning of the torso and mimic the instant of takeoff at landing [45,46], which was also practiced for unilateral countermovement jump (Figure 3B). Participants were further instructed to jump as high as possible with shortest contact time/SSC as possible in drop jump and unilateral countermovement jump respectively, in line with previous research [47,48].
Hurdle jumps were performed bilaterally and unilaterally (Figure 3C,D). The distance between each hurdle was 1.70 m for the bilateral condition and 1 m for the unilateral condition. Hurdle heights were standards of either at 20, 30, 40, 50 or 60 cm, which one of these heights applied to all hurdles within one test. This was based on the second familiarization day, which the height that athletes demonstrated the shortest contact time was used on the test day. The participants were instructed to jump over all hurdles as fast as possible, minimizing the contact time between [48,49]. The athletes performed three jumps within one series; the jump with the shortest contact time in three attempts was used for analysis.
In the skate jump, the participants started by placing their dominant foot on a marked tape. On a signal, they performed the exercise trying to reach maximal lateral distance, landing on their non-dominant foot with full control in the landing (Figure 3E). The performance was tracked by measuring the distance from the marked tape at the start to the middle of the heel used for landing.
2.6. Training
After the test day, participants were evenly matched based upon their competitive level and performance in part-time and total time in the COD tests and assigned to either strength (n = 10) or plyometric (n = 11) training. However, one player from the strength training group got injured and was therefore excluded. During the intervention, participants were not allowed to train lower limb strength and plyometric exercises at their spare time, in addition to sprint, COD and deceleration training outside their regular soccer practice. For both the plyometric and strength training group, the training was performed in a controlled lab environment, supervised by a strength- and plyometric experienced researcher at each training session, providing participants individual feedback to ensure for both effort and technique in exercises. The participants were instructed to perform the strength exercises with a controlled eccentric phase of the lift [42]. In plyometric exercises, participants were encouraged to maximize performance with minimizing contact time and jump height. They were regularly provided feedback by contact mats, which functioned as a motivational tool. They were given cues such as fully extend their ankle when performing countermovement jump. The drop jumps and hurdle jumps were performed from the same height as deemed optimal at the day of testing.
To match exercises from strength and plyometric training in terms of workload, impulse in the movements was calculated based on approaches from past research [33,50,51,52]. The total workload of each training program and their respective exercises was calculated and matched (Table 1). The workload for each training session equal to around 6000 Ns per training group per training session. The workload for the strength exercises was calculated by using a linear encoder (Ergotest Innovation AS, Porsgrunn, Norway) attached to a squat bar, measuring the maximum velocity in the movement. The workload for the plyometric exercises was estimated using indirect measures of flight time measured by a contact grid. The post-test occurred approximately one week after completion of the training program.
2.7. Statistical Analysis
To assess the effect of strength and plyometric training upon COD performances with different angles and approaches, a 2 (training group: independent groups) × 4 (degrees: 45‒180) × 2 (test occasion: pre, post) analysis of variance (ANOVA) with repeated measures was used on 4 m and 20 m approaches. In addition, percentage of change from pre- to posttest per group were calculated and per group repeated-measures ANOVAs were used to identify changes in 16 m part-times prior to the 20 m CODs (4 sprints) and performance changes in three strength exercises and five plyometric exercises. Besides the absolute strength performances, were the strength performances also normalized to body mass for each individual in order to present measures of relative strength. A two-way repeated-measures ANOVA (4 degrees × 2 times: pre, post) was also used to identify changes in kinematics for both groups combined from pre- to post-test. When significant differences occurred, Holm-Bonferroni post hoc tests were conducted to identify comparisons that were statistically significant. The level of significance was set at p < 0.05 and all data were expressed as mean ± SD after confirmation of the normal distribution using Kolmogorov Smirnov test. Independent sample t-test was conducted to check for differences in age, body, mass and height between groups. Effect size was evaluated with η2 (eta squared) where 0.01 < η2 < 0.06 constitutes a small effect, 0.06 < η2 < 0.14 constitutes a medium effect and η2 > 0.14 constitutes a large effect [53]. The analyses were carried out using SPSS Statistics v26 (IBM Corp., Armonk, NY, USA). Since no significant differences between different left and right COD test completion times at baseline (p ≥ 0.17) were found, further analysis was only conducted on left-side CODs. In these CODs the dominant leg (right leg for all participants) was used in the COD step and kinematics were analyzed on the dominant foot.
3. Results
There were no statistical differences in age, body-mass and height between the groups at baseline (p ≥ 0.21). All strength and plyometric exercise performances improved from pre- to post-testing (F ≥ 3.214, p ≤ 0.05, η2 ≥ 0.167). However, a significant effect from pre- to post (group × time interaction) was found in seven out of eight strength and plyometric exercises (F ≥ 4.776; p ≤ 0.045, η2 ≥ 0.230), with the bilateral hurdle jump being the exception (F = 0.435; p = 0.519, η2 = 0.028). The strength training group improved more in all strength exercises (bilateral, unilateral and lateral squats) than the plyometric training group, while the plyometric training group improved more in all plyometric exercises (except for the bilateral hurdle jump; see Table 4).
A significant test occasion effect (F ≥ 7.3; p ≤ 0.015, η2 ≥ 0.27) was found for all COD times with 4 and 20 m approaches. Furthermore, a significant effect of COD degree (F ≥ 550; p < 0.001, η2 ≥ 0.98) upon the COD times was found. However, no significant time*degree interaction (F ≤ 1.4; p ≥ 0.247, η2 ≤ 0.07) or any group interactions were found (F ≤ 2.6; p ≥ 0.121, η2 ≤ 0.13). Post hoc comparison revealed that only the 4 m 45° and 180° and 20 m 180° COD times significantly decreased from pre- to post-test (Table 5) and that with increasing degree the COD times increased.
All COD times between the different degrees were significantly different on p < 0.05 level. Note that positive percentage of change means faster COD performance at the post test.
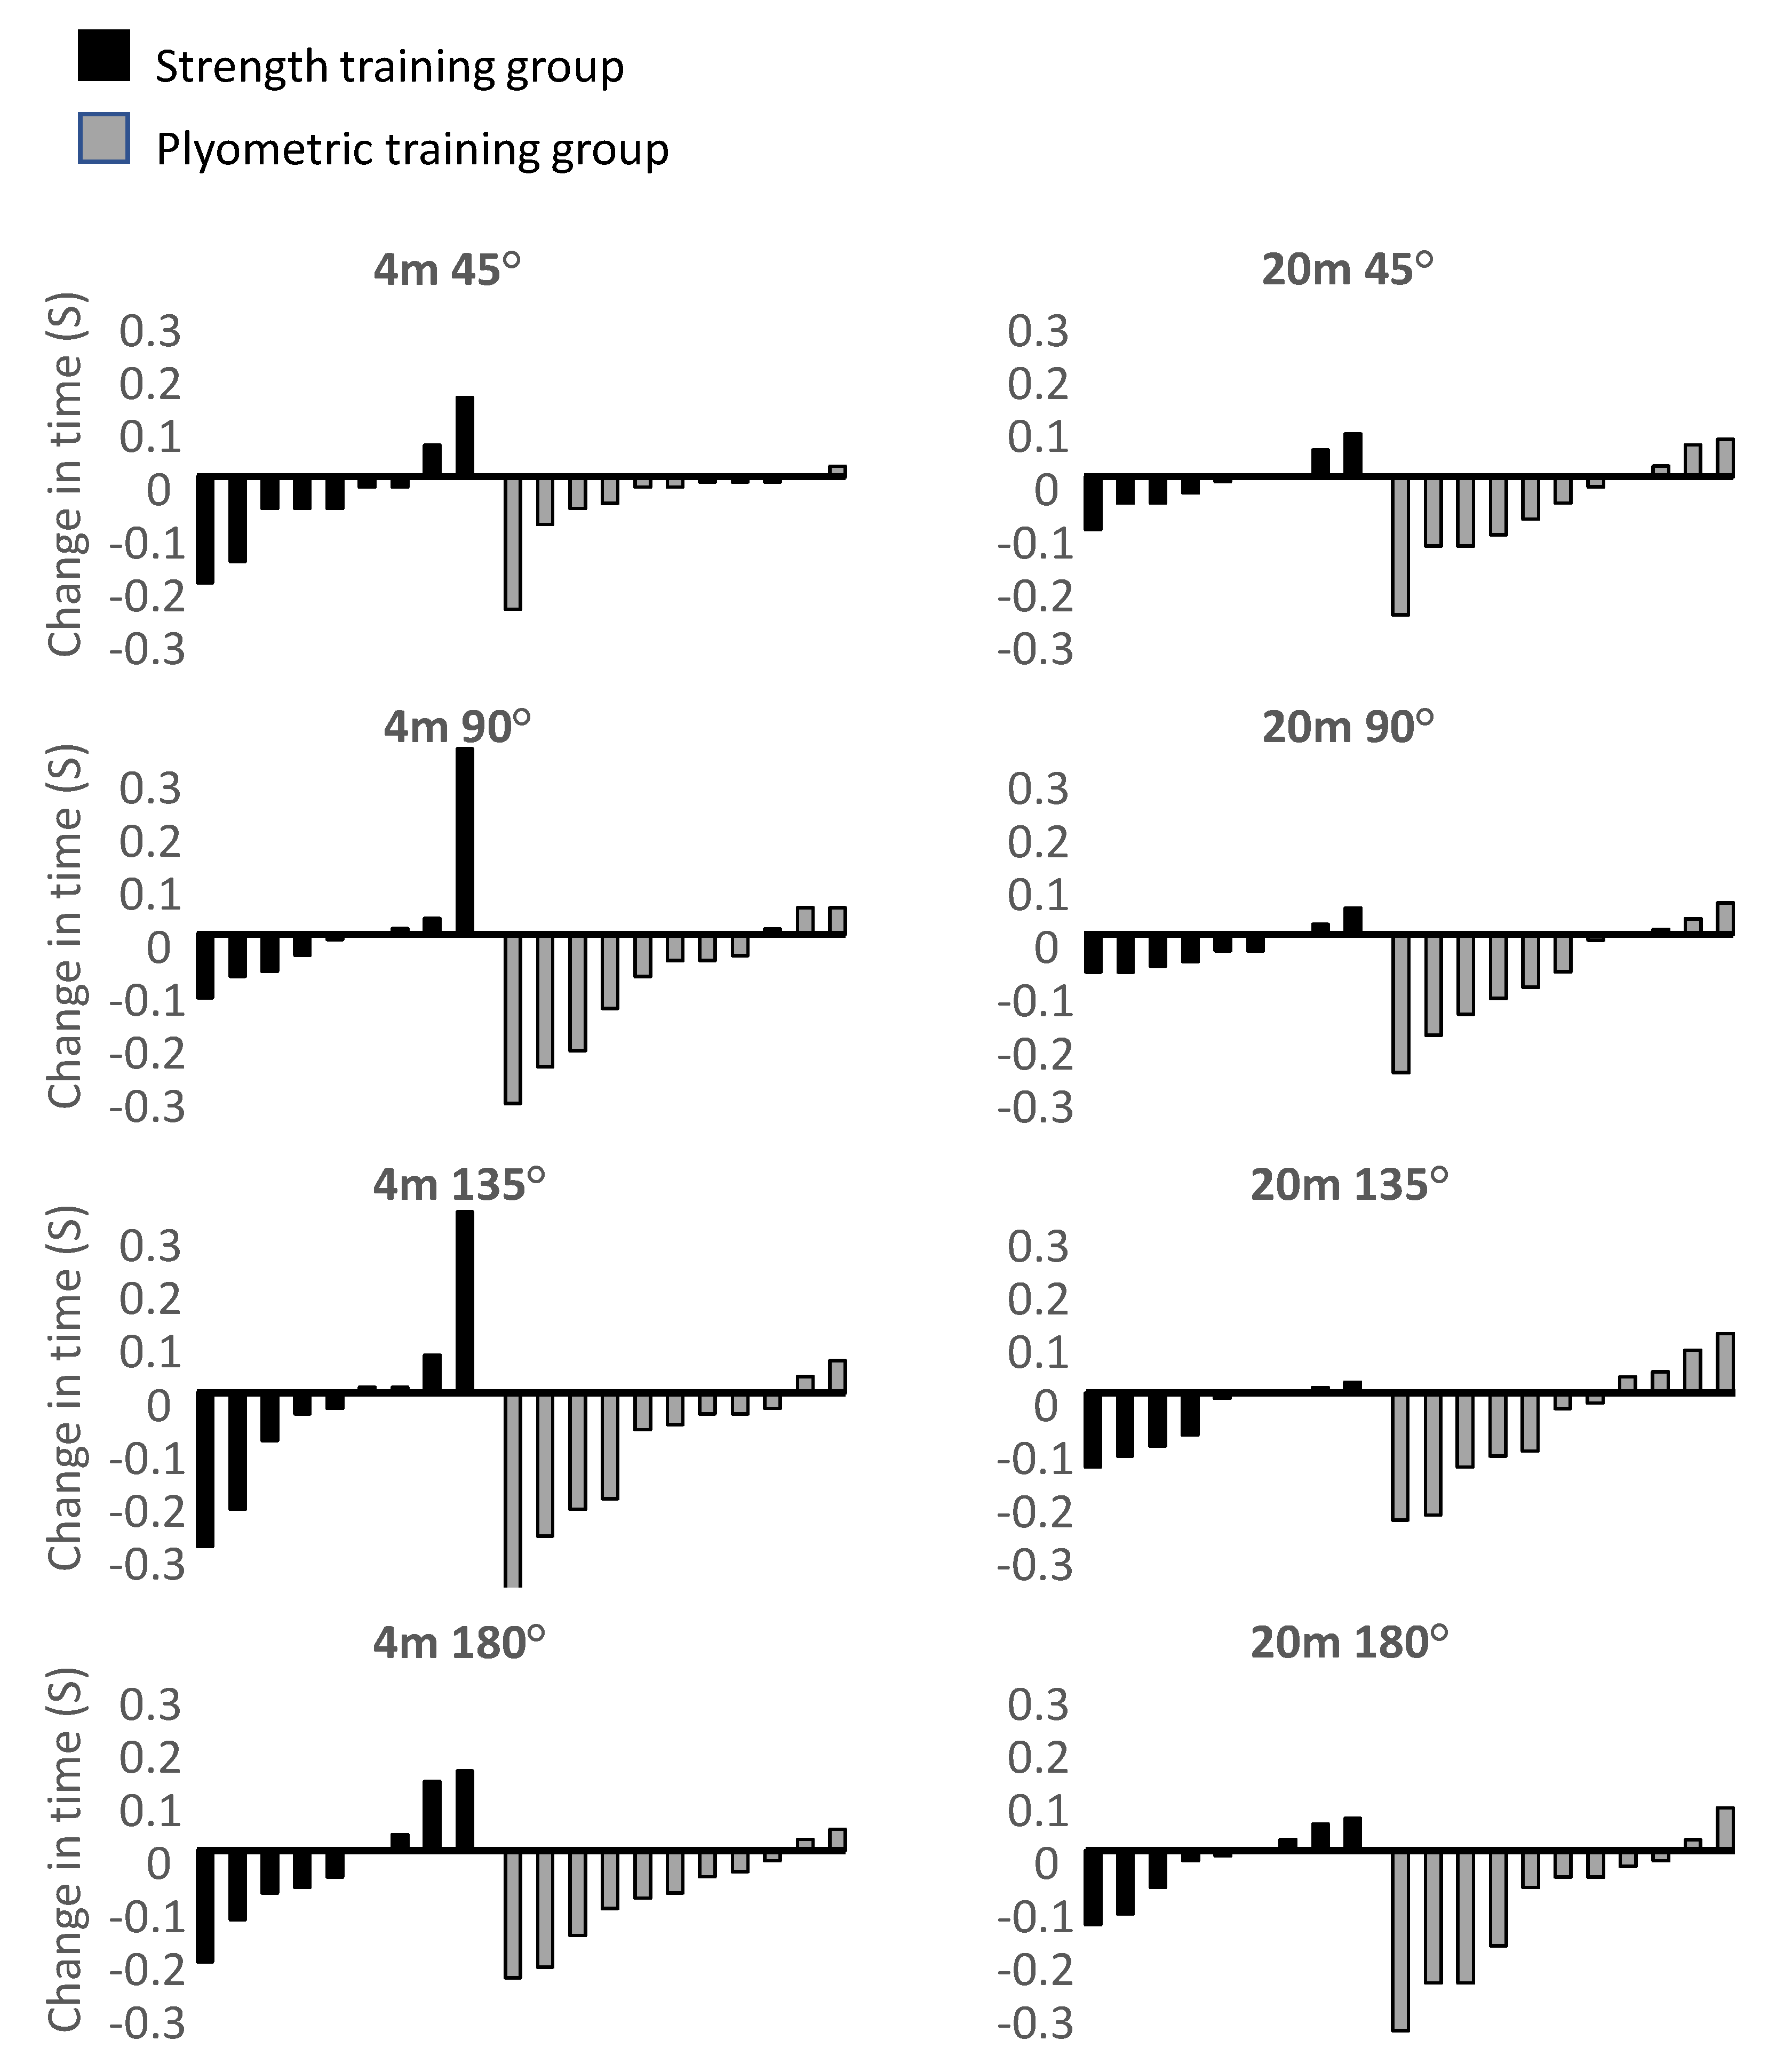
However, when analyzed per group only significant decreases in COD times were found in 90°, 135° and 180° with the 4 m approach and 180° with the 20 m approach in the plyometric training group. Individual changes in COD performances within both groups showed that with the 4 m approach at least 55% and 81% of the strength and plyometric training group, respectively, improved COD performance, while with the 20 m approach at least 66% of both groups improved performance (Figure 4).
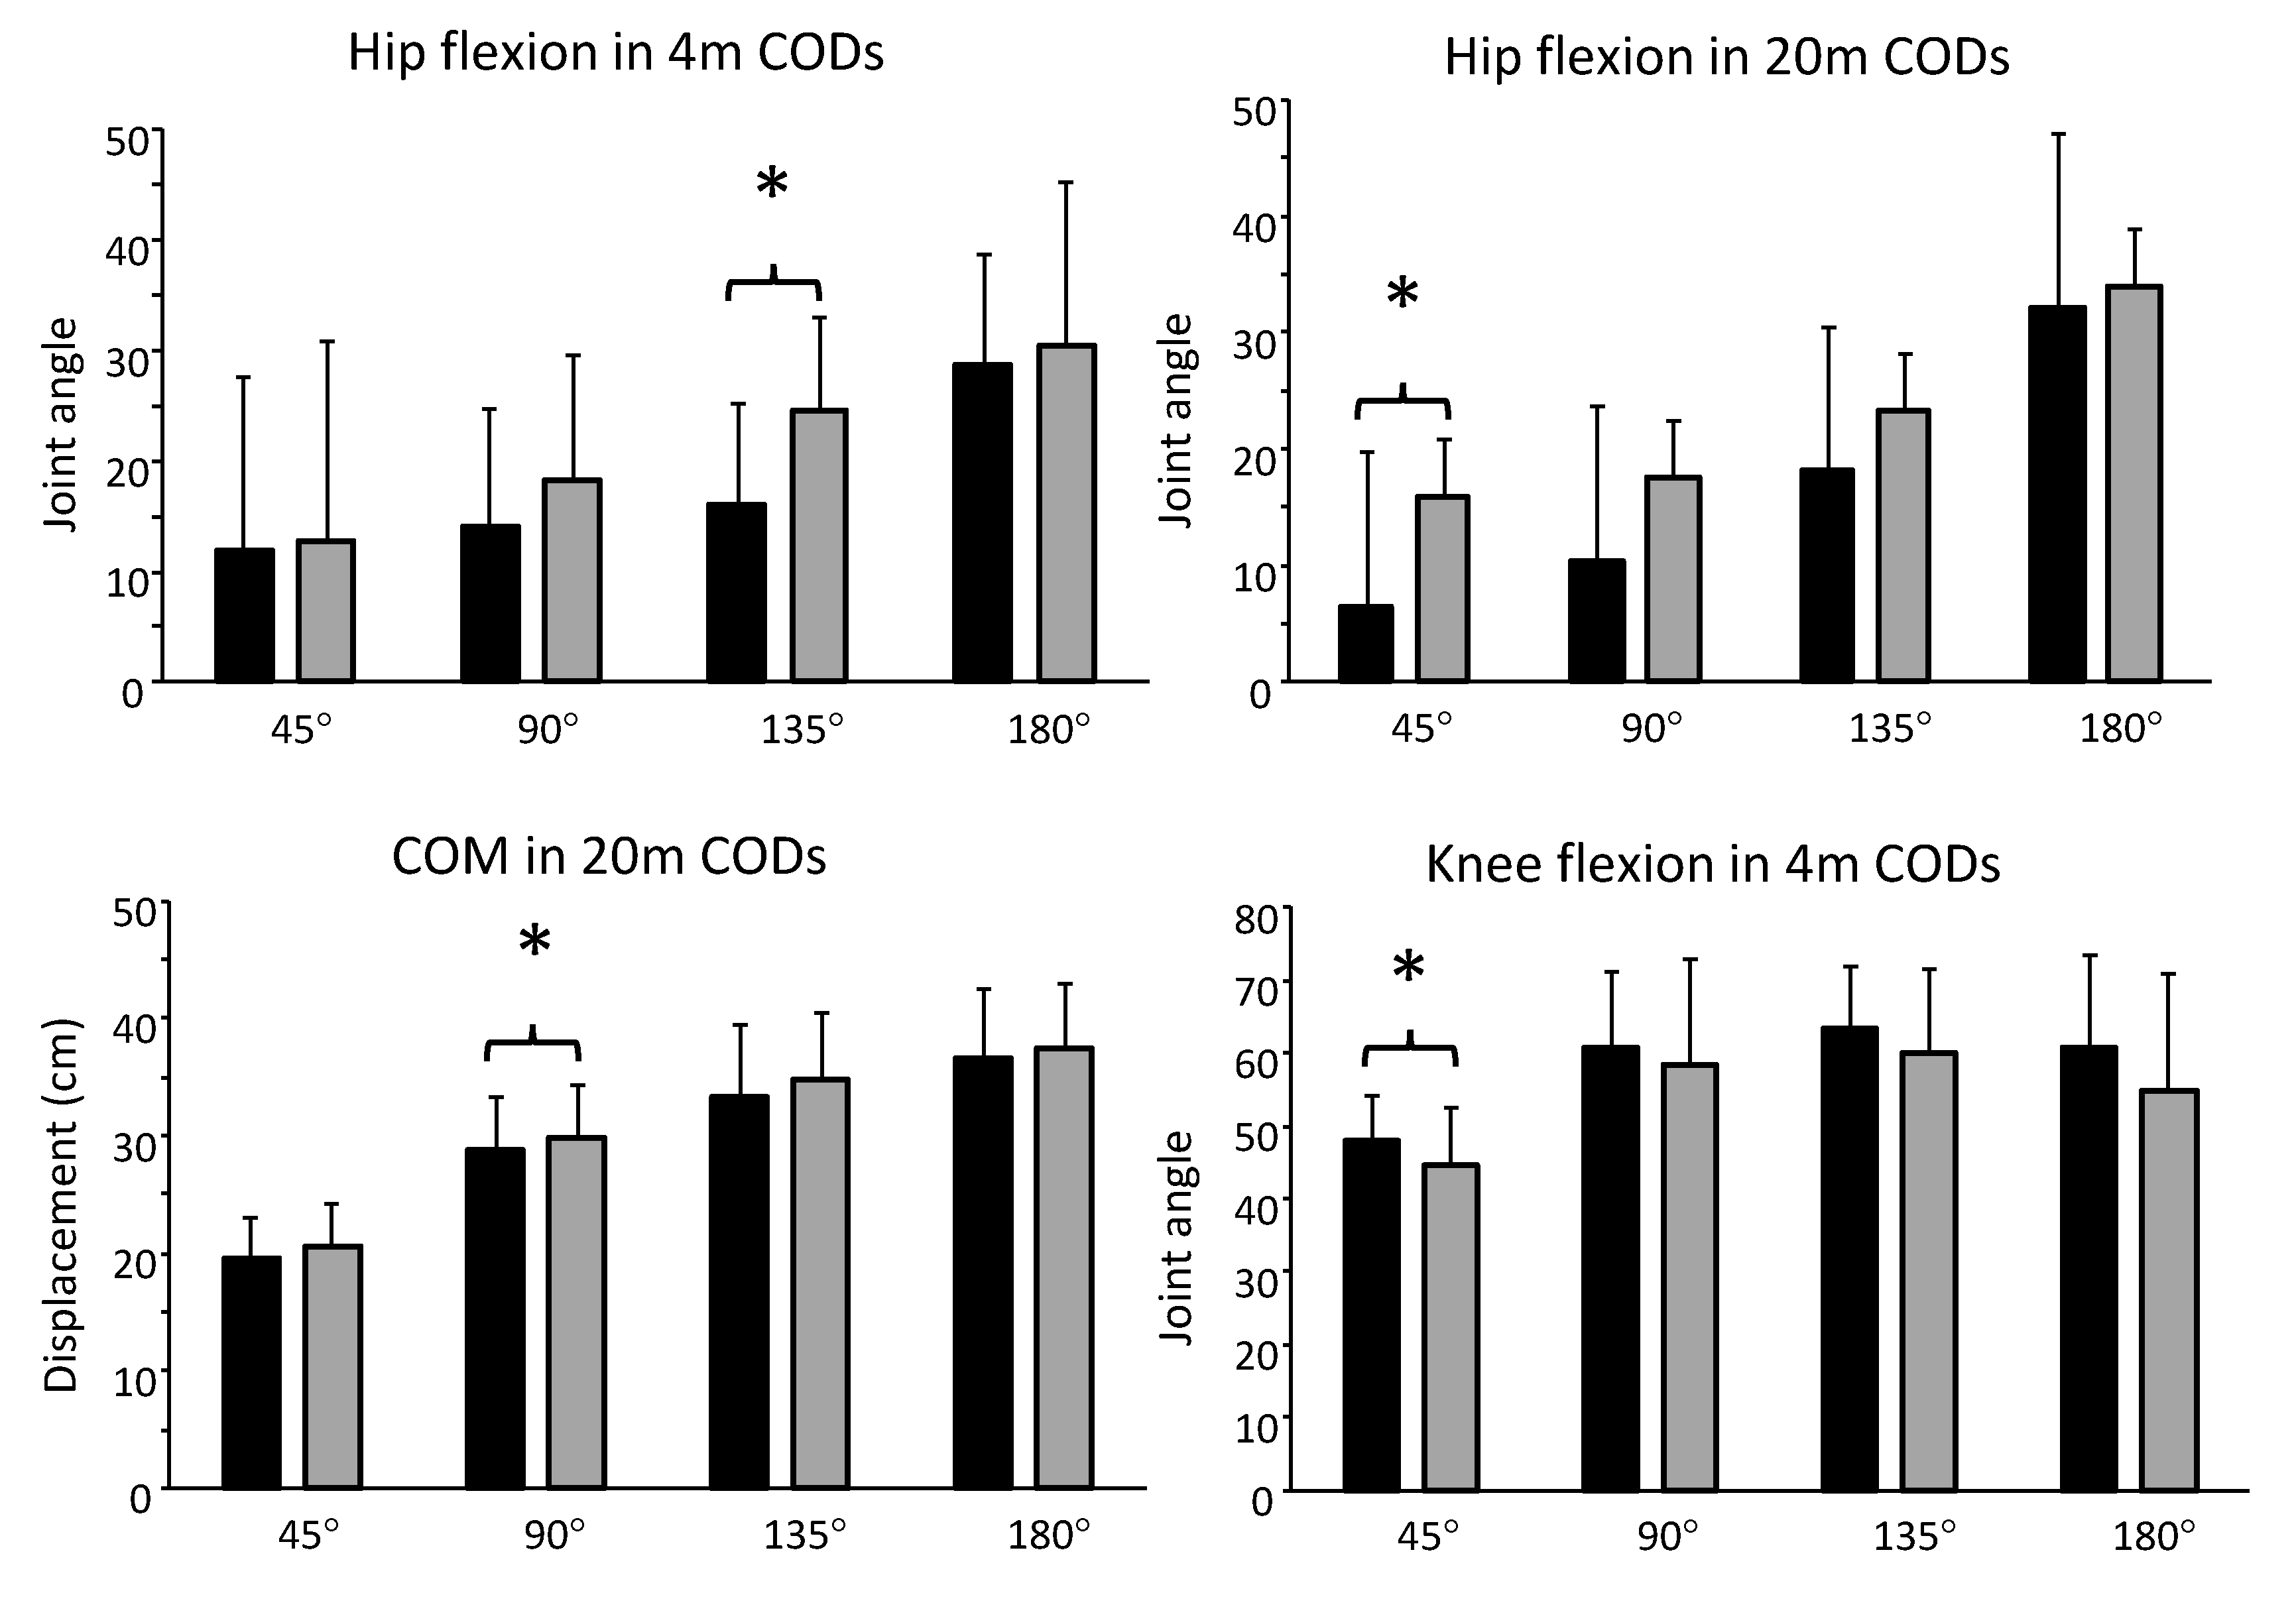
Significant changes in step and joint kinematics from pre- to post-test were found when both groups were combined (Table 6) for peak hip and knee flexion angle in 4 m CODs (F ≥ 10.7, p ≤ 0.032, η2 ≥ 0.43) and center of mass and hip flexion in 20 m CODs (F ≥ 5.8; p ≤ 0.035, η2 ≥ 0.29; see Figure 5). The remaining kinematic variables displayed no significant changes (F ≤ 3.12, p ≥ 0.103, ηp2 ≤ 0.21).
4. Discussion
The aim of this study was to examine the effect of strength- vs. plyometric training that were matched in terms of workload and exercise direction of motion on CODs with different approaches, distances and angles. The main findings were that both training programs improved different CODs (Table 5), with no significant differences between groups. Changes in COD performances were accompanied by increased hip flexion, more displacement in the center of mass and less knee flexion (Figure 5). In addition, improvements in strength and plyometric performance after six weeks were related to the training program (Table 4). Strength performance was improved in the strength training group and plyometric performance was improved in the plyometric training group.
Improvements in COD performance for both groups were partly comparable with previous studies and theory suggesting that strength training can induce better performance in strength-oriented CODs, while plyometric training can induce better performance in both strength- and velocity-oriented CODs [13,15]. Marked improvements were only found within the plyometric training group in the 90°, 135° and 180° CODs from 4 m and the 180° COD from 20 m, where improvement in percentage change varied from 3.2% to 4.6%. These increases were greater than in previous studies implementing plyometric training in short-duration CODs (<10 s) in a similar population [54,55]. The study points towards greater improvements in CODs induced by the plyometric training group, although the majority of the participants in both groups improved their performances in all COD tasks (Figure 4), which implies that both training approaches may be effective at improving different CODs.
Changes in COD performances from a kinematic point of view can be explained by the fact that participants changed their way of altering joint mechanics from pre- to post-test. Sixteen out of 20 participants improved their performance in the 4 m 45° COD where less knee flexion was found at post-test. Therefore, it seems that participants stiffened the knee joint with minimal flexion. Generally, an increased knee angle during COD ensures greater braking and propulsive force application, typically demonstrated by stronger athletes [56]. However, a reduced knee flexion angle in 45° CODs will likely enable a more efficient force transmission between the knee and ankle joint, enabling greater exertion of vertical ground reaction force, deemed important for maintaining propulsion and velocity during directional changes of <45° [18].
Although approaching velocity was not quantified in this study, greater approaching velocity is expected in smaller-angle CODs and with increasing approach distance [18]. Havens and Sigward [57] reported no differences in ground reaction impulse between the penultimate step and the COD step in a 45° COD from a 7.5 m approach distance, indicating that braking is not an important factor in 45° COD as the penultimate foot contact plays an integral role in braking [58]. Therefore, the increased hip angle found in the 20 m 45° COD might be suboptimal as this will shift the center of pressure further and posteriorly away from the center of mass (COM) [34] and limits hip sagittal plane power [59]. This could explain why only 12 out of 20 improved their performance in the 20 m 45° COD as they failed to maintain velocity throughout the turn.
Furthermore, increased hip angle and COM displacement were observed in 4 m 135° and 20 m 90° CODs. Turns of >90° have been shown to reduce nearly all momentum [30], meaning that exertion of horizontal/propulsive force will be prevalent in accelerating in a new direction. This can be accomplished by lowering COM [60] or increasing forward lean [61]. Fourteen out of 20 participants improved their performance in the 4 m 135° COD and those who improved had relatively large improvements, which were accompanied by relatively large changes in hip flexion angle from pre- (16°) to post-test (24.6°). Only 12 out of 20 participants improved in the 20 m 90° COD and the minor individual improvements may be explained by small changes in COM from pre- (28.8 cm) to post-test (29.8 cm).
It is hard to draw any clear conclusion on how the two training programs influenced changes in kinematics. The strength training group improved their performance in three out of three strength exercises and in one out of five plyometric exercises. The plyometric training group improved their performance in five out of five plyometric exercises and in one out of three strength exercises. It is possible that participants had learned to apply greater ground reaction forces in the specific exercise range of motions trained, which is supported by the work of Rhea, et al. [62], who found increased levels of strength prior to a training intervention to be joint angle-specific. Alternatively, adaptations after training may also be explained by the fact that neuromuscular adaptations are velocity-specific [63,64] and specific to the contraction type and movement type trained [64]. This means that adaptations in muscle contraction velocity and force occur near or at the training velocity applied [65]. This was investigated by Loturco, et al. [66], who compared a group of young soccer players training with squat jumps with loads lower than their optimal power load and one group training with a load higher than their optimal power load. Results showed that the group training with a load lower than their optimal power load increased power production over the entire range (−20%, 0% and 20% of optimal power load). The group training with loads higher than the optimum load only increased at their optimal load condition and with loads 20% higher than optimal. Although there seems to be no clear consensus regarding adaptations in different parts of the force velocity curve following training, the strength training program is arguably suboptimal compared to the plyometric training group as the RFD in COD prevents players from expressing their maximal force capacity depending on the task [67].
These task-specific constraints may be exemplified by the fact that the strength training group displayed their greatest improvement in the 20 m 135° COD (−0.08 s). This was substantially better than the plyometric group (−0.01 s; see Table 4). This has a practical application considering that 135° directional changes represent a threshold, where a shift from a unilateral to a bilateral COD step typically occurs [18], thus players may approach the COD with a speed they feel they can tolerate based on their individual level of strength and perhaps modify the COD step technique based on their strength capacity. It is possible that players that underwent strength training approached the 20 m 135° COD with greater confidence in applying and tolerating the force with the 20 m 135° COD than the plyometric group. However, the effect in this task is unclear (p > 0.05) and needs further investigation.
It should be mentioned that no differences were observed from pre- to post-test regarding contact time in different CODs. Considering the reduction in time taken to complete CODs, lower contact times in the COD step were expected as this has proved to be related to faster COD performance [68]. One possible explanation could be that the COD step is performed with a higher production of ground reaction force, which could result in higher concentric power output at push-off and thereby greater stride length, although this is dependent on the extent to which ground reaction force contributes to braking vs. propulsion.
The present study collected no kinetic data, which could have provided a more practical relevance and quantification regarding force production during COD and how this is related to the effect of the two training programs. Due to the variation in individual training responses and the limitation of only performing one attempt per COD it was difficult to compare results between the two training groups and the strength training was not appropriate for yielding statistical significance due to the lower sample size. In addition, further research with a test-retest correlation design is necessary to improve the findings of this study. Implementation of force plates sampling kinetic data from both the COD step and the penultimate step with several test trials is recommended to enable a better understanding of which phases of COD the training programs are affecting. Consequently, with the limitations raised, this should encourage future researchers to replicate parts of this study.
5. Conclusions
The development of change of direction ability has become more specific. This research shows that there is some task-specific adaptation in COD depending on the angle of direction change and approaching velocity to the COD maneuver. In summary, both the strength and the plyometric training program, in particular, are useful for developing COD ability that requires angles of directional change of ≥90° and ≥135°, respectively, in mature male soccer players in six weeks. The plyometric training program can effectively be used by players that want to surpass or respond to opponents in anticipated situations where the angle of direction change is relatively sharp (>90°). Considering the limited time for implementing physical conditioning, in addition to regular soccer practice in most soccer environments, the current plyometric training program can be advantageous in improving CODs at maximal intensity. However, strength and conditioning coaches must carefully apply the training program based on the individual player, as previous work [15] has shown that a minimum level of maximal strength in the lower limbs is necessary for plyometric training to have an effect upon COD ability.
Author Contributions
Conceptualization, H.N.F., H.G.R. and R.v.d.T.; methodology, H.N.F., H.G.R. and R.v.d.T.; data curation H.N.F. and H.G.R.; writing—original draft preparation, H.G.R.; writing—review and editing, H.N.F., H.G.R. and R.v.d.T.; supervision, R.v.d.T. All authors have read and agreed to the published version of the manuscript.
Funding
This research received no external funding.
Conflicts of Interest
The authors declare no conflict of interest.
References
- Reilly, T.; Williams, A.M.; Nevill, A.; Franks, A. A multidisciplinary approach to talent identification in soccer. J. Sports. Sci. 2000, 18, 695–702. [Google Scholar] [CrossRef]
- Bangsbo, J. The physiology of soccer: With special reference to intense intermittent exercise. Acta Physiol. Scand. Suppl. 1994, 619, 1–155. [Google Scholar]
- Dalen, T.; Ingebrigtsen, J.; Ettema, G.; Hjelde, G.H.; Wisløff, U. Player load, acceleration, and deceleration during forty-five competitive matches of elite soccer. J. Strength Cond. Res. 2016, 30, 351–359. [Google Scholar] [CrossRef]
- Brughelli, M.; Cronin, J.; Levin, G.; Chaouachi, A. Understanding change of direction ability in sport. Sports Med. 2008, 38, 1045–1063. [Google Scholar] [CrossRef] [PubMed]
- Sheppard, J.M.; Young, W.B. Agility literature review: Classifications, training and testing. J. Sports Sci. 2006, 24, 919–932. [Google Scholar] [CrossRef] [PubMed] [Green Version]
- Trecroci, A.; Milanović, Z.; Frontini, M.; Iaia, F.M.; Alberti, G. Physical performance comparison between under 15 elite and sub-elite soccer players. J. Hum. Kinet. 2018, 61, 209–216. [Google Scholar] [CrossRef] [PubMed] [Green Version]
- Gabbett, T.J.; Kelly, J.N.; Sheppard, J.M. Speed, change of direction speed, and reactive agility of rugby league players. J. Strength Cond. Res. 2008, 22, 174–181. [Google Scholar] [CrossRef] [PubMed]
- Lockie, R.G.; Jeffriess, M.D.; McGann, T.S.; Callaghan, S.J.; Schultz, A.B. Planned and reactive agility performance in semiprofessional and amateur basketball players. Int. J. Sports Physiol. Perform. 2014, 9, 766–771. [Google Scholar] [CrossRef] [PubMed]
- Sisic, N.; Jelicic, M.; Pehar, M.; Spasic, M.; Sekulic, D. Agility performance in high-level junior basketball players: The predictive value of anthropometrics and power qualities. J. Sports Med. Phys. Fitness 2016, 56, 884–893. [Google Scholar]
- Trecroci, A.; Longo, S.; Perri, E.; Iaia, F.M.; Alberti, G. Field-based physical performance of elite and sub-elite middle-adolescent soccer players. Res. Sports Med. 2019, 27, 60–71. [Google Scholar] [CrossRef]
- Young, W.B.; Miller, I.R.; Talpey, S.W. Physical qualities predict change-of-direction speed but not defensive agility in Australian rules football. J. Strength Cond. Res. 2015, 29, 206–212. [Google Scholar] [CrossRef] [PubMed] [Green Version]
- Asadi, A.; Arazi, H.; Young, W.B.; de Villarreal, E.S. The effects of plyometric training on change-of-direction ability: A meta-analysis. Int. J. Sports Physiol. Perf. 2016, 11, 563–573. [Google Scholar] [CrossRef] [Green Version]
- Bourgeois, F.; McGuigan, M.; Gill, N.; Gamble, G. Physical characteristics and performance in change of direction tasks: A brief review and training considerations. J. Austr. Strength Cond. 2017, 25, 104–117. [Google Scholar]
- Dos’Santos, T.; McBurnie, A.; Thomas, C.; Comfort, P.; Jones, P. Biomechanical comparison of cutting techniques: A review ans practical applications. Strength Cond. J. 2019, 41, 40–54. [Google Scholar] [CrossRef]
- Falch, H.N.; Rædergård, H.G.; van den Tillaar, R. Effect of different physical training forms on change of cirection ability: A systematic review and meta-analysis. Sports Med. 2019, 5, 53. [Google Scholar]
- Watts, D. A brief review on the role of maximal strength in change of direction speed. J. Austr. Strength Cond. 2015, 23, 100–108. [Google Scholar]
- Nimphius, S.; Callaghan, S.J.; Bezodis, N.E.; Lockie, R.G. Change of direction and agility tests: Challenging our current measures of performance. Strength Cond. J. 2018, 40, 26–38. [Google Scholar] [CrossRef] [Green Version]
- Dos’Santos, T.; Thomas, C.; Comfort, P.; Jones, P.A. The effect of angle and velocity on change of direction biomechanics: An angle-velocity trade-off. Sports Med. 2018, 48, 2235–2253. [Google Scholar] [CrossRef] [Green Version]
- Young, W.B.; James, R.; Montgomery, I. Is muscle power related to running speed with changes of direction? J. Sports Med. Phys. Fitness 2002, 42, 282–288. [Google Scholar]
- Nygaard Falch, H.; Guldteig Rædergård, H.; Van den Tillaar, R. Relationship of performance measures and muscle activity between a 180° change of direction task and different countermovement jumps. Sports 2020, 8, 47. [Google Scholar] [CrossRef]
- Markovic, G.; Mikulic, P. Neuro-musculoskeletal and performance adaptations to lower-extremity plyometric training. Sports Med. 2010, 40, 859–895. [Google Scholar] [CrossRef] [PubMed]
- van de Hoef, P.A.; Brauers, J.J.; van Smeden, M.; Backx, F.J.G.; Brink, M.S. The effects of lower-pxtremity Plyometric training on soccer-specific outcomes in adult male soccer players: A systematic review and meta-analysis. Int. J. Sports Physiol. Perform. 2019, 1–15. [Google Scholar] [CrossRef]
- Barbalho, M.; Gentil, P.; Raiol, R.; Del Vecchio, F.B.; Ramirez-Campillo, R.; Coswig, V.S. Non-Linear Resistance Training Program Induced Power and Strength but Not Linear Sprint Velocity and Agility Gains in Young Soccer Players. Sports 2018, 6, 43. [Google Scholar] [CrossRef] [Green Version]
- Coratella, G.; Beato, M.; Cè, E.; Scurati, R.; Milanese, C.; Schena, F.; Esposito, F. Effects of in-season enhanced negative work-based vs traditional weight training on change of direction and hamstrings-to-quadriceps ratio in soccer players. Biol. Sport 2019, 36, 241–248. [Google Scholar] [CrossRef] [PubMed]
- Ramirez-Campillo, R.; Alvarez, C.; Gentil, P.; Loturco, I.; Sanchez-Sanchez, J.; Izquierdo, M.; Moran, J.; Nakamura, F.Y.; Chaabene, H.; Granacher, U. Sequencing effects of plyometric training applied before or after regular soccer raining on measures of physical fitness in young players. J. Strength Cond. Res. 2020, 34, 1959–1966. [Google Scholar] [CrossRef] [Green Version]
- Bianchi, M.; Coratella, G.; Dello Iacono, A.; Beato, M. Comparative effects of single vs. double weekly plyometric training sessions on jump, sprint and change of directions abilities of elite youth football players. J. Sports Med. Phys. Fitness 2019, 59, 910–915. [Google Scholar] [CrossRef] [PubMed]
- McMillan, K.; Helgerud, J.; Grant, S.J.; Newell, J.; Wilson, J.; Macdonald, R.; Hoff, J. Lactate threshold responses to a season of professional British youth soccer. Br. J. Sports Med. 2005, 39, 432–436. [Google Scholar] [CrossRef] [Green Version]
- de Villarreal, E.S.; González-Badillo, J.J.; Izquierdo, M. Low and moderate plyometric training frequency produces greater jumping and sprinting gains compared with high frequency. J. Strength Cond. Res. 2008, 22, 715–725. [Google Scholar] [CrossRef] [Green Version]
- Silva, J.R.; Nassis, G.P.; Rebelo, A. Strength training in soccer with a specific focus on highly trained players. Sports Med. Open 2015, 1, 17. [Google Scholar] [CrossRef] [Green Version]
- Andrews, J.R.; McLeod, W.D.; Ward, T.; Howard, K. The cutting mechanism. Am. J. Sports Med. 1977, 5, 111–121. [Google Scholar] [CrossRef]
- Jones, P.; Bampouras, T.; Marrin, K. An investigation into the physical determinants of change of direction speed. J. Sports Med. Phys. Fitness 2009, 49, 97–104. [Google Scholar] [PubMed]
- Spiteri, T.; Nimphius, S.; Hart, N.H.; Specos, C.; Sheppard, J.M.; Newton, R.U. Contribution of strength characteristics to change of direction and agility performance in female basketball athletes. J. Strength Cond. Res. 2014, 28, 2415–2423. [Google Scholar] [CrossRef] [PubMed]
- Ettema, G.; Gløsen, T.; van den Tillaar, R. Effect of specific resistance training on overarm throwing performance. Int. J. Sports Physiol. Perf. 2008, 3, 164–175. [Google Scholar] [CrossRef] [Green Version]
- Schreurs, M.J.; Benjaminse, A.; Lemmink, K.A. Sharper angle, higher risk? The effect of cutting angle on knee mechanics in invasion sport athletes. J. Biomech. 2017, 63, 144–150. [Google Scholar] [CrossRef] [PubMed] [Green Version]
- Supej, M. 3D measurements of alpine skiing with an inertial sensor motion capture suit and GNSS RTK system. J. Sports Sci. 2010, 28, 759–769. [Google Scholar] [CrossRef] [PubMed]
- Al-Amri, M.; Nicholas, K.; Button, K.; Sparkes, V.; Sheeran, L.; Davies, J.L. Inertial measurement units for clinical movement analysis: Reliability and concurrent validity. Sensors 2018, 18, 719. [Google Scholar] [CrossRef] [Green Version]
- Blair, S.; Duthie, G.; Robertson, S.; Hopkins, W.; Ball, K. Concurrent validation of an inertial measurement system to quantify kicking biomechanics in four football codes. J. Biomech. 2018, 73, 24–32. [Google Scholar] [CrossRef] [PubMed]
- Robinson, G.; O’Donoghue, P.; Nielson, P. Path changes and injury risk in English FA Premier League soccer. Int. J. Perf. Analys. Sport 2011, 11, 40–56. [Google Scholar] [CrossRef]
- Dong-il, S.; Eonho, K.; Fahs, C.A.; Rossow, L.; Young, K.; Ferguson, S.L.; Thiebaud, R.; Sherk, V.D.; Loenneke, J.P.; Daeyeol, K.; et al. Reliability of the one-repetition maximum test based on muscle group and gender. J. Sports Sci. Med. 2012, 11, 221–225. [Google Scholar]
- Urquhart, B.G.; Moir, G.L.; Graham, S.M.; Connaboy, C. Reliability of 1RM split-squat performance and the efficacy of assessing both bilateral squat and split-squat 1RM in a single session for non-resistance trained recreationally active men. J. Strength Cond. Res. 2015, 29, 1991–1998. [Google Scholar] [CrossRef] [Green Version]
- Ribeiro, A.S.; do Nascimento, M.A.; Salvador, E.P.; Gurjão, A.L.D.; Avelar, A.; Ritti-Dias, R.M.; Mayhew, J.L.; Cyrino, E.S. Reliability of one-repetition maximum test in untrained young adult men and women. Isokin. Exerc. Sci. 2014, 22, 175–182. [Google Scholar] [CrossRef]
- Schoenfeld, B.J. Squatting kinematics and kinetics and their application to exercise performance. J. Strength Cond. Res. 2010, 24, 3497–3506. [Google Scholar] [CrossRef] [Green Version]
- Ramirez-Campillo, R.; Alvarez, C.; García-Pinillos, F.; Sanchez-Sanchez, J.; Yanci, J.; Castillo, D.; Loturco, I.; Chaabene, H.; Moran, J.; Izquierdo, M. Optimal reactive strength index: Is tt an accurate variable to optimize plyometric training effects on measures of physical fitness in young soccer players? J. Strength Cond. Res. 2018, 32, 885–893. [Google Scholar] [CrossRef] [Green Version]
- McClymont, D. Use of the reactive strength index (RSI) as an indicator of plyometric training conditions. In Science and Football V: The proceedings of the fifth World Congress on Sports Science and Football; Taylor & Francis Group: Lisbon, Portugal, 2005; pp. 408–417. [Google Scholar]
- Markovic, G.; Jukic, I.; Milanovic, D.; Metikos, D. Effects of sprint and plyometric training on muscle function and athletic performance. J. Strength Cond. Res. 2007, 21, 543–549. [Google Scholar] [PubMed]
- Young, W. A simple method for evaluating the strength qualities of the leg extensor muscles and jumping ability. Strength Cond. Coach 1994, 2, 5–8. [Google Scholar]
- Thomas, K.; French, D.; Hayes, P.R. The effect of two plyometric training techniques on muscular power and agility in youth soccer players. J. Strength Cond. Res. 2009, 23, 332–335. [Google Scholar] [CrossRef] [Green Version]
- Cappa, D.F.; Behm, D.G. Neuromuscular characteristics of drop and hurdle jumps with different types of landings. J. Strength Cond. Res. 2013, 27, 3011–3020. [Google Scholar] [CrossRef] [PubMed] [Green Version]
- Maulder, P.; Cronin, J. Horizontal and vertical jump assessment: Reliability, symmetry, discriminative and predictive ability. Phys. Ther. Sport 2005, 6, 74–82. [Google Scholar] [CrossRef]
- Marques, M.C.; Liberal, S.M.; Costa, A.M.; van den Tillaar, R.; Sánchez-Medina, L.; Martins, J.C.; Marinho, D.A. Effects of two different training programs with same workload on throwing velocity by experienced water polo players. Precept. Mot Skills 2012, 115, 895–902. [Google Scholar] [CrossRef]
- van den Tillaar, R.; Marques, M.C. Effect of two different training programs with the same workload on soccer overhead throwing velocity. Int. J. Sports Physiol. Perf. 2009, 4, 474–484. [Google Scholar] [CrossRef] [Green Version]
- van den Tillaar, R.; Marques, M.C. A comparison of three training programs with the same workload on overhead throwing velocity with different weighted balls. J. Strength Cond. Res. 2011, 25, 2316–2321. [Google Scholar] [CrossRef]
- Cohen, J. Statistical Power for the Behavioural Sciences; Lawrence Erlbaum Associates: Mahwah, NJ, USA, 1988. [Google Scholar]
- Loturco, I.; Kobal, R.; Kitamura, K.; Cal Abad, C.C.; Faust, B.; Almeida, L.; Pereira, L.A. Mixed training methods: Effects of combining resisted sprints or plyometrics with optimum power loads on sprint and agility performance in professional soccer players. Front. Physiol. 2017, 8, 1034. [Google Scholar] [CrossRef] [PubMed] [Green Version]
- Yanci, J.; Los Arcos, A.; Camara, J.; Castillo, D.; García, A.; Castagna, C. Effects of horizontal plyometric training volume on soccer players’ performance. Res. Sports Med. 2016, 24, 308–319. [Google Scholar] [CrossRef]
- Spiteri, T.; Cochrane, J.L.; Hart, N.H.; Haff, G.G.; Nimphius, S. Effect of strength on plant foot kinetics and kinematics during a change of direction task. Eur. J. Sport Sci. 2013, 13, 646–652. [Google Scholar] [CrossRef] [PubMed]
- Havens, K.L.; Sigward, S.M. Whole body mechanics differ among running and cutting maneuvers in skilled athletes. Gait Posture 2015, 42, 240–245. [Google Scholar] [CrossRef]
- Dos’ Santos, T.; Thomas, C.; Comfort, P.; Jones, P.A. Role of the penultimate foot contact during change of direction: Implications on performance and risk of injury. Strength Cond. J. 2019, 41, 87–104. [Google Scholar] [CrossRef]
- Havens, K.L.; Sigward, S.M. Cutting mechanics: Relation to performance and anterior cruciate ligament injury risk. Med. Sci. Sports Exerc. 2015, 47, 818–824. [Google Scholar] [CrossRef] [PubMed]
- DeWeese, B.; Nimphius, S. Program design and technique for speed and agility training. In Essentials of Strength Training and Conditioning; Human Kinetics Publishers: Champaign, IL, USA, 2016; pp. 521–558. [Google Scholar]
- Young, W.; Farrow, D. A review of agility: Practical applications for strength and conditioning. Strength Cond. J. 2006, 28, 24–29. [Google Scholar] [CrossRef]
- Rhea, M.R.; Kenn, J.G.; Peterson, M.D.; Massey, D.; SimÃO, R.; Marin, P.J.; Favero, M.; Cardozo, D.; Krein, D. Joint-angle specific strength adaptations influence improvements in power in highly trained athletes. Hum. Mov. 2016, 17, 43–49. [Google Scholar] [CrossRef] [Green Version]
- Behm, D.; Sale, D. Velocity specificity of resistance training. Sports Med. 1993, 15, 374–388. [Google Scholar] [CrossRef]
- Cronin, J.; McNair, P.J.; Marshall, R.N. Developing explosive power: A comparison of technique and training. J. Sci. Med. Sport 2001, 4, 59–70. [Google Scholar] [CrossRef]
- Jiménez-Reyes, P.; Samozino, P.; Brughelli, M.; Morin, J.-B. Effectiveness of an individualized training based on force-velocity profiling during jumping. Front. Physiol. 2017, 7, 677. [Google Scholar] [CrossRef] [PubMed] [Green Version]
- Loturco, I.; Pereira, L.A.; Reis, V.P.; Bishop, C.; Zanetti, V.; Alcaraz, P.E.; Freitas, T.T.; Mcguigan, M.R. Power training in elite young soccer players: Effects of using loads above or below the optimum power zone. J. Sports Sci. 2019, 38, 1–7. [Google Scholar] [CrossRef]
- Suchomel, T.J.; Nimphius, S.; Stone, M.H. The importance of muscular strength in athletic performance. Sports Med. 2016, 46, 1419–1449. [Google Scholar] [CrossRef]
- Marshall, B.M.; Franklyn-Miller, A.D.; King, E.A.; Moran, K.A.; Strike, S.C.; Falvey, É.C. Biomechanical factors associated with time to complete a change of direction cutting maneuver. J. Strength Cond. Res. 2014, 28, 2845–2851. [Google Scholar] [CrossRef] [PubMed]
Figure 1.
Change of direction (COD) test setup with approaches of 4 m or 20 m with timing gates on 4 m and 20 m with CODs of 45°, 90°, 135° and 180° followed by a 4 m sprint.
Figure 1.
Change of direction (COD) test setup with approaches of 4 m or 20 m with timing gates on 4 m and 20 m with CODs of 45°, 90°, 135° and 180° followed by a 4 m sprint.

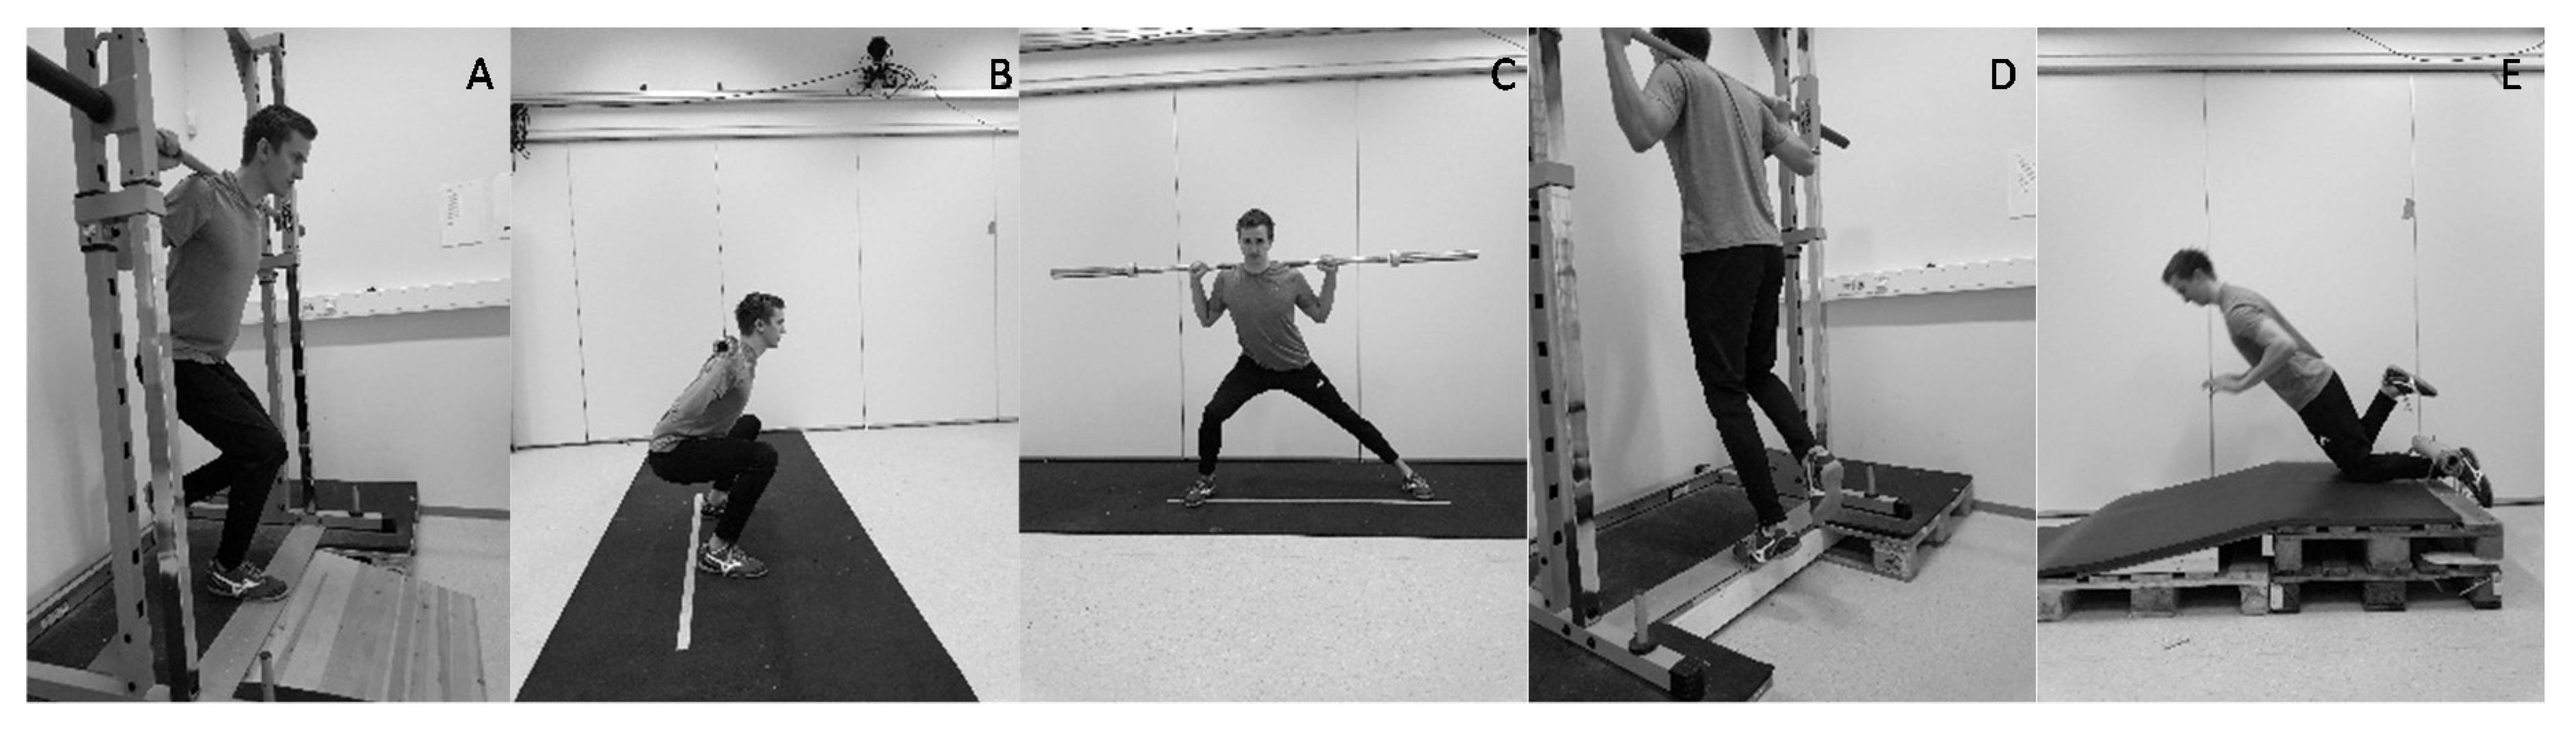
Figure 2.
Performance of strength exercises. (A) Unilateral quarter squat. (B) Bilateral parallel squat. (C) Lateral squat. (D) Unilateral plantarflexion. (E) Unilateral Nordic hamstring (displayed for the purpose of the strength training program but not used as a measure of performance).
Figure 2.
Performance of strength exercises. (A) Unilateral quarter squat. (B) Bilateral parallel squat. (C) Lateral squat. (D) Unilateral plantarflexion. (E) Unilateral Nordic hamstring (displayed for the purpose of the strength training program but not used as a measure of performance).

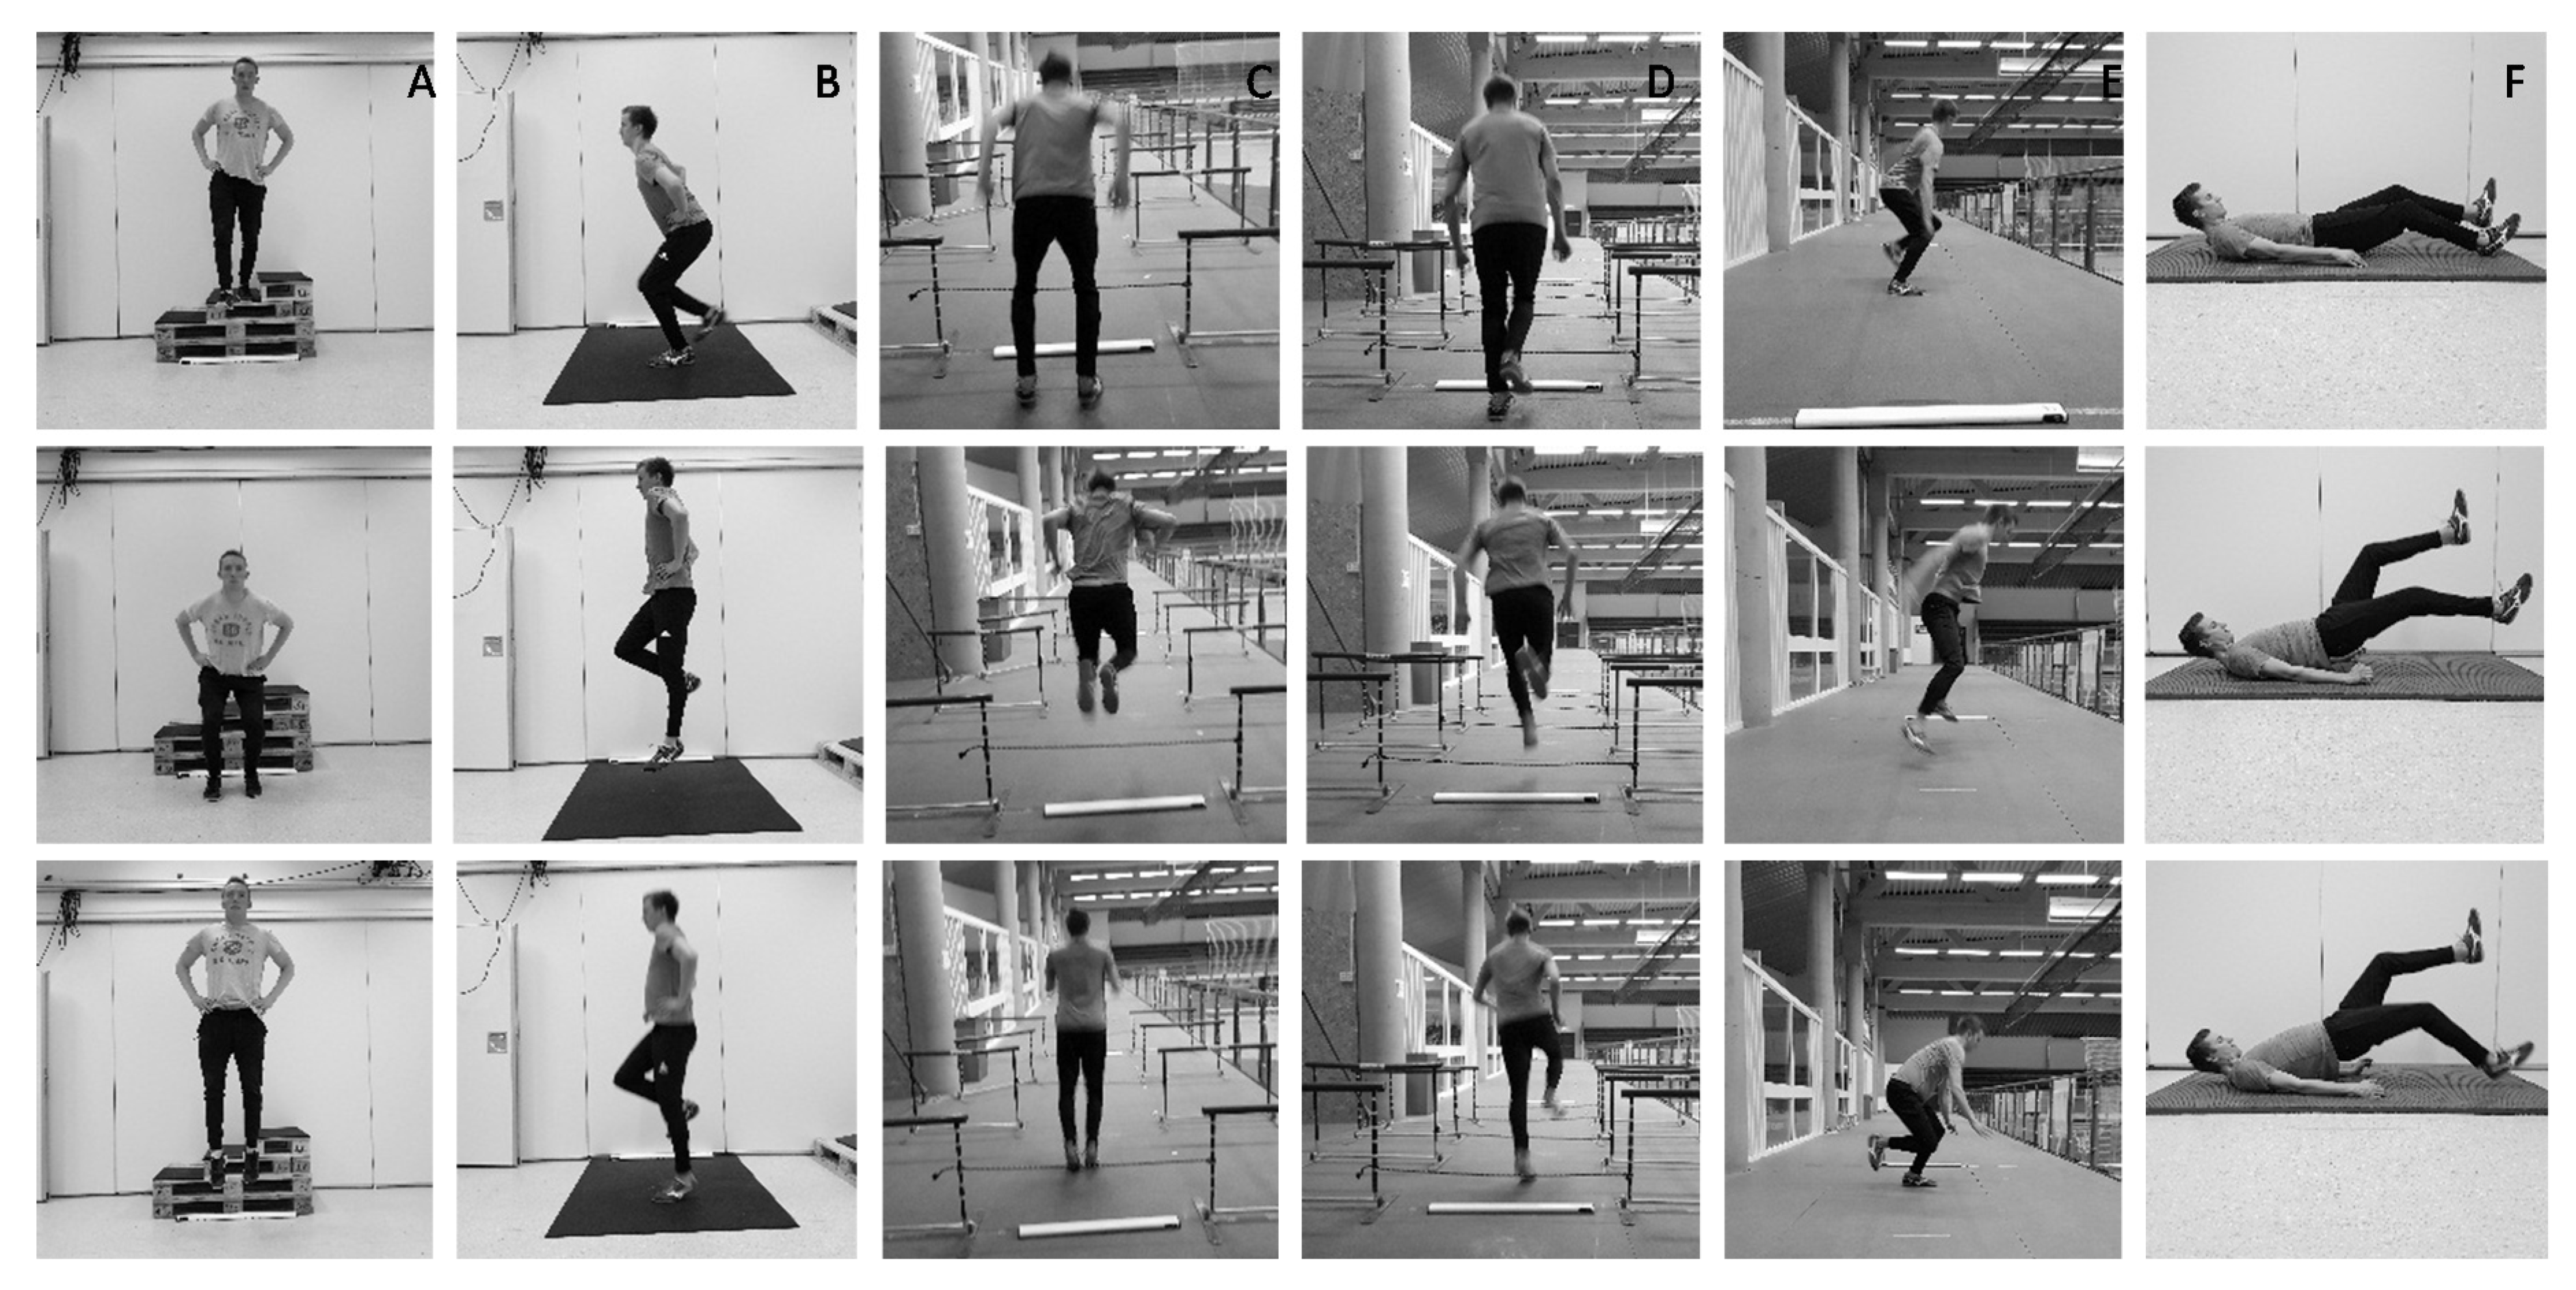
Figure 3.
Different plyometric exercises. (A) Drop jump. (B) Countermovement jump. (C) Bilateral hurdle jump. (D) Unilateral hurdle jump. (E) Skate jump. (F) Lying kick (displayed for the purpose of the plyometric training program but not used as a measure of performance).
Figure 3.
Different plyometric exercises. (A) Drop jump. (B) Countermovement jump. (C) Bilateral hurdle jump. (D) Unilateral hurdle jump. (E) Skate jump. (F) Lying kick (displayed for the purpose of the plyometric training program but not used as a measure of performance).

Figure 4.
Individual changes from pre- to post-test (s) for each group with 4 m and 20 m approaches and four different COD angles.
Figure 4.
Individual changes from pre- to post-test (s) for each group with 4 m and 20 m approaches and four different COD angles.

Figure 5.
Mean (SD) at pre- and post-test of selected peak joint angles and center of mass height during COD with different angles. * indicates a significant change from pre- to post for the variable.
Figure 5.
Mean (SD) at pre- and post-test of selected peak joint angles and center of mass height during COD with different angles. * indicates a significant change from pre- to post for the variable.


Table 1.
Matched exercises in strength- vs. plyometric group with corresponding muscles being targeted for physical overload and the sum of workload in these matched exercises per training group.
Table 1.
Matched exercises in strength- vs. plyometric group with corresponding muscles being targeted for physical overload and the sum of workload in these matched exercises per training group.
| Matched Exercises | Common Aspects | ||
|---|---|---|---|
| Strength Training Group | Plyometric Training Group | Targeted Muscles from the Matched Exercises | Workload per Session |
| Parallel squat, Unilateral squat & Calf Raise | Drop Jump, Unilateral CMJ & Hurdle jumps | Hip, knee and ankle extensor muscles | ≈ 4250 Ns |
| Lateral squat | Skate jump | Hip abductor muscles | ≈ 1650 Ns |
| Unilateral Nordic hamstring | Laying kick | Hamstring muscles | Peak EMG activity ≈ 75% of MVC (van den Tillaar et al., 2017) |
Ns = Newton second, EMG = Electromyography, MVC = Max voluntary contraction.
Table 2.
Periodized strength training program of six weeks.
| Week 1–3 (Session 1–6) | |||
| Day 1 | Intensity | Rest (s) | Series and Repetitions |
| Unilateral quarter squat | 85% of 1RM | 180> | 2 × 5 with each leg |
| Parallel squat | 85% of 1RM | 180> | 3 × 5 |
| Lateral squat | 75% of 1RM | 180> | 3 × 6 with each leg |
| Nordic hamstring | Max braking | 90> | 2 × 5 with each leg |
| Unilateral plantarflexion | 70% of 1RM | 90> | 3 × 8 with each leg |
| Day 2 | |||
| Unilateral quarter squat | 80% of 1RM | 180> | 2 × 6 with each leg |
| Parallel squat | 80% of 1RM | 180> | 3 × 8 |
| Lateral squat | 75% of 1RM | 180> | 3 × 8 with each leg |
| Nordic hamstring | Max braking | 90> | 2 × 5 with each leg |
| Unilateral plantarflexion | 70% of 1RM | 90> | 3 × 8 with each leg |
| Week 4–6 (Session 7–12) | |||
| Day 1 | Intensity | Rest (s) | Series and Repetitions |
| Lateral squat | 80% of 1RM | 240> | 4 × 4 with each leg |
| Unilateral quarter squat | 80% of 1RM | 240> | 2 × 6 with each leg |
| Parallel squat | 80% of 1RM | 240> | 3 × 6 |
| Nordic hamstring | Max braking | 90> | 2 × 8 with each leg |
| Unilateral plantarflexion | 75% of 1RM | 90> | 4 × 6 with each leg |
| Day 2 | |||
| Unilateral quarter squat | 88% of 1RM | 240> | 2 × 4 with each leg |
| Parallel squat | 85% of 1RM | 240> | 3 × 6 |
| Lateral squat | 70% of 1RM | 240> | 3 × 8 with each leg |
| Nordic hamstring | Max braking | 90> | 3 × 8 with each leg |
| Unilateral plantarflexion | 75% of 1RM | 90> | 4 × 6 with each leg |
1RM = 1 repetition maximum.
Table 3.
Periodized plyometric training program of six weeks.
| Week 1–3 (Session 1–6) | |||
| Day 1 | Main Focus | Rest (s) | Series and Repetitions |
| Unilateral CMJ | Height | 90 | 5 × 1 with each leg |
| Drop jump | Reactive strength | 60 | 10 × 1 |
| Unilateral hurdle jump | Contact time | 120 | 5 × 3 with each leg |
| Bilateral hurdle jump | Contact time | 90 | 4 × 3 |
| Skate jump | Reactive strength | 90 | 3 × 6 with each leg |
| Laying kick | Reactive strength | 90 | 2 × 5 with each leg |
| Day 2 | |||
| Drop Jump | Reactive strength | 20 | 4 × 3 |
| Unilateral CMJ | Height | 60 | 6 × 1 with each leg |
| Bilateral hurdle jump | Contact time | 60 | 6 × 3 |
| Unilateral hurdle jump | Contact time | 120 | 4 × 3 with each leg |
| Skate jump | Reactive strength | 90 | 3 × 6 with each leg |
| Laying kick | Reactive strength | 90 | 2 × 5 with each leg |
| Week 4–6 (Session 7–12) | |||
| Day 1 | Goal | Rest (s) | Series and Repetitions |
| Skate jump | Reactive strength | 90 | 4 × 4 with each leg |
| Bilateral hurdle jump | Contact time | 20 | 4 × 6 |
| Unilateral hurdle jump | Contact time | 120 | 4 × 3 with each leg |
| Drop jump | Reactive strength | 60 | 8 × 1 |
| Unilateral CMJ | Height | 90 | 6 × 6 with each leg |
| Laying kick | Reactive strength | 90 | 2 × 8 with each leg |
| Day 2 | |||
| Unilateral hurdle jump | Contact time | 90 | 4 × 3 with each leg |
| Bilateral hurdle jump | Contact time | 60 | 4 × 3 with each leg |
| Skate jump | Reactive strength | 120 | 3 × 8 with each leg |
| Unilateral CMJ | Height | 90 | 6 × 1 with each leg |
| Drop jump | Reactive strength | 60 | 8 × 1 |
| Laying kick | Reactive strength | 90 | 3 × 8 with each leg |
CMJ = Countermovement jump.
Table 4.
Mean (±SD) of the different strength and plyometric exercise performances at pre and posttest for each group and between group comparisons.
Table 4.
Mean (±SD) of the different strength and plyometric exercise performances at pre and posttest for each group and between group comparisons.
| Strength Training Group | Plyometric Training Group | ANOVA | |||||
|---|---|---|---|---|---|---|---|
| Exercise Variable | Pre | Post | Diff (%) | Pre | Post | Diff (%) | Effect: Group × Time (p) |
| Bilateral squat (kg) | 113.6 ± 22.5 | 127.8 ± 19.5 | 12.5 * | 130.0 ± 21.6 | 132.5 ± 13.0 | 1.9 | 0.021 |
| Unilateral squat (kg) | 88.3 ± 11.8 | 104.7 ± 11.3 | 18.6 * | 98.7 ± 10.7 | 103.4 ± 12.0 | 4.7 * | 0.023 * |
| Lateral squat (kg) | 90.6 ± 15.4 | 106.3 ± 16.0 | 17.2 * | 106.1 ± 15.4 | 104.3 ± 12.4 | −1.7 | 0.001 * |
| Bilateral squat (kg/BM·kg) | 1.47 ± 0.25 | 1.66 ± 0.22 | 12.7 * | 1.57 ± 0.28 | 1.60 ± 0.18 | 2.1 | 0.028 * |
| Unilateral squat (kg/BM·kg) | 1.15 ± 0.11 | 1.36 ± 0.08 | 18.2 * | 1.19 ± 0.16 | 1.25 ± 0.15 | 4.8 * | 0.019 * |
| Lateral squat (kg/BM·kg) | 1.16 ± 0.16 | 1.36 ± 0.19 | 17.5 * | 1.28 ± 0.21 | 1.26 ± 0.17 | −1.6 | 0.001 * |
| Drop jump (RSI) | 1.35 ± 0.27 | 1.31 ± 0.29 | −3.2 | 1.27 ± 0.31 | 1.48 ± 0.29 | 16.8 * | 0.015 * |
| Unilateral CMJ (m) | 0.173 ± 0.039 | 0.185 ± 0.041 | 6.8 | 0.165 ± 0.029 | 0.196 ± 0.024 | 19.0 * | 0.045 * |
| Bilateral hurdle jump (s) | 0.173 ± 0.018 | 0.152 ± 0.022 | −12.1 * | 0.168 ± 0.023 | 0.152 ± 0.012 | −9.5 * | 0.435 |
| Unilateral hurdle jump (s) | 0.193 ± 0.092 | 0.188 ± 0.019 | −2.7 | 0.197 ± 0.021 | 0.176 ± 0.017 | −10.6 * | 0.044 * |
| Skate-jump (m) | 2.02 ± 0.16 | 2.04 ± 0.16 | 1.4 | 1.92 ± 0.19 | 2.02 ± 0.20 | 5.4 * | 0.022 * |
* indicates a significant effect on a p < 0.05 level.
Table 5.
Change of direction time (4 m entry and exit time) at the different degrees with the 4 and 20 m approach at pre- and posttest for all and specified for each training groups.
Table 5.
Change of direction time (4 m entry and exit time) at the different degrees with the 4 and 20 m approach at pre- and posttest for all and specified for each training groups.
| Test | 4 m 45° | 4 m 90° | 4 m 135° | 4 m 180° | 20 m 45° | 20 m 90° | 20 m 135° | 20 m 180° |
|---|---|---|---|---|---|---|---|---|
| All | ||||||||
| Pretest | 1.73 ± 0.15 | 2.06 ± 0.16 | 2.37 ± 0.17 | 2.48 ± 0.16 | 1.38 ± 0.11 | 1.84 ± 0.12 | 2.15 ± 0.14 | 2.30 ± 0.12 |
| Posttest | 1.69 ± 0.13 * | 2.01 ± 0.15 | 2.30 ± 0.14 | 2.42 ± 0.13 * | 1.36 ± 0.12 | 1.82 ± 0.09 | 2.11 ± 0.12 | 2.22 ± 0.11 * |
| Diff (%) | 2.31% | 2.43% | 2.95% | 2.42% | 1.45% | 1.09% | 1.86% | 3.48% |
| Strength training group | ||||||||
| Pretest | 1.71 ± 0.17 | 2.03 ± 0.19 | 2.37 ± 0.20 | 2.44 ± 0.18 | 1.38 ± 0.10 | 1.84 ± 0.13 | 2.17 ± 0.08 | 2.32 ± 0.07 |
| Posttest | 1.67 ± 0.15 | 2.04 ± 0.19 | 2.35 ± 0.15 | 2.41 ± 0.15 | 1.34 ± 0.13 | 1.83 ± 0.11 | 2.09 ± 0.9 | 2.25 ± 0.10 |
| Diff (%) | 2.34% | −0.49% | 0.84% | 1.23% | 2.90% | 0.54% | 3.69% | 3.02% |
| Plyometric training group | ||||||||
| Pretest | 1.74 ± 0.14 | 2.08 ± 0.13 | 2.37 ± 0.15 | 2.51 ± 0.15 | 1.38 ± 0.12 | 1.83 ± 0.11 | 2.13 ± 0.18 | 2.29 ± 0.15 |
| Posttest | 1.70 ± 0.12 | 1.99 ± 0.12 * | 2.26 ± 0.13 * | 2.43 ± 0.11 * | 1.38 ± 0.11 | 1.82 ± 0.08 | 2.12 ± 0.14 | 2.20 ± 0.12 * |
| Diff (%) | 2.30% | 4.33% | 4.64% | 3.19% | 0.00% | 0.55% | 0.47% | 3.93% |
* indicates a significant effect from pre- to post test for this COD time on a p < 0.05 level.
Table 6.
Mean (±SD) step and joint kinematics at pre- and post-test for both groups combined.
| 45° COD | 90° COD | 135° COD | 180° COD | ANOVA | ||||||
|---|---|---|---|---|---|---|---|---|---|---|
| Variables | N | Pre | Post | Pre | Post | Pre | Post | Pre | Post | Effect: Time (p) |
| 4 m | ||||||||||
| COM disp. (cm) | 17 | 17.7 ± 2.8 | 18.0 ± 4.3 | 25.4 ± 5.9 | 28.3 ± 5.3 | 31.2 ± 5.8 | 32.0 ± 6.9 | 34.5 ± 7.0 | 35.5 ± 9.5 | 0.200 |
| Contact time (ms) | 16 | 150 ± 23 | 160 ± 22 | 182 ± 37 | 204 ± 47 | 221 ± 42 | 238 ± 77 | 296 ± 82 | 304 ± 81 | 0.122 |
| Hip flexion (°) | 15 | 11.9 ± 15.8 | 12.8 ± 18.1 | 14.0 ± 10.8 | 18.3 ± 11.2 | 16.0 ± 9.2 | 24.6 ± 8.5 | 28.6 ± 10.2 | 30.4 ± 14.8 | 0.006 * |
| Hip abduction (°) | 14 | 7.4 ± 5.2 | 9.0 ± 4.9 | 10.5 ± 6.0 | 10.1 ± 6.2 | 7.9 ± 7.5 | 10.3 ± 6.5 | 13.5 ± 7.9 | 10.3 ± 10.2 | 0.834 |
| Knee flexion (°) | 15 | 48.0 ± 6.0 | 44.5 ± 7.9 | 60.8 ± 10.4 | 58.2 ± 14.6 | 63.2 ± 8.7 | 60.1 ± 11.3 | 60.7 ± 12.7 | 54.7 ± 16.3 | 0.032 * |
| Lean angle (°) | 11 | 28.1 ± 3.9 | 28.8 ± 4.9 | 38.0 ± 5.2 | 39.4 ± 2.3 | 43.1 ± 3.0 | 44.2 ± 4.3 | 47.1 ± 4.5 | 48.5 ± 3.7 | 0.279 |
| 20 m | ||||||||||
| COM disp. (cm) | 16 | 19.5 ± 3.5 | 20.5 ± 3.6 | 28.8 ± 4.6 | 29.8 ± 4.5 | 33.3 ± 6.1 | 34.6 ± 5.9 | 36.5 ± 5.9 | 37.3 ± 5.7 | 0.035 * |
| Contact time (ms) | 15 | 150 ± 23 | 145 ± 21 | 186 ± 35 | 198 ± 52 | 216 ± 71 | 241 ± 76 | 335 ± 114 | 318 ± 90 | 0.735 |
| Hip flexion (°) | 15 | 6.5 ± 13.2 | 15.9 ± 16.8 | 10.4 ± 13.2 | 17.5 ± 13.7 | 18.2 ± 12.4 | 23.3 ± 10.7 | 32.1 ± 15.2 | 34.0 ± 16.7 | 0.030 * |
| Hip abduction (°) | 14 | 9.8 ± 7.1 | 9.7 ± 4.9 | 10.0 ± 5.8 | 9.7 ± 6.0 | 11.7 ± 6.4 | 10.4 ± 8.0 | 16.7 ± 9.7 | 15.5 ± 7.0 | 0.562 |
| Knee flexion (°) | 15 | 49.0 ± 12.6 | 45.6 ± 12.2 | 59.6 ± 16.2 | 56.9 ± 15.7 | 61.4 ± 11.8 | 59.8 ± 14.8 | 60.2 ± 10.4 | 55.9 ± 17.0 | 0.185 |
| Lean angle (°) | 13 | 30.4 ± 5.6 | 32.7 ± 5.8 | 39.0 ± 4.7 | 40.1 ± 3.8 | 42.9 ± 3.7 | 44.4 ± 6.2 | 46.3 ± 6.6 | 48.2 ± 5.0 | 0.103 |
* indicates a significant effect from pre- to post test on a p < 0.05 level. COM disp. = center of mass displacement. Reduced N is apparent due to listwise exclusion of cases in ANOVA and the following post-hoc analysis, as there are some missing values in matching cases from pre- to post-test. The grey-shaded (highlighted) windows are further illustrated in Figure 5 to discriminate the specific significant pairwise comparisons. Note that sample size varies due to missing values.
Publisher’s Note: MDPI stays neutral with regard to jurisdictional claims in published maps and institutional affiliations. |
© 2020 by the authors. Licensee MDPI, Basel, Switzerland. This article is an open access article distributed under the terms and conditions of the Creative Commons Attribution (CC BY) license (http://creativecommons.org/licenses/by/4.0/).
Share and Cite
MDPI and ACS Style
Rædergård, H.G.; Falch, H.N.; Tillaar, R.v.d. Effects of Strength vs. Plyometric Training on Change of Direction Performance in Experienced Soccer Players. Sports 2020, 8, 144. https://doi.org/10.3390/sports8110144
AMA Style
Rædergård HG, Falch HN, Tillaar Rvd. Effects of Strength vs. Plyometric Training on Change of Direction Performance in Experienced Soccer Players. Sports. 2020; 8(11):144. https://doi.org/10.3390/sports8110144
Chicago/Turabian StyleRædergård, Håvard Guldteig, Hallvard Nygaard Falch, and Roland van den Tillaar. 2020. "Effects of Strength vs. Plyometric Training on Change of Direction Performance in Experienced Soccer Players" Sports 8, no. 11: 144. https://doi.org/10.3390/sports8110144
Note that from the first issue of 2016, this journal uses article numbers instead of page numbers. See further details here.