Iron Redox Reactions Can Drive Microtopographic Variation in Upland Soil Carbon Dioxide and Nitrous Oxide Emissions


1
Program in Ecology, Evolution and Conservation Biology, University of Illinois, Urbana, IL 61801, USA
2
Center for Conservation Biology, University of California, Riverside, CA 92521, USA
3
Department of Plant Biology, University of Illinois, Urbana, IL 61801, USA
4
Department of Geology, University of Illinois, Urbana, IL 61801, USA
*
Author to whom correspondence should be addressed.
Soil Syst. 2019, 3(3), 60; https://doi.org/10.3390/soilsystems3030060
Submission received: 18 June 2019
/
Revised: 19 August 2019
/
Accepted: 26 August 2019
/
Published: 29 August 2019
(This article belongs to the Special Issue Effects of Global Change and Human Activities on Soil Carbon and Nutrient Dynamics)
Abstract
:Topographic depressions in upland soils experience anaerobic conditions conducive for iron (Fe) reduction following heavy rainfall. These depressional areas can also accumulate reactive Fe compounds, carbon (C), and nitrate, creating potential hot spots of Fe-mediated carbon dioxide (CO2) and nitrous oxide (N2O) production. While there are multiple mechanisms by which Fe redox reactions can facilitate CO2 and N2O production, it is unclear what their cumulative effect is on CO2 and N2O emissions in depressional soils under dynamic redox. We hypothesized that Fe reduction and oxidation facilitate greater CO2 and N2O emissions in depressional compared to upslope soils in response to flooding. To test this, we amended upslope and depressional soils with Fe(II), Fe(III), or labile C and measured CO2 and N2O emissions in response to flooding. We found that depressional soils have greater Fe reduction potential, which can contribute to soil CO2 emissions during flooded conditions when C is not limiting. Additionally, Fe(II) addition stimulated N2O production, suggesting that chemodenitrification may be an important pathway of N2O production in depressions that accumulate Fe(II). As rainfall intensification results in more frequent flooding of depressional upland soils, Fe-mediated CO2 and N2O production may become increasingly important pathways of soil greenhouse gas emissions.
1. Introduction
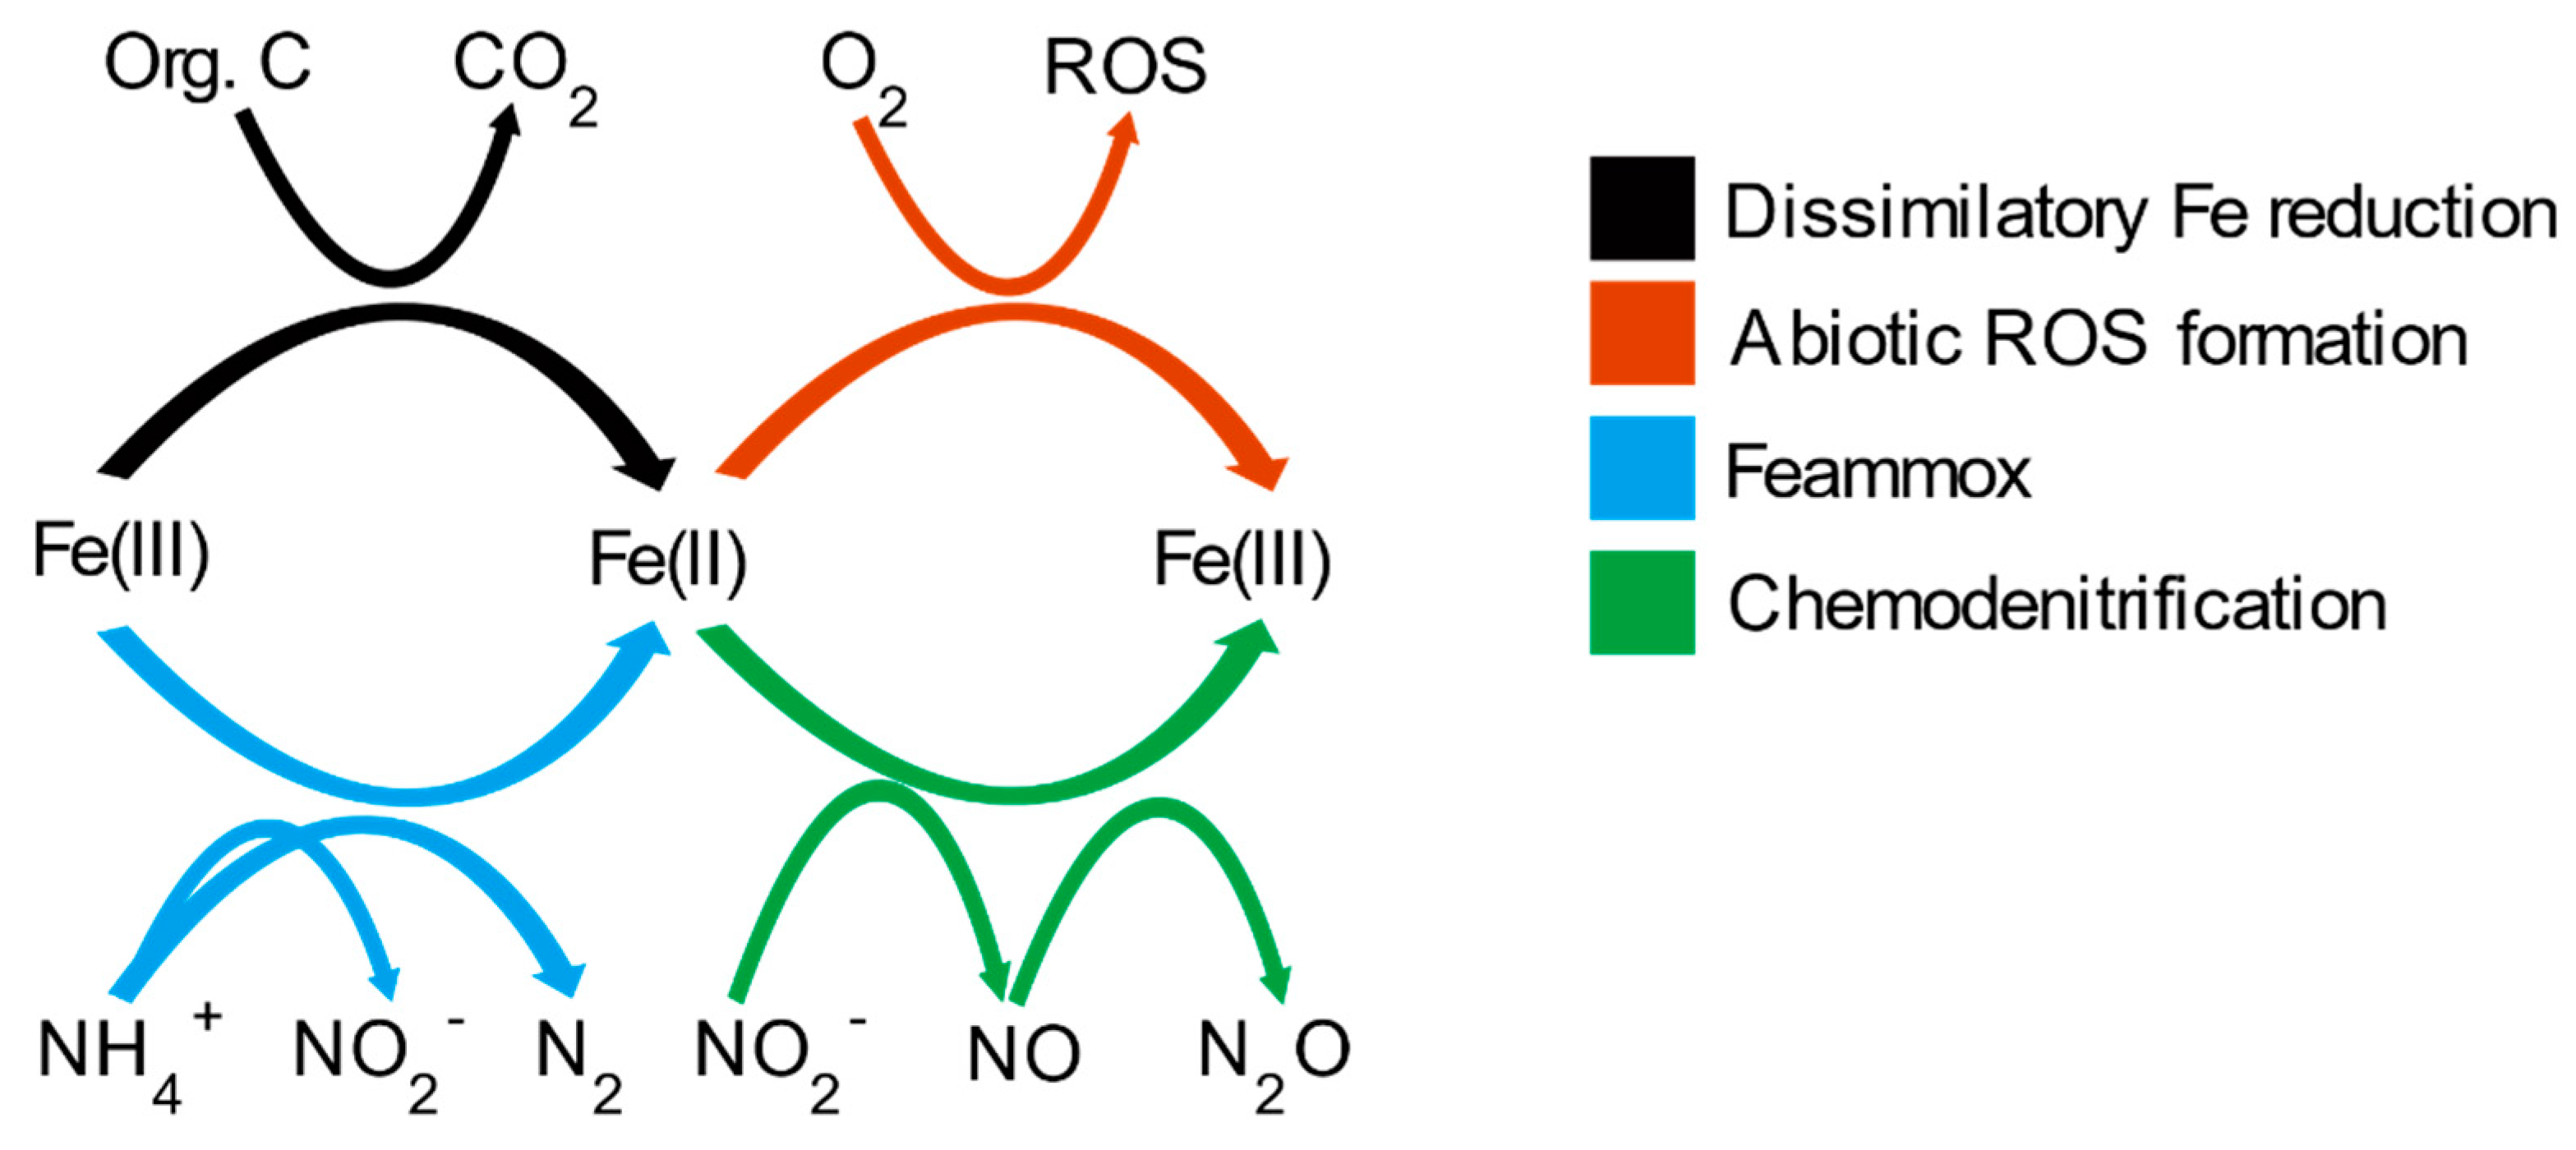
Rainfall intensification as a result of global climate change has resulted in the increased ponding of ecosystems that exhibit topography [1,2,3]. Even the ponding of shallow topographic depressions in upland soils can deplete soil O2 by inhibiting the diffusive resupply of O2 consumed by microbial respiration [4,5]. These anaerobic periods allow for the occurrence of anaerobic biogeochemical reactions, such as iron (Fe) reduction and oxidation, that are typically overlooked in non-flooded environments. Iron redox reactions can be coupled to C and N transformations in upland soils via multiple mechanisms (Figure 1) [6,7], contributing to emissions of carbon dioxide (CO2) and nitrous oxide (N2O), two potent greenhouse gases. These reactions could become more prevalent as rainfall intensification increases the ponding extent and duration in upland soils. However, it is unknown if Fe redox cycling could be more important in depressional areas that are more prone to ponding. While Fe redox reactions are known to occur in upland soils, it is unclear how they contribute to CO2 and N2O emissions in upslope and depressional soils in response to ponding following heavy rainfall.
The reduction and oxidation of Fe minerals has the potential to drive C mineralization to a greater degree in depressional compared to upslope soils via multiple mechanisms. Dissimilatory Fe reduction is an anaerobic respiration pathway in which microbes couple Fe reduction with C oxidation [6,8,9], potentially contributing up to 40% of soil C mineralization in upland soils [10]. Iron reduction potential could be greater in depressional soils compared to upslope soils due to legacy effects from more frequent ponding in depressions. For example, Fe-reducing bacterial taxa such as Geobacter and Anaeromyxobacter can be more abundant in depressions compared to nearby upslope soils [11], suggesting higher genetic potential for Fe reduction in depressional soils. Fluctuations in soil O2 concentrations can also facilitate the buildup of poorly-crystalline Fe compounds that are more susceptible to microbial reduction [12,13,14], leading to higher concentrations of poorly crystalline Fe(III) minerals in depressional soils that more frequently experience fluctuations in soil O2 [11,15]. If Fe reduction rates are Fe-limited, then this could directly stimulate Fe reduction in depressional soils compared to upslope soils. If Fe reduction rates are C-limited, then this could indirectly stimulate Fe reduction in depressional soils that can receive labile C inputs from a variety of sources. For example, C protected from mineralization by complexation with Fe-oxyhydroxides under aerobic conditions [16,17,18] can be released as the Fe is reduced under anaerobic conditions [18,19,20]. Topographic depressions can also accumulate C as a result of erosion or downslope transport of dissolved organic carbon (DOC) in hydrological flow [21,22,23]. When upland soils drain and return to aerobic conditions, abiotic Fe(II) oxidation can create reactive oxygen species (ROS) that breakdown recalcitrant soil organic matter (SOM) via Fenton reactions [24]. More frequent fluctuations in soil O2 concentrations in depressional soils compared to upslope soils can lead to more episodes of Fe(II) oxidation [15], potentially fueling more abiotic soil organic matter (SOM) mineralization in depressional soils. Some or all of these mechanisms could contribute to greater potential for Fe-coupled C mineralization in depressional soils compared to upslope soils, but the contribution of Fe redox cycling to microtopographic variation in upland soil CO2 and N2O emissions has not previously been explored.
The reduction and oxidation of Fe minerals may also contribute to N2O production in upland soils via multiple mechanisms. Under anaerobic conditions, the microbially mediated process of Feammox can couple Fe(III) reduction to ammonium (NH4+) oxidation [25,26]. The most energetically favorable end product of Feammox is dinitrogen gas (N2) [25], but the reaction can also produce NO3− or NO2− that can subsequently be reduced to N2O via biotic denitrification or chemodenitrification. Chemodenitrification can abiotically produce N2O via oxidation of Fe(II) coupled to reduction of NO3−, nitrite (NO2−), or nitric oxide (NO) [7,27,28]. Some microorganisms can also couple Fe(II) oxidation with NO3− or NO2− reduction for energy yield or NO2− detoxification, but these reactions occur more slowly compared to chemodenitrification [28,29,30,31]. While the importance of chemodenitrification and Feammox in driving soil N cycling from upland soils is increasingly recognized [7,25,26,32], these reactions are not often considered as major sources of N2O production from upland soils. However, they may be important drivers of soil N2O emissions in upland ecosystems that experience soil redox fluctuations, and especially in depressional soils that experience these fluctuations more frequently than upslope soils.
In this study, we tested the hypothesis that oxidation and reduction of reactive Fe compounds facilitate greater CO2 and N2O emissions in depressional compared to upslope soils in response to flooding and drainage. In a laboratory experiment, we measured CO2 and N2O emissions as well as Fe(II) accumulation in upslope and depressional soils in response to a flooding and drainage cycle with and without amendment of substrates (either Fe(III), Fe(II), or labile C). This was done to gain insight into which Fe reduction and oxidation processes contribute to soil trace gas emissions. We predicted that if dissimilatory Fe reduction contributes to CO2 emissions, or if Feammox indirectly contributes to soil N2O emissions, then added Fe(III) minerals should stimulate CO2 and N2O production, respectively. We also predicted that if Fe(II) oxidation contributes to SOM decomposition via the creation of ROS, or N2O production via chemodenitrification, then addition of Fe(II) should stimulate CO2 and N2O production, respectively. Finally, we predicted that if C availability as an electron donor rather than electron acceptor availability limits anaerobic respiration, then C addition should stimulate CO2 emissions in flooded soils. By assessing C amendment effects on Fe reduction rates, we can determine the potential importance of Fe reduction as an anaerobic respiratory pathway generating CO2. These predictions assume that the treatment amendments will only stimulate the processes of interest if the processes are limited by the added substrates rather than other substrates or factors such as microbial community composition.
2. Methods
2.1. Study Site
This study was conducted on soils collected from three agricultural fields managed in conventional maize-soybean rotations across Champaign County, Illinois (40.2139° N, 88.2461° W): South Farms, Energy Farm, and Cardinal Road. When the soils were collected during the summer of 2018, the Energy Farm and Cardinal Road fields were planted in maize while the South Farms field was planted in soybean. Depressional soils were identified within each of these fields based on visual observations of ponding following rain events of at least 30 mm in a 24-h period. Upslope areas were chosen as relatively elevated areas within 100 m of the depressional area in the same field. All depressional soils were classified as silty clay loams from the Drummer soil series. Upslope soils from South Farms and Cardinal Road fields were silt loams from the Flanagan soil series, and the upslope soils from the Energy Farm field were fine-silty soils from the Dana series.
The mean annual air temperature in Champaign County is 10 °C, and the mean annual precipitation is 1008 mm [33]. For the early season experiment, soils were collected in May after planting of crops and fertilization of only the maize fields. For the late season experiment, soils were collected in July when the crops were at peak growth. The mean air temperature in May was 16.7 °C and the mean monthly precipitation was 105 mm. The mean temperature in July was 23.1 °C and the mean monthly precipitation was 114 mm [33]. Soils were collected when no rain had fallen in at least 4 days to minimize effects from antecedent soil moisture differences between topographic positions.
2.2. Experimental Design
A laboratory experiment was designed to elucidate the role of Fe reduction and oxidation on CO2 and N2O emissions from depressional and upslope soils collected from three agricultural fields in Champaign County, Illinois. The experiment was conducted twice, once in May and once in July, to account for potential changes in soil properties and microbial community composition over the course of the growing season. To determine the role of Fe reduction and oxidation on soil GHG emissions, CO2 and N2O emissions were measured from soil cores in response to flooding and drainage over the course of a nine-day lab incubation, and Fe(II) concentrations were measured on the final day of the flooding period in the late season experiment. A nine-day incubation period was chosen to replicate a four-day flooding period followed by four days of drainage, which is typical in depressional upland soils in response to heavy rainfall. To gain insight into which specific pathways were responsible for CO2 or N2O production from these soils, the soil cores were treated with either Fe(III), Fe(II), or C. If any of the Fe redox reactions detailed in the introduction (Figure 1) were limited by Fe(III), Fe(II), or C, then these treatments should stimulate CO2 or N2O production compared to unamended control cores.
2.3. Soil Collection and Initial Characterization
Approximately one week prior to initiating experimental treatments, seven 0–10 cm deep surface soil cores were collected from each topographic position within each of the three sites. The cores were collected within 5 m from the center of each plot using a 10 cm diameter auger. The cores were stored in gallon Ziploc bags at ambient temperature and immediately transported back to lab at the University of Illinois at Urbana-Champaign where cores from each topographic position within each site were homogenized and passed through an 8 mm sieve. Soils were homogenized to limit spatial variability and allow for the detection of treatment effects in the lab. The homogenized soil was analyzed for initial gravimetric soil moisture by drying five 10 g subsamples at 105 °C for two days and measuring water loss. Initial HCl extractible Fe(II) and Fe(III) concentrations were measured by adding 1.0 g of dry soil equivalent to 30 mL of 0.5 N HCl and shaking vigorously on an orbital shaker for 24 h. These samples were then centrifuged at 10,000 rcf for 10 min, and the supernatant was immediately analyzed for Fe(II) and Fe(III) concentrations using a modified ferrozine method [34]. Soil pH was measured in a 1:1 deionized water to dry soil mass mixture. These measurements were performed on five replicate subsamples from each of the homogenized soil samples originating from the six sampling locations. Three 10 g subsamples of air-dried and ground soil from each sampling location for the late season experiment were also analyzed for total organic C (TOC) concentrations using a Vario Micro Cube elemental analyzer (Elementar, Hanau, Germany).
2.4. Experimental Methods
The experiment was conducted on re-packed soil cores that could be flooded and drained in the laboratory. For each core, a 150 g subsample of homogenized soil from a given sampling location was packed to approximate field bulk density (~1.0 g−1 cm−3) in a plastic cylinder that was 11 cm tall and 5 cm in diameter. Each plastic cylinder had 0.5 mm mesh window screening glued to the bottom of the cylinder with a watertight plastic cap fitted over top of the window screening. This allowed the cores to retain water when capped at the bottom and to drain water without losing soil when the cap was removed. Five replicate cores were packed with soil from each sampling location for each treatment, for a total of 120 cores. Each core was placed into a 1 L canning jar filled with 150 g of silica sand to allow water to drain away from the bottom of the soil cores. The silica sand was heated at 550 °C for four hours in a muffle furnace to burn off any C compounds and sterilize the sand.
Net CO2 and N2O fluxes were measured from each of the jars five times over the course of the nine day incubation. A pre-treatment measurement was made on field moist soils within one week of collection. All of the cores were then flooded with 80 mL of deionized (DI) water the day after the pre-treatment trace gas flux measurement. For the treatment soils receiving amendments, Fe(III), Fe(II), or acetate was dissolved in the added DI. Water was added by injecting 20 mL of water four times vertically throughout the core using a 10 cm long spinal tap needle. This process left approximately 0.5 cm of standing water above the soil surface and saturated the soil core. Dissolved O2 was not purged from the DI prior to flooding the cores, and the jar was left open to room air in between trace gas flux measurements. Trace gas fluxes from all cores were measured 24 h after flooding, and again 72 h after flooding. The watertight plastic caps were removed from all of the cores the day after the 72-h flooded measurement to allow the soil cores to drain. Standing water was no longer present on any cores within 12 h of removing the cap. Trace gas fluxes were measured from each core 24 h after removing the cap and again 72 h after removing the cap.
The Fe(III), Fe(II), and C treatment solutions for the experiment were prepared based on previous data from the study sites. The Fe(III) amendment corresponded to observed differences in Fe(III) concentrations between depressional and upslope soils at these sites [11,15]. For the Fe(III) treatment, hydrous ferrous oxide (HFO) synthesized from ferric chloride hexahydrate [35] was added to increase Fe(III) concentrations by 113 ug Fe g−1 dry soil to each soil core for the first experiment and by 165 ug Fe g−1 dry soil for the second experiment. Stoichiometric calculations of 4 moles Fe reduced for every mole C oxidized [10] suggest that this was of sufficient magnitude to sustain 0.08–0.12 ug C-CO2 g−1 h−1 of CO2 production coupled to dissimilatory Fe reduction over the course of the 72 h flooding period. For the Fe(II) treatment, Fe(II) was added to correspond to differences in Fe(II) concentrations previously observed between depressional versus upslope soils in these sites under ponded conditions [11,15]. To do this, approximately 125 ug Fe-FeCl2 g−1 dry soil was added to each soil core. The Fe(II) solution was made by dissolving FeCl2 into DI water under an anoxic headspace. It is difficult to calculate an expected effect size for the Fe(II) treatment since the abiotic breakdown of SOM by ROS does not have a set stoichiometric ratio. This Fe(II) addition amount could potentially fuel the production of 139 ng N-N2O g−1 h−1 via chemodenitrification over the course of the 72 h flooding period assuming six moles of Fe oxidized for every one mole N2O produced [7]. For the C treatment, the C amendment rate was designed to stimulate up to 0.37 ug C-CO2 g−1 h−1 CO2 efflux over the course of the nine-day experiment, assuming 30% carbon use efficiency. This response size is similar to previously observed differences in CO2 efflux between upslope and depressional soils under flooded conditions [15]. By adding 80 mL of 7.2 mM sodium acetate to each soil core in both experiments, the C concentration of each core was increased by approximately 0.12 mg C g−1 dry soil.
To measure net CO2 and N2O fluxes from the soil cores, each canning jar was sealed with a metal lid fitted with a rubber septum and the change in CO2 and N2O concentrations was measured over four hours. Immediately after sealing each jar, a 15 mL gas sample was collected by inserting a needle fitted to a 20 mL syringe and a two-way stopcock through the rubber septum, mixing the jar headspace by slowly pumping the syringe three times, and then removing a 15 mL gas sample. The gas sample was stored in a 10 mL pre-evacuated vial sealed with a thick rubber septum (Geo-Microbial Technologies, Inc., Ochelata, OK, USA) and an aluminum crimp (Wheaton Industries Inc., Millville, NJ, USA). Another gas sample was collected from each jar four hours after the initial gas sample. A four-hour incubation was chosen to ensure accumulation of CO2 and N2O in the jar headspace so that a change in trace gas concentrations could be detected. It is possible that the accumulation of N2O in the jar headspace could stimulate soil N2O consumption and result in an underestimation of net N2O emissions [36]. All gas samples were analyzed on a Shimadzu GC-2014 gas chromatograph fitted with an electron capture device and a thermal conductivity detector for N2O and CO2 analysis, respectively (Shimadzu Scientific Instruments, Columbia, MD, USA). Net CO2 and N2O fluxes were calculated as the change in CO2 and N2O concentrations over the four-hour incubation. A minimum detectable flux was calculated based on the standard deviation of three standard gas samples (1001 ppm CO2 and 1.08 ppm N2O) run on the GC. The calculated detection limit for N2O was 0.0025 ppm h−1 and for CO2 was 2.41 ppm h−1. Net fluxes under this limit were considered not detectable and estimated as zero. Since the soil cores were homogenized and water was evenly distributed throughout the cores, fluxes were expressed per soil mass. This assumes that gas production was even throughout the core and that diffusion was minimally limited.
Concentrations of Fe(II) were measured from each soil core on Day 5 of the experiment using the modified ferrozine method described above [34]. To calculate net rates of Fe reduction, the average initial Fe(II) concentration of soils collected from each topographic position within each site were subtracted from the Fe(II) concentrations measured from corresponding soil cores on Day 5 of the late season experiment, after cores had been flooded for 72 h. This number was divided by the total amount of time that each core had been flooded to calculate the net rate of Fe reduction within each core.
2.5. Statistical Analyses
All statistical analyses were performed using R version 3.5.2 [37]. Two way analysis of variance (ANOVA) was used to assess differences in initial SOC, pH, Fe(III), and Fe(II) concentrations using the ANOVA function in the car package [38]. Separate ANOVAs were run for each soil property with site and topographic position as independent variables. Type III sums of squares were used to test for the presence of an interaction, and type II sums of squares were used if no interaction was present. This same analysis was done to compare net Fe reduction rates in response to all treatments on day 5 of the experiment. A separate ANOVA was run for each site with treatment and topographic position included as independent variables. Tukey-corrected multiple comparisons were used to assess differences in Fe rates between all treatments and topographic positions within each site using the lsmeans package [39]. Statistical significance was assessed as p < 0.05.
Mixed effects models were used to determine the effect of topographic position and day of experiment on soil CO2 and N2O emissions from unamended control soil cores. The control cores were analyzed separately to isolate the effect of topographic position on soil CO2 and N2O emissions without amendments. Separate models were run on CO2 and N2O emissions from soils collected from each site. In each model, topographic position and day of experiment were included as fixed independent variables, while soil core ID was included as a random variable to account for repeated measures of each soil core over time. This was done using the lme function from the nlme package in R [40]. N2O emissions were log transformed to meet assumptions of normality; a constant of 5 was added prior to log transformation to avoid taking the log of values below 1. The anova.lme function was then used to determine which variables explained the most variance in either CO2 or N2O emissions.
To gain insight into the processes driving the responses to soil flooding and drainage, we assessed the difference in CO2 or N2O emissions between treatment cores that received amendments and corresponding unamended soil cores that served as controls. This was done by subtracting the mean control CO2 or N2O efflux (n = 5) from the mean CO2 or N2O efflux from any given treatment. Standard errors were calculated using Gaussian error propagation to assess the variability of this treatment effect. Linear mixed effects models were also used to assess treatment and day of experiment effects on soil CO2 and N2O efflux over the course of the incubation, as described above. Soil cores receiving each of the three treatments as well as the control were included in these models to assess treatment effects on soil CO2 and N2O emissions compared to control soils over the course of the incubation. Prior to running these models, CO2 and N2O emissions were log transformed to meet assumptions of normality. Separate models were run for soils collected from each topographic position (upslope versus depressional) within each site. All linear mixed effects models were run using the lme function from the nlme package in R [40]. To assess the significance of the treatment and day of experiment effects, ANOVAs were run on each model using the anova.lme function in the nlme package [40].
3. Results
3.1. Background Soil Properties
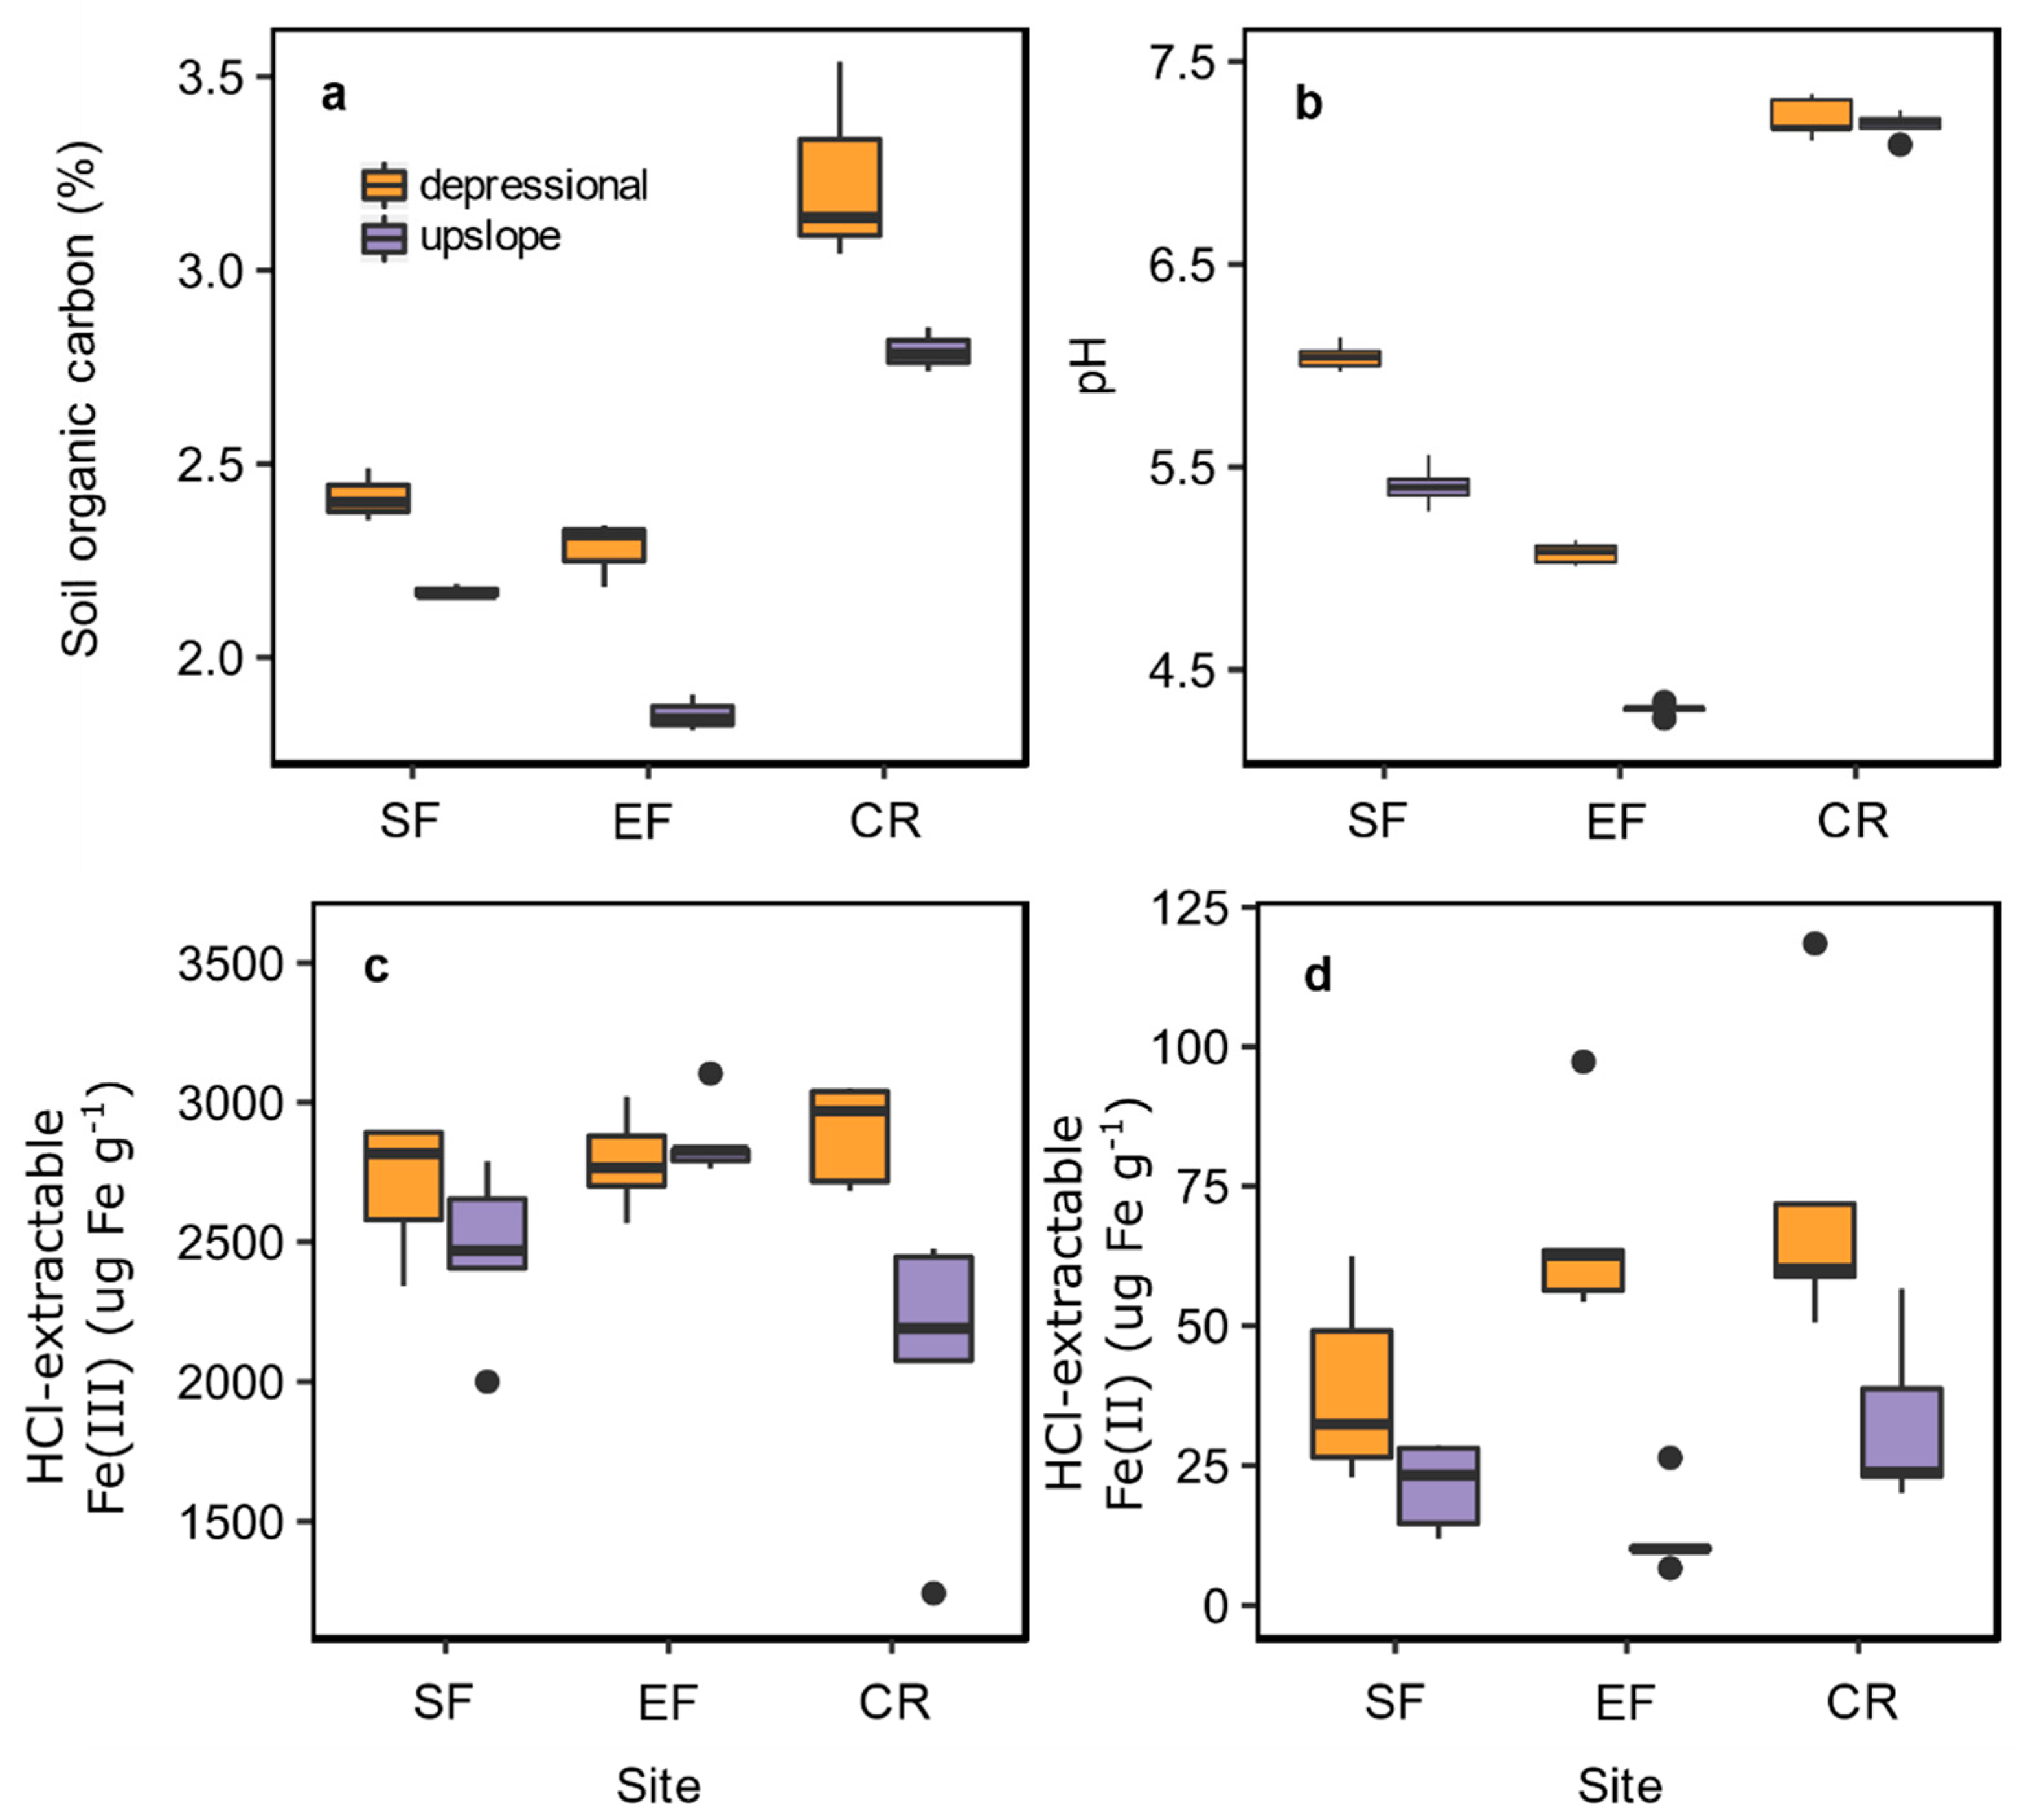
Soil organic C concentrations, pH, Fe(III), and Fe(II) concentrations differed significantly between upslope and depressional soils and among sites (Figure 2). Soil organic C concentrations were significantly higher in depressional compared to upslope topographic positions (Figure 2a; F1,14 = 41, p < 0.001). Overall, SOC concentrations were highest at Cardinal Road and lowest at the Energy Farm (F2,14 = 97, p < 0.001). Soil pH was higher in depressions compared to upslope positions (F2,26 = 50, p < 0.001, Figure 2b); it was lowest in the Energy Farm soils and highest in Cardinal Road soils (F1,26 = 459, p < 0.001). Concentrations of 0.5 N HCl extractable Fe(III) were significantly higher in depressional soils (Figure 2c; F1,26 = 7.0, p = 0.01), but did not differ significantly among sites (F2,26 = 2.7, p = 0.09). Finally, 0.5 N HCl extractable Fe(II) concentrations were higher in depressional soils compared to upslope soils (Figure 2d; F1,26 = 32, p < 0.001), and were highest in Cardinal Road soils (F2,26 = 3.8, p = 0.03).
3.2. Redox Fluctuation Effects on Trace Gas Emissions
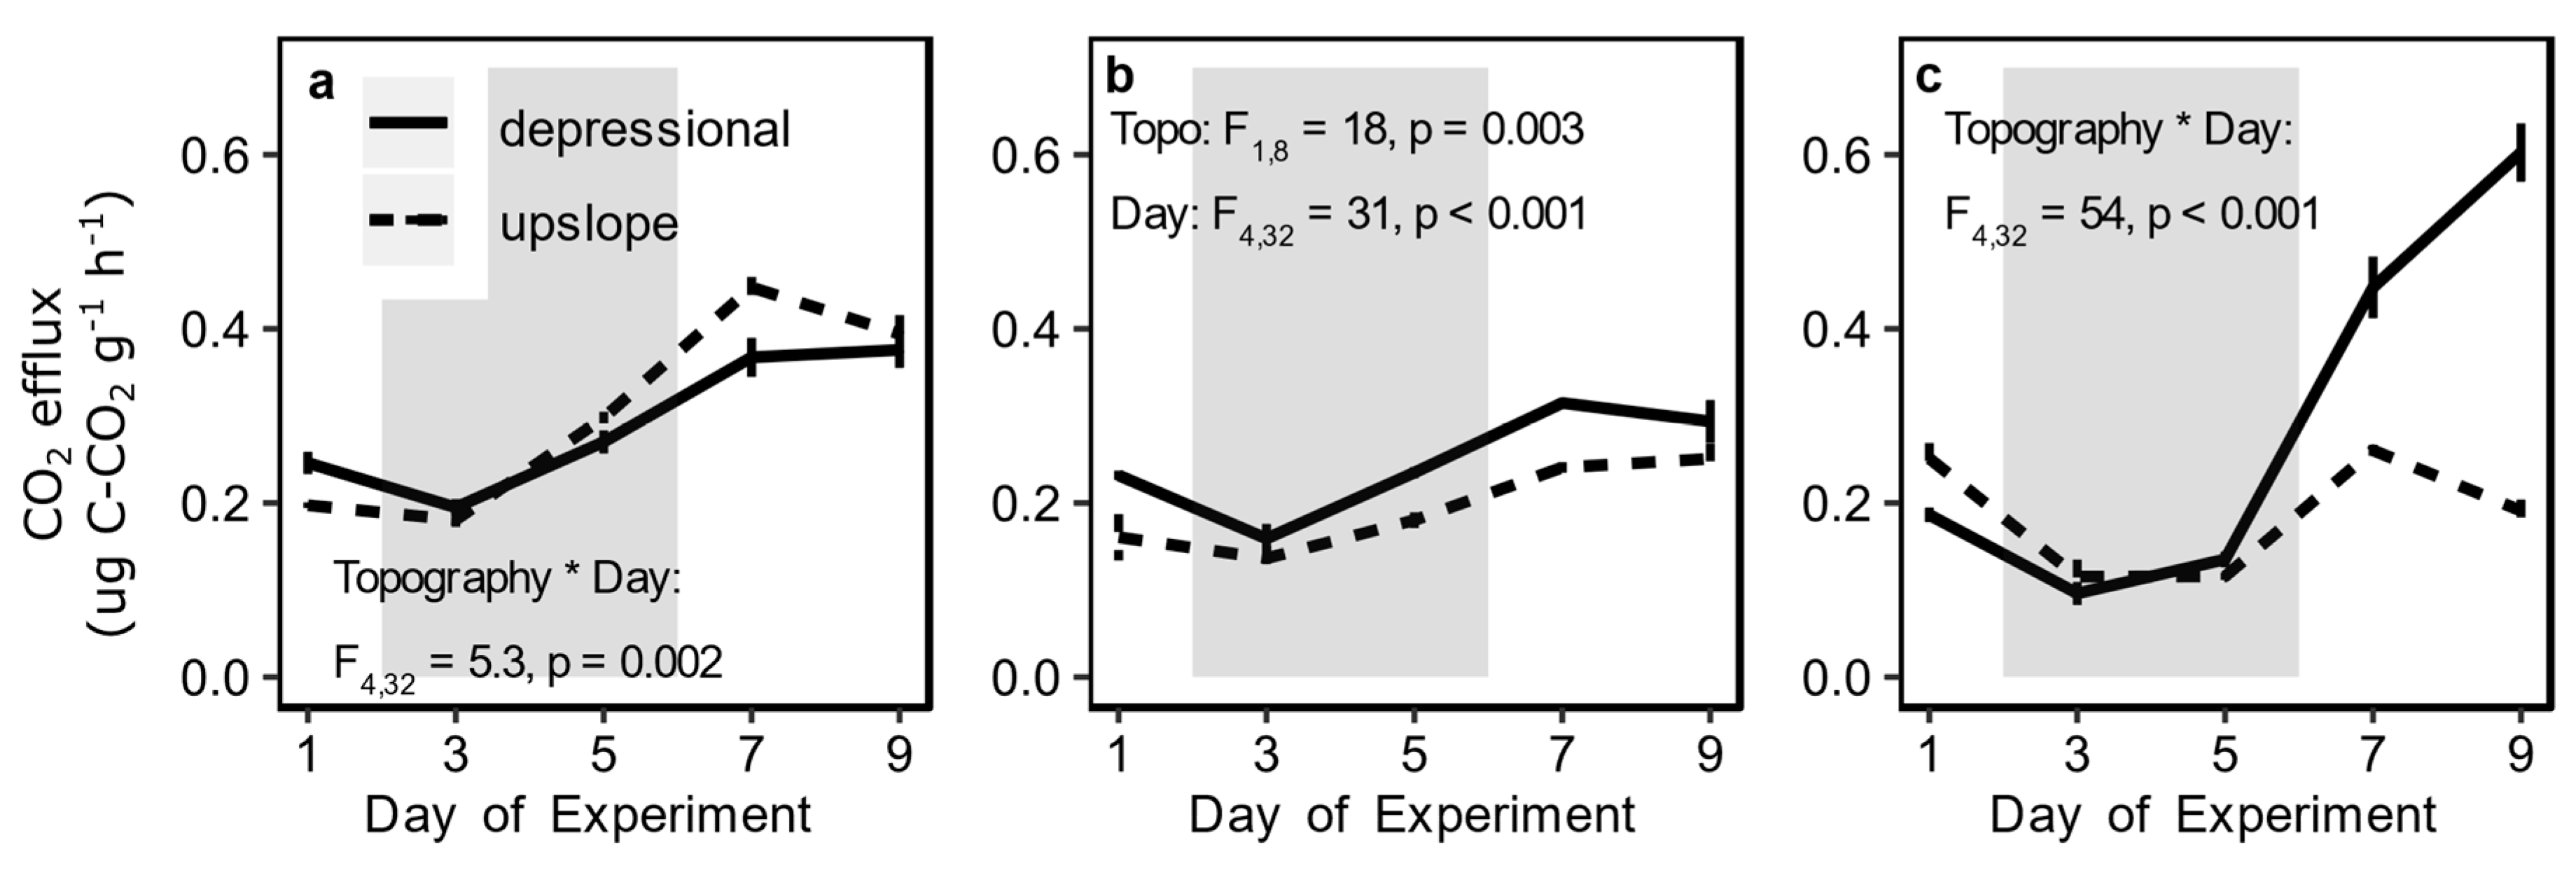
Trace gas emissions responded to a redox fluctuation caused by flooding and drainage of soils similarly in the early- and late growing seasons. Therefore, only late season data are presented throughout the results whereas early season data are reported in the supplemental material (Figures S1–S4, Tables S1 and S2). Flooding inhibited CO2 emissions from all soils, and drainage stimulated CO2 emissions above pre-flooding levels (Figure 3). This effect was evident from both upslope and depressional soils from all three sites, but the degree to which CO2 emissions spiked as soils drained differed between upslope and depressional soils at each site. Specifically, the day of experiment significantly interacted with the topographic position at the South Farms (F4,32 = 5.3, p = 0.002) and Cardinal Road (F4,32 = 54, p < 0.001) soils (Figure 3a,c). While Energy Farm soils did not exhibit this interaction effect (Figure 3b), topographic position and day of experiment each significantly affected soil CO2 emissions (F1,8 = 18, p = 0.003; F4,32 = 31, p < 0.001; respectively). In contrast to the consistent direction of response to flooding for the two topographic positions, upslope and depressional soils did not respond the same to soil drainage in all sites. Upslope soils from the South Farms had higher CO2 emissions compared to depressional soils during drainage, while depressional soils in the Energy Farm and Cardinal Road had higher CO2 emissions as soils drained (Figure 3). This was most pronounced in soils collected from Cardinal Road, where CO2 emissions from depressional soils reached 0.60 ± 0.03 ug C-CO2 g−1 h−1 on the last day of the experiment.
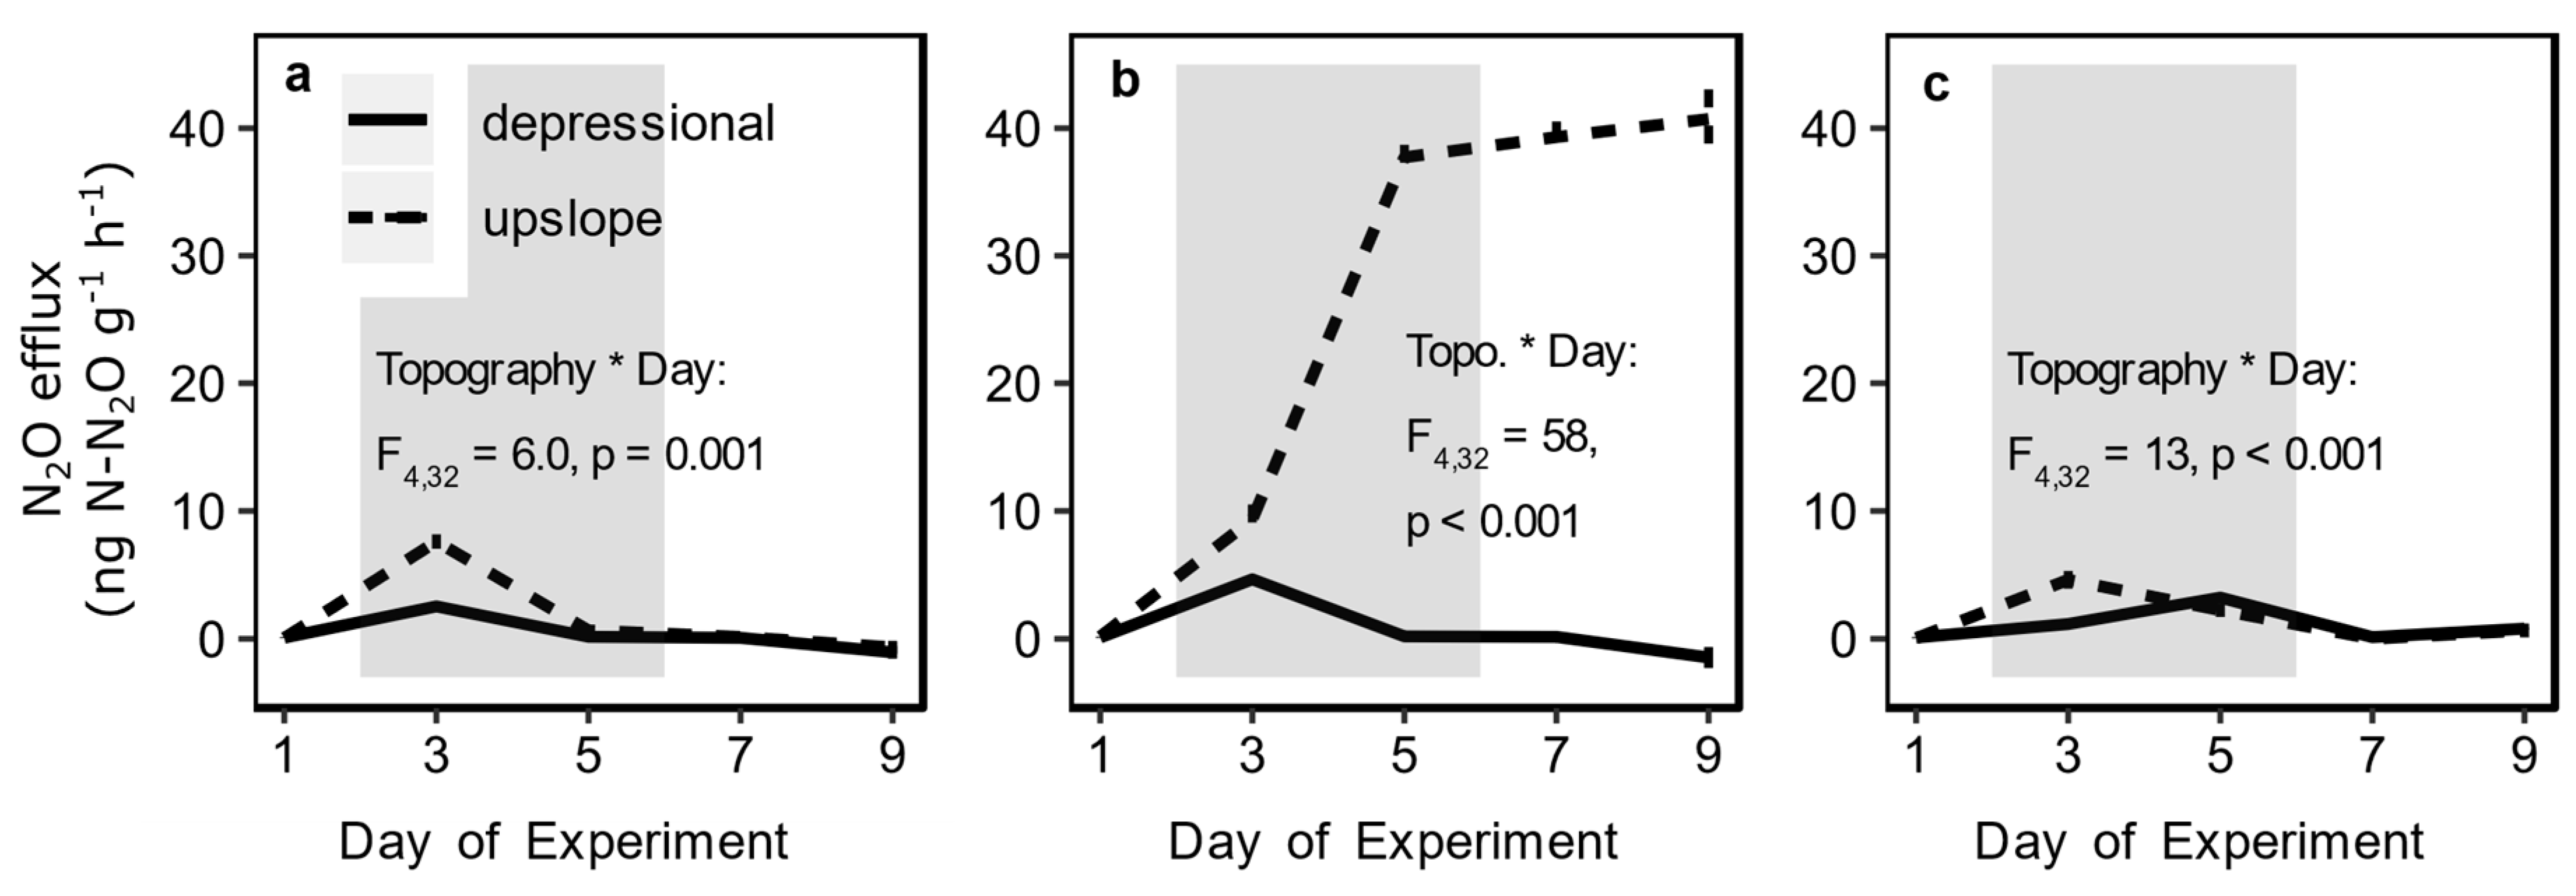
Flooding stimulated N2O emissions from all soil cores (Figure 4). There was a significant interaction effect between the topographic position and the day of experiment on N2O emissions from all three sites (p ≤ 0.001, Figure 4). Soil N2O emissions were higher from upslope soils compared to depressional from all three sites on the first day of flooding. Soil N2O emissions returned to near undetectable levels for most soils after day 5 of the experiment. This was not the case for upslope soils from the Energy Farm, where N2O emissions climbed to 40.7 ± 2.32 ng N-N2O g−1 h−1 by Day 9 of the experiment (Figure 4b).
3.3. Amendment Effects on Trace Gas Emissions and Fe Reduction
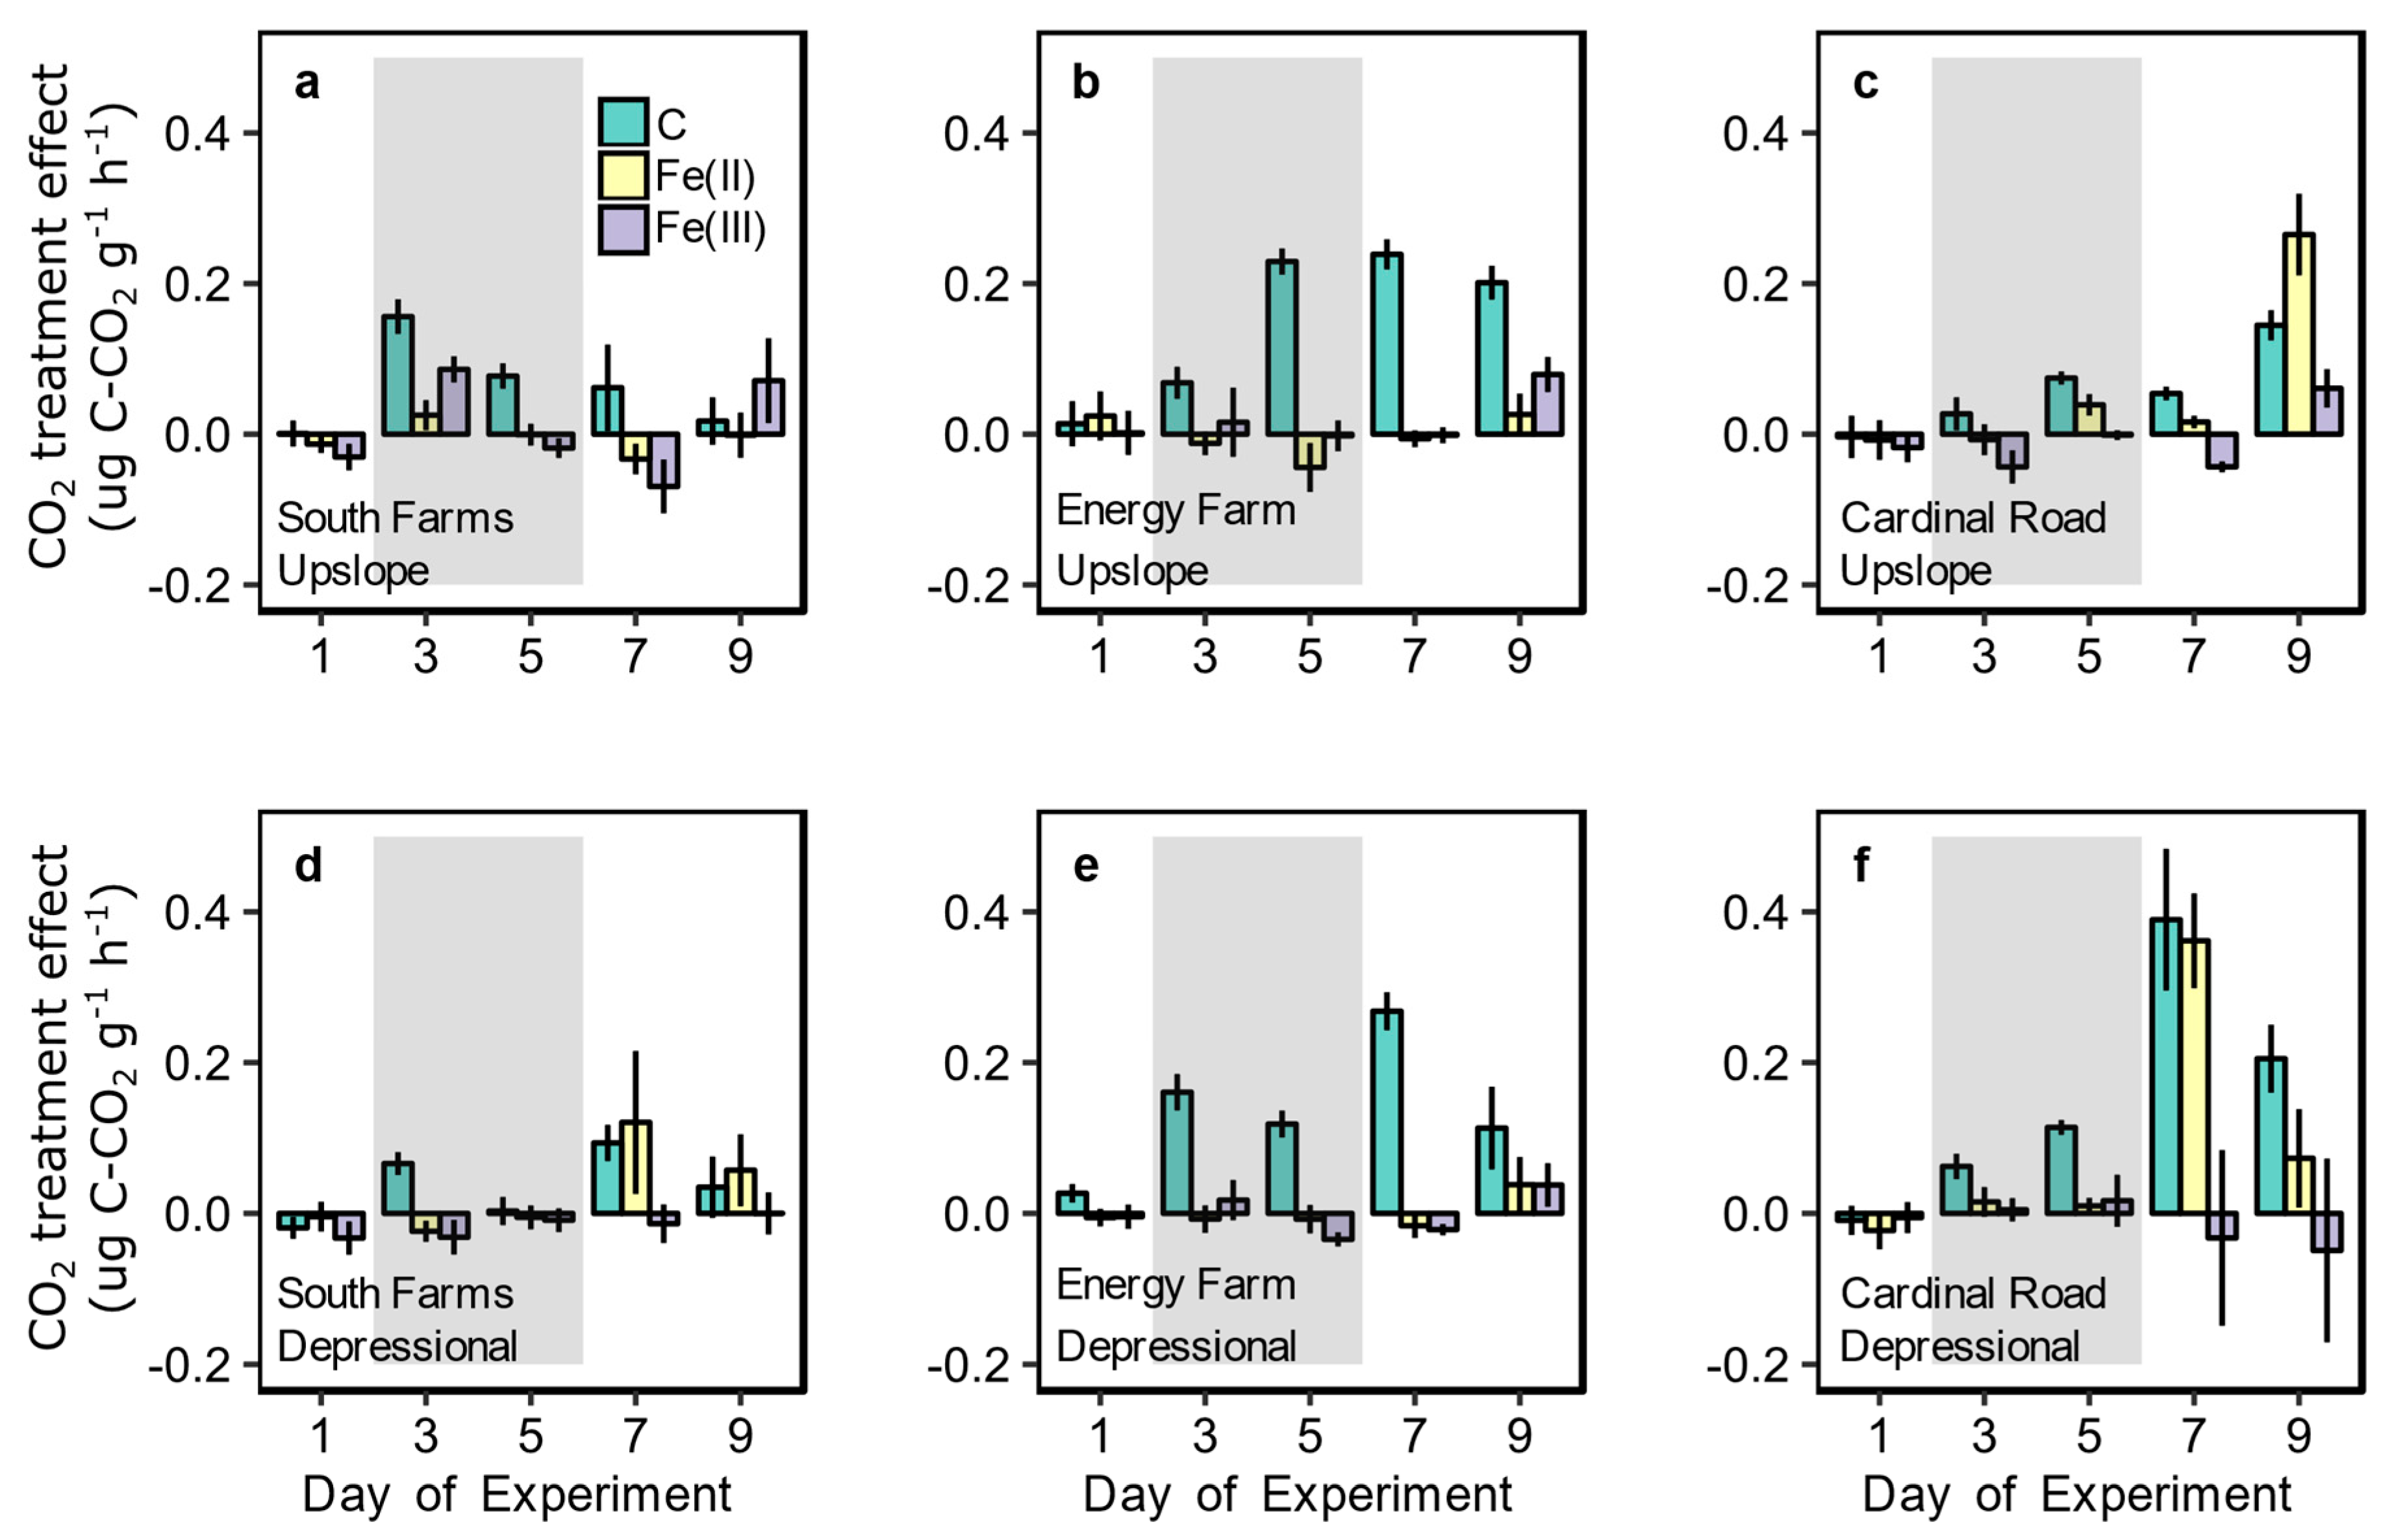
Of all amendment treatments, labile C had the strongest and most consistent effect on soil CO2 emissions in response to flooding and drainage in the late growing season (Figure 5). Carbon amendment stimulated soil CO2 emissions from all sites and topographic positions during both flooding and drainage (Table 1, Figure 5, p ≤ 0.05 for all treatment * day of experiment interaction effects). During flooded conditions on days 2 through 5 of the experiment, the treatment effect size relative to unamended controls soils was as large as 0.39 ug C-CO2 g−1 h−1, comparable to the expected response based on the amount of acetate added and assumed 30% carbon use efficiency (Figure 5). Amendment of Fe(II) stimulated CO2 emissions as both upslope and depressional soils from Cardinal Road drained, but had no effect on CO2 emissions from the South Farms and Energy Farm soils (Figure 5). Soil CO2 emissions did not exhibit a consistent response to the Fe(III) treatment throughout the experiment (Figure 5).
Log transformed CO2 emissions were included as the dependent variable, treatment was the independent variable, and date was included as a random variable.
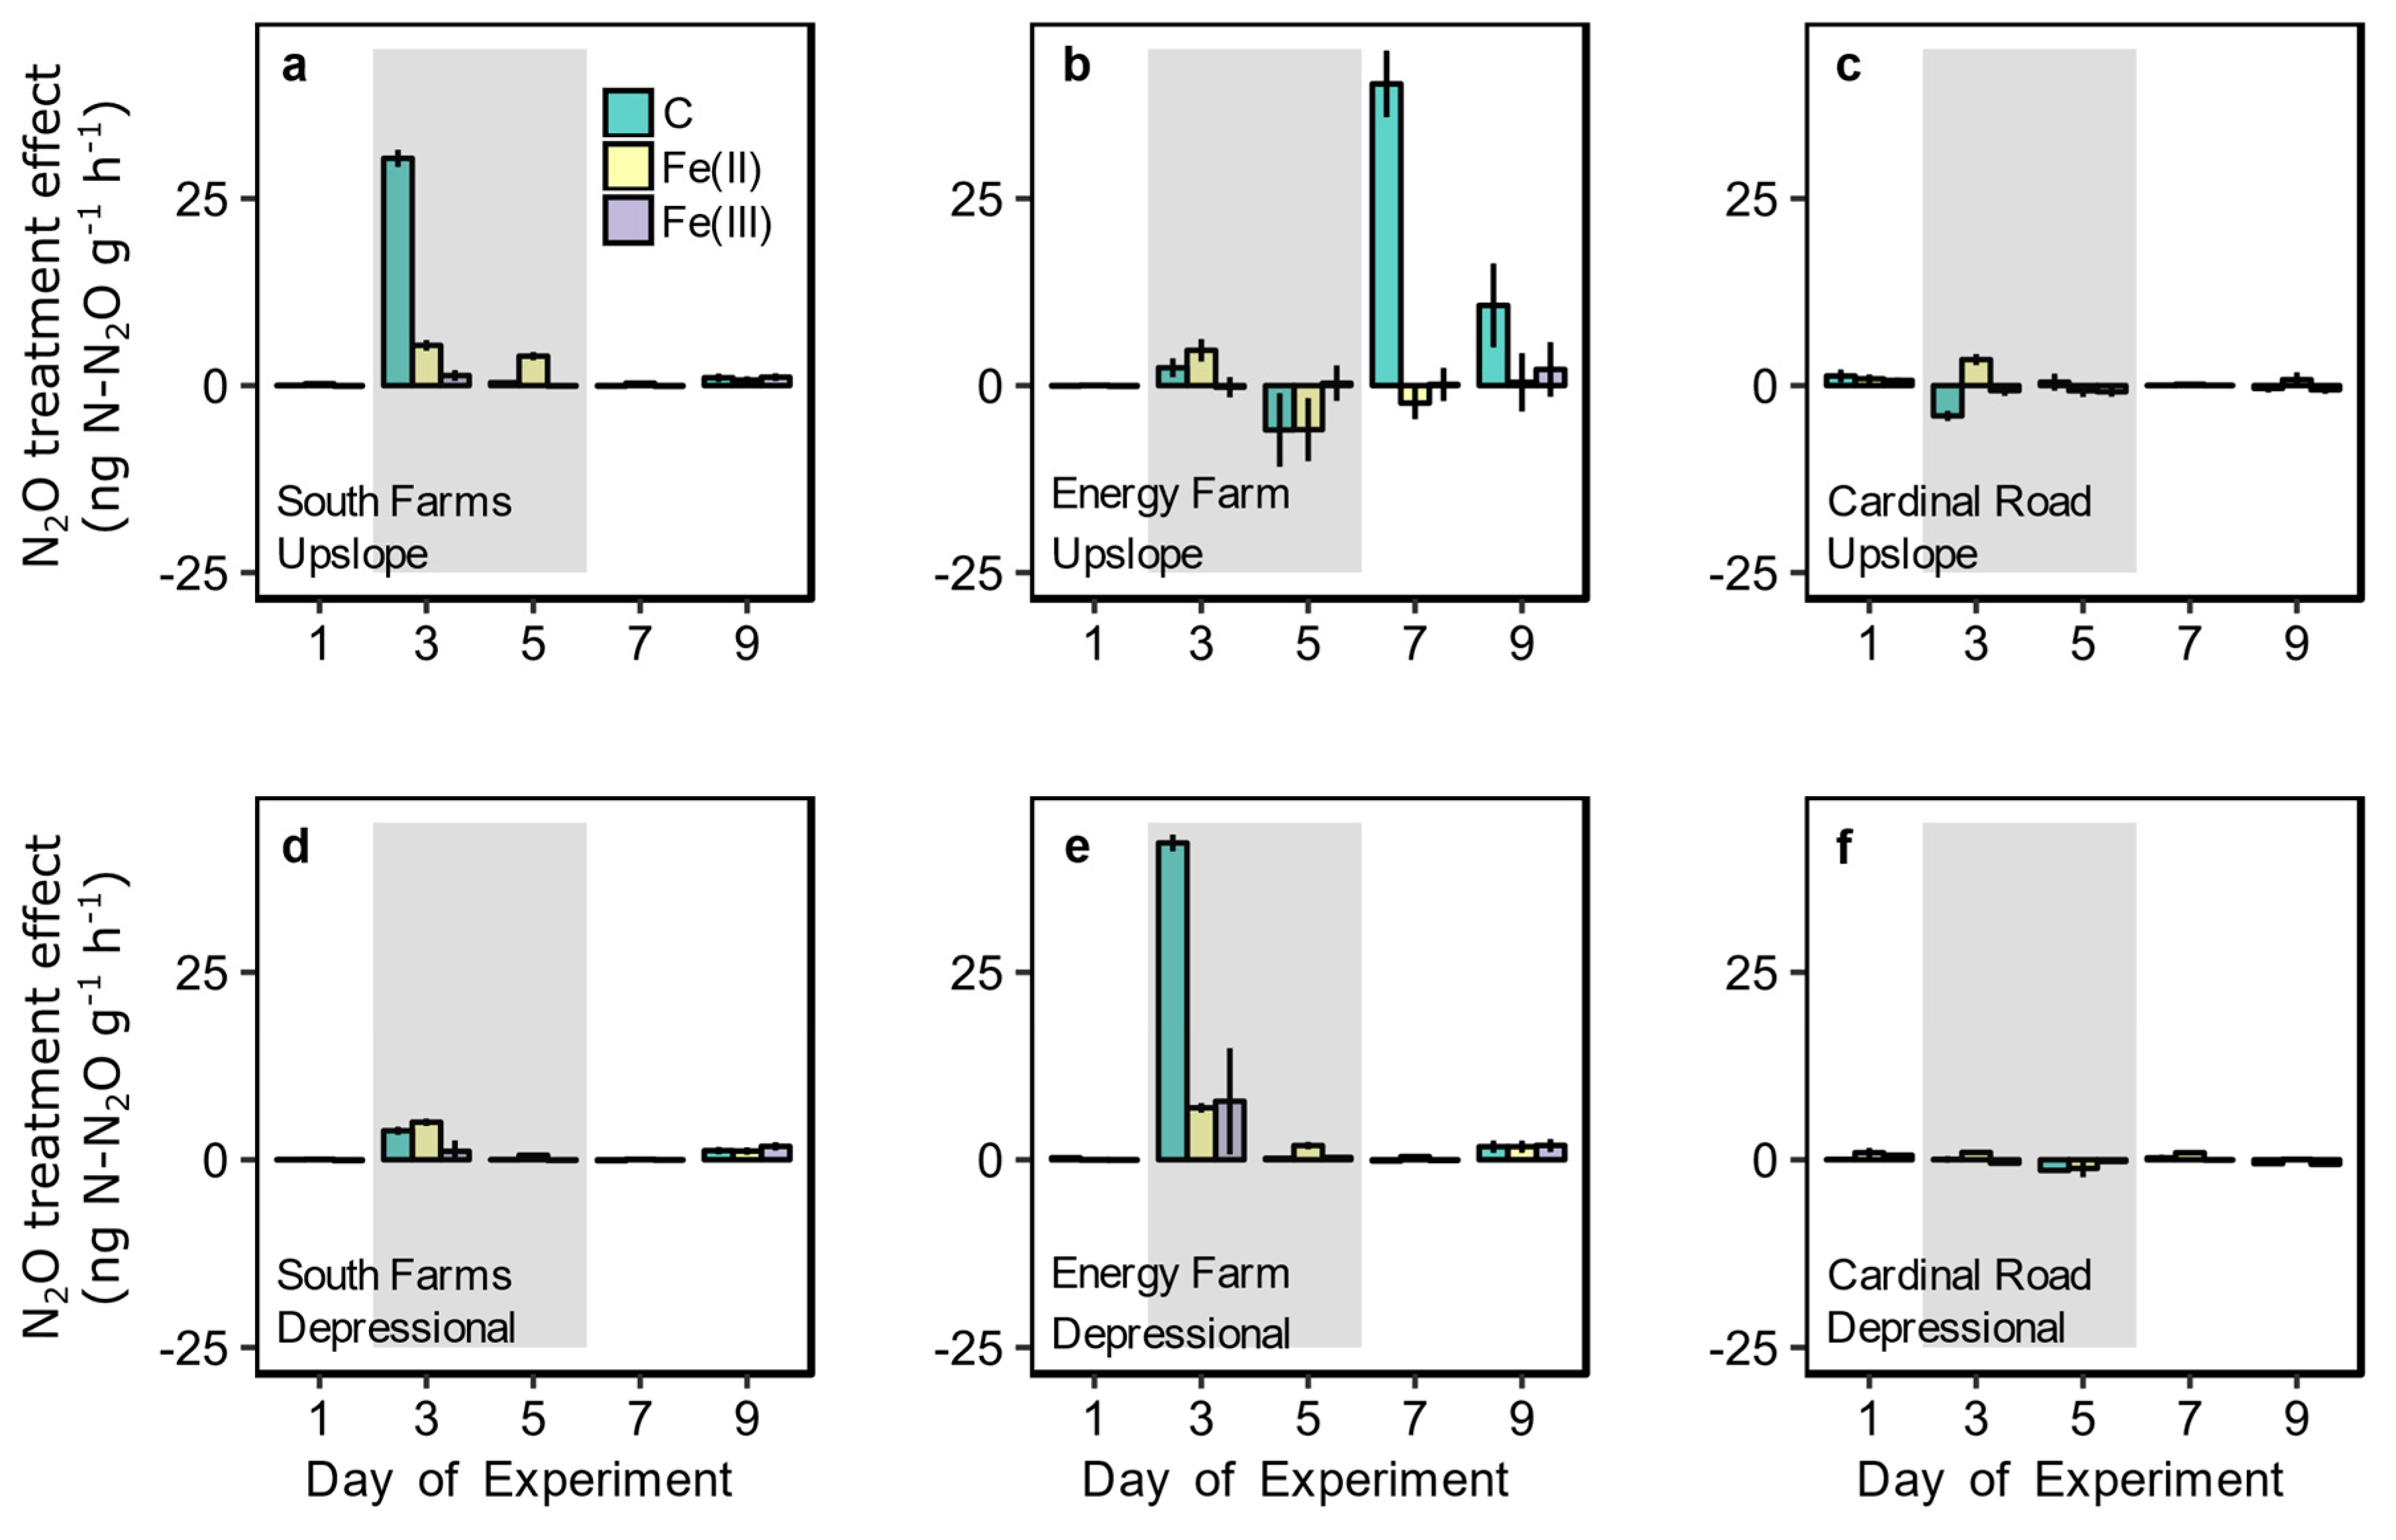
Soil N2O emissions from depressional and upslope soils from all three sites also responded to both C and Fe(II) additions in the late growing season (Figure 6). Carbon and Fe(II) addition stimulated N2O emissions starting on the first day of flooding (Table 2, Figure 6, p < 0.05 for all treatment * day of experiment interaction effects). Carbon addition led to the largest treatment effects. Carbon addition stimulated N2O emissions on the first day of flooding in soils from the South Farms and the Energy Farm (Figure 6). The addition of Fe(II) also consistently stimulated N2O emissions during flooding of both depressional and upslope soils from most sites, with an average increase of 4.41 ± 0.82 ng N-N2O g−1 h−1 above emissions from unamended control soils on the third day of the experiment (Figure 6). Assuming a ratio of 6 mole Fe oxidized for every 1 mole N2O produced via chemodenitrification [7], the oxidation of just 1.4 ug Fe(II) g−1 soil could drive this observed treatment effect over 24 h flooded period prior to the day 3 measurement, which is less than 2% of the Fe(II) added to the cores. Similar treatment effects on soil N2O emissions were observed on soils collected during the early growing season (SI data).
Log transformed N2O emissions were included as the dependent variable, treatment was the independent variable, and date was included as a random variable.
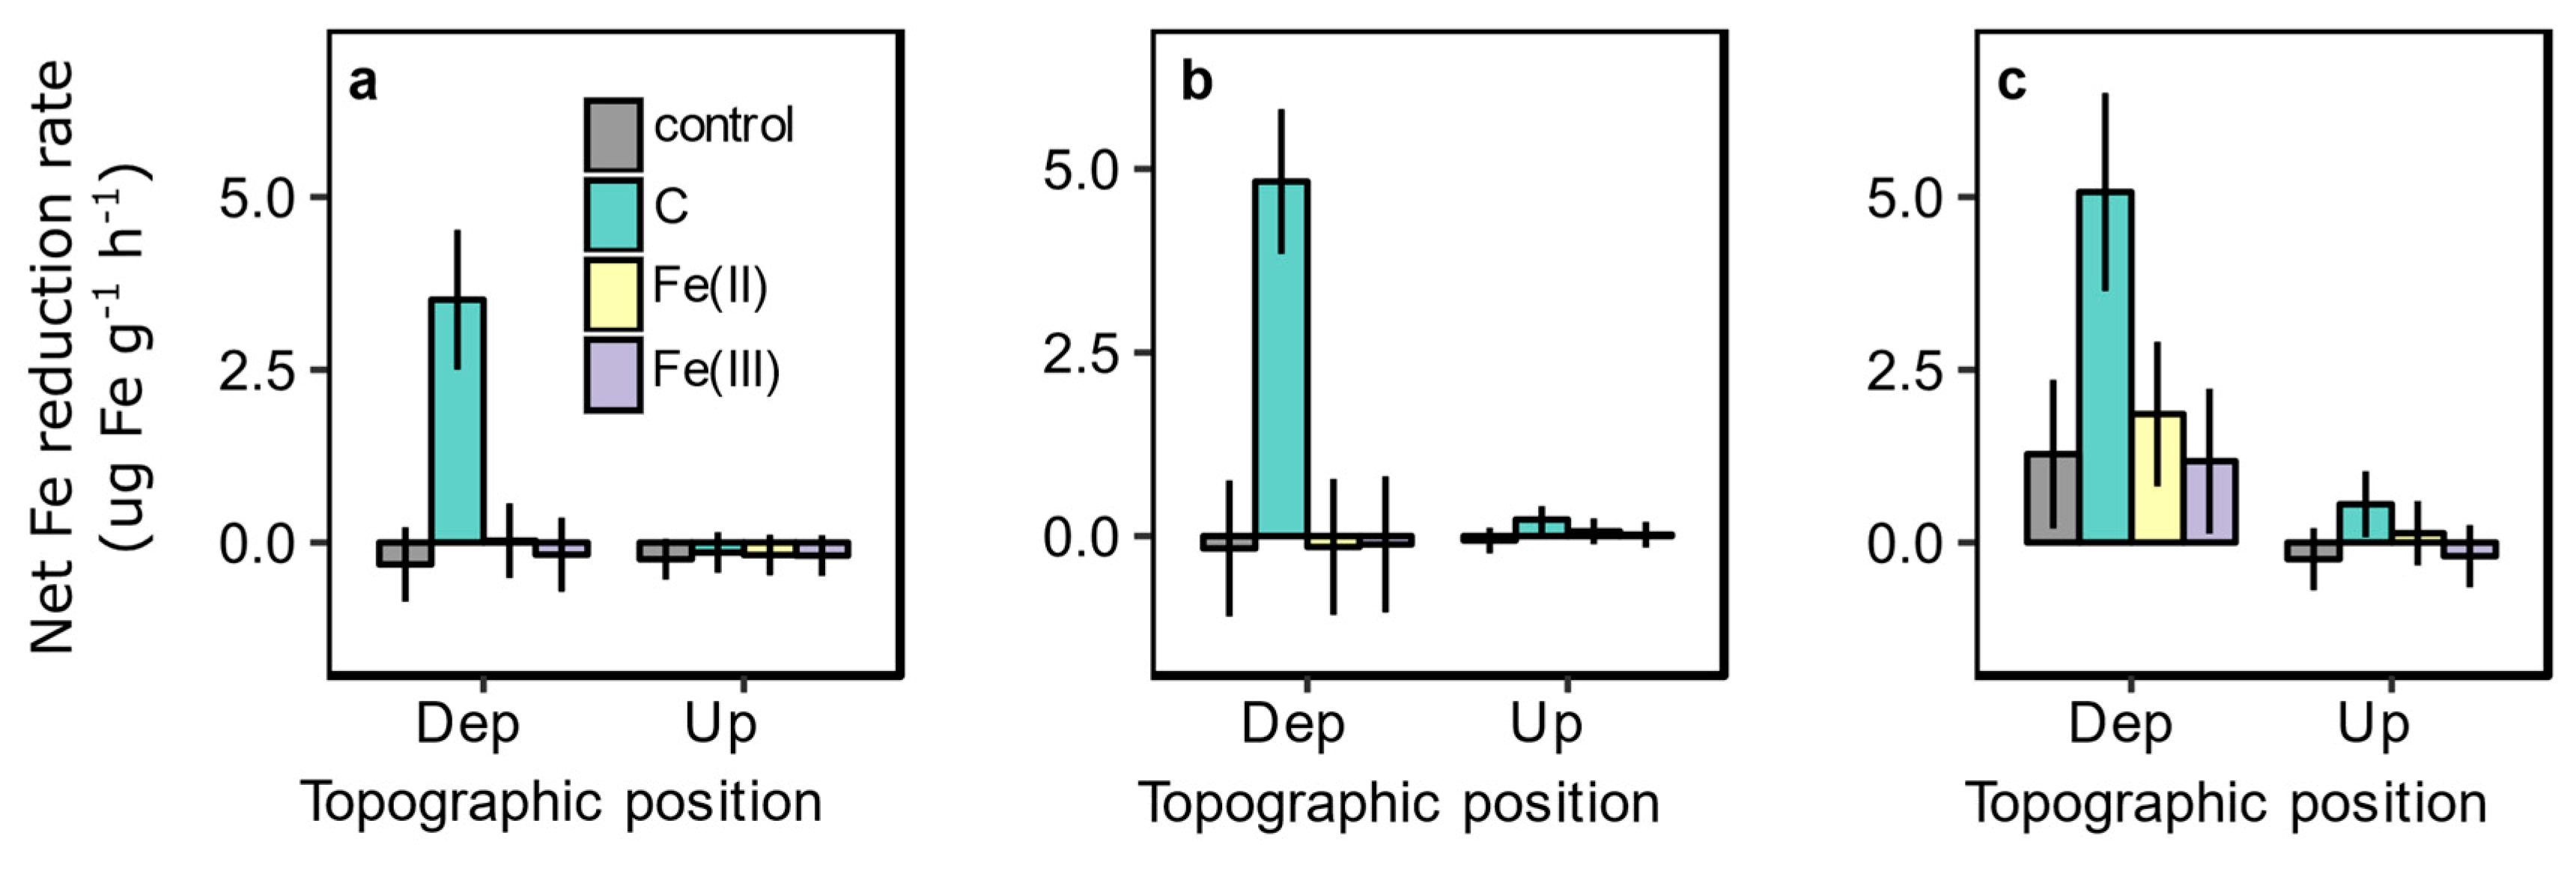
Carbon addition resulted in higher Fe reduction rates compared to unamended control soils during the 72-h flooding treatment in depressional soils but not upslope soils. Across all sites, treatment and topographic position significantly interacted to affect Fe reduction rates (Table 3, Figure 7). In C-amended depressional soils, average Fe reduction rates from all three sites ranged between 3.51 and 5.07 ug Fe g−1 h−1 compared to between −0.14 and 0.55 ug Fe g−1 h−1 in upslope soils (Figure 7). Tukey-corrected multiple comparisons showed that Fe reduction rates were significantly higher from C-amended depressional soils compared to all other treatments in depressional or upslope soils across all sites (p < 0.01, Figure 7).
Soil Fe reduction rate is the dependent variable for each model and the interaction between treatment and topographic position is the independent variable.
4. Discussion
We demonstrated that the potential for Fe reduction and oxidation to drive CO2 and N2O emissions is greater in depressional versus upslope soils, in support of our hypothesis. Flooding initially suppressed CO2 emissions from all soils but triggered a pulse in CO2 production as soils drained. While there were no consistent differences in CO2 emissions between upslope and depressional soils (Figure 3), acetate addition stimulated CO2 emissions under flooded conditions (Figure 5), suggesting that anaerobic respiration in upland soils may be limited by C availability and not access to alternative terminal electron acceptors (TEAs). However, depressional soils had higher rates of Fe reduction compared to upslope soils following the C amendment treatment (Figure 7). Thus, downslope transport of DOC from upslope to depressional areas following heavy rainfall may fuel hot spots of anaerobic CO2 production from dissimilatory Fe reduction. Additionally, high Fe(II) production rates in depressional soils can stimulate N2O and CO2 emissions via chemodenitrification and abiotic ROS production, respectively. While abiotic Fe(II) oxidation can contribute to the pulse in CO2 emissions that we observed as soils drain, other mechanisms such as the physical release of C from aggregates [41,42,43] or microbial necromass could also be important [44]. Together, these results suggest that Fe reduction and oxidation can contribute to CO2 and N2O production in upland soils, especially from depressional soils that have higher Fe reduction potential and experience accumulation of DOC and NO3− as a result of hydrologic flow.
Conventional understanding of moisture-soil respiration relationships suggests that O2 limitation following inundation should inhibit soil CO2 emissions [45,46], yet anaerobic respiration using alternative TEAs such as Fe contributes to soil CO2 emissions under flooded conditions. Although flooding inhibited CO2 efflux, acetate addition stimulated CO2 emissions from flooded soils (Figure 5), suggesting that anaerobic microbial respiration is more limited by concentrations of low molecular weight C compounds than access to alternative TEAs [5]. Depressional soils from Cardinal Road had the highest SOC concentrations (Figure 2a) and were the only soils where Fe reduction was observed under control conditions (Figure 7c), further supporting limitation of Fe reduction by C availability. Because of this, greater poorly crystalline Fe(III) concentrations in depressional soils, and Fe(III) addition to both depressional and upslope soils, did not result in higher rates of CO2 production. While Fe reduction can drive soil CO2 emissions in response to short anaerobic periods in C-rich tropical soils [10], it is likely that greater labile C availability is necessary to stimulate CO2 production via dissimilatory Fe reduction in tilled agricultural fields with lower SOC concentrations. Additionally, longer anaerobic periods may be necessary for the reductive dissolution of C-bearing Fe-oxyhydroxide compounds [47]. However, when acetate was added to the soil cores, depressional soils had higher Fe reduction rates compared to upslope soils (Figure 7). Observed rates of Fe reduction could produce CO2 at a rate ranging from 0.15 and 0.25 ug C-CO2 g−1 h−1 via dissimilatory Fe reduction over the 72 h flooding period, which is of similar magnitude to the pulse in CO2 emissions that was observed with acetate amendment. As such, dissimilatory Fe reduction has the potential to drive higher soil CO2 emissions from depressional areas that accumulate DOC from hydrologic flow following rainfall compared to upslope areas. This is contingent upon the composition of the DOC, as more complex compounds may not stimulate Fe reduction to the same degree as acetate [48,49].
We speculate that release of DOC into soil solution following soil drainage triggers pulses in CO2 emissions. Soil CO2 emissions increased as soils drained (Figure 3), suggesting either that the act of drainage stimulated the release of labile C, or that reactive C compounds accumulated during flooded periods and were aerobically respired as O2 diffused into the soil. This pulse in CO2 emissions was greatest from depressional soils collected from Cardinal Road (Figure 3c). Control depressional soils from Cardinal Road had higher Fe reduction rates compared to control upslope soils during the flooding period (Figure 7c), suggesting that Fe reduction could have contributed to the release of more DOC via the dissolution of solid Fe-oxyhydroxide compounds, as has been demonstrated in soils that experience prolonged anaerobic periods [16,47]. Depressional soils from the South Farms and the Energy Farm did not have higher Fe reduction rates compared to their upslope counterparts during the flooding treatment, and CO2 emissions from these soils did not consistently differ between depressional and upslope areas (Figure 5a,b). At these sites, other mechanisms such as physical breakdown of soil aggregates [41,42,43] or release of labile C from microbial necromass [44] could have increased C availability to fuel C mineralization in drained soils. We also observed evidence that abiotic Fe(II) oxidation may have been coupled to SOM degradation following soil drainage, as the addition of Fe(II) stimulated CO2 emissions from the drained Cardinal Road soils. These soils had the highest pH (Figure 2c) and it is possible that a decrease in soil pH following Fe(II) oxidation freed C from physical protection [19]. Iron reduction and oxidation can contribute to CO2 production as soils drain, but the relative importance of these mechanisms varies by site.
High Fe(III) reduction potential in depressional soils may support anaerobic C mineralization when labile C is abundant. Acetate addition, but not Fe(III) addition, stimulated Fe reduction in depressional soils (Figure 7). This treatment effect occurred only in depressional soils, indicating that depressional soils have higher Fe reduction potential than upslope soils. Greater abundance of genera capable of Fe reduction, such as Geobacter and Anaeromyxobacter, found in depressions within fields exhibiting microtopography [11] could lead to higher potential for Fe reduction to occur under favorable conditions. Higher Fe reduction rates in poorly-drained compared to nearby well-drained soils has previously been observed [50], suggesting that this phenomenon may be widespread. This is also consistent with studies showing increased abundance of Fe reducing microbes and higher rates of Fe reduction in tropical soils that experience repeated fluctuations in soil redox potential [10,12,13]. While CO2 emissions were not consistently higher from unamended depressional soils that were flooded (Figure 3), the stimulation of both CO2 and Fe(II) production with acetate addition indicate that anaerobic respiration using Fe(III) as a TEA was limited by soil labile C availability. During prolonged ponding in the field, higher abundance of Fe reducing microbes in depressional soils may facilitate continued CO2 production via dissimilatory Fe reduction after other more favorable TEAs, such as NO3−, are locally depleted. As such, greater Fe reduction potential in depressional soils may enable these areas to act as hotspots of Fe-mediated CO2 production under extended anaerobic periods.
An abundant supply of Fe(II) from high Fe reduction rates could support N2O production via chemodenitrification in depressional soils under flooded conditions. During the first day of flooding, Fe(II) additions stimulated N2O emissions from all soils (Figure 6). The abiotic oxidation of less than 2% of the Fe(II) amendment amount could sustain this level of N2O production over 24 h. It is possible that rapid chemodenitrification occurred immediately after flooding the soil cores and that we did not capture this initial pulse and subsequently underestimated the contribution of chemodenitrification to N2O emissions. While both biotic and abiotic reactions have been shown to produce N2O when Fe(II) oxidation is coupled to the reduction of inorganic N compounds [27,28,30,31,51,52], it is likely that abiotic Fe(II) oxidation was the dominant process since it is significantly faster than biotic Fe(II) oxidation [7,27]. However, it is possible that biotic pathways also contribute, either by directly oxidizing Fe(II) for energy or NO2− detoxification, or by denitrifying other inorganic N compounds produced by abiotic Fe(II) oxidation [27,30]. The increase in N2O emissions in response to acetate and Fe(II) treatments was smaller from Cardinal Road soils, potentially due to higher pH in these soils favoring the reduction of N2O to N2 [36]. Addition of Fe(III) compounds did not have any consistent effects on soil N2O emissions, suggesting that Feammox coupled to denitrification did not contribute to N2O production in these soils. These results highlight the potential for Fe(II) oxidation to drive high rates of N2O production, warranting further exploration of this process in upland soils. This may be especially important in depressional soils that experience accumulation of Fe(II) as a result of high rates of Fe reduction and from transport of dissolved Fe(II) in hydrologic flow from upslope areas of the field following large rain events.
In conclusion, we demonstrate that the reduction and oxidation of Fe compounds has the potential to drive microtopographic variation in CO2 and N2O emissions in upland soils, with these Fe-coupled reactions occurring more readily in depressional areas. In the laboratory experiment, CO2 efflux did not consistently differ between unamended depressional and upslope soils. However, depressional soils had higher Fe reduction potential with C amendment, suggesting that greater C mineralization via dissimilatory Fe reduction could occur with downslope transport of C to depressional areas under field conditions. Additionally, higher Fe reduction rates in depressional soils may supply sufficient Fe(II) to stimulate N2O production via chemodenitrification. Iron redox reactions are not often accounted for in upland soils but have the potential to significantly contribute to both CO2 and N2O emissions as soil redox potential fluctuates in response to large rain events. As climate change induced rainfall intensification results in greater extent and duration of flooding of depressional upland soils [1], Fe-mediated C and N transformations may become increasingly important pathways of soil greenhouse gas emissions that can feed back on climate change.
Supplementary Materials
The following are available online at https://www.mdpi.com/2571-8789/3/3/60/s1, Figure S1: Early growing season CO2 emissions from control soils; Figure S2: Early growing season N2O emissions from control soils; Figure S3: Treatment effects on soil CO2 emissions during the early growing season; Figure S4: Treatment effects on soil N2O emissions during the early growing season; Table S1: Results from ANOVAs run on mixed effects models examining the treatment effect on soil CO2 emissions during the early season lab experiment; Table S2: Results from ANOVAs run on mixed effects models examining the treatment effect on soil N2O emissions during the early season lab experiment.
Author Contributions
Conceptualization, A.H.K. and W.H.Y.; methodology, A.H.K. and W.H.Y.; software, A.H.K.; validation, A.H.K. and W.H.Y.; formal analysis, A.H.K. and E.S.; investigation, A.H.K. and E.S.; resources, W.H.Y.; data curation, A.H.K. and E.S.; writing—original draft preparation, A.H.K.; writing—review and editing, A.H.K., W.H.Y., and E.S.; visualization, A.H.K.; supervision, A.H.K. and W.H.Y.; project administration, A.H.K. and W.H.Y.; funding acquisition, A.H.K. and W.H.Y.
Funding
This research was funded by the University of Illinois at Urbana-Champaign Campus Research Board Award RB17056 and by the NSF Dimensions Biodiversity grant DEB-1831842. A.H.K. was supported by the Lebus Fund Award from the University of Illinois at Urbana-Champaign’s School of Integrative Biology. This research was also supported by the Cooperative State Research, Education, and Extension Service, US Department of Agriculture, under project number ILLU 875-952.
Acknowledgments
We would like to thank Rachel Van Allen for her assistance with lab work, as well as Karrie Weber and Olivia Healey for preparing the hydrous ferric oxide used in this study.
Conflicts of Interest
The authors declare no conflict of interest.
Data Availability
The datasets from this study are available in the Illinois Data Bank repository at https://doi.org/10.13012/B2IDB-8512100_V1.
References
- Min, S.K.; Zhang, X.; Zwiers, F.W.; Hegerl, G.C. Human contribution to more-intense precipitation extremes. Nature 2011, 470, 378–381. [Google Scholar] [CrossRef]
- Gleason, K. 2008 Midwestern, U.S. Floods; NOAA’s National Climatic Data Center: Ashville, NC, USA, 2008. [Google Scholar]
- USGCRP. Global Climate Change Impacts in the United States; Karl, T.R., Melillo, J.M., Peterson, T.C., Eds.; United States Global Change Research Program, Cambrige University Press: New York, NY, USA, 2009. [Google Scholar]
- Takai, Y.; Kamura, T. The mechanism of reduction in waterlogged paddy soil. Folia Microbiol. 1966, 11, 304–313. [Google Scholar] [CrossRef]
- Estop-Aragonés, C.; Knorr, K.H.; Blodau, C. Belowground in situ redox dynamics and methanogenesis recovery in a degraded fen during dry-wet cycles and flooding. Biogeosciences 2013, 10, 421–436. [Google Scholar] [CrossRef] [Green Version]
- Weber, K.A.; Achenbach, L.A.; Coates, J.D. Microorganisms pumping iron: Anaerobic microbial iron oxidation and reduction. Nat. Rev. Microbiol. 2006, 4, 752–764. [Google Scholar] [CrossRef] [PubMed]
- Zhu-Barker, X.; Cavazos, A.R.; Ostrom, N.E.; Horwath, W.R.; Glass, J.B. The importance of abiotic reactions for nitrous oxide production. Biogeochemistry 2015, 126, 251–267. [Google Scholar] [CrossRef]
- Lovley, D.R.; Phillips, E.J. Availability of ferric iron for microbial reduction in bottom sediments of the freshwater tidal potomac river. Appl. Environ. Microbiol. 1986, 52, 751–757. [Google Scholar] [PubMed]
- Burgin, A.J.; Yang, W.H.; Hamilton, S.K.; Silver, W.L. Beyond carbon and nitrogen: How the microbial energy economy couples elemental cycles in diverse ecosystems. Front. Ecol. Environ. 2011, 9, 44–52. [Google Scholar] [CrossRef]
- Dubinsky, E.A.; Silver, W.L.; Firestone, M.K. Tropical forest soil microbial communities couple iron and carbon biogeochemistry. Ecology 2010, 91, 2604–2612. [Google Scholar] [CrossRef]
- Suriyavirun, N.; Krichels, A.H.; Kent, A.D.; Yang, W.H. Microtopographic differences in soil properties and microbial community composition at the field scale. Soil. Biol. Biochem. 2019, 131, 71–80. [Google Scholar] [CrossRef]
- Barcellos, D.; Cyle, K.T.; Thompson, A. Faster redox fluctuations can lead to higher iron reduction rates in humid forest soils. Biogeochemistry 2018, 137, 367–378. [Google Scholar] [CrossRef]
- Ginn, B.; Meile, C.; Wilmoth, J.; Yang, Y.; Thompson, A. Rapid iron reduction rates are stimulated by high-amplitude redox fluctuations in a tropical forest soil. Environ. Sci. Technol. 2017, 51, 3250–3259. [Google Scholar] [CrossRef] [PubMed]
- Thompson, A.; Rancourt, D.G.; Chadwick, O.A.; Chorover, J. Iron solid-phase differentiation along a redox gradient in basaltic soils. Geochim. Cosmochim. Acta 2011, 75, 119–133. [Google Scholar] [CrossRef]
- Krichels, A.; DeLucia, E.H.; Sanford, R.; Chee-Sanford, J.C.; Yang, W.H. Historical soil drainage mediates the response of soil greenhouse gas emissions to intense precipitation events. Biogeochemistry 2019, 142, 425–442. [Google Scholar] [CrossRef]
- Buettner, S.W.; Kramer, M.G.; Chadwick, O.A.; Thompson, A. Mobilization of colloidal carbon during iron reduction in basaltic soils. Geoderma 2014, 221–222, 139–145. [Google Scholar] [CrossRef]
- Coward, E.K.; Thompson, A.; Plante, A.F. Contrasting Fe speciation in two humid forest soils: Insight into organomineral associations in redox-active environments. Geochim. Cosmochim. Acta 2018, 238, 68–84. [Google Scholar] [CrossRef]
- Hall, S.J.; Berhe, A.A.; Thompson, A. Order from disorder: Do soil organic matter composition and turnover co-vary with iron phase crystallinity? Biogeochemistry 2018, 140, 93–110. [Google Scholar] [CrossRef]
- Grybos, M.; Davranche, M.; Gruau, G.; Petitjean, P.; Pédrot, M. Increasing pH drives organic matter solubilization from wetland soils under reducing conditions. Geoderma 2009, 154, 13–19. [Google Scholar] [CrossRef]
- Pan, W.; Kan, J.; Inamdar, S.; Chen, C.; Sparks, D. Dissimilatory microbial iron reduction release DOC (dissolved organic carbon) from carbon-ferrihydrite association. Soil. Biol. Biochem. 2016, 103, 232–240. [Google Scholar] [CrossRef]
- Nitzsche, K.N.; Kaiser, M.; Premke, K.; Gessler, A.; Ellerbrock, R.H.; Hoffman, C.; Kleeberg, A.; Kayler, Z.E. Organic matter distribution and retention along transects from hilltop to kettle hole within an agricultural landscape. Biogeochemistry 2017, 136, 47–70. [Google Scholar] [CrossRef]
- Yanai, J.; Sawamoto, T.; Oe, T.; Jusa, K.; Yamakawa, K.; Sakamoto, K.; Naganawa, T.; Inubushi, K.; Hatano, R.; Kosaki, T. Spatial variability of nitrous oxide emissions and their soil-related determining factors in an agricultural field. J. Environ. Qual. 2003, 32, 1965–1977. [Google Scholar] [CrossRef]
- Turner, D.A.; Chen, D.; Galbally, I.E.; Leuning, R.; Edis, R.B.; Kelly, K.; Phillips, F. Spatial variability of nitrous oxide emissions from an Australian irrigated dairy pasture. Plant Soil 2008, 309, 77–88. [Google Scholar] [CrossRef]
- Hall, S.J.; Silver, W.L. Iron oxidation stimulates organic matter decomposition in humid tropical forest soils. Glob. Chang. Biol. 2013, 19, 2804–2813. [Google Scholar] [CrossRef] [PubMed]
- Yang, W.H.; Weber, K.; Silver, W.L. Nitrogen loss from soil through anaerobic ammonium oxidation coupled to iron reduction. Nat. Geosci. 2012, 5, 538–541. [Google Scholar] [CrossRef] [Green Version]
- Huang, S.; Jaffé, P.R. Characterization of incubation experiments and development of an enrichment culture capable of ammonium oxidation under iron-reducing conditions. Biogeosciences 2015, 12, 769–779. [Google Scholar] [CrossRef] [Green Version]
- Picardal, F. Abiotic and microbial interactions during anaerobic transformations of Fe(II) and NOx−. Front. Microbiol. 2012, 3, 1–7. [Google Scholar] [CrossRef] [PubMed]
- Carlson, H.K.; Clark, I.C.; Melnyk, R.A.; Coates, J.D. Toward a mechanistic understanding of anaerobic nitrate-dependent iron oxidation: Balancing electron uptake and detoxification. Front. Microbiol. 2012, 3, 1–6. [Google Scholar] [CrossRef] [PubMed]
- Coby, A.J.; Picardal, F.; Shelobolina, E.; Xu, H.; Roden, E.D. Repeated anaerobic microbial redox cycling of iron. Appl. Environ. Microbiol. 2011, 77, 6036–6042. [Google Scholar] [CrossRef]
- Klueglein, N.; Zeitvogel, F.; Stierhof, Y.D.; Floetenmeyer, M.; Konhauser, K.O.; Kappler, A.; Obst, M. Potential role of nitrite for abiotic Fe(II) oxidation and cell encrustation during nitrate reduction by denitrifying bacteria. Appl. Environ. Microbiol. 2014, 80, 1051–1061. [Google Scholar] [CrossRef]
- Carlson, H.K.; Clark, I.C.; Blazewicz, S.J.; Iavarone, A.T.; Coates, J.D. Fe(II) oxidation is an innate capability of nitrate-reducing bacteria that involves abiotic and biotic reactions. J. Bacteriol. 2013, 195, 3260–3268. [Google Scholar] [CrossRef]
- Ding, L.; An, X.; Li, S.; Zhang, G.; Zhu, Y. Nitrogen loss through anaerobic ammonium oxidation coupled to iron reduction from paddy soils in a chronosequence. Environ. Sci. Technol. 2014, 48, 10641–10647. [Google Scholar] [CrossRef]
- Inois Cilllimate Network. Water and Atmospheric Resources Monitoring Program; Illinois State Water Survey: Champaign, IL, USA, 2017. [Google Scholar]
- Liptzin, D.; Silver, W.L. Effects of carbon additions on iron reduction and phosphorus availability in a humid tropical forest soil. Soil Biol. Biochem. 2009, 41, 1696–1702. [Google Scholar] [CrossRef]
- Lovley, D.R.; Phillips, E.J.P. Organic-matter mineralization with reduction of ferric iron in anaerobic sediments. Appl. Environ. Microbiol. 1986, 51, 683–689. [Google Scholar] [CrossRef] [PubMed]
- Chapuis-Lardy, L.; Wrage, N.; Metay, A.; Chottes, J.; Bernouxs, M. Soils, a sink for N2O? A review. Glob. Chang. Biol. 2007, 13, 1–17. [Google Scholar] [CrossRef]
- R Core Team. R: A Language and Environment for Statistical Computing; R Foundation for Statistical Computing: Vienna, Austria, 2018. [Google Scholar]
- Fox, J.; Weisberg, S. An R Companion to Applied Regression, 2nd ed.; Sage: Thousand Oaks, CA, USA, 2011. [Google Scholar]
- Lenth, R.V. Least-Squares Means: The R Package lsmeans. J. Stat. Softw. 2016, 69, 1–33. [Google Scholar] [CrossRef]
- Pinheiro, J.; DebRoy, S.; Sarkar, D.; R Core Team. Nlme: Linear and Nonlinear Mixed Effects Models. 2017. Available online: https://CRAN.R-project.org/package=nlme (accessed on 10 March 2018).
- Denef, K.; Six, J.; Bossuyt, H.; Frey, A.D.; Elliott, E.T.; Merckx, R.; Paustian, K. Influence of dry-wet cycles on the interrelationship between aggregate, particulate organic matter, and microbial community dynamics. Soil. Biol. Biochem. 2001, 33, 1599–1611. [Google Scholar] [CrossRef]
- Six, J.; Bossuyt, H.; Degryze, S.; Denef, K. A history of research on the link between (micro)aggregates, soil biota, and soil organic matter dynamics. Soil Tillage Res. 2004, 79, 7–31. [Google Scholar] [CrossRef]
- De-Campos, A.B.; Mamedov, A.I.; Huang, C. Short-term reducing conditions decrease soil aggregation. Soil Sci. Soc. Am. J. 2009, 73, 550–559. [Google Scholar] [CrossRef]
- Blazewicz, S.J.; Schwartz, E.; Firestone, M.K. Growth and death of bacteria and fungi underlie rainfall-induced carbon dioxide pulses from seasonally dried soil. Ecology 2014, 95, 1162–1172. [Google Scholar] [CrossRef]
- Linn, D.M.; Doran, J.W. Effect of water-filled pore space on carbon dioxide and nitrous oxide production in tillied and nontilled soils. Soil. Sci. Soc. Am. J. 1984, 48, 1267–1272. [Google Scholar] [CrossRef]
- Davidson, E.A.; Samanta, S.; Caramori, S.S.; Savage, K. The Dual Arrhenius and Michaelis-Menten kinetics model for decomposition of soil organic matter at hourly to seasonal time scales. Glob. Chang. Biol. 2012, 18, 371–384. [Google Scholar] [CrossRef]
- Huang, W.; Hall, S.J. Elevated moisture stimulates carbon loss from mineral soils by releasing protected organic matter. Nat. Commun. 2017, 8, 1–10. [Google Scholar] [CrossRef] [PubMed]
- LaRowe, D.E.; Van Cappellen, P. Degradation of natural organic matter: A thermodynamic analysis. Geochim. Cosmochim. Acta. 2011, 75, 2030–2042. [Google Scholar] [CrossRef]
- Stuckey, J.W.; Schaefer, M.V.; Kocar, B.D.; Benner, S.G.; Fendorf, S. Arsenic release metabolically limited to permanently water-saturated soil in Mekong Delta. Nat. Geosci. 2016, 9, 70–76. [Google Scholar] [CrossRef]
- Henderson, R.; Kabengi, N.; Mantripragada, N.; Cabrera, M.; Hassan, S.; Thompson, A. Anoxia-induced release of colloid- and nanoparticle-bound phosphorus in grassland soils. Environ. Sci. Technol. 2012, 46, 11727–11734. [Google Scholar] [CrossRef] [PubMed]
- Coby, A.J.; Picardal, F.W. Inhibition of NO3− and NO2− reduction by microbial Fe( III ) reduction: Evidence of a reaction between NO2− and cell surface-bound Fe2+. Appl. Environ. Microbiol. 2005, 71, 5267–5274. [Google Scholar] [CrossRef] [PubMed]
- Hall, S.J.; Reyes, L.; Huang, W.; Homyak, P.M. Wet Spots as Hotspots: Moisture Responses of Nitric and Nitrous Oxide Emissions From Poorly Drained Agricultural Soils. J. Geophys. Res. Biogeosci. 2018, 123, 3589–3602. [Google Scholar] [CrossRef] [Green Version]
Figure 1.
Conceptual diagram showing the four main Fe mediated C and N transformations considered in this study: Dissimilatory Fe reduction, abiotic reactive oxygen species (ROS) formation, anaerobic ammonium oxidation coupled to Fe reduction (Feammox), and chemodenitrification. While C is not directly lost via ROS production, ROS can stimulate the abiotic degradation of soil organic matter (SOM). Arrows originate at the starting reactant and end at the product. Colors correspond to different reactions coupling Fe reduction or oxidation with C and N transformations.

Figure 2.
Soil organic carbon concentration (a), soil pH (b), 0.5N HCl-extractable Fe(III) concentration (c), and 0.5N HCl-extractable Fe(II) concentration (d) from upslope and depressional soils from the South Farms (SF), the Energy Farm (EF), and Cardinal Road (CR) (n = 3 for C, n = 5 for pH, Fe(II), and Fe(III)). Colors represent the topographic position where soils were collected from within each site. The line in each box represents the mean, the upper and lower portions of each box correspond to the 25th and 75th percentiles, the whiskers extend to the upper and lower inter-quartile range, and dots represent outliers.

Figure 3.
Soil CO2 emissions (mean ± SE, n = 5) from unamended control soils from the South Farms (a), the Energy Farm (b), and Cardinal Road (c) over the course of the late season experiment. Solid lines represent emissions from depressional soils, and dotted lines represent emissions from upslope soils. Shaded areas represent when the soil cores were flooded. Results from ANOVAs run on linear mixed effects models are presented within each panel. Interaction effects are presented when significant interactions were detected. Otherwise, significant main effects are presented.

Figure 4.
Soil N2O emissions (mean ± SE, n = 5) from unamended control soils from the South Farms (a), the Energy Farm (b), and Cardinal Road (c) over the course of the late season experiment. Solid lines represent emissions from depressional soils, and dotted lines represent emissions from upslope soils. Shaded areas represent when the soil cores were flooded. Results from ANOVAs run on linear mixed effects models are presented within each panel. Interaction effects are presented when significant interactions were detected. Otherwise, significant main effects are presented.

Figure 5.
Effect size of treatments on soil CO2 emissions from upslope (a–c) and depressional (d–f) soils from the South Farms (a,d), the Energy Farm (b,e), and Cardinal Road (c,f) during the late season experiment. The treatment effect was calculated as the difference between net CO2 emissions from soil receiving a given treatment amendment compared to unamended control soils. Error bars represent propagated standard error (n = 5) of the difference between the control and treatment means. Colors represent each treatment. Gray shading indicates when soils were flooded.

Figure 6.
Effect size of treatments on soil N2O emissions from upslope (a–c) and depressional (d–f) soils from the South Farms (a,d), the Energy Farm (b,e), and Cardinal Road (c,f) during the late season experiment. The treatment effect was calculated as the difference between net N2O emissions from soil receiving a given treatment amendment compared to unamended control soils. Error bars represent propagated standard error (n = 5) of the difference between the control and treatment means. Colors represent each treatment. Gray shading indicates when soils were flooded.

Figure 7.
Net Fe reduction rates in depressional and upslope areas at the South Farms (a), the Energy Farm (b), and Cardinal Road (c) during the late season experiment (mean ± SE, n = 5). Colors represent different treatments.
Figure 7.
Net Fe reduction rates in depressional and upslope areas at the South Farms (a), the Energy Farm (b), and Cardinal Road (c) during the late season experiment (mean ± SE, n = 5). Colors represent different treatments.


Table 1.
Results from ANOVAs run on mixed effects models examining the interaction effect between treatment and date on soil CO2 emissions during the late season lab experiment.
Table 1.
Results from ANOVAs run on mixed effects models examining the interaction effect between treatment and date on soil CO2 emissions during the late season lab experiment.
| Site | Drainage Class | Degrees of Freedom (n,d) | F Statistic | p Value |
|---|---|---|---|---|
| South Farms | upslope | 9,47 | 3.2 | 0.004 |
| South Farms | depressional | 9,48 | 2.1 | <0.05 |
| Energy Farm | upslope | 9,48 | 4.6 | <0.001 |
| Energy Farm | depressional | 9,46 | 3.8 | 0.001 |
| Cardinal Road | upslope | 9,45 | 9.2 | <0.001 |
| Cardinal Road | depressional | 9,47 | 3.5 | 0.002 |
Table 2.
Results from ANOVAs run on mixed effects models examining the treatment effect on soil N2O emissions during the late season lab experiment.
Table 2.
Results from ANOVAs run on mixed effects models examining the treatment effect on soil N2O emissions during the late season lab experiment.
| Site | Drainage Class | Degrees of Freedom (n,d) | F Statistic | p value |
|---|---|---|---|---|
| South Farms | upslope | 9,47 | 46 | <0.001 |
| South Farms | depressional | 9,48 | 6.9 | <0.001 |
| Energy Farm | upslope | 9,48 | 7.6 | <0.001 |
| Energy Farm | depressional | 9,46 | 8.7 | <0.001 |
| Cardinal Road | upslope | 9,45 | 7.1 | <0.001 |
| Cardinal Road | depressional | 9,47 | 3.1 | 0.006 |
Table 3.
Results from ANOVAs explaining variation in soil Fe reduction rates during the late season lab experiment.
Table 3.
Results from ANOVAs explaining variation in soil Fe reduction rates during the late season lab experiment.
| Site | Degrees of Freedom (n,d) | F Statistic | p Value |
|---|---|---|---|
| South Farms | 3,32 | 17 | <0.001 |
| Energy Farm | 3,32 | 172 | <0.001 |
| Cardinal Road | 3,32 | 6.1 | 0.002 |
© 2019 by the authors. Licensee MDPI, Basel, Switzerland. This article is an open access article distributed under the terms and conditions of the Creative Commons Attribution (CC BY) license (http://creativecommons.org/licenses/by/4.0/).
Share and Cite
MDPI and ACS Style
Krichels, A.H.; Sipic, E.; Yang, W.H. Iron Redox Reactions Can Drive Microtopographic Variation in Upland Soil Carbon Dioxide and Nitrous Oxide Emissions. Soil Syst. 2019, 3, 60. https://doi.org/10.3390/soilsystems3030060
AMA Style
Krichels AH, Sipic E, Yang WH. Iron Redox Reactions Can Drive Microtopographic Variation in Upland Soil Carbon Dioxide and Nitrous Oxide Emissions. Soil Systems. 2019; 3(3):60. https://doi.org/10.3390/soilsystems3030060
Chicago/Turabian StyleKrichels, Alexander H., Emina Sipic, and Wendy H. Yang. 2019. "Iron Redox Reactions Can Drive Microtopographic Variation in Upland Soil Carbon Dioxide and Nitrous Oxide Emissions" Soil Systems 3, no. 3: 60. https://doi.org/10.3390/soilsystems3030060