
EgoActive: Integrated Wireless Wearable Sensors for Capturing Infant Egocentric Auditory–Visual Statistics and Autonomic Nervous System Function ‘in the Wild’
 , , , , ,
Abstract
:1. Introduction
1.1. Importance of Wearable Sensors for Developmental Research in the Wild
1.2. Limitations of Existing Wearable Sensors for Developmental Research in the Wild
1.3. The EgoActive Platform
2. Platform Hardware Design, Fabrication and Validation
2.1. Overview
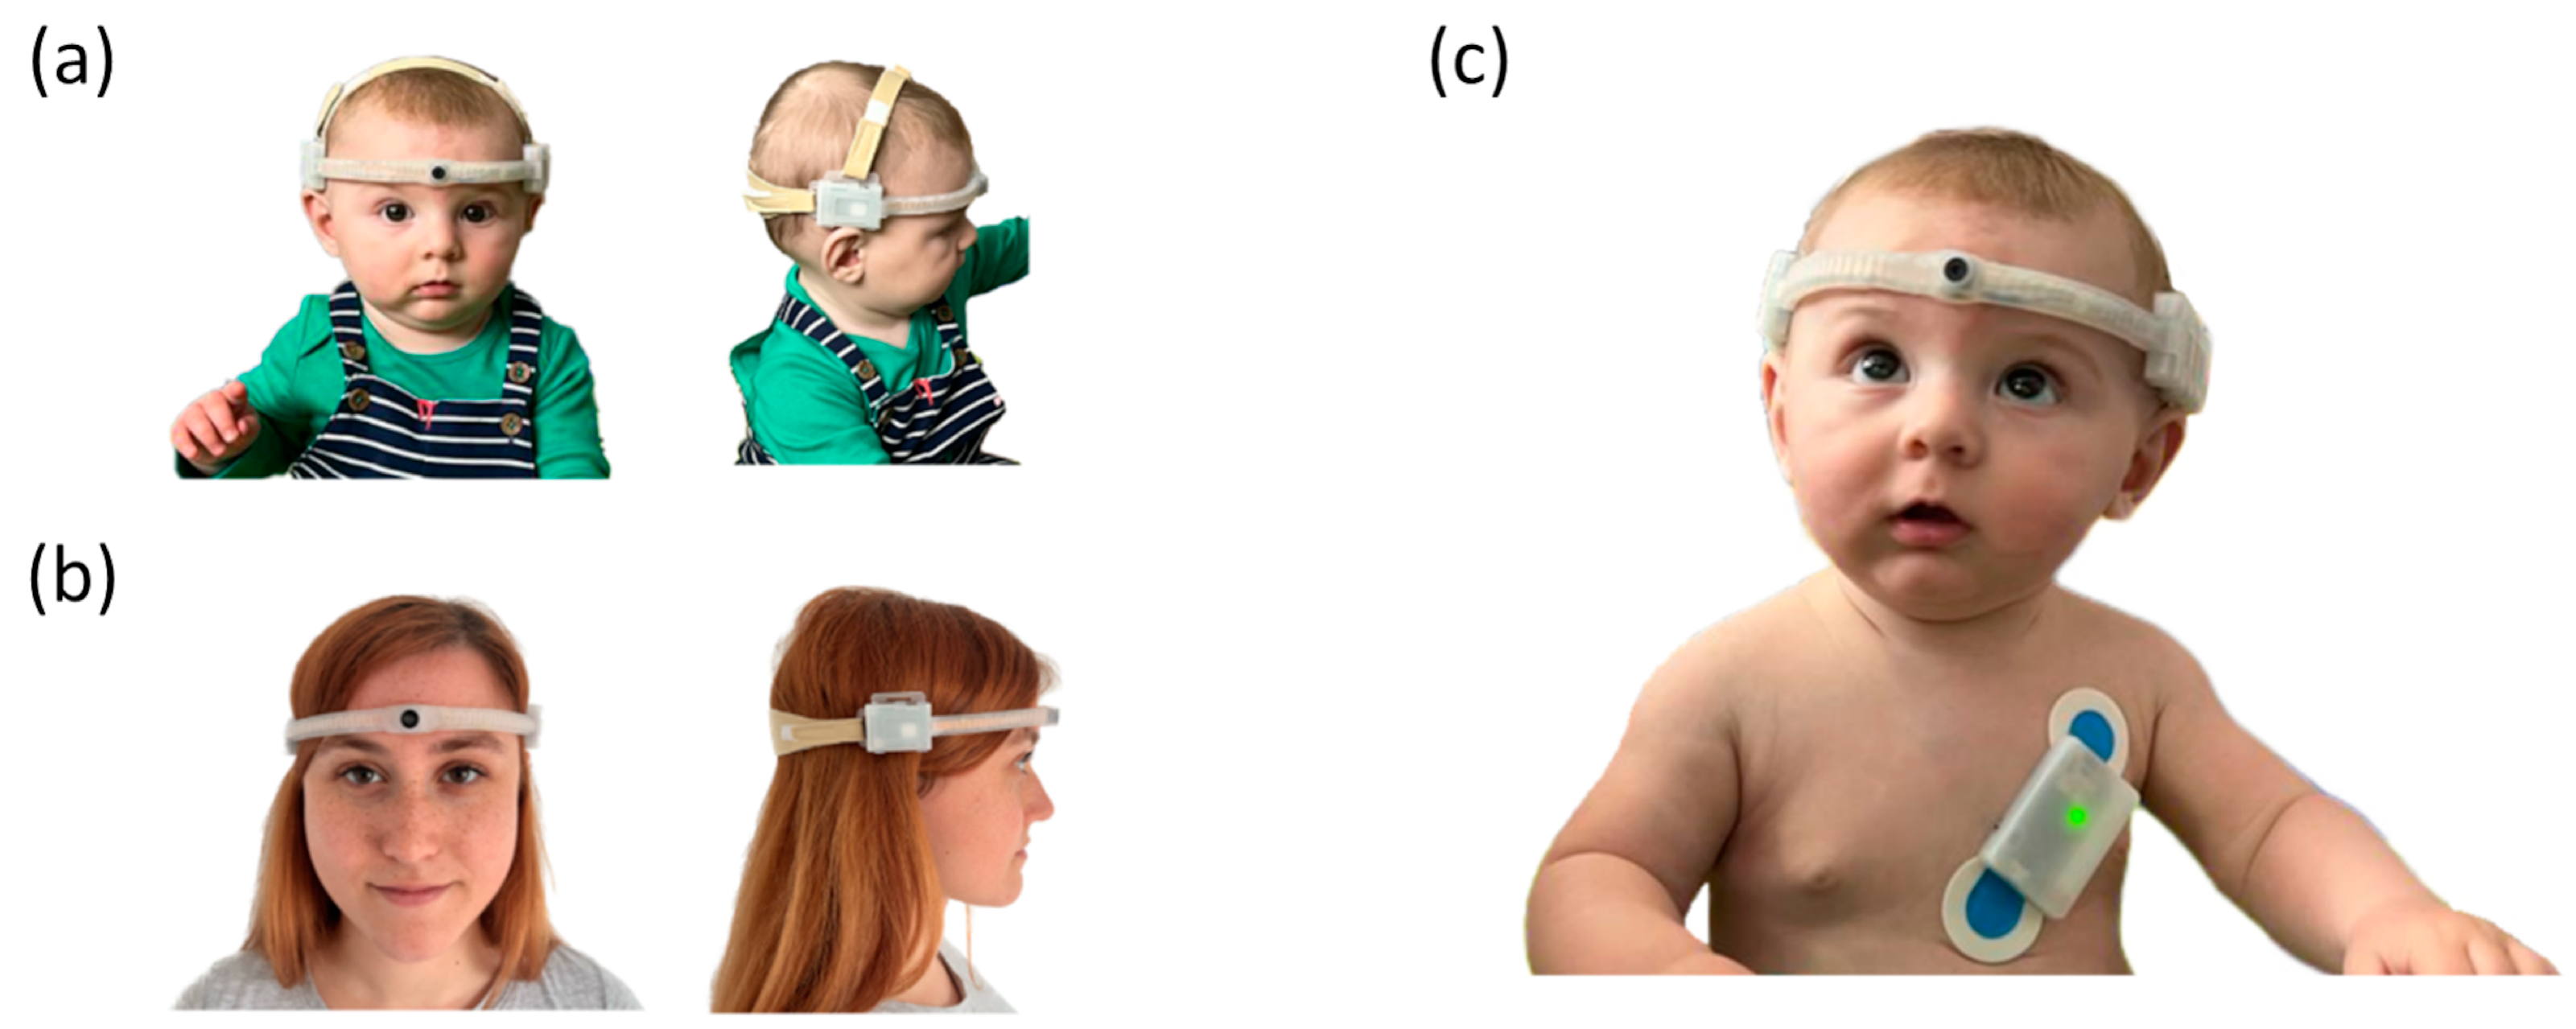
2.2. Head-Mounted Camera
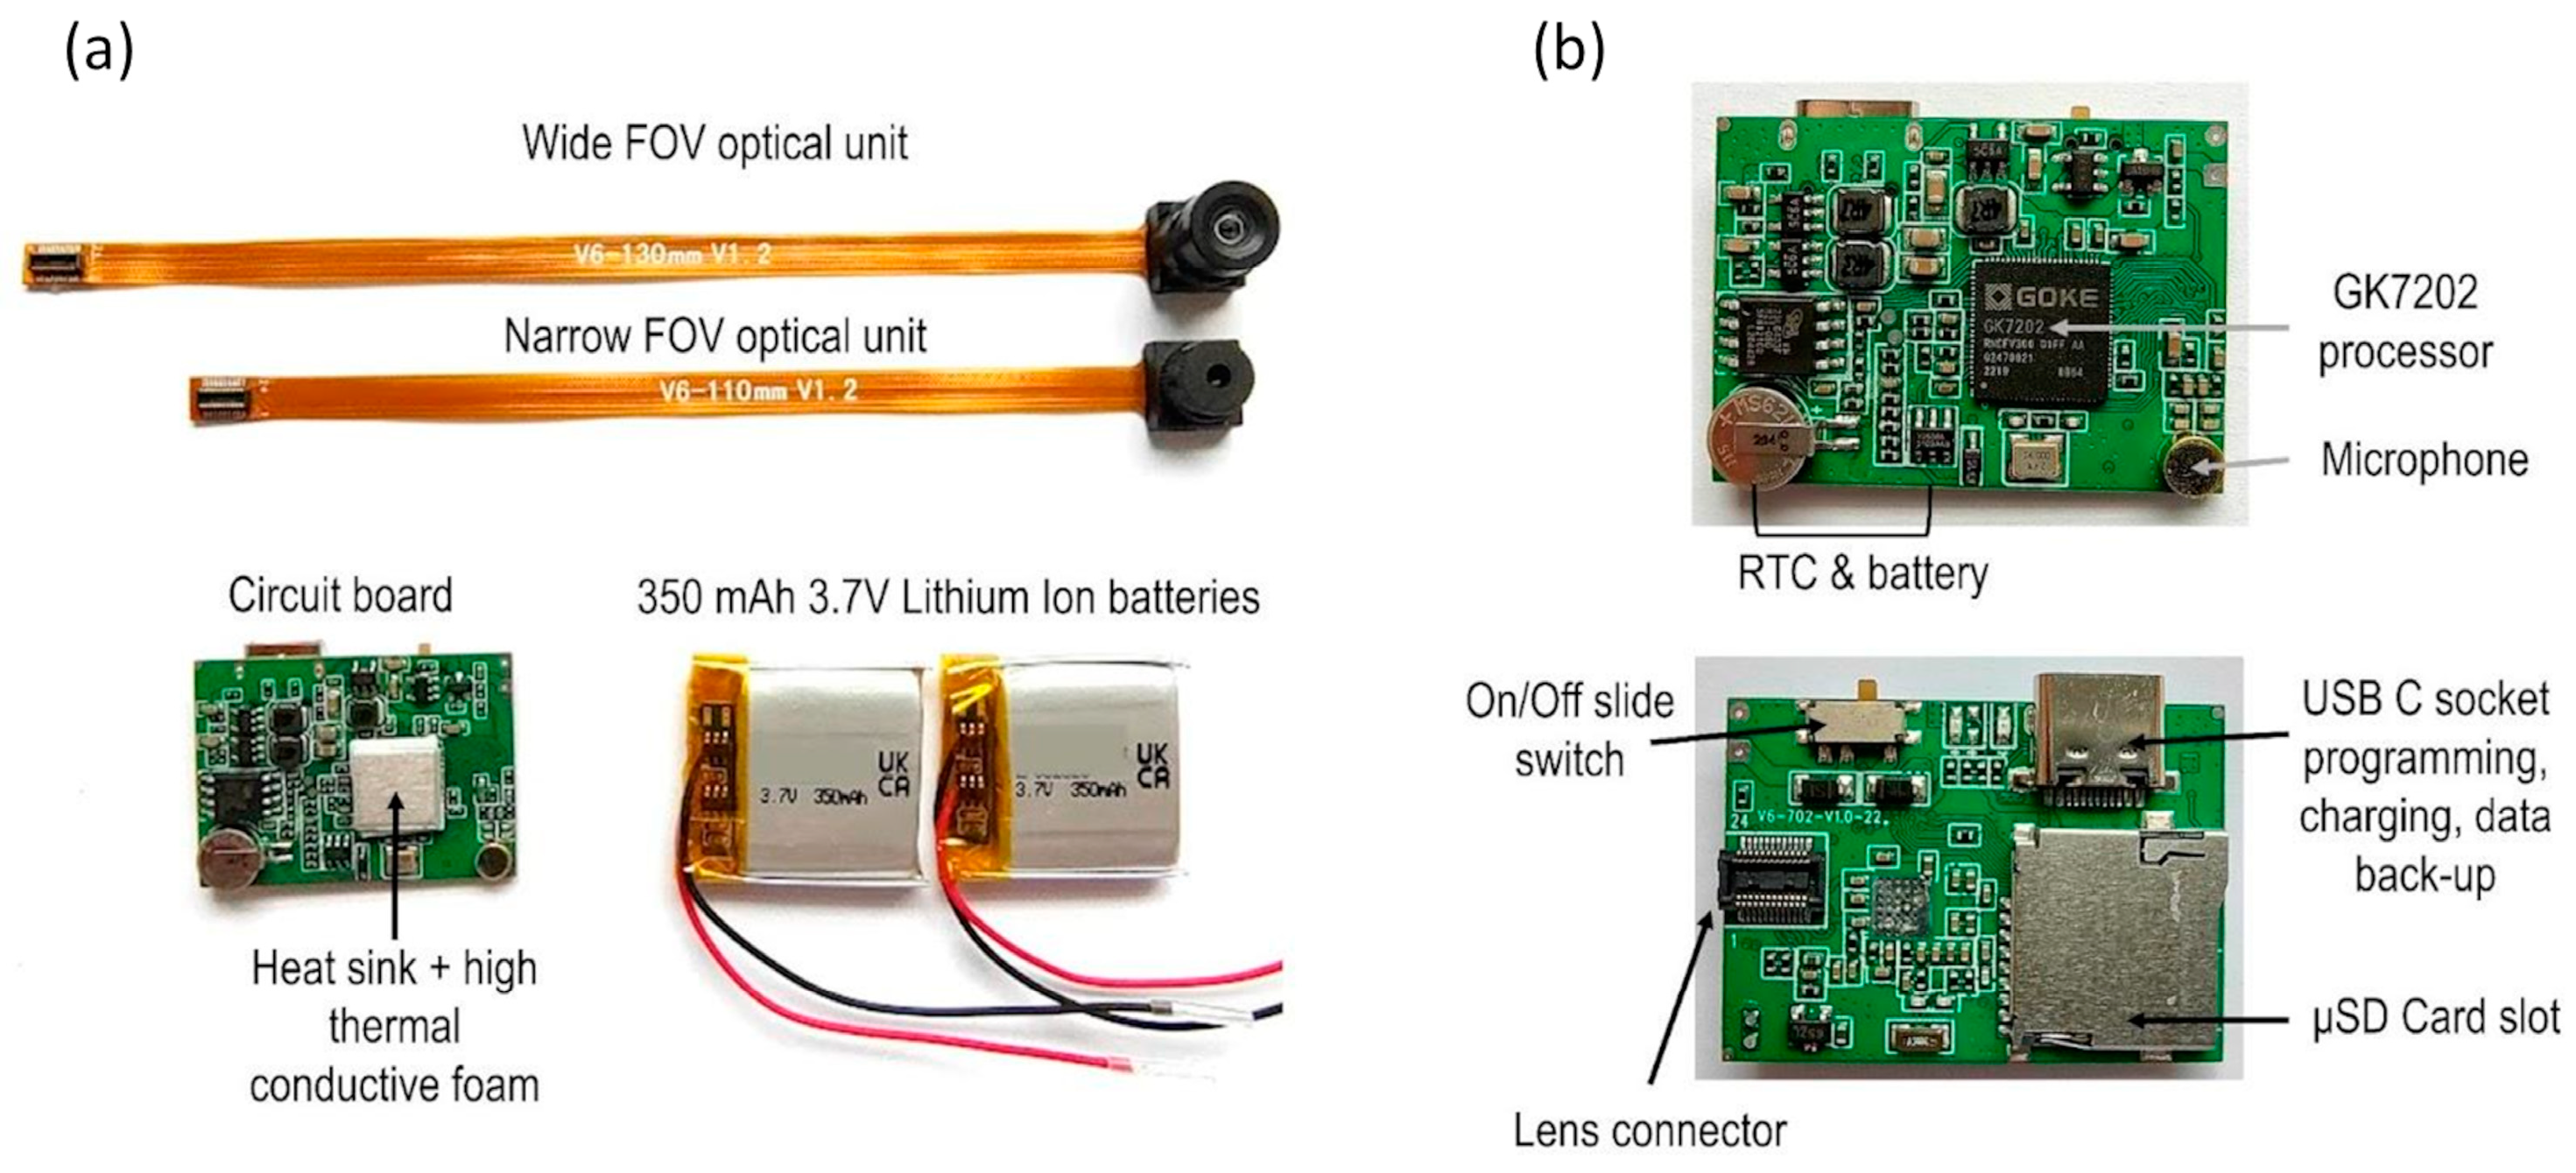
2.2.1. Hardware Design
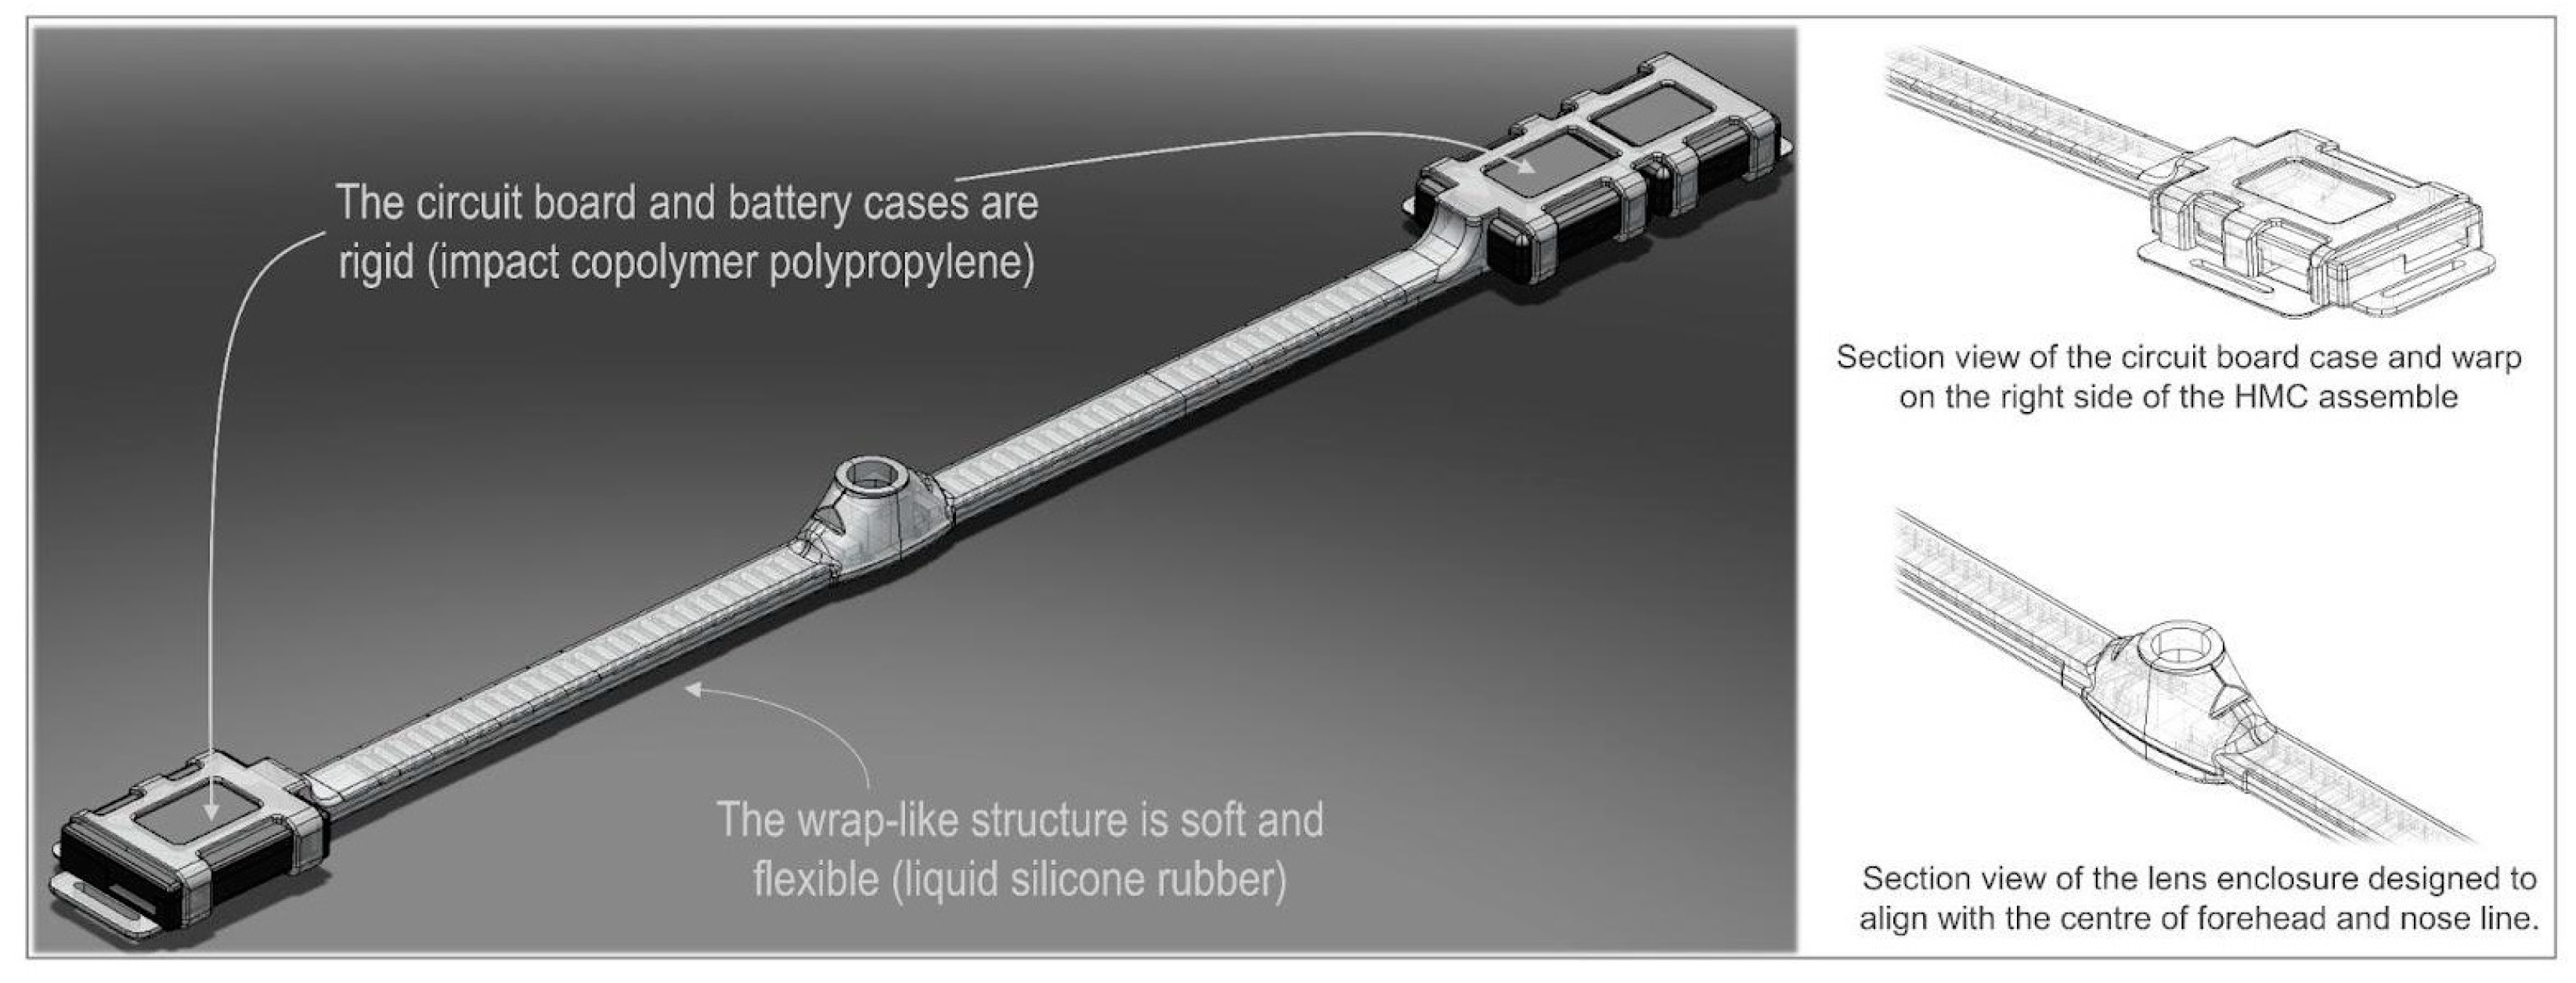
2.2.2. Headset Case Design
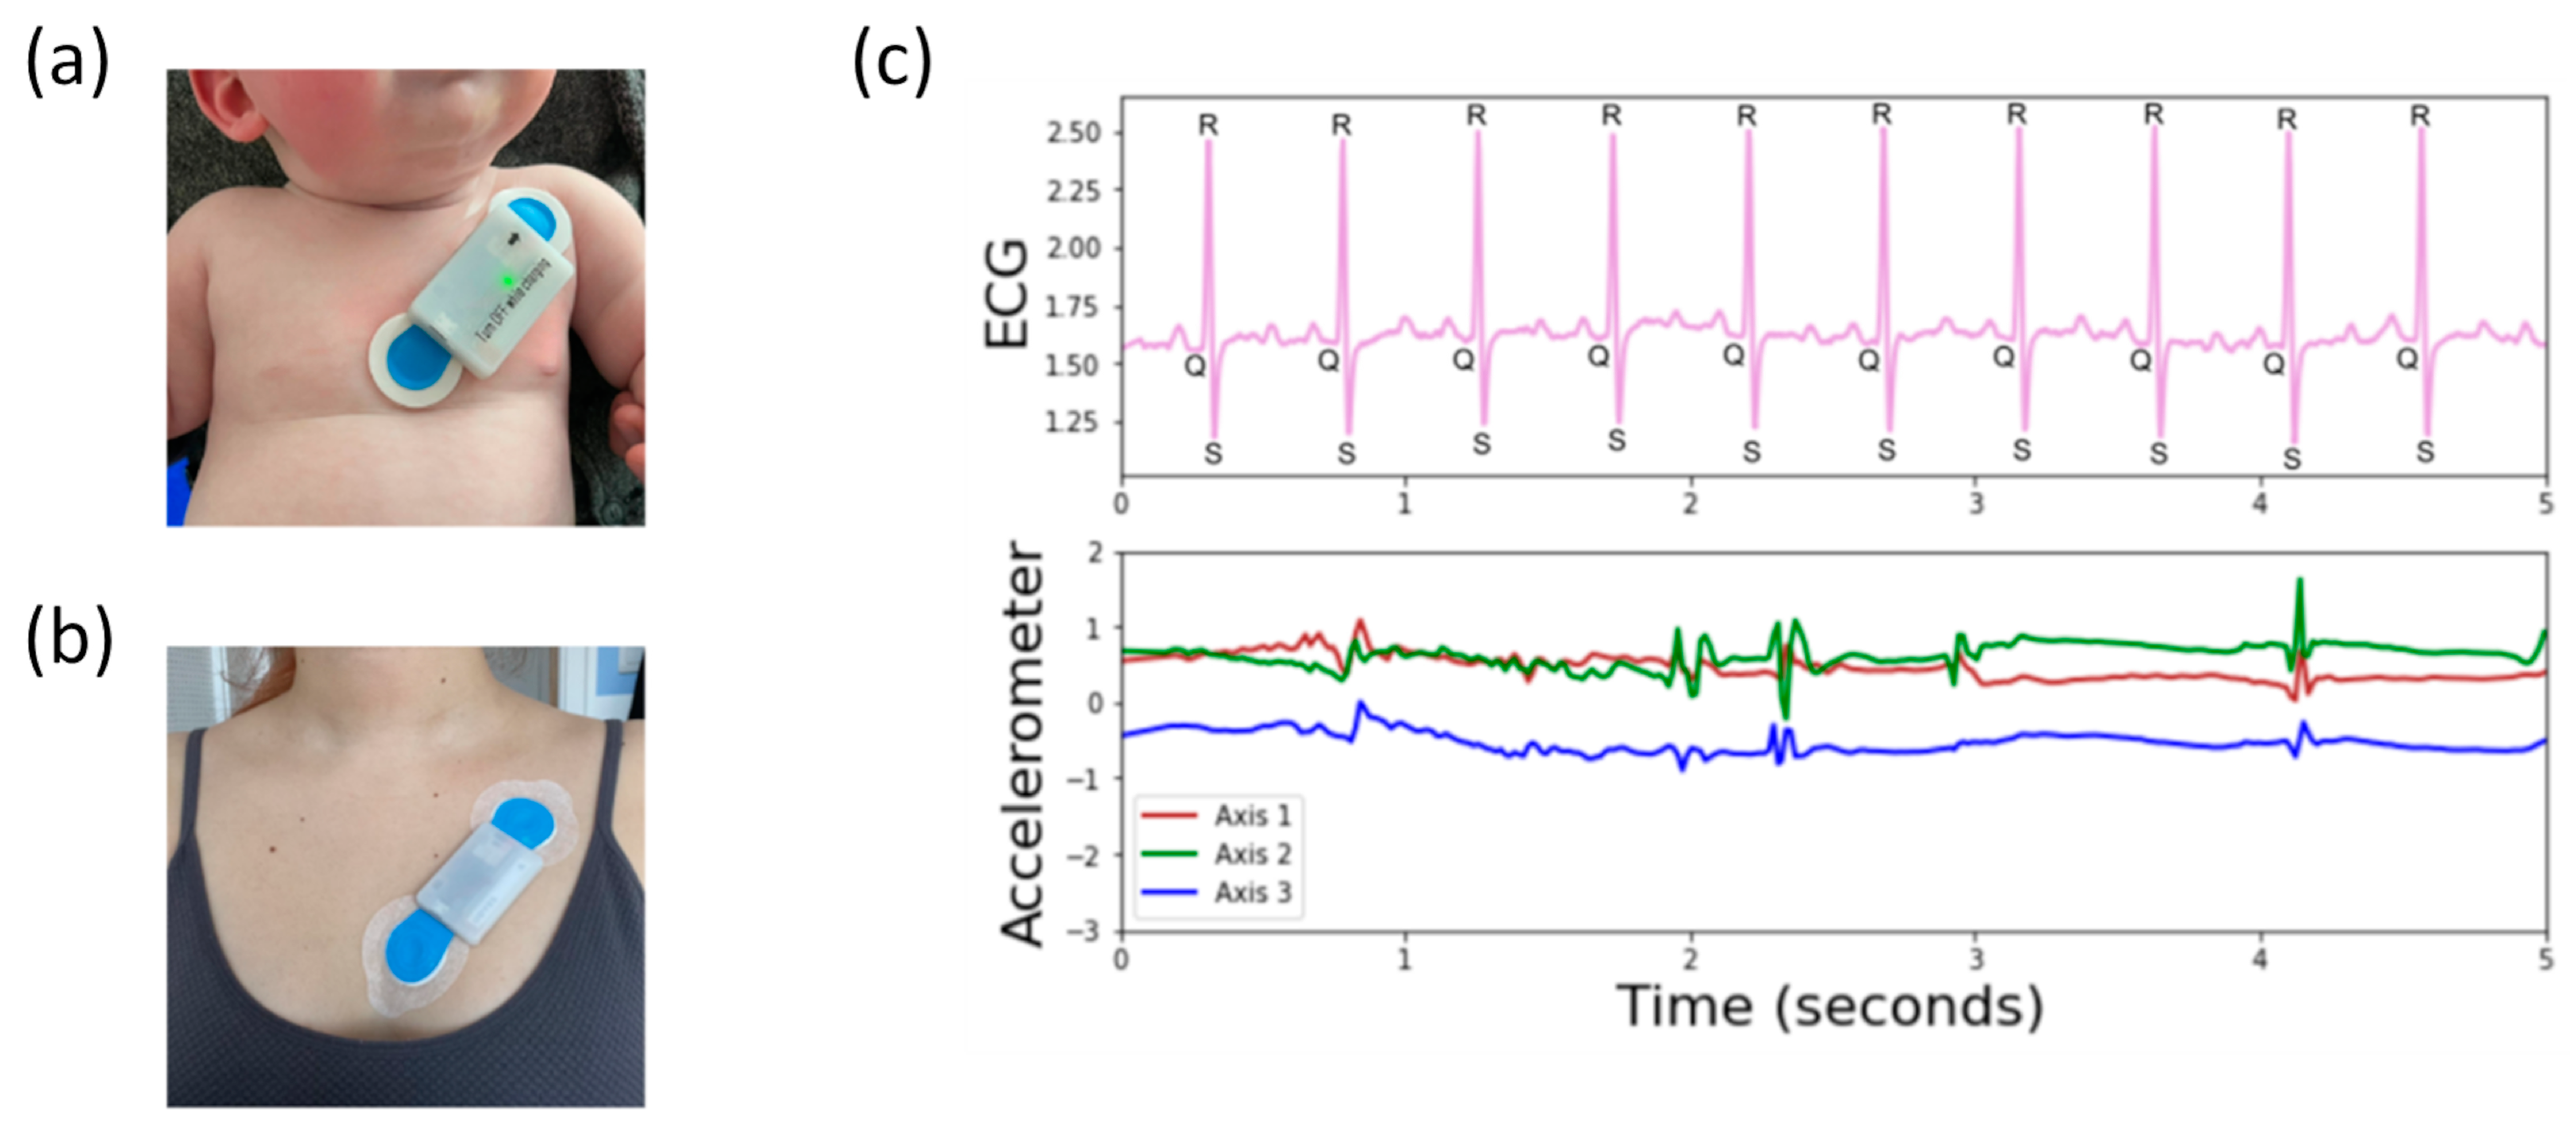
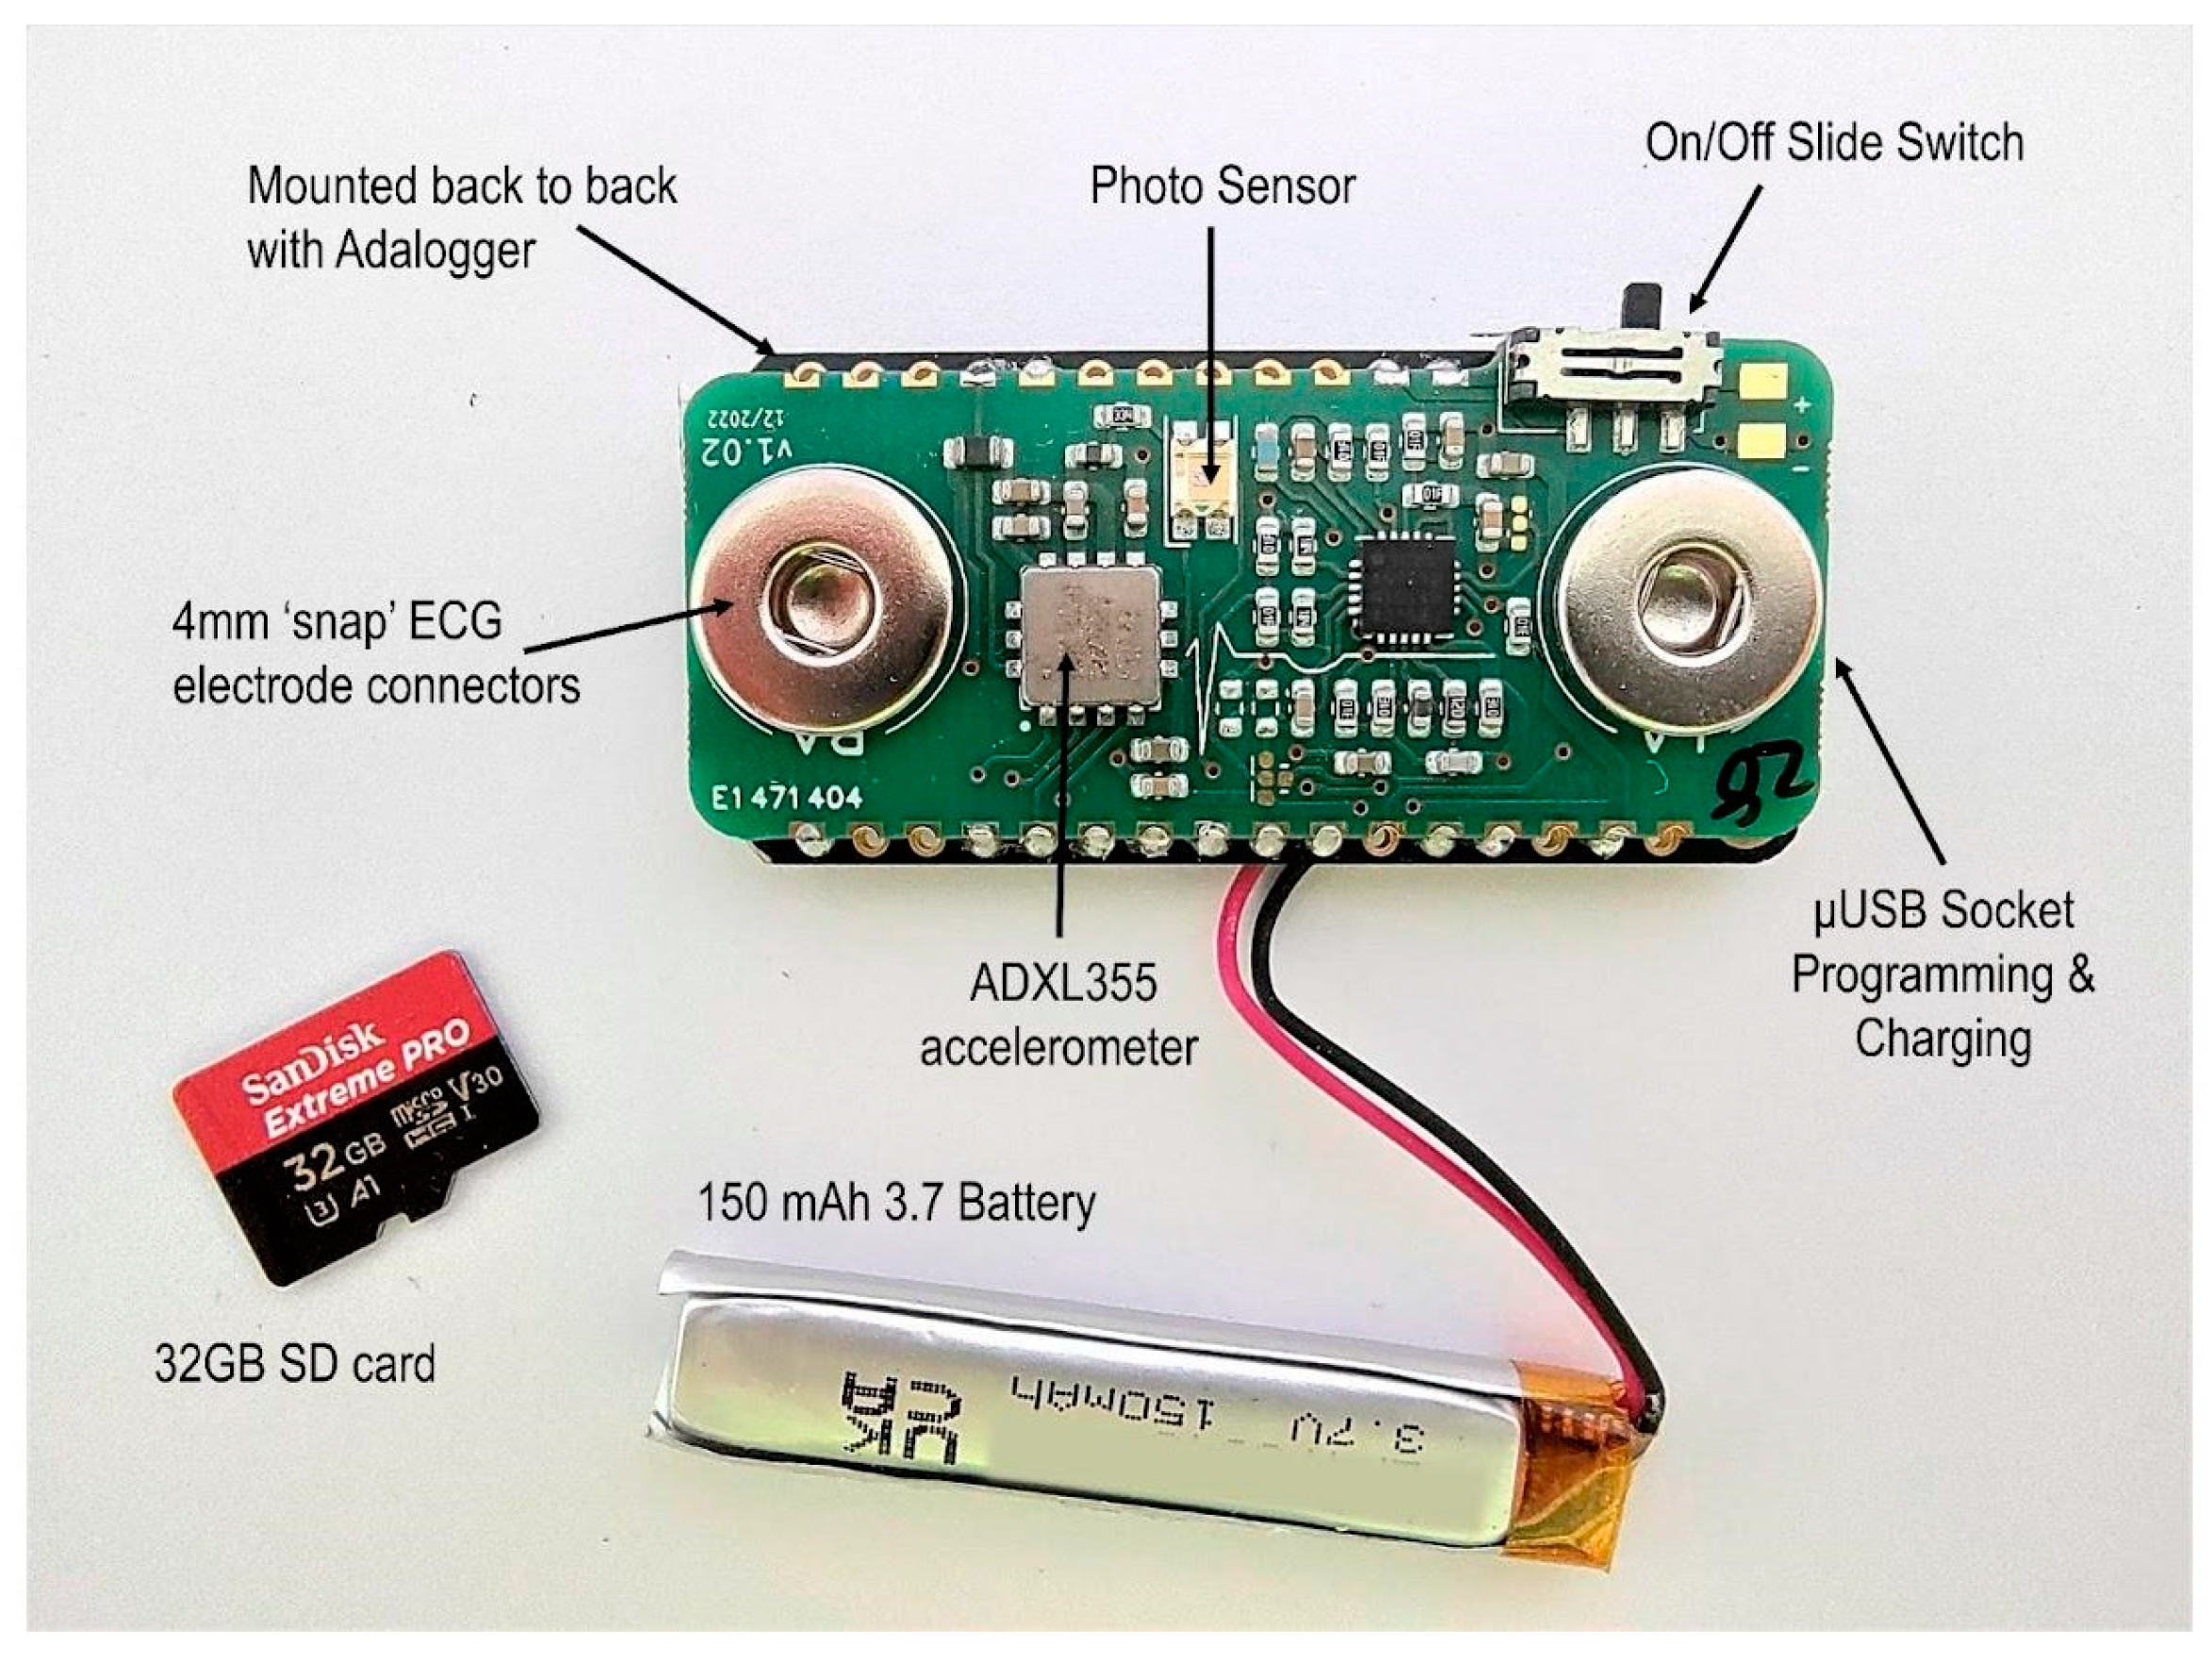
2.3. Body Sensor
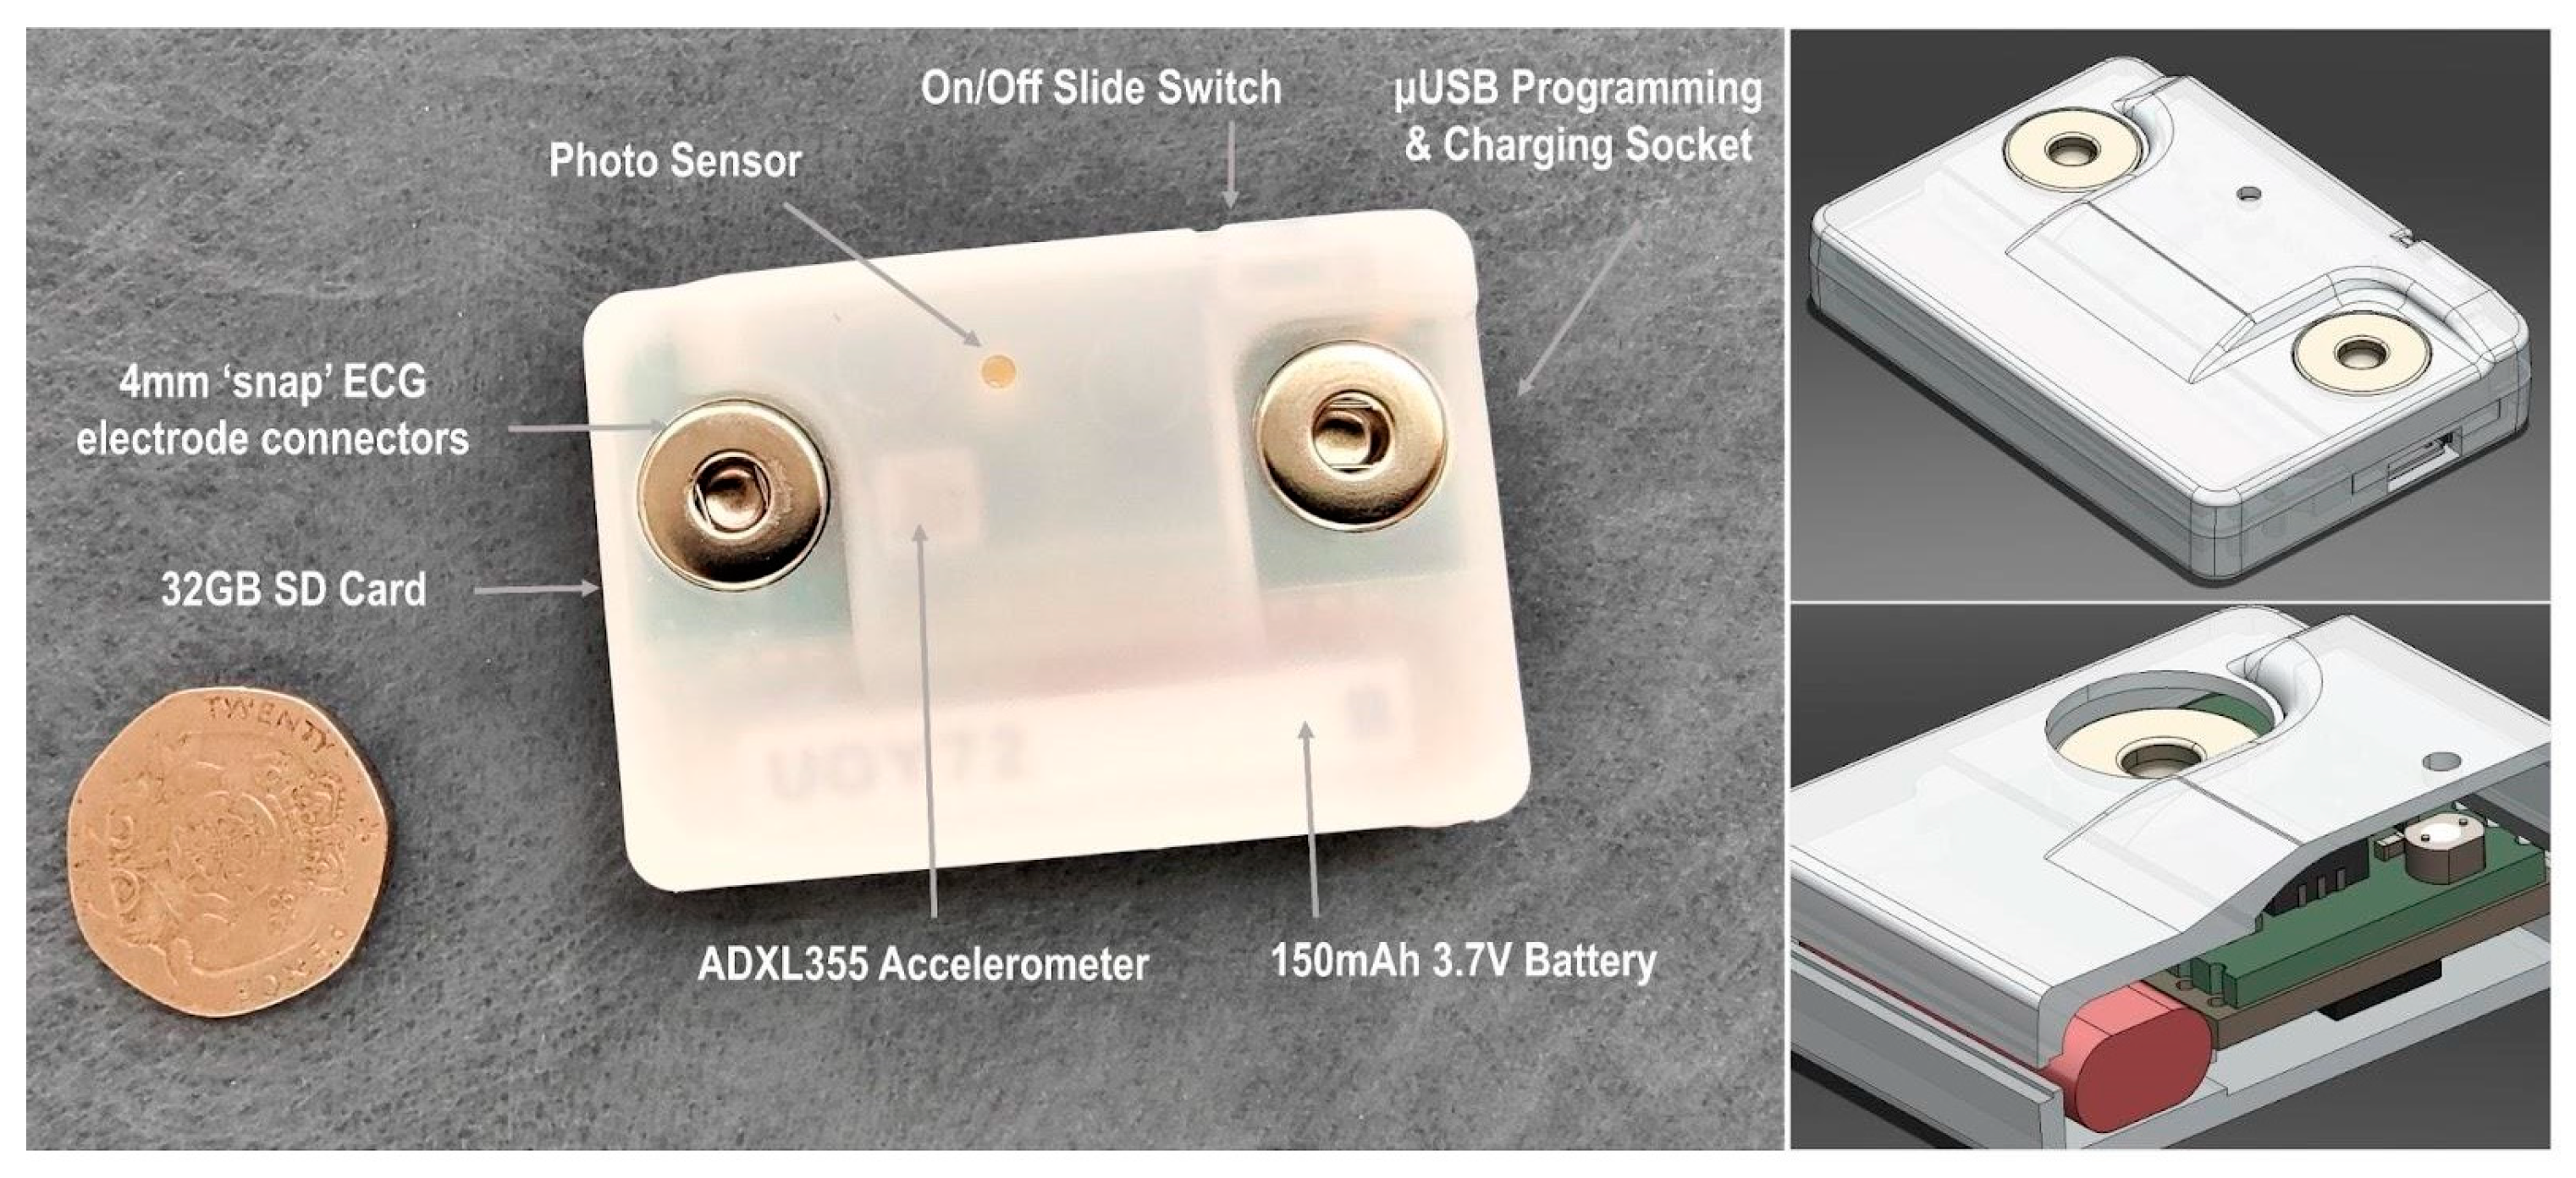
2.3.1. Hardware Design
2.3.2. Firmware Design
2.3.3. Case Design
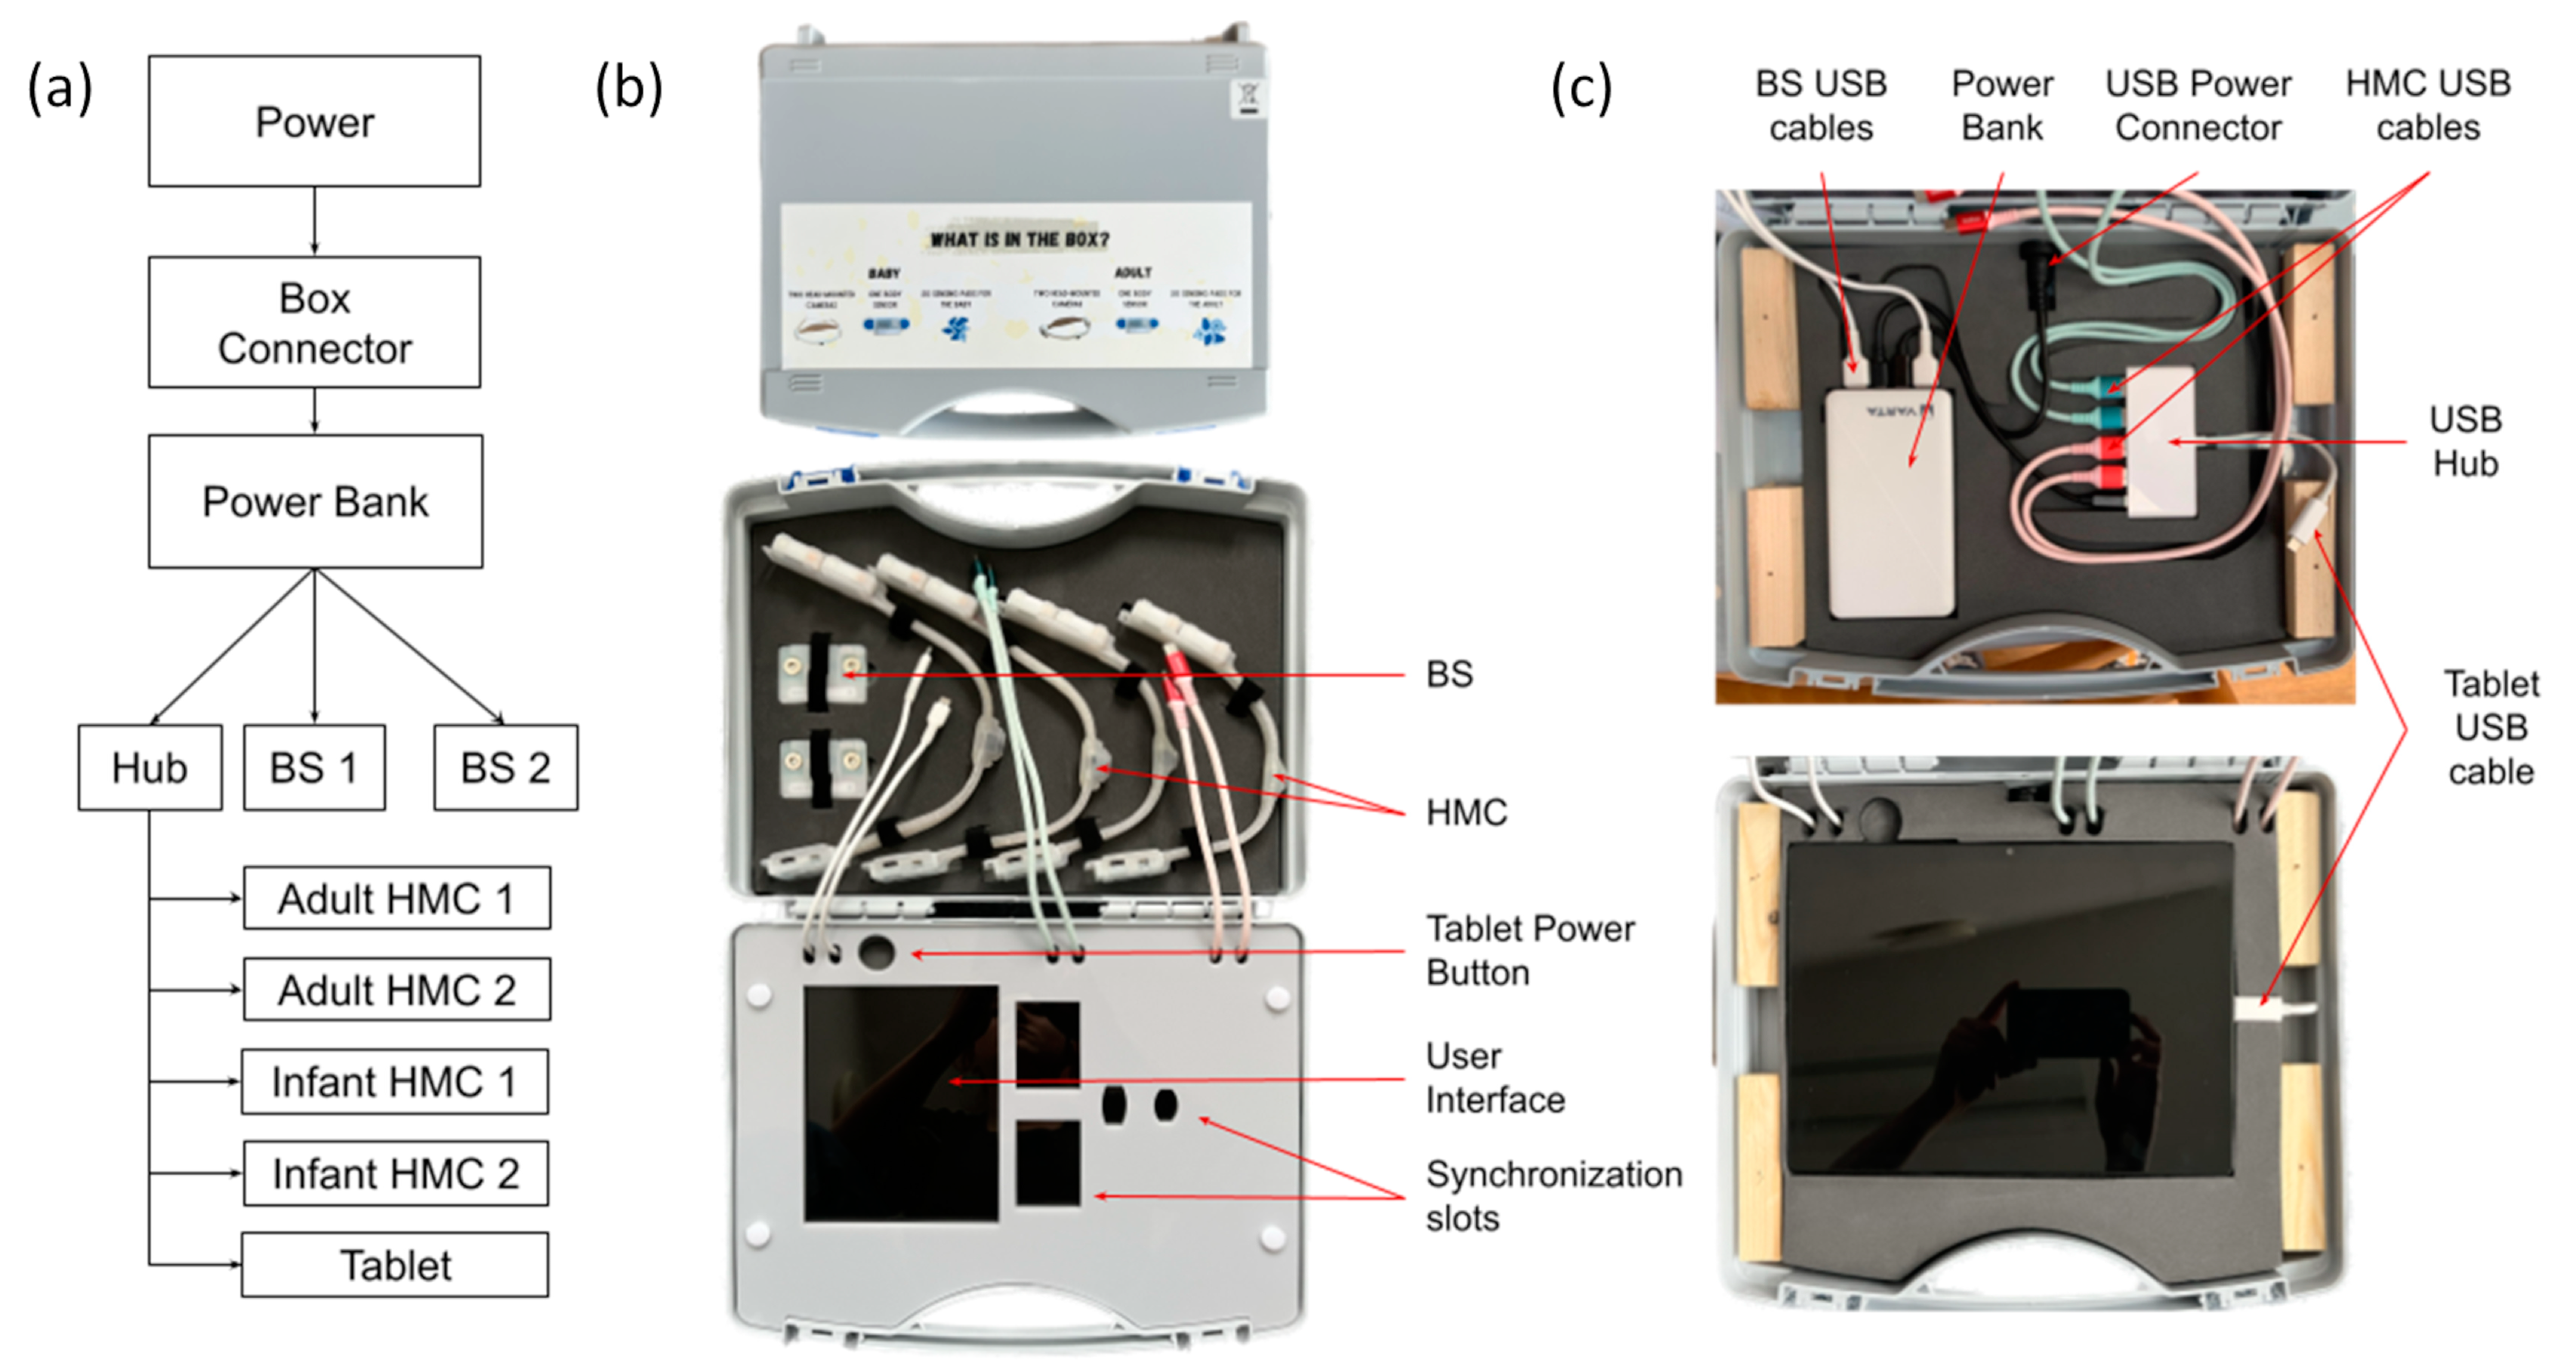
2.4. Base Unit
2.5. Validation and User Experience of the EgoActive Hardware
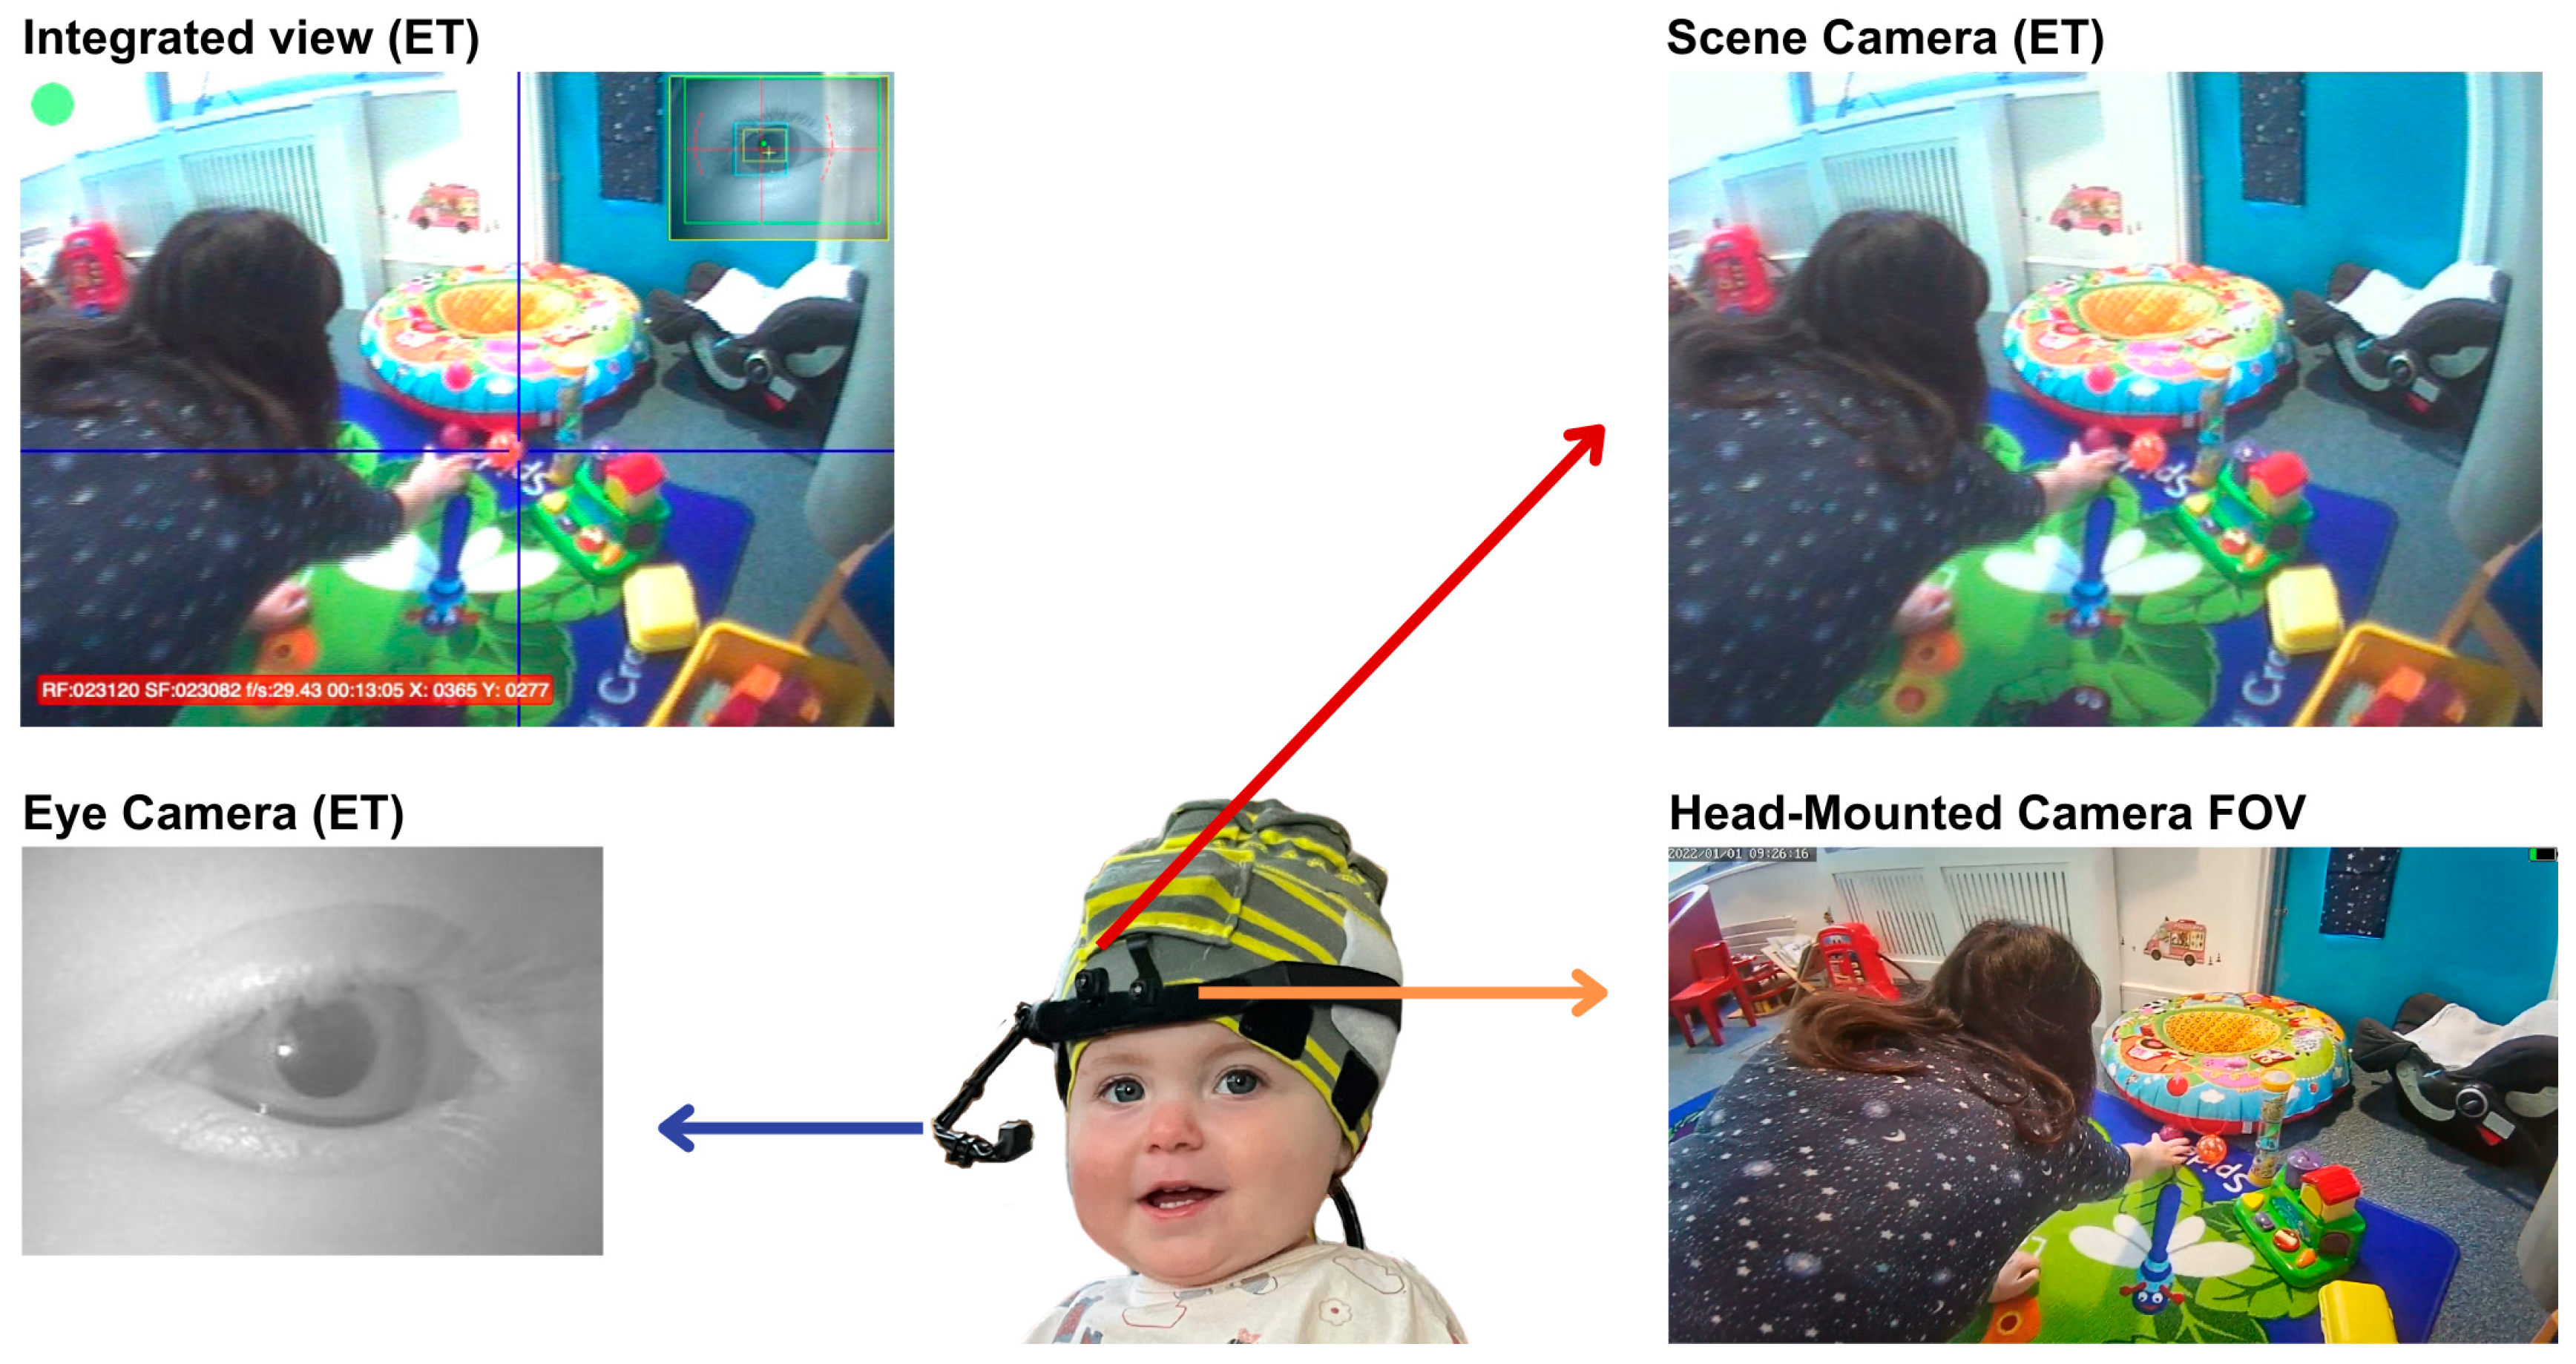
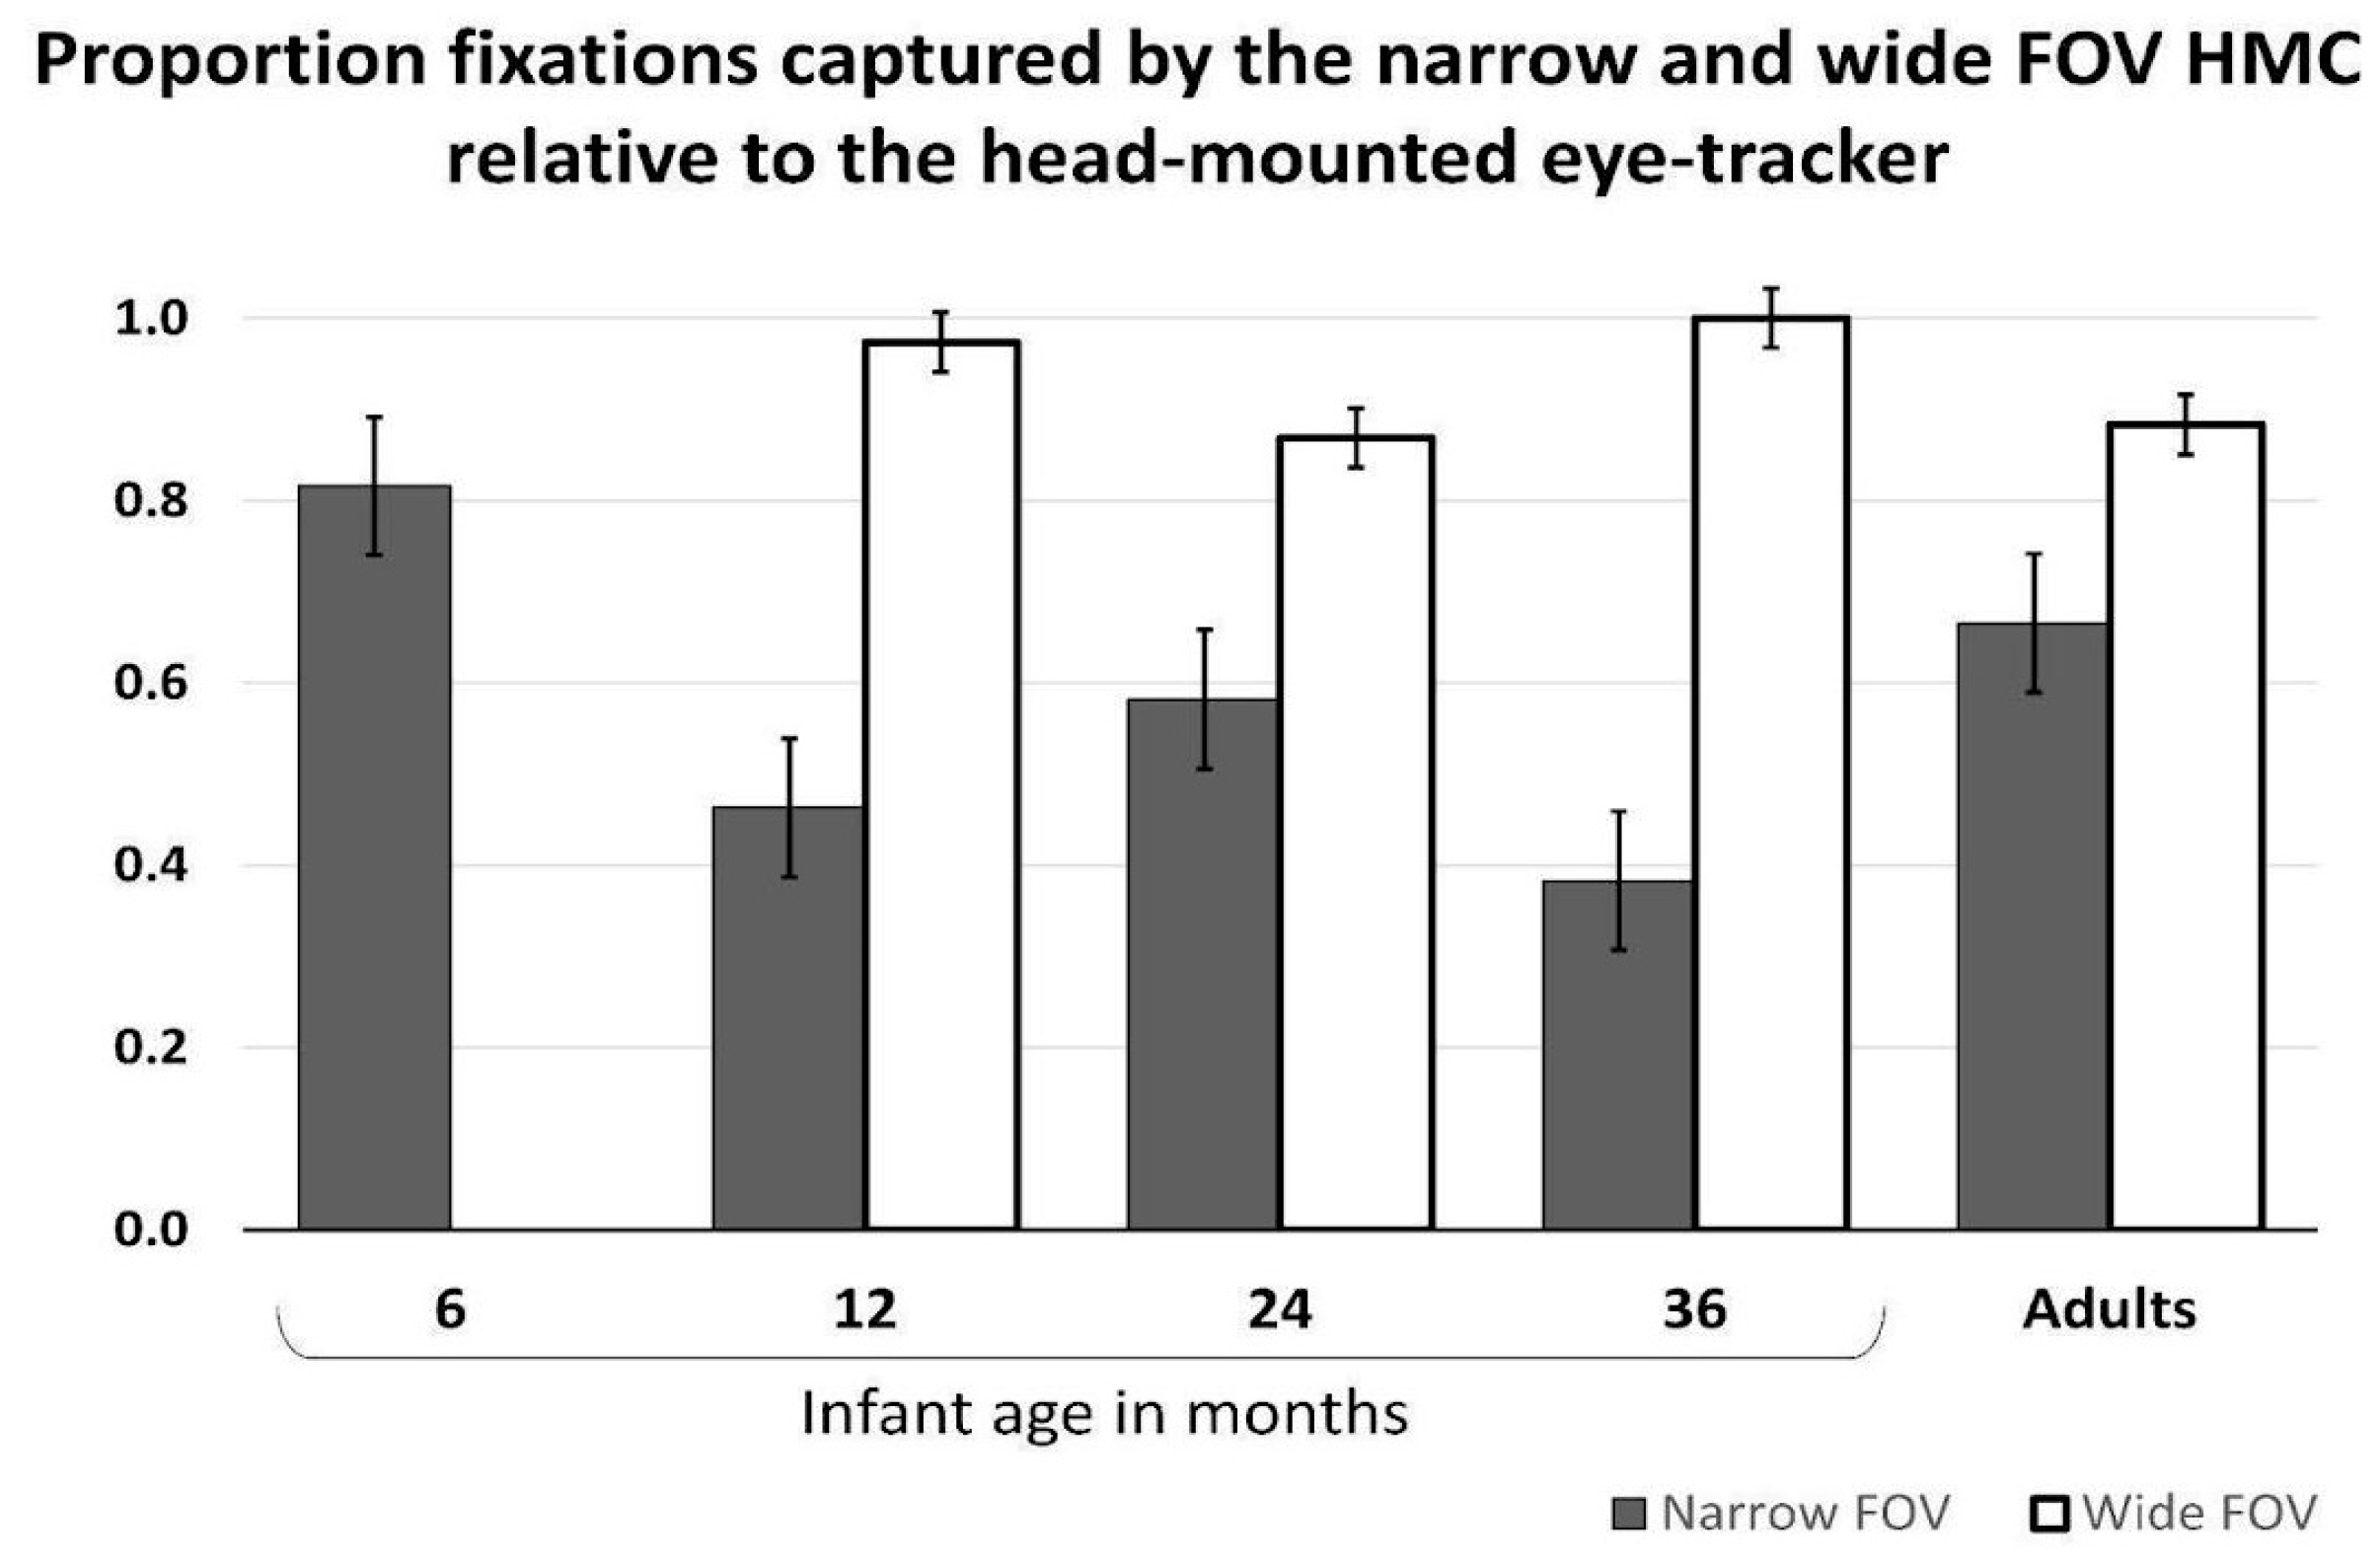
2.5.1. Validation Studies of EgoActive Head-Mounted Camera
Suitability of the FOV
User Experience
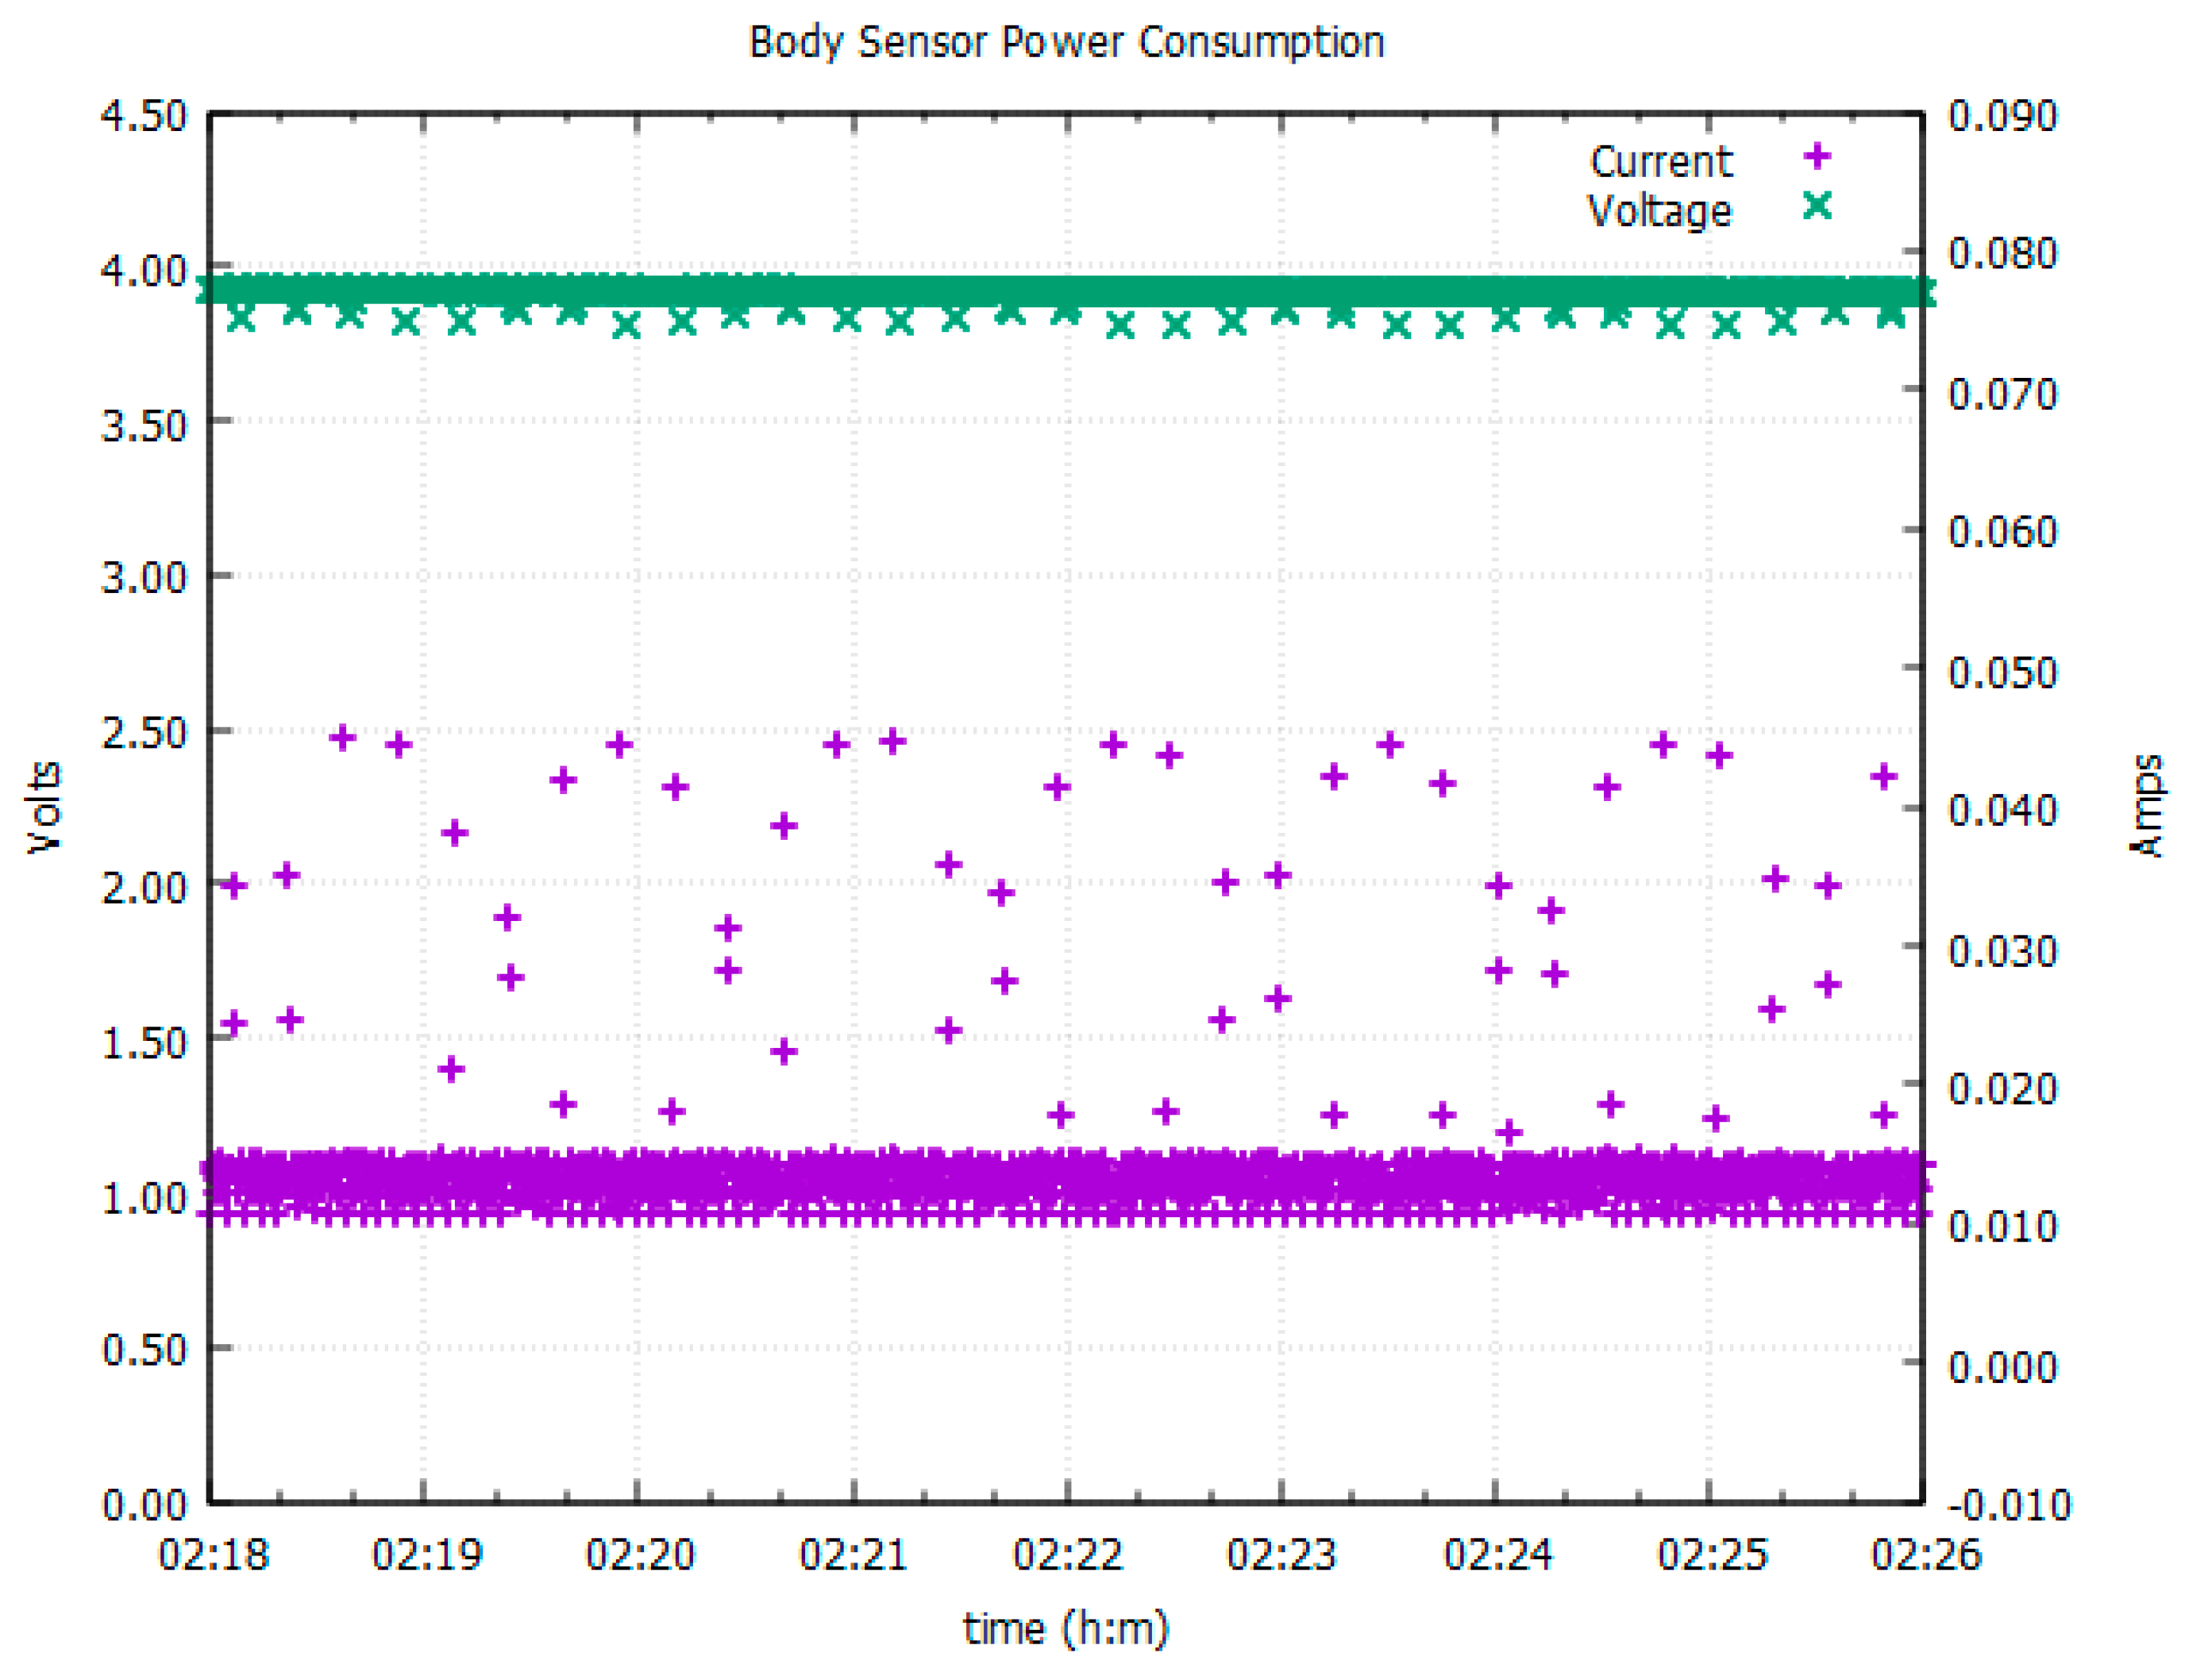
2.5.2. Validation Studies of EgoActive Body Sensor
Comparison with Commercially Available Wearable Sensors—Short Recordings
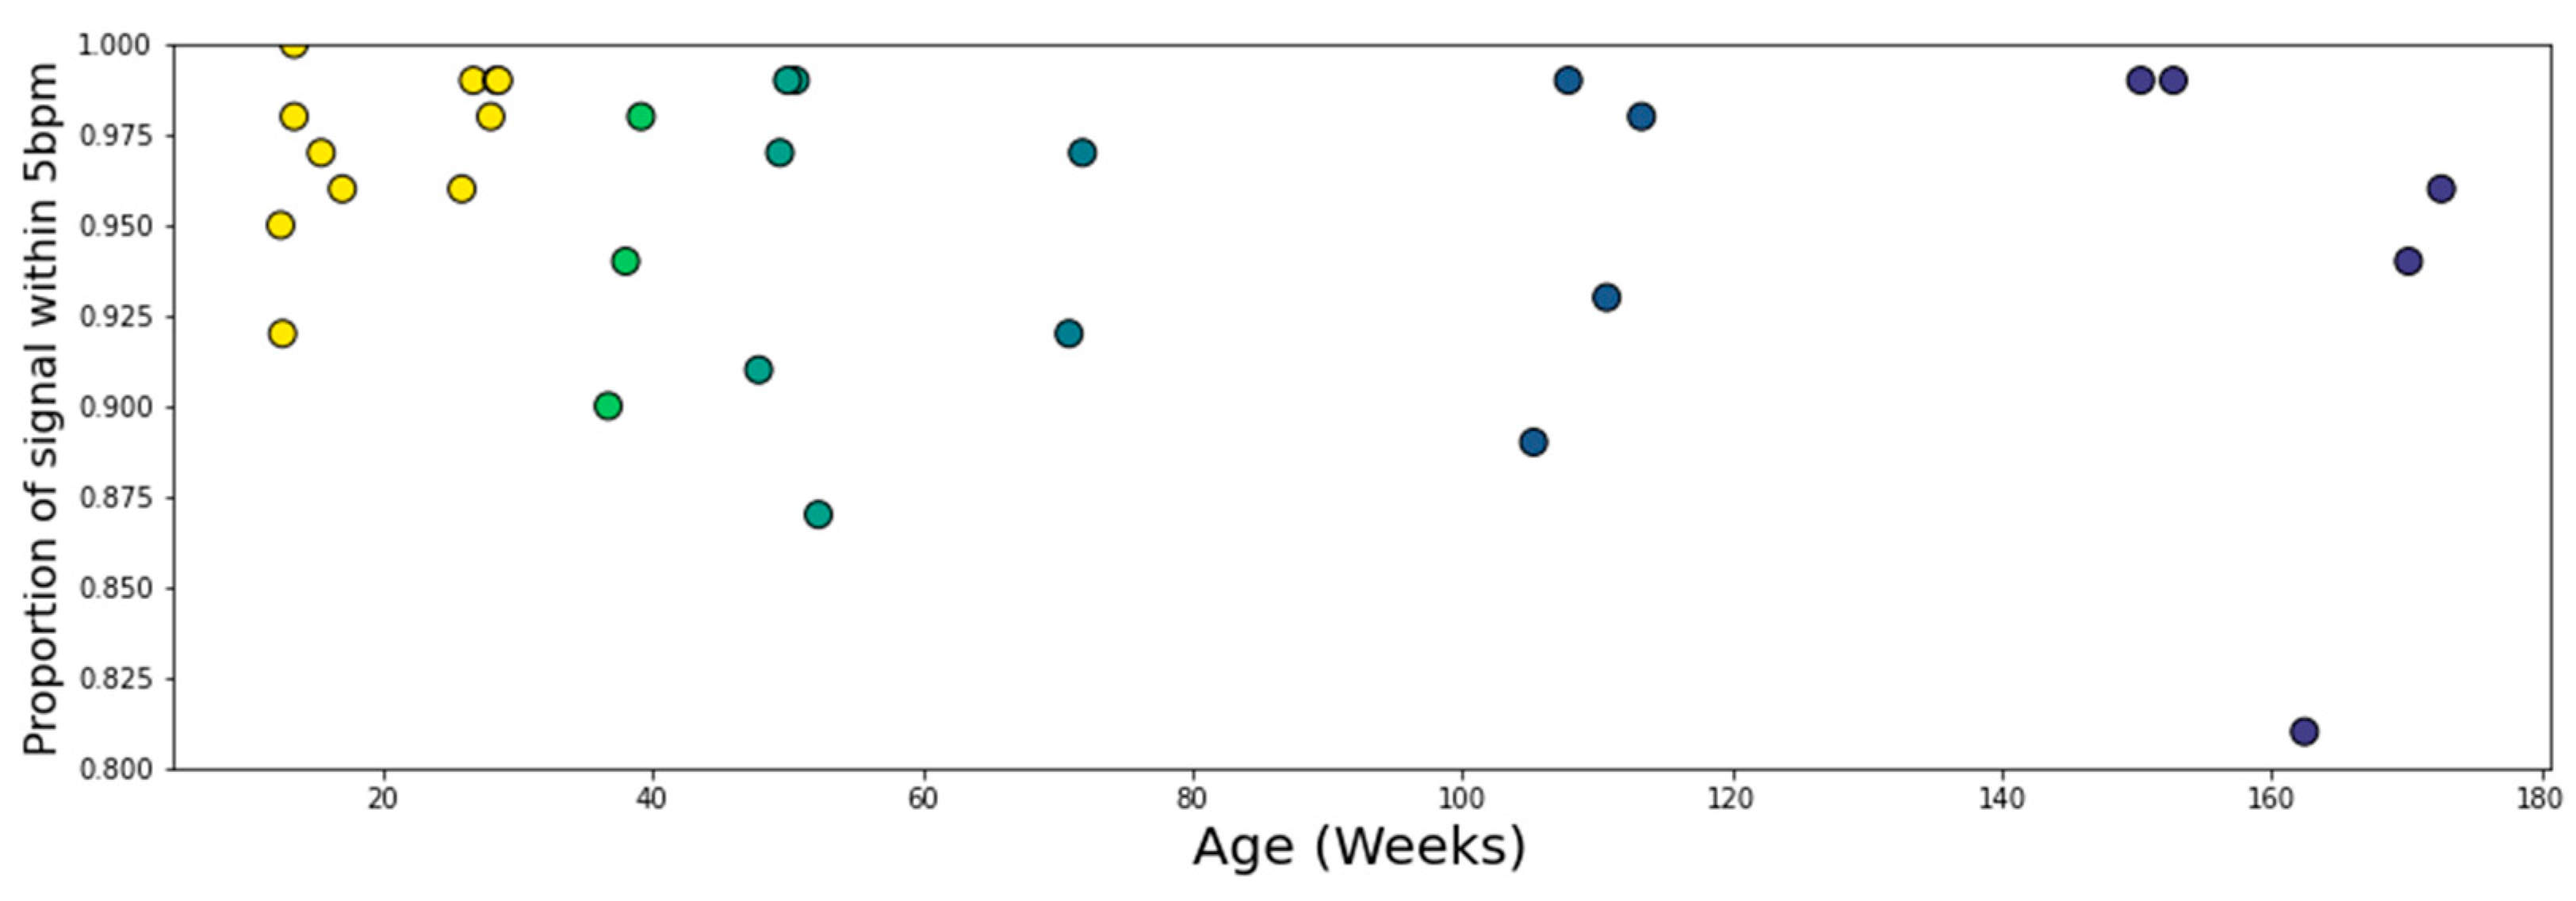
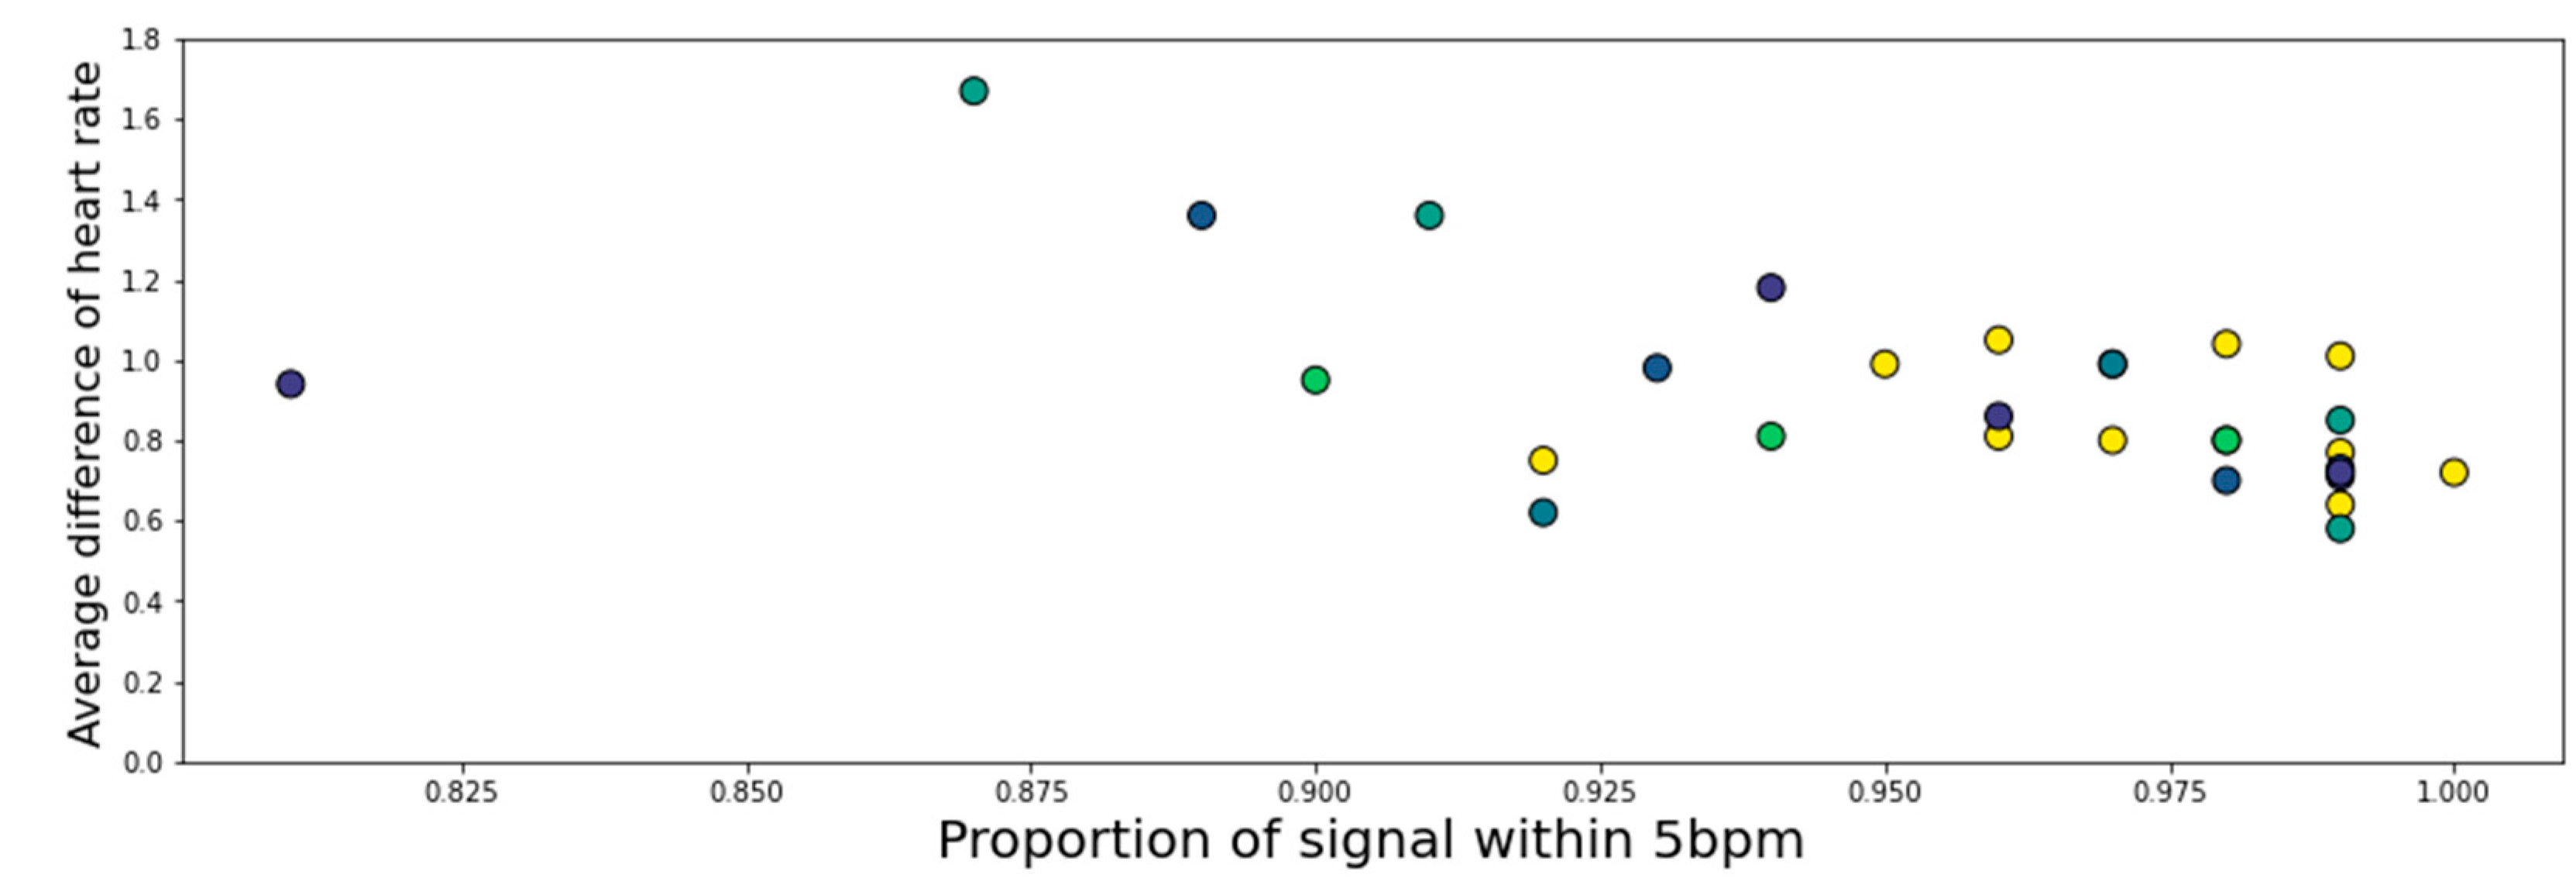
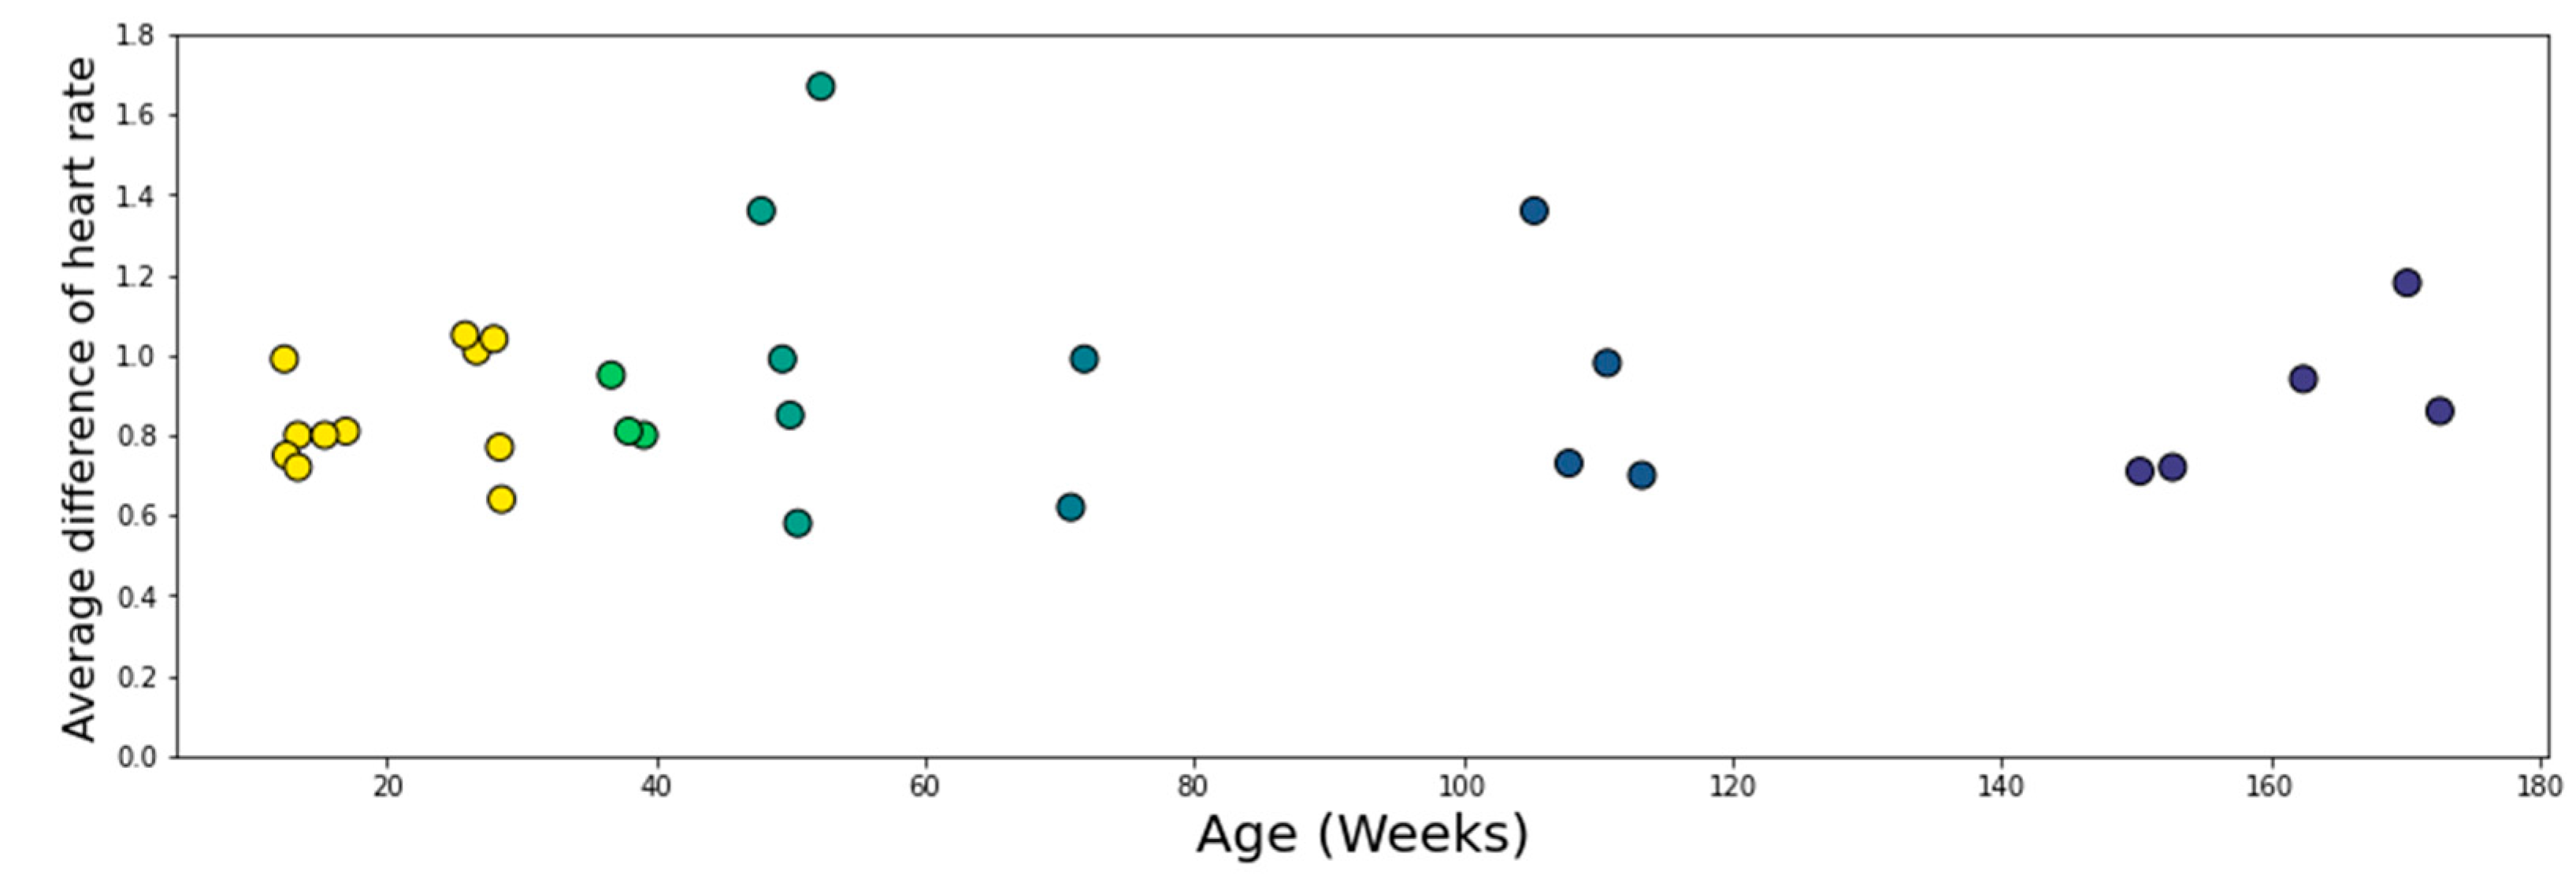
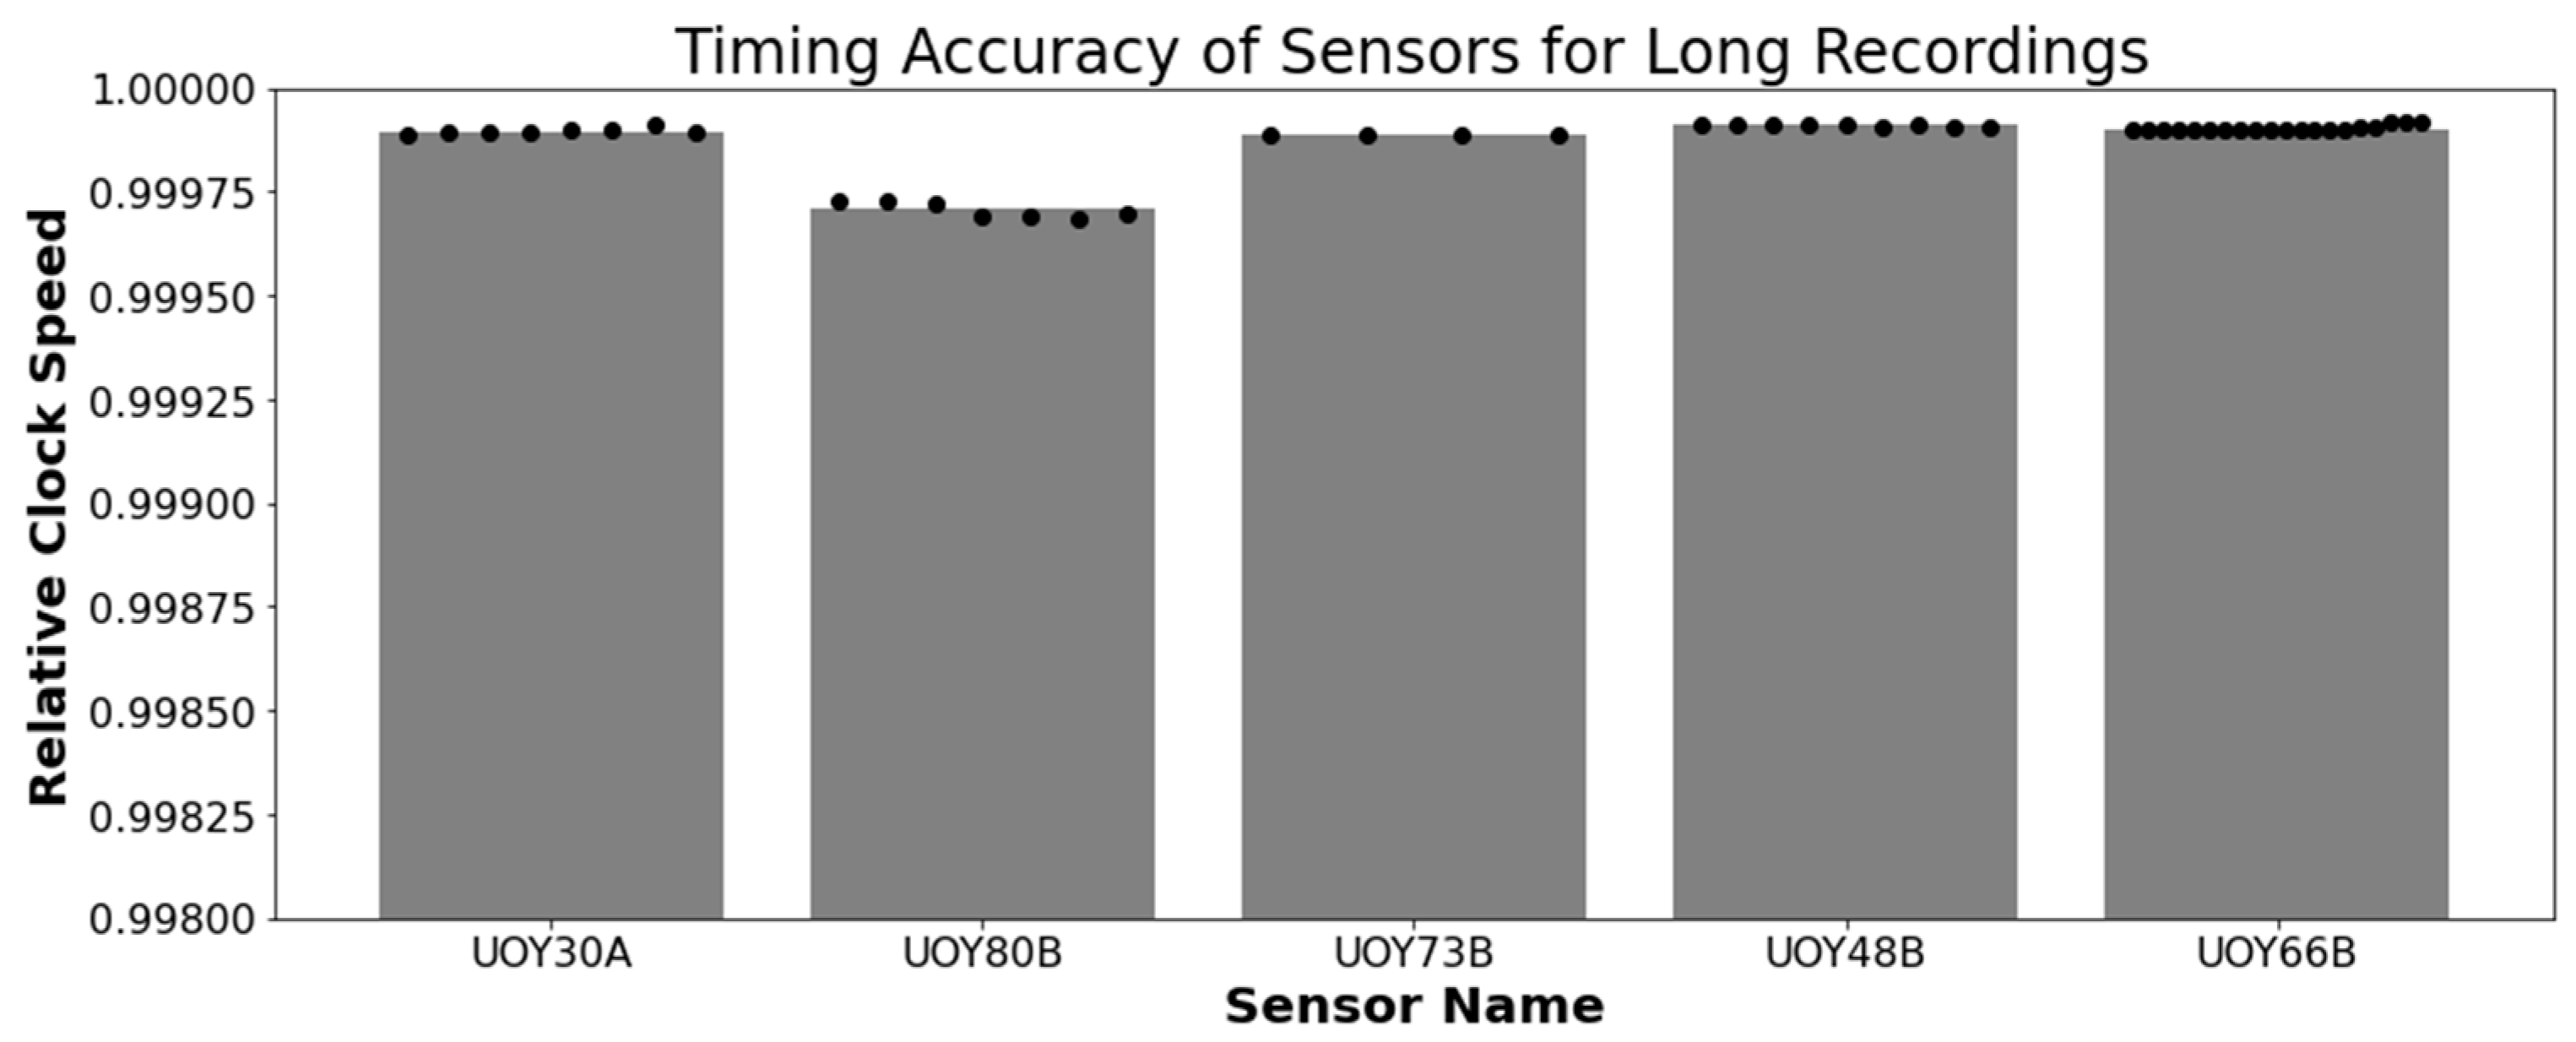
Comparison with ECG Simulator—Long Recordings
User Experience
3. Software
3.1. Android App for Device Synchronization and Data Backup
3.1.1. Design of the Synchronization Signal
3.1.2. Data Backup
3.2. Software for Preprocessing Raw Data
3.2.1. Software for Temporal Synchronization of HMC and Body Sensor Data
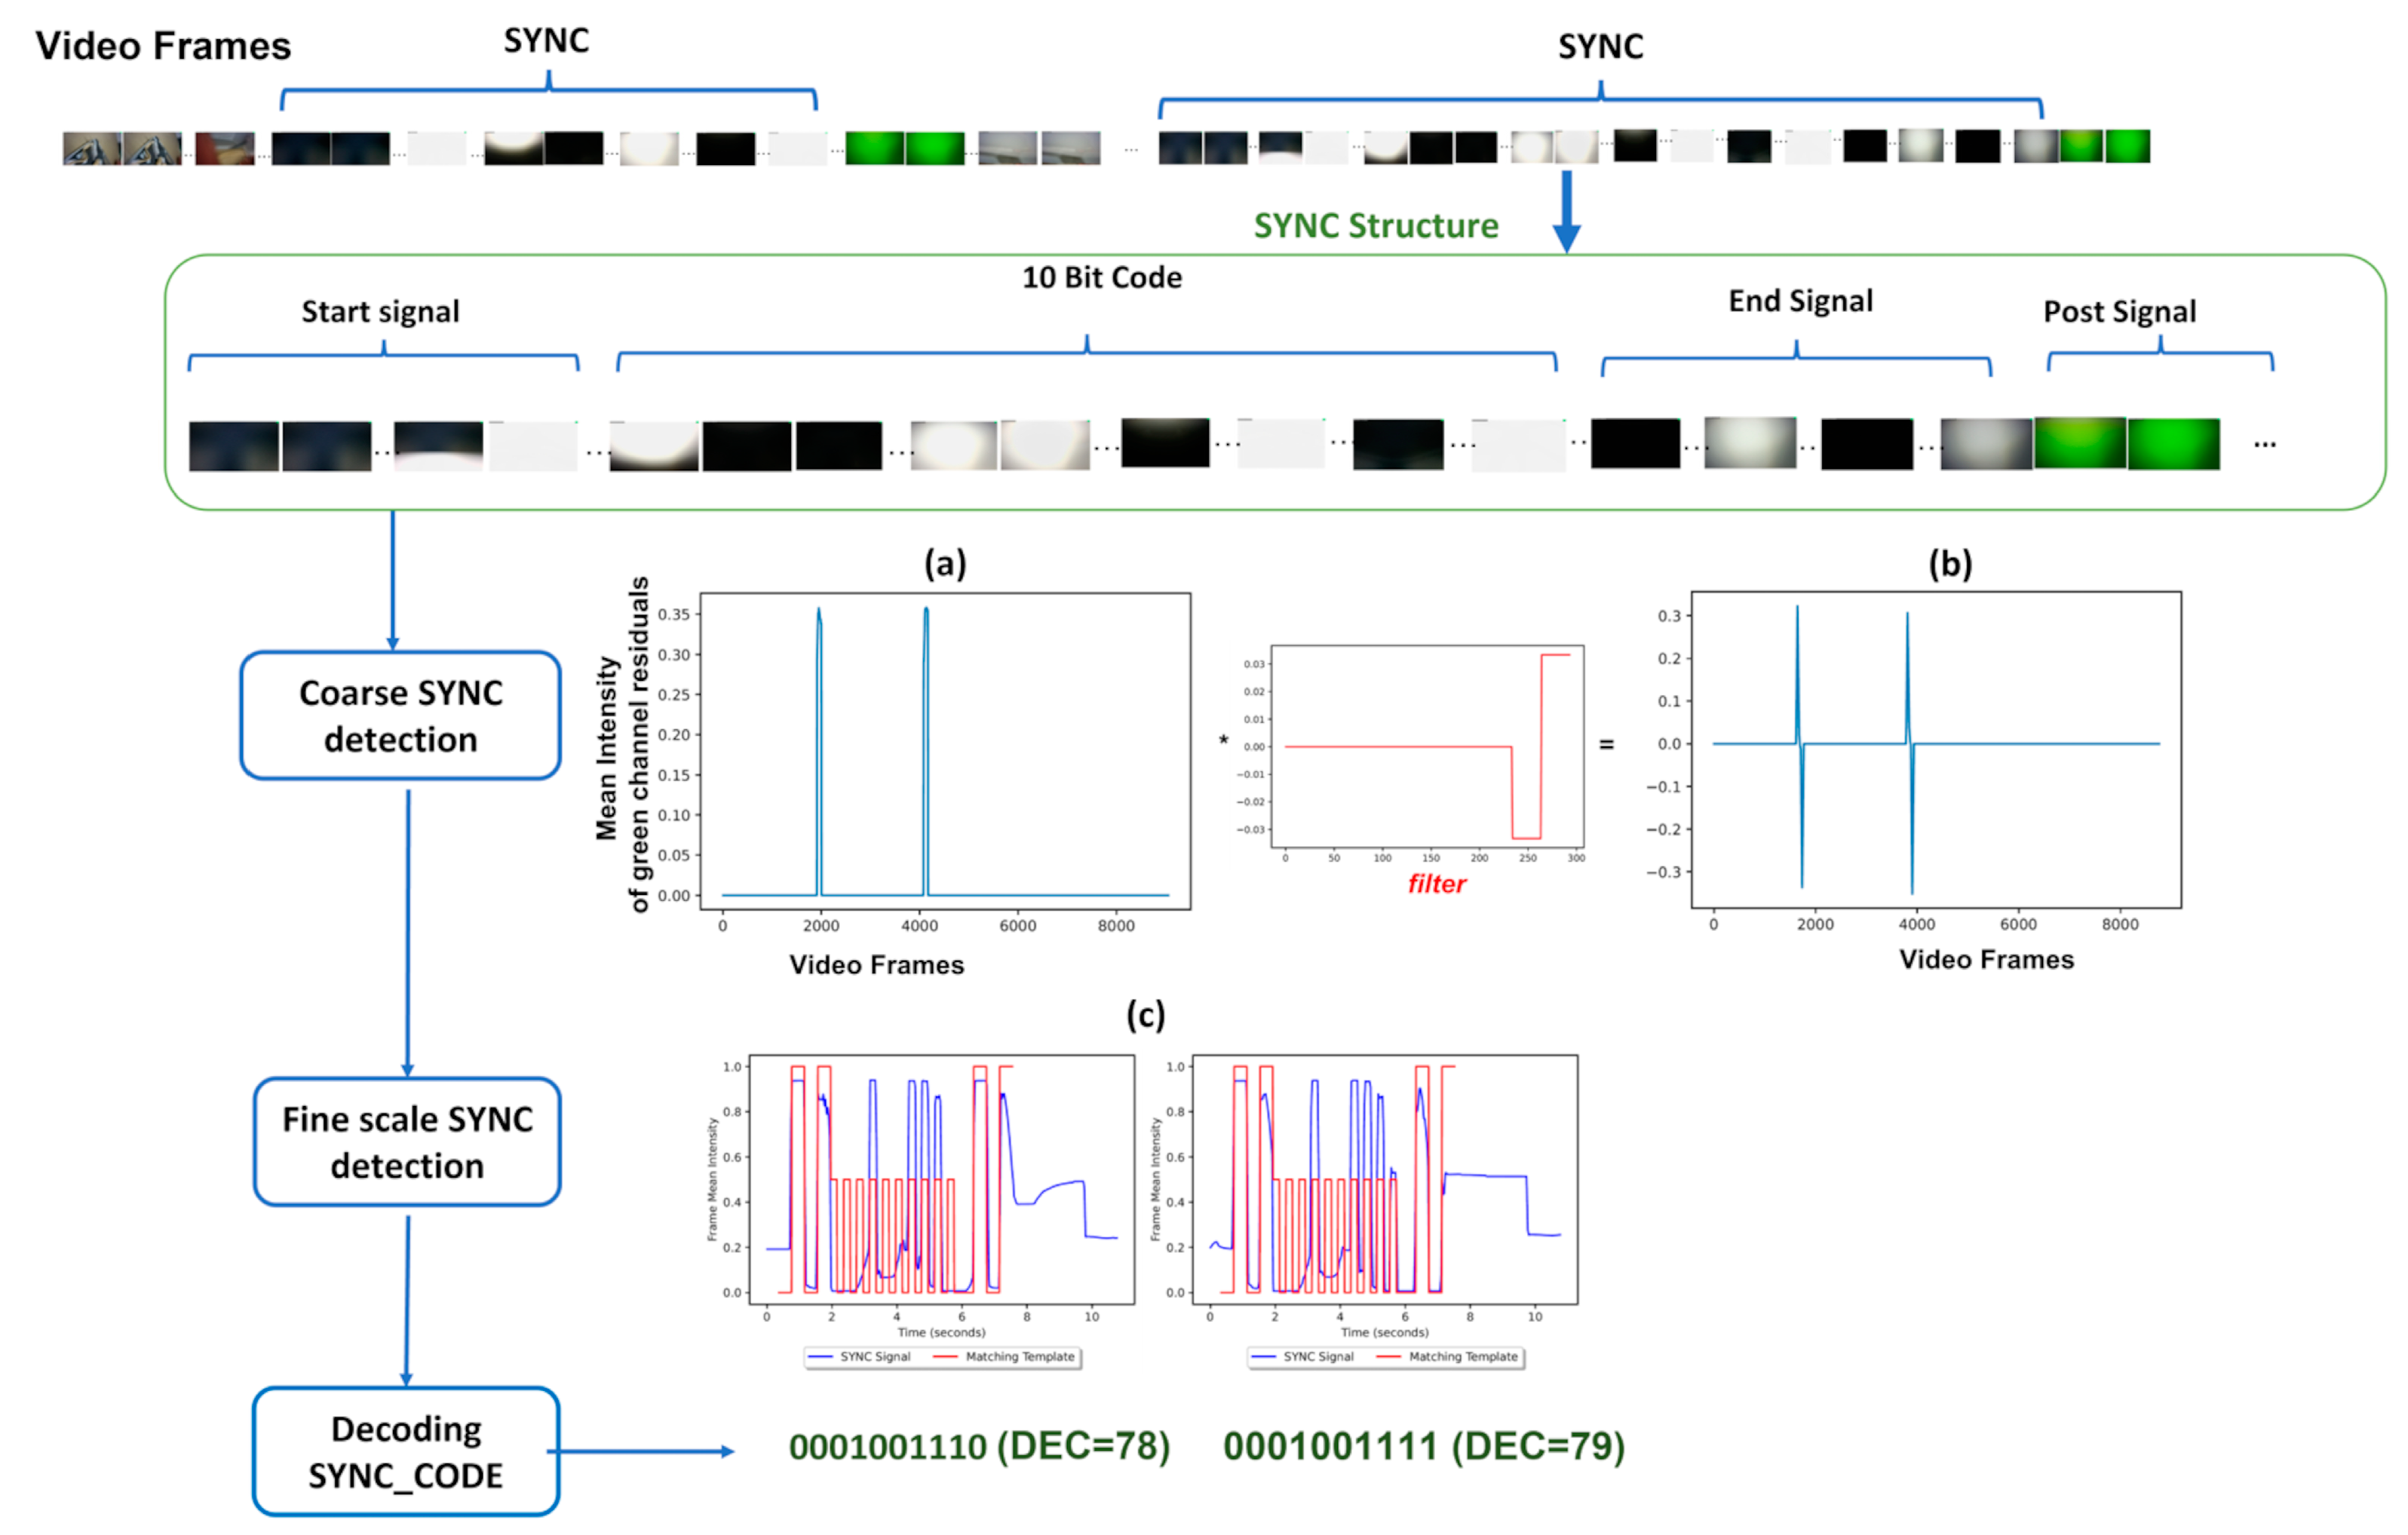
- The ‘greenness’ signal is defined as max(0,G-R-B). This signal (see Figure 20a) has a large value when the mean color of the frame is green, i.e., when the average value over pixels is significantly larger in the green channel than red and blue, otherwise it is zero.
- The average intensity signal is simply the average over the three color channels (see blue curves in Figure 20c).
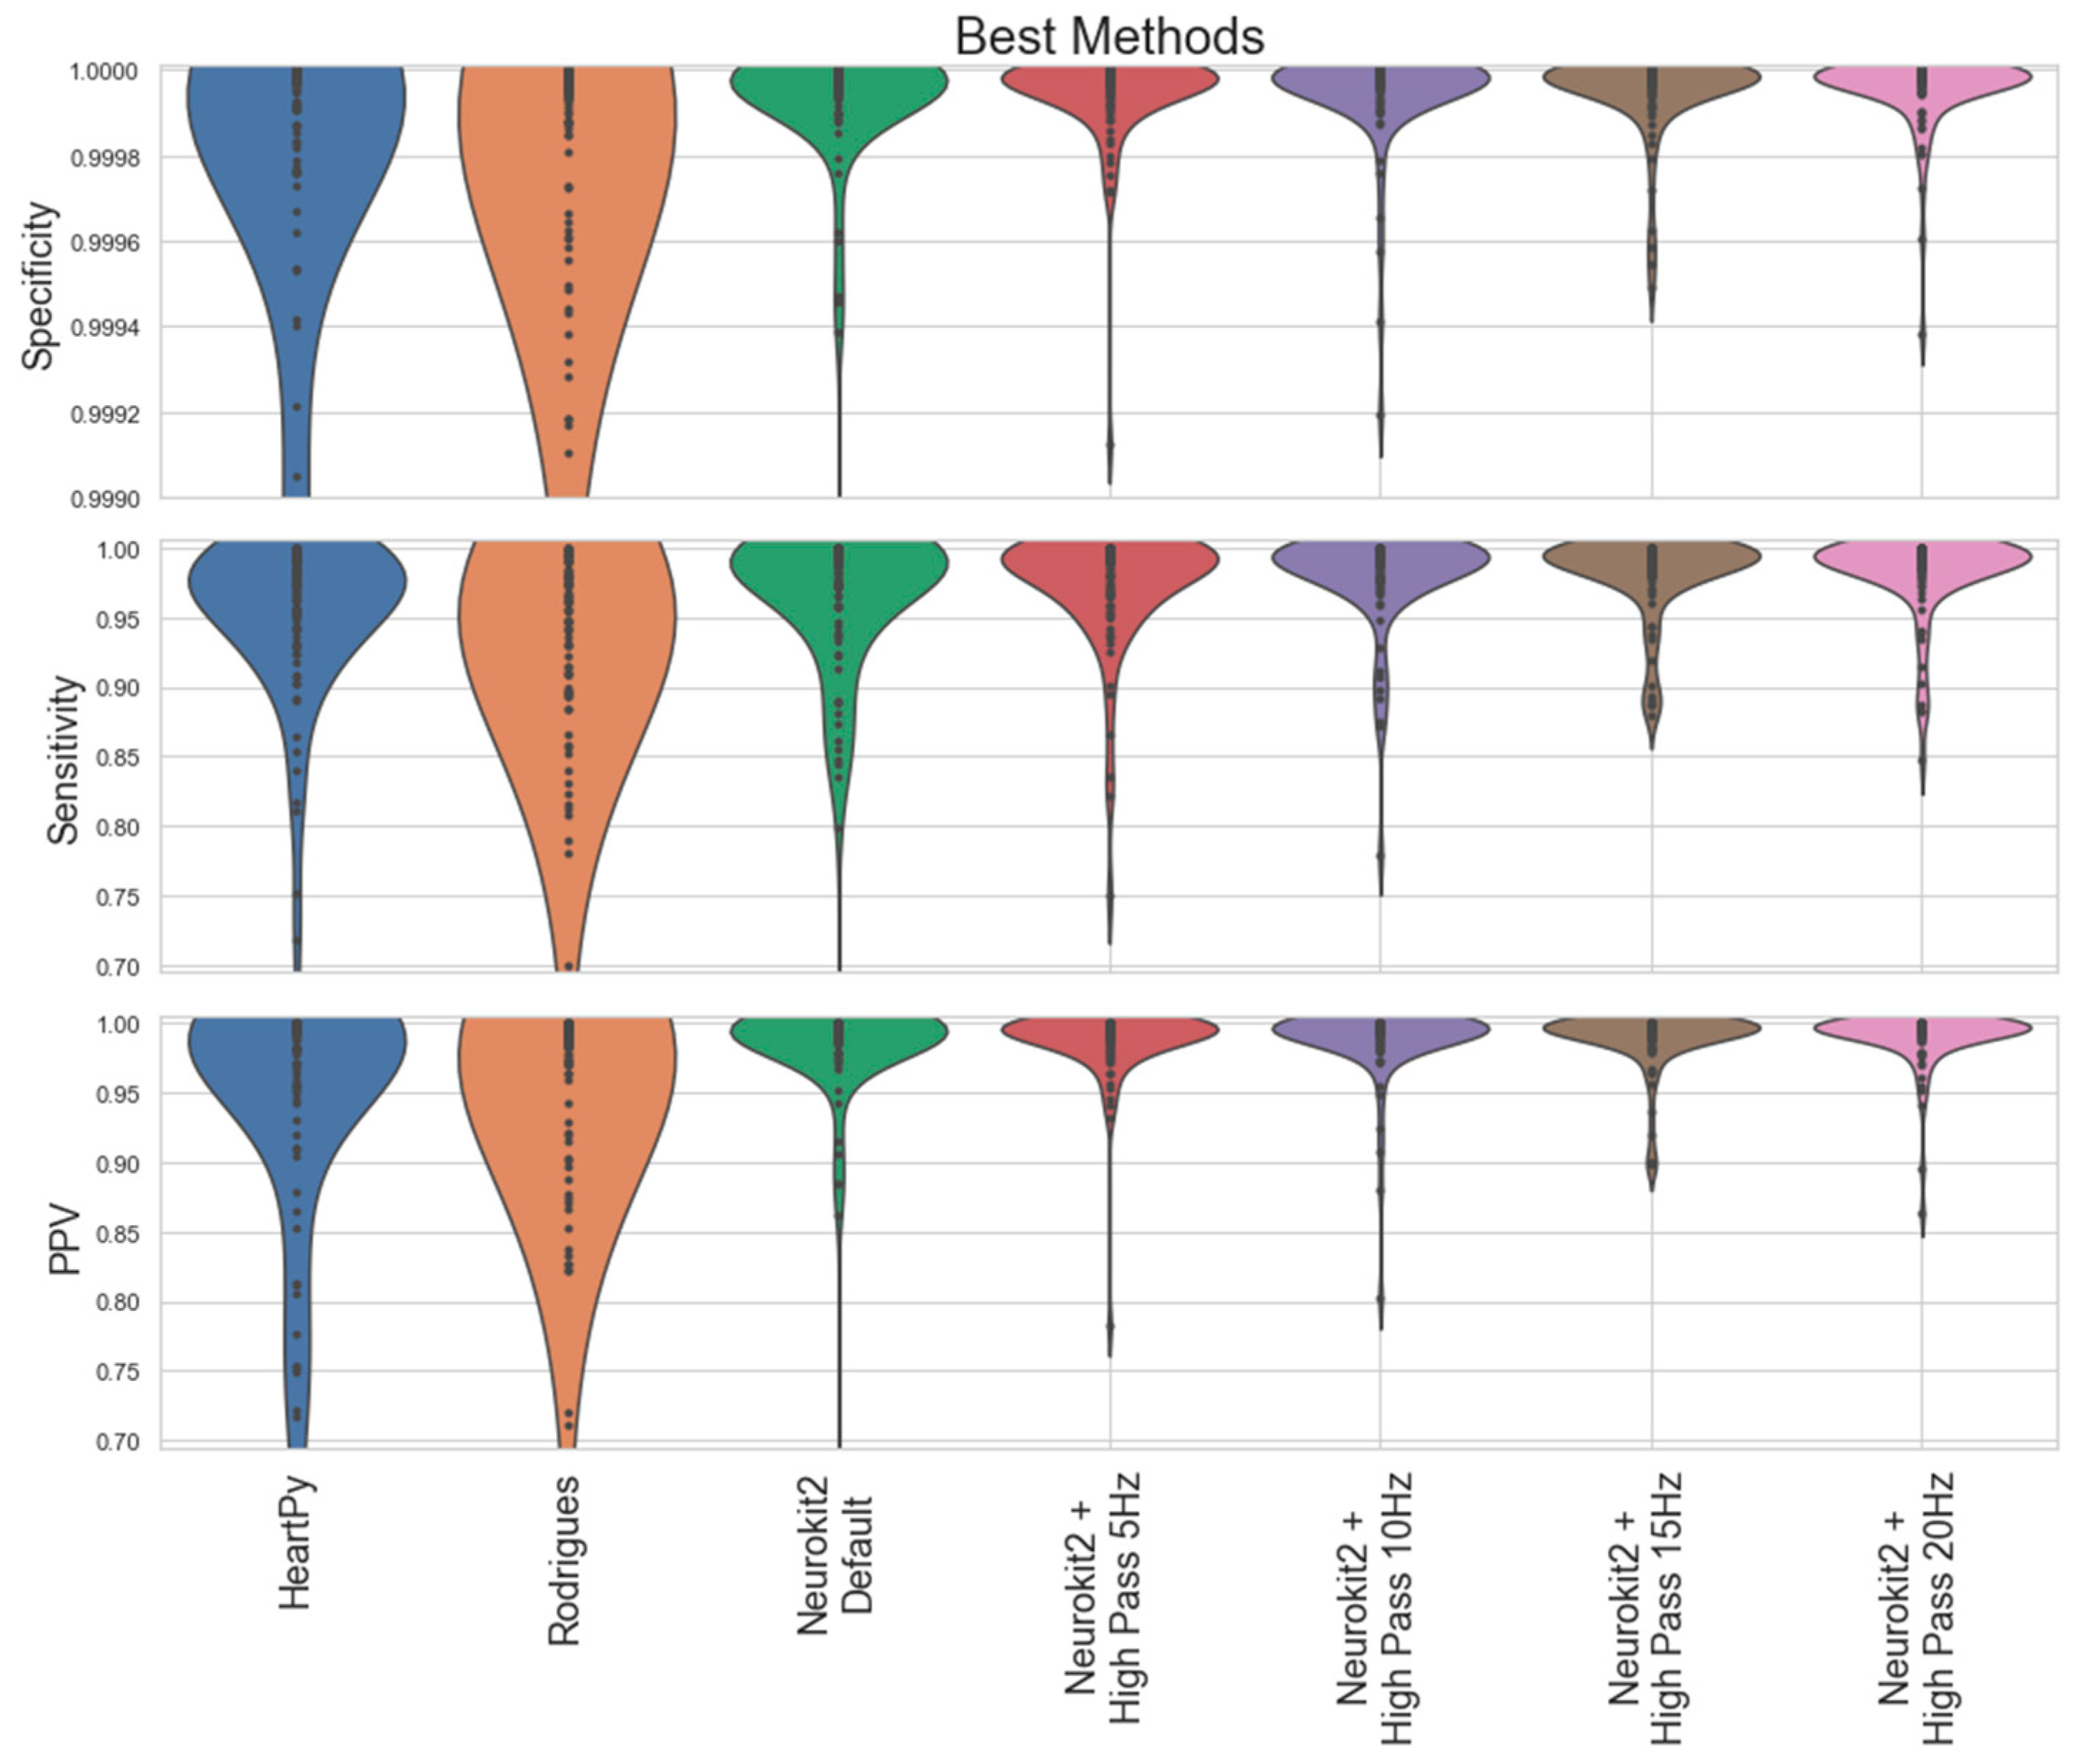
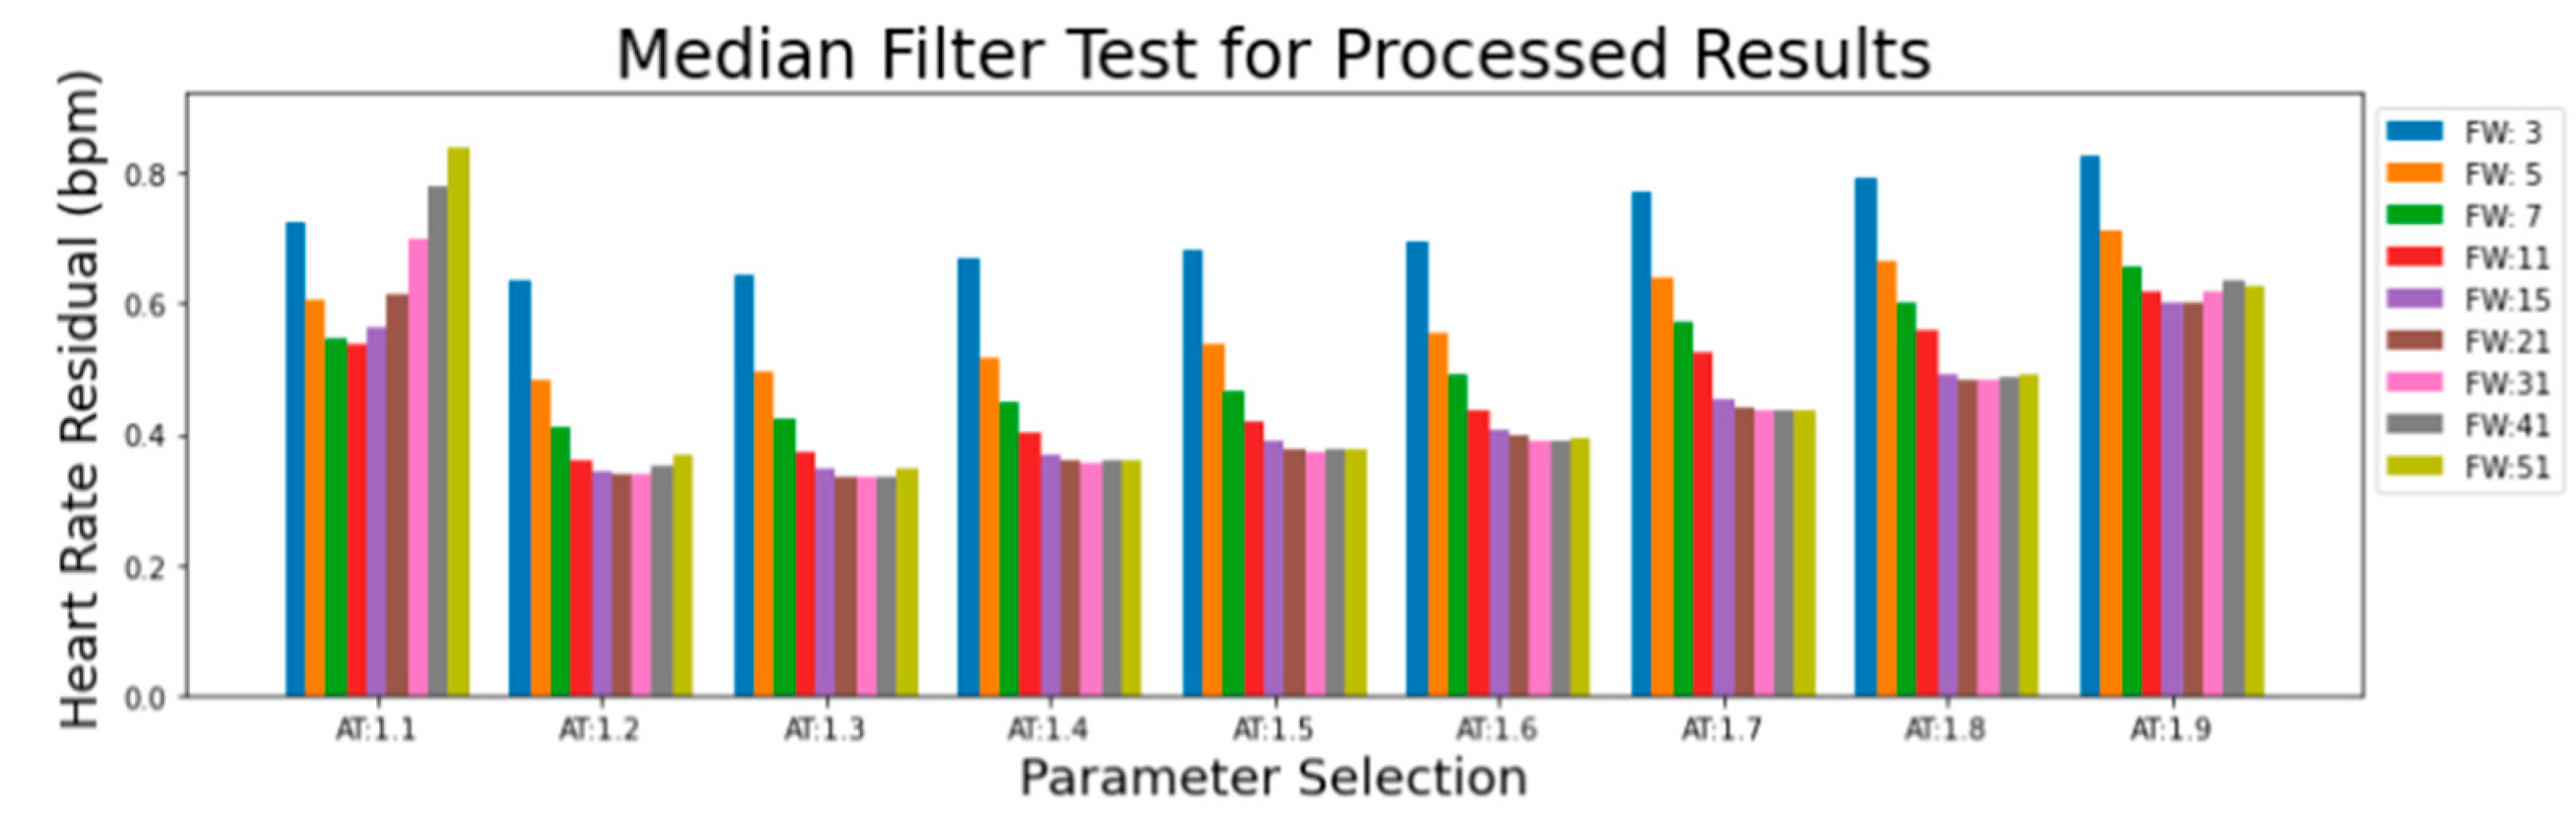
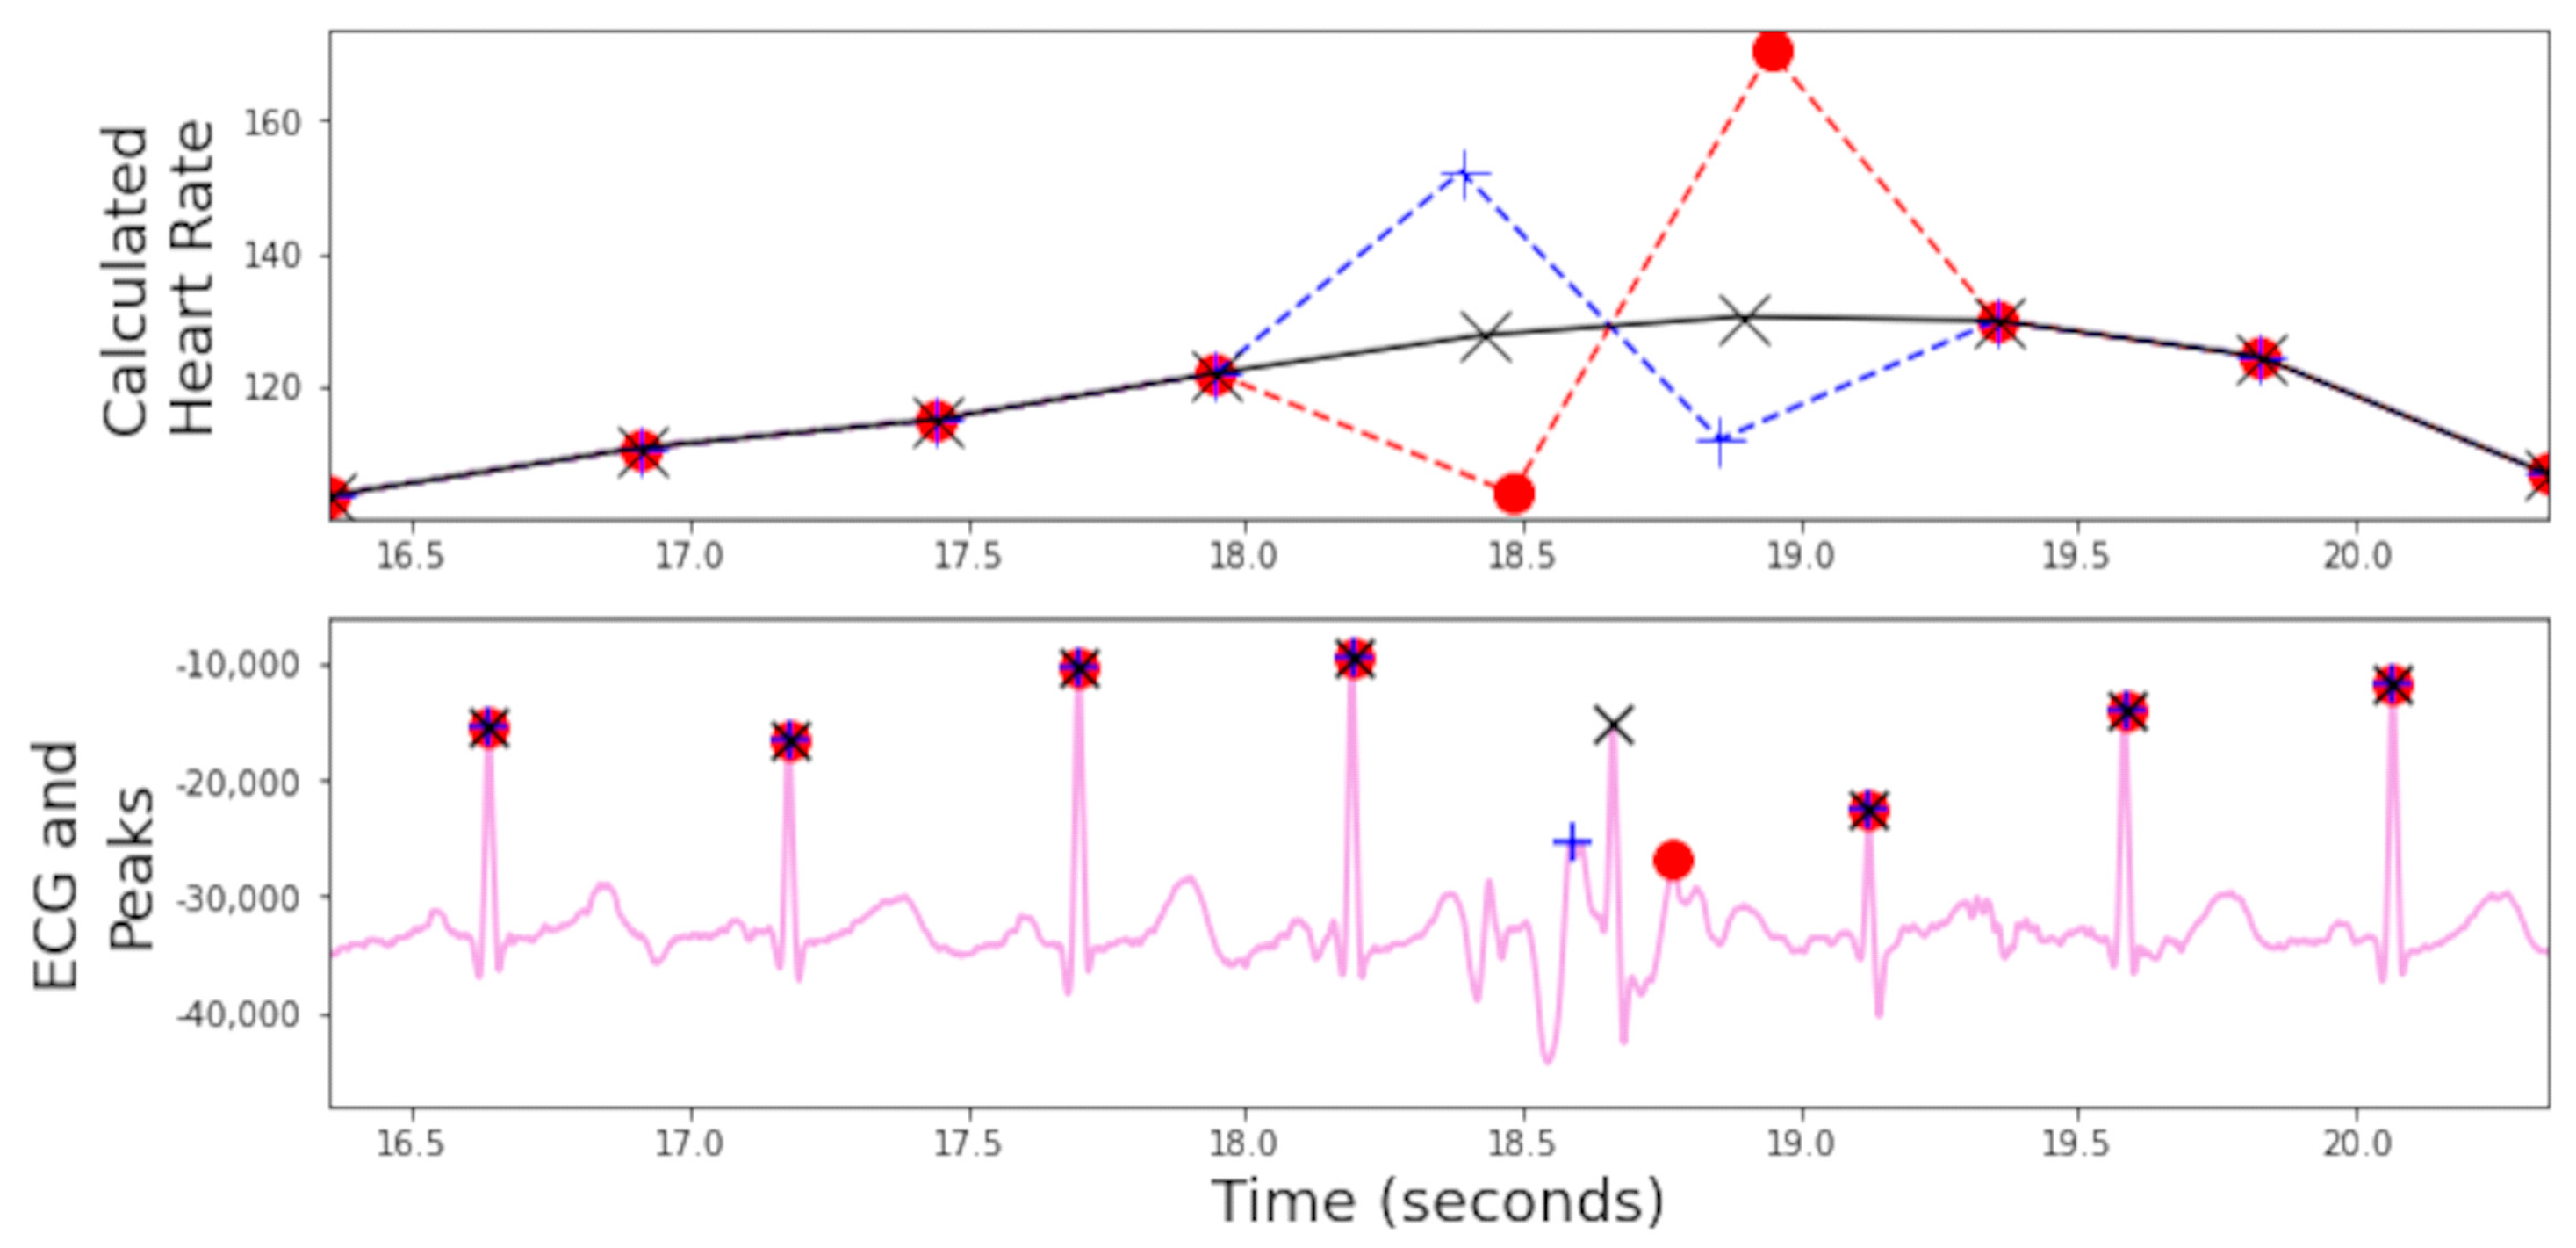
3.2.2. Body Sensor ECG Processing
3.2.3. Acceleration Processing
3.2.4. HMC Quality Control Processing
4. Discussion
4.1. New Tools for Developmental Research
4.2. Challenges for the EgoActive Platform
4.3. Summary and Research Potential
Author Contributions
Funding
Institutional Review Board Statement
Informed Consent Statement
Data Availability Statement
Acknowledgments
Conflicts of Interest
Appendix A
- A sample dataset comprising a raw video and body sensor recording and the resulting synchronized time series after applying our preprocessing pipeline.
- Python source code for:
- (a)
- Video resampling, stitching and synchronization signal detection,
- (b)
- Detection of dark/static/inverted videos or video segments,
- (c)
- Conversion of raw .dat body sensor files into human-readable .txt files,
- (d)
- Extraction, processing, and quality assessment of heart rate from raw ECG signal, and
- (e)
- Extraction and processing of accelerometer files.
- AutoCAD designs for base unit foam insert layers.
- Java source code for Android tablet backup and synchronization app.
- Body sensor manufacturing files:
- (a)
- KiCAD project files for the body sensor body sensor circuit board design.
- (b)
- Bill of Materials.
- (c)
- Arduino sketch, the program code which drives the body sensor processor.
- (d)
- Python script to read and convert the raw binary .dat files into human-readable .txt files for heart rate and accelerometer data.
- (e)
- CAD files for the body sensor case design (injection molding and 3D printing).
- HMC manufacturing files:
- (a)
- System diagram,
- (b)
- Bill of Materials,
- (c)
- CAD designs for the HMC casings (injection molding and 3D printing), and
- (d)
- Instructions for assembling the HMC.
Appendix B
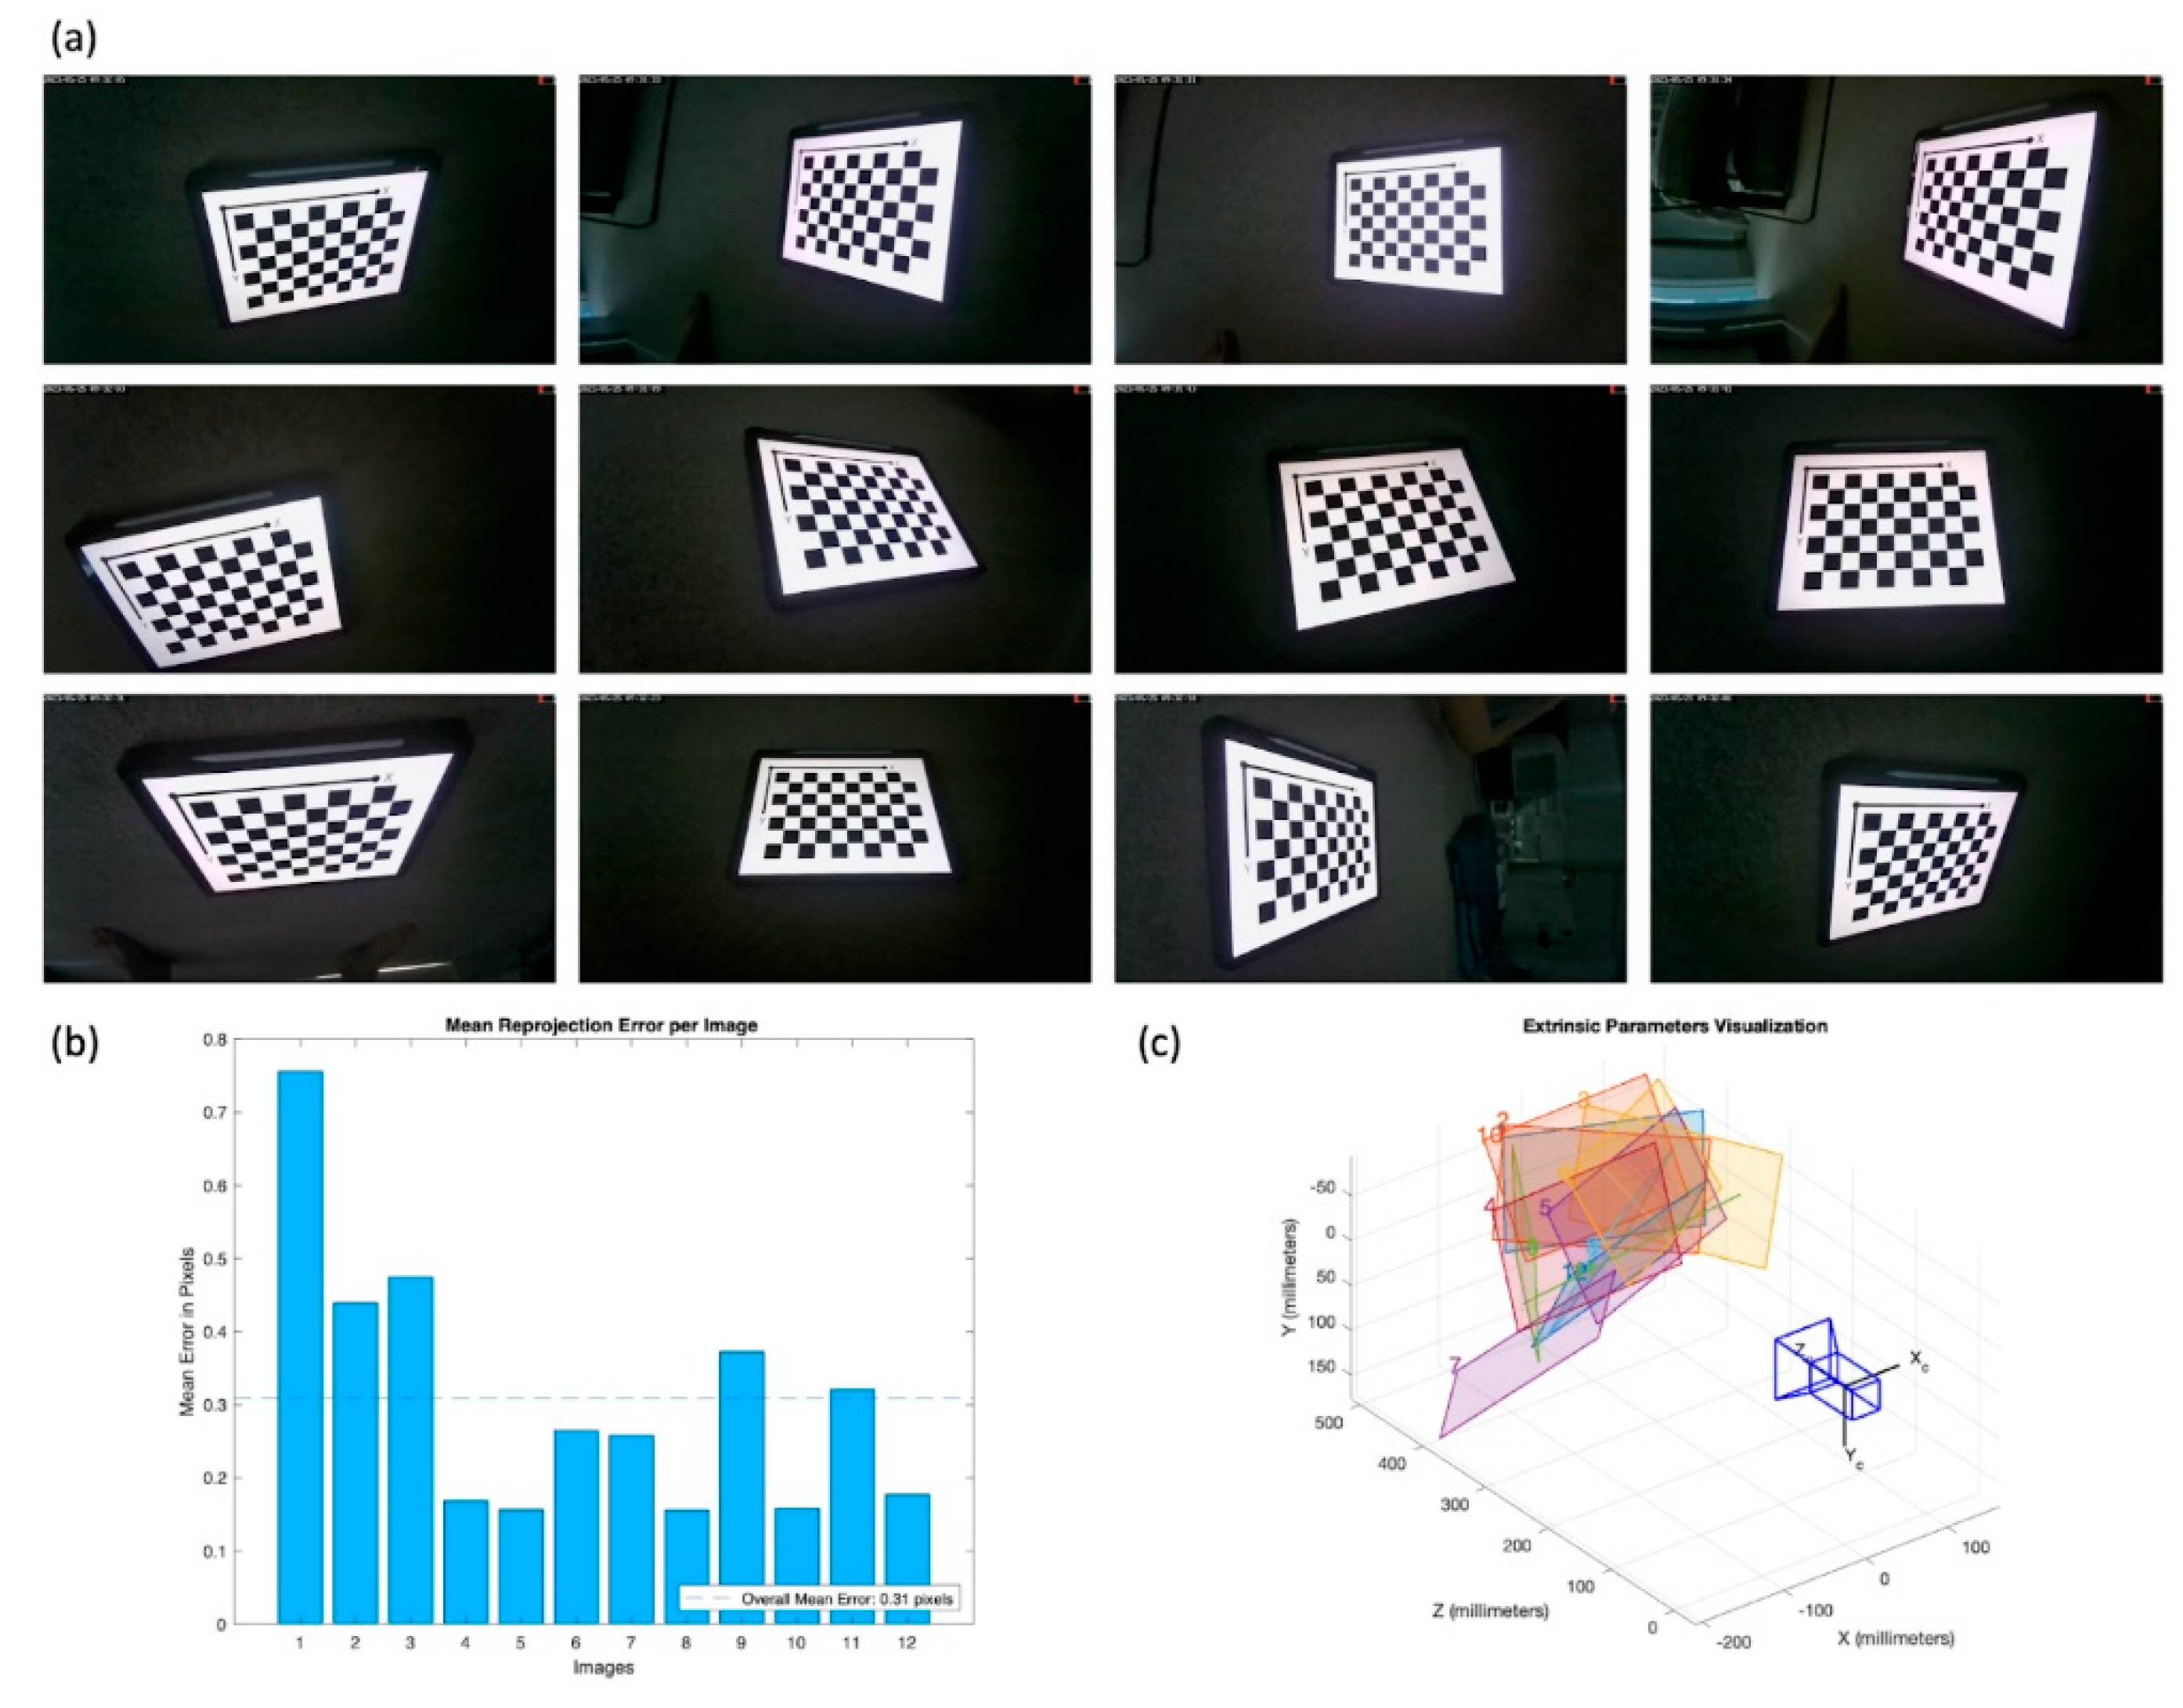
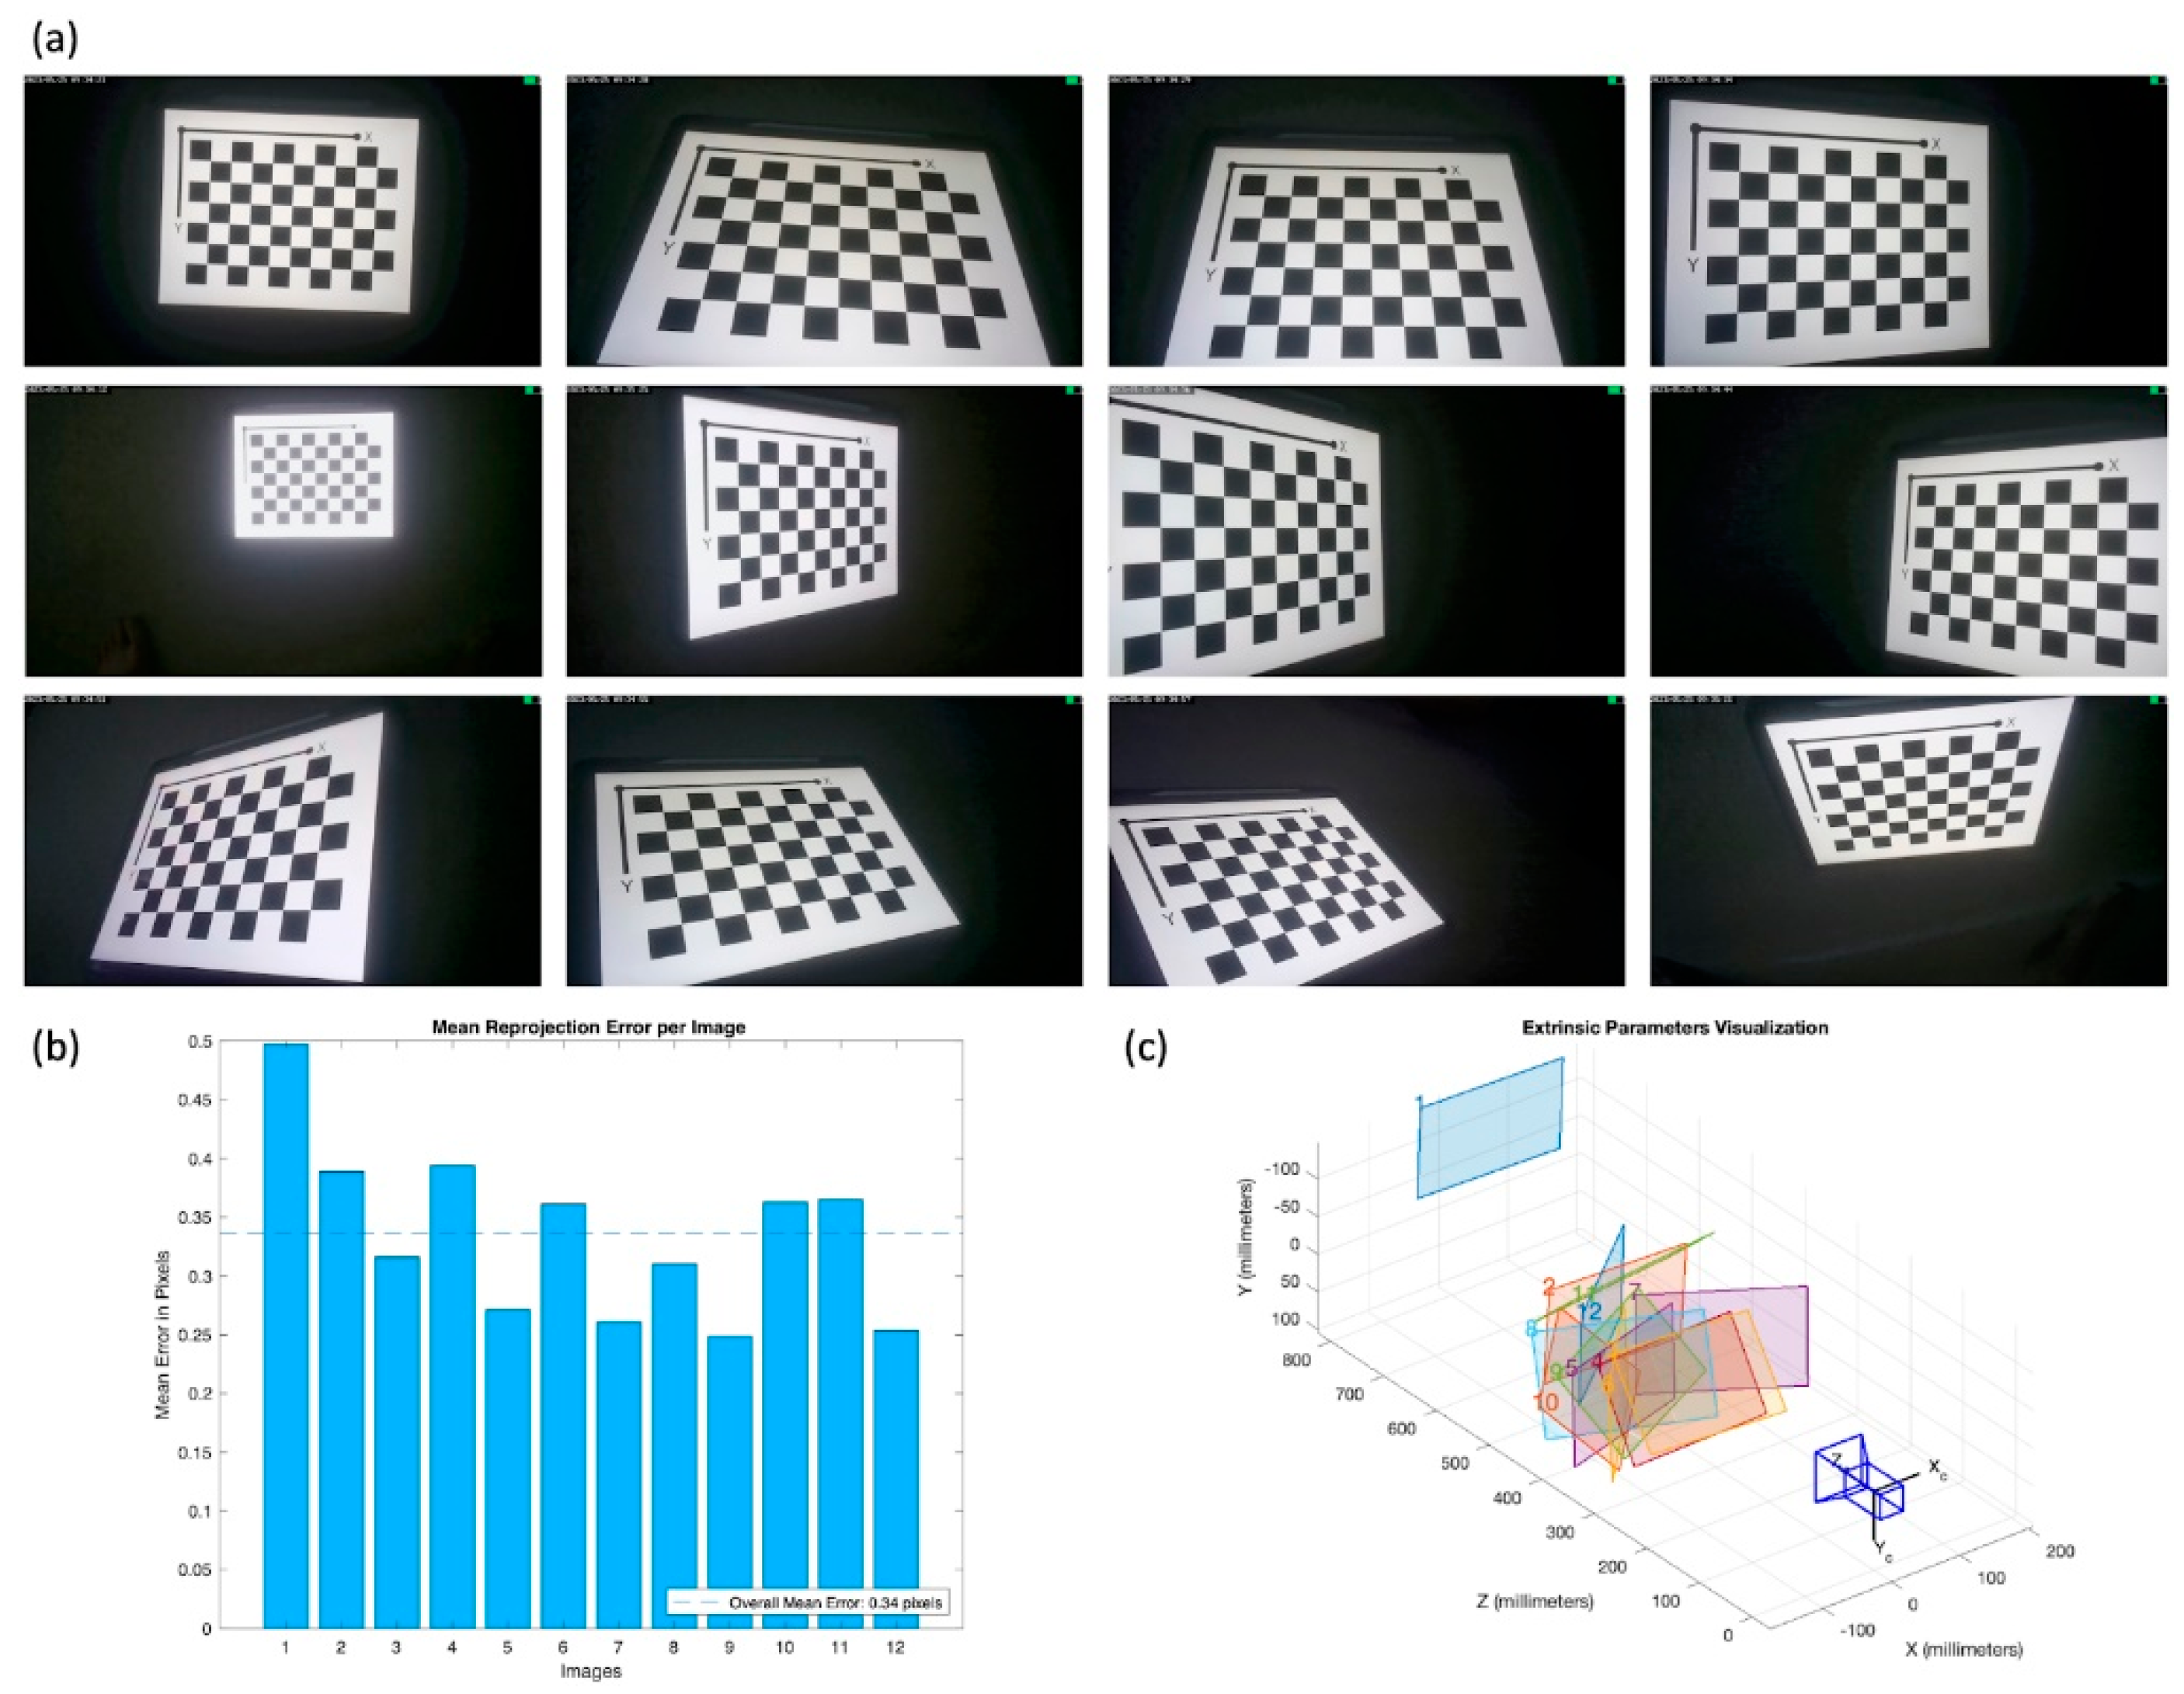
Camera Calibration Results

| Wide-FOV Lens | Narrow-FOV Lens | |
|---|---|---|
| Focal length (x) | 972.3 pixels | 1571.5 pixels |
| Focal length (y) | 971.7 pixels | 1569.6 pixels |
| Principal point (x) | 967.3 pixels | 946.3 pixels |
| Principal point (y) | 525.8 pixels | 512.0 pixels |
| Radial distortion 1 | 0.0638 | 0.0462 |
| Radial distortion 2 | −0.0979 | −0.0768 |
| Tangential distortion 1 | −3.3806 × 10⁻⁴ | −5.42 × 10⁻⁴ |
| Tangential distortion 2 | −8.75 × 10⁻⁵ | 3.01 × 10⁻⁴ |


Appendix C
Single Run through of the App
| Role | Process | Actions |
|---|---|---|
| Administrators | Initial setup |
|
| Administrators | Data collection preparations |
|
| End users | Data collection in the natural environment |
|
- Time/Counter verification

- Timer/Delay (Discussing the several minute requirement through sync to stop overlapping files)
Appendix D
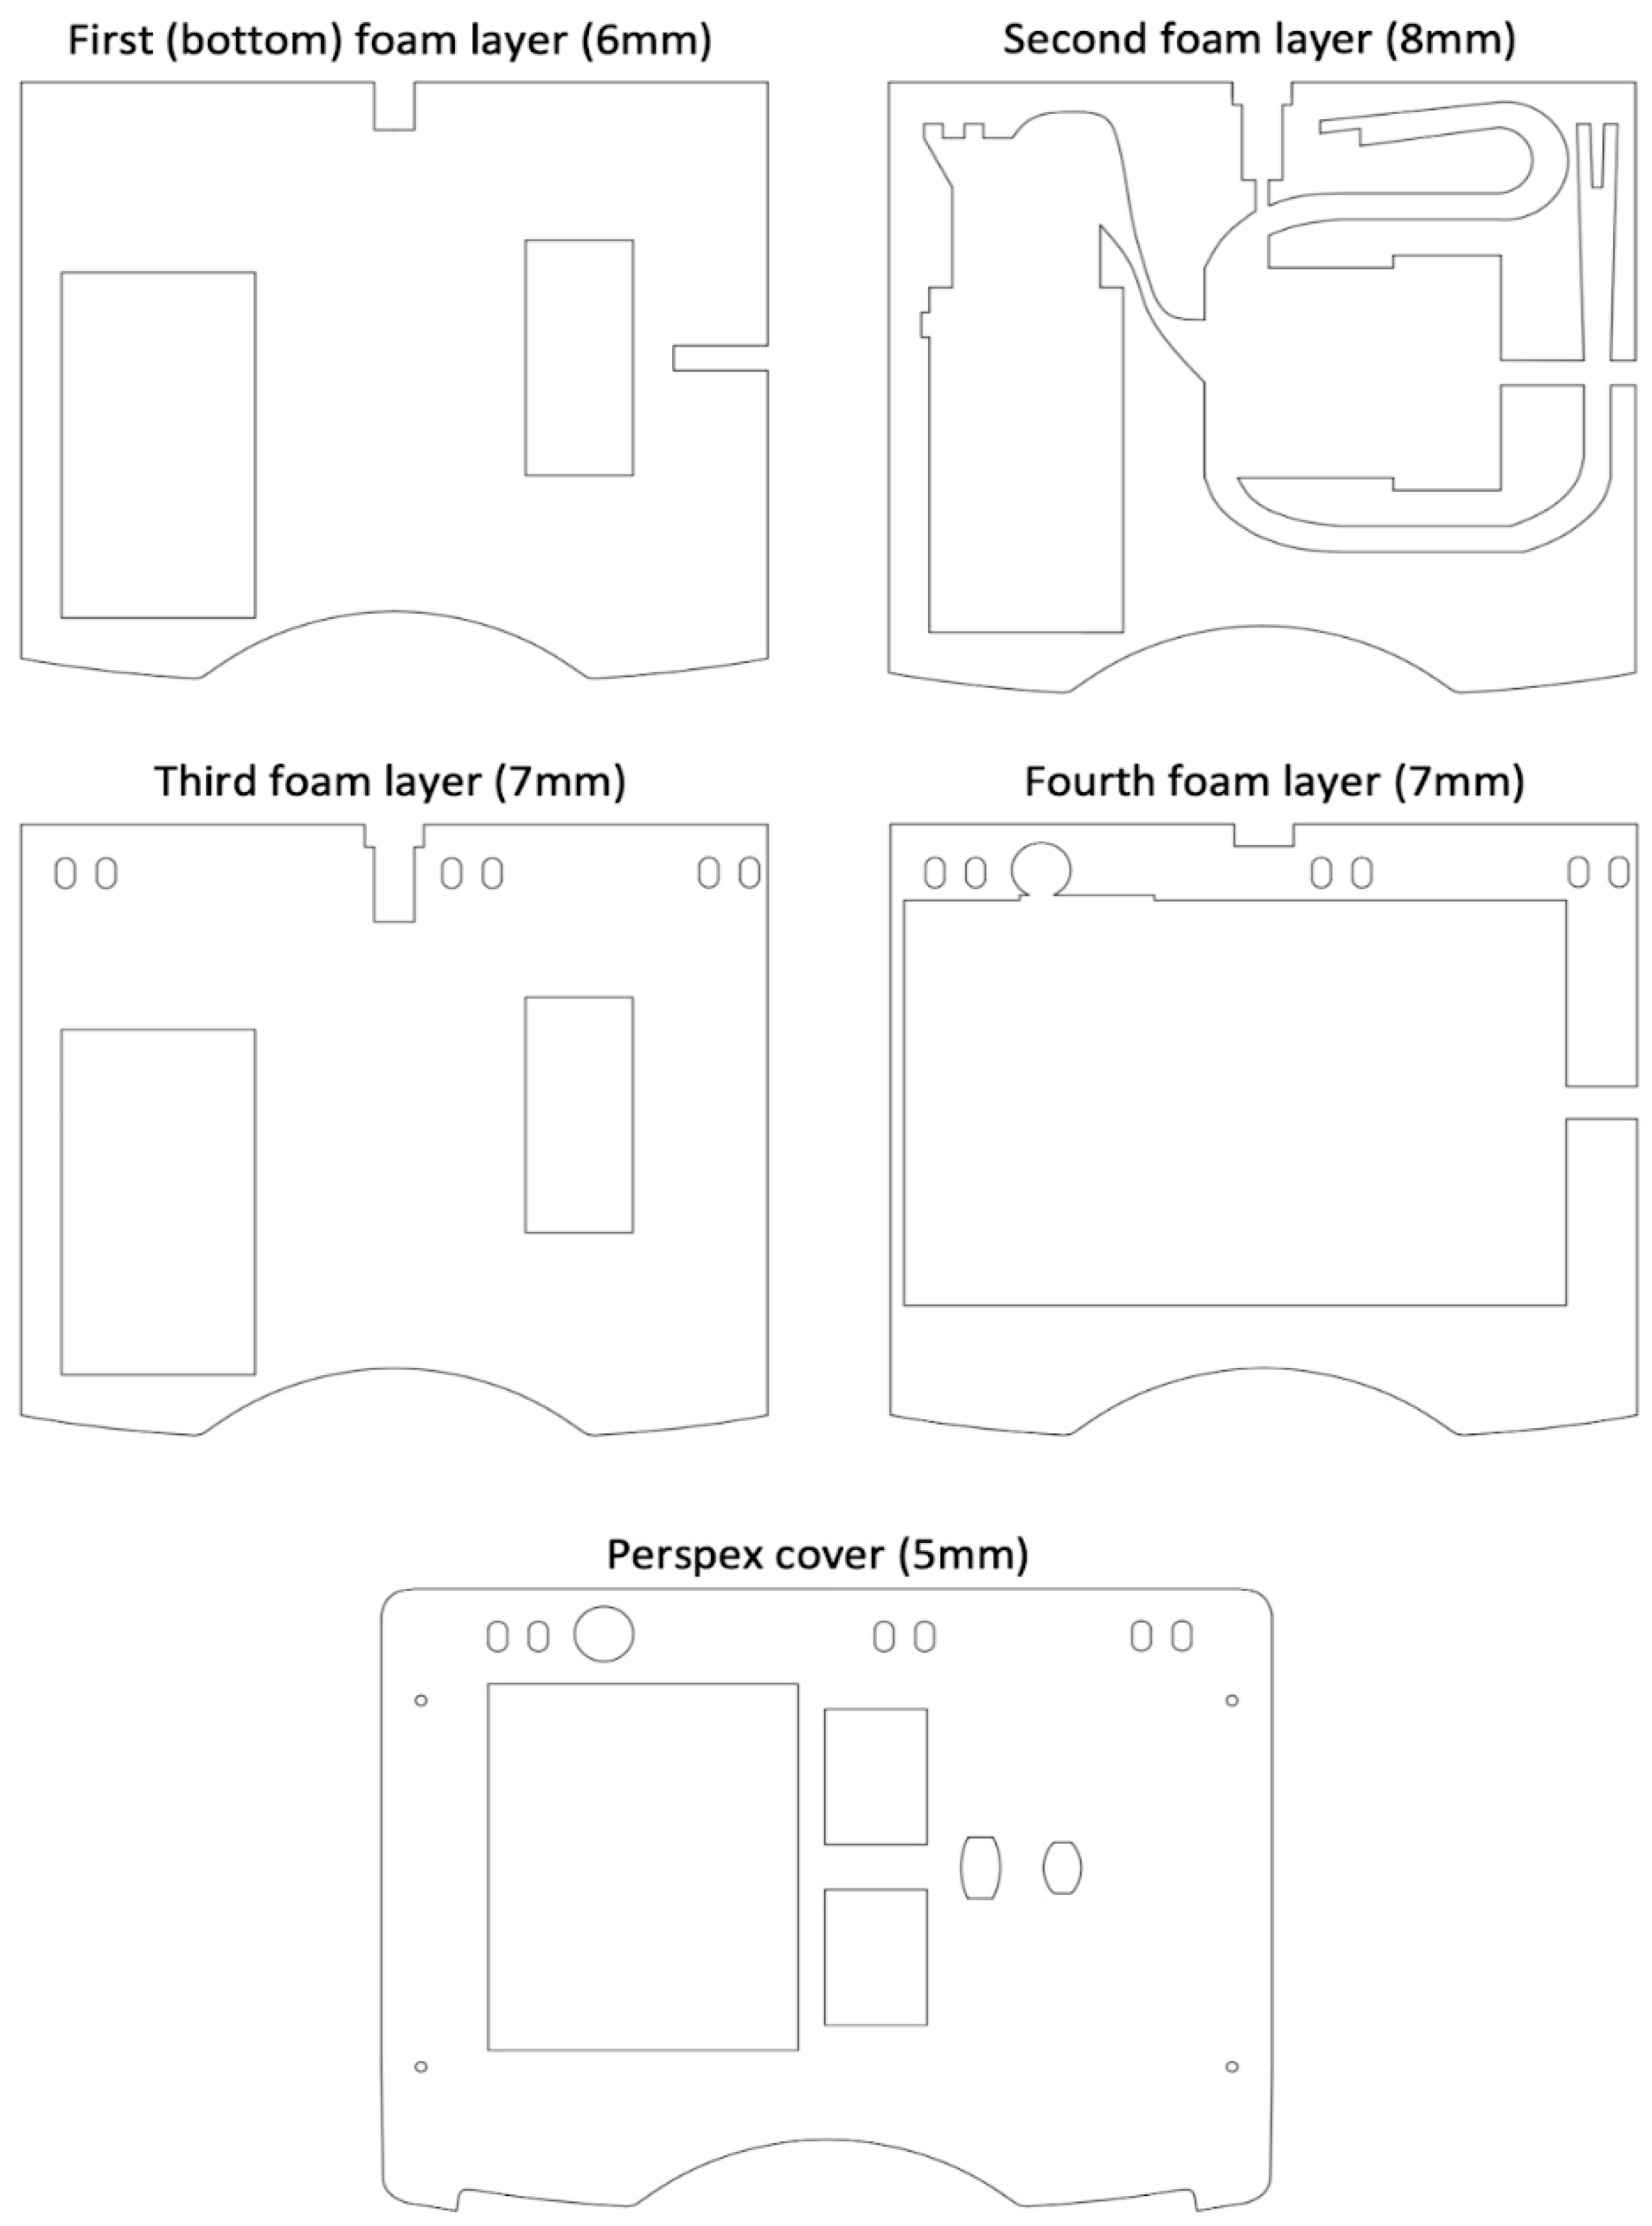
CAD Designs for the Four Foam Insert Layers and Perspex Cover for the Base Unit Case

References
- Jayaraman, S.; Smith, L.B. The infant’s visual world: The everyday statistics for visual learning. In The Cambridge Handbook of Infant Development: Brain, Behavior, and Cultural Context; Lockman, J.J., Tamis-LeMonda, C.S., Eds.; Cambridge University Press: Cambridge, UK, 2020; pp. 549–576. [Google Scholar]
- Bronfenbrenner, U. Toward an experimental ecology of human development. Am. Psychol. 1977, 32, 513. [Google Scholar] [CrossRef]
- Bronfenbrenner, U. Ecology of the family as a context for human development: Research perspectives. Dev. Psychol. 1986, 22, 723. [Google Scholar] [CrossRef]
- Dahl, A. Ecological commitments: Why developmental science needs naturalistic methods. Child Dev. Perspect. 2017, 11, 79–84. [Google Scholar] [CrossRef] [PubMed]
- Oller, D.K.; Niyogi, P.; Gray, S.; Richards, J.A.; Gilkerson, J.; Xu, D.; Yapanel, U.; Warren, S.F. Automated vocal analysis of naturalistic recordings from children with autism, language delay, and typical development. Proc. Natl. Acad. Sci. USA 2010, 107, 13354–13359. [Google Scholar] [CrossRef]
- Willems, E.P. Toward an explicit rationale for naturalistic research methods. Hum. Dev. 1967, 10, 138–154. [Google Scholar] [CrossRef] [PubMed]
- Smith, L.B.; Jayaraman, S.; Clerkin, E.; Yu, C. The developing infant creates a curriculum for statistical learning. Trends Cogn. Sci. 2018, 22, 325–336. [Google Scholar] [CrossRef]
- Cristia, A. A systematic review suggests marked differences in the prevalence of infant-directed vocalization across groups of populations. Dev. Sci. 2023, 26, e13265. [Google Scholar] [CrossRef]
- Long, B.; Goodin, S.; Kachergis, G.; Marchman, V.A.; Radwan, S.; Sparks, R.; Xiang, V.; Zhuang, C.; Hsu, O.; Newman, B. The BabyView Camera: Designing a New Head-Mounted Camera to Capture Children’s Early Social and Visual Environment. Available online: psyarxiv.com/238jk (accessed on 22 November 2022).
- Smith, L.B.; Yu, C.; Yoshida, H.; Fausey, C.M. Contributions of head-mounted cameras to studying the visual environments of infants and young children. J. Cogn. Dev. 2015, 16, 407–419. [Google Scholar] [CrossRef]
- Tamis-LeMonda, C.S. The mountain stream of infant development. Infancy 2023, 28, 468–491. [Google Scholar] [CrossRef]
- Wass, S.V.; Goupil, L. Studying the developing brain in real-world contexts: Moving from castles in the air to castles on the ground. Front. Integr. Neurosci. 2022, 16, 896919. [Google Scholar] [CrossRef]
- Maitha, C.; Goode, J.C.; Maulucci, D.P.; Lasassmeh, S.M.; Yu, C.; Smith, L.B.; Borjon, J.I. An open-source, wireless vest for measuring autonomic function in infants. Behav. Res. Methods 2020, 52, 2324–2337. [Google Scholar] [CrossRef] [PubMed]
- Smith, L.B.; Thelen, E. Development as a dynamic system. Trends Cogn. Sci. 2003, 7, 343–348. [Google Scholar] [CrossRef] [PubMed]
- Thelen, E. Time-scale dynamics and the development of an embodied cognition. In Mind as Motion: Explorations in the Dynamics of Cognition; Port, R.F., Van Gelder, T., Eds.; MIT Press: Cambridge, MA, USA, 1995; pp. 69–100. [Google Scholar]
- Thelen, E.; Corbetta, D. Microdevelopment and dynamic systems: Applications to infant motor development. In Microdevelopment: Transition Processes in Development and Learning; Granott, N., Parziale, J., Eds.; Cambridge University Press: Cambridge, UK, 2002; pp. 59–79. [Google Scholar]
- Keller, H. Parenting and socioemotional development in infancy and early childhood. Dev. Rev. 2018, 50, 31–41. [Google Scholar] [CrossRef]
- Singh, L.; Cristia, A.; Karasik, L.B.; Rajendra, S.J.; Oakes, L.M. Diversity and representation in infant research: Barriers and bridges toward a globalized science of infant development. Infancy 2023, 28, 708–737. [Google Scholar] [CrossRef] [PubMed]
- Geangu, E. Development of empathy during early childhood across cultures. In International Encyclopedia of the Social and Behavioral Sciences; Wright, J.D., Ed.; Elsevier: Oxford, UK, 2015; pp. 549–553. [Google Scholar]
- Gibbins, I. Functional organization of autonomic neural pathways. Organogenesis 2013, 9, 169–175. [Google Scholar] [CrossRef] [PubMed]
- Sharkey, K.; Pittman, Q. The autonomic nervous system: Peripheral and central integrative aspects. In Comprehensive Human Physiology: From Cellular Mechanisms to Integration; Springer: Berlin/Heidelberg, Germany, 1996; pp. 335–353. [Google Scholar]
- Berntson, G.G.; Cacioppo, J.T.; Quigley, K.S. Respiratory sinus arrhythmia: Autonomic origins, physiological mechanisms, and psychophysiological implications. Psychophysiology 1993, 30, 183–196. [Google Scholar] [CrossRef] [PubMed]
- Jennings, R.J.; van der Molen, M.W. Cardiac timing and the central regulation of action. Psychol. Res. 2002, 66, 337–349. [Google Scholar] [CrossRef] [PubMed]
- Kleinow, J.; Smith, A. Potential interactions among linguistic, autonomic, and motor factors in speech. Dev. Psychobiol. 2006, 48, 275–287. [Google Scholar] [CrossRef]
- Peters, H.F.; Hulstijn, W. Stuttering and anxiety: The difference between stutterers and nonstutterers in verbal apprehension and physiologic arousal during the anticipation of speech and non-speech tasks. J. Fluency Disord. 1984, 9, 67–84. [Google Scholar] [CrossRef]
- Gomez, I.N.; Flores, J.G. Diverse patterns of autonomic nervous system response to sensory stimuli among children with autism. Curr. Dev. Dis. Rep. 2020, 7, 249–257. [Google Scholar] [CrossRef]
- Heilman, K.J.; Harden, E.R.; Zageris, D.M.; Berry-Kravis, E.; Porges, S.W. Autonomic regulation in fragile X syndrome. Dev. Psychobiol. 2011, 53, 785–795. [Google Scholar] [CrossRef] [PubMed]
- Imeraj, L.; Antrop, I.; Roeyers, H.; Swanson, J.; Deschepper, E.; Bal, S.; Deboutte, D. Time-of-day effects in arousal: Disrupted diurnal cortisol profiles in children with ADHD. J. Child Psychol. Psychiatry 2012, 53, 782–789. [Google Scholar] [CrossRef] [PubMed]
- Van Goozen, S.H.; Matthys, W.; Cohen-Kettenis, P.T.; Buitelaar, J.K.; Van Engeland, H. Hypothalamic-pituitary-adrenal axis and autonomic nervous system activity in disruptive children and matched controls. J. Am. Acad. Child Adolesc. Psychiatry 2000, 39, 1438–1445. [Google Scholar] [CrossRef] [PubMed]
- Mulkey, S.B.; Dú Plessis, A. The critical role of the central autonomic nervous system in fetal-neonatal transition. Semin. Pediatr. Neurol. 2018, 28, 29–37. [Google Scholar] [CrossRef] [PubMed]
- Coles, M.G. Cardiac and respiratory activity during visual search. J. Exp. Psychol. 1972, 96, 371. [Google Scholar] [CrossRef] [PubMed]
- Porges, S.W.; Humphrey, M.M. Cardiac and respiratory responses during visual search in nonretarded children and retarded adolescents. Am. J. Ment. Defic. 1977, 82, 162–169. [Google Scholar]
- Porges, S.W.; Raskin, D.C. Respiratory and heart rate components of attention. J. Exp. Psychol. 1969, 81, 497. [Google Scholar] [CrossRef] [PubMed]
- Richards, J.E.; Casey, B.J. Heart rate variability during attention phases in young infants. Psychophysiology 1991, 28, 43–53. [Google Scholar] [CrossRef]
- Zantinge, G.; van Rijn, S.; Stockmann, L.; Swaab, H. Psychophysiological responses to emotions of others in young children with autism spectrum disorders: Correlates of social functioning. Autism Res. 2017, 10, 1499–1509. [Google Scholar] [CrossRef]
- Zantinge, G.; van Rijn, S.; Stockmann, L.; Swaab, H. Physiological arousal and emotion regulation strategies in young children with autism spectrum disorders. J. Autism Dev. Disord. 2017, 47, 2648–2657. [Google Scholar] [CrossRef]
- Berg, W.K.; Berg, K.M. Psychophysiological development in infancy: State, startle, and attention. In Handbook of Infant Development; Osofsky, J.D., Ed.; John Wiley & Sons: Hoboken, NJ, USA, 1987; pp. 238–317. [Google Scholar]
- Graham, F. Distinguishing among orienting, defense, and startle reflexes. In The Orienting Reflex in Humans; Kimmel, H., Olst, E.H., Orlebeke, J.F., Eds.; Routledge: London, UK, 2021; pp. 137–167. [Google Scholar]
- Graham, F.; Anthony, B.; Zeigler, B. Orienting and Habituation: Perspectives in Human Research. Psychol. Res. 1983, 66, 337–349. [Google Scholar]
- Porges, S.W. Peripheral and neurochemical parallels of psychopathology: A psychophysiological model relating autonomic imbalance to hyperactivity, psychopathy, and autism. Adv. Child Dev. Behav. 1976, 11, 35–65. [Google Scholar] [PubMed]
- Porges, S.W.; Bohrer, R.E.; Cheung, M.N.; Drasgow, F.; McCabe, P.M.; Keren, G. New time-series statistic for detecting rhythmic co-occurrence in the frequency domain: The weighted coherence and its application to psychophysiological research. Psychol. Bull. 1980, 88, 580. [Google Scholar] [CrossRef] [PubMed]
- Von Bargen, D.M. Infant heart rate: A review of research and methodology. Merrill-Palmer Q. 1983, 29, 115–149. [Google Scholar]
- Lansink, J.M.; Richards, J.E. Heart rate and behavioral measures of attention in six-, nine-, and twelve-month-old infants during object exploration. Child Dev. 1997, 68, 610–620. [Google Scholar] [CrossRef] [PubMed]
- Richards, J.E.; Gibson, T.L. Extended visual fixation in young infants: Look distributions, heart rate changes, and attention. Child Dev. 1997, 68, 1041–1056. [Google Scholar] [CrossRef] [PubMed]
- Richards, J.E. Attention affects the recognition of briefly presented visual stimuli in infants: An ERP study. Dev. Sci. 2003, 6, 312–328. [Google Scholar] [CrossRef] [PubMed]
- Xie, W.; Mallin, B.M.; Richards, J.E. Development of infant sustained attention and its relation to EEG oscillations: An EEG and cortical source analysis study. Dev. Sci. 2018, 21, e12562. [Google Scholar] [CrossRef]
- Amso, D.; Scerif, G. The attentive brain: Insights from developmental cognitive neuroscience. Nat. Rev. Neurosci. 2015, 16, 606–619. [Google Scholar] [CrossRef]
- Oakes, L.M. The development of visual attention in infancy: A cascade approach. In Advances in Child Development and Behavior; Tamis-Lemonda, C.S.L., Jeffrey, J., Eds.; Elsevier: Amsterdam, The Netherlands, 2023; Volume 64, pp. 1–37. [Google Scholar]
- Perry, R.E.; Braren, S.H.; Rincón-Cortés, M.; Brandes-Aitken, A.N.; Chopra, D.; Opendak, M.; Alberini, C.M.; Sullivan, R.M.; Blair, C. Enhancing executive functions through social interactions: Causal evidence using a cross-species model. Front. Psychol. 2019, 10, 2472. [Google Scholar] [CrossRef]
- Posner, M.I.; Rothbart, M.K. Developing mechanisms of self-regulation. Dev. Psychopathol. 2000, 12, 427–441. [Google Scholar] [CrossRef]
- Reynolds, G.D.; Romano, A.C. The development of attention systems and working memory in infancy. Front. Syst. Neurosci. 2016, 10, 15. [Google Scholar] [CrossRef] [PubMed]
- Rose, S.A.; Feldman, J.F.; Jankowski, J.J. Visual short-term memory in the first year of life: Capacity and recency effects. Dev. Psychol. 2001, 37, 539. [Google Scholar] [CrossRef] [PubMed]
- Ruff, H.A.; Lawson, K.R. Development of sustained, focused attention in young children during free play. Dev. Psychol. 1990, 26, 85. [Google Scholar] [CrossRef]
- Smith, L.B.; Yu, C. Visual attention is not enough: Individual differences in statistical word-referent learning in infants. Lang. Learn. Dev. 2013, 9, 25–49. [Google Scholar] [CrossRef] [PubMed]
- Ursache, A.; Blair, C.; Stifter, C.; Voegtline, K. Emotional reactivity and regulation in infancy interact to predict executive functioning in early childhood. Dev. Psychol. 2013, 49, 127. [Google Scholar] [CrossRef] [PubMed]
- Brandes-Aitken, A.; Braren, S.; Swingler, M.; Voegtline, K.; Blair, C. Sustained attention in infancy: A foundation for the development of multiple aspects of self-regulation for children in poverty. J. Exp. Child Psychol. 2019, 184, 192–209. [Google Scholar] [CrossRef] [PubMed]
- Porges, S.W. The polyvagal perspective. Biol. Psychol. 2007, 74, 116–143. [Google Scholar] [CrossRef]
- Beauchaine, T. Vagal tone, development, and Gray’s motivational theory: Toward an integrated model of autonomic nervous system functioning in psychopathology. Dev. Psychopathol. 2001, 13, 183–214. [Google Scholar] [CrossRef]
- Holzman, J.B.; Bridgett, D.J. Heart rate variability indices as bio-markers of top-down self-regulatory mechanisms: A meta-analytic review. Neurosci. Biobehav. Rev. 2017, 74, 233–255. [Google Scholar] [CrossRef]
- Porges, S.W. Orienting in a defensive world: Mammalian modifications of our evolutionary heritage. A polyvagal theory. Psychophysiology 1995, 32, 301–318. [Google Scholar] [CrossRef] [PubMed]
- Blandon, A.Y.; Calkins, S.D.; Keane, S.P.; O’Brien, M. Individual differences in trajectories of emotion regulation processes: The effects of maternal depressive symptomatology and children’s physiological regulation. Dev. Psychol. 2008, 44, 1110. [Google Scholar] [CrossRef] [PubMed]
- Calkins, S.D. Cardiac vagal tone indices of temperamental reactivity and behavioral regulation in young children. Dev. Psychobiol. 1997, 31, 125–135. [Google Scholar] [CrossRef]
- Calkins, S.D.; Keane, S.P. Cardiac vagal regulation across the preschool period: Stability, continuity, and implications for childhood adjustment. Dev. Psychobiol. 2004, 45, 101–112. [Google Scholar] [CrossRef] [PubMed]
- El-Sheikh, M. Stability of respiratory sinus arrhythmia in children and young adolescents: A longitudinal examination. Dev. Psychobiol. 2005, 46, 66–74. [Google Scholar] [CrossRef]
- Fabes, R.A.; Eisenberg, N.; Karbon, M.; Troyer, D.; Switzer, G. The relations of children’s emotion regulation to their vicarious emotional responses and comforting behaviors. Child Dev. 1994, 65, 1678–1693. [Google Scholar] [CrossRef] [PubMed]
- Gottman, J.M.; Katz, L.F. Children’s emotional reactions to stressful parent-child interactions: The link between emotion regulation and vagal tone. Marriage Fam. Rev. 2002, 34, 265–283. [Google Scholar] [CrossRef]
- Hessler, D.M.; Fainsilber Katz, L. Children’s emotion regulation: Self-report and physiological response to peer provocation. Dev. Psychol. 2007, 43, 27. [Google Scholar] [CrossRef]
- Scarpa, A.; Haden, S.C.; Tanaka, A. Being hot-tempered: Autonomic, emotional, and behavioral distinctions between childhood reactive and proactive aggression. Biol. Psychol. 2010, 84, 488–496. [Google Scholar] [CrossRef]
- Patriquin, M.A.; Lorenzi, J.; Scarpa, A.; Bell, M.A. Developmental trajectories of respiratory sinus arrhythmia: Associations with social responsiveness. Dev. Psychobiol. 2014, 56, 317–326. [Google Scholar] [CrossRef]
- Richter, M.; Lickenbrock, D.M. Cardiac physiological regulation across early infancy: The roles of infant surgency and parental involvement with mothers and fathers. Infant Behav. Dev. 2021, 64, 101597. [Google Scholar] [CrossRef] [PubMed]
- Feldman, R.; Rosenthal, Z.; Eidelman, A.I. Maternal-preterm skin-to-skin contact enhances child physiologic organization and cognitive control across the first 10 years of life. Biol. Psychiatry 2014, 75, 56–64. [Google Scholar] [CrossRef] [PubMed]
- Wagner, N.; Mills-Koonce, R.; Willoughby, M.; Propper, C.; Rehder, P.; Gueron-Sela, N. Respiratory sinus arrhythmia and heart period in infancy as correlates of later oppositional defiant and callous-unemotional behaviors. Int. J. Behav. Dev. 2017, 41, 127–135. [Google Scholar] [CrossRef] [PubMed]
- Aslin, R.N. How infants view natural scenes gathered from a head-mounted camera. Optom. Vis. Sci. 2009, 86, 561–565. [Google Scholar] [CrossRef]
- Braddick, O.; Atkinson, J. Development of human visual function. Vision Res. 2011, 51, 1588–1609. [Google Scholar] [CrossRef] [PubMed]
- Geisler, W.S. Visual perception and the statistical properties of natural scenes. Annu. Rev. Psychol. 2008, 59, 167–192. [Google Scholar] [CrossRef] [PubMed]
- Simoncelli, E.P. Vision and the statistics of the visual environment. Curr. Opin. Neurobiol. 2003, 13, 144–149. [Google Scholar] [CrossRef]
- Sinha, P.; Balas, B.; Ostrovsky, Y. Discovering faces in infancy. J. Vis. 2007, 7, 569. [Google Scholar]
- Jayaraman, S.; Fausey, C.M.; Smith, L.B. Why are faces denser in the visual experiences of younger than older infants? Dev. Psychol. 2017, 53, 38. [Google Scholar] [CrossRef]
- Jayaraman, S.; Smith, L.B. Faces in early visual environments are persistent not just frequent. Vision Res. 2019, 157, 213–221. [Google Scholar] [CrossRef]
- Johnson, M.H. Interactive specialization: A domain-general framework for human functional brain development? Dev. Cogn. Neurosci. 2011, 1, 7–21. [Google Scholar] [CrossRef] [PubMed]
- Thelen, E.; Smith, L.B. Dynamic systems theories. In Handbook of Child Psychology; Damon, W., Lerner, R.M., Lerner, R.M., Eds.; Wiley: Hoboken, NJ, USA, 2007. [Google Scholar]
- Bigelow, A.E.; Rochat, P. Two-month-old infants’ sensitivity to social contingency in mother–infant and stranger–infant interaction. Infancy 2006, 9, 313–325. [Google Scholar] [CrossRef] [PubMed]
- Werker, J.F.; Pons, F.; Dietrich, C.; Kajikawa, S.; Fais, L.; Amano, S. Infant-directed speech supports phonetic category learning in English and Japanese. Cognition 2007, 103, 147–162. [Google Scholar] [CrossRef]
- Kretch, K.S.; Franchak, J.M.; Adolph, K.E. Crawling and walking infants see the world differently. Child Dev. 2014, 85, 1503–1518. [Google Scholar] [CrossRef] [PubMed]
- Campos, J.J.; Thein, S.; Owen, D. A Darwinian legacy to understanding human infancy: Emotional expressions as behavior regulators. Ann. N. Y. Acad. Sci. 2003, 1000, 110–134. [Google Scholar] [CrossRef] [PubMed]
- Burbank, B.; McGregor, D.; Wild, M. ‘My special, my special thing, and my camera!’ Using GoPro™ as a complementary research tool to investigate young children’s museum experiences. Mus. Soc. 2018, 16, 311–333. [Google Scholar] [CrossRef]
- Ohnishi, A.; Murao, K.; Terada, T.; Tsukamoto, M. A method for structuring meeting logs using wearable sensors. Internet Things 2019, 5, 140–152. [Google Scholar] [CrossRef]
- Prieto-Avalos, G.; Cruz-Ramos, N.A.; Alor-Hernández, G.; Sánchez-Cervantes, J.L.; Rodríguez-Mazahua, L.; Guarneros-Nolasco, L.R. Wearable devices for physical monitoring of heart: A review. Biosensors 2022, 12, 292. [Google Scholar] [CrossRef]
- Kamble, P.M. Life Logging: A Practicable Approach. In Proceedings of the 2018 Fourth International Conference on Computing Communication Control and Automation, Pune, India, 16–18 August 2018; pp. 1–4. [Google Scholar]
- Rodin, I.; Furnari, A.; Mavroeidis, D.; Farinella, G.M. Predicting the future from first person (egocentric) vision: A survey. Comput. Vis. Image Und. 2021, 211, 103252. [Google Scholar] [CrossRef]
- Yoon, H.; Kim, S.K.; Lee, Y.; Choi, J. Google glass-supported cooperative training for health professionals: A case study based on using remote desktop virtual support. J. Multidiscip. Healthc. 2021, 14, 1451–1462. [Google Scholar] [CrossRef]
- Borjon, J.I.; Schroer, S.E.; Bambach, S.; Slone, L.K.; Abney, D.H.; Crandall, D.J.; Smith, L.B. A view of their own: Capturing the egocentric view of infants and toddlers with head-mounted cameras. J. Vis. Exp. 2018, 140, e58445. [Google Scholar]
- Sullivan, J.; Mei, M.; Perfors, A.; Wojcik, E.; Frank, M.C. SAYCam: A large, longitudinal audiovisual dataset recorded from the infant’s perspective. Open Mind 2022, 5, 20–29. [Google Scholar] [CrossRef] [PubMed]
- Kliper-Gross, O.; Gurovich, Y.; Hassner, T.; Wolf, L. Motion interchange patterns for action recognition in unconstrained videos. In Proceedings of the Computer Vision–ECCV 2012: 12th European Conference on Computer Vision, Florence, Italy, 7–13 October 2012; pp. 256–269. [Google Scholar]
- Ye, V.; Pavlakos, G.; Malik, J.; Kanazawa, A. Decoupling human and camera motion from videos in the wild. In Proceedings of the IEEE/CVF Conference on Computer Vision and Pattern Recognition, Vancouver, BC, Canada, 17–24 June 2023; pp. 21222–21232. [Google Scholar]
- Grooby, E.; Sitaula, C.; Chang Kwok, T.n.; Sharkey, D.; Marzbanrad, F.; Malhotra, A. Artificial intelligence-driven wearable technologies for neonatal cardiorespiratory monitoring: Part 1 wearable technology. Pediatr. Res. 2023, 93, 413–425. [Google Scholar] [CrossRef] [PubMed]
- Celka, P.; Granqvist, N.; Schwabl, H.; Lutz, M.; Carton, E.; Baut, J. Estimation of SpO2 at the Upper Arm. Available online: https://www.researchgate.net/publication/347751990_Estimation_of_SpO2_at_the_Upper_Arm (accessed on 18 July 2023).
- Geangu, E.; Hauf, P.; Bhardwaj, R.; Bentz, W. Infant pupil diameter changes in response to others’ positive and negative emotions. PLoS ONE 2011, 6, e27132. [Google Scholar] [CrossRef] [PubMed]
- Geangu, E.; Vuong, Q.C. Seven-months-old infants show increased arousal to static emotion body expressions: Evidence from pupil dilation. Infancy 2023, 28, 820–835. [Google Scholar] [CrossRef] [PubMed]
- Crespo-Llado, M.M.; Vanderwert, R.E.; Geangu, E. Individual differences in infants’ neural responses to their peers’ cry and laughter. Biol. Psychol. 2018, 135, 117–127. [Google Scholar] [CrossRef] [PubMed]
- Hoehl, S.; Wahl, S. Recording infant ERP data for cognitive research. Dev. Neuropsychol. 2012, 37, 187–209. [Google Scholar] [CrossRef] [PubMed]
- Quadrelli, E.; Geangu, E.; Turati, C. Human action sounds elicit sensorimotor activation early in life. Cortex 2019, 117, 323–335. [Google Scholar] [CrossRef]
- Geangu, E.; Senna, I.; Croci, E.; Turati, C. The effect of biomechanical properties of motion on infants’ perception of goal-directed grasping actions. J. Exp. Child Psychol. 2015, 129, 55–67. [Google Scholar] [CrossRef]
- Task force of the European society of cardiology and the north American society of pacing and electrophysiology. Heart rate variability. Standards of measurement, physiological interpretation, and clinical use. Eur. Heart J. 1996, 17, 354–381. [CrossRef]
- Kwon, O.; Jeong, J.; Kim, H.B.; Kwon, I.H.; Park, S.Y.; Kim, J.E.; Choi, Y. Electrocardiogram sampling frequency range acceptable for heart rate variability analysis. Healthc. Inform. Res. 2018, 24, 198–206. [Google Scholar] [CrossRef]
- Franchak, J.M.; Kretch, K.S.; Soska, K.C.; Adolph, K.E. Head-mounted eye tracking: A new method to describe infant looking. Child Dev. 2011, 82, 1738–1750. [Google Scholar] [CrossRef] [PubMed]
- Holmqvist, K.; Örbom, S.L.; Hooge, I.T.; Niehorster, D.C.; Alexander, R.G.; Andersson, R.; Benjamins, J.S.; Blignaut, P.; Brouwer, A.-M.; Chuang, L.L. Eye tracking: Empirical foundations for a minimal reporting guideline. Behav. Res. Methods 2023, 55, 364–416. [Google Scholar] [CrossRef] [PubMed]
- Jeyhani, V.; Mäntysalo, M.; Noponen, K.; Seppänen, T.; Vehkaoja, A. Effect of different ECG leads on estimated R–R intervals and heart rate variability parameters. In Proceedings of the 41st Annual International Conference of the IEEE Engineering in Medicine and Biology Society, Berlin, Germany, 23–27 July 2019; pp. 3786–3790. [Google Scholar]
- Nelson, B.W.; Allen, N.B. Accuracy of consumer wearable heart rate measurement during an ecologically valid 24-hour period: Intraindividual validation study. JMIR Mhealth Uhealth 2019, 7, e10828. [Google Scholar] [CrossRef]
- Xu, M.; Sun, W.; Alam, M. Security enhancement of secure USB debugging in Android system. In Proceedings of the 2015 12th Annual IEEE Consumer Communications and Networking Conference, Las Vegas, NV, USA, 9–12 January 2015; pp. 134–139. [Google Scholar]
- Wrótniak, K. Android-gif-Drawable, GitHub Repository. Available online: https://github.com/koral--/android-gif-drawable (accessed on 30 June 2023).
- Hardiannico, A. SimpleStorage, GitHub Repository. Available online: https://github.com/anggrayudi/SimpleStorage (accessed on 30 June 2023).
- Tomar, S. Converting video formats with FFmpeg. Linux J. 2006, 2006, 10. [Google Scholar]
- Pan, J.; Tompkins, W. A real-time QRS detection algorithm. IEEE Trans. Biomed. Eng. 1985, BME-32, 230–236. [Google Scholar] [CrossRef] [PubMed]
- Velayudhan, A.; Peter, S. Noise analysis and different denoising techniques of ECG signal-a survey. J. Electron. Commun. Eng. 2016, 1, 40–44. [Google Scholar]
- Makowski, D.; Pham, T.; Lau, Z.J.; Brammer, J.C.; Lespinasse, F.; Pham, H.; Schölzel, C.; Chen, S.A. NeuroKit2: A Python toolbox for neurophysiological signal processing. Behav. Res. Methods 2021, 53, 1689–1696. [Google Scholar] [CrossRef] [PubMed]
- Campero Jurado, I.; Lorato, I.; Morales, J.; Fruytier, L.; Stuart, S.; Panditha, P.; Janssen, D.M.; Rossetti, N.; Uzunbajakava, N.; Serban, I.B. Signal quality analysis for long-term ECG monitoring using a health patch in cardiac patients. Sensors 2023, 23, 2130. [Google Scholar] [CrossRef]
- Venkatachalam, K.; Herbrandson, J.E.; Asirvatham, S.J. Signals and signal processing for the electrophysiologist: Part I: Electrogram acquisition. Circ. Arrhythmia Elect. 2011, 4, 965–973. [Google Scholar] [CrossRef]
- Charlton, P.H.; Bonnici, T.; Tarassenko, L.; Clifton, D.A.; Beale, R.; Watkinson, P.J. An assessment of algorithms to estimate respiratory rate from the electrocardiogram and photoplethysmogram. Physiol. Meas. 2016, 37, 610. [Google Scholar] [CrossRef]
- Hirokawa, J.; Hitosugi, T.; Miki, Y.; Tsukamoto, M.; Yamasaki, F.; Kawakubo, Y.; Yokoyama, T. The influence of electrocardiogram (ECG) filters on the heights of R and T waves in children. Sci. Rep. 2022, 12, 13279. [Google Scholar] [CrossRef] [PubMed]
- Van Gent, P.; Farah, H.; Van Nes, N.; Van Arem, B. HeartPy: A novel heart rate algorithm for the analysis of noisy signals. Transp. Res. F—Traffic Psych. Behav. 2019, 66, 368–378. [Google Scholar] [CrossRef]
- Rodrigues, T.; Samoutphonh, S.; Silva, H.; Fred, A. A Low-Complexity R-peak Detection Algorithm with Adaptive Thresholding for Wearable Devices. In Proceedings of the 25th International Conference on Pattern Recognition, Milan, Italy, 10–15 January 2021; pp. 1–8. [Google Scholar]
- Zhang, Z.; Li, Z.; Li, Z. An improved real-time R-wave detection efficient algorithm in exercise ECG signal analysis. J. Healthc. Eng. 2020, 2020, 8868685. [Google Scholar] [CrossRef] [PubMed]
- Kramer, L.; Menon, C.; Elgendi, M. ECGAssess: A Python-based toolbox to assess ECG lead signal quality. Front. Digit. Health 2022, 4, 847555. [Google Scholar] [CrossRef] [PubMed]
- Rodrigues, J.; Belo, D.; Gamboa, H. Noise detection on ECG based on agglomerative clustering of morphological features. Comput. Biol. Med. 2017, 87, 322–334. [Google Scholar] [CrossRef] [PubMed]
- Jiang, C.; de Armendi, J.T.; Smith, B.A. The immediate effect of positioning devices on infant leg movement characteristics. Pediatr. Phys. Ther. 2016, 28, 304. [Google Scholar] [CrossRef] [PubMed]
- Teed, Z.; Deng, J. Raft: Recurrent all-pairs field transforms for optical flow. In Proceedings of the Computer Vision–ECCV 2020: 16th European Conference, Glasgow, UK, 23–28 August 2020; pp. 402–419. [Google Scholar]
- Tan, M.; Le, Q. Efficientnet: Rethinking model scaling for convolutional neural networks. In Proceedings of the International Conference on Machine Learning, Long Beach, CA, USA, 9–15 June 2019; pp. 6105–6114. [Google Scholar]
- Gamboa, H.; Silva, H.; Fred, A. HiMotion: A new research resource for the study of behavior, cognition, and emotion. Multimed. Tools Appl. 2014, 73, 345–375. [Google Scholar] [CrossRef]
- Gamboa, P.; Varandas, R.; Rodrigues, J.; Cepeda, C.; Quaresma, C.; Gamboa, H. Attention classification based on biosignals during standard cognitive tasks for occupational domains. Computers 2022, 11, 49. [Google Scholar] [CrossRef]
- Osório, D.N.; Viana-Soares, R.; Marto, J.P.; Mendonça, M.D.; Silva, H.P.; Quaresma, C.; Viana-Baptista, M.; Gamboa, H.; Vieira, H.L. Autonomic nervous system response to remote ischemic conditioning: Heart rate variability assessment. BMC Cardiovasc. Disord. 2019, 19, 211. [Google Scholar]
- Atilla, F.; Alimardani, M.; Kawamoto, T.; Hiraki, K. Mother-child inter-brain synchrony during a mutual visual search task: A study of feedback valence and role. Soc. Neurosci. 2023, 1–13. [Google Scholar] [CrossRef]
- Jeon, H.-J.; Peterson, C.A.; DeCoster, J. Parent–child interaction, task-oriented regulation, and cognitive development in toddlers facing developmental risks. J. Appl. Dev. Psychol. 2013, 34, 257–267. [Google Scholar] [CrossRef]
- Saby, J.N.; Marshall, P.J. The utility of EEG band power analysis in the study of infancy and early childhood. Dev. Neuropsychol. 2012, 37, 253–273. [Google Scholar] [CrossRef] [PubMed]
- Vuong, Q.C.; Geangu, E. The development of emotion processing of body expressions from infancy to early childhood: A meta-analysis. Front. Cogn. 2023, 2, 1155031. [Google Scholar] [CrossRef]


| Narrow-FOV HMC | Wide-FOV HMC | |||
|---|---|---|---|---|
| Age | N | Mean Age | N | Mean Age |
| (Months—m, Days—d) | (Months—m, Days—d) | |||
| 6 months | 10 | 6 m, 8 d | NA | NA |
| 12 months | 8 | 12 m, 15 d | 8 | 11 m, 28 d |
| 24 months | 10 | 24 m, 28 d | 6 | 25 m, 2 d |
| 36 months | 5 | 37 m, 5 d | 4 | 38 m, 2 d |
| Adults | 9 | 306 m, 28 d | 9 | 361 m, 9 d |
| Age | N | Mean Age |
|---|---|---|
| Months—m, Days—d | ||
| 3 months | 6 | 3 m, 27 d |
| 6 months | 5 | 6 m, 41 d |
| 9 months | 3 | 8 m, 85 d |
| 12 months | 8 | 13 m, 0 d |
| 24 months | 3 | 25 m, 18 d |
| 36 months | 5 | 37 m, 71 d |
Disclaimer/Publisher’s Note: The statements, opinions and data contained in all publications are solely those of the individual author(s) and contributor(s) and not of MDPI and/or the editor(s). MDPI and/or the editor(s) disclaim responsibility for any injury to people or property resulting from any ideas, methods, instructions or products referred to in the content. |
© 2023 by the authors. Licensee MDPI, Basel, Switzerland. This article is an open access article distributed under the terms and conditions of the Creative Commons Attribution (CC BY) license (https://creativecommons.org/licenses/by/4.0/).
Share and Cite
Geangu, E.; Smith, W.A.P.; Mason, H.T.; Martinez-Cedillo, A.P.; Hunter, D.; Knight, M.I.; Liang, H.; del Carmen Garcia de Soria Bazan, M.; Tse, Z.T.H.; Rowland, T.; et al. EgoActive: Integrated Wireless Wearable Sensors for Capturing Infant Egocentric Auditory–Visual Statistics and Autonomic Nervous System Function ‘in the Wild’. Sensors 2023, 23, 7930. https://doi.org/10.3390/s23187930
Geangu E, Smith WAP, Mason HT, Martinez-Cedillo AP, Hunter D, Knight MI, Liang H, del Carmen Garcia de Soria Bazan M, Tse ZTH, Rowland T, et al. EgoActive: Integrated Wireless Wearable Sensors for Capturing Infant Egocentric Auditory–Visual Statistics and Autonomic Nervous System Function ‘in the Wild’. Sensors. 2023; 23(18):7930. https://doi.org/10.3390/s23187930
Chicago/Turabian StyleGeangu, Elena, William A. P. Smith, Harry T. Mason, Astrid Priscilla Martinez-Cedillo, David Hunter, Marina I. Knight, Haipeng Liang, Maria del Carmen Garcia de Soria Bazan, Zion Tsz Ho Tse, Thomas Rowland, and et al. 2023. "EgoActive: Integrated Wireless Wearable Sensors for Capturing Infant Egocentric Auditory–Visual Statistics and Autonomic Nervous System Function ‘in the Wild’" Sensors 23, no. 18: 7930. https://doi.org/10.3390/s23187930