
Implementation of Non-Contact Temperature Distribution Monitoring Solutions for Railway Vehicles in a Sustainability Development System Transport


Abstract
:1. Introduction
- latest (years 2017, 2018, and 2019);
- medium (years 2008, 2011, and 2012); and,
- older—senior (year 1975).
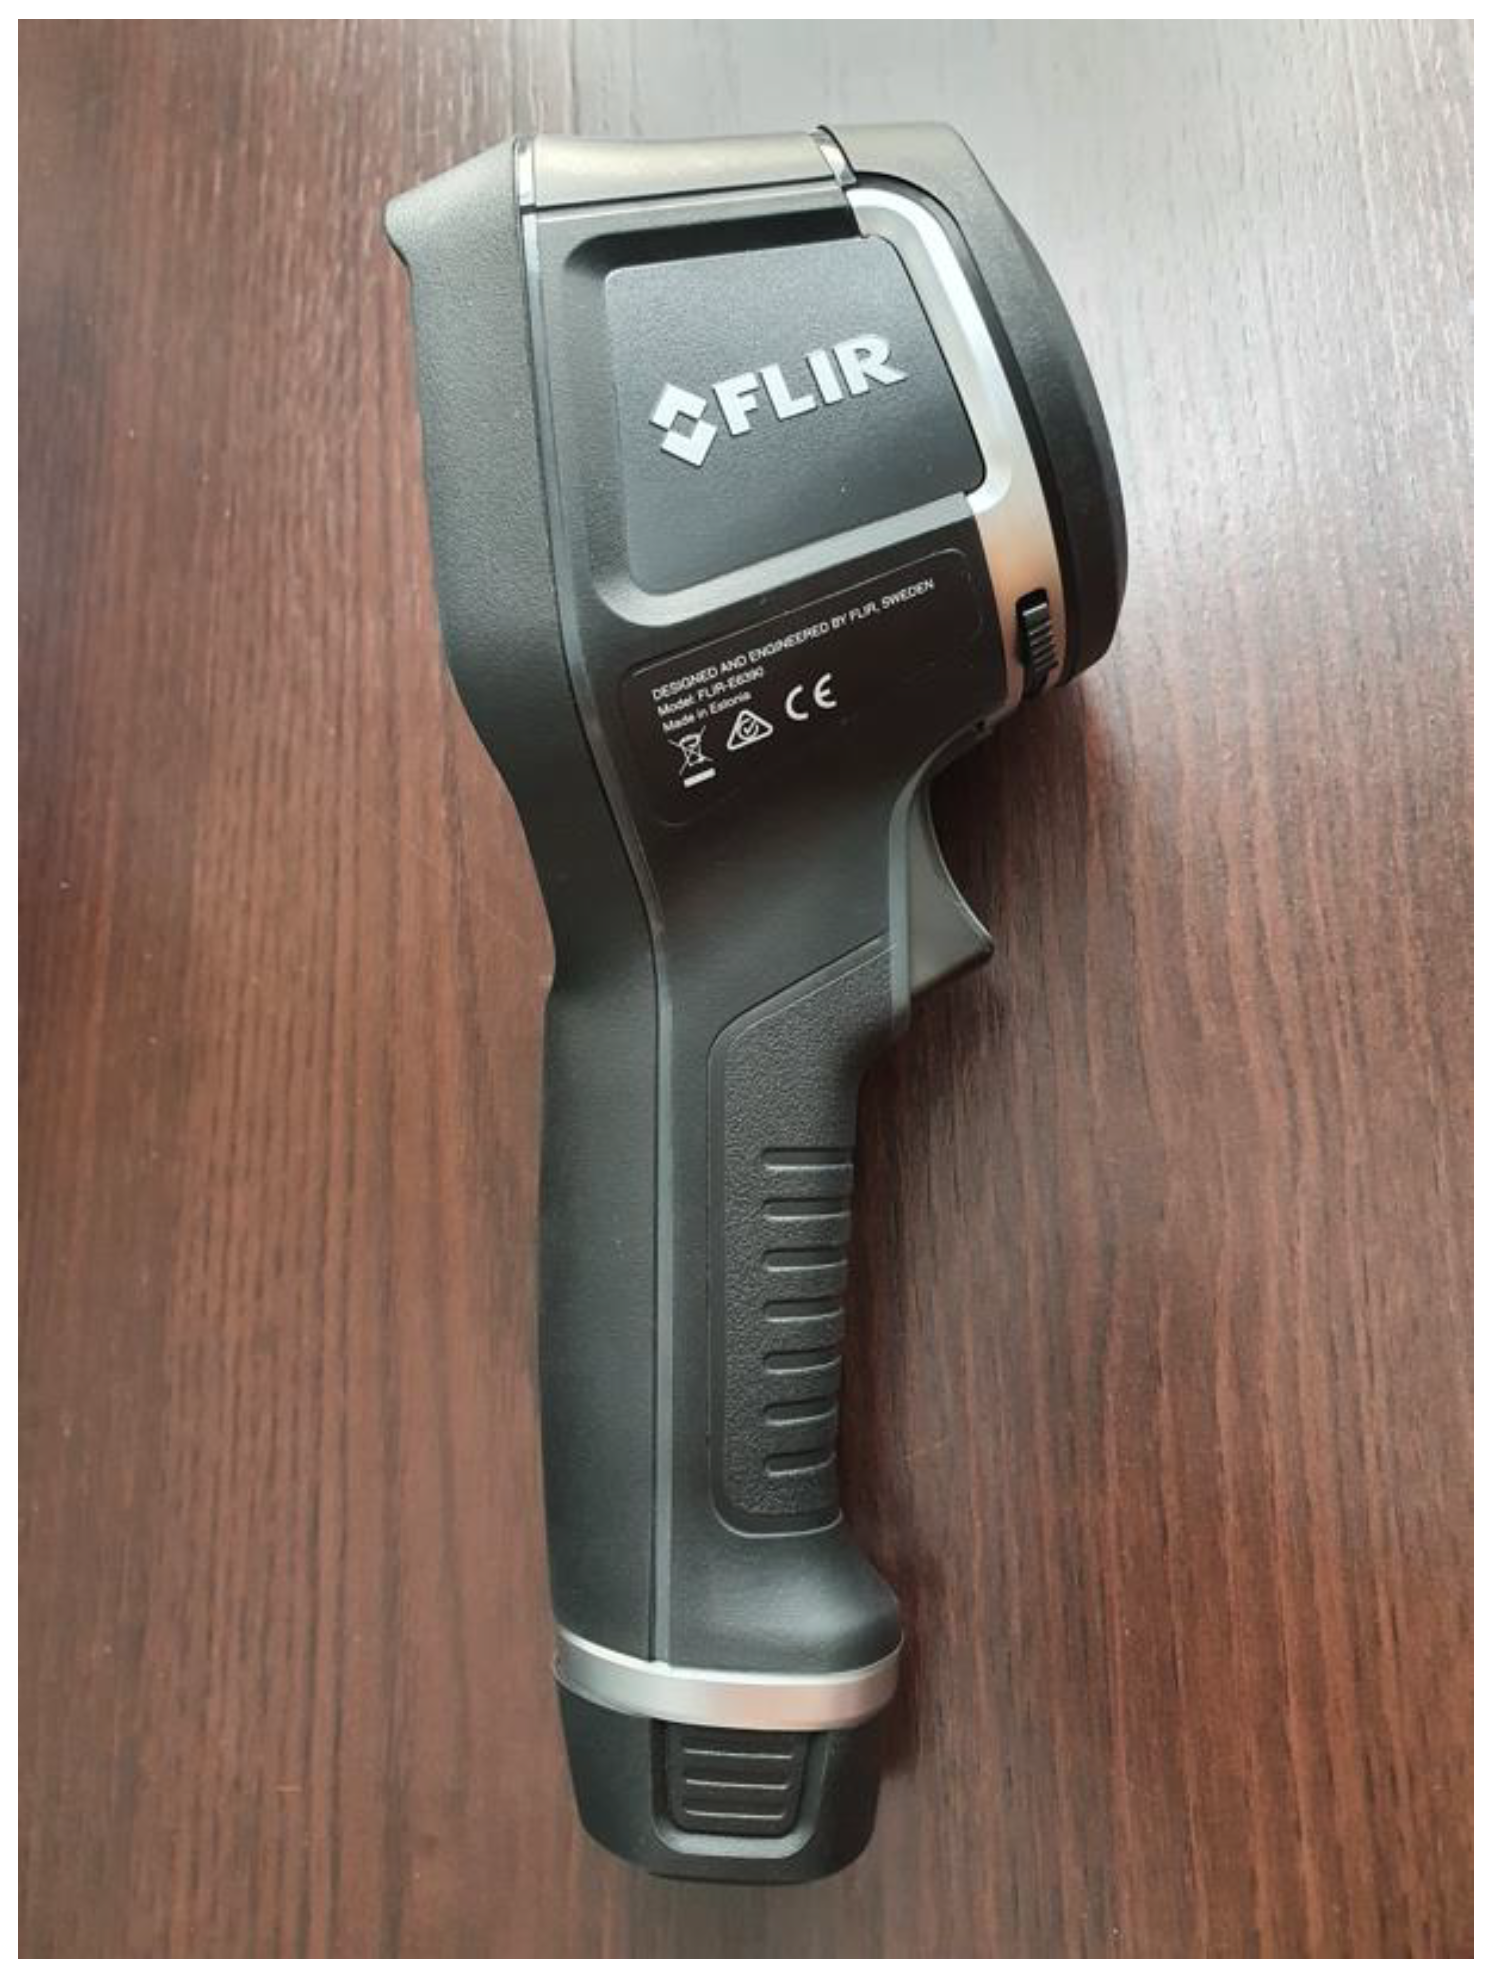
- assessing the quality of the rail vehicle body in exploitation and its thermal insulation, as well as the location of thermal bridges and the tightness of the railway vehicles body using temperature sensors, represented by the FLIR-E6390 thermal imaging camera;
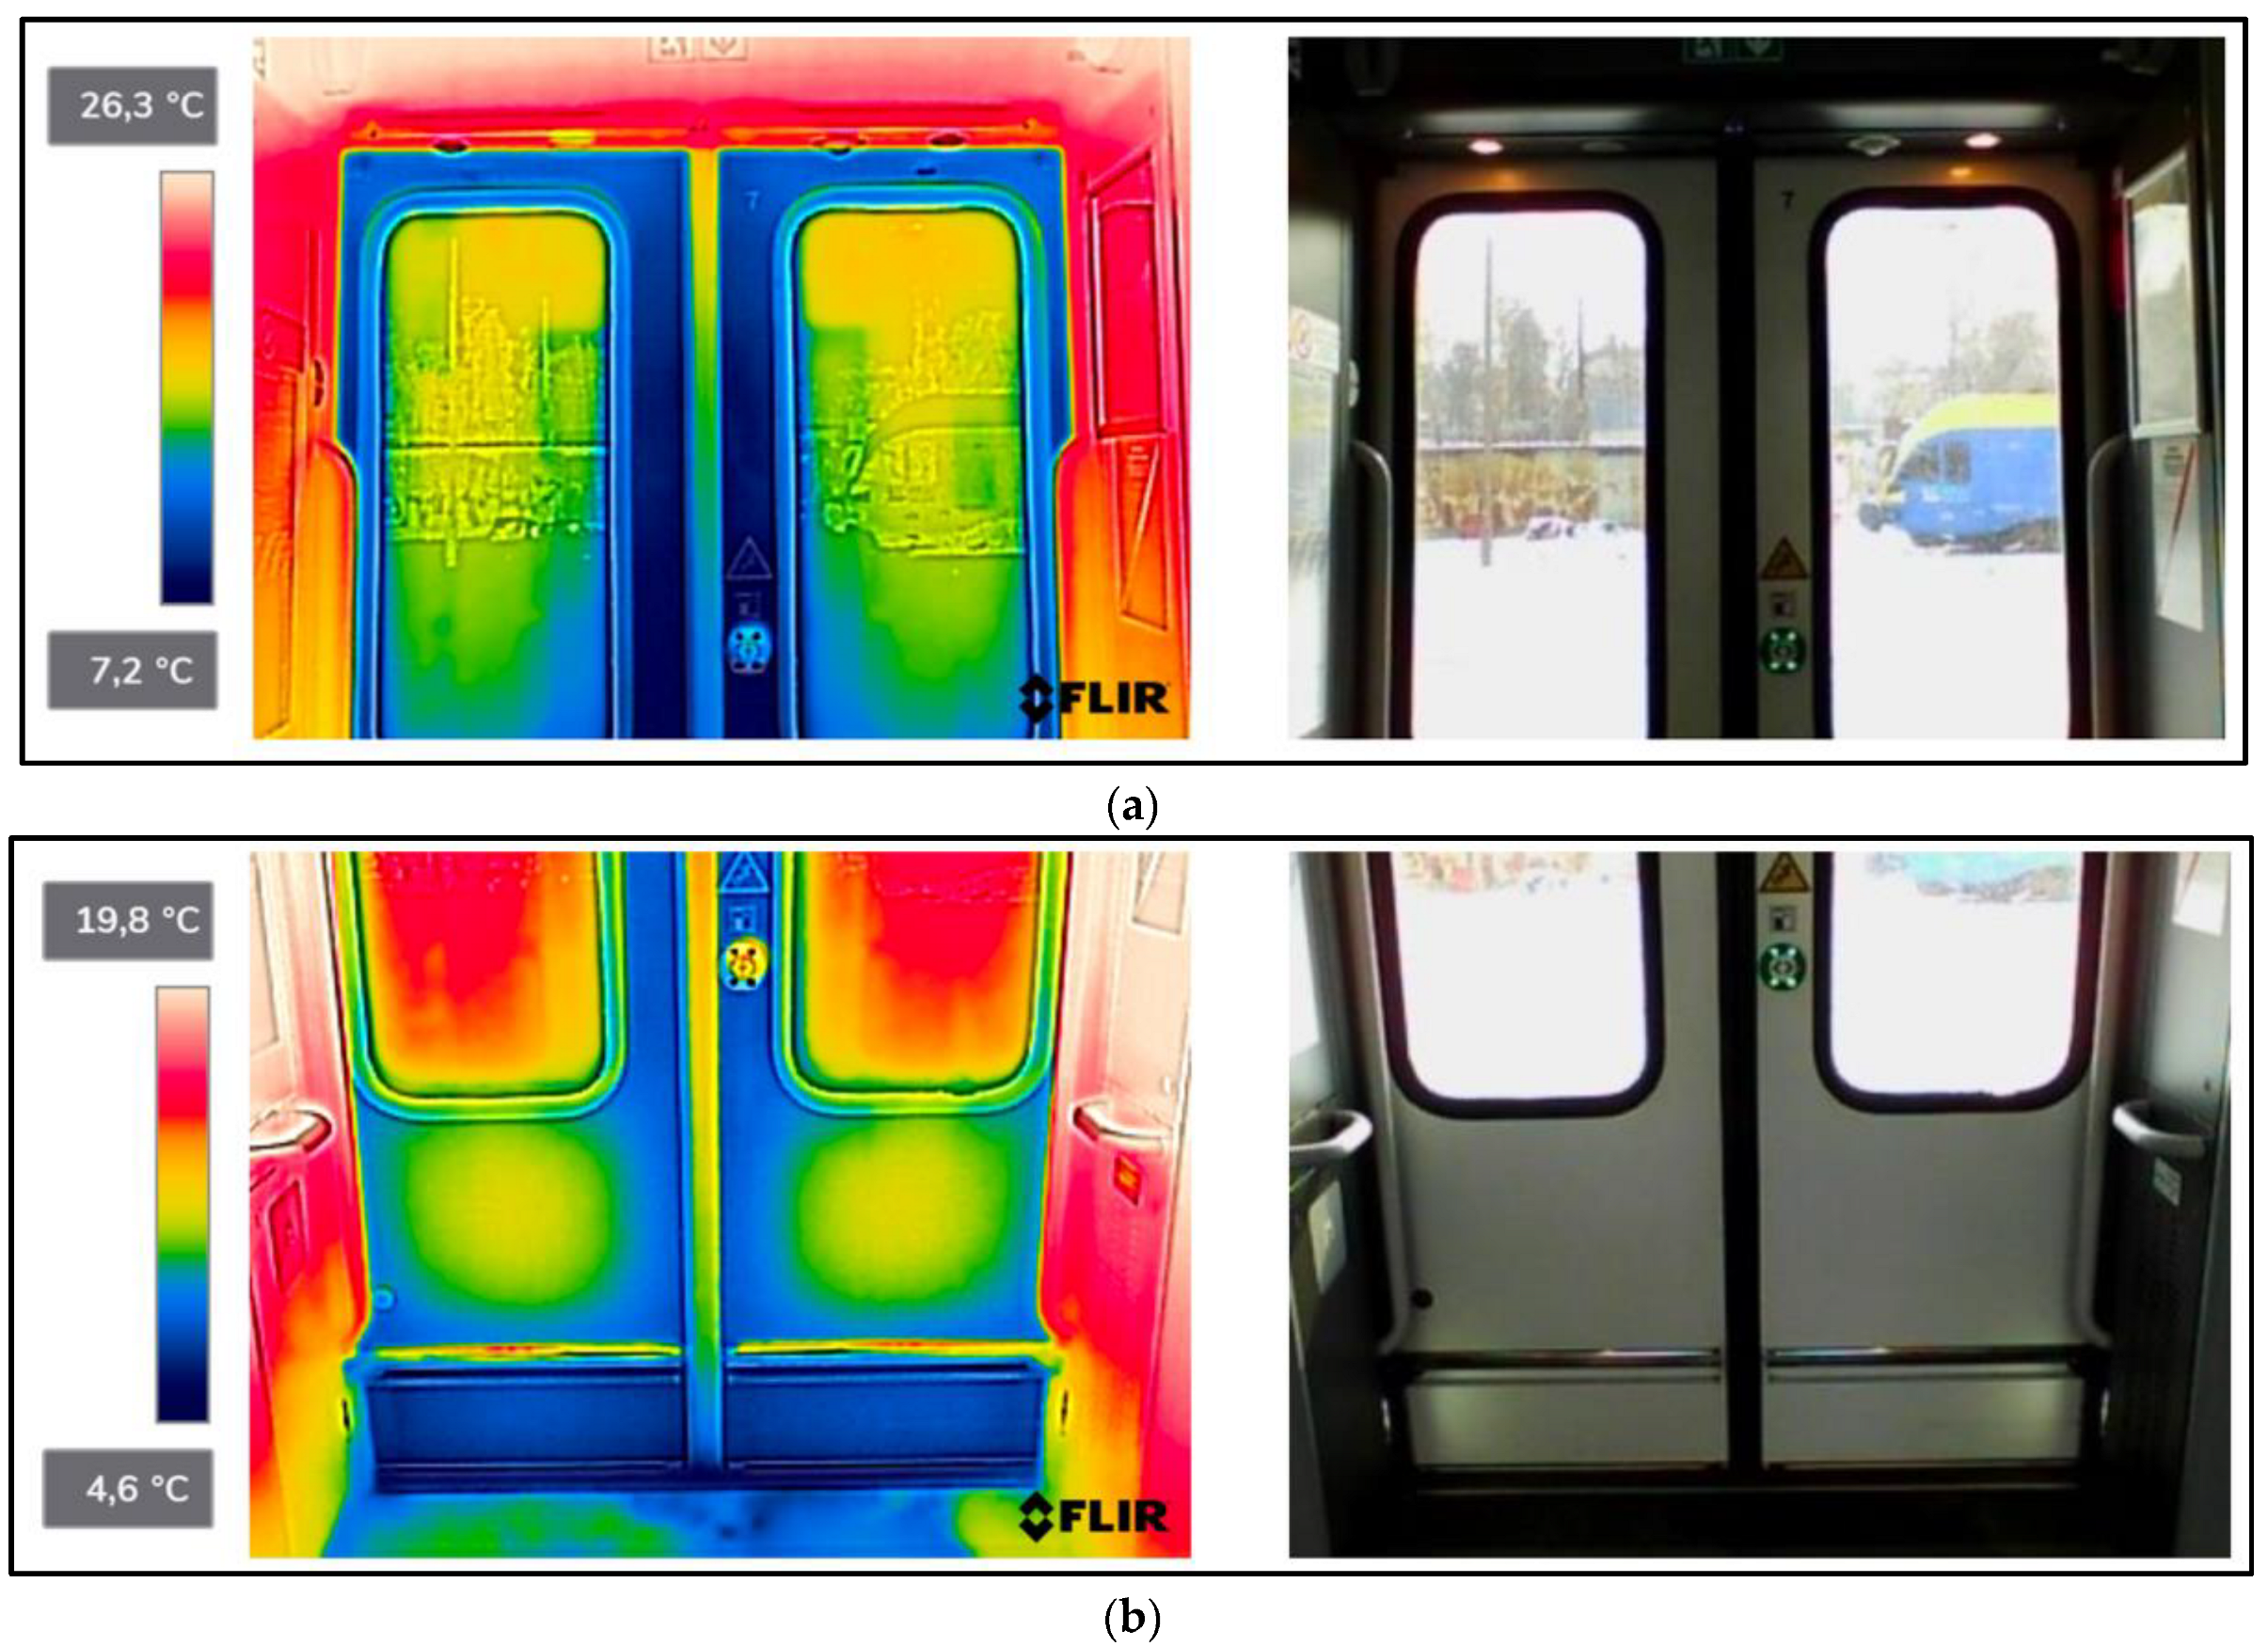
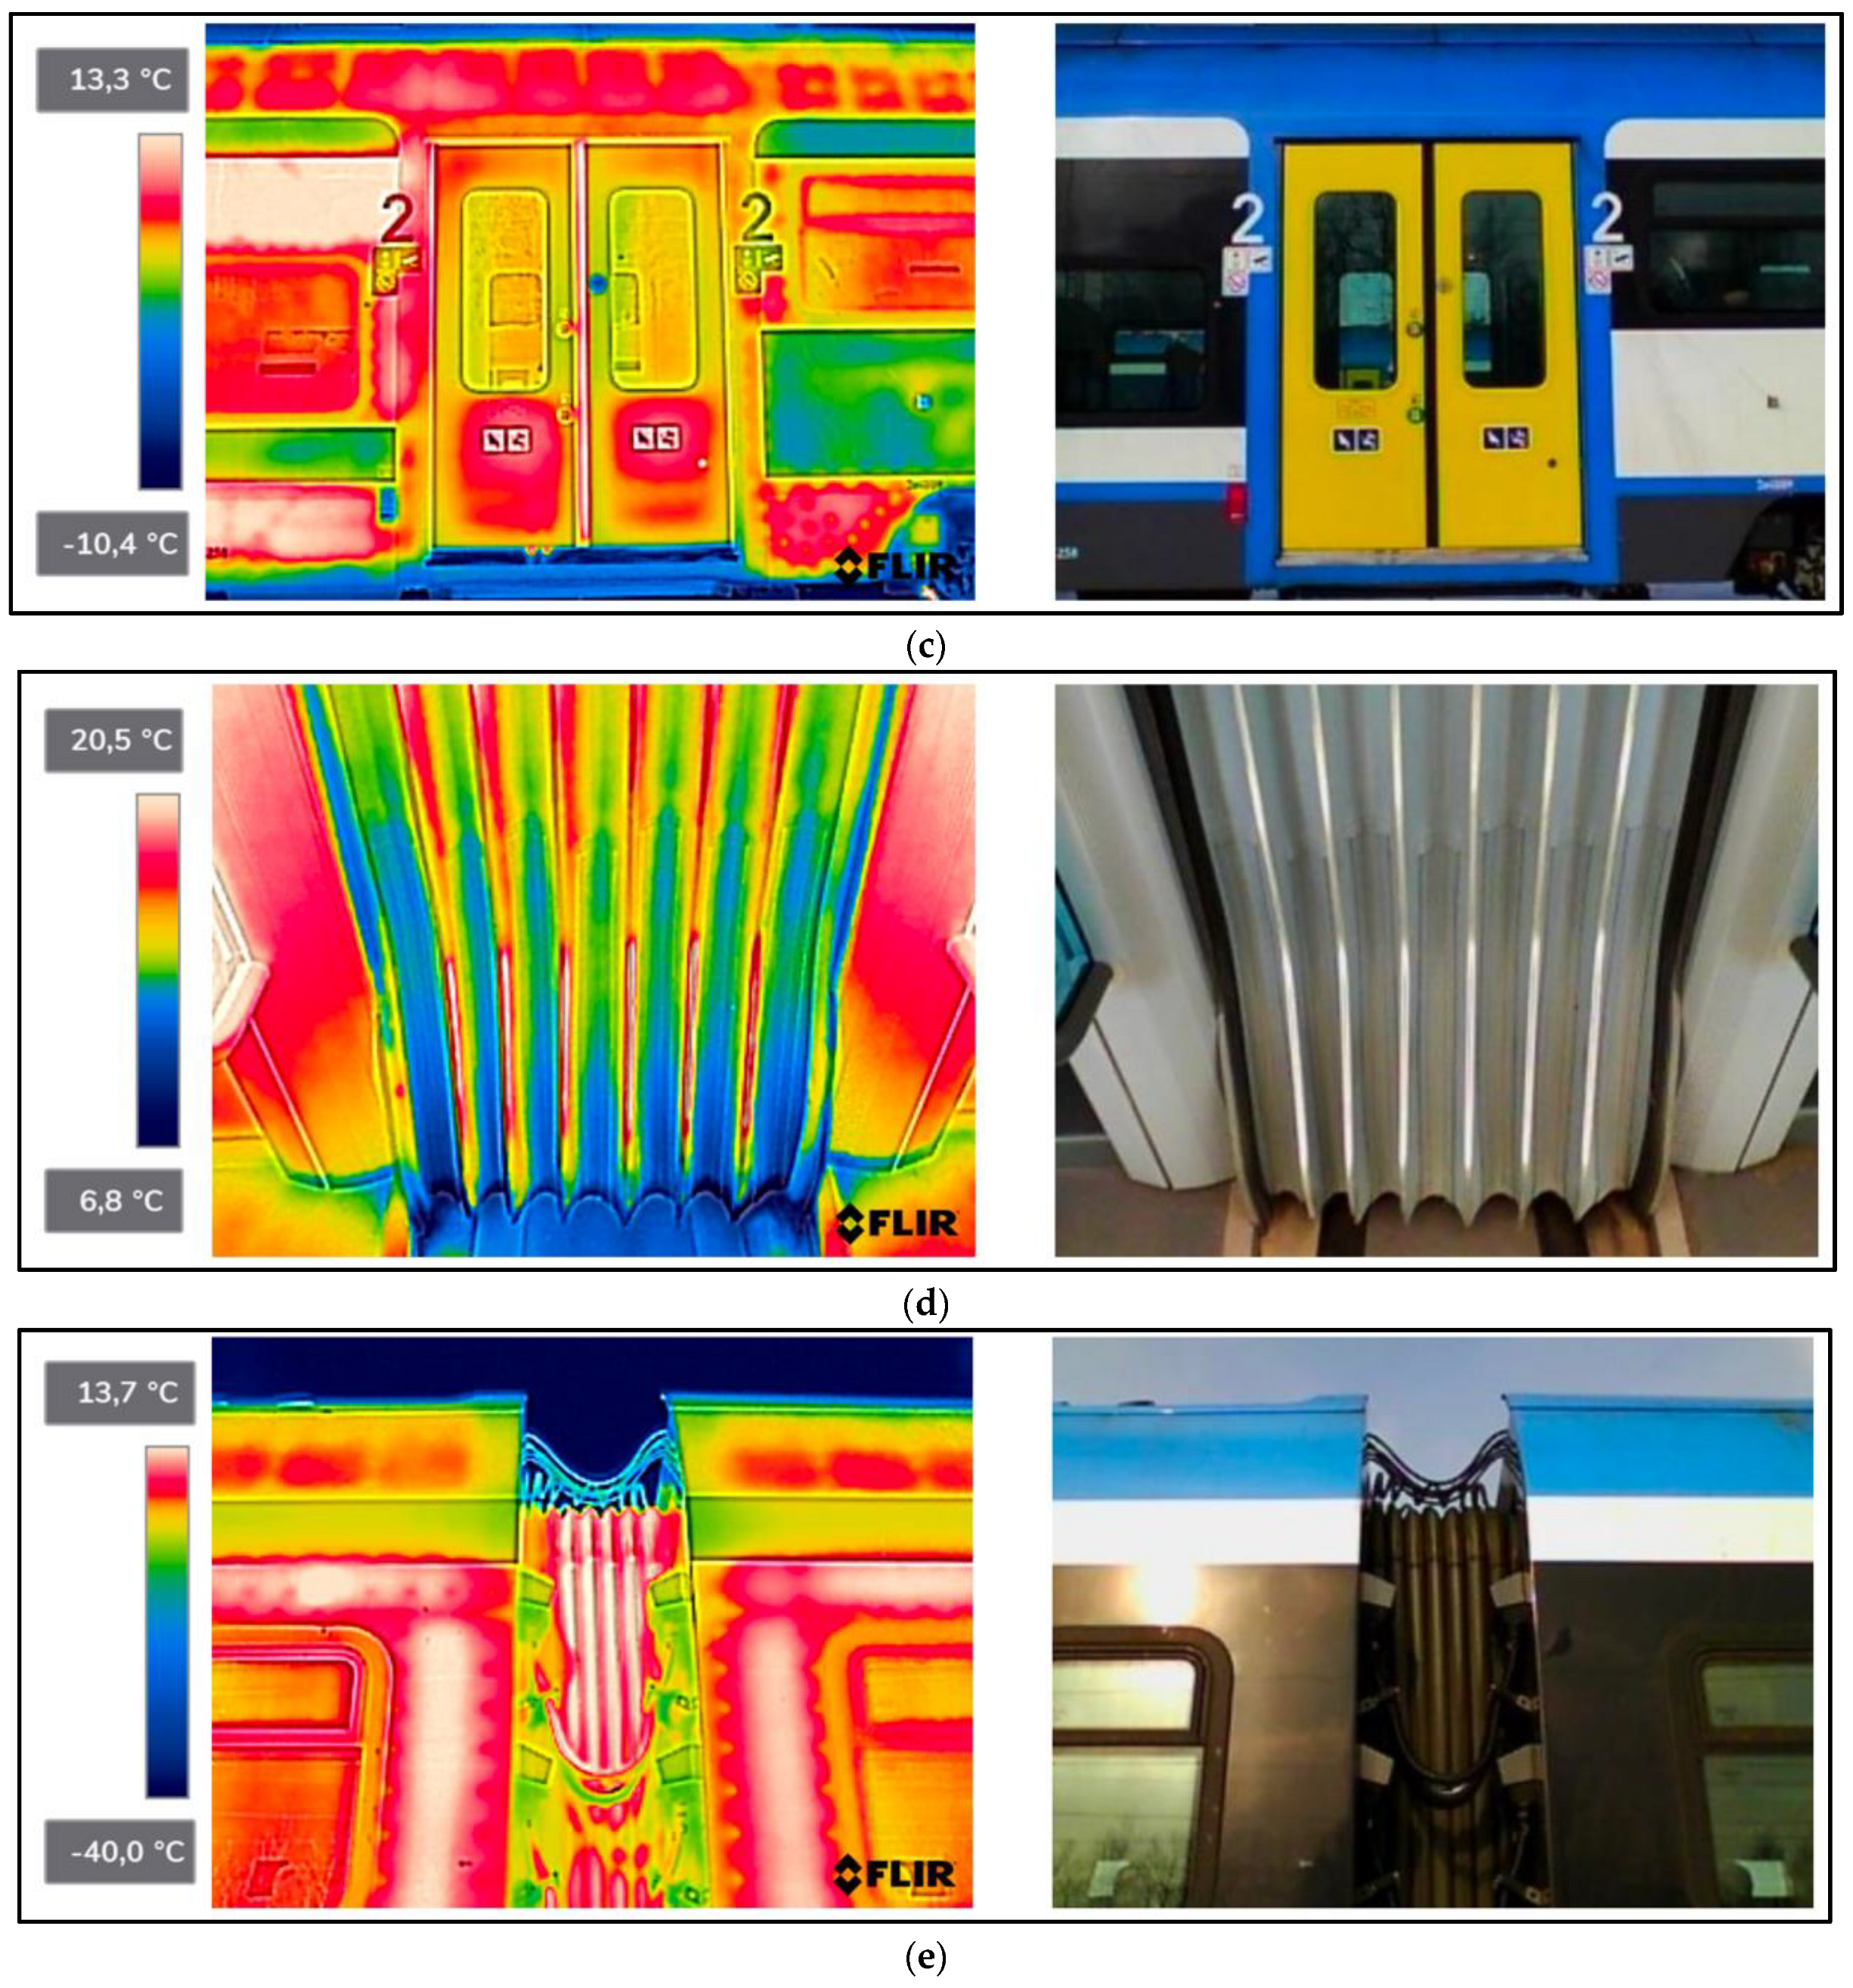
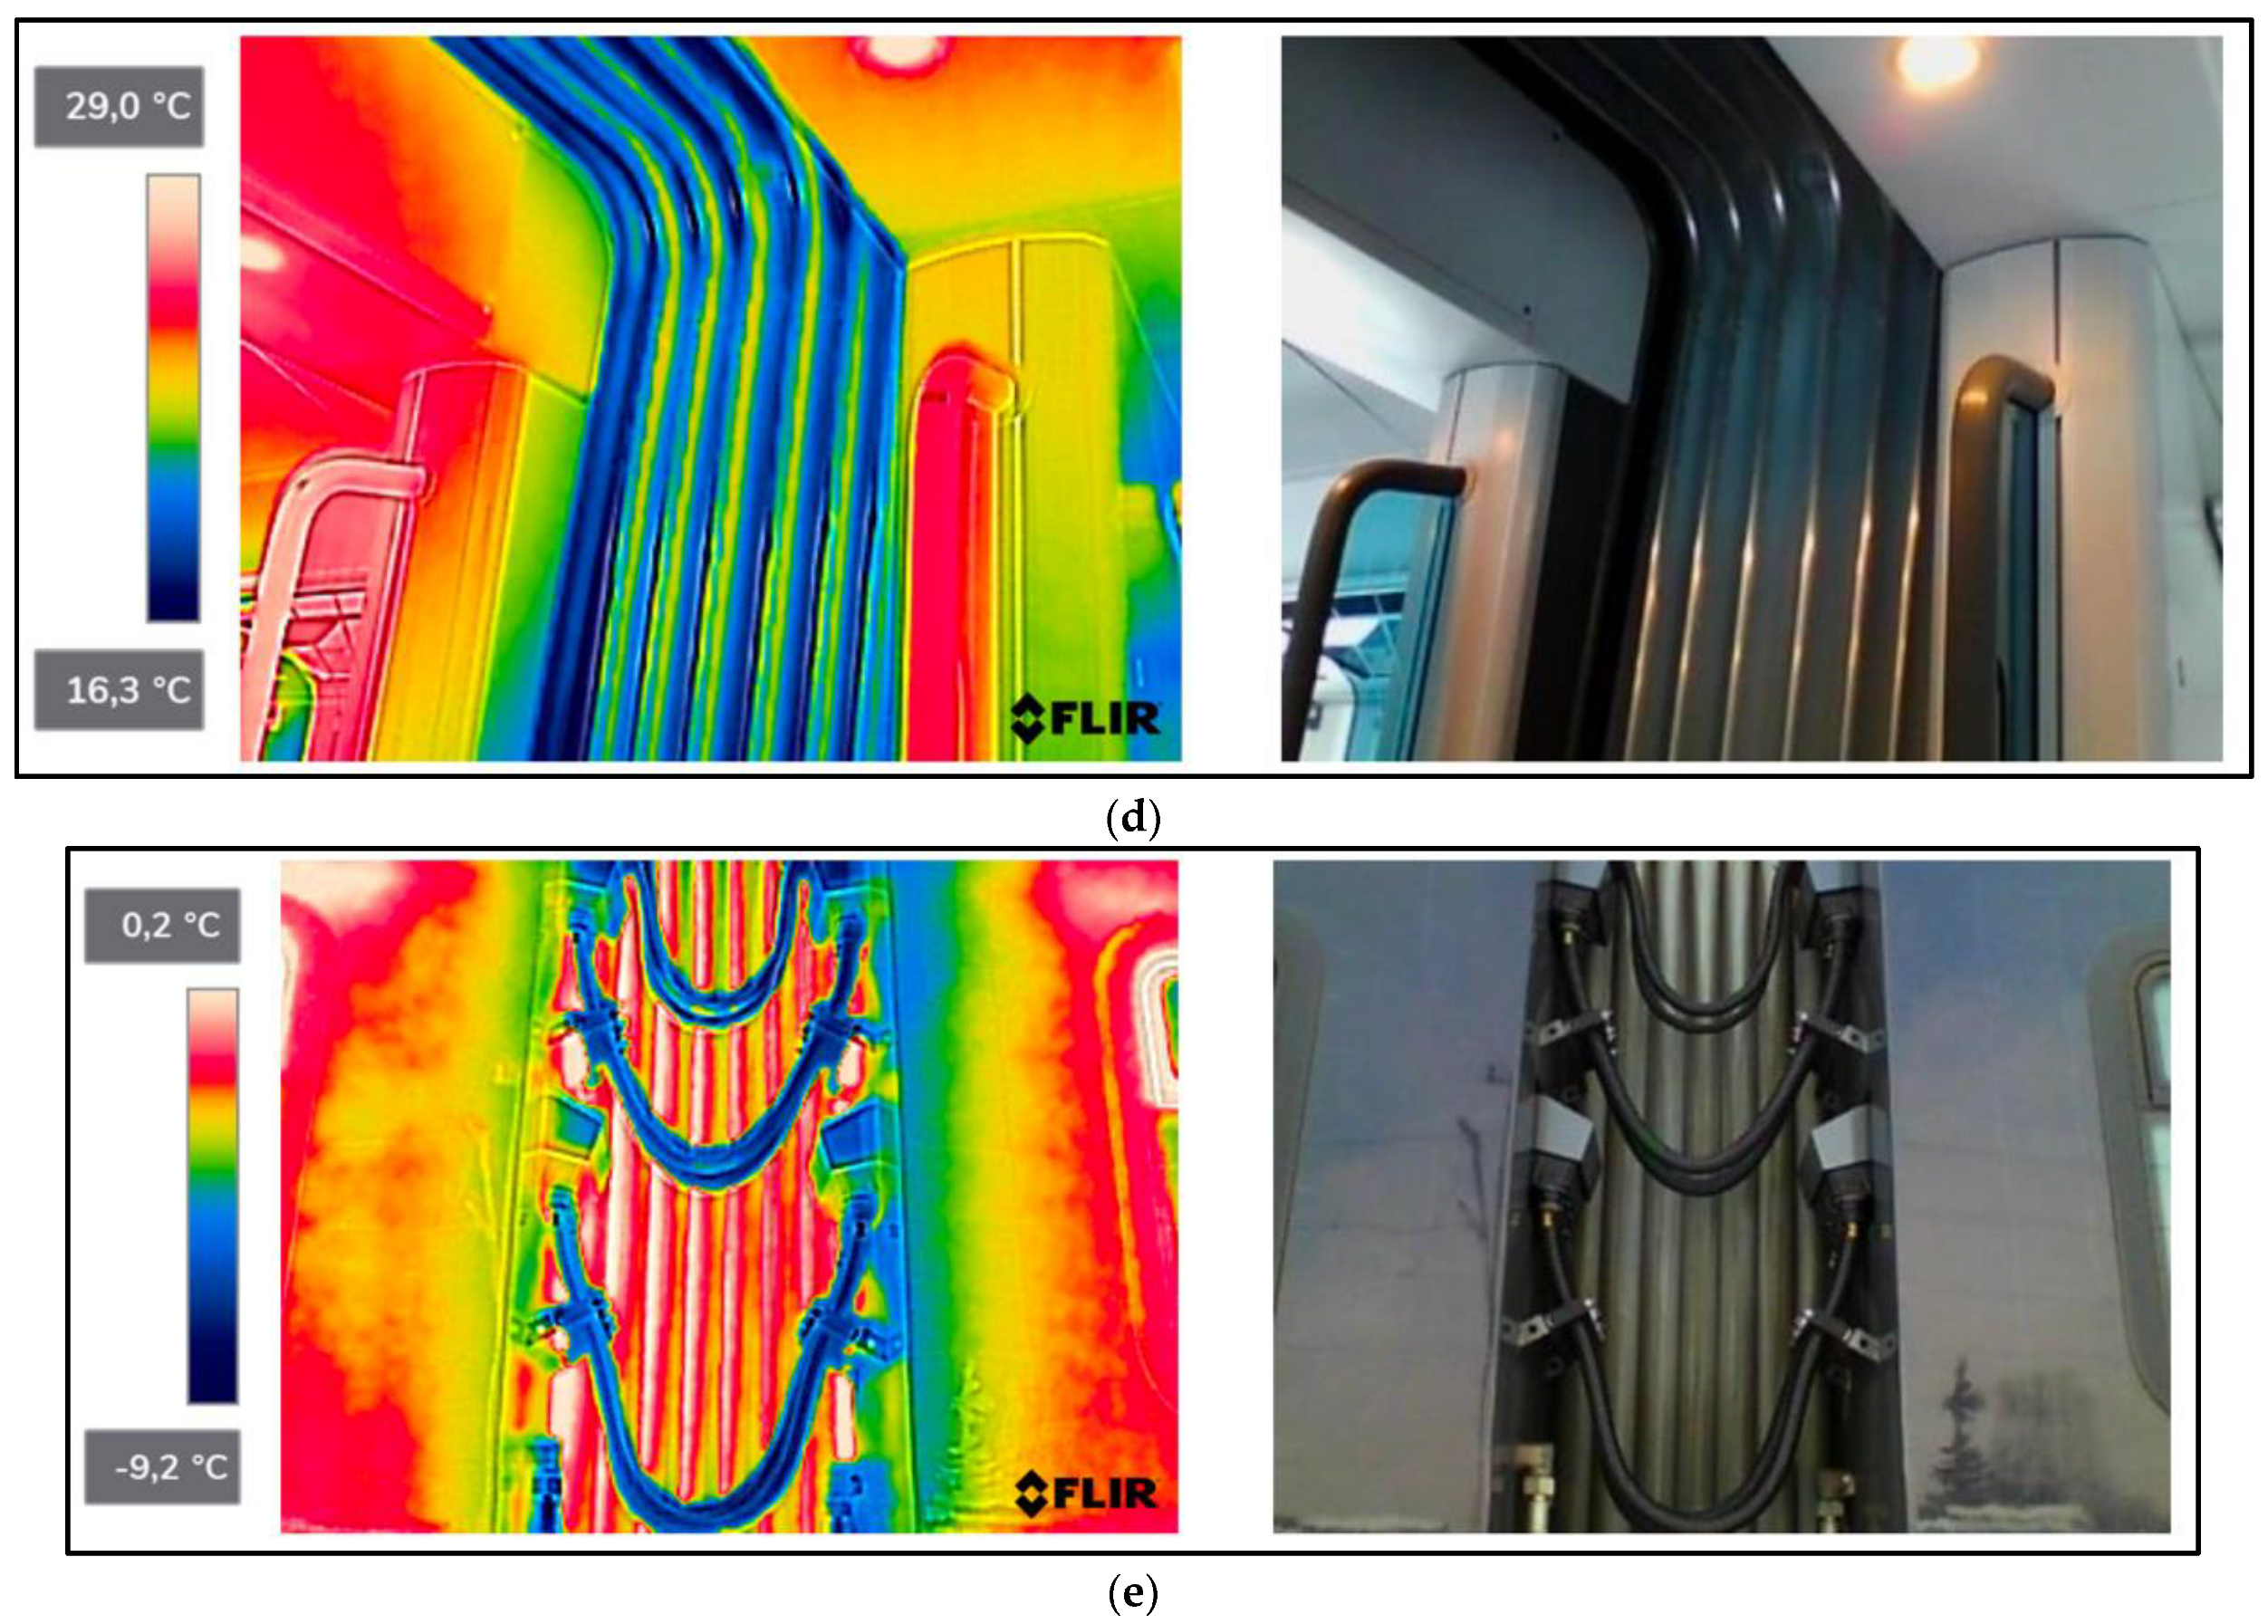
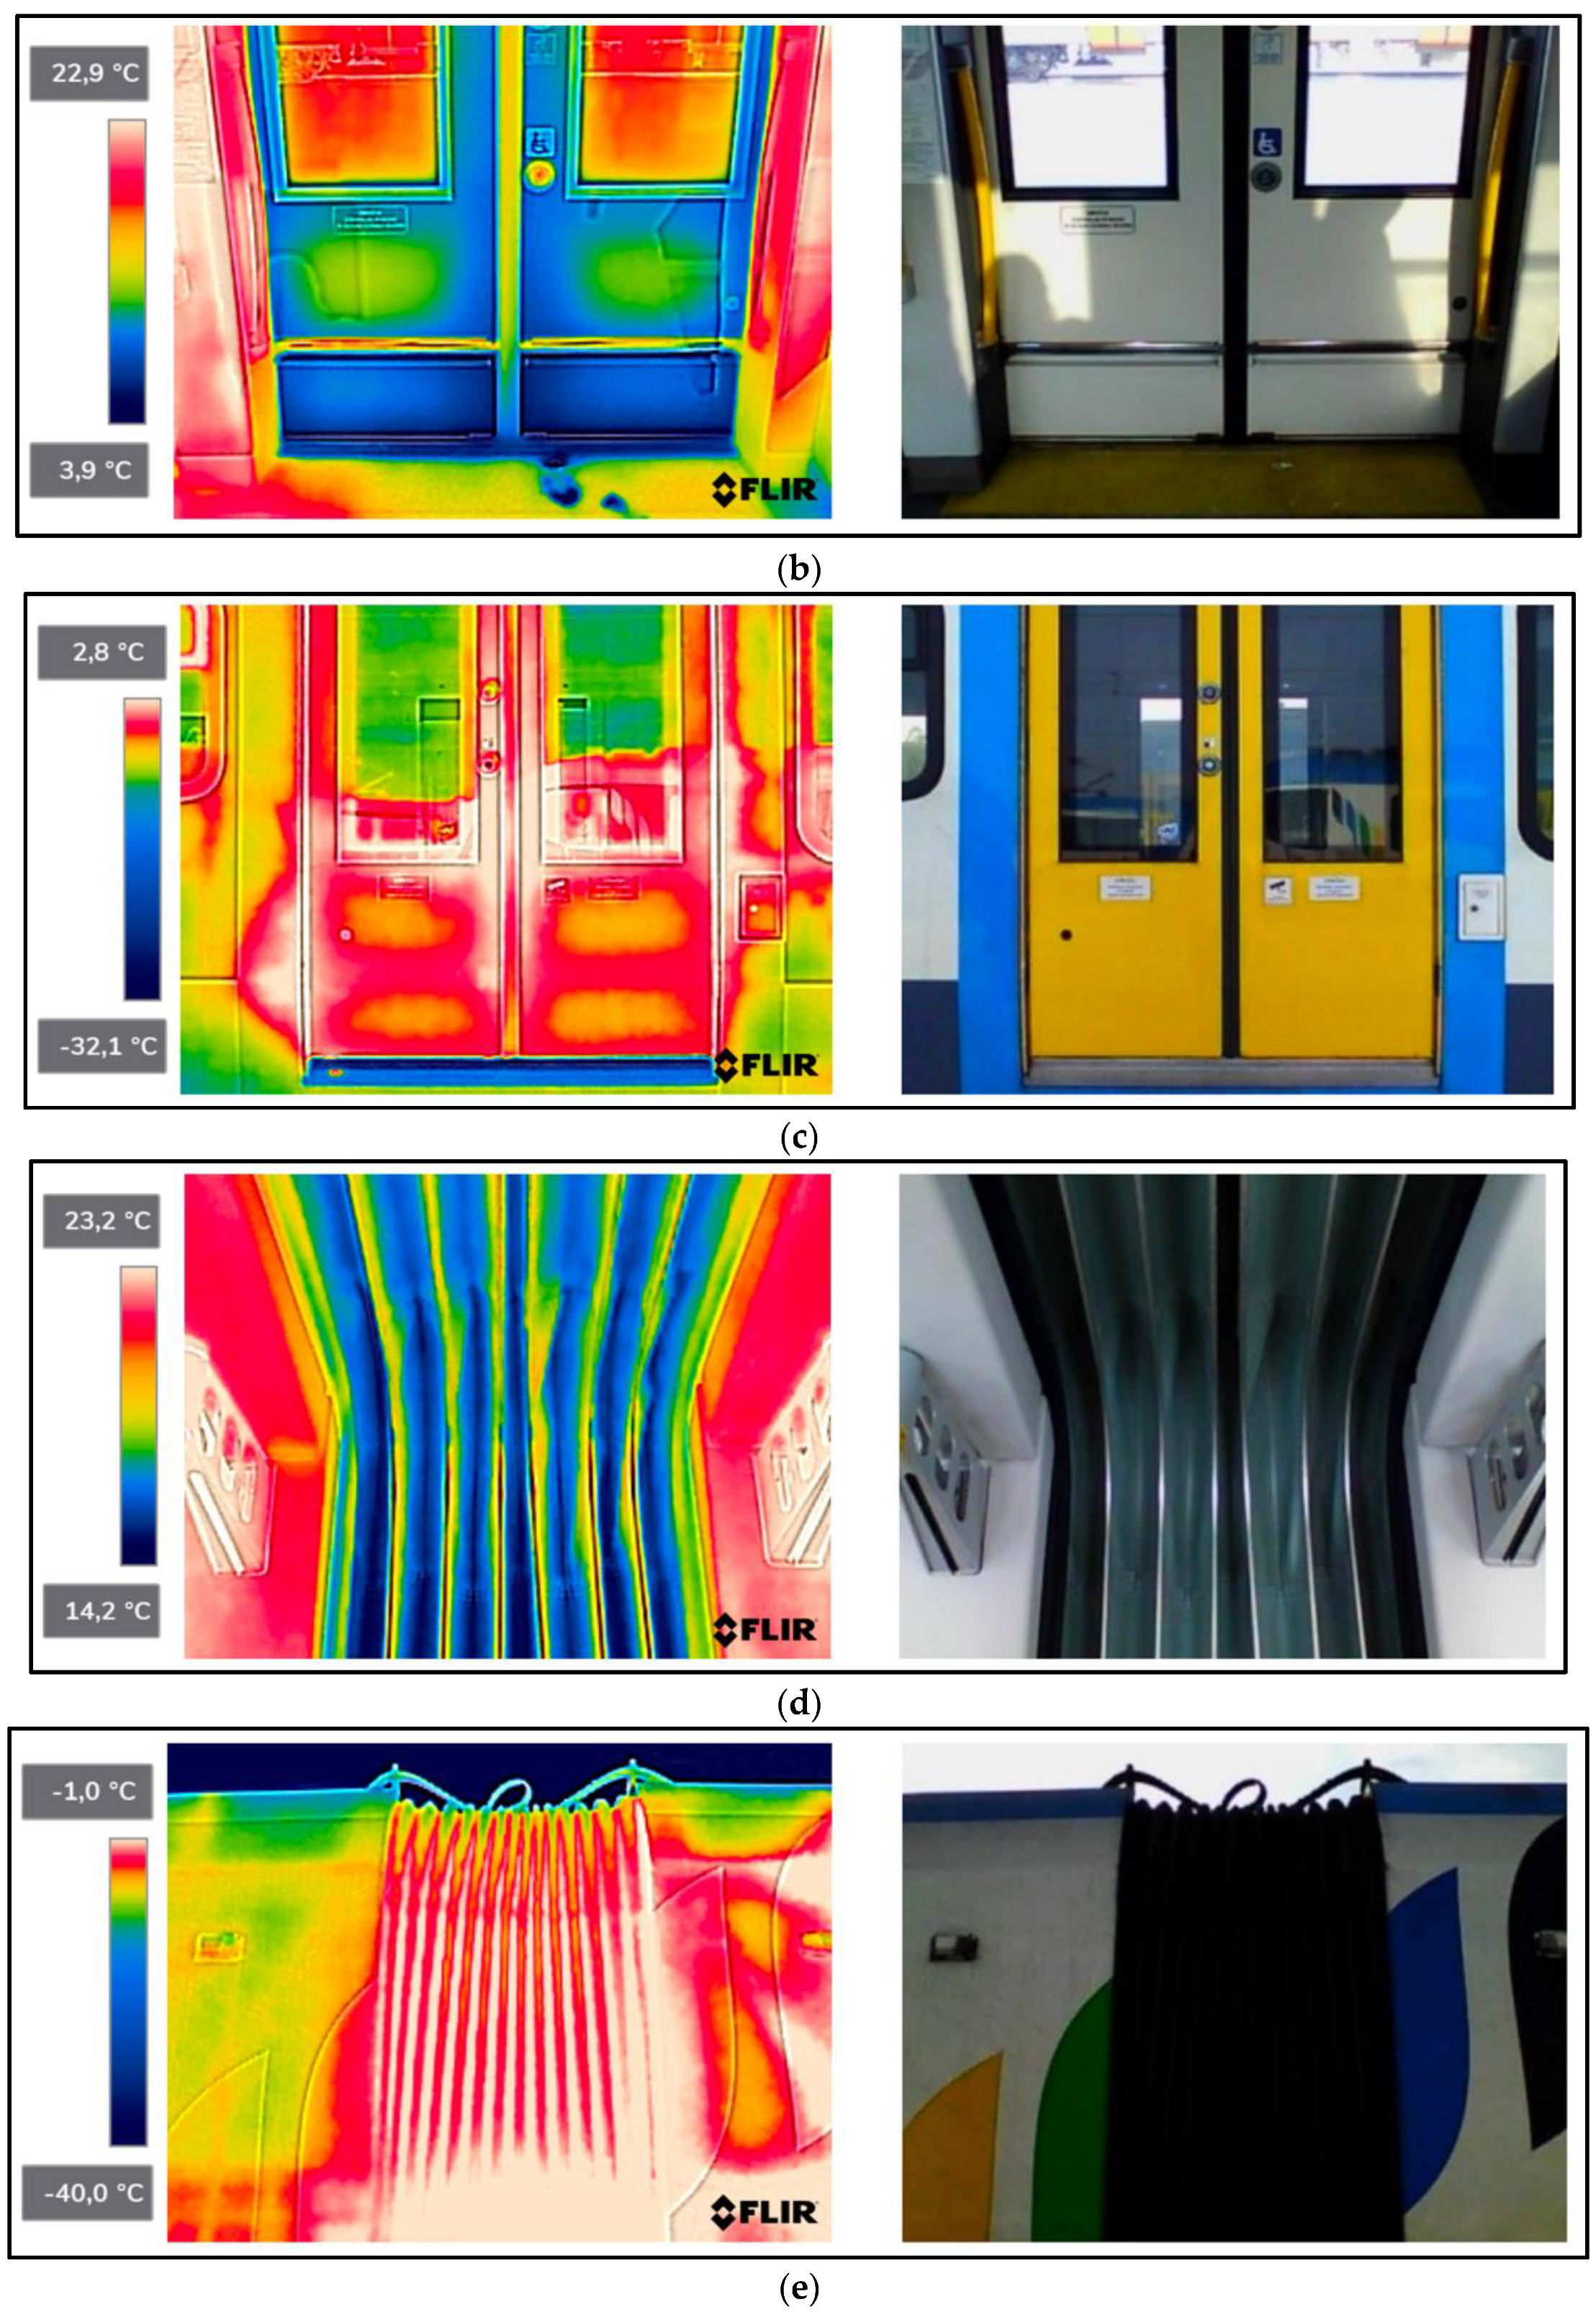
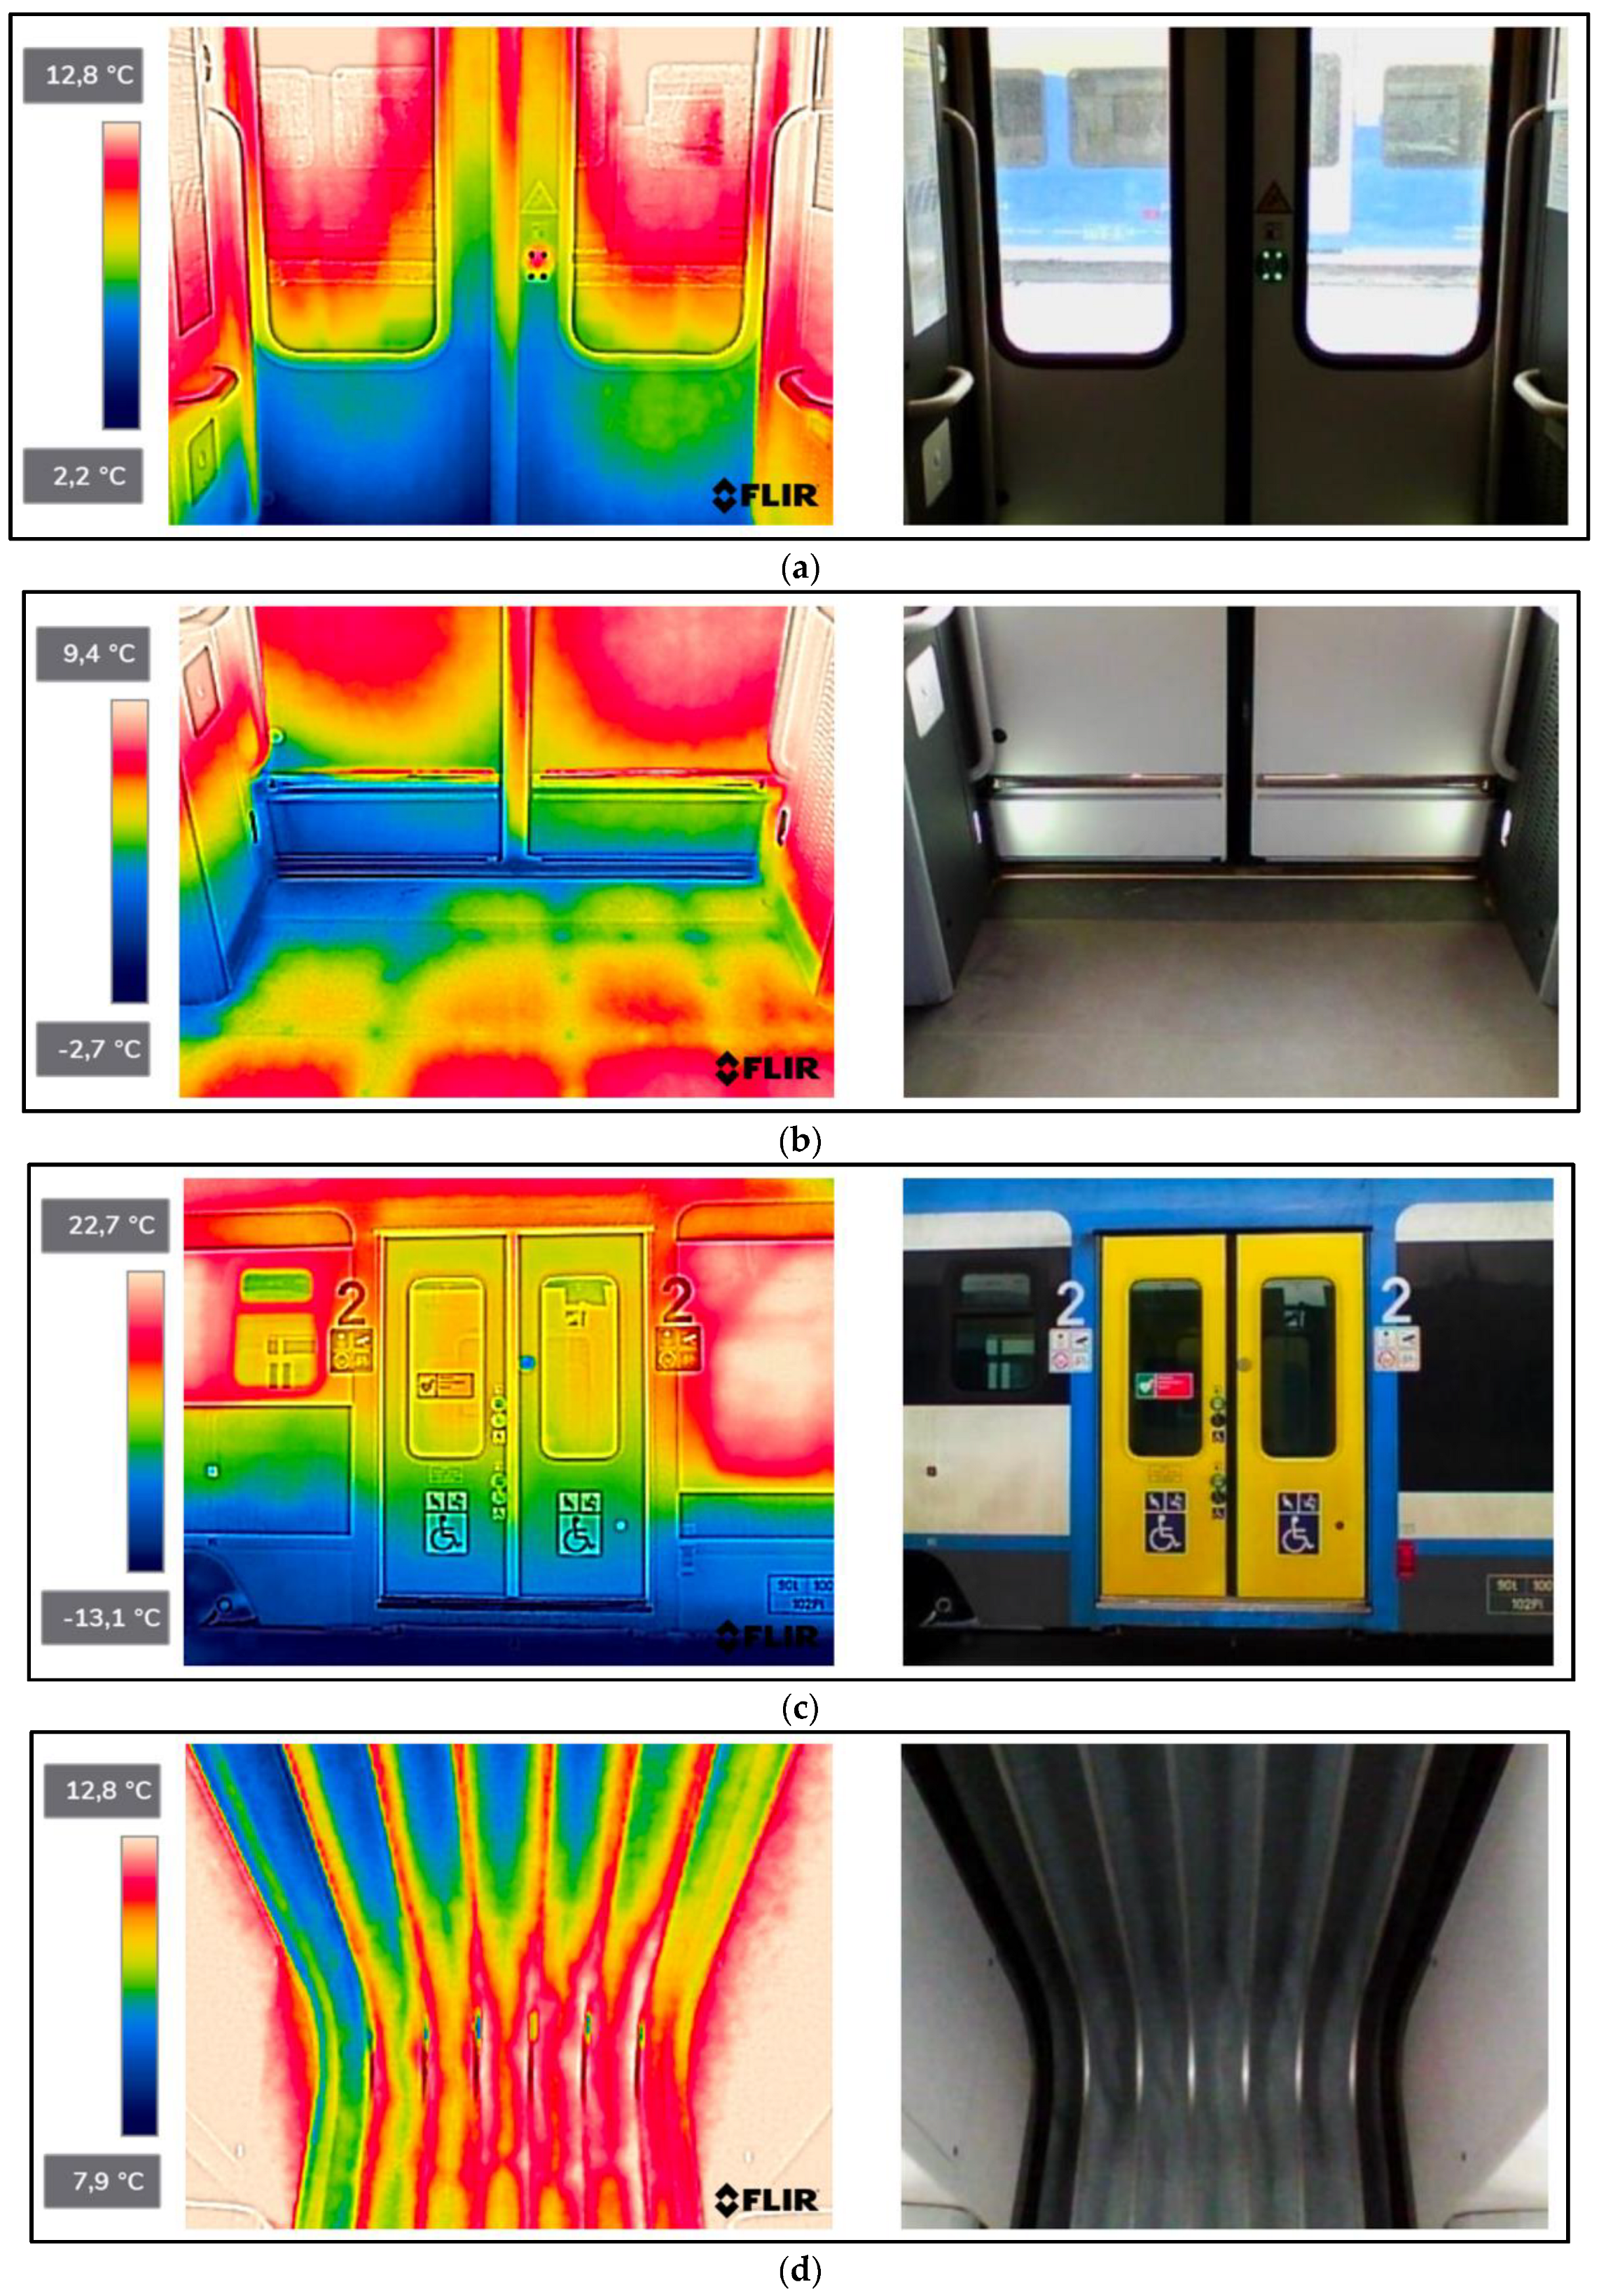
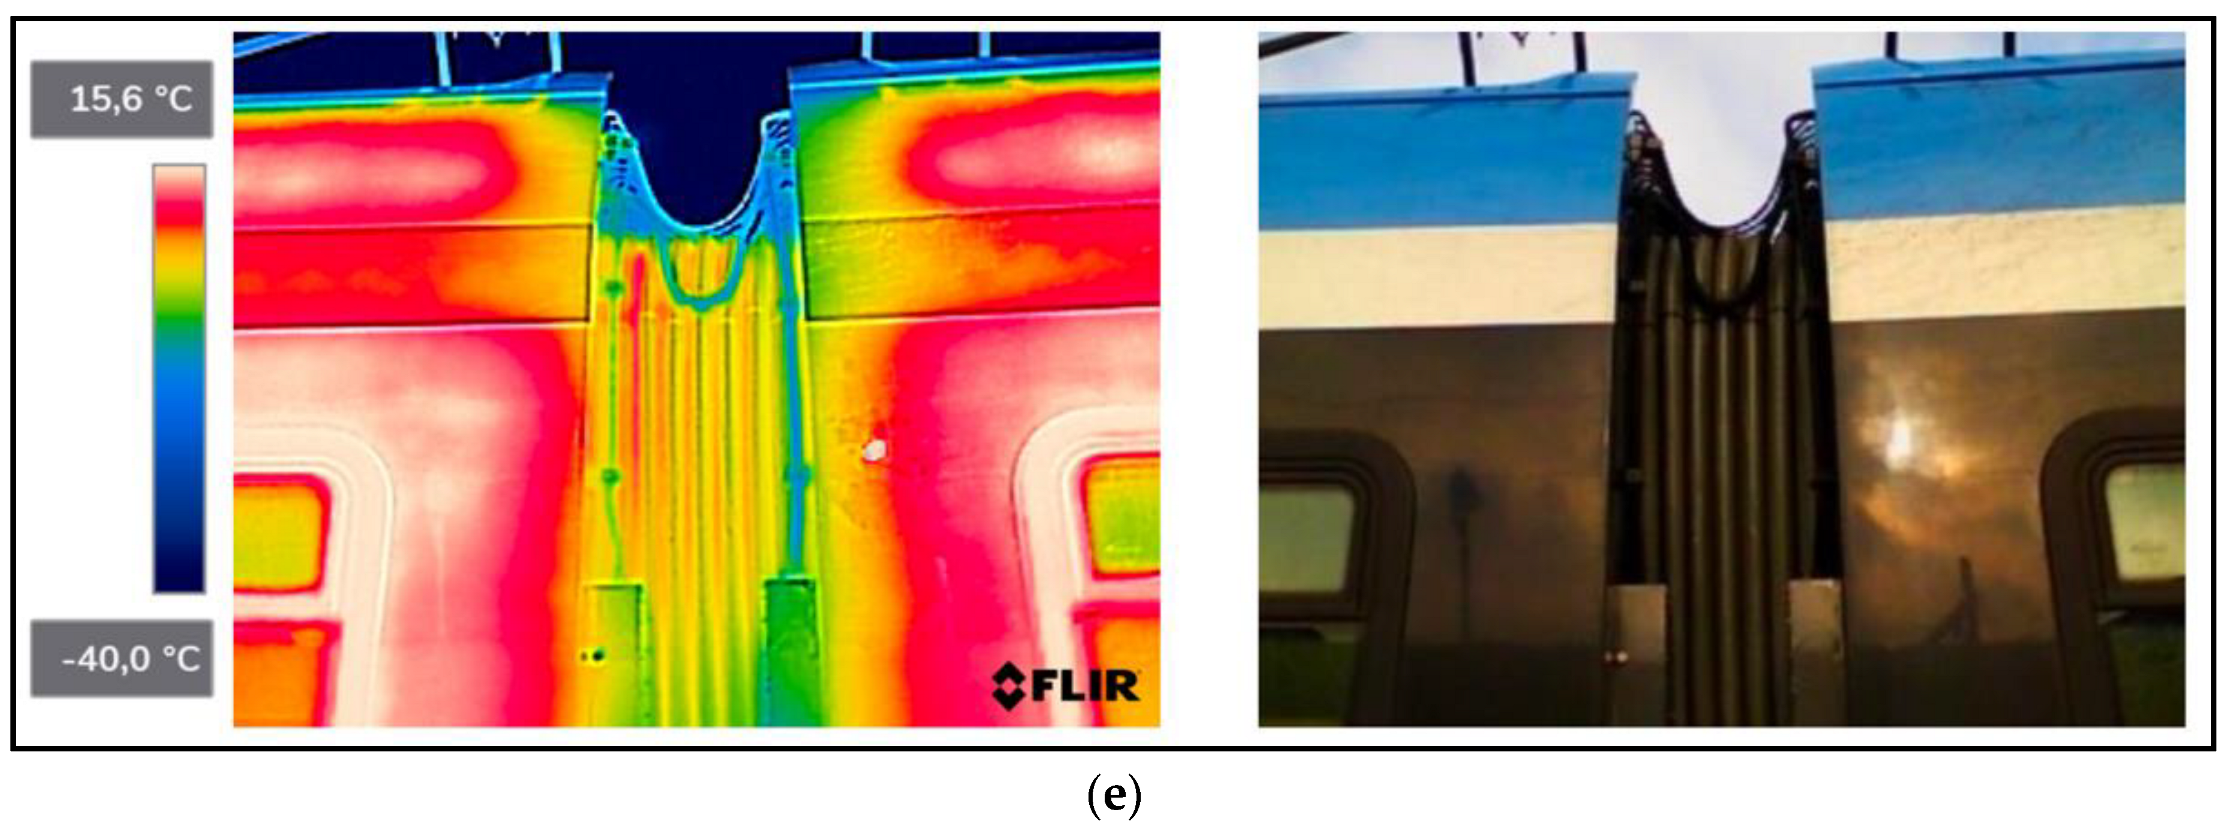
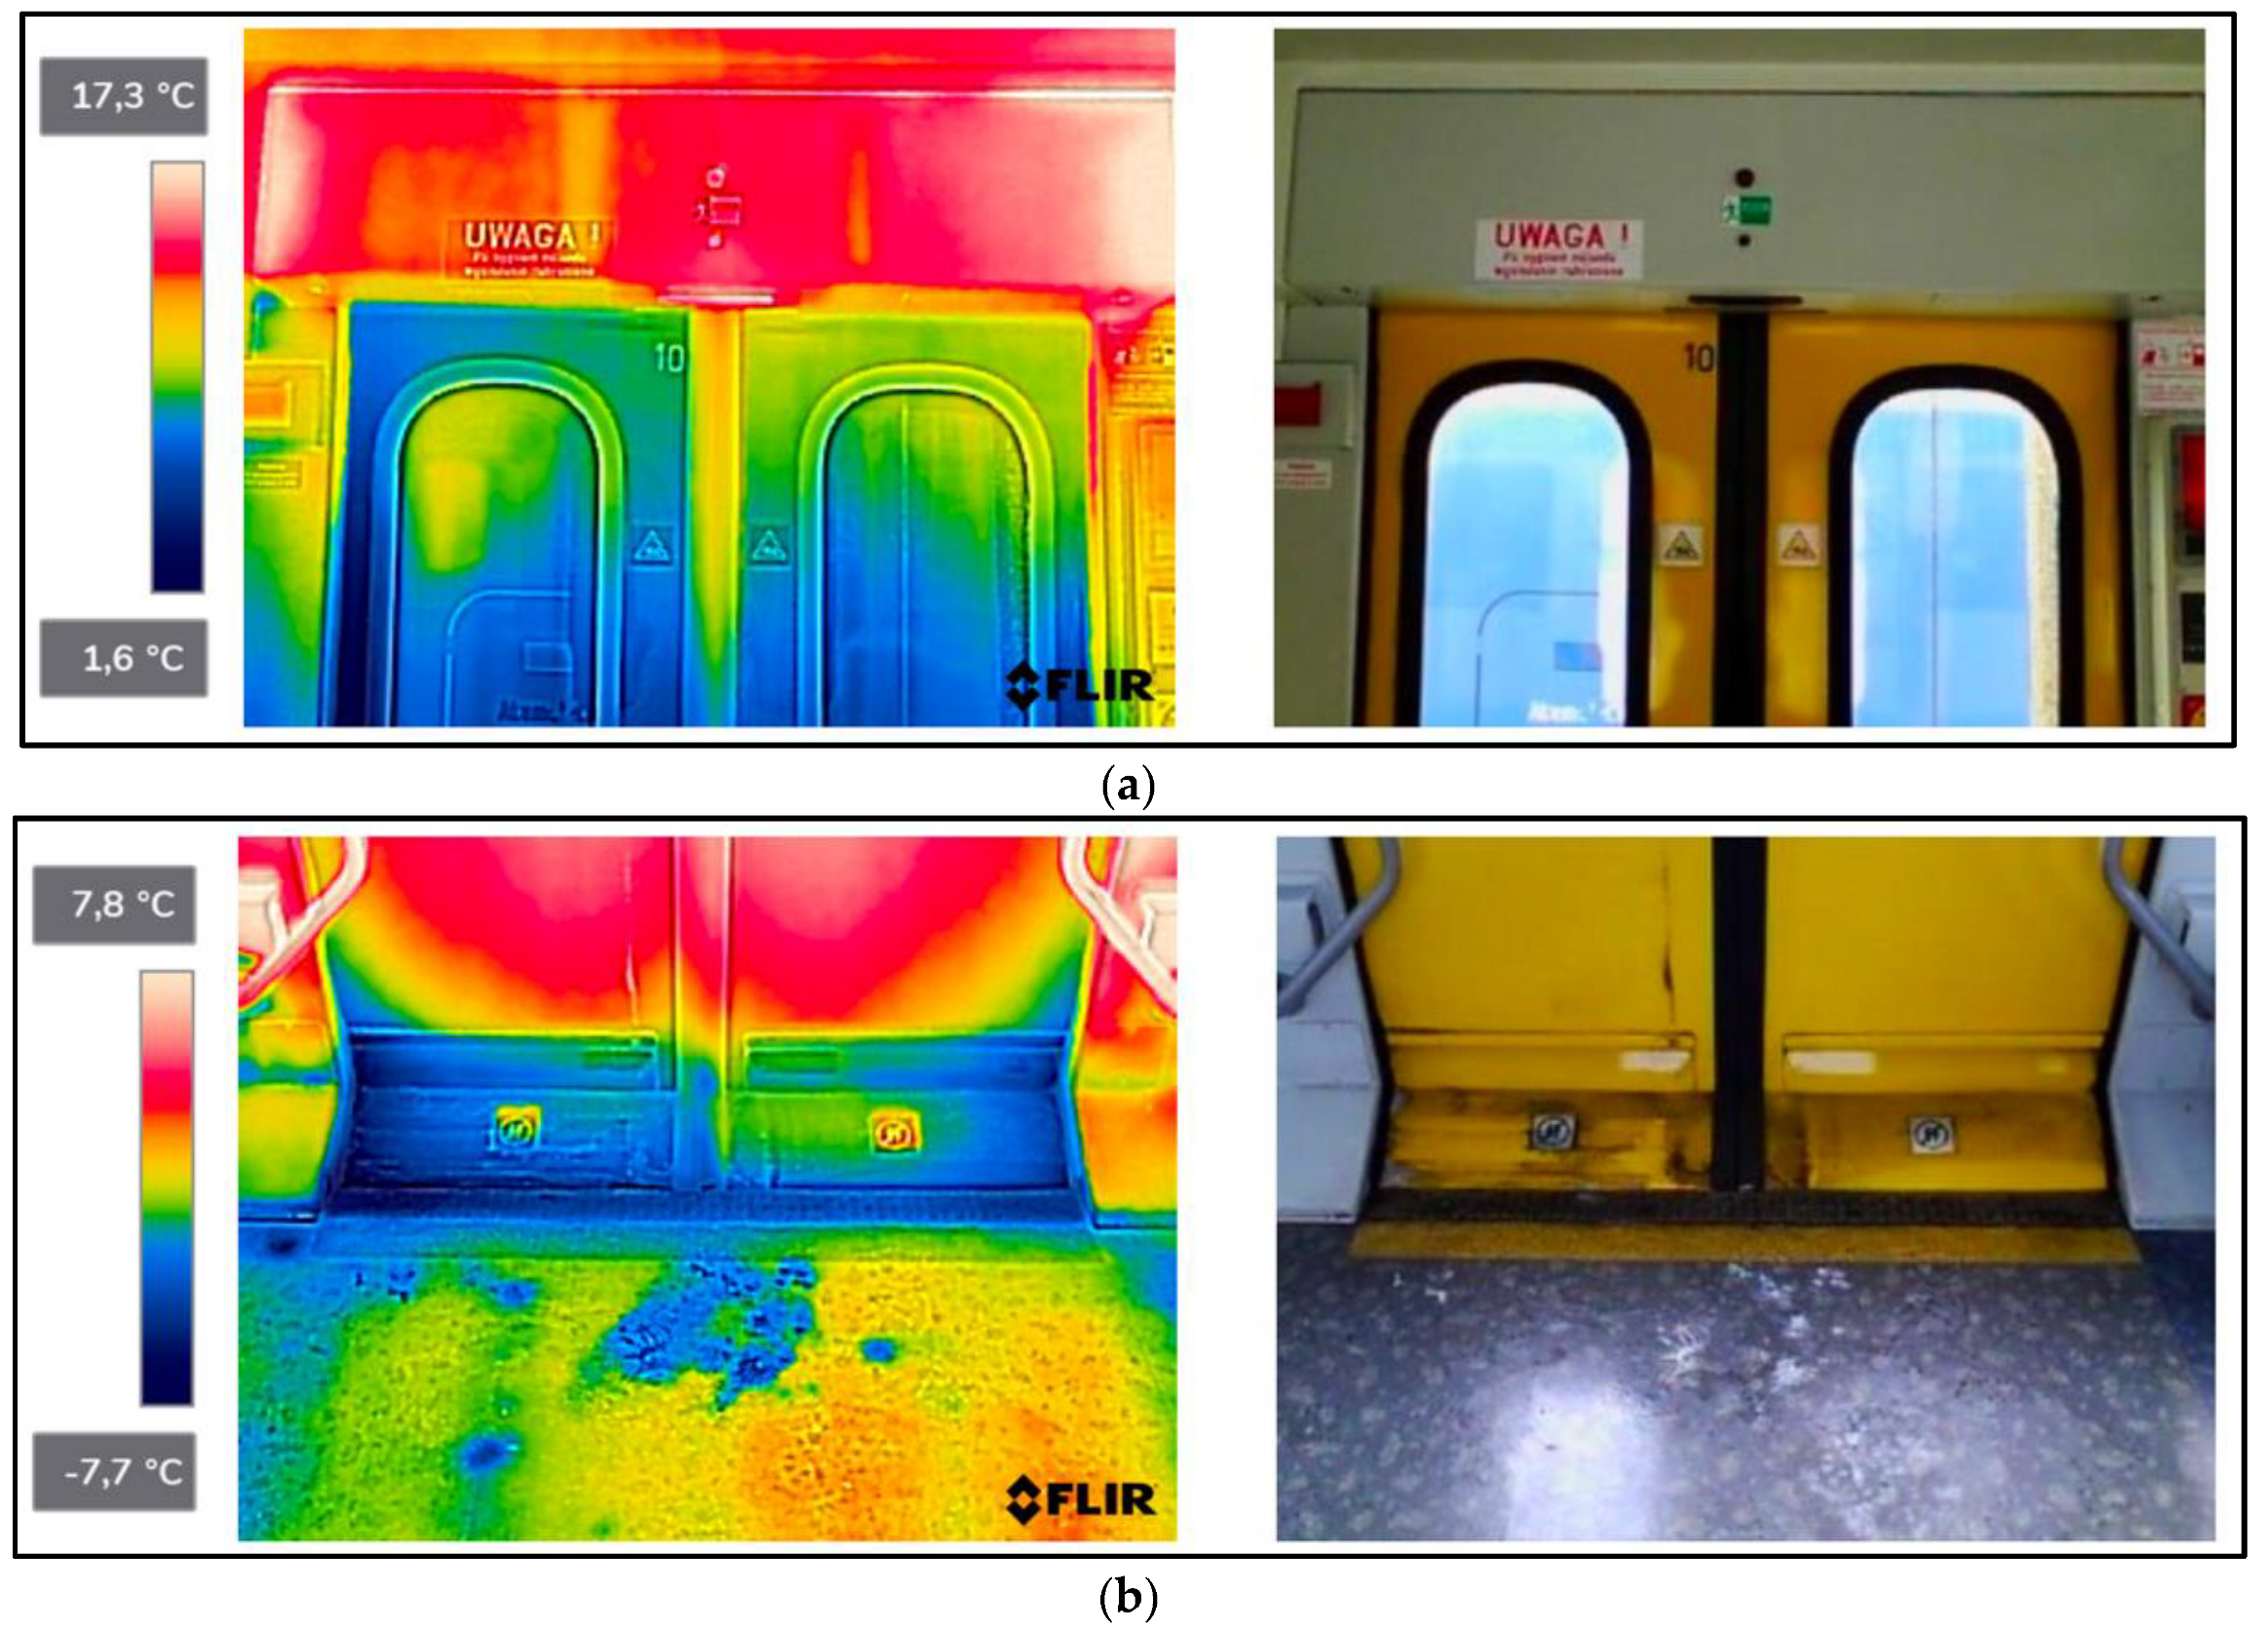
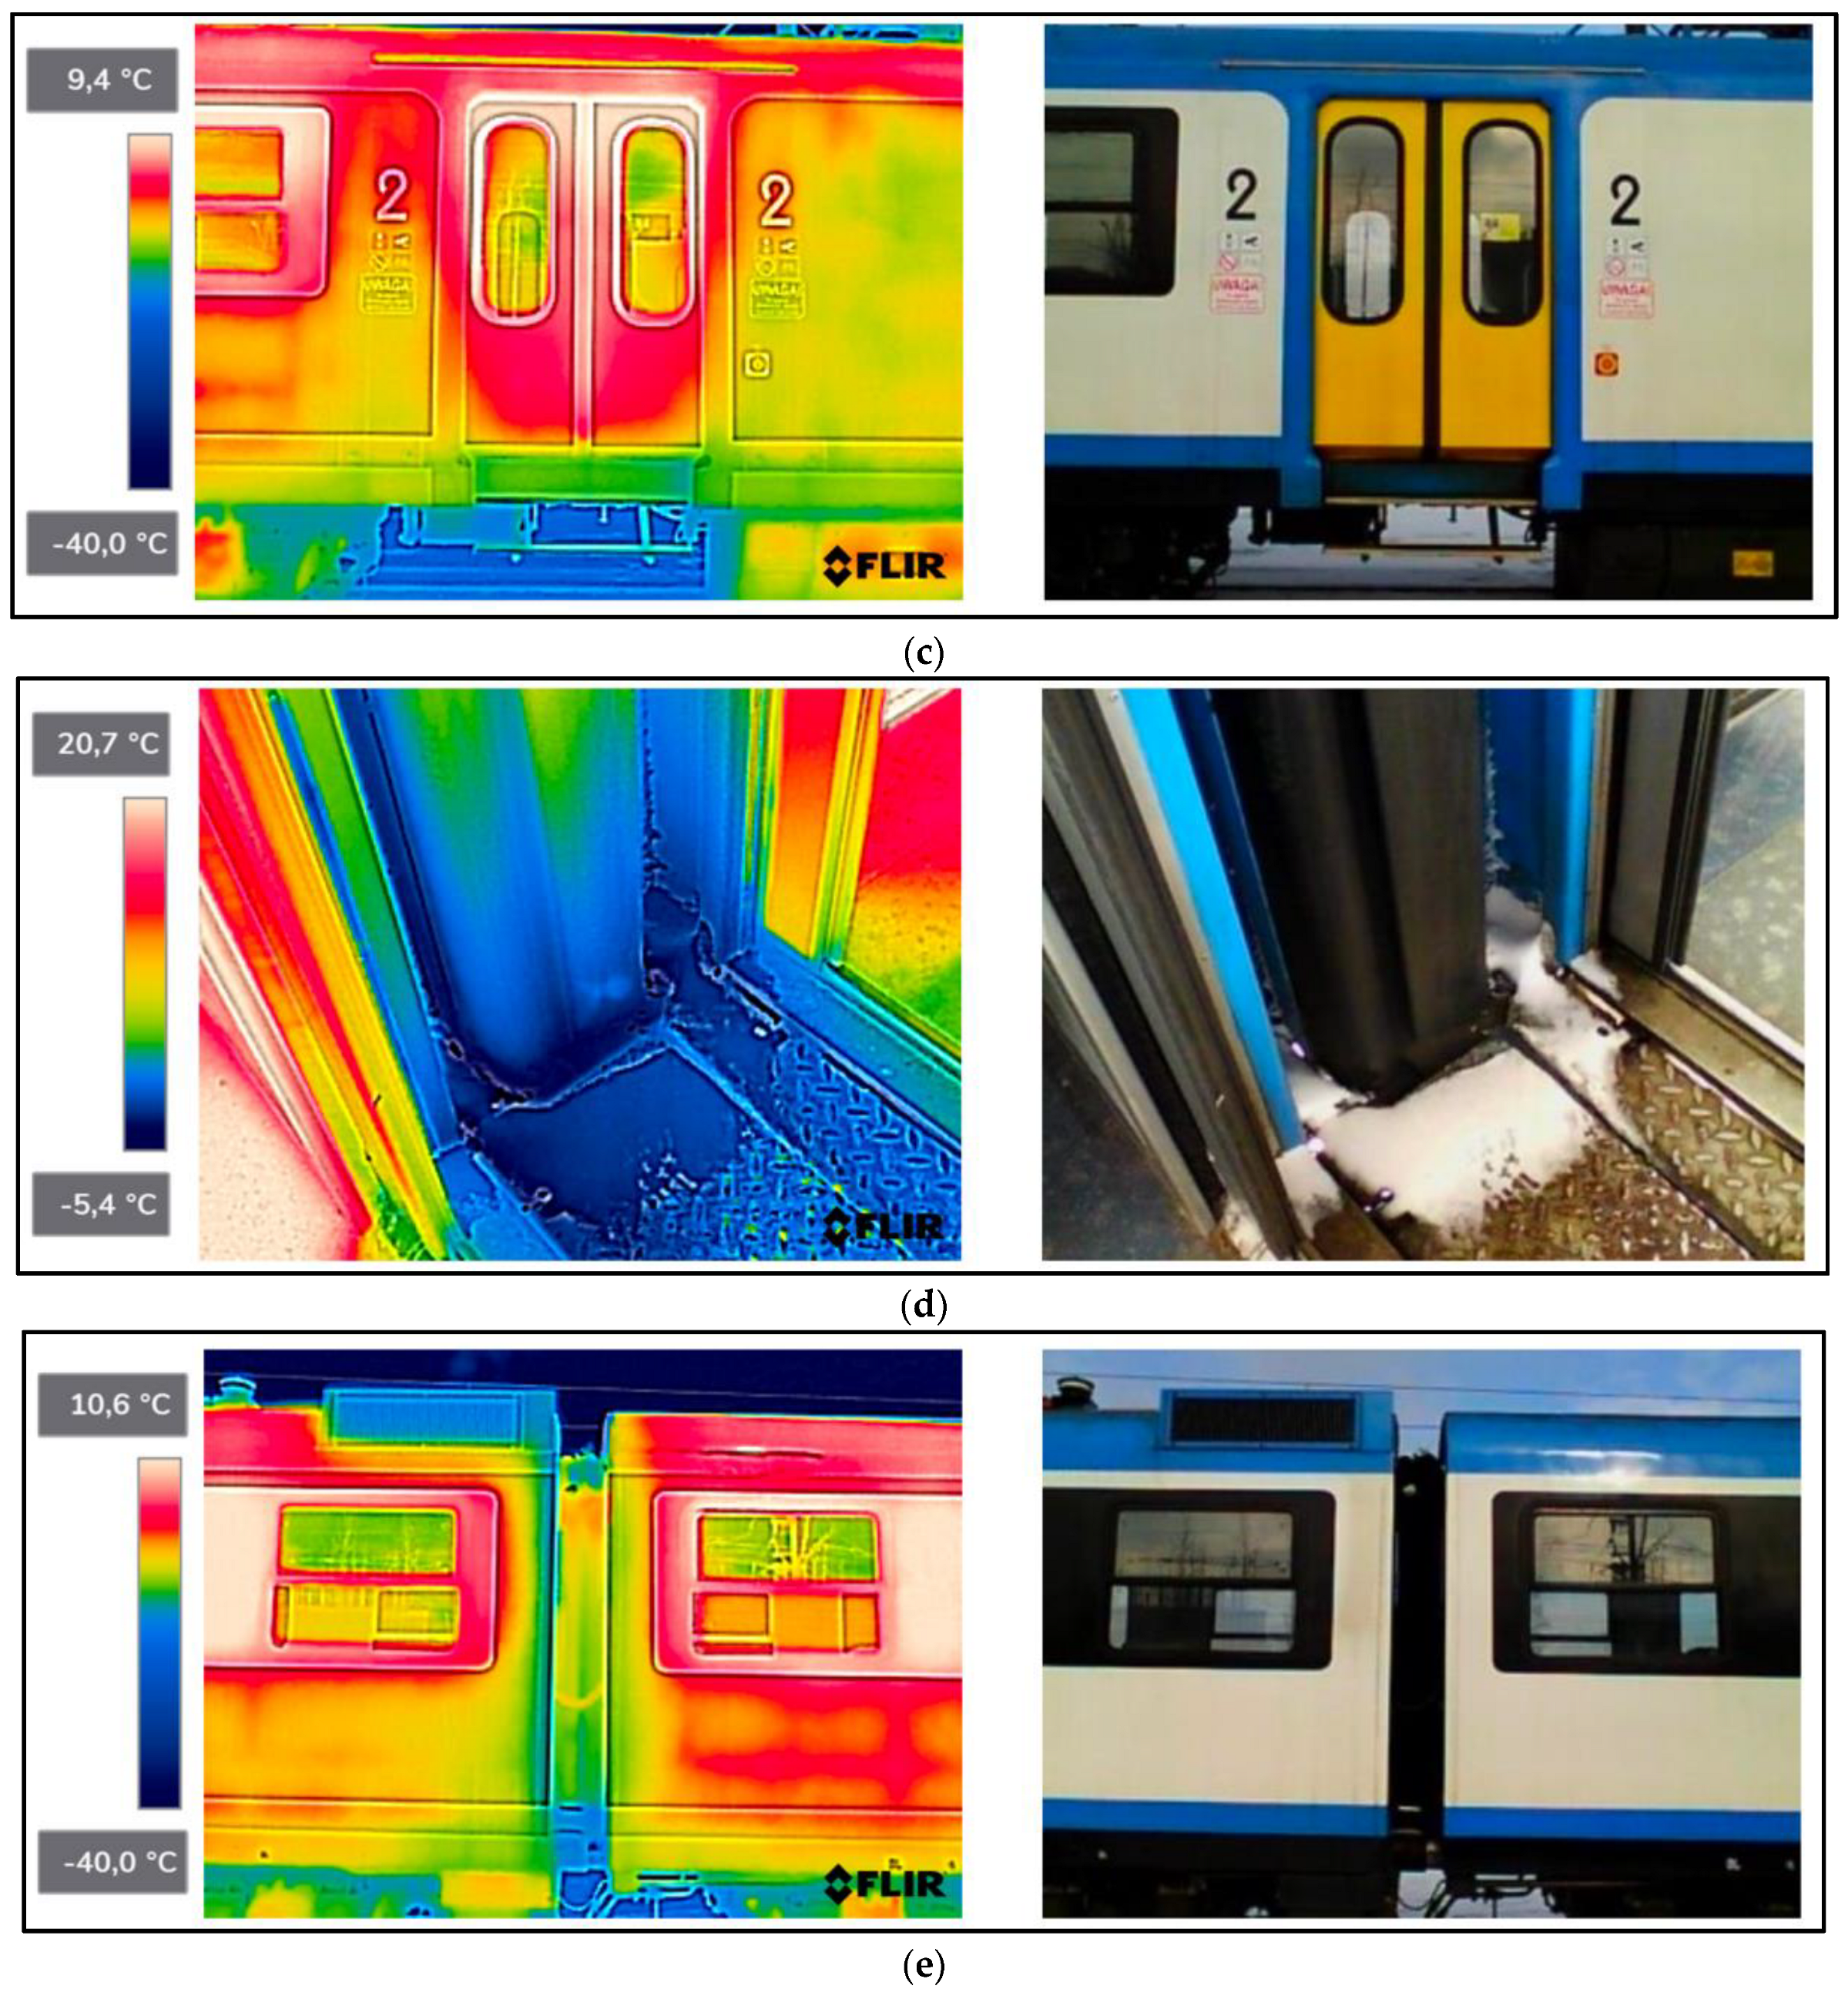
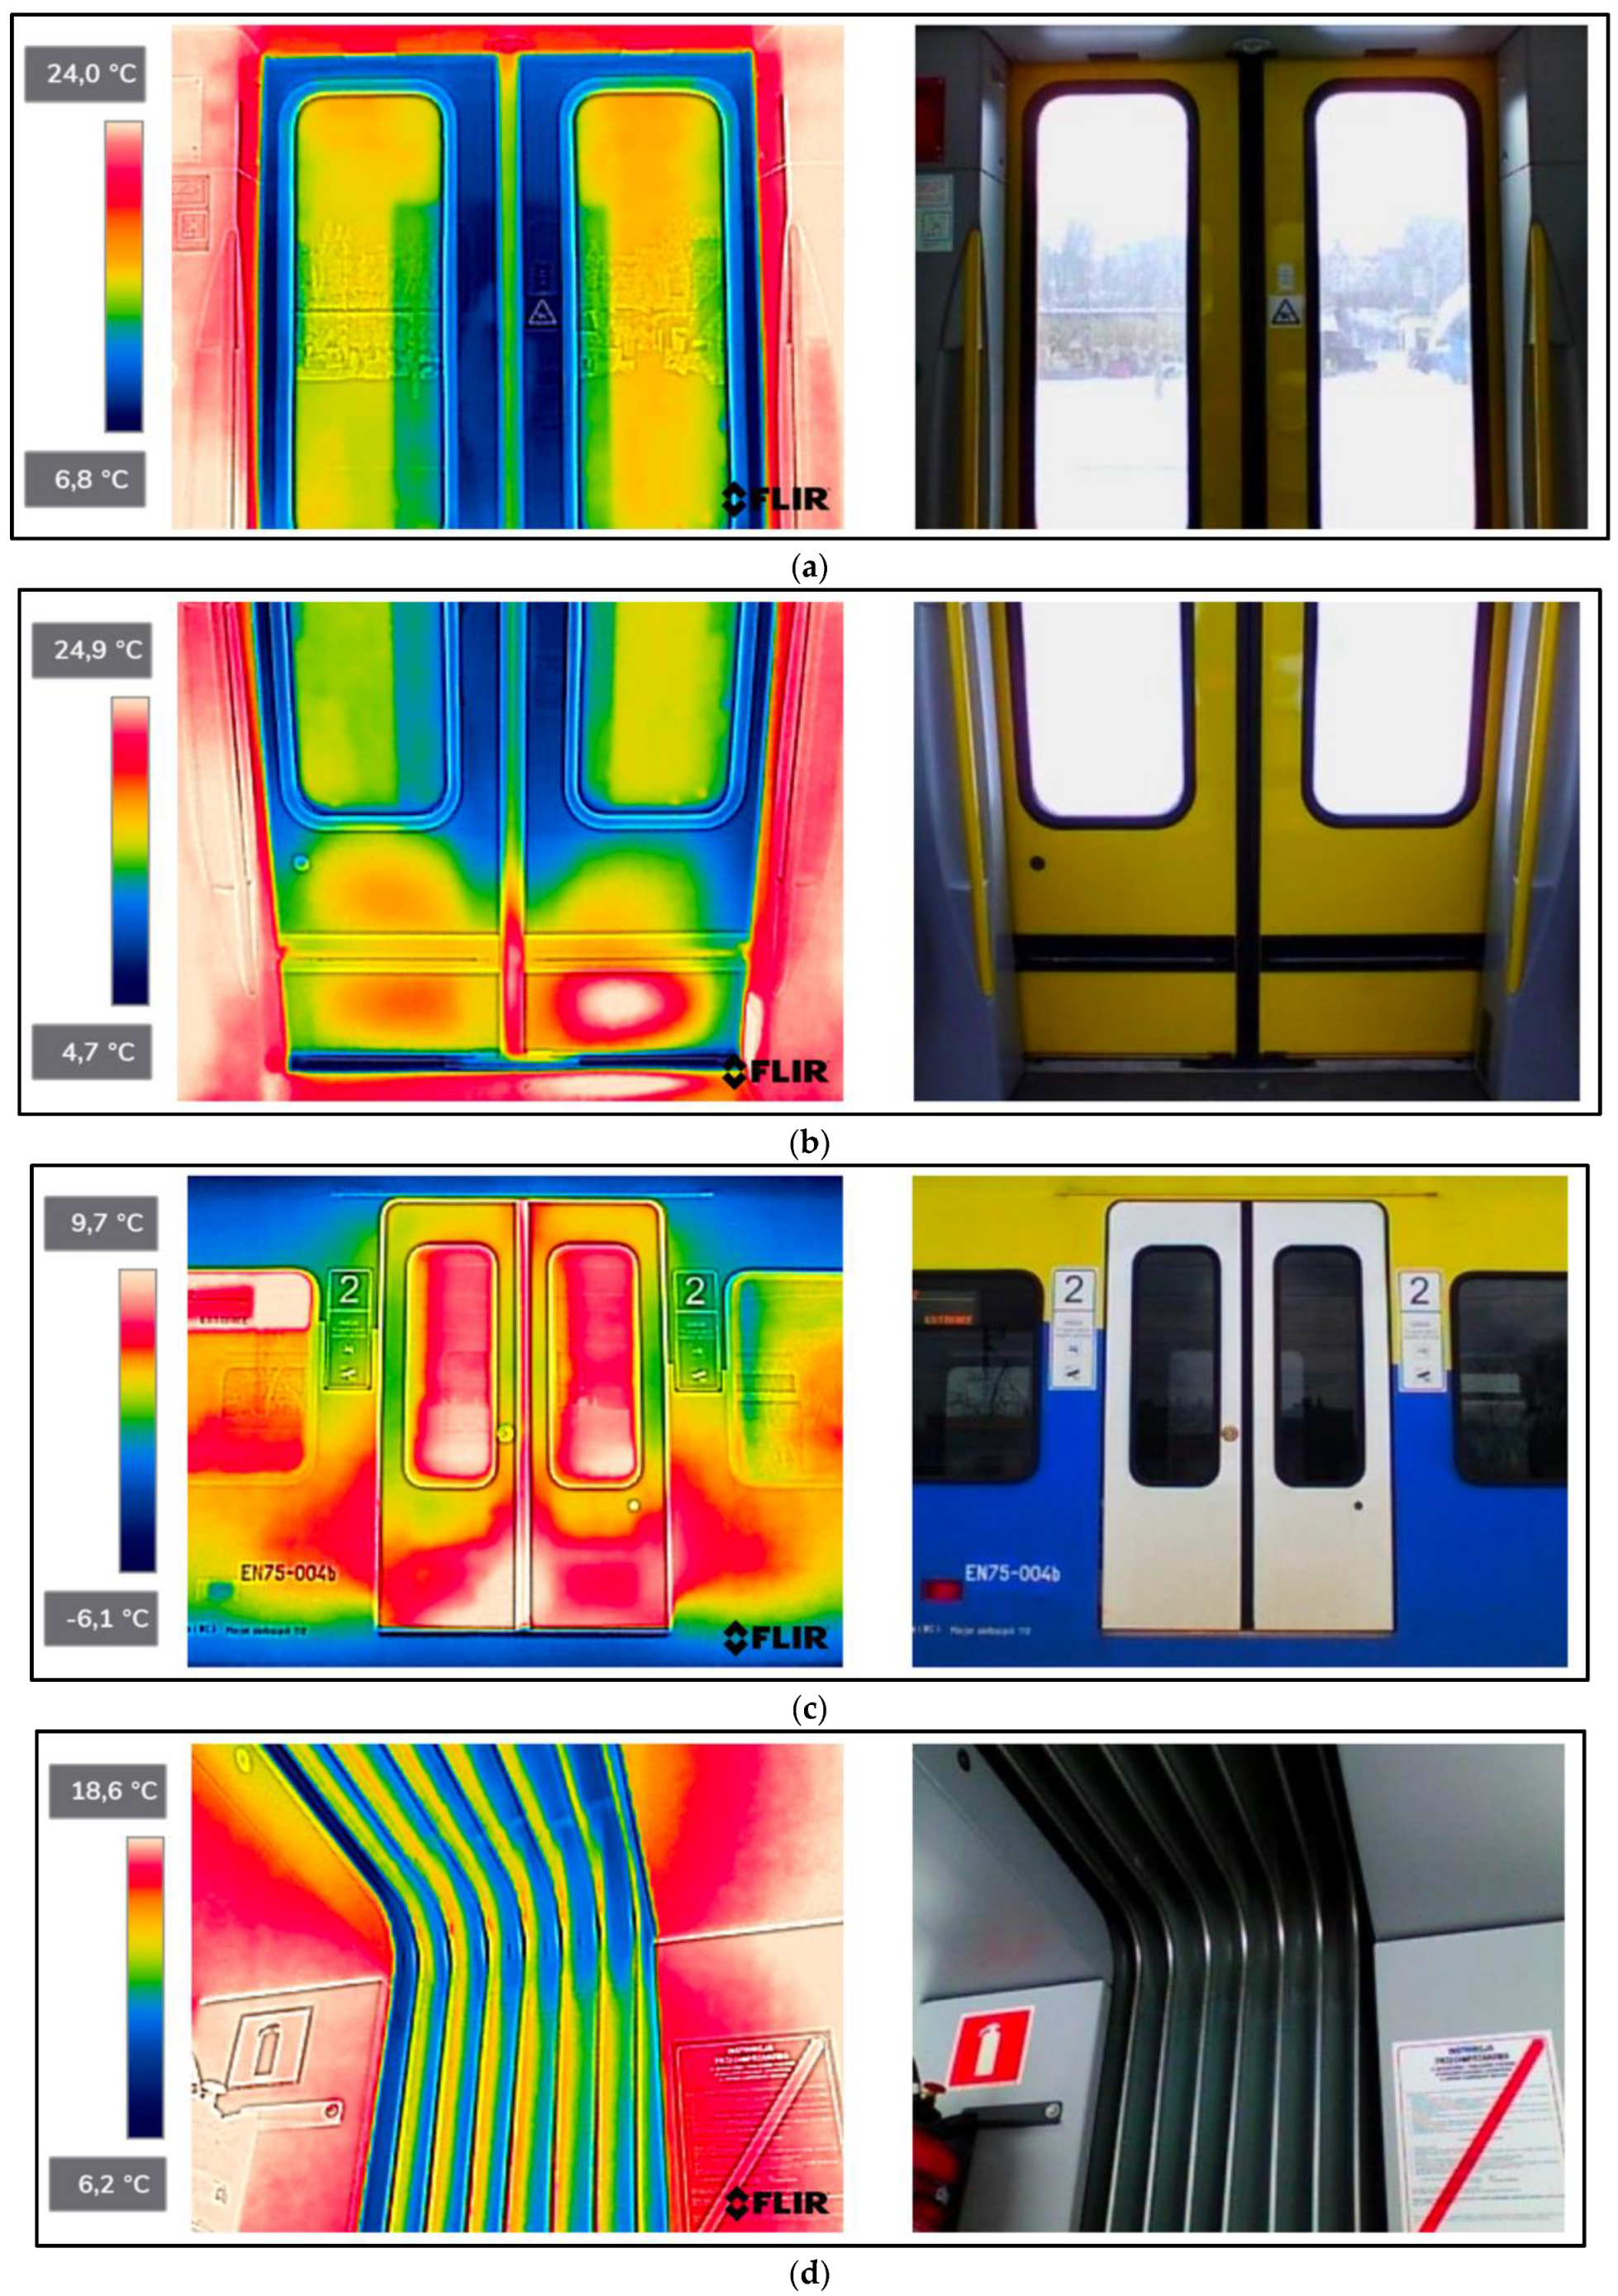
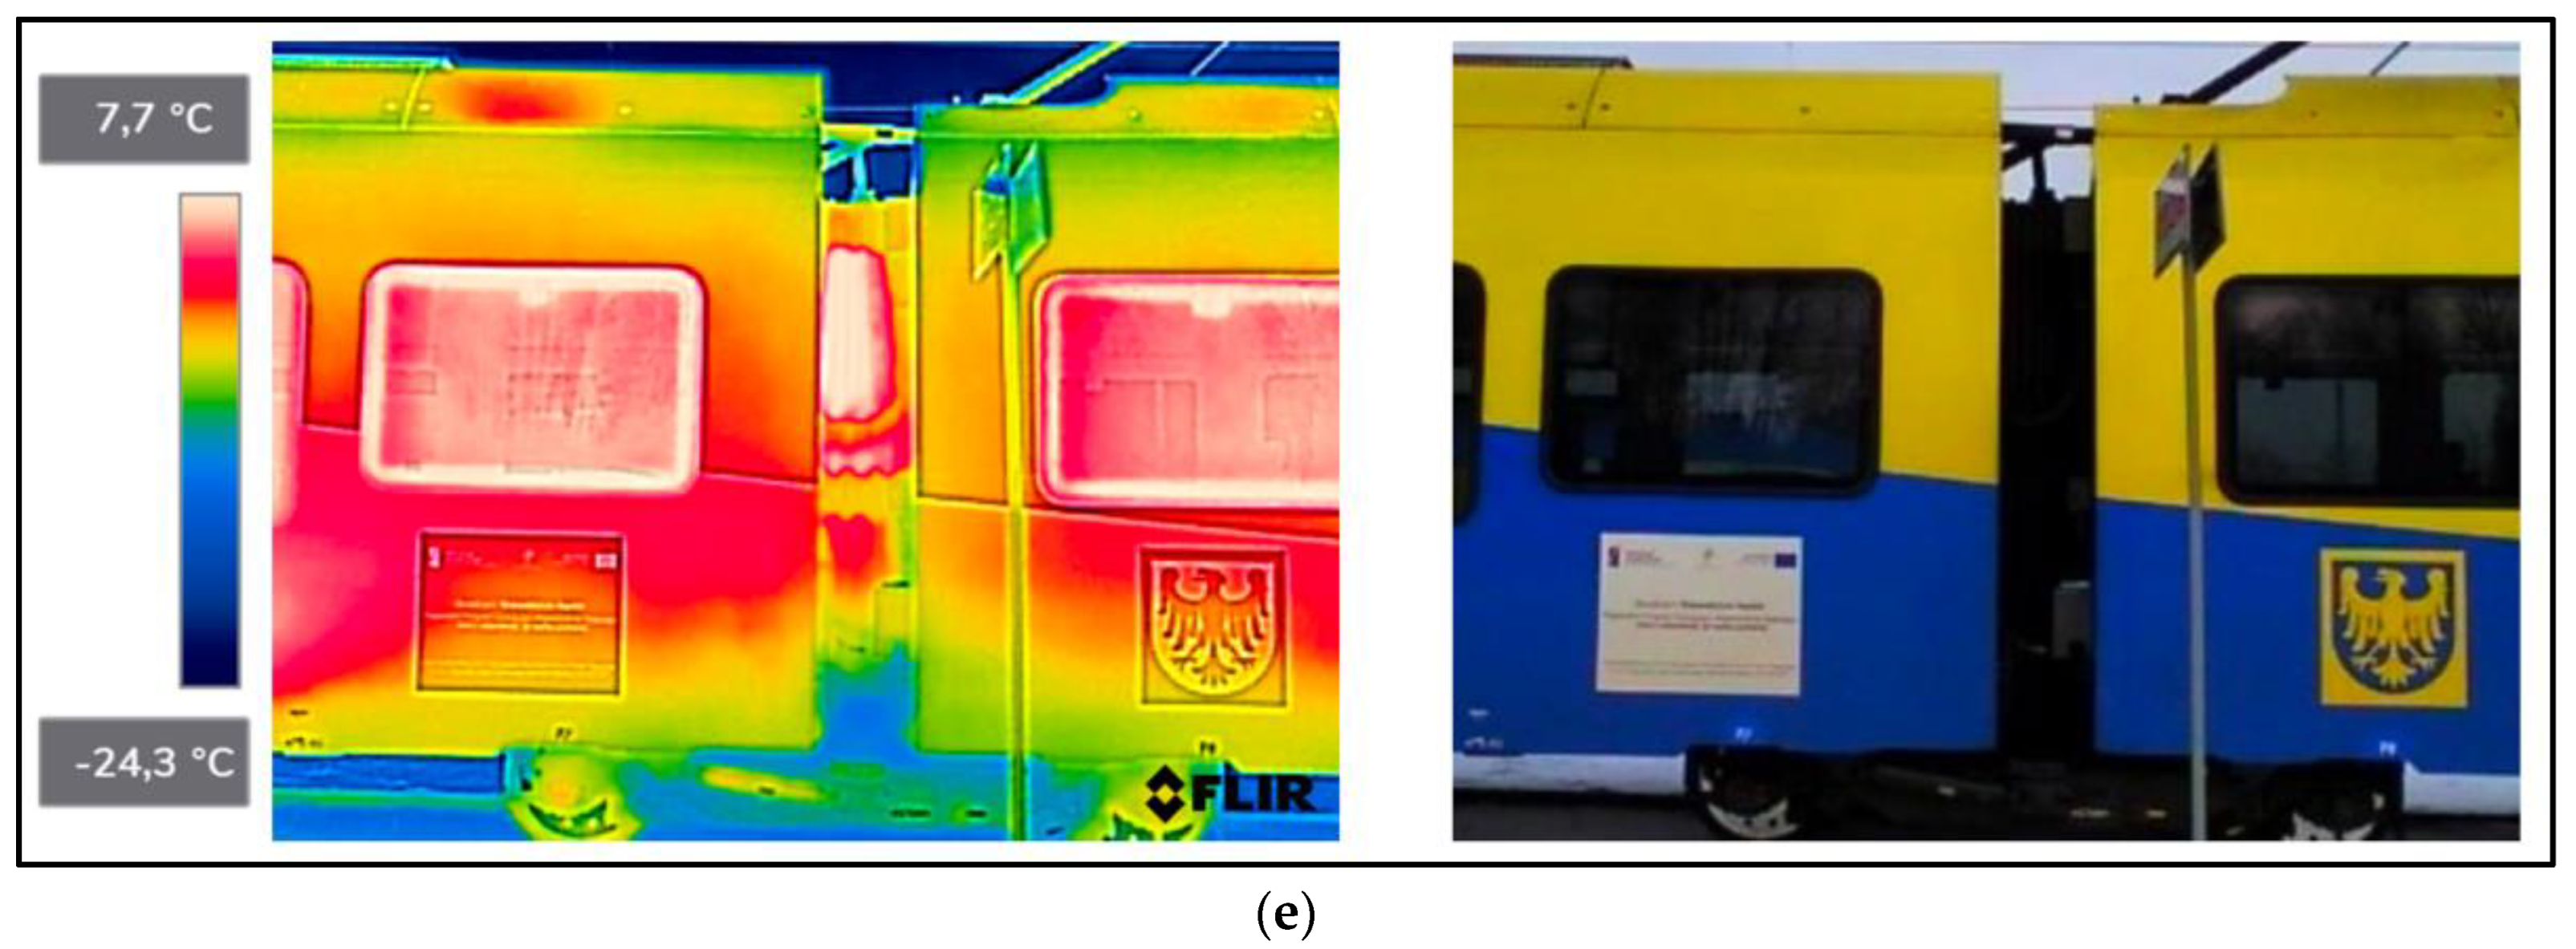
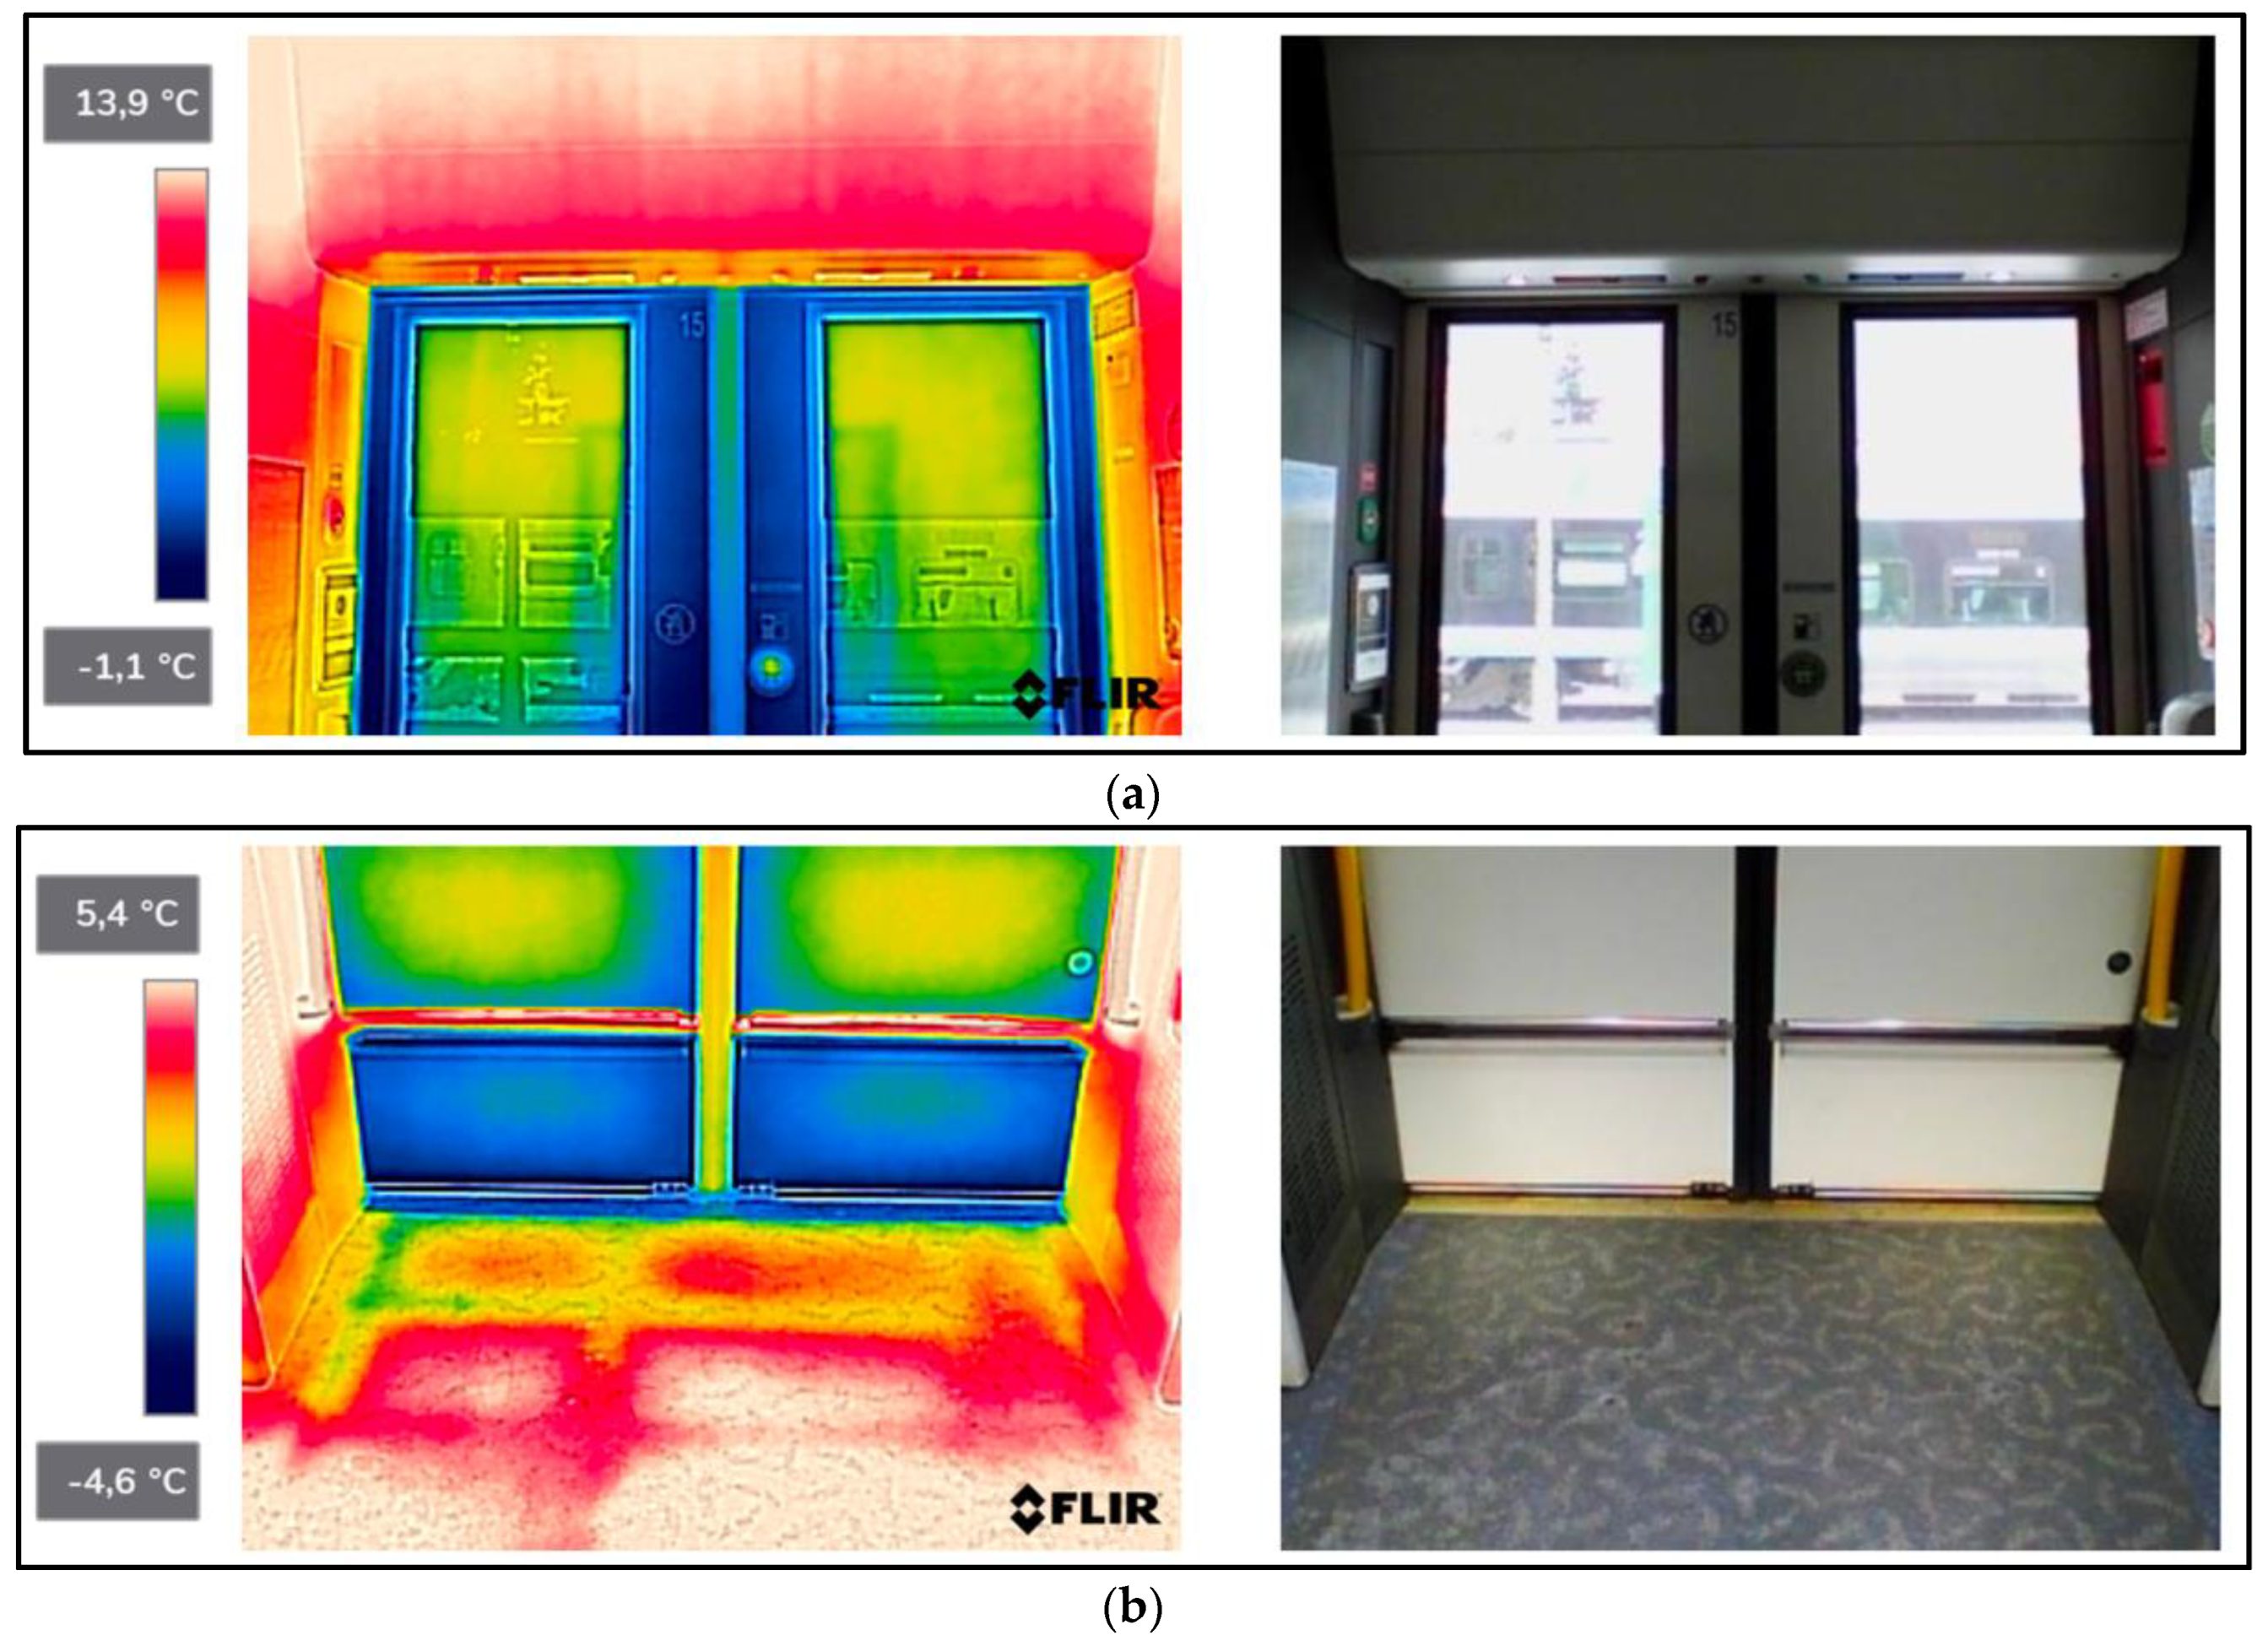
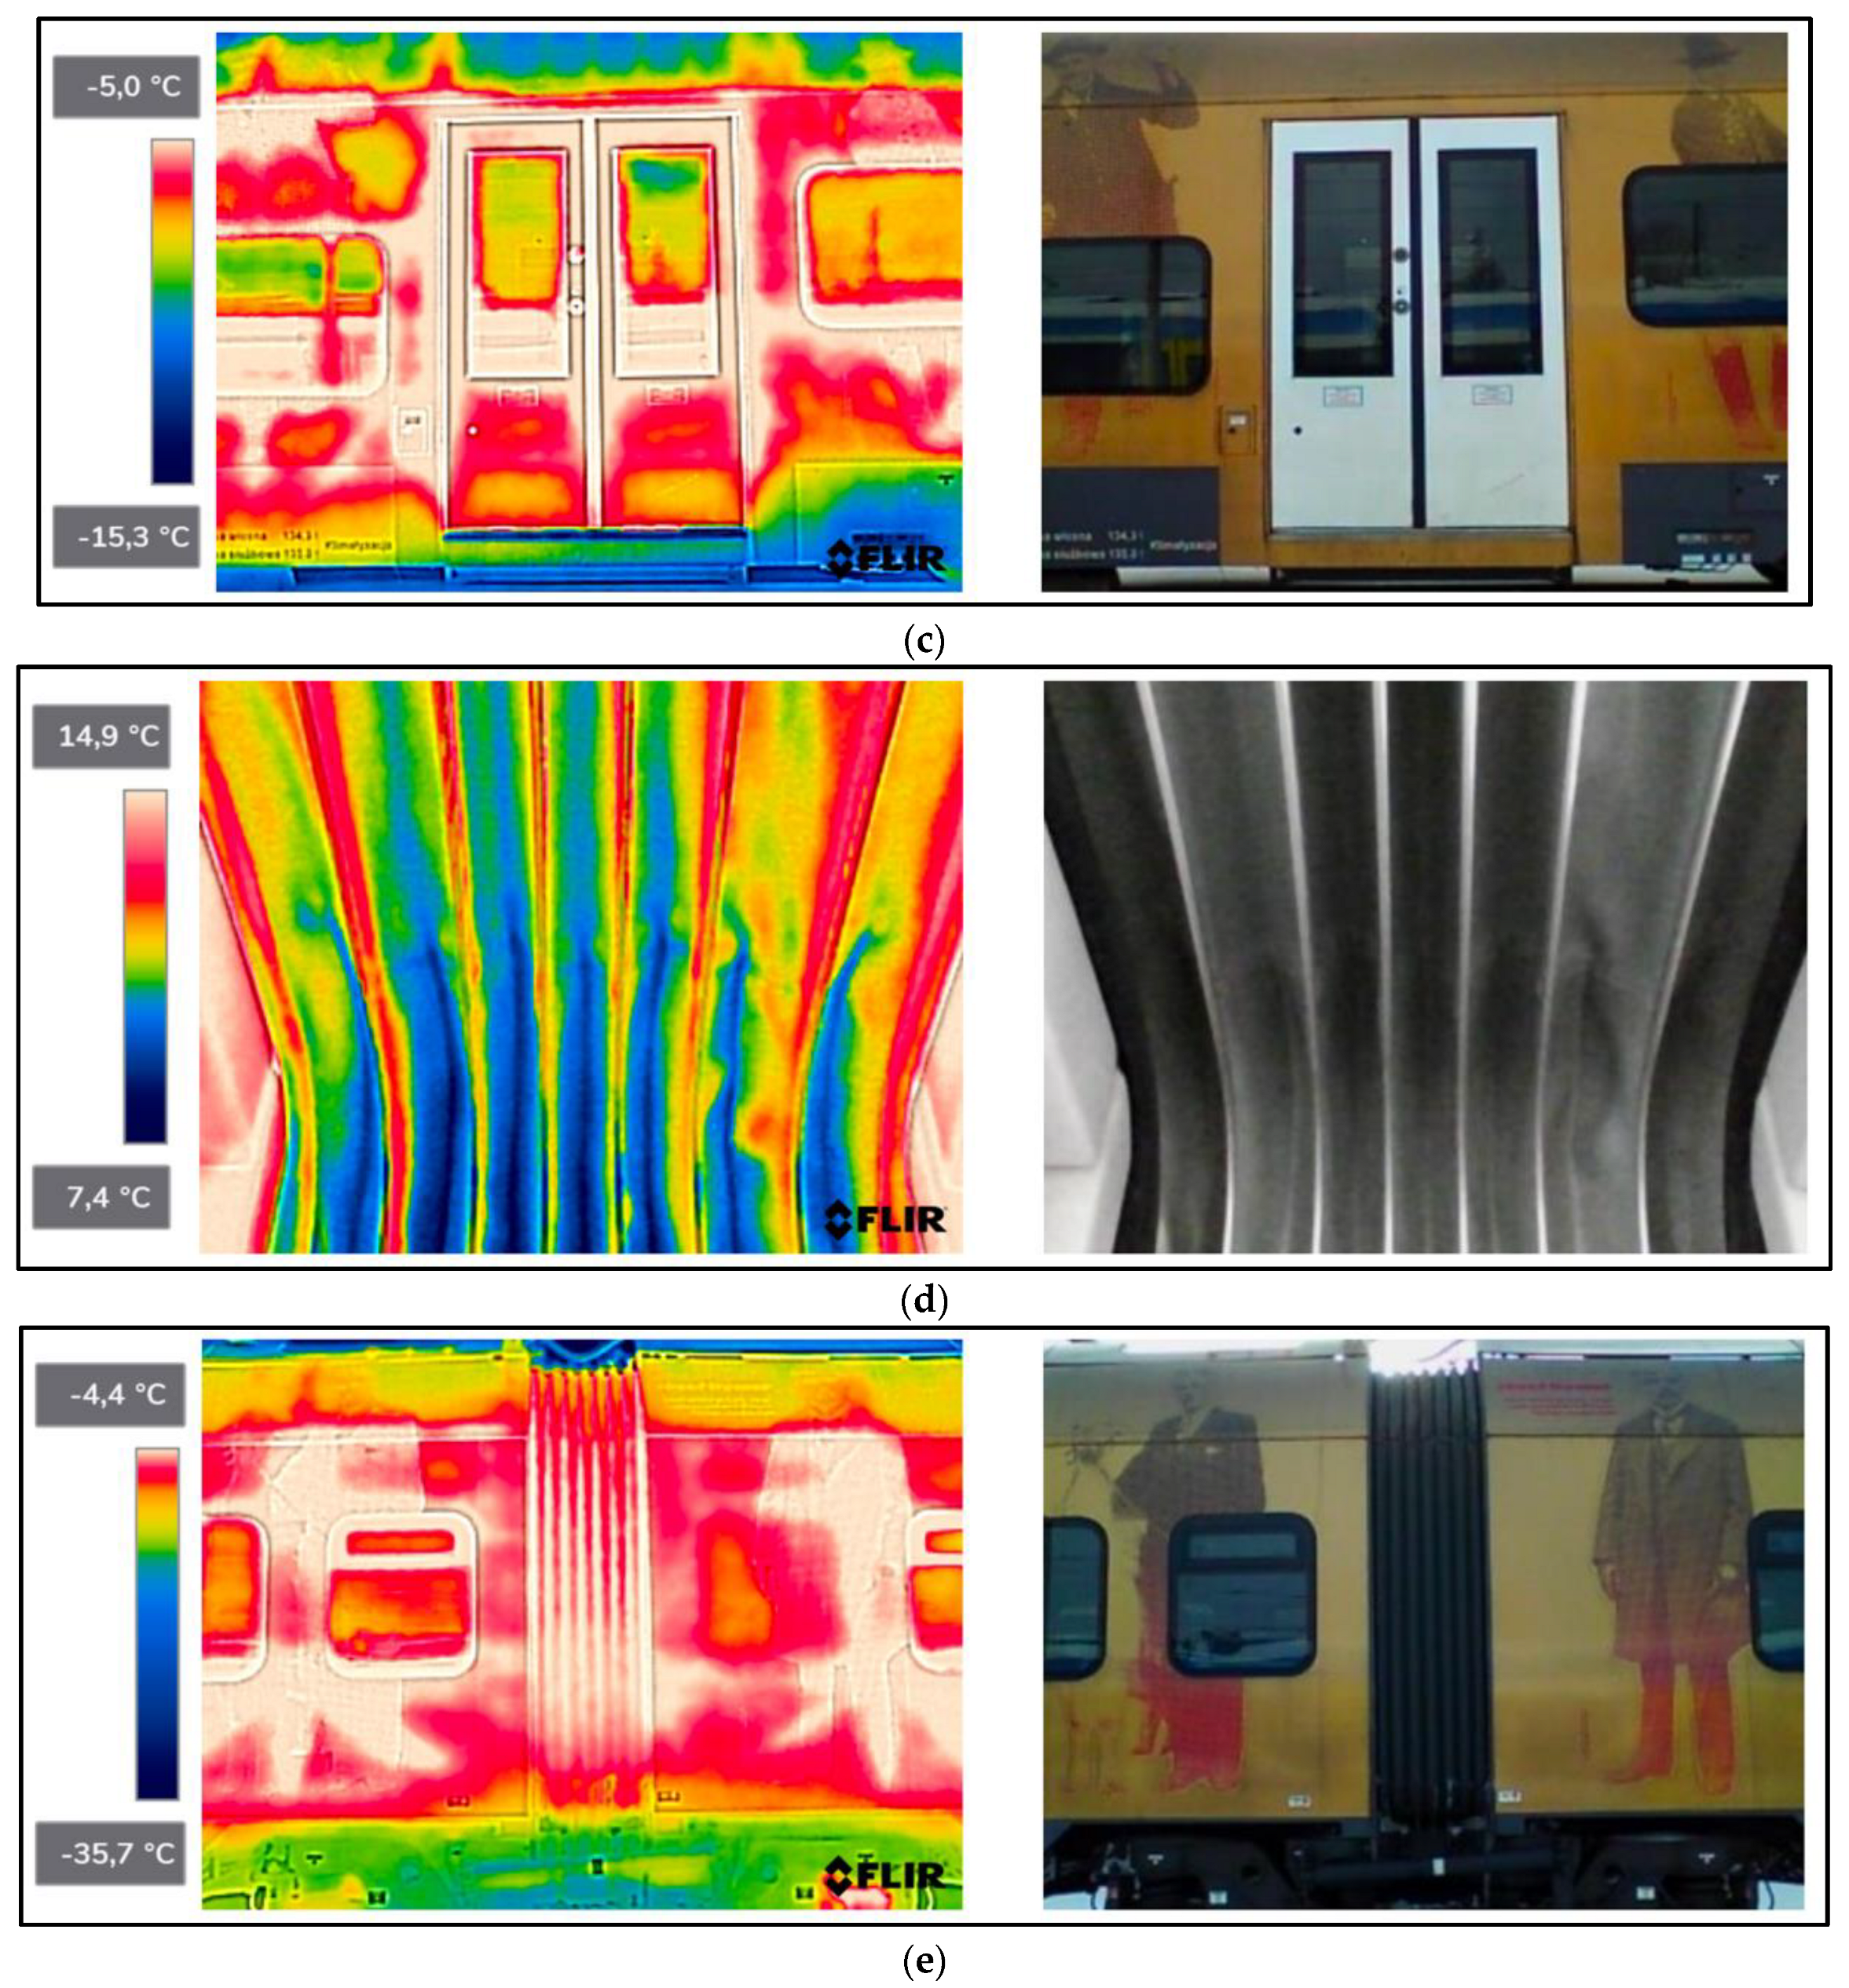
- demonstration of sensitive body components of railway vehicles. The representative of which especially is the door area including the components around the mounting and the railway car interconnections (folding connections, inter-unit connections, interconnection);
- calculations average values for the temperatures of the body components of railway vehicles;
- demonstration of condition consumption of stationary electricity of railway vehicles (energy consumption for non-traction needs, including heating at standstill);
- definition and implementation of innovative indicators for stationary electricity consumption of railway vehicles (for non-traction needs) marked as W1 and W2 constituting a component of the new approach in the implementation of innovative and non-contact temperature distribution monitoring solutions for railway vehicles in a sustainability development system transport; and,
- to complement and fill an existing research gap that has not been addressed before, while at the same time providing a new and innovative approach, particularly for civil engineering, surveying, and transport.
2. Related Work
- military, logistics, and industrial systems [26,27] and mobile multimedia devices, represented in particular by smartphones in non-contact smartphone-based monitoring of thermally stressed structures. Sefa et al. in [28] emphasise that the in-situ measurement of thermal stress in beams or continuously welded rails may prevent structural anomalies such as buckling. Advanced research applicable to specify components of communications construction is also referred to in the work of the [29,30,31]. The development of technology for the use of temperature sensors in integration with smartphones also confirms Hallock in [32] for dynamic infrared thermography and smartphone thermal imaging as an adjunct for preoperative, intraoperative, and postoperative perforator free flap monitoring. Subsequently, Hallock in [33] states that smartphone thermal imaging can enable the safer use of propeller flaps. Relatively recently, incredibly cheap but adequate thermal imaging cameras have become available that work in concert with the ubiquitous cell phone. In turn, Choi et al. in [34] presented thermal image enhancement using a convolutional neural network;
- in electrical power systems (EPS) and electronics [35,36,37]. At the same time, Żywiołek et al. in [38] state that energy conservation is a popular topic in scientific-research today, despite the specific effects of energy conservation awareness still being investigated. The results in [38] of the study clearly show that not only do economic factors affect energy saving, but also an informed society that cares about resource management;
- food supply and food quality [48], Rosak-Szyrocka and Abbase in [49] note and address the issues of how quality/safety managers can objectively and automatically implement the hazard analysis and critical control point (HACCP) principles of hazard analysis in the application of HACCP, which is the identification of risk priorities and of the related critical control points (CCPs). In turn, Ghosh et al. in [50] presented a quality evaluation of food by thermal imaging;
3. Materials and Methods
- latest (years 2017, 2018, and 2019);
- medium (years 2008, 2011, and 2012); and,
- older—senior (year 1975).
4. Results
4.1. Sensitive Body Components of Railway Vehicles
4.2. Average Values for the Temperatures of the Body Components of Railway Vehicles
4.2.1. Average Values for Rail Vehicles Door Temperatures—From inside the Vehicle
4.2.2. Average Values for Rail Vehicles Door Temperatures—From outside the Vehicle
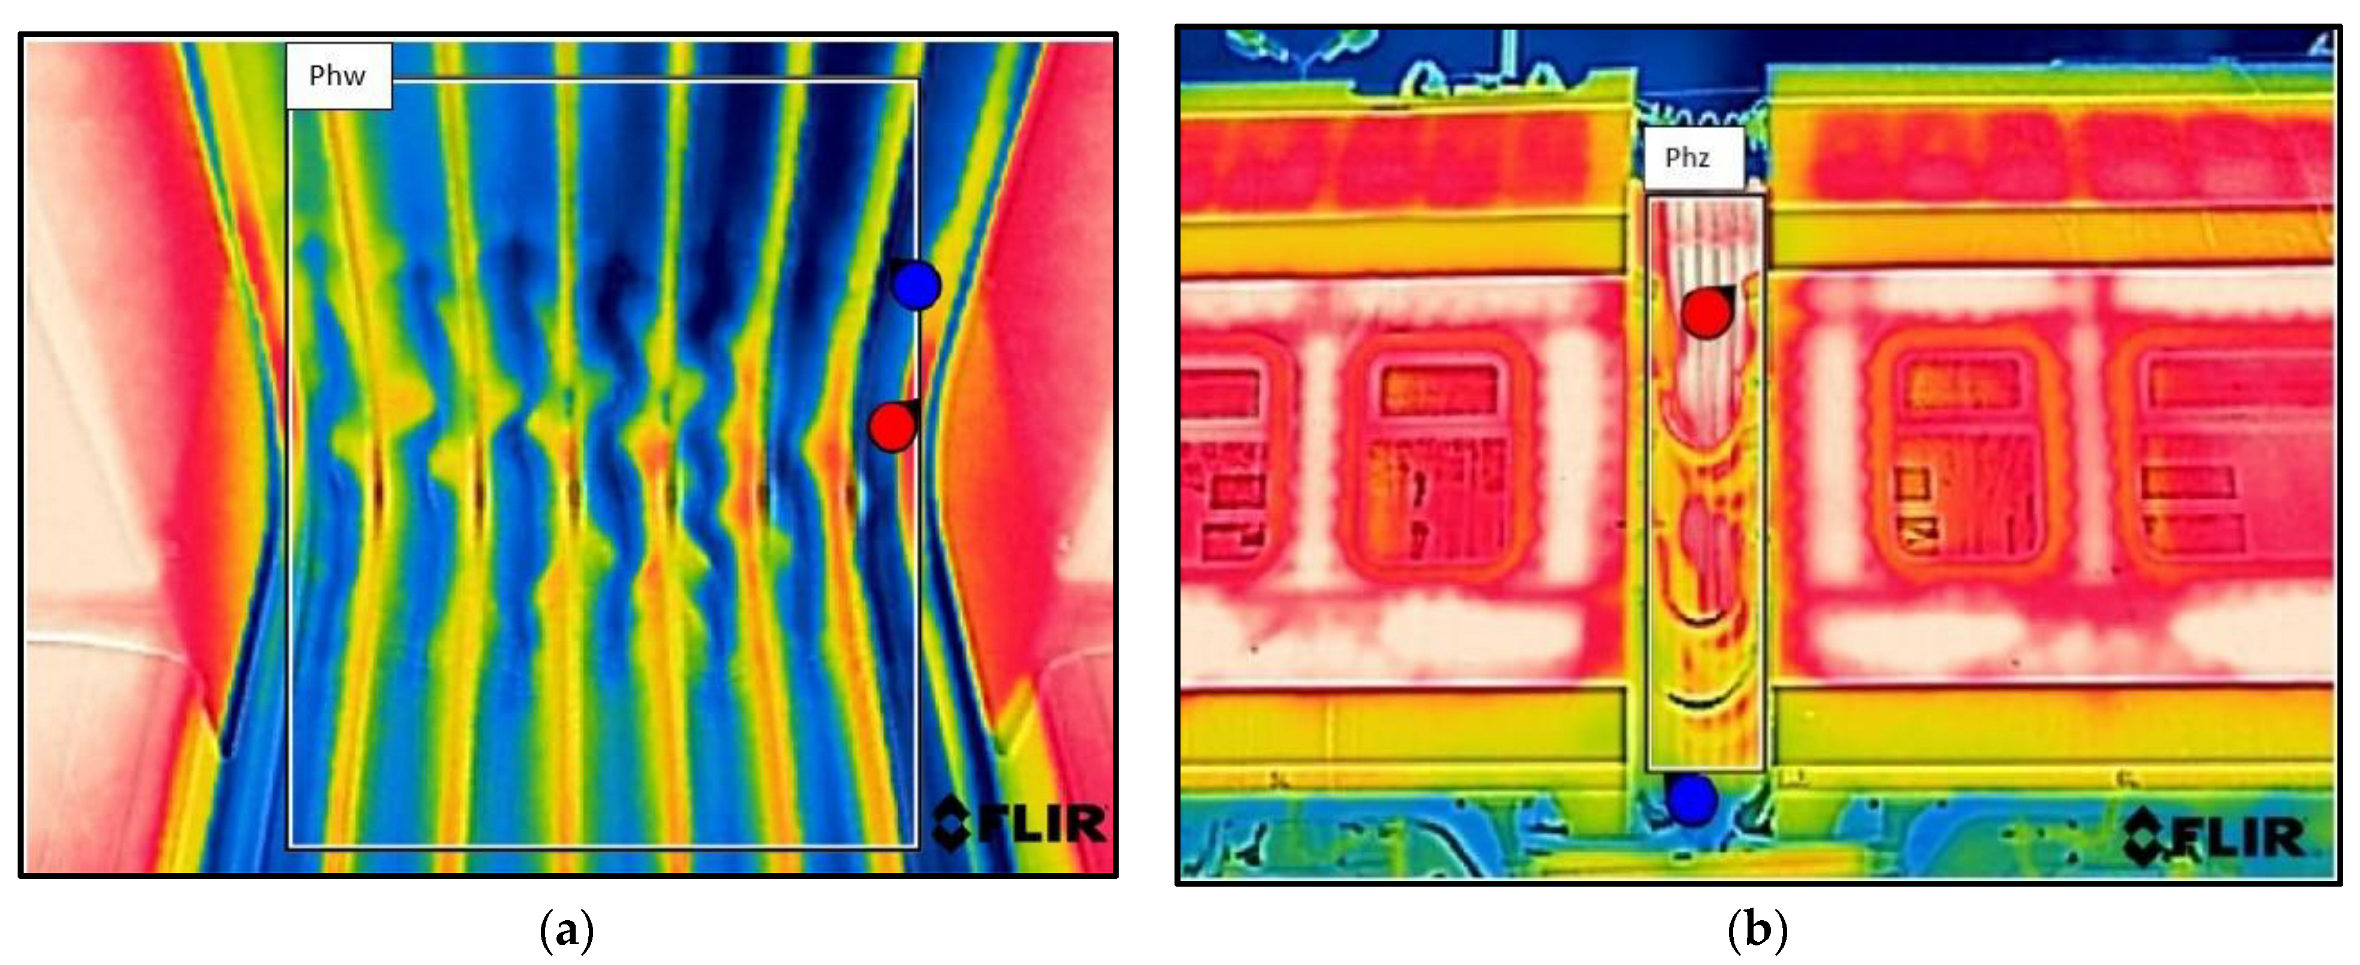
4.2.3. Average Temperatures of Inter-Unit Connections of Railway Vehicles—From inside the Vehicle
4.2.4. Average Temperatures of Inter-Unit Connections of Railway Vehicles—From outside the Vehicle
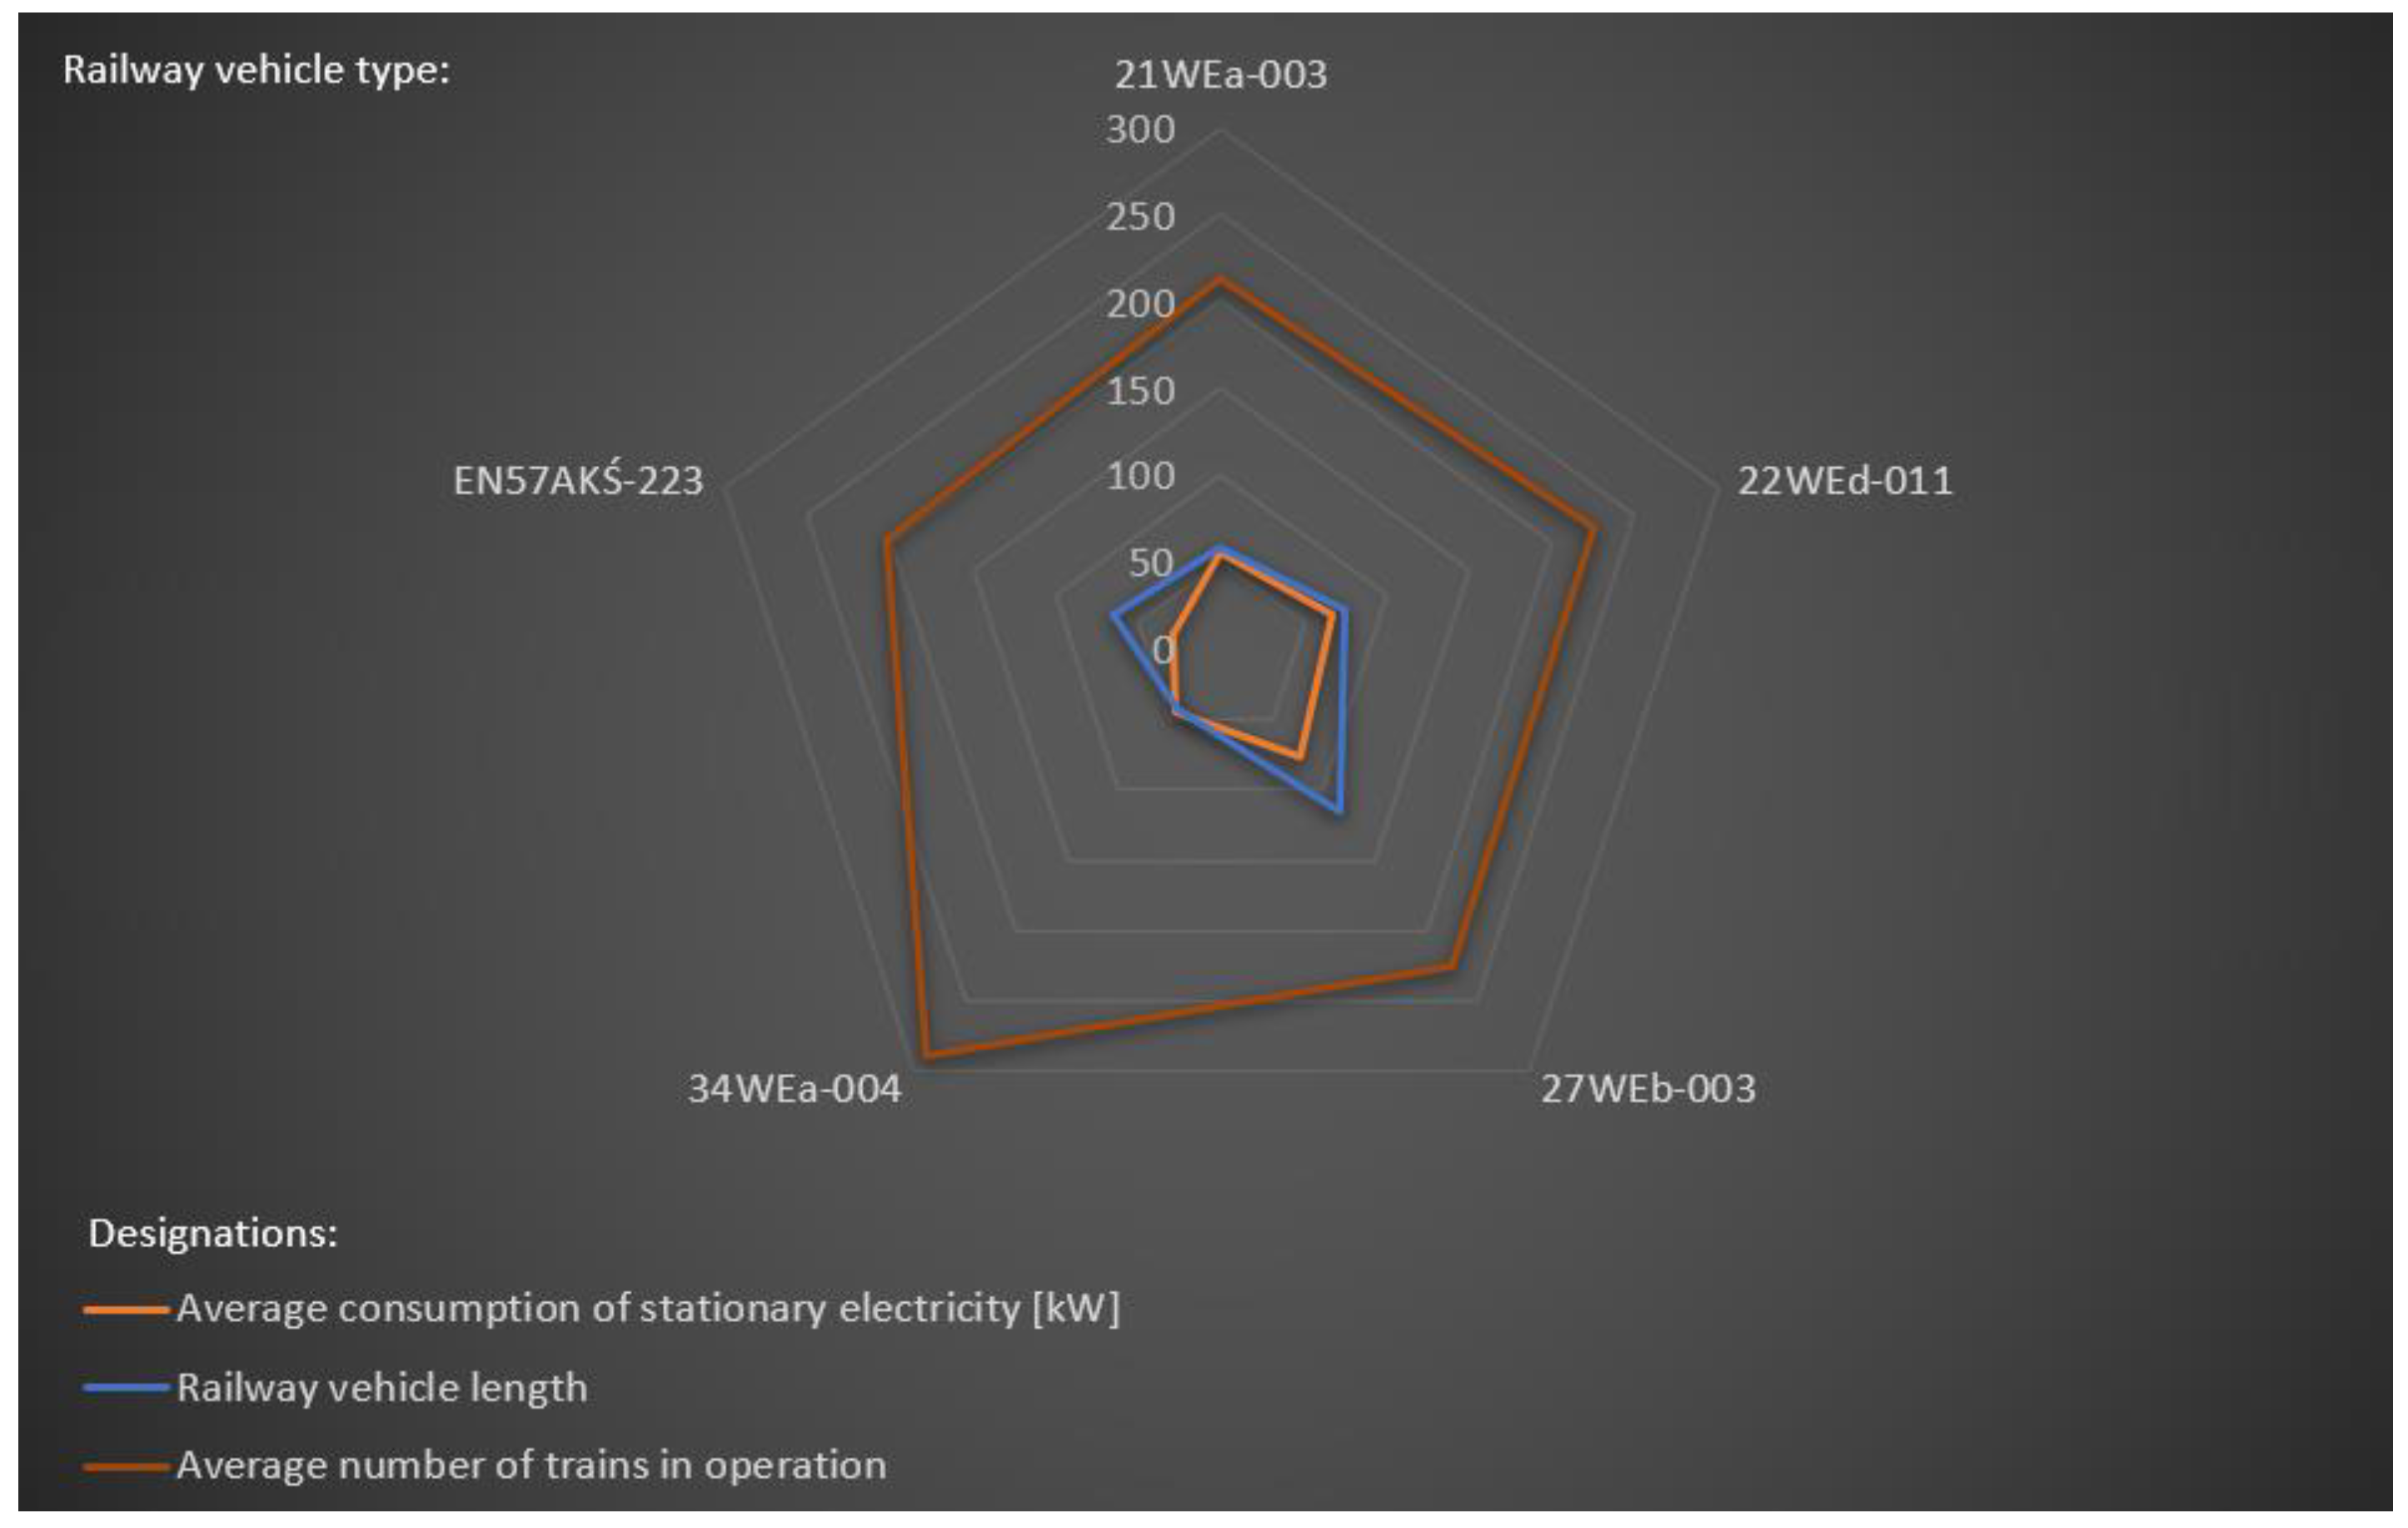
4.3. Consumption of Stationary Electricity—For Non-Traction Needs of Railway Vehicles
4.4. Innovative Indicators for Stationary Electricity Consumption—For Non-Traction Needs of Railway Vehicles
5. Discussion
6. Conclusions
- assessing the quality of the rail vehicle body in exploitation and its thermal insulation, as well as the location of thermal bridges and the tightness of the railway vehicles body using temperature sensors, represented by the FLIR-E6390 thermal imaging camera;
- demonstration of sensitive body components of railway vehicles. The representative of which especially is the door area including the components around the mounting and the railway car interconnections;
- identification of significant differences in thermal insulation between types of railway vehicles;
- calculations average values for the temperatures of the body components of railway vehicles;
- demonstrate that the older type of rail vehicle (EN57AKŚ-223) has significantly worse thermal insulation parameters than the other vehicles studied;
- to identify thermal bridges arising in individual vehicles (e.g., door seals, the base of interconnection);
- demonstration of condition consumption of stationary electricity of railway vehicles; and,
- definition and implementation of innovative indicators for stationary electricity consumption of railway vehicles marked as W1 and W2.
Author Contributions
Funding
Institutional Review Board Statement
Informed Consent Statement
Data Availability Statement
Acknowledgments
Conflicts of Interest
References
- Wen, S.; Ren, Q.; Shao, Y.; Tang, B. Research on Dynamic Monitoring of Train Running Part Using Integrated Detection System. In Artificial Intelligence and Security; Sun, X., Zhang, X., Xia, Z., Bertino, E., Eds.; ICAIS 2022. Lecture Notes in Computer Science; Springer: Cham, Switzerland, 2022; Volume 13338, pp. 206–216. [Google Scholar] [CrossRef]
- Stypułkowski, K.; Gołda, P.; Lewczuk, K.; Tomaszewska, J. Monitoring System for Railway Infrastructure Elements Based on Thermal Imaging Analysis. Sensors 2021, 21, 3819. [Google Scholar] [CrossRef]
- Karakose, M.; Yaman, O. Complex Fuzzy System Based Predictive Maintenance Approach in Railways. IEEE Trans. Ind. Inform. 2020, 16, 6023–6032. [Google Scholar] [CrossRef]
- Dumoulin, J.; Crinière, A.; Averty, R. Outdoor Thermal Monitoring of Large Scale Structures by Infrared Thermography Integrated in an ICT Based Architecture. In Twelfth International Conference on Quality Control by Artificial Vision 2015, Le Creusot, France, 3–5 June 2015; SPIE: Bellingham, WA, USA, 2015; Volume 9534, pp. 396–402. [Google Scholar] [CrossRef]
- Dumoulin, J.; Boucher, V. Infrared Thermography System for Transport Infrastructures Survey with Inline Local Atmospheric Parameter Measurements and Offline Model for Radiation Attenuation Evaluations. J. Appl. Remote Sens. 2014, 8, 084978. [Google Scholar] [CrossRef]
- Berg, A.; Öfjäll, K.; Ahlberg, J.; Felsberg, M. Detecting Rails and Obstacles Using a Train-Mounted Thermal Camera. In Image Analysis. SCIA 2015. Lecture Notes in Computer Science; Paulsen, R., Pedersen, K., Eds.; Springer: Cham, Switzerland, 2015; Volume 9127, pp. 492–503. [Google Scholar] [CrossRef] [Green Version]
- Pavlović, M.G.; Ćirić, I.T.; Ristić-Durrant, D.; Nikolić, V.D.; Simonović, M.B.; Ćirić, M.V.; Banić, M.S. Advanced Thermal Camera Based System for Object Detection on Rail Tracks. Therm. Sci. 2018, 22, 1551–1561. [Google Scholar] [CrossRef]
- Tan, Y.; Chen, Y.; Peterson, A.W.; Ahmadian, M. Monitoring and Detecting Fouled Ballast Using Forward-Looking Infrared Radiometer (FLIR) Aerial Technology: Possibilities and Limitations. In ASME/IEEE Joint Rail Conference; American Society of Mechanical Engineers: New York, NY, USA, 2019; Volume 58523, p. V001T01A019. [Google Scholar] [CrossRef]
- Ramzan, B.; Malik, M.S.; Martarelli, M.; Ali, H.T.; Yusuf, M.; Ahmad, S.M. Pixel Frequency Based Railroad Surface Flaw Detection Using Active Infrared Thermography for Structural Health Monitoring. Case Stud. Therm. Eng. 2021, 27, 101234. [Google Scholar] [CrossRef]
- Ghazanfari, M.; Tehrani, P.H. Experimental and Numerical Investigation of the Characteristics of Flash-Butt Joints Used in Continuously Welded Rails. Proc. Inst. Mech. Eng. Part F J. Rail Rapid Transit 2020, 234, 65–79. [Google Scholar] [CrossRef]
- Ishimwe, R.; Abutaleb, K.; Ahmed, F. Applications of Thermal Imaging in Agriculture—A Review. Adv. Remote Sens. 2014, 3, 50193. [Google Scholar] [CrossRef] [Green Version]
- Deilamsalehy, H.; Havens, T.C.; Lautala, P.; Medici, E.; Davis, J. An Automatic Method for Detecting Sliding Railway Wheels and Hot Bearings Using Thermal Imagery. Proc. Inst. Mech. Eng. Part F J. Rail Rapid Transit 2017, 231, 690–700. [Google Scholar] [CrossRef]
- Stoynova, A.; Nenov, N.; Bonev, B.; Yosifova, D. Electronic Sensor System for Monitoring the Temperature Status of Rolling Stock in Motion. In Proceedings of the 2019 42nd International Spring Seminar on Electronics Technology (ISSE), Wroclaw, Poland, 15–19 May 2019; pp. 1–6. [Google Scholar] [CrossRef]
- Sawczuk, W. The Evaluation of a Rail Disc Brake Braking Process by Using a Thermal Camera. Meas. Autom. Monit. 2015, 61, 265–270. [Google Scholar]
- Lisanti, G.; Karaman, S.; Pezzatini, D.; Bimbo, A.D. A Multi-Camera Image Processing and Visualization System for Train Safety Assessment. Multimed. Tools Appl. 2018, 77, 1583–1604. [Google Scholar] [CrossRef] [Green Version]
- Kim, M.S.; Oh, S.C.; Kim, G.Y.; Kwon, S.J. Underbody Component Monitoring System of Railway Vehicles Using the Infra-red Thermal Images. In Proceedings of the 2014 International SoC Design Conference (ISOCC), Jeju, Republic of Korea, 3–6 November 2014; pp. 222–223. [Google Scholar] [CrossRef]
- Deilamsalehy, H.; Havens, T.C.; Lautala, P. Sensor Fusion of Wayside Visible and Thermal Imagery for Rail Car Wheel and Bearing Damage Detection. In ASME/IEEE Joint Rail Conference; American Society of Mechanical Engineers: New York, NY, USA, 2017; Volume 50718, p. V001T02A011. [Google Scholar] [CrossRef]
- Deilamsalehy, H.; Havens, T.C.; Lautala, P. Detection of Sliding Wheels and Hot Bearings Using Wayside Thermal Cameras. In ASME/IEEE Joint Rail Conference; American Society of Mechanical Engineers: New York, NY, USA, 2016; Volume 49675, p. V001T02A002. [Google Scholar] [CrossRef]
- Szurgacz, D.; Zhironkin, S.; Vöth, S.; Pokorný, J.; Spearing, A.J.S.; Cehlár, M.; Stempniak, M.; Sobik, L. Thermal Imaging Study to Determine the Operational Condition of a Conveyor Belt Drive System Structure. Energies 2021, 14, 3258. [Google Scholar] [CrossRef]
- Glowacz, A. Fault Diagnosis of Electric Impact Drills Using Thermal Imaging. Measurement 2021, 171, 108815. [Google Scholar] [CrossRef]
- Abdulshahed, A.M.; Longstaff, A.P.; Fletcher, S.; Myers, A. Thermal Error Modelling of Machine Tools Based on ANFIS with Fuzzy C-means Clustering Using a Thermal Imaging Camera. Appl. Math. Model. 2015, 39, 1837–1852. [Google Scholar] [CrossRef]
- Carvalho, R.; Nascimento, R.; D’Angelo, T.; Delabrida, S.; Bianchi, A.G.C.; Oliveira, R.A.R.; Azpúrua, H.; Uzeda Garcia, L.G. A UAV-Based Framework for Semi-Automated Thermographic Inspection of Belt Conveyors in the Mining Industry. Sensors 2020, 20, 2243. [Google Scholar] [CrossRef] [Green Version]
- Sztubecki, J.; Topoliński, S.; Mrówczyńska, M.; Bağrıaçık, B.; Beycioğlu, A. Experimental Research of the Structure Condition Using Geodetic Methods and Crackmeter. Appl. Sci. 2022, 12, 6754. [Google Scholar] [CrossRef]
- Mrówczyńska, M.; Sztubecki, J. The Network Structure Evolutionary Optimization to Geodetic Monitoring in the Aspect of Information Entropy. Measurement 2021, 179, 109369. [Google Scholar] [CrossRef]
- Shvets, A.O. Influence of Lateral Displacement of Bogies on the Freight Car Dynamics. Science and Transport Progress 2020, 6, 66–81. [Google Scholar] [CrossRef]
- Gade, R.; Moeslund, T.B. Thermal Cameras and Applications: A Survey. Mach. Vis. Appl. 2014, 25, 245–262. [Google Scholar] [CrossRef] [Green Version]
- Sahr, C.A. Thermal Imaging of Railroad Cars Used for Molten Iron Transport. Thermosense XXI 1999, 3700, 194–201. [Google Scholar] [CrossRef]
- Sefa Orak, M.; Nasrollahi, A.; Ozturk, T.; Mas, D.; Ferrer, B.; Rizzo, P. Non-Contact Smartphone-Based Monitoring of Thermally Stressed Structures. Sensors 2018, 18, 1250. [Google Scholar] [CrossRef] [PubMed] [Green Version]
- Przybyłowicz, M.; Sysyn, M.; Gerber, U.; Kovalchuk, V.; Fischer, S. Comparison of the Effects and Efficiency of Vertical and Side Tamping Methods for Ballasted Railway Tracks. Constr. Build. Mater. 2022, 314, 125708. [Google Scholar] [CrossRef]
- Sysyn, M.; Gerber, U.; Liu, J.; Fischer, S. Studying the Relation of the Residual Stresses in the Ballast Layer to the Elastic Wave Propagation. Transp. Infrastruct. Geotechnol. 2022, 1–26. [Google Scholar] [CrossRef]
- Fischer, S. Investigation of the Horizontal Track Geometry Regarding Geogrid Reinforcement Under Ballast. Acta Polytech. Hung. 2022, 19, 89–101. [Google Scholar] [CrossRef]
- Hallock, G.G. Dynamic Infrared Thermography and Smartphone Thermal Imaging as an Adjunct for Preoperative, Intraoperative, and Postoperative Perforator Free Flap Monitoring. Plast. Aesthetic Res. 2019, 6, 29. [Google Scholar] [CrossRef]
- Hallock, G.G. Smartphone Thermal Imaging Can Enable the Safer Use of Propeller Flaps. Semin. Plast. Surg. 2020, 34, 161–164. [Google Scholar] [CrossRef]
- Choi, Y.; Kim, N.; Hwang, S.; Kweon, I.S. Thermal Image Enhancement Using Convolutional Neural Network. In Proceedings of the 2016 IEEE/RSJ International Conference on Intelligent Robots and Systems (IROS), Daejeon, Republic of Korea, 9–14 October 2016; pp. 223–230. [Google Scholar] [CrossRef]
- Karakose, M.; Yaman, O.; Aydin, I.; Karakose, E. Real-Time Condition Monitoring Approach of Pantograph-Catenary System Using FPGA. In Proceedings of the 2016 IEEE 14th International Conference on Industrial Informatics (INDIN), Poitiers, France, 19–21 July 2016; pp. 481–486. [Google Scholar] [CrossRef]
- Pal, D.; Meyur, R.; Menon, S.; Reddy, M.J.B.; Mohanta, D.K. Real-Time Condition Monitoring of Substation Equipment Using Thermal Cameras. IET Gener. Transm. Distrib. 2018, 12, 895–902. [Google Scholar] [CrossRef]
- Merryman, S.A.; Nelms, R.M. Diagnostic Technique for Power Systems Utilizing Infrared Thermal Imaging. IEEE Trans. Ind. Electron. 1995, 42, 615–618. [Google Scholar] [CrossRef]
- Żywiołek, J.; Rosak-Szyrocka, J.; Mrowiec, M. Knowledge Management in Households about Energy Saving as Part of the Awareness of Sustainable Development. Energies 2021, 14, 8207. [Google Scholar] [CrossRef]
- Jung, Y.S.; Jung, D.Y. Class 1-3 Vehicle Classification Using Deep Learning and Thermal Image. J. Korea Inst. Intell. Transp. Syst. 2020, 19, 96–106. [Google Scholar] [CrossRef]
- Yang, J.; Zuo, B.; Kim, S.H. Understanding the Factors Underlying Variation in Detection Errors of Video-and Thermal-Imaging Cameras. Transp. Res. Rec. J. Transp. Res. Board 2016, 2557, 55–65. [Google Scholar] [CrossRef]
- Aparna; Bhatia, Y.; Rai, R.; Gupta, V.; Aggarwal, N.; Akula, A. Convolutional Neural Networks Based Potholes Detection Using Thermal Imaging. J. King Saud Univ.-Comput. Inf. Sci. 2022, 34, 578–588. [Google Scholar] [CrossRef]
- Henault, J.W.; Larsen, D.A. Thermal Imaging of Hot-Mix Asphalt Paving Projects in Connecticut. Transp. Res. Rec. J. Transp. Res. Board 2006, 1946, 130–138. [Google Scholar] [CrossRef]
- Samuel, M.; M Ajibade, S.; Fudah Moveh, F.A.I. Driven Thermal People Counting for Smart Window Facade Using Portable Low-Cost Miniature Thermal Imaging Sensors. Preprints 2020, 2020010067. [Google Scholar] [CrossRef] [Green Version]
- Lyu, C.; Heyer, P.; Goossens, B.; Philips, W. An Unsupervised Transfer Learning Framework for Visible-Thermal Pedestrian Detection. Sensors 2022, 22, 4416. [Google Scholar] [CrossRef]
- Kuchár, P.; Pirník, R.; Tichý, T.; Rástočný, K.; Skuba, M.; Tettamanti, T. Noninvasive Passenger Detection Comparison Using Thermal Imager and IP Cameras. Sustainability 2021, 13, 12928. [Google Scholar] [CrossRef]
- Chang, S.L.; Yang, F.T.; Wu, W.P.; Cho, Y.A.; Chen, S.W. Nighttime Pedestrian Detection Using Thermal Imaging Based on HOG feature. In Proceedings of the 2011 International Conference on System Science and Engineering, Macau, China, 8–10 June 2011; pp. 694–698. [Google Scholar] [CrossRef]
- ALshukri, D.; R Lavanya, V.; Sumesh, E.P.; Krishnan, P. Intelligent Border Security Intrusion Detection Using IoT and Embedded Systems. In Proceedings of the 2019 4th MEC International Conference on Big Data and Smart City (ICBDSC), Muscat, Oman, 15–16 January 2019; pp. 1–3. [Google Scholar] [CrossRef]
- Badia-Melis, R.; Mc Carthy, U.; Ruiz-Garcia, L.; Garcia-Hierro, J.; Villalba, J.I.R. New Trends in Cold Chain Monitoring Applications-A Review. Food Control 2018, 86, 170–182. [Google Scholar] [CrossRef]
- Rosak-Szyrocka, J.; Abbase, A.A. Quality Management and Safety of Food in HACCP System Aspect. Prod. Eng. Arch. 2020, 26, 50–53. [Google Scholar] [CrossRef]
- Ghosh, P.; Rana, S.S.; Nayak, A.; Pradhan, R.C. Quality Evaluation of Food by Thermal Imaging. Internat. J. Proc. Post Harvest Technol. 2016, 7, 126–133. [Google Scholar] [CrossRef]
- Kisilowski, M.; Stypułkowski, K. Thermal Imaging for the Operator’s Comfort Assessment in the Aspect of the COVID-19 Pandemic. Arch. Transp. 2021, 59, 149–163. [Google Scholar] [CrossRef]
- Ring, E.F.J.; Ammer, K. Infrared Thermal Imaging in Medicine. Physiol. Meas. 2012, 33, R33. [Google Scholar] [CrossRef]
- Calvari, S.; Spampinato, L.; Lodato, L.; Harris, A.J.L.; Patrick, M.R.; Dehn, J.; Burton, M.R.; Andronico, D. Chronology and Complex Volcanic Processes During the 2002–2003 Flank Eruption at Stromboli Volcano (Italy) Reconstructed from Direct Observations and Surveys with a Handheld Thermal Camera. J. Geophys. Res. Solid Earth 2005, 110. [Google Scholar] [CrossRef] [Green Version]
- Fuentes, S.; Tongson, E.; Gonzalez Viejo, C. Urban Green Infrastructure Monitoring Using Remote Sensing from Integrated Visible and Thermal Infrared Cameras Mounted on a Moving Vehicle. Sensors 2021, 21, 295. [Google Scholar] [CrossRef] [PubMed]
- FLIR Systems, Inc. Technical Data FLIR Ex Series; FLIR Systems, Inc.: Wilsonville, OR, USA, 2019. [Google Scholar]
- Jalowiec, T.; Miciula, I.; Barczak, M.; Szymkowska, A.; Masloch, P.; Wojtaszek, H.; Masloch, G. Innovation in the Production Process: Conditions in Line with the Production Schedule. Eur. Res. Stud. J. 2021, 24, 536–547. [Google Scholar] [CrossRef] [PubMed]


| Parameter | Value |
|---|---|
| IR resolution | 240 × 180 pixels |
| Thermal sensitivity/NETD | <0.06 °C (0.11 °F)/<60 mK |
| Field of view (FOV) | 45° × 34° |
| Spatial resolution (IFOV) | 3.4 mrad |
| Image frequency | 9 Hz |
| Detector type | Focal plane array (FPA), uncooled microbolometer |
| Spectral range | 7.5–13 μm |
| Operating temperaturę range | −15 °C to +50° |
| Accuracy (for ambient temperature 10 to 35 °C, object temperature above 0 °C and camera temperature range −20 to 250 °C | ±2 °C |
| Railway Vehicle Type | Factory Number | Year of Production | Producent |
|---|---|---|---|
| 21WEa-003 | E737BNA003 a, c, b | 2017 | PESA Bydgoszcz joint-stock company (PESA Bydgoszcz S.A. in Polish) |
| 22WEd-011 | E747BNA011 a, b, c, d | 2019 | PESA Bydgoszcz joint-stock company (PESA Bydgoszcz S.A. in Polish) |
| 27WEb-003 | E763BNA003 a, b, c, d, e, f | 2012 | PESA Bydgoszcz joint-stock company (PESA Bydgoszcz S.A. in Polish) |
| 34WEa-004 | E722BNA004 a, b | 2018 | PESA Bydgoszcz joint-stock company (PESA Bydgoszcz S.A. in Polish) |
| EN57AKŚ-223 | 311/001 a, s, b | 1975 | State-owned Pafawag Wagon Factory, NEWAG S.A. modernisation and Electric Locomotive Repair Plant in Gliwice (Państwowa Fabryka Wagonów Pafawag, modernizacja NEWAG S.A. oraz Zakłady Naprawcze Lokomotyw Elektrycznych w Gliwicach in Polish) |
| EN75-004 | L-415811 a, b, c, d | 2008 | Stadler Poland limited liability company (Stadler Polska sp. z o.o. in Polish) |
| EN76-009 | E742BNA009 a, b, c, d | 2011 | PESA Bydgoszcz joint-stock company (PESA Bydgoszcz S.A. in Polish) |
| Railway Vehicle Type | Type of Material | |
|---|---|---|
| Thermal Insulation | Interconnection | |
| 21WEa-003 | Material: Plastotect (thickness 20 mm—floor ramps, 25 mm—lower deck, 50 mm—walls below window line), Moniflex (thickness 10 mm), and mineral wool (thickness 40 mm—overhead deck) | Folding sheet (harmonica) exterior/interior—fabric SEF3, light alloy profiles; rubber protective collar—EPDM |
| 22WEd-011 | Material: Plastotect (thickness 20 mm—floor ramps, 25 mm—lower deck, 50 mm—walls below window line), Moniflex (thickness 10 mm), and mineral wool (thickness 40 mm—overhead deck) | Folding sheet (harmonica) exterior/interior—fabric SEF3, light alloy profiles; rubber protective collar—EPDM |
| 27WEb-003 | Material: Moniflex—60 mm overhead deck, 60 mm sidewalls, 60 mm flooring | External/internal corrugated harmonica—harmonica fabric EF 5, M 3, T 5, and light alloy metal sections |
| 34WEa-004 | Material: Plastotect (thickness 20 mm—floor ramps, 25 mm—lower deck, 50 mm—walls below window line), Moniflex (thickness 10 mm), and mineral wool (thickness 40 mm—overhead deck). | Folding sheet (harmonica) exterior/interior—fabric SEF3, light alloy profiles; rubber protective collar—EPDM |
| EN57AKŚ-223 | In the side walls and ceiling, mineral wool matting covered on one side with foil aluminium foil | No data available |
| EN75-004 | No data available | Double harmonic for good thermal and acoustic insulation |
| EN76-009 | Material: Moniflex—60 mm overhead deck, 60 mm sidewalls, 60 mm flooring | Outer/inner wavy harmonica—harmonica fabric EF 5, M 3, T 5, and light alloy metal sections |
| Place of Defined Measurement | Railway Vehicle Type | |||||||
|---|---|---|---|---|---|---|---|---|
| Emissivity ε | 21WEa-003 | 22WEd-011 | 27WEb-003 | 34WEa-004 | EN57AKŚ-223 | EN75-004 | EN76-009 | |
| Average temperature value [°C] | ||||||||
| Interior door (upper part) | ||||||||
| Dwg1 | 0.96 | 15.4 | 13.5 | 12.3 | 11.9 | 7.1 | 11.5 | 4.1 |
| Dwg2 | 0.93 | 11.7 | 10.2 | 12.9 | 10.3 | 10.1 | 11.3 | 3.1 |
| Dwg3 | 0.96 | 15.5 | 13.3 | 13.3 | 12.7 | 10.3 | 12.1 | 4.4 |
| Interior door (lower part) | ||||||||
| Dwd1 | 0.96 | 11.4 | 11.0 | 11.4 | 6.1 | 3.2 | 15.8 | 0.7 |
| Dwd2 | 0.96 | 11.4 | 9.4 | 10.9 | 7.3 | 3.3 | 14.3 | 0.9 |
| Dwd3 | 0.95 | 8.0 | 12.4 | 9.8 | 3.1 | −1.6 | 17,7 | 0,0 |
| Doors from outside | ||||||||
| Dz1 | 0.96 | 9.3 | 1.4 | 0.8 | 2.5 | 4.5 | 7.4 | −5.5 |
| Dz2 | 0.93 | 10.3 | 1.8 | 1.9 | 8.2 | 8.5 | 8.3 | −3.2 |
| Dz3 | 0.96 | 9.3 | 1.4 | 0.3 | 2.6 | 4.1 | 7.8 | −5.6 |
| Interconnection from within | ||||||||
| Phw | 0.91 | 14.5 | 19.5 | 16.7 | 10.5 | −2.1 | 12.4 | 10.4 |
| Interconnection from the outside | ||||||||
| Phz | 0.91 | 10.0 | −1.3 | −0.6 | 6.1 | −2.1 | 2.5 | −4.2 |
| Railway Vehicle Type | Average Consumption of Stationary Electricity [kW] | Average Number of Trains in Operation | Railway Vehicle Length Li [m] | Index Average Energy Consumption per Number of Trains in Operation W1 | Index |
|---|---|---|---|---|---|
| 21WEa-003 | 55.33 | 213 | 58.73 | 0.26 | 0.0044 |
| 22WEd-011 | 66.33 | 225 | 74.63 | 0.29 | 0.0040 |
| 27WEb-003 | 76.33 | 225 | 114.75 | 0.34 | 0.0030 |
| 34WEa-004 | 44.67 | 289 | 42.83 | 0.15 | 0.0036 |
| EN57AKŚ-223 | 29.00 | 203 | 64.77 | 0.14 | 0.0022 |
| EN75-004 | No data available | ||||
| EN76-009 | No data available | ||||
Publisher’s Note: MDPI stays neutral with regard to jurisdictional claims in published maps and institutional affiliations. |
© 2022 by the authors. Licensee MDPI, Basel, Switzerland. This article is an open access article distributed under the terms and conditions of the Creative Commons Attribution (CC BY) license (https://creativecommons.org/licenses/by/4.0/).
Share and Cite
Kampczyk, A.; Gamon, W.; Gawlak, K. Implementation of Non-Contact Temperature Distribution Monitoring Solutions for Railway Vehicles in a Sustainability Development System Transport. Sensors 2022, 22, 9624. https://doi.org/10.3390/s22249624
Kampczyk A, Gamon W, Gawlak K. Implementation of Non-Contact Temperature Distribution Monitoring Solutions for Railway Vehicles in a Sustainability Development System Transport. Sensors. 2022; 22(24):9624. https://doi.org/10.3390/s22249624
Chicago/Turabian StyleKampczyk, Arkadiusz, Wojciech Gamon, and Katarzyna Gawlak. 2022. "Implementation of Non-Contact Temperature Distribution Monitoring Solutions for Railway Vehicles in a Sustainability Development System Transport" Sensors 22, no. 24: 9624. https://doi.org/10.3390/s22249624