
Side-Polish Plastic Optical Fiber Based SPR Sensor for Refractive Index and Liquid-Level Sensing

 , , and
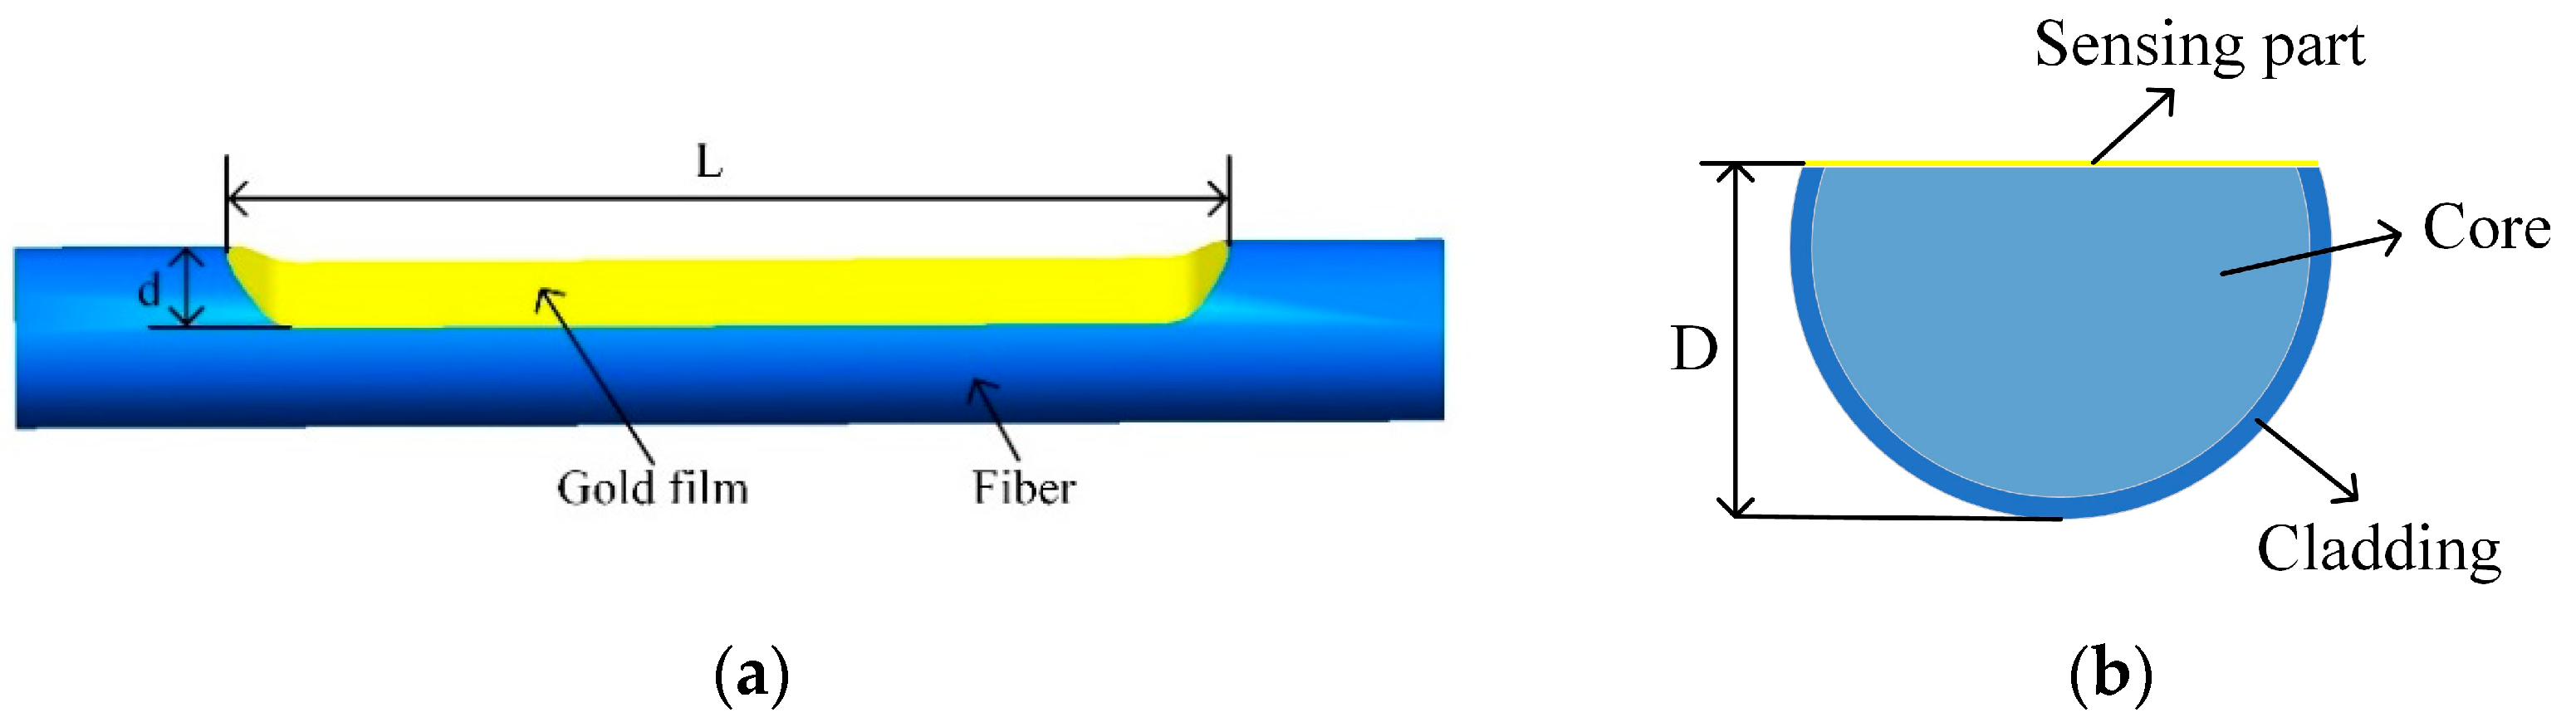
Abstract
:1. Introduction
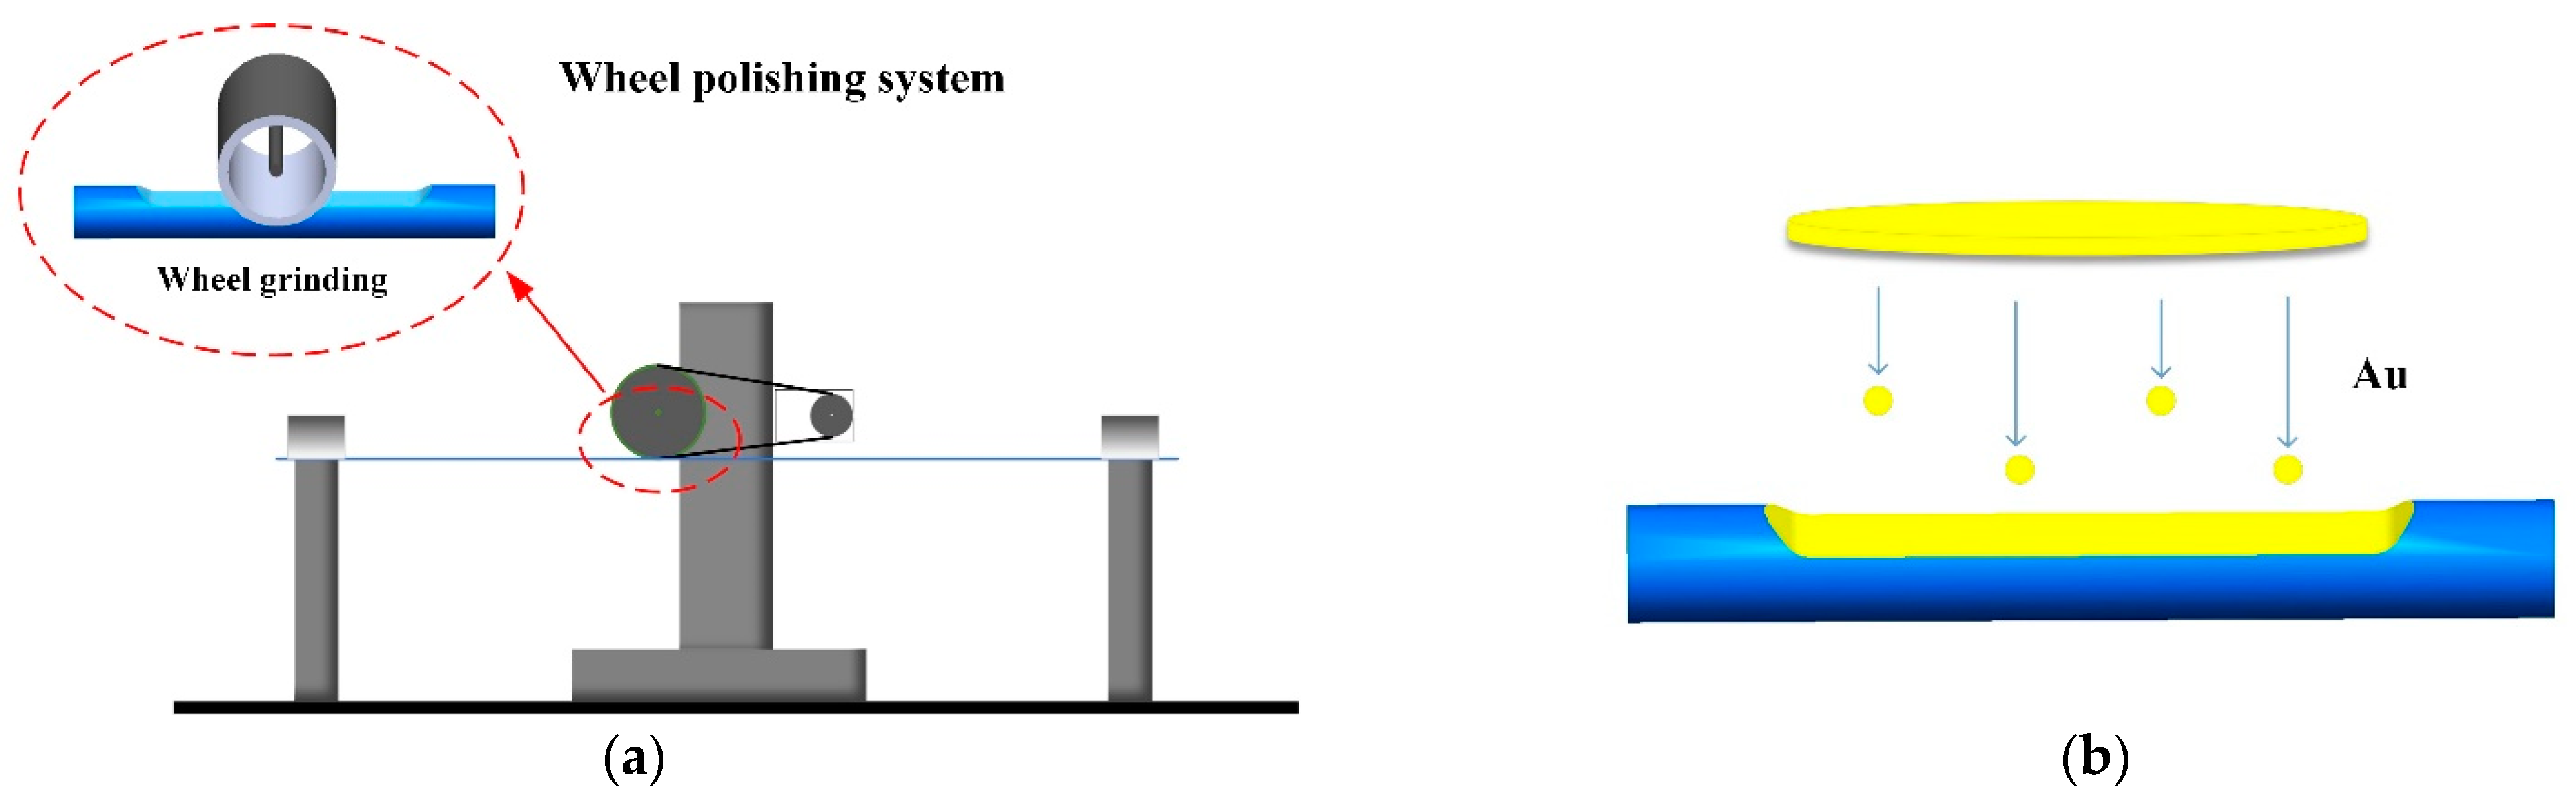
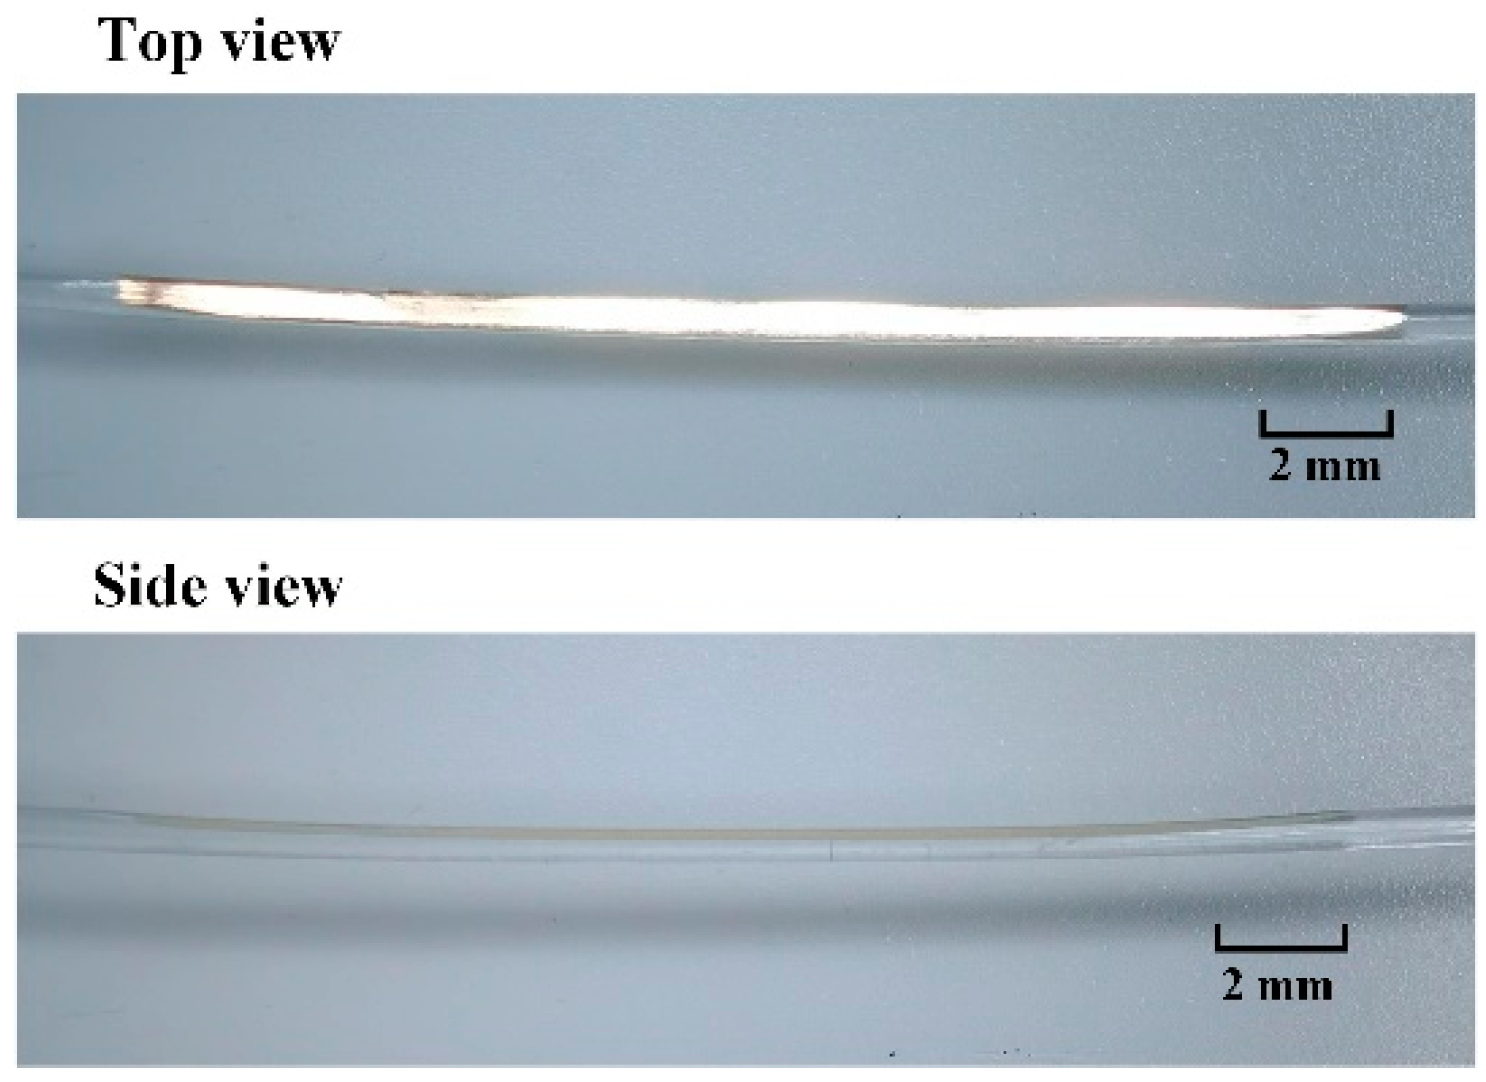
2. Sensor Probe Structure and Fabrication
3. Sensor Probe Operating Principle
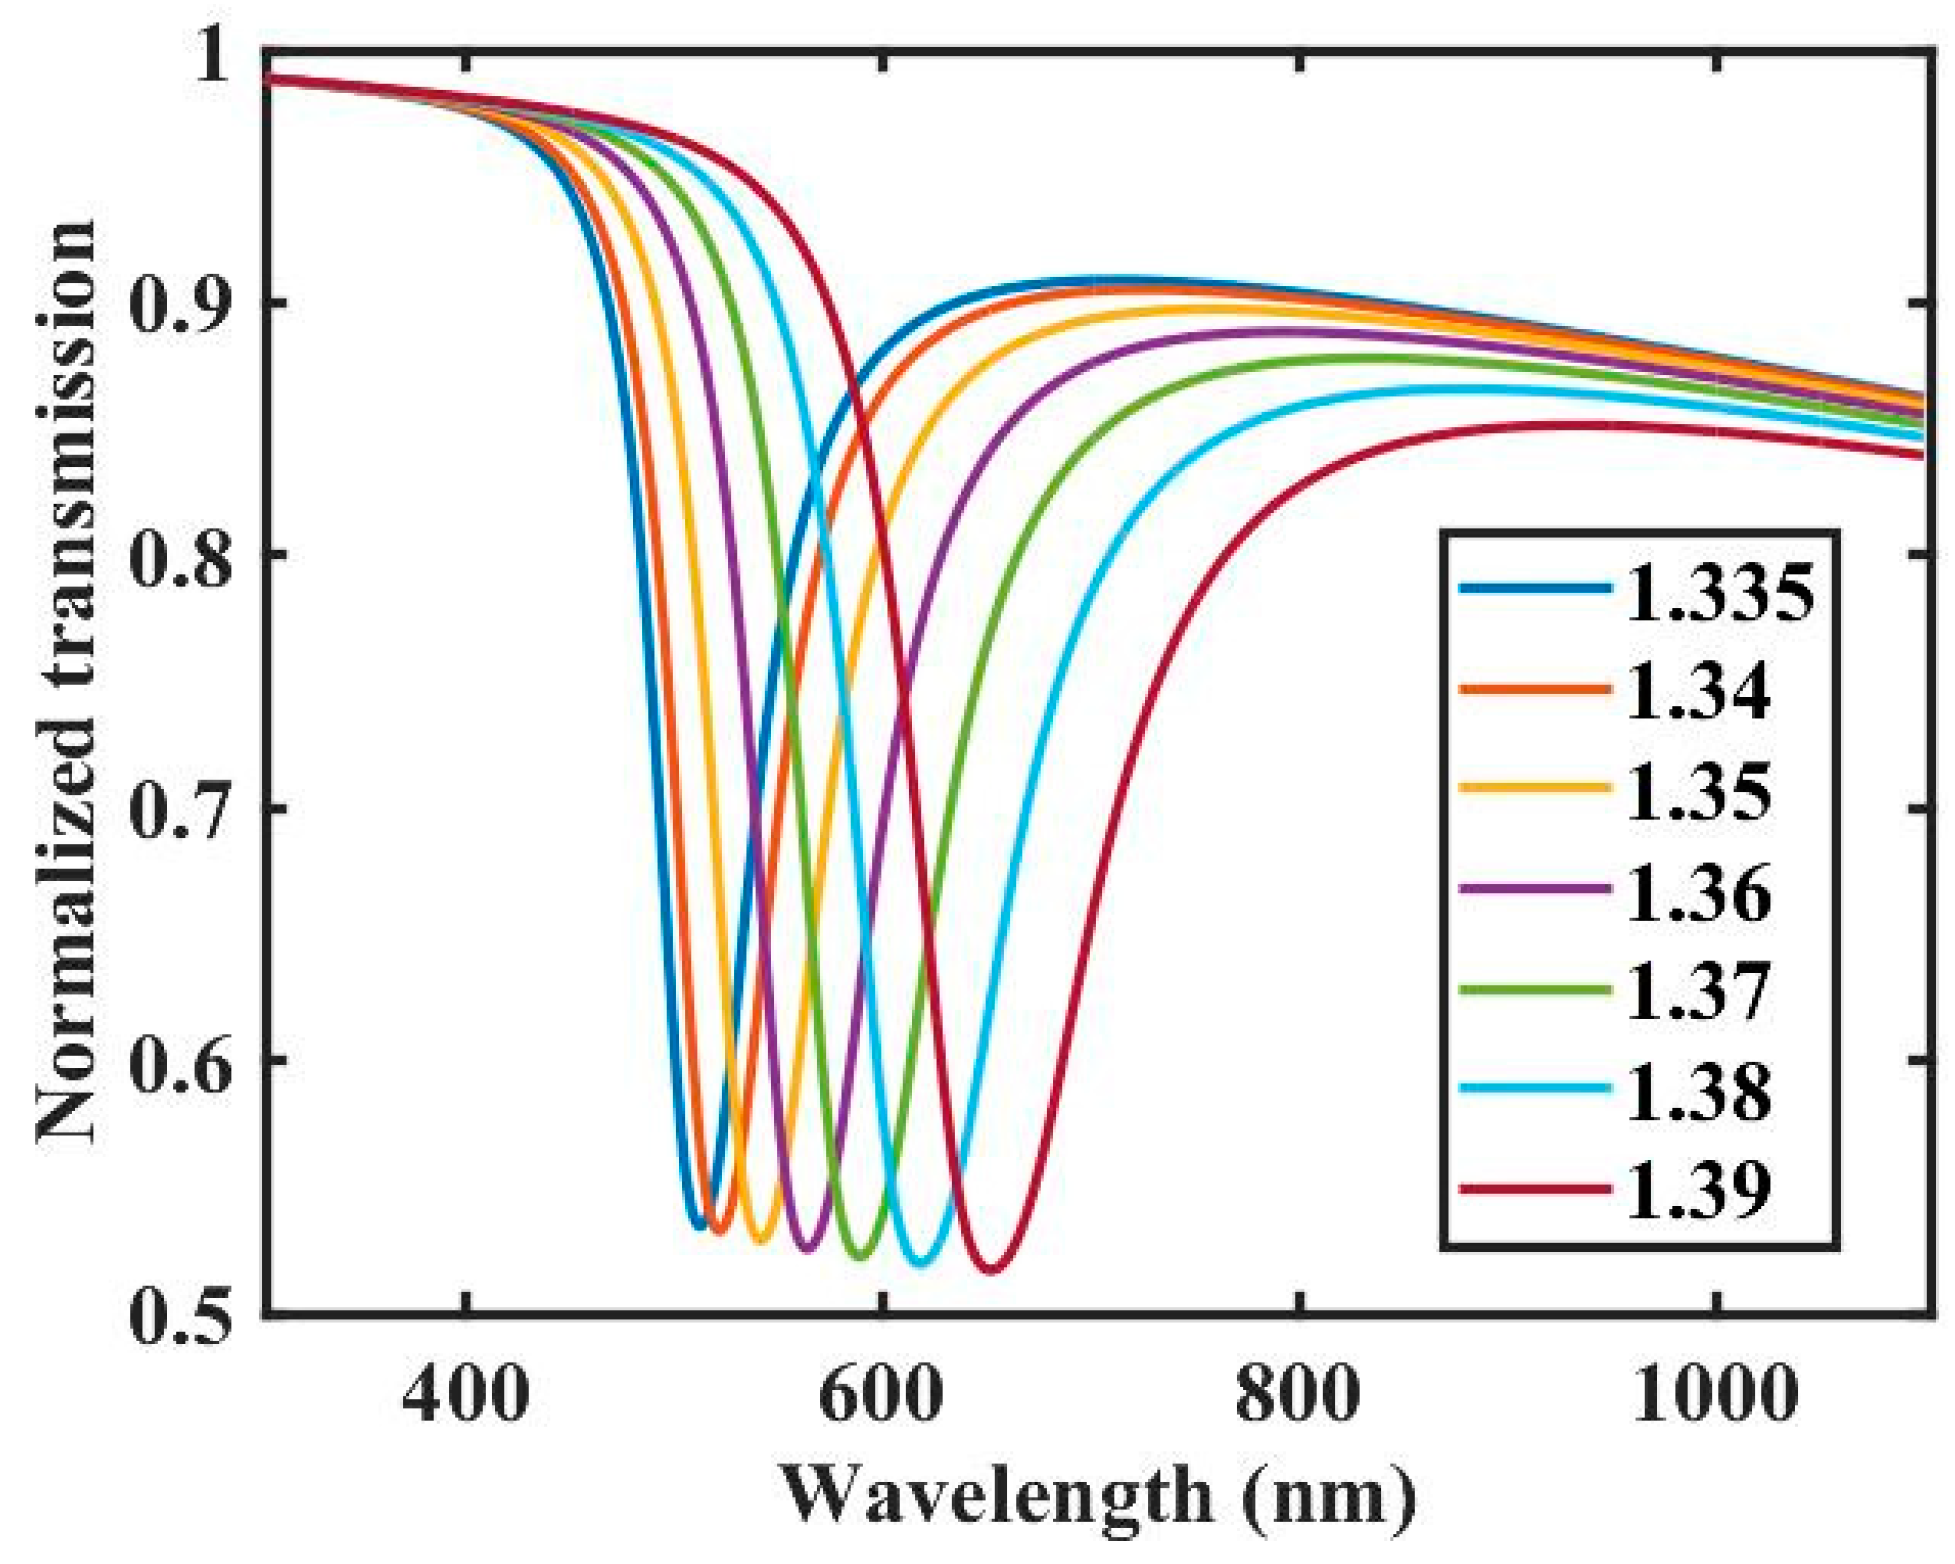
4. Experimental Results and Discussions
5. Conclusions
Author Contributions
Funding
Institutional Review Board Statement
Informed Consent Statement
Conflicts of Interest
References
- Sharma, A.K.; Jha, R.; Gupta, B.D. Fiber-Optic Sensors Based on Surface Plasmon Resonance: A Comprehensive Review. IEEE Sens. J. 2007, 7, 71118–71129. [Google Scholar] [CrossRef]
- Xiong, H.; Yang, Q.; Huang, Z.C.; Peng, W.X.; Zhang, H.Q. Analyzing broadband tunable metamaterial absorbers by using the symmetry model. Opt. Express. 2021, 29, 41475–41484. [Google Scholar] [CrossRef]
- Otto, A. Excitation of nonradiative surface plasma waves in silver by the method of frustrated total reflflection. Z. Physik. 1968, 216, 398–410. [Google Scholar] [CrossRef]
- Kretschmann, E.; Raether, H.N. Radiative decay of non-radiative surface Plasmon excited by light. Z. Für Nat. A 1968, 23, 2135–2136. [Google Scholar] [CrossRef]
- Caucheteur, C.; Guo, T.; Albert, J. Review of plasmonic fiber optic biochemical sensors: Improving the limit of detection. Anal. Bioanal. Chem. 2015, 407, 3883–3897. [Google Scholar] [CrossRef]
- Sharma, K.; Pandey, A.K.; Kaur, B. A Review of advancements (2007–2017) in plasmonics-based optical fiber sensors. Opt. Fiber. Technol. 2018, 43, 20–34. [Google Scholar] [CrossRef]
- Jorgenson, R.C.; Yee, S.S. A fiber-optic chemical sensor based on surface plasmon resonance. Sens. Actuators B Chem. 1993, 12, 213–220. [Google Scholar] [CrossRef]
- Maria, L.D.; Martinelli, M.; Vegetti, G. Fiber-optic sensor based on surface plasmon interrogation. Sens. Actuators B 1993, 12, 221–223. [Google Scholar] [CrossRef]
- Lin, Y.C.; Tsai, W.H.; Tsao, Y.C.; Tai, J.K. An Enhanced Optical Multimode Fiber Sensor Based on Surface Plasmon Resonance with Cascaded Structure. IEEE Photon. Technol. Lett. 2008, 20, 1287–1289. [Google Scholar] [CrossRef]
- Chaudhary, V.S.; Kumar, D.; Kumara, S. Gold-immobilized Photonic Crystal Fiber-based SPR Biosensor for Detection of Malaria Disease in Human Body. IEEE Sens. J. 2021, 99, 1. [Google Scholar] [CrossRef]
- Xiao, S.Y.; Jia, D.G.; Nie, A.R.; Yu, H.; Ji, Z.; Zhang, H.X.; Liu, T.G. Multi-channel few-mode multicore fiber based surface plasmon resonance biosensor with open air-hole. Acta Phys. Sin. 2020, 69, 137802. [Google Scholar] [CrossRef]
- Nasirifar, R.; Danaie, M.; Dideban, A. Hollow-core graded index optical fiber refractive index sensor based on surface plasmon resonance. Opt. Quant. Electron. 2020, 52, 341. [Google Scholar] [CrossRef]
- Chinowsky, T.M.; Yee, S.S. Surface plasmon resonance sensing in capillaries. Electron. Lett. 1999, 35, 1659–1661. [Google Scholar] [CrossRef]
- Teng, C.X.; Min, R.; Zheng, J.; Deng, S.J.; Li, M.S.; Hou, L.; Yuan, L.B. Intensity-Modulated Polymer Optical Fiber-Based Refractive Index Sensor: A Review. Sensors 2021, 22, 81. [Google Scholar] [CrossRef] [PubMed]
- Gasior, K.; Martynkien, T.; Wojcik, G.; Mergo, P.; Urbanczyk, W. D-shape polymer optical fibres for surface plasmon resonance sens-ing. Opto-Electron. Rev. 2017, 25, 1–5. [Google Scholar] [CrossRef]
- Liu, L.; Deng, S.J.; Zheng, J.; Yuan, L.B.; Deng, H.C.; Teng, C.X. An Enhanced Plastic Optical Fiber-Based Surface Plasmon Resonance Sensor with a Double-Sided Polished Structure. Sensors 2021, 21, 1516. [Google Scholar] [CrossRef]
- Cennamo, N.; Agostino, G.D.; Pesavento, M.; Zeni, L. High selectivity and sensitivity sensor based on MIP and SPR in tapered plasticoptical fibers for the detection of l-nicotine. Sens. Actuators B Chem. 2014, 191, 529–536. [Google Scholar] [CrossRef]
- Christopher, C.; Subrahmanyam, A.; Sai, V.V.R. Gold sputtered U-bent plastic optical fiber probes as SPR- and LSPR-based compact plasmonic sensors. Plasmonics 2018, 13, 493–502. [Google Scholar] [CrossRef]
- Al-Qazwini, Y.; Noor, A.S.M.; Al-Qazwini, Z.; Yaacob, M.H.; Harun, S.W.; Mahdi, M.A. Refractive index sensor based on SPR in symmetrically etched plastic optical fibers. Sens. Actuators A Phys. 2016, 246, 163–169. [Google Scholar] [CrossRef]
- Cennamo, N.; Pesavento, M.; Zeni, L. A Review on simple and highly sensitive Plastic Optical Fiber Probes for Bio-Chemical Sensing. Sens. Actuators B Chem. 2020, 331, 129393. [Google Scholar] [CrossRef]
- Chou Chao, C.T.; Chou Chau, Y.F.; Chiang, H.P. Enhancing plasmonic effect in periodic nanometal square prisms with fences and cavities for refractive index and temperature sensing applications. J. Nanopart. Res. 2020, 22, 29. [Google Scholar] [CrossRef]
- Zhao, Y.; Wu, Q.L.; Zhang, Y.N. Simultaneous measurement of salinity, temperature and pressure in seawater using optical fiber SPR sensor. Measurement 2019, 248, 10672. [Google Scholar] [CrossRef]
- Li, B.; Zhang, F.; Yan, X.; Zhang, X.; Wang, F.; Cheng, T. An Optical Fiber-Based Surface Plasmon Resonance Sensor for Simultaneous Measurement of Temperature and Magnetic Field Intensity. IEEE Trans. Instrum. Meas. 2022, 71, 1–7. [Google Scholar] [CrossRef]
- Zhang, Y.N.; Si, Y.E.; Bi, R.T.; Wu, Q.L.; Han, B.T. Reflective SPR Sensor for Simultaneous Measurement of Nitrate Concentration and Temperature. IEEE Trans. Instrum. Meas. 2019, 68, 4566–4574. [Google Scholar] [CrossRef]
- Luan, N.N.; Yao, J. Refractive index and temperature sensing based on surface plasmon resonance and directional resonance coupling in a PCF. IEEE Photon. J. 2017, 9, 2. [Google Scholar] [CrossRef]
- Zhang, Q.; Liu, H.L.; Li, B.; Zhang, F.; Yan, X.; Zhang, X.N.; Wang, F.; Cheng, T.L. A Dual-Channel Surface Plasmon Resonance Sensor for the Liquid Refractive Index and Temperature Measurement Based on Hollow-Core Fiber. IEEE Sens. J. 2022, 22, 7785–7791. [Google Scholar] [CrossRef]
- Velázquez-González, J.S.; Moreno-Hernández, D.; Martínez-Piñón, F.; Hernández-Romano, I. Simultaneous measurement of refractive index and temperature using a SPR-based fiber optic sensor. Sens. Actuators B 2017, 242, 912–920. [Google Scholar] [CrossRef]
- Liu, L.; Zheng, J.; Deng, S.; Yuan, L.; Teng, C. Parallel Polished Plastic Optical Fiber-Based SPR Sensor for Simultaneous Measurement of RI and Temperature. IEEE Trans. Instrum. Meas. 2021, 70, 1–8. [Google Scholar] [CrossRef]
- Monserrat, D.C.; Alonso, M.; Jesus, S.V.; David, M.H. Monserrat. SPR Fiber Tip Sensor for the Simultaneous Measurement of Refractive Index, Temperature, and Level of a Liquid. J. Lightwave Technol. 2019, 37, 4808–4814. [Google Scholar]
- Teng, C.; Wang, Y.W.; Min, R.; Deng, S.J.; Deng, H.C.; Li, Y.J.; Yuan, L.B. Plastic Optical Fiber Based SPR Sensor for Simultaneous Measurement of Refractive Index and Liquid Level. IEEE Sens. J. 2022, 22, 6677–6684. [Google Scholar] [CrossRef]
- Zhang, Y.X.; Wang, L.; Liu, Z.H. The polishing detection method of side-polished fiber. Proc. SPIE. 2011, 8202, 820211. [Google Scholar]
- Raether, H. Surface Plasmons on Smooth Surfaces; Springer: Berlin/Heidelberg, Germany, 1988; Volume 111, pp. 4–39. [Google Scholar]
- Sharma, A.K.; Gupta, B.D. On the performance of different bimetallic combinations in surface plasmon resonance based fiber optic sensors. J. Appl. Phys. 2007, 101, 093111. [Google Scholar] [CrossRef]
- Ishigure, T.; Nihei, E.; Koike, Y. Optimization of the refractive-index distribution of high-bandwidth GI polymer optical fiber based on both modal and material dispersions. Polym. J. 1996, 28, 272–275. [Google Scholar] [CrossRef]
- Chou Chau, Y.F.; Ming, T.Y.; Chou Chao, C.T.; Thotagamuge, R.; Kooh, M.R.R.; Huang, H.J.; Lim, C.M.; Chiang, H.P. Significantly enhanced coupling effect and gap plasmon resonance in a MIM-cavity based sensing structure. Sci. Rep. 2021, 11, 18515. [Google Scholar] [CrossRef] [PubMed]


Publisher’s Note: MDPI stays neutral with regard to jurisdictional claims in published maps and institutional affiliations. |
© 2022 by the authors. Licensee MDPI, Basel, Switzerland. This article is an open access article distributed under the terms and conditions of the Creative Commons Attribution (CC BY) license (https://creativecommons.org/licenses/by/4.0/).
Share and Cite
Teng, C.; Ying, S.; Min, R.; Deng, S.; Deng, H.; Chen, M.; Chu, X.; Yuan, L.; Cheng, Y.; Xue, M. Side-Polish Plastic Optical Fiber Based SPR Sensor for Refractive Index and Liquid-Level Sensing. Sensors 2022, 22, 6241. https://doi.org/10.3390/s22166241
Teng C, Ying S, Min R, Deng S, Deng H, Chen M, Chu X, Yuan L, Cheng Y, Xue M. Side-Polish Plastic Optical Fiber Based SPR Sensor for Refractive Index and Liquid-Level Sensing. Sensors. 2022; 22(16):6241. https://doi.org/10.3390/s22166241
Chicago/Turabian StyleTeng, Chuanxin, Shiyuan Ying, Rui Min, Shijie Deng, Hongchang Deng, Ming Chen, Xiaoxue Chu, Libo Yuan, Yu Cheng, and Minmin Xue. 2022. "Side-Polish Plastic Optical Fiber Based SPR Sensor for Refractive Index and Liquid-Level Sensing" Sensors 22, no. 16: 6241. https://doi.org/10.3390/s22166241