Open Software/Hardware Platform for Human-Computer Interface Based on Electrooculography (EOG) Signal Classification


Abstract
:1. Introduction
- Acquiring the Electrooculography (EOG) signals.
- Processing these signals.
- Extracting the signal features.
- Classifying the features previously extracted.
2. Materials and Methods
2.1. Hardware-Software Integration
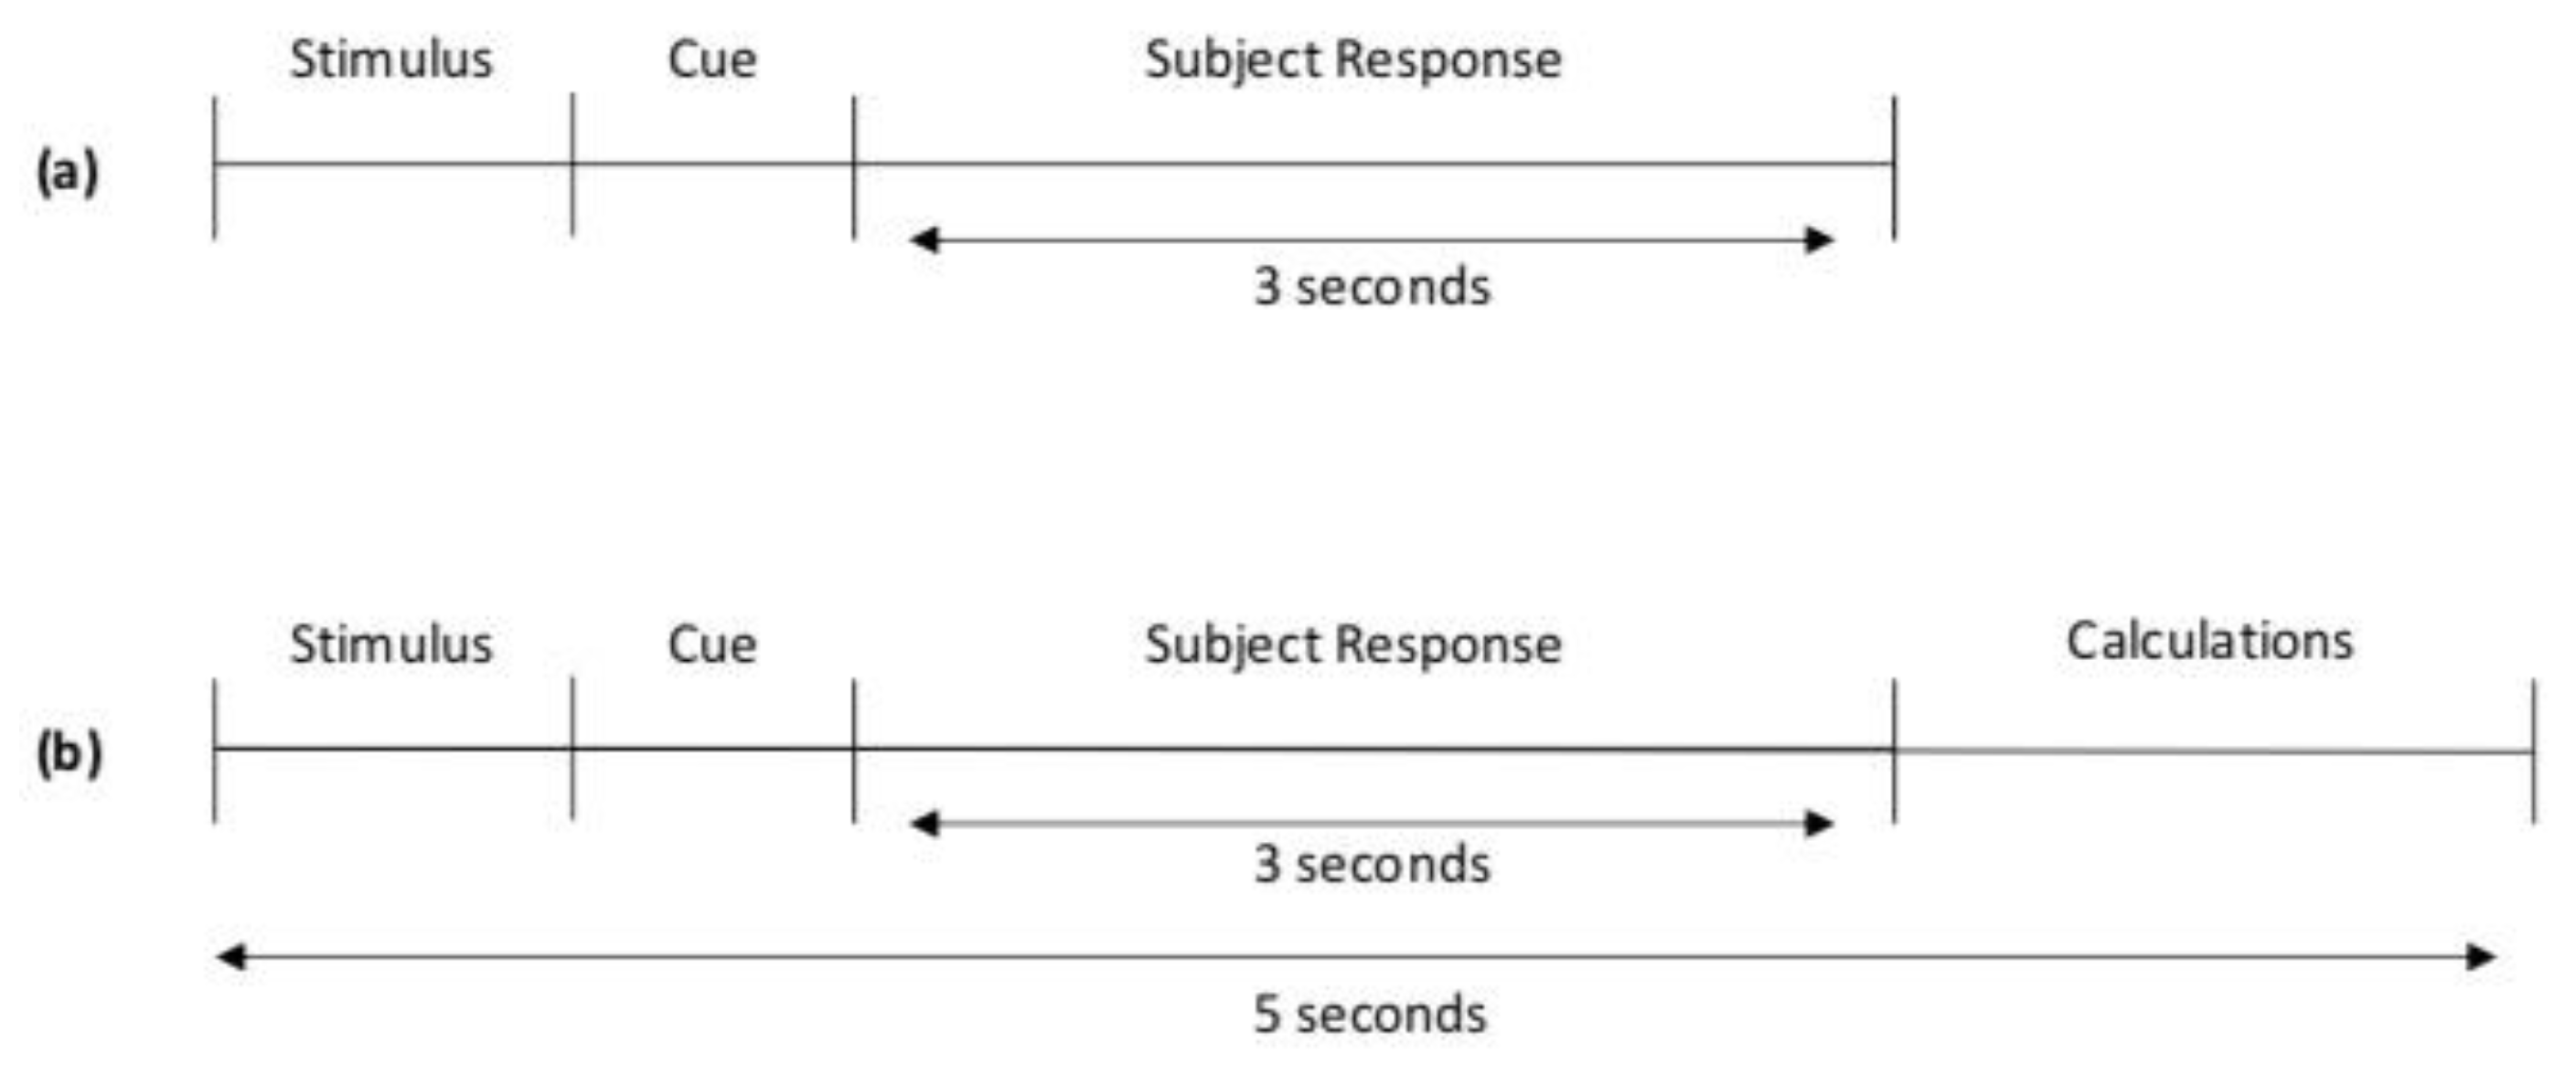
2.2. Experimental Paradigm
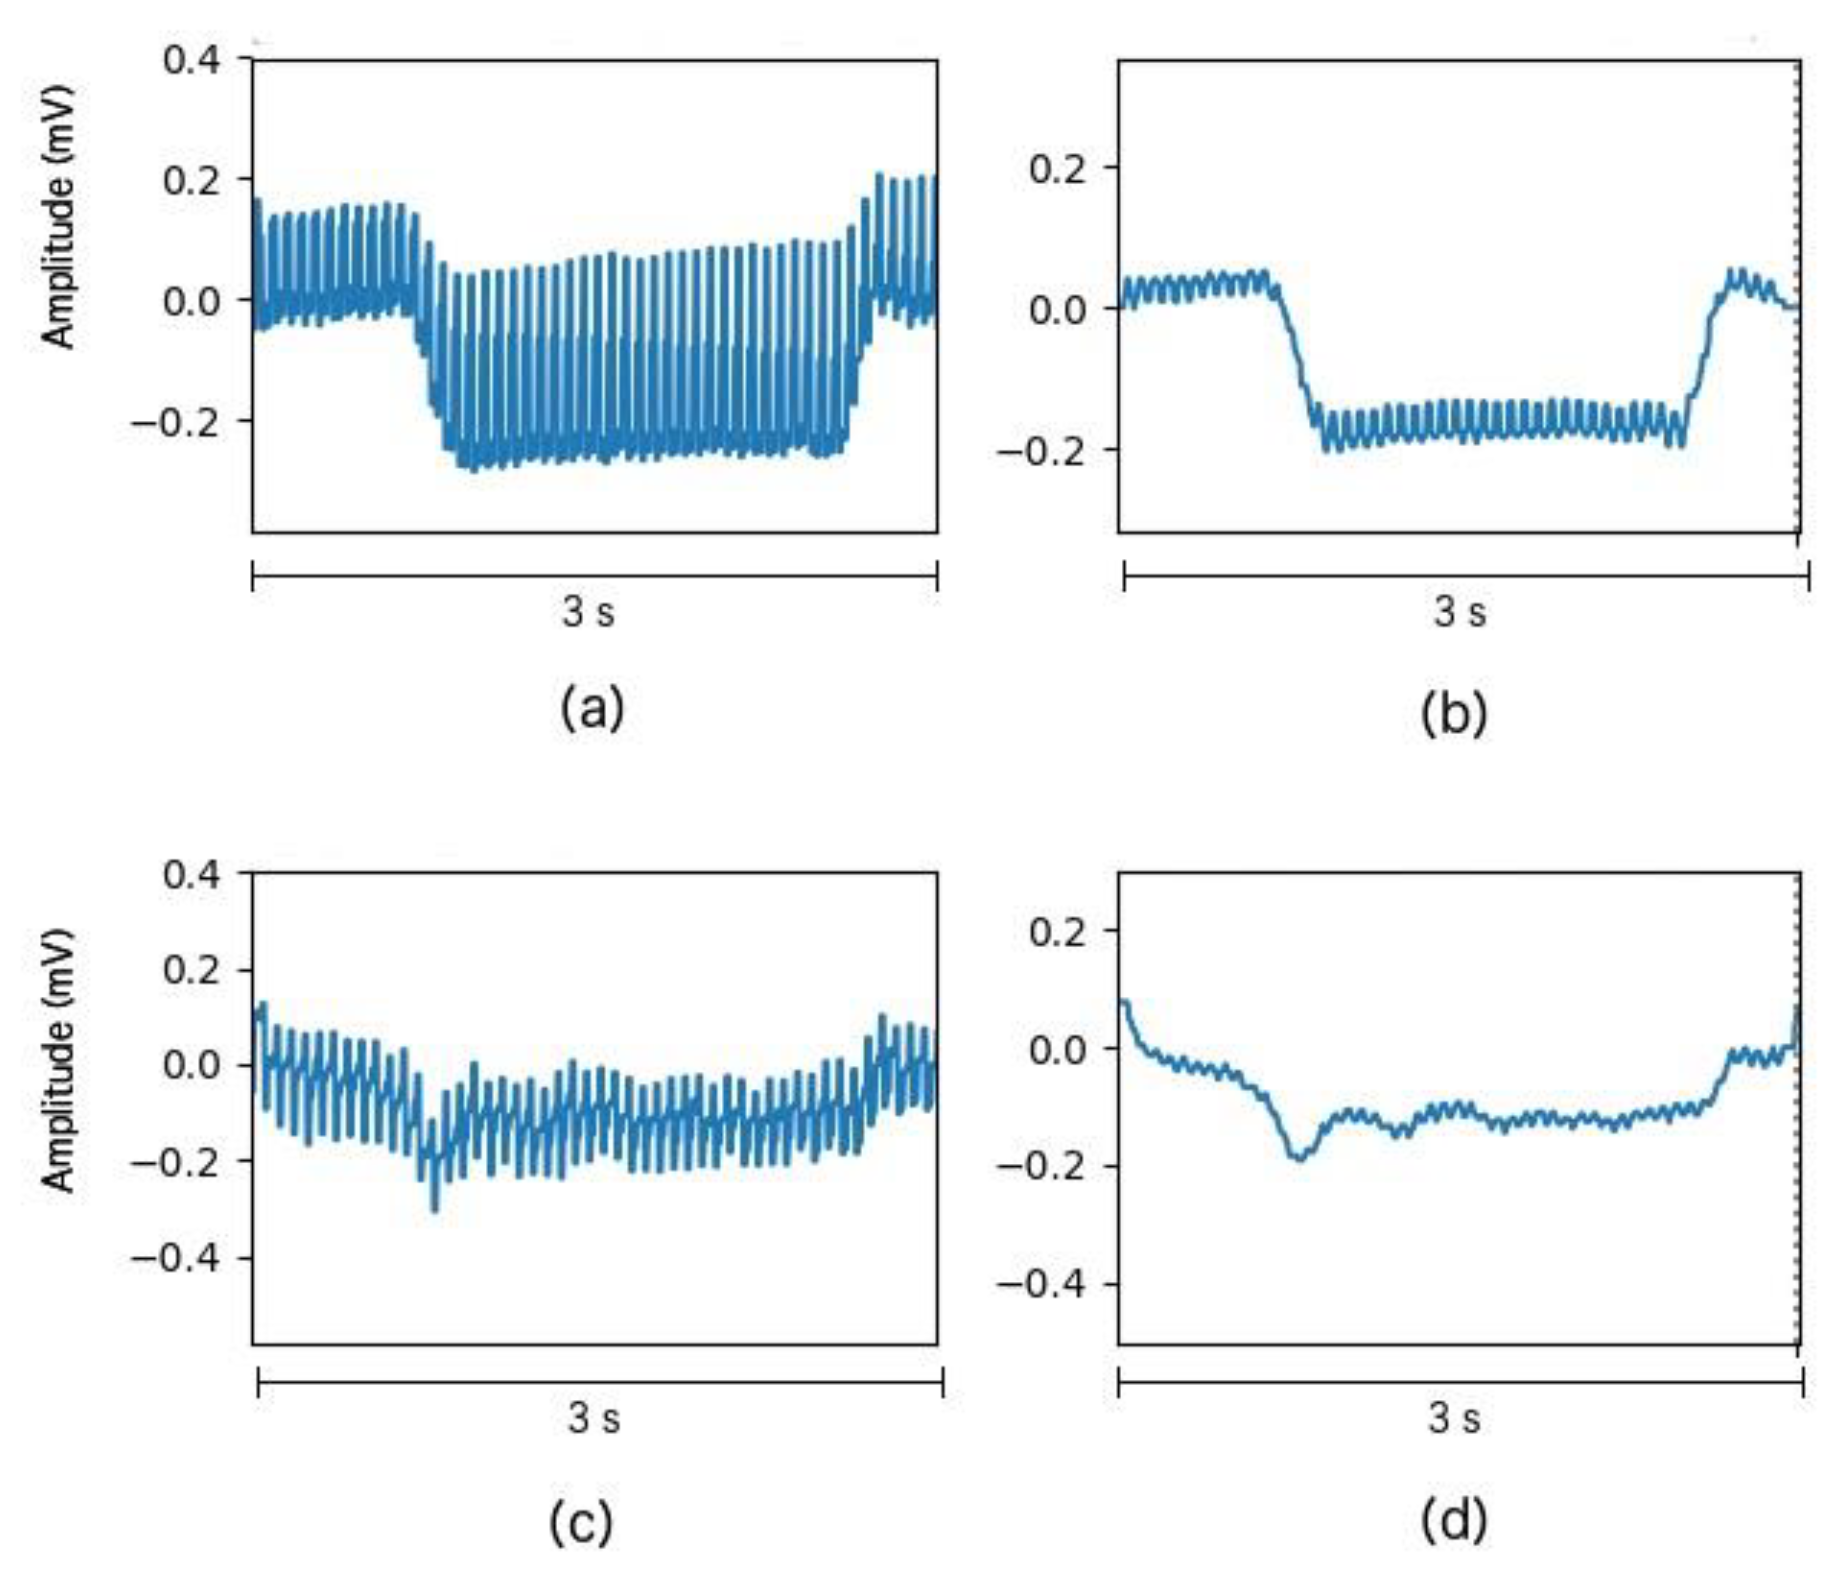
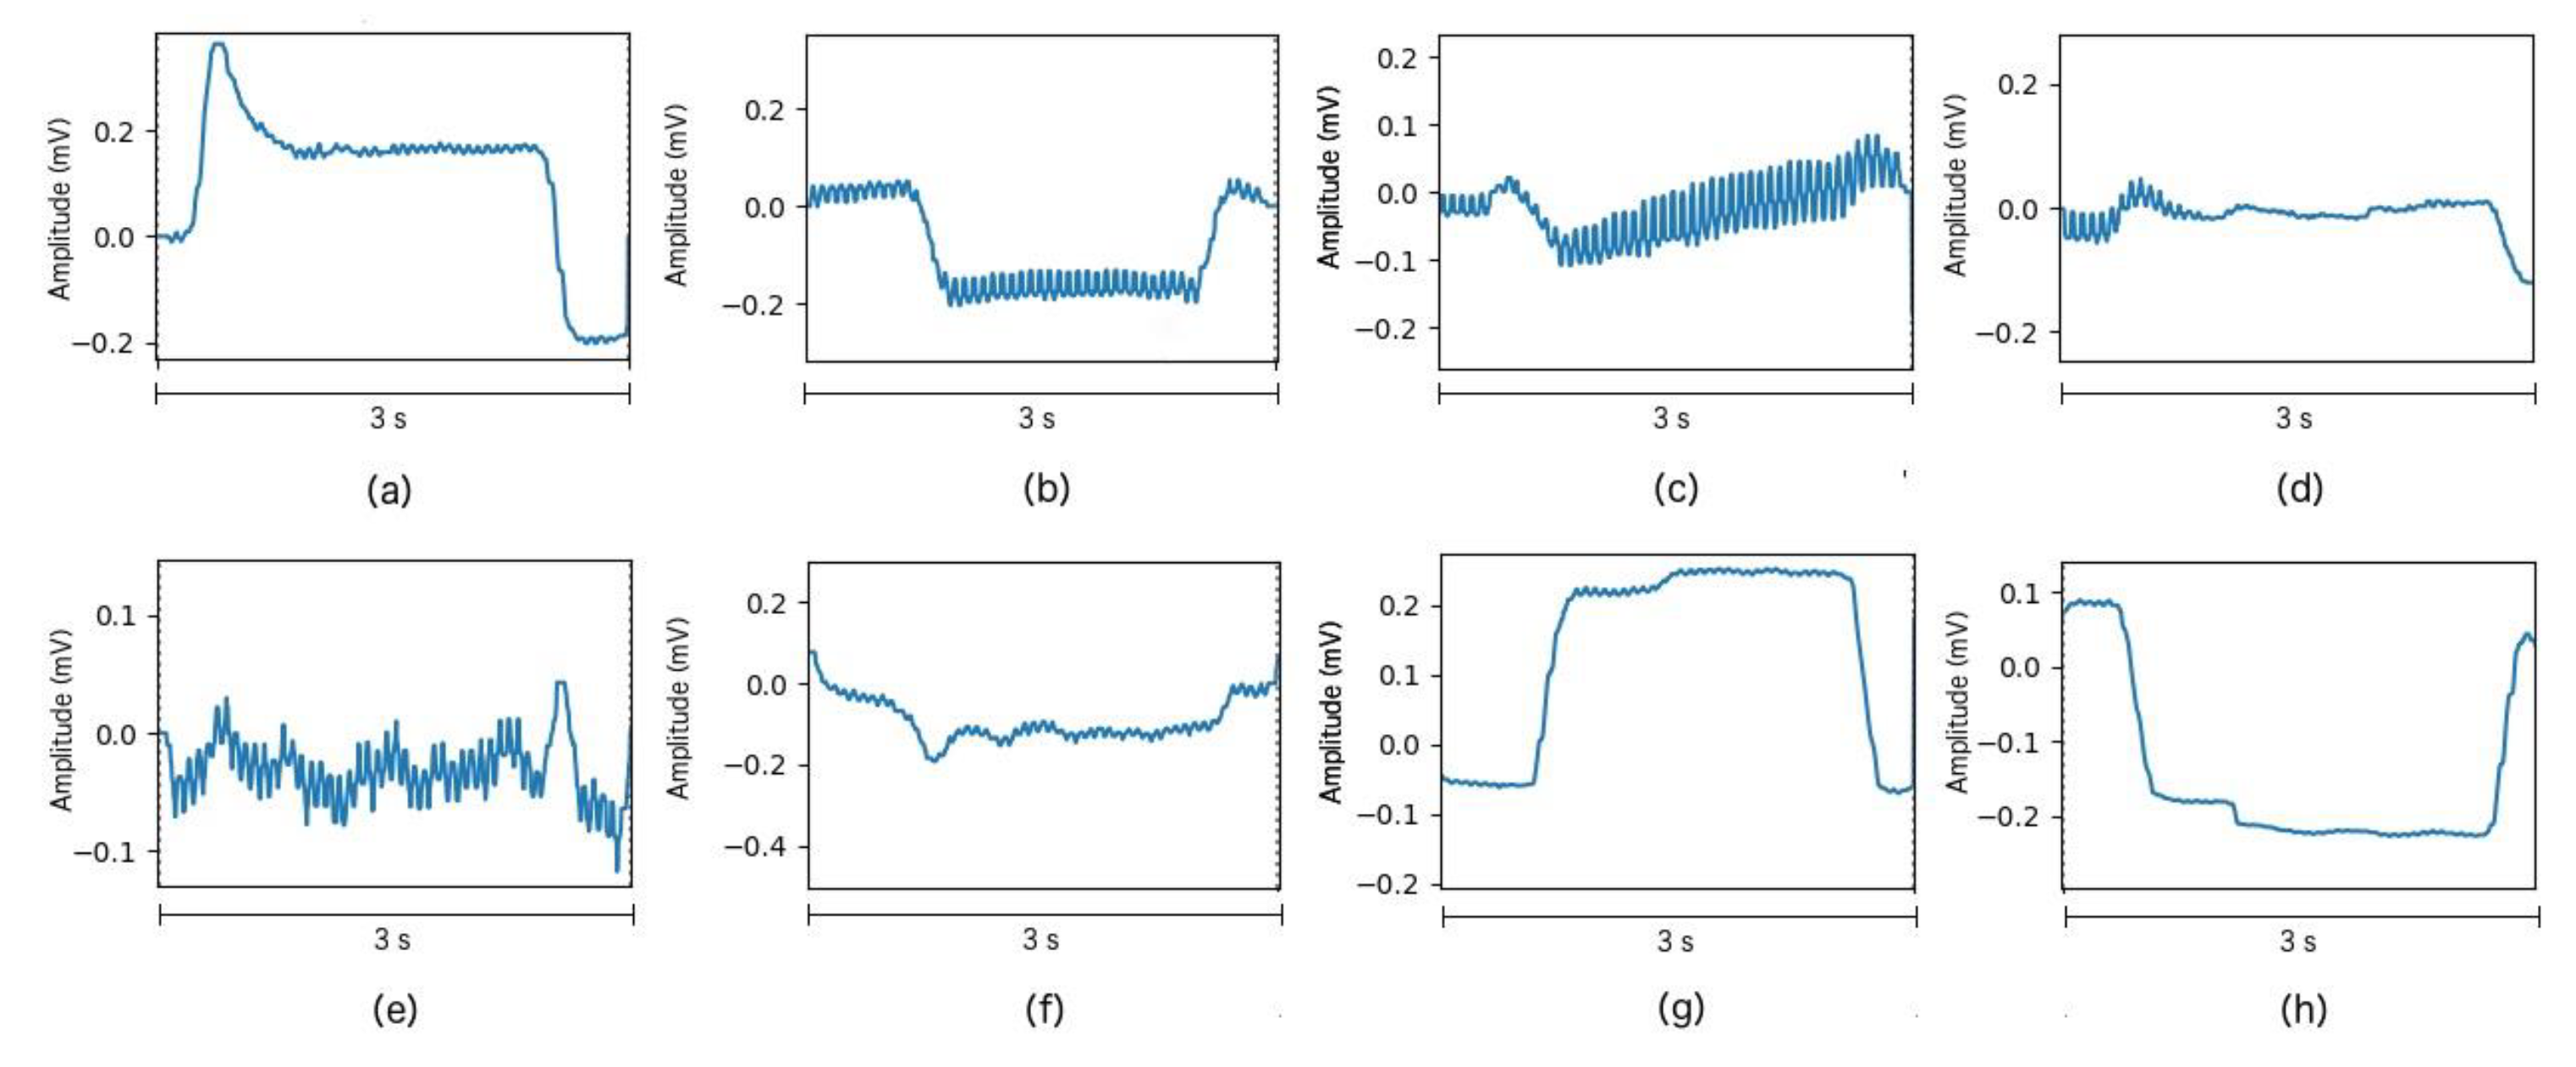
2.3. Signal Processing
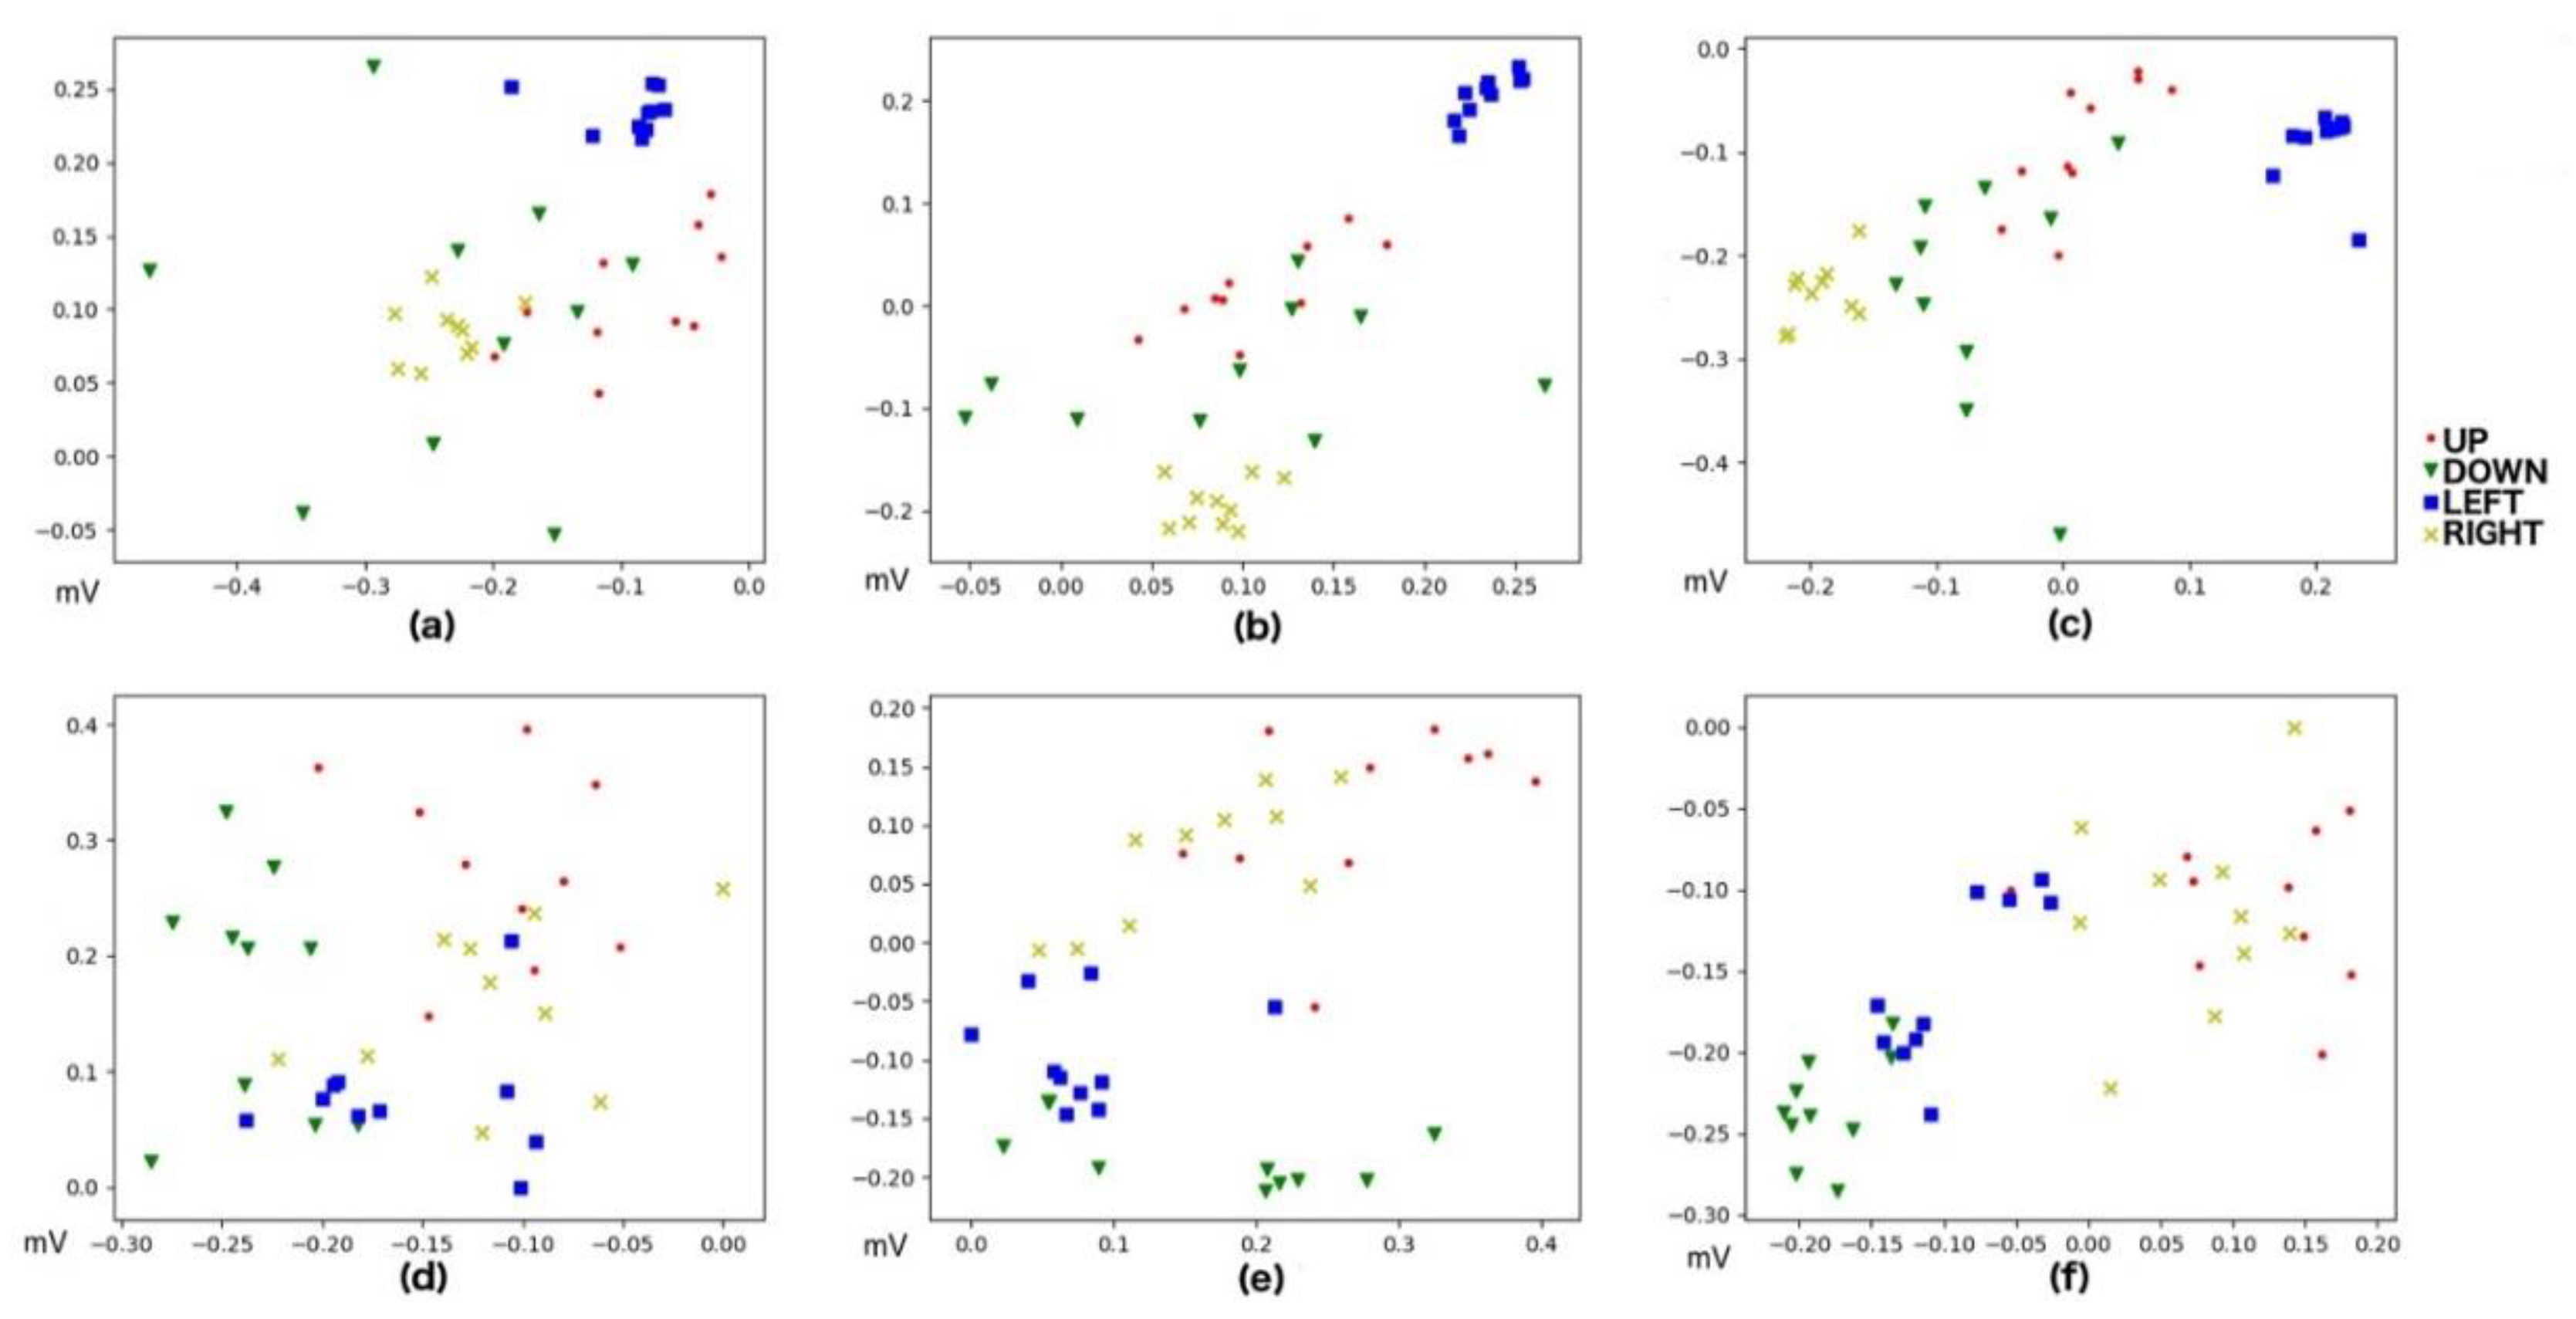
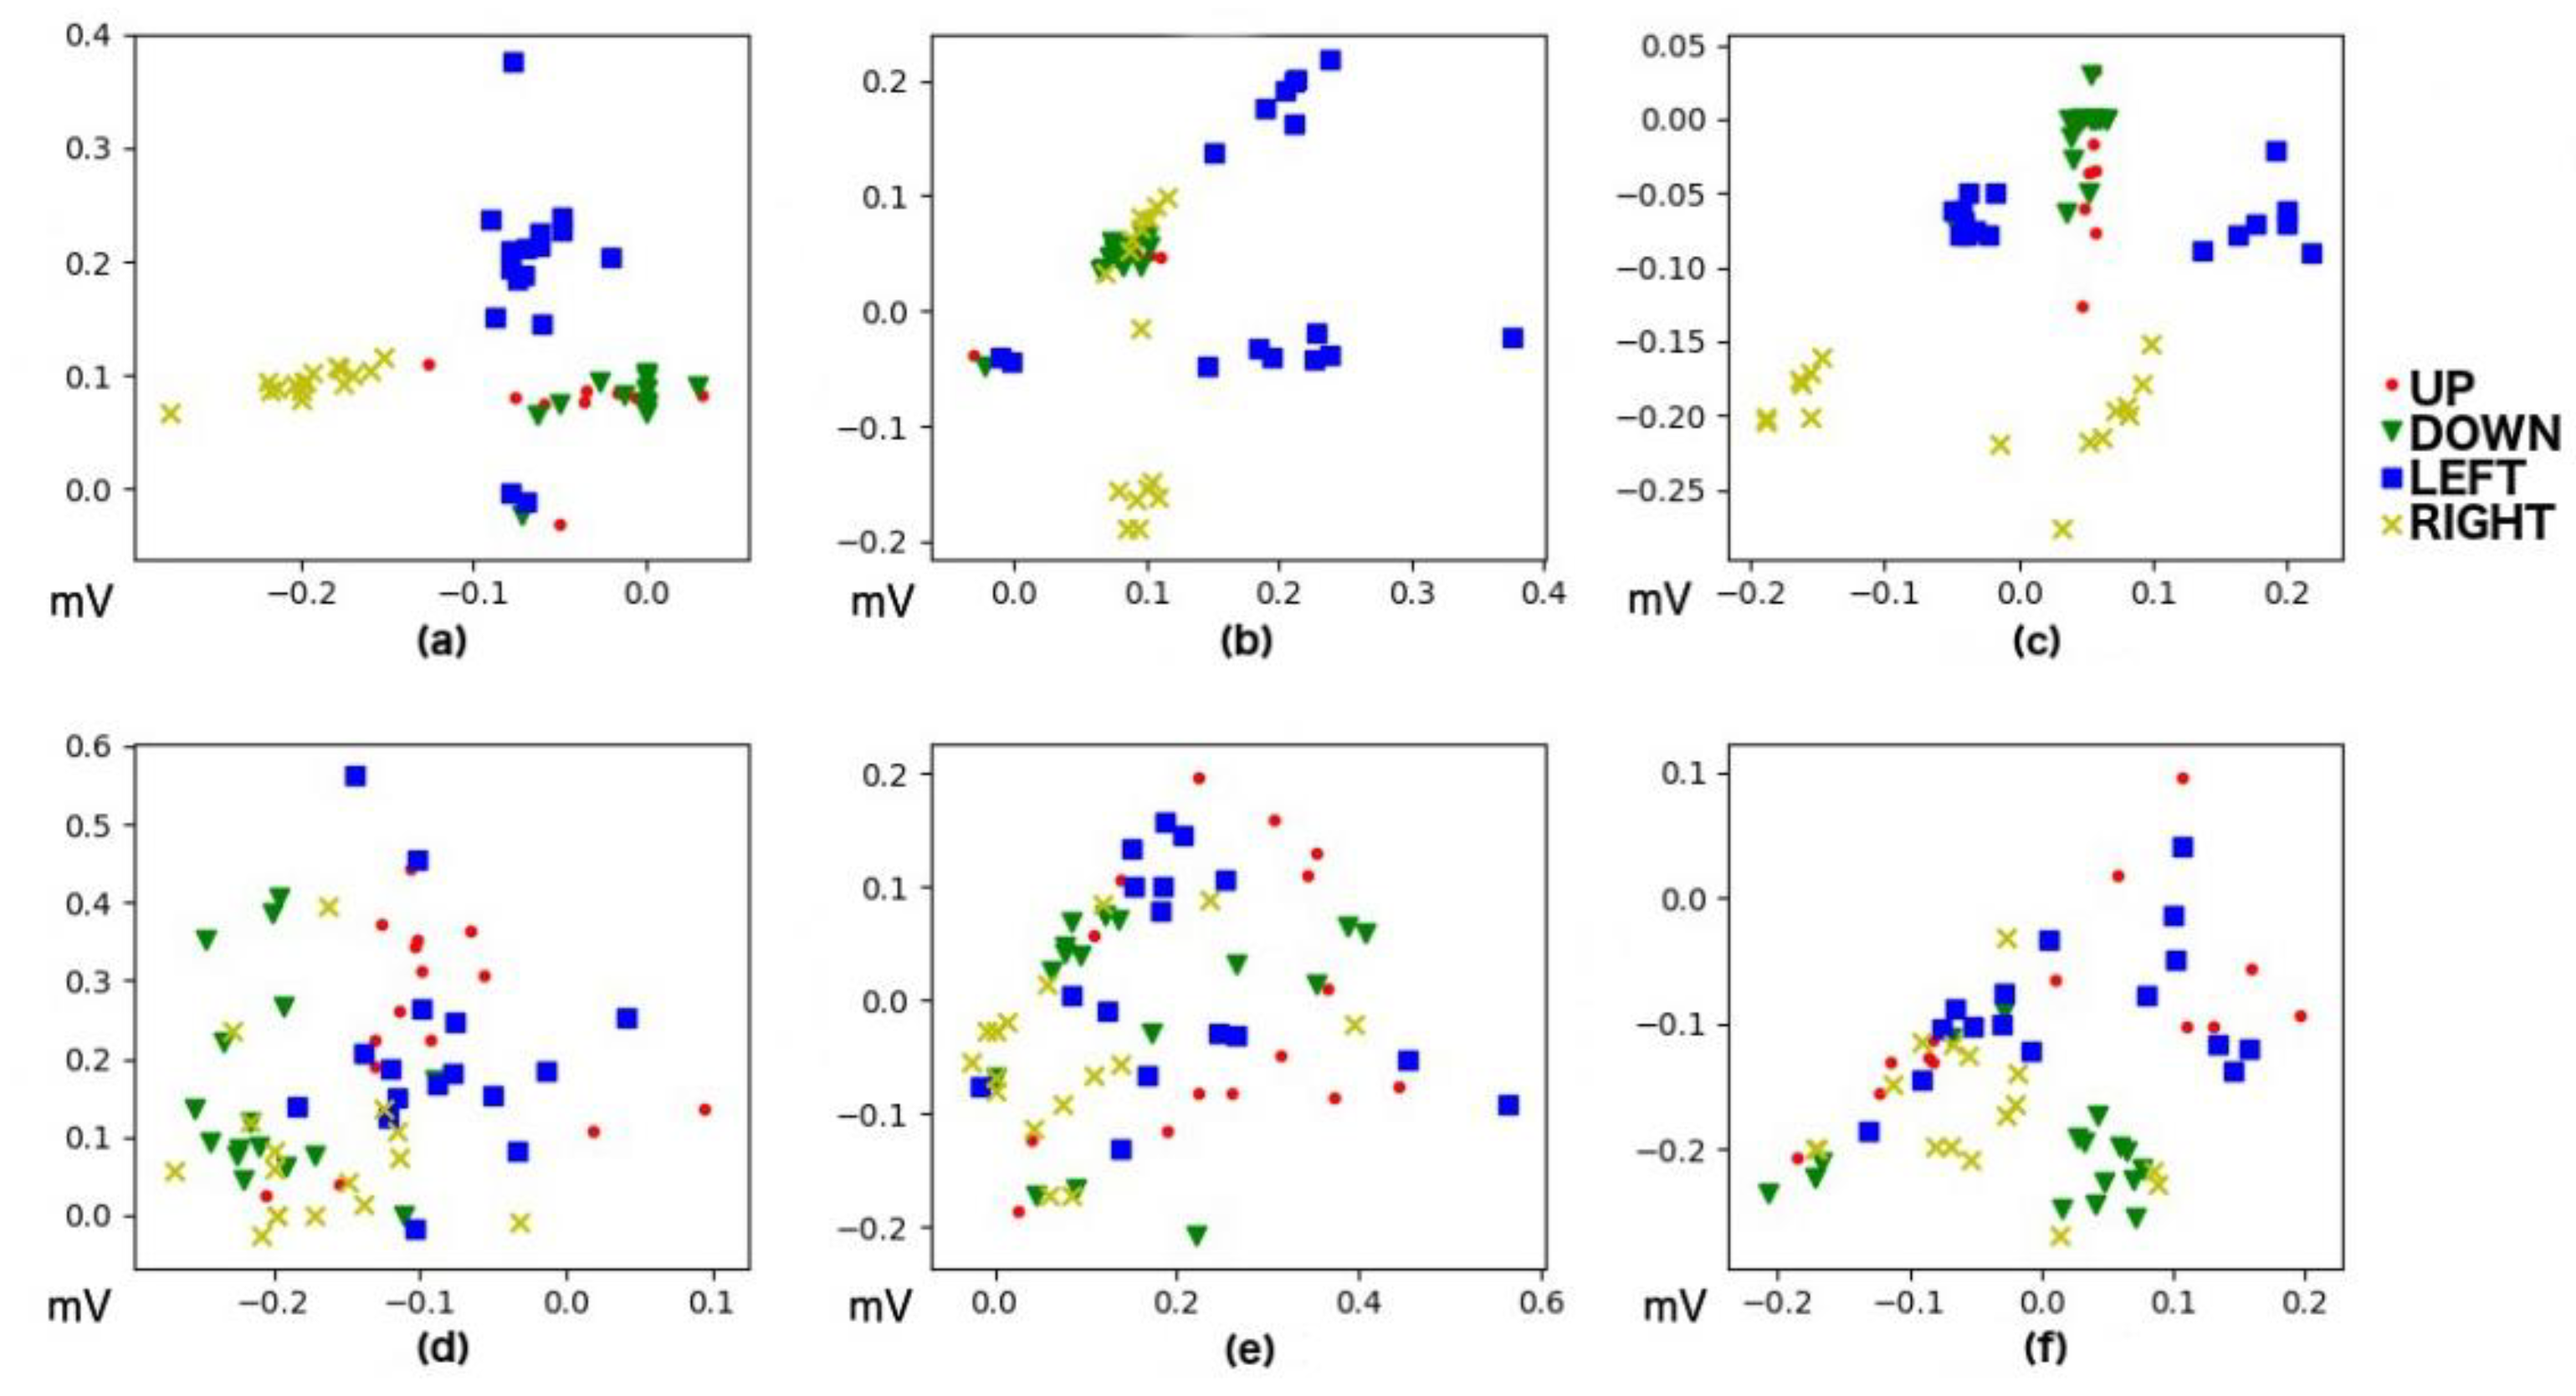
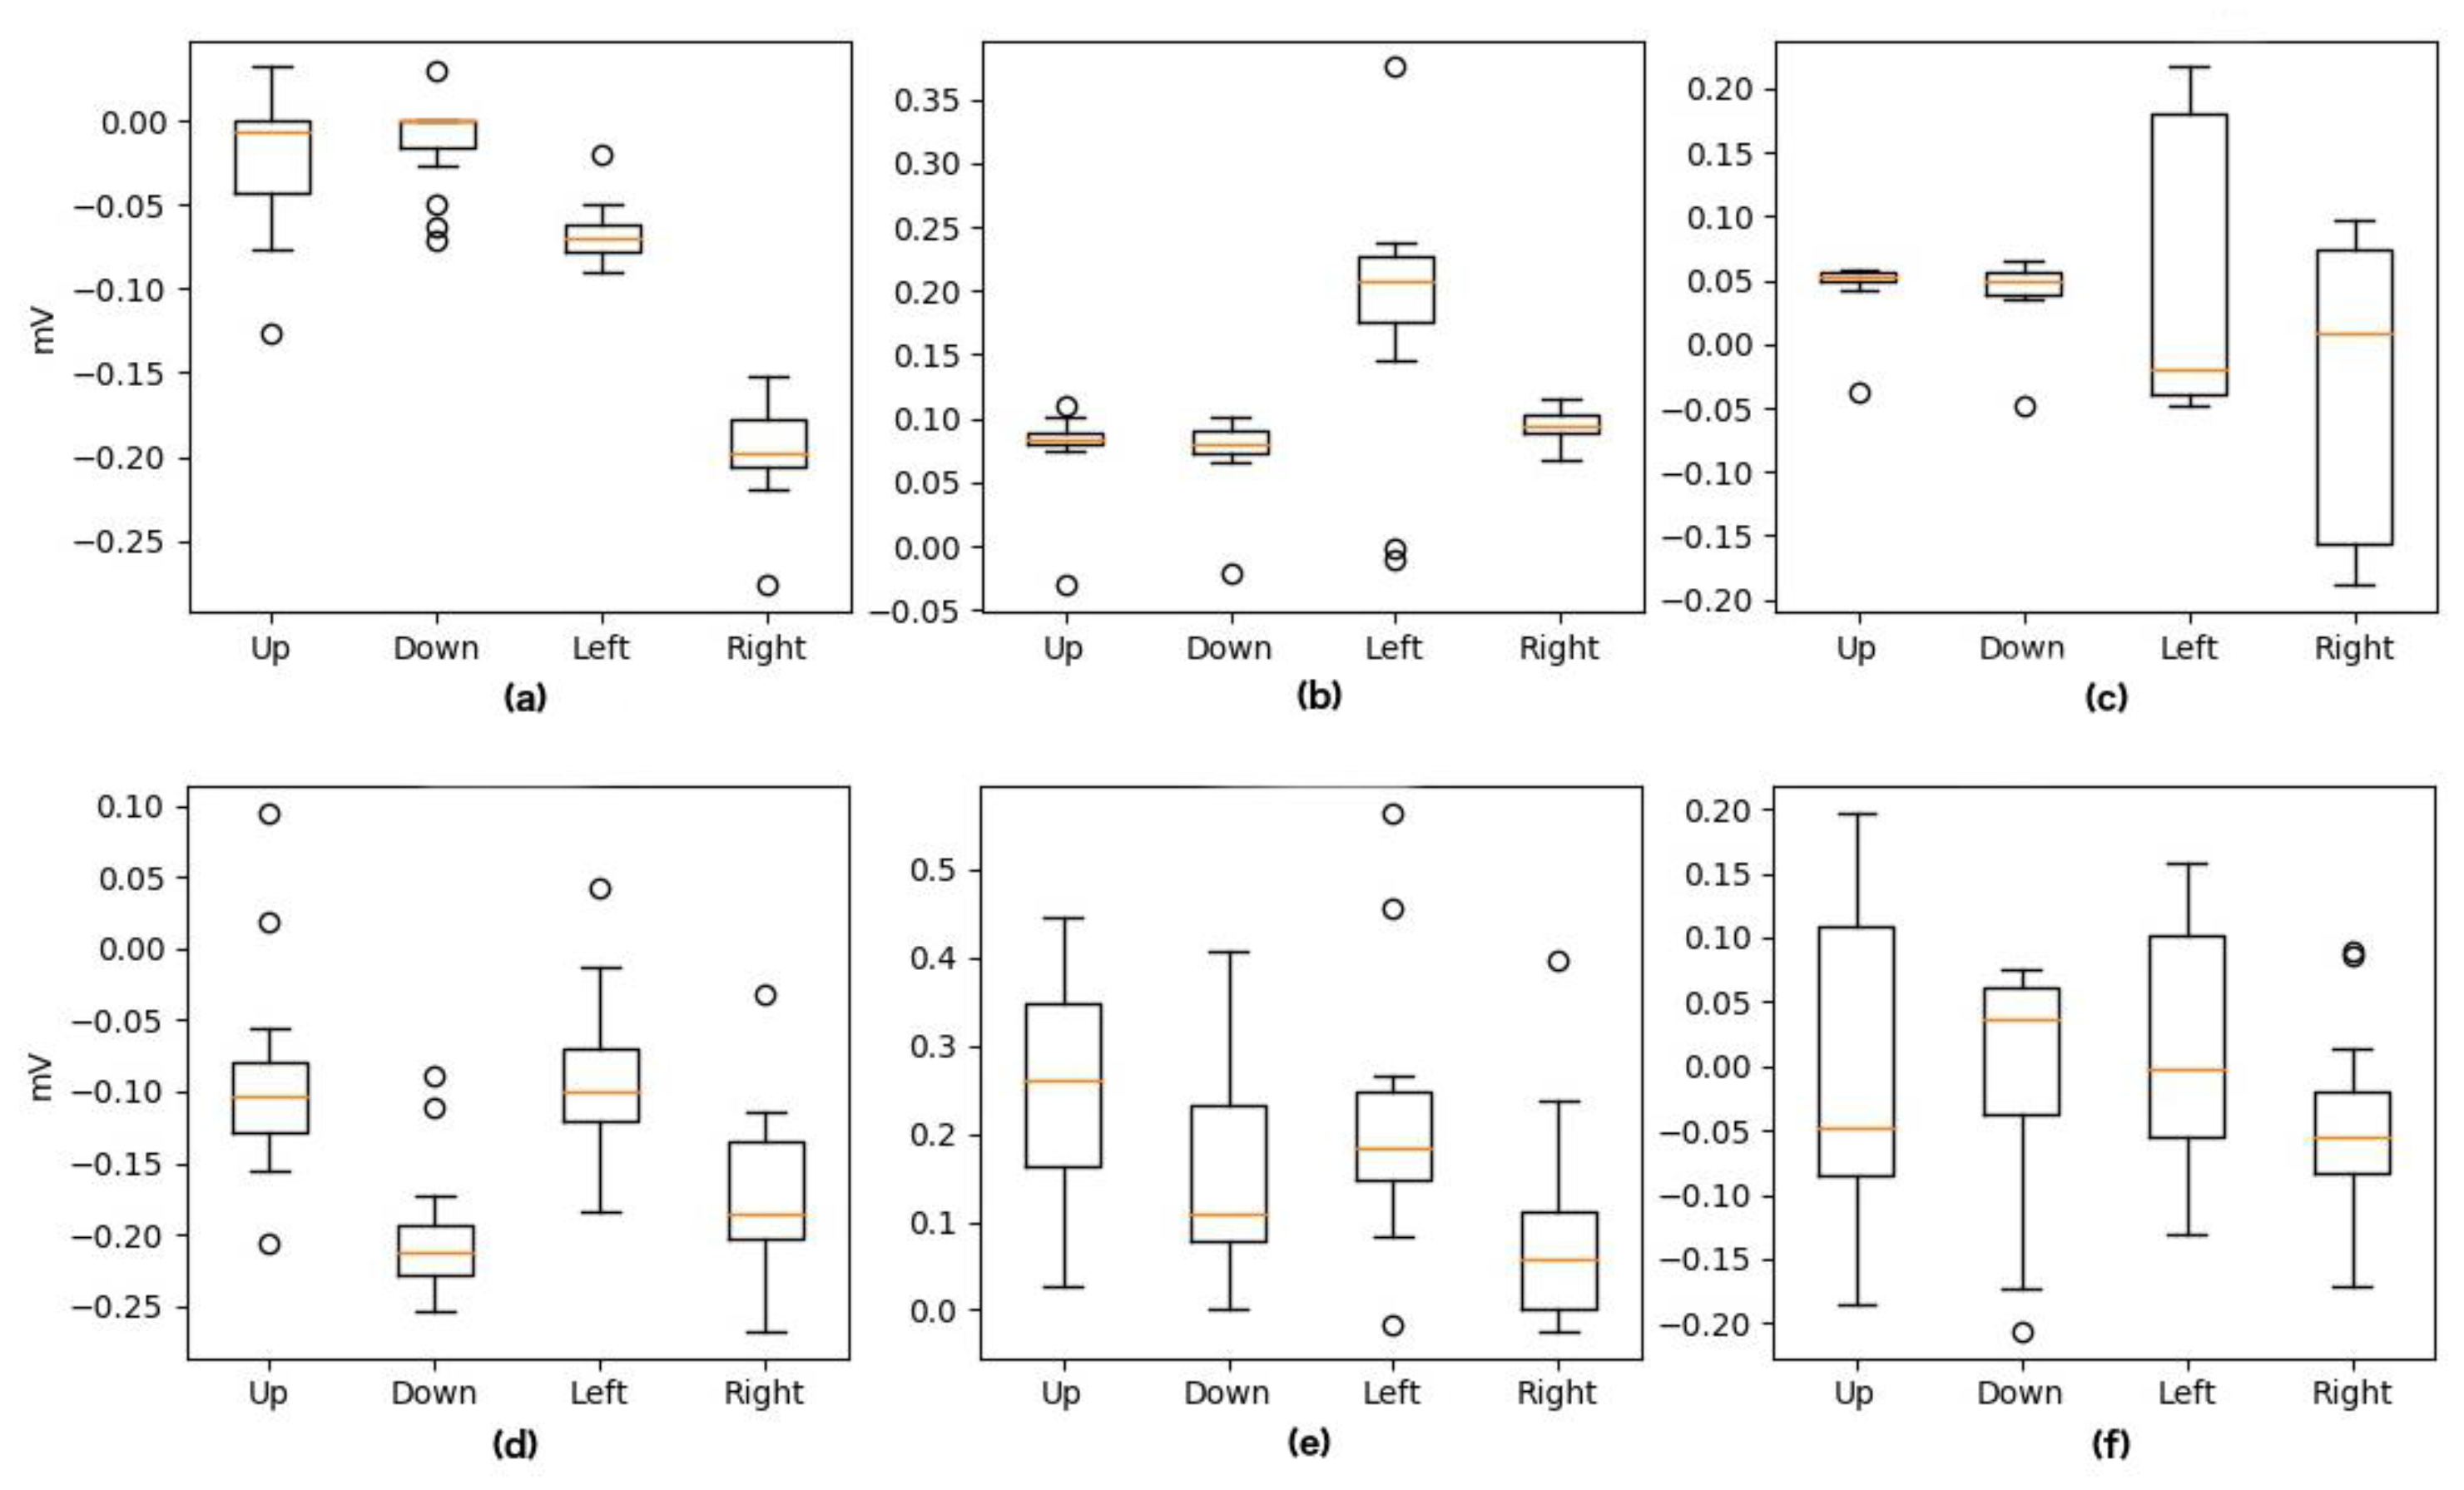
2.4. Feature Extraction
- Min: The minimum amplitude value during the eye movement.
- Max: The maximum amplitude value during the eye movement.
- Median: The amplitude value during the eye movement that has 50% values above as below.
2.5. Classification
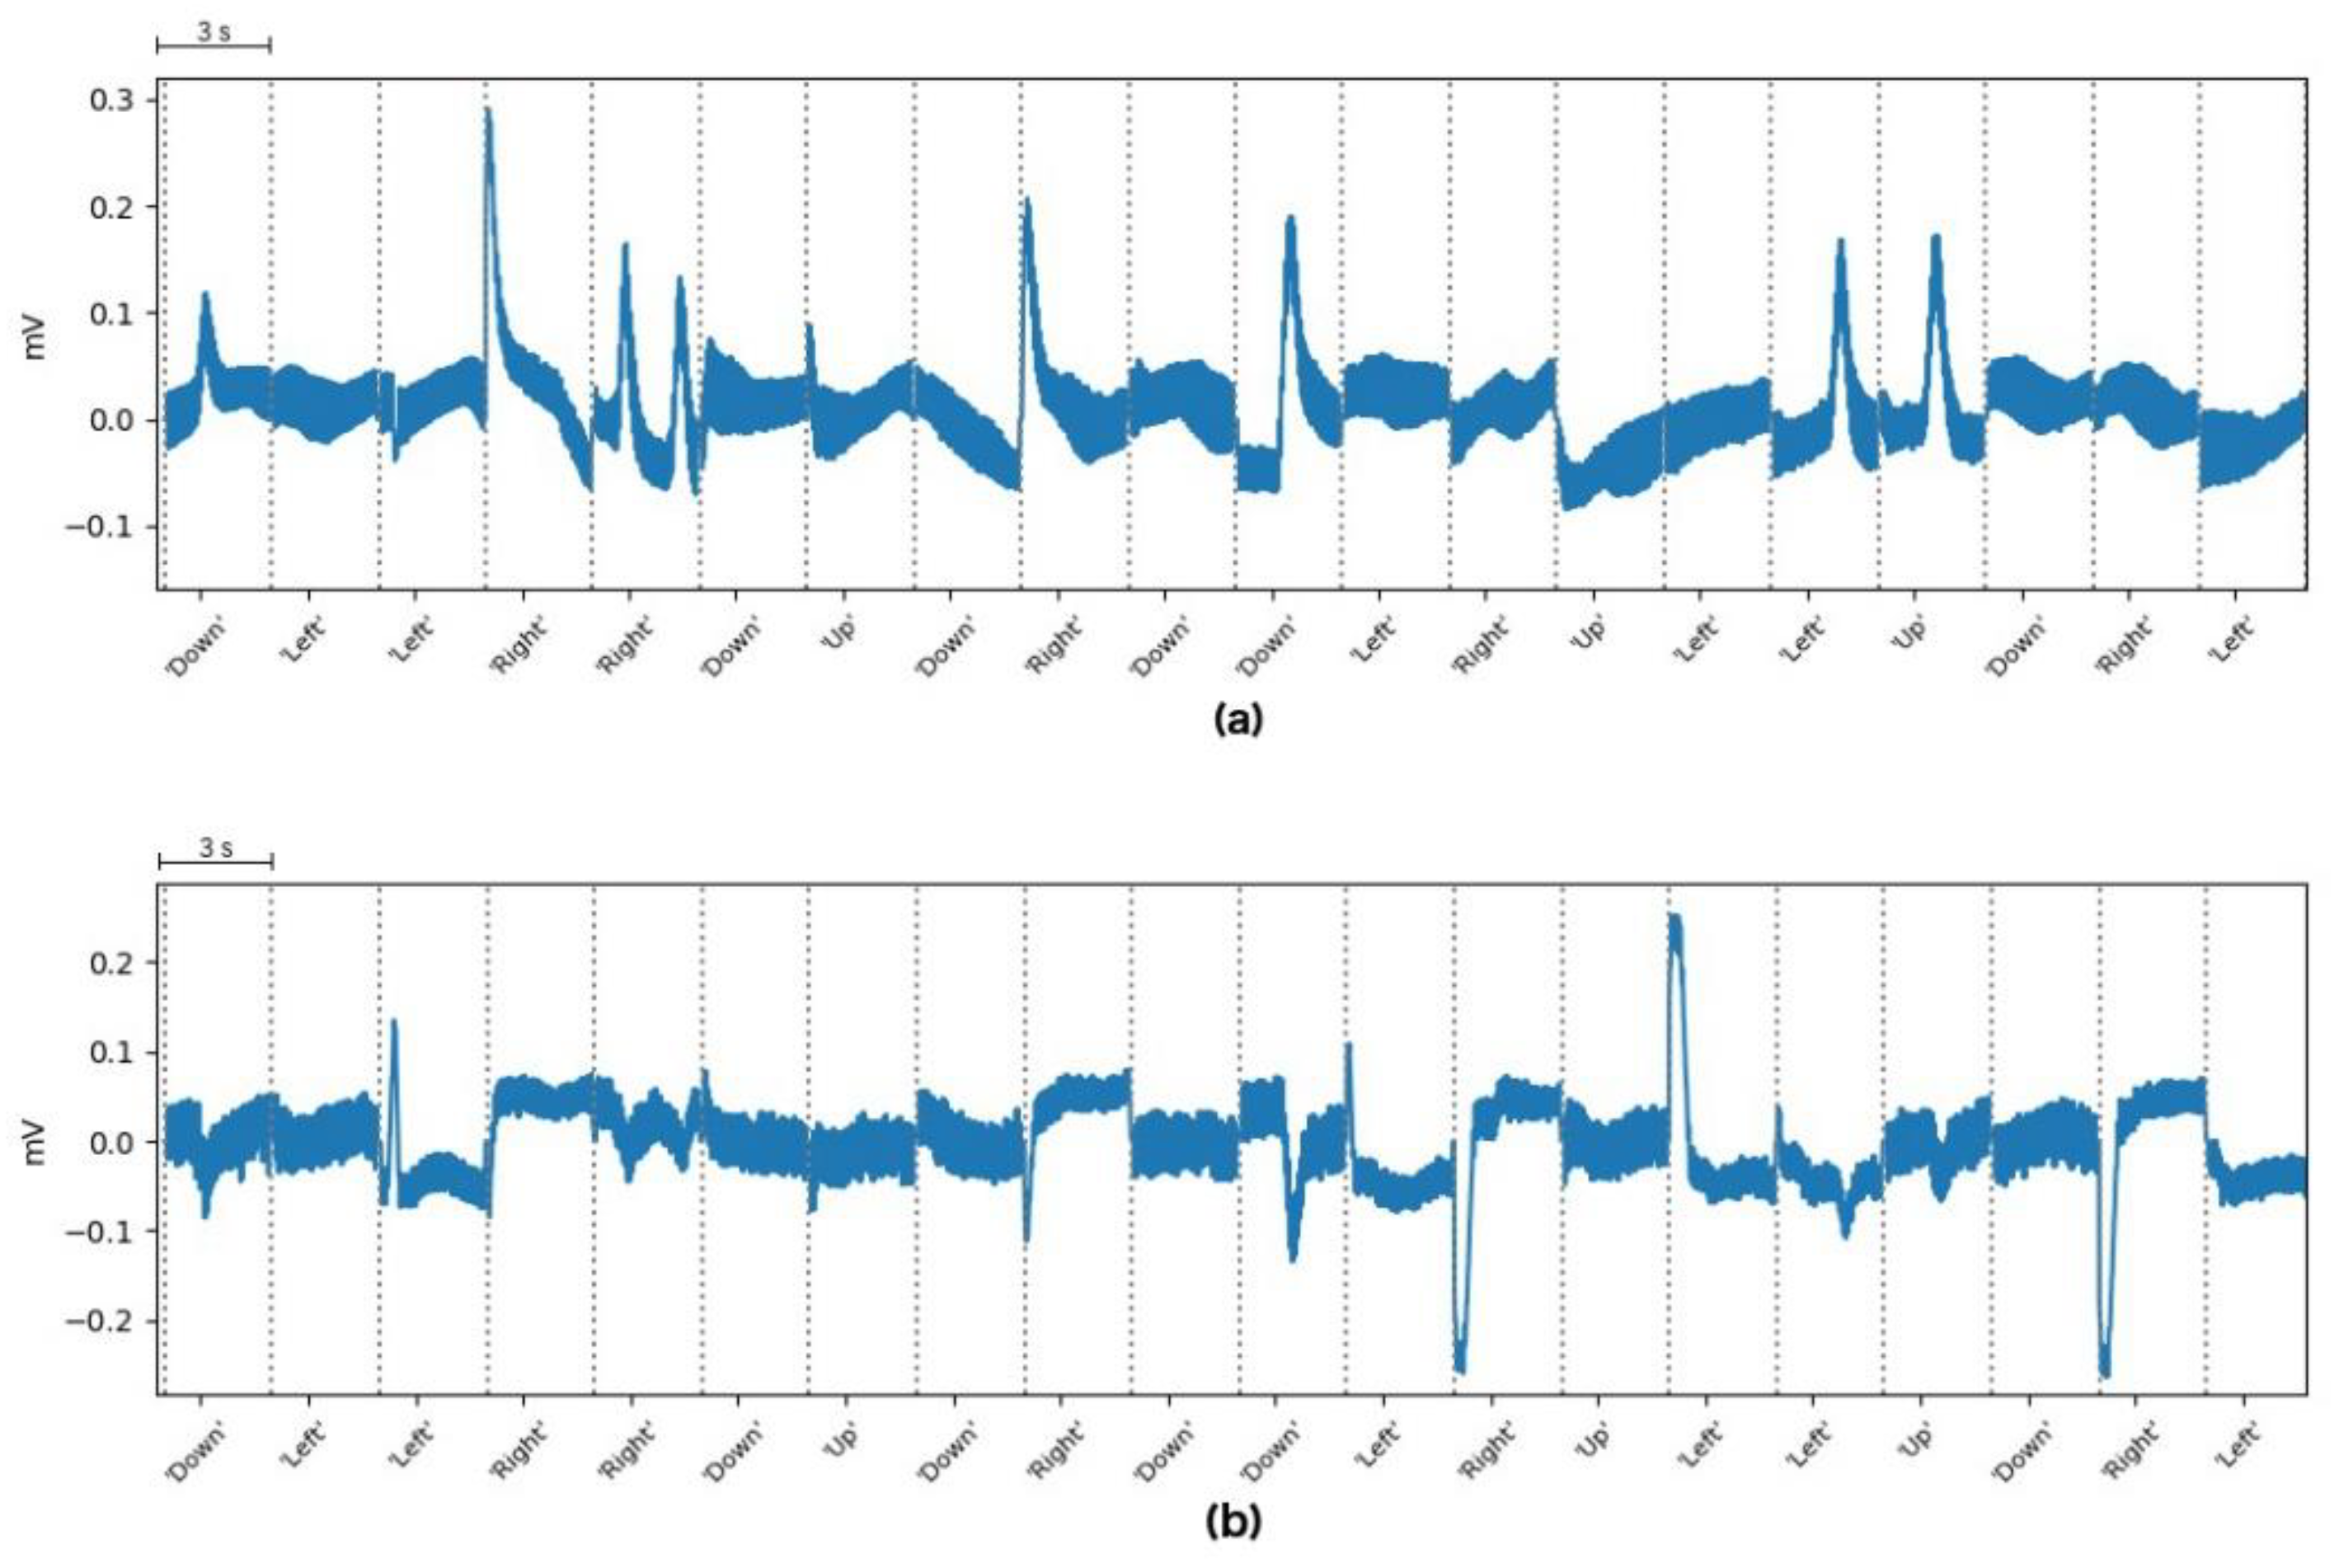
3. Results
4. Discussion
5. Conclusions
Author Contributions
Funding
Conflicts of Interest
References
- Hossain, Z.; Shuvo, M.M.H.; Sarker, P. Hardware and Software Implementation of Real Time Electrooculogram (EOG) Acquisition System to Control Computer Cursor with Eyeball Movement. In Proceedings of the 4th International Conference on Advances in Electrical Engineering (ICAEE), Dhaka, Bangladesh, 28–30 September 2017; IEEE: Piscataway, NJ, USA, 2017; pp. 132–137. [Google Scholar] [CrossRef]
- Usakli, A.B.; Gurkan, S. Design of a Novel Efficient Human–Computer Interface: An Electrooculagram Based Virtual Keyboard. IEEE Trans. Instrum. Meas. 2010, 59, 2099–2108. [Google Scholar] [CrossRef]
- Argentim, L.M.; Castro, M.C.F.; Tomaz, P.A. Human Interface for a Neuroprothesis Remotely Control. In Proceedings of the 11th International Joint Conference on Biomedical Engineering Systems and Technologies, Funchal, Madeira, Portugal, 19–21 January 2018; SCITEPRESS—Science and Technology Publications: Setubal, Portugal, 2018; pp. 247–253. [Google Scholar] [CrossRef]
- Rokonuzzaman, S.M.; Ferdous, S.M.; Tuhin, R.A.; Arman, S.I.; Manzar, T.; Hasan, M.N. Design of an Autonomous Mobile Wheelchair for Disabled Using Electrooculogram (EOG) Signals. In Mechatronics; Jablonski, R., Brezina, T., Eds.; Springer: Berlin/Heidelberg, Germany, 2011; pp. 41–53. [Google Scholar]
- Barea, R.; Boquete, L.; Bergasa, L.M.; López, E.; Mazo, M. Electro-Oculographic Guidance of a Wheelchair Using Eye Movements Codification. Int. J. Robot. Res. 2003, 22, 641–652. [Google Scholar] [CrossRef]
- Yathunanthan, S.; Chandrasena, L.U.R.; Umakanthan, A.; Vasuki, V.; Munasinghe, S.R. Controlling a Wheelchair by Use of EOG Signal. In Proceedings of the 4th International Conference on Information and Automation for Sustainability, Colombo, Sri Lanka, 12–14 December 2008; IEEE: Piscataway, NJ, USA, 2008; pp. 283–288. [Google Scholar] [CrossRef]
- Mazo, M.; Rodríguez, F.J.; Lázaro, J.L.; Ureña, J.; García, J.C.; Santiso, E.; Revenga, P.A. Electronic Control of a Wheelchair Guided by Voice Commands. Control. Eng. Pract. 1995, 3, 665–674. [Google Scholar] [CrossRef]
- Chaudhary, U.; Mrachacz-Kersting, N.; Birbaumer, N. Neuropsychological and Neurophysiological Aspects of Brain-computer-interface (BCI)-control in Paralysis. J. Physiol. 2020, JP278775. [Google Scholar] [CrossRef] [PubMed] [Green Version]
- Chaudhary, U.; Birbaumer, N.; Curado, M.R. Brain-Machine Interface (BMI) in Paralysis. Ann. Phys. Rehabil. Med. 2015, 58, 9–13. [Google Scholar] [CrossRef] [PubMed] [Green Version]
- Chaudhary, U.; Birbaumer, N.; Ramos-Murguialday, A. Brain–Computer Interfaces in the Completely Locked-in State and Chronic Stroke. In Progress in Brain Research; Elsevier: Amsterdam, The Netherlands, 2016; Volume 228, pp. 131–161. [Google Scholar] [CrossRef]
- Chaudhary, U.; Birbaumer, N.; Ramos-Murguialday, A. Brain–Computer Interfaces for Communication and Rehabilitation. Nat. Rev. Neurol. 2016, 12, 513–525. [Google Scholar] [CrossRef] [Green Version]
- Rosen, J.; Brand, M.; Fuchs, M.B.; Arcan, M. A Myosignal-Based Powered Exoskeleton System. IEEE Trans. Syst. Man Cybern. Part. A Syst. Hum. 2001, 31, 210–222. [Google Scholar] [CrossRef] [Green Version]
- Ferreira, A.; Celeste, W.C.; Cheein, F.A.; Bastos-Filho, T.F.; Sarcinelli-Filho, M.; Carelli, R. Human-Machine Interfaces Based on EMG and EEG Applied to Robotic Systems. J. NeuroEng. Rehabil. 2008, 5, 10. [Google Scholar] [CrossRef] [Green Version]
- Chaudhary, U.; Xia, B.; Silvoni, S.; Cohen, L.G.; Birbaumer, N. Brain–Computer Interface–Based Communication in the Completely Locked-In State. PLOS Biol. 2017, 15, e1002593. [Google Scholar] [CrossRef]
- Khalili Ardali, M.; Rana, A.; Purmohammad, M.; Birbaumer, N.; Chaudhary, U. Semantic and BCI-Performance in Completely Paralyzed Patients: Possibility of Language Attrition in Completely Locked in Syndrome. Brain Lang. 2019, 194, 93–97. [Google Scholar] [CrossRef]
- Gallegos-Ayala, G.; Furdea, A.; Takano, K.; Ruf, C.A.; Flor, H.; Birbaumer, N. Brain Communication in a Completely Locked-in Patient Using Bedside near-Infrared Spectroscopy. Neurology 2014, 82, 1930–1932. [Google Scholar] [CrossRef] [PubMed] [Green Version]
- Bharadwaj, S.; Kumari, B.; Tech, M. Electrooculography: Analysis on Device Control by Signal Processing. Int. J. Adv. Res. Comput. Sci. 2017, 8, 787–790. [Google Scholar]
- Heide, W.; Koenig, E.; Trillenberg, P.; Kömpf, D.; Zee, D.S. Electrooculography: Technical Standards and Applications. Electroencephalogr. Clin. Neurophysiol. Suppl. 1999, 52, 223–240. [Google Scholar] [PubMed]
- Lv, Z.; Wang, Y.; Zhang, C.; Gao, X.; Wu, X. An ICA-Based Spatial Filtering Approach to Saccadic EOG Signal Recognition. Biomed. Signal. Process. Control. 2018, 43, 9–17. [Google Scholar] [CrossRef]
- Wu, S.L.; Liao, L.D.; Lu, S.W.; Jiang, W.L.; Chen, S.A.; Lin, C.T. Controlling a Human–Computer Interface System with a Novel Classification Method That Uses Electrooculography Signals. IEEE Trans. Biomed. Eng. 2013, 60, 2133–2141. [Google Scholar] [CrossRef]
- Huang, Q.; He, S.; Wang, Q.; Gu, Z.; Peng, N.; Li, K.; Zhang, Y.; Shao, M.; Li, Y. An EOG-Based Human–Machine Interface for Wheelchair Control. IEEE Trans. Biomed. Eng. 2018, 65, 2023–2032. [Google Scholar] [CrossRef]
- Larson, A.; Herrera, J.; George, K.; Matthews, A. Electrooculography Based Electronic Communication Device for Individuals with ALS. In Proceedings of the IEEE Sensors Applications Symposium (SAS), Glassboro, NJ, USA, 13–15 March 2017; IEEE: Piscataway, NJ, USA, 2017; pp. 1–5. [Google Scholar] [CrossRef]
- Iáñez, E.; Azorin, J.M.; Perez-Vidal, C. Using Eye Movement to Control a Computer: A Design for a Lightweight Electro-Oculogram Electrode Array and Computer Interface. PLoS ONE 2013, 8, e67099. [Google Scholar] [CrossRef] [Green Version]
- Kherlopian, A.; Sajda, P.; Gerrein, J.; Yue, M.; Kim, K.; Kim, J.W.; Sukumaran, M. Electrooculogram Based System for Computer Control Using a Multiple Feature Classification Model. 4. In Proceedings of the 28th IEEE EMBS Annual International Conference, New York, NY, USA, 30 August–3 September 2006. [Google Scholar]
- Arai, K.; Mardiyanto, R. A Prototype of ElectricWheelchair Controlled by Eye-Only for Paralyzed User. J. Robot. Mechatron. 2011, 23, 66–74. [Google Scholar] [CrossRef]
- Heo, J.; Yoon, H.; Park, K. A Novel Wearable Forehead EOG Measurement System for Human Computer Interfaces. Sensors 2017, 17, 1485. [Google Scholar] [CrossRef] [Green Version]
- Qi, L.J.; Alias, N. Comparison of ANN and SVM for Classification of Eye Movements in EOG Signals. J. Phys. Conf. Ser. 2018, 971, 012012. [Google Scholar] [CrossRef]
- Guo, X.; Pei, W.; Wang, Y.; Chen, Y.; Zhang, H.; Wu, X.; Yang, X.; Chen, H.; Liu, Y.; Liu, R. A Human-Machine Interface Based on Single Channel EOG and Patchable Sensor. Biomed. Signal. Process. Control. 2016, 30, 98–105. [Google Scholar] [CrossRef]
- Erkaymaz, H.; Ozer, M.; Orak, İ.M. Detection of Directional Eye Movements Based on the Electrooculogram Signals through an Artificial Neural Network. Chaos Solitons Fractals 2015, 77, 225–229. [Google Scholar] [CrossRef]
- Merino, M.; Rivera, O.; Gomez, I.; Molina, A.; Dorronzoro, E. A Method of EOG Signal Processing to Detect the Direction of Eye Movements. In Proceedings of the First International Conference on Sensor Device Technologies and Applications, Venice, Italy, 18–25 July 2010; IEEE: Piscataway, NJ, USA, 2010; pp. 100–105. [Google Scholar] [CrossRef] [Green Version]
- Aungsakul, S.; Phinyomark, A.; Phukpattaranont, P.; Limsakul, C. Evaluating Feature Extraction Methods of Electrooculography (EOG) Signal for Human-Computer Interface. Procedia Eng. 2012, 32, 246–252. [Google Scholar] [CrossRef] [Green Version]
- Phukpattaranont, P.; Aungsakul, S.; Phinyomark, A.; Limsakul, C. Efficient Feature for Classification of Eye Movements Using Electrooculography Signals. Therm. Sci. 2016, 20, 563–572. [Google Scholar] [CrossRef]
- Boser, B.; Guyon, I.; Vapnik, V. A Training Algorithm for Optimal Margin Classifiers. In Proceedings of the Fifth Annual Workshop on Computational Learning Theory, Pittsburgh, PA, USA, 27–29 July 1992; Association for Computing Machinery: New York, NY, USA, 1992; pp. 144–152. [Google Scholar]
- Vapnik, V.; Golowich, S.E.; Smola, A.J. Support Vector Method for Function Approximation, Regression Estimation and Signal Processing. In Advances in Neural Information Processing Systems; Mozer, M.C., Jordan, M.I., Petsche, T., Eds.; MIT Press: Cambridge, MA, USA, 1997. [Google Scholar]
- Hess, C.W.; Muri, R.; Meienberg, O. Recording of Horizontal Saccadic Eye Movements: Methodological Comparison Between Electro-Oculography and Infrared Reflection Oculography. Neuro Ophthalmol. 1986, 6, 189–197. [Google Scholar] [CrossRef]
- Barea, R.; Boquete, L.; Ortega, S.; López, E.; Rodríguez-Ascariz, J.M. EOG-Based Eye Movements Codification for Human Computer Interaction. Expert Syst. Appl. 2012, 39, 2677–2683. [Google Scholar] [CrossRef]
- Chang, W.D. Electrooculograms for Human–Computer Interaction: A Review. Sensors 2019, 19, 2690. [Google Scholar] [CrossRef] [Green Version]
- Barea, R.; Boquete, L.; Mazo, M.; Lopez, E. System for Assisted Mobility Using Eye Movements Based on Electrooculography. IEEE Trans. Neural Syst. Rehabil. Eng. 2002, 10, 209–218. [Google Scholar] [CrossRef]
- Amari, S.; Wu, S. Improving Support Vector Machine Classifiers by Modifying Kernel Functions. Neural Netw. 1999, 12, 783–789. [Google Scholar] [CrossRef]
- Ben-Hur, A.; Weston, J. A User’s Guide to Support Vector Machines. In Data Mining Techniques for the Life Sciences; Carugo, O., Eisenhaber, F., Eds.; Humana Press: Totowa, NJ, USA, 2010; Volume 609, pp. 223–239. [Google Scholar] [CrossRef] [Green Version]
- Hsu, C.W.; Lin, C.J. A Comparison of Methods for Multiclass Support Vector Machines. IEEE Trans. Neural Netw. 2002, 13, 415–425. [Google Scholar] [CrossRef] [Green Version]
- Kohavi, R. A Study of Cross-Validation and Bootstrap for Accuracy Estimation and Model Selection. Int. Jt. Conf. Artif. Intell. 1995, 14, 8. [Google Scholar]
- Barea, R.; Boquete, L.; Rodriguez-Ascariz, J.M.; Ortega, S.; López, E. Sensory System for Implementing a Human-Computer Interface Based on Electrooculography. Sensors 2010, 11, 310–328. [Google Scholar] [CrossRef] [PubMed]
- Pander, T.; Przybyła, T.; Czabanski, R. An Application of Detection Function for the Eye Blinking Detection. In Proceedings of the Conference on Human System Interactions, Krakow, Poland, 25–27 May 2008; IEEE: Piscataway, NJ, USA, 2008; pp. 287–291. [Google Scholar] [CrossRef]
Sample Availability: Corresponding code and data are available at https://github.com/JayroMartinez/EOG-Classification. |


| Study | Movements | Acquisition | Processing | Method | Accuracy |
|---|---|---|---|---|---|
| Qi et al. [27] | Up, Down, Left, Right | Commercial | - | Offline | 70% |
| Guo et al. [28] | Up, Down, Blink | Commercial | Laptop | Online | 84% |
| Kherlopian et al. [24] | Left, Right, Center | Commercial | Laptop | Online | 80% |
| Wu et al. [20] | Up, Down, Left, Right, Up-Right, Up-Left, Down-Right, Down-Left | Self-designed | Laptop | Online | 88.59% |
| Heo et al. [26] | Up, Down, Left, Right, Blink | Self-designed | Self-designed + Laptop | Online | 91.25% |
| Heo et al. [26] | Double Blink | Self-designed | Self-designed + Laptop | Online | 95.12% |
| Erkaymaz et al. [29] | Up, Down, Left, Right, Blink, Tic | Commercial | Laptop | Offline | 93.82% |
| Merino et al. [27] | Up, Down, Left, Right | Commercial | Laptop | Online | 94.11% |
| Huang et al. [21] | Blink | Self-designed | Laptop | Online | 96.7% |
| Lv et al. [19] | Up, Down, Left, Right | Commercial | Laptop | Offline | 99% |
| Yathunanthan et al. [6] | Up, Down, Left, Right | Self-designed | Self-designed | Online | 99% |
| Subject | Model Mean Accuracy | Online Accuracy |
|---|---|---|
| Subject 1 | 100% | 90% |
| Subject 2 | 100% | 95% |
| Subject 3 | 92.5% | 85% |
| Subject 5 | 100% | 100% |
| Subject 6 | 78.7% | 85% |
| Subject 7 | 97.5% | 95% |
| Subject 10 | 90.8% | 80% |
| MEAN | 94.21% | 90% |
© 2020 by the authors. Licensee MDPI, Basel, Switzerland. This article is an open access article distributed under the terms and conditions of the Creative Commons Attribution (CC BY) license (http://creativecommons.org/licenses/by/4.0/).
Share and Cite
Martínez-Cerveró, J.; Ardali, M.K.; Jaramillo-Gonzalez, A.; Wu, S.; Tonin, A.; Birbaumer, N.; Chaudhary, U. Open Software/Hardware Platform for Human-Computer Interface Based on Electrooculography (EOG) Signal Classification. Sensors 2020, 20, 2443. https://doi.org/10.3390/s20092443
Martínez-Cerveró J, Ardali MK, Jaramillo-Gonzalez A, Wu S, Tonin A, Birbaumer N, Chaudhary U. Open Software/Hardware Platform for Human-Computer Interface Based on Electrooculography (EOG) Signal Classification. Sensors. 2020; 20(9):2443. https://doi.org/10.3390/s20092443
Chicago/Turabian StyleMartínez-Cerveró, Jayro, Majid Khalili Ardali, Andres Jaramillo-Gonzalez, Shizhe Wu, Alessandro Tonin, Niels Birbaumer, and Ujwal Chaudhary. 2020. "Open Software/Hardware Platform for Human-Computer Interface Based on Electrooculography (EOG) Signal Classification" Sensors 20, no. 9: 2443. https://doi.org/10.3390/s20092443