Vision-Based Traffic Sign Detection and Recognition Systems: Current Trends and Challenges

 ,
,  , ,
, ,  and
and
Abstract
:1. Introduction
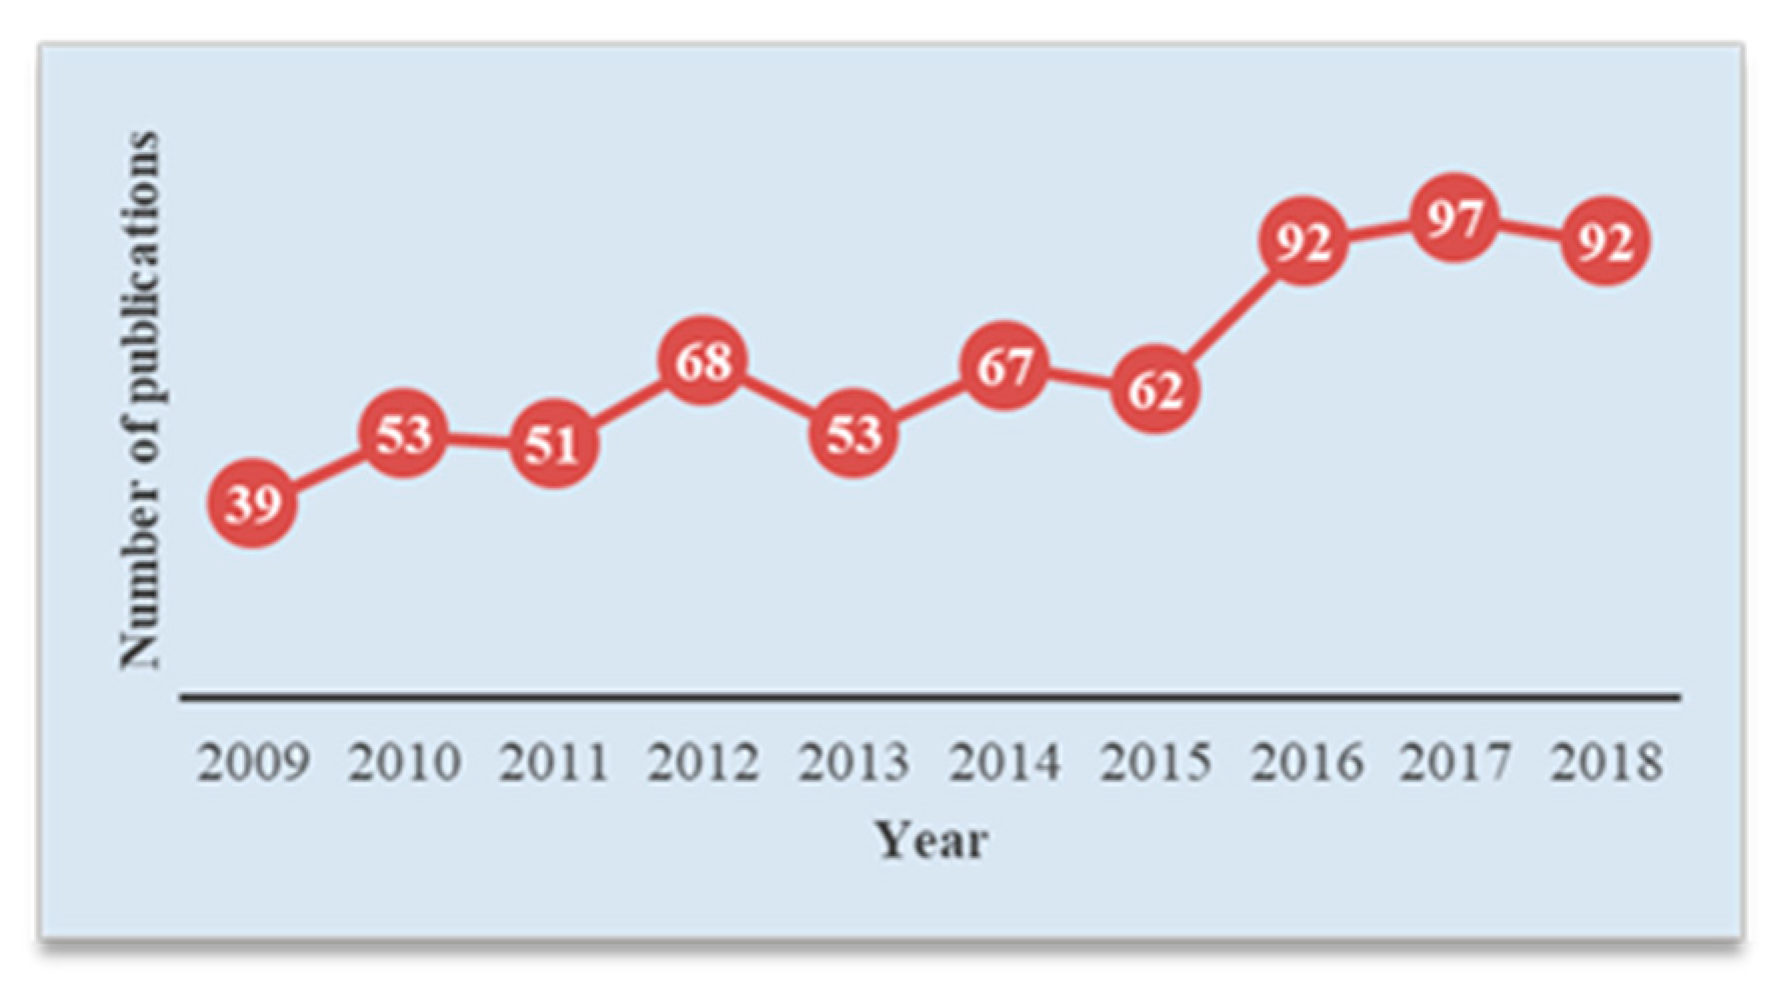
2. Traffic Signs and Research Trends
3. Traffic Sign Database
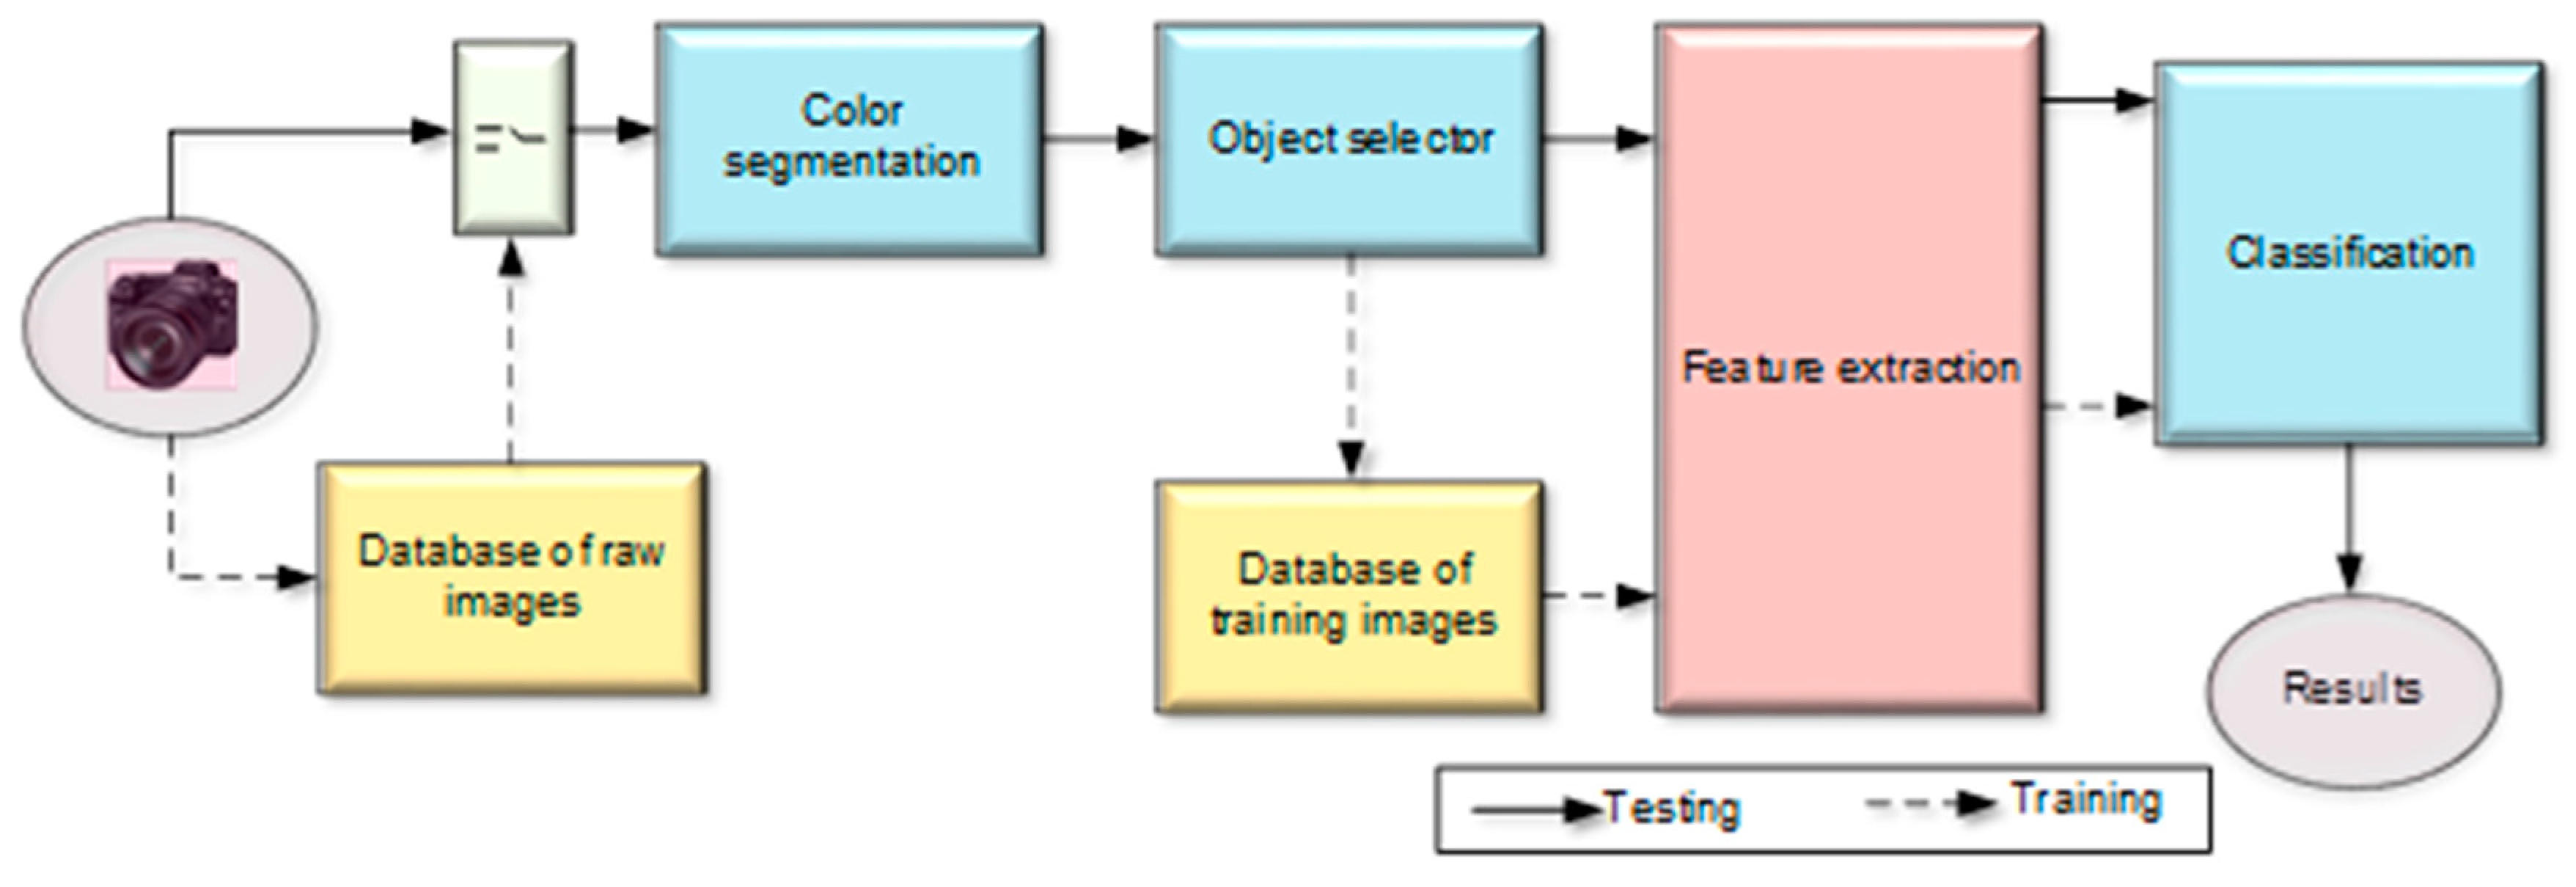
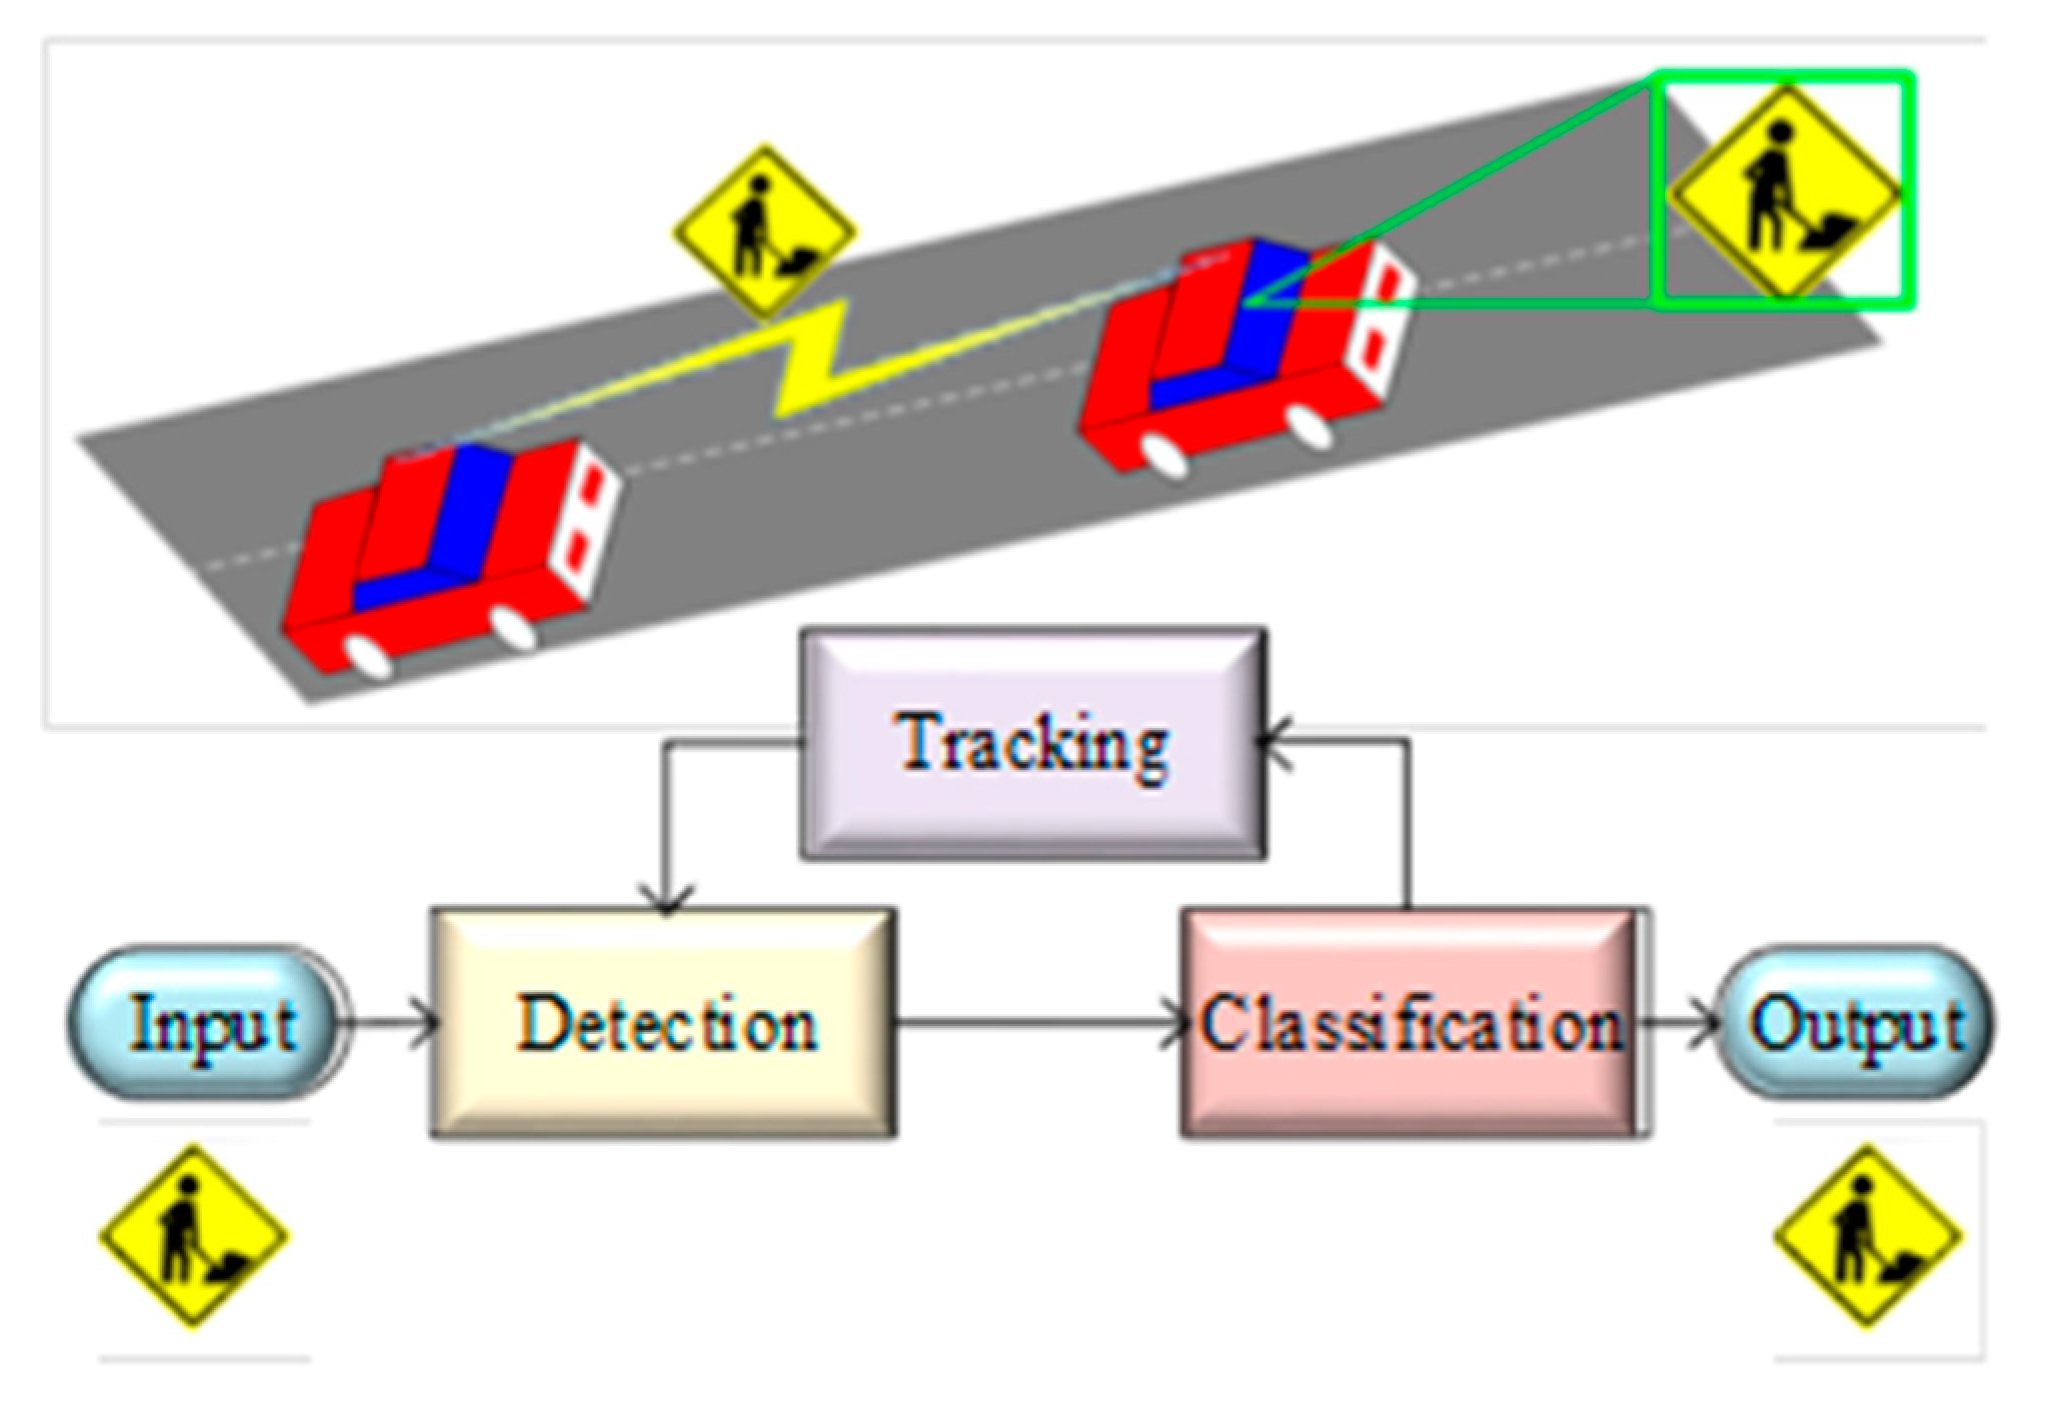
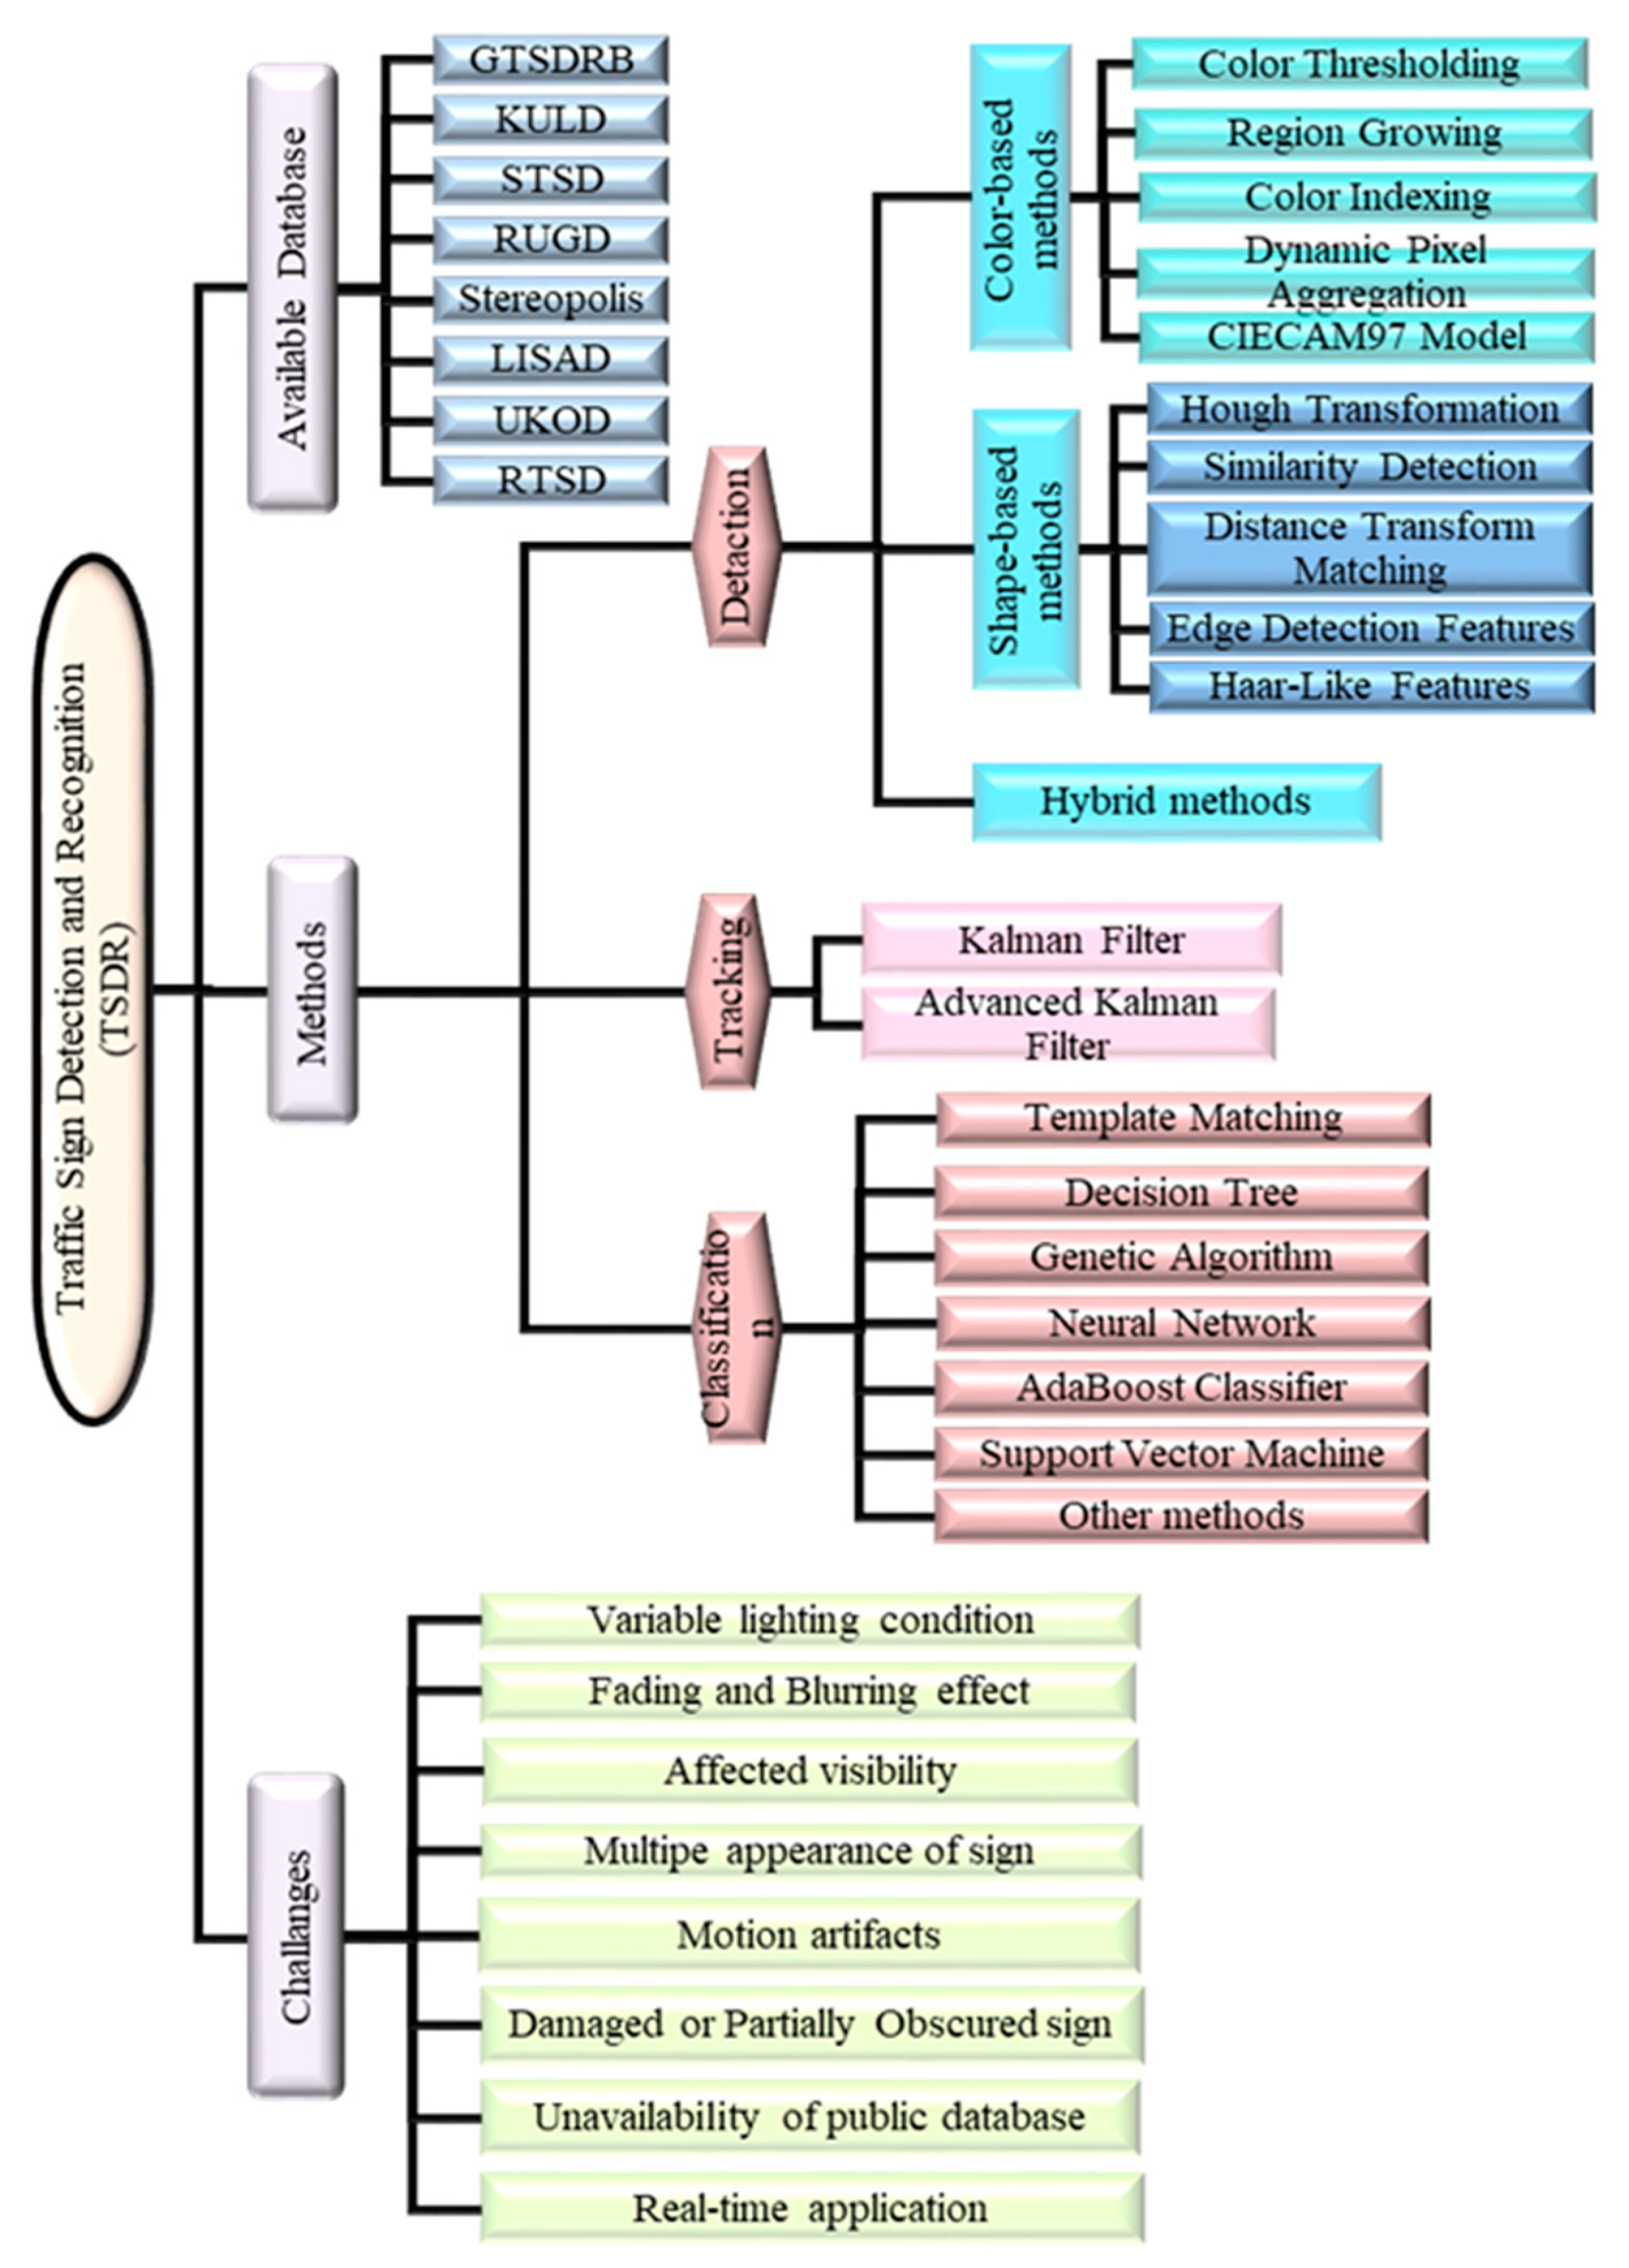
4. Traffic Sign Detection, Tracking and Classification Methods
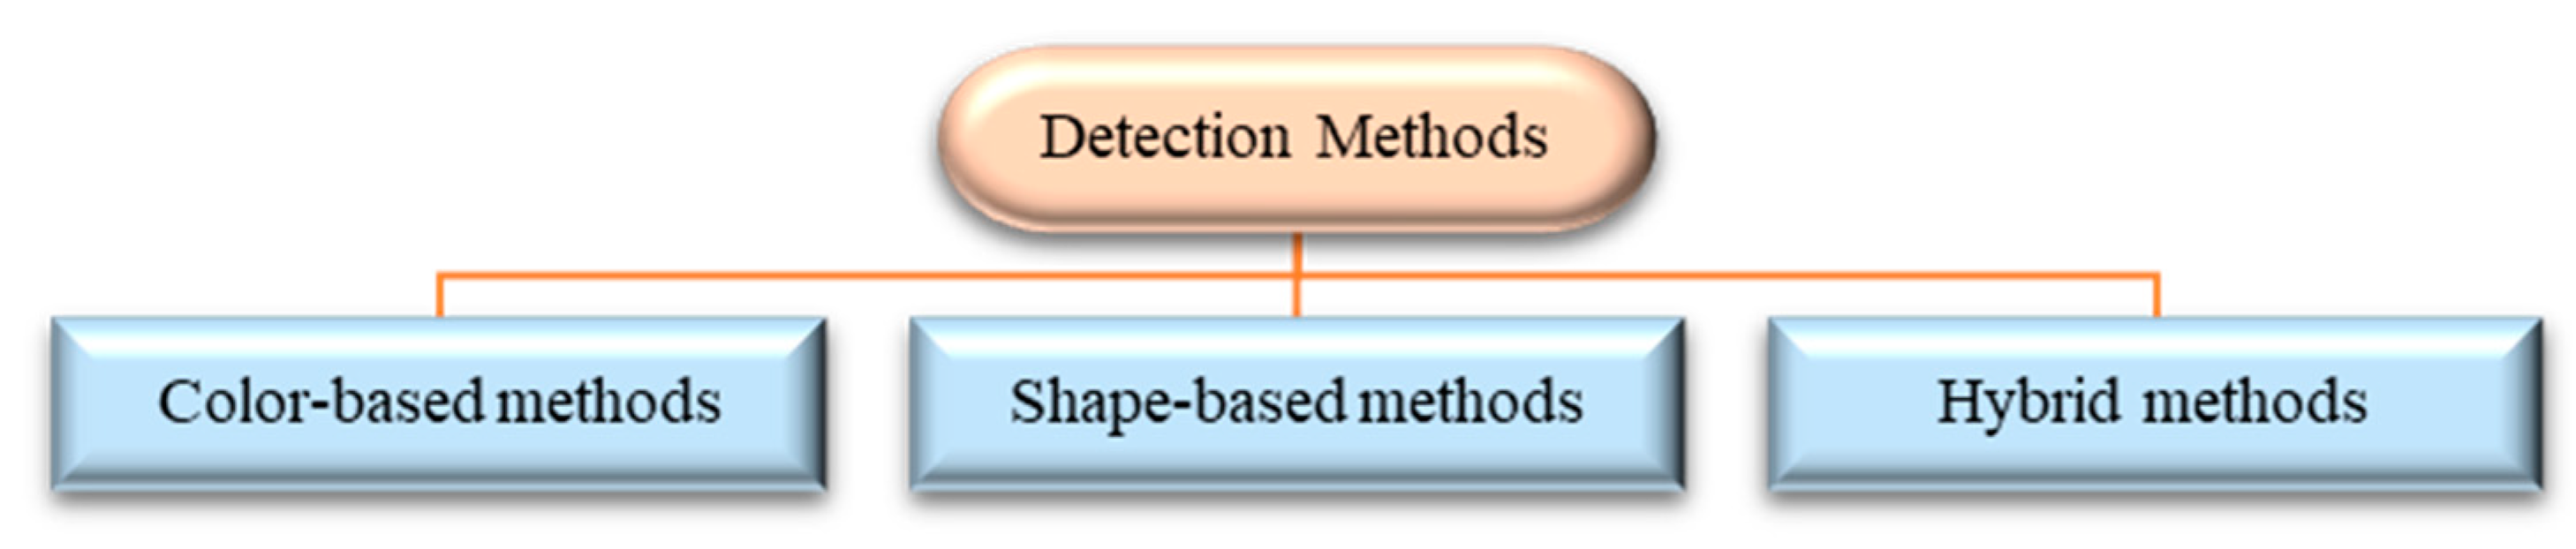
4.1. Detection Phase
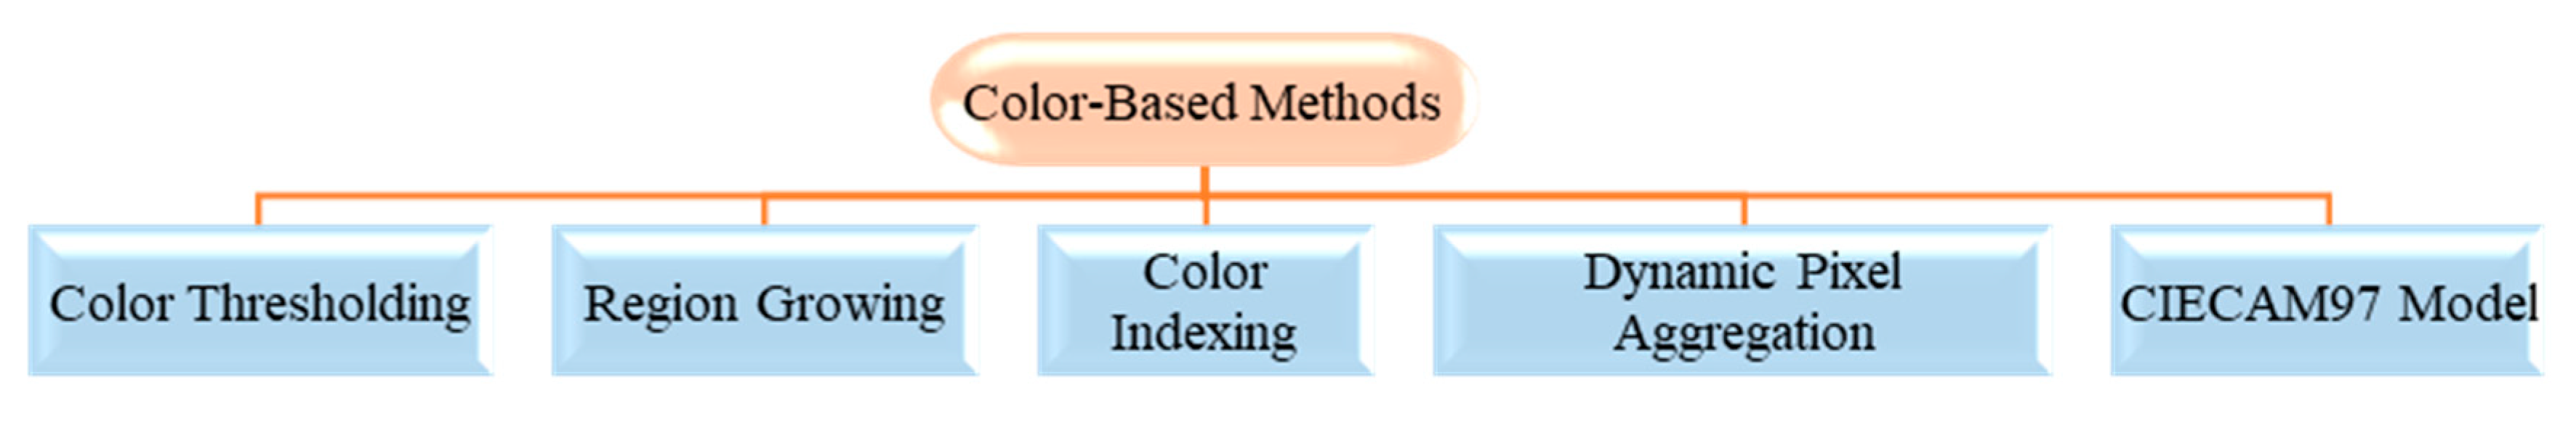
4.1.1. Color-Based Methods
4.1.2. Shape-Based Methods
4.1.3. Hybrid Methods
4.2. Tracking Phase
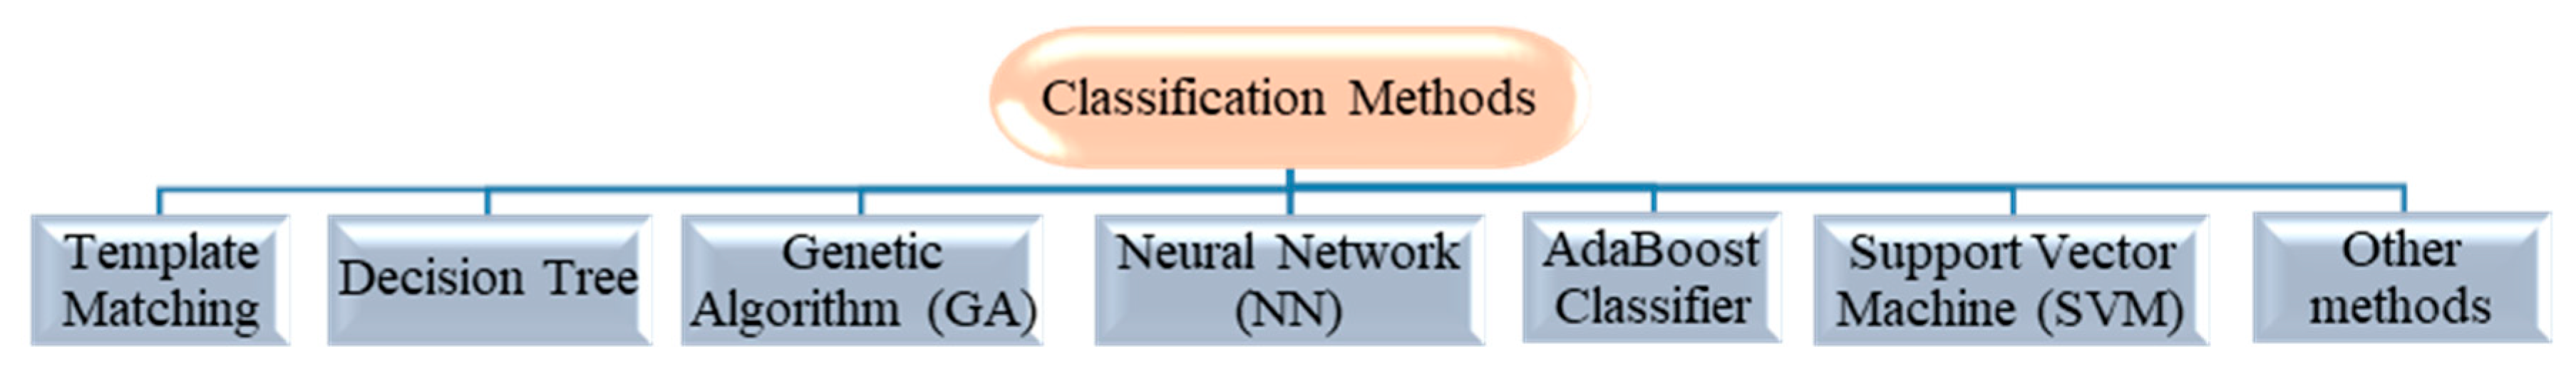
4.3. Classification Phase
5. Current Issues and Challenges
6. Conclusions and Suggestion
Author Contributions
Funding
Acknowledgments
Conflicts of Interest
References
- Alturki, A.S. Traffic Sign Detection and Recognition Using Adaptive Threshold Segmentation with Fuzzy Neural Network Classification. In Proceedings of the 2018 International Symposium on Networks, Computers and Communications (ISNCC), Rome, Italy, 19–21 June 2018; pp. 1–7. [Google Scholar]
- Satılmış, Y.; Tufan, F.; Şara, M.; Karslı, M.; Eken, S.; Sayar, A. CNN Based Traffic Sign Recognition for Mini Autonomous Vehicles. In Proceedings of the International Conference on Information Systems Architecture and Technology, Nysa, Poland, 16–18 September 2018; pp. 85–94. [Google Scholar]
- Saadna, Y.; Behloul, A.; Mezzoudj, S. Speed limit sign detection and recognition system using SVM and MNIST datasets. Neural Comput. Appl. 2019, 1–11. [Google Scholar] [CrossRef]
- Guo, J.; Lu, J.; Qu, Y.; Li, C. Traffic-Sign Spotting in the Wild via Deep Features. In Proceedings of the 2018 IEEE Intelligent Vehicles Symposium (IV), Changshu, China, 26–30 June 2018; pp. 120–125. [Google Scholar]
- Vokhidov, H.; Hong, H.; Kang, J.; Hoang, T.; Park, K. Recognition of damaged arrow-road markings by visible light camera sensor based on convolutional neural network. Sensors 2016, 16, 2160. [Google Scholar] [CrossRef] [PubMed]
- De la Escalera, A.; Armingol, J.M.; Mata, M. Traffic sign recognition and analysis for intelligent vehicles. Image Vis. Comput. 2003, 21, 247–258. [Google Scholar] [CrossRef] [Green Version]
- Hoang, T.M.; Baek, N.R.; Cho, S.W.; Kim, K.W.; Park, K.R. Road lane detection robust to shadows based on a fuzzy system using a visible light camera sensor. Sensors 2017, 17, 2475. [Google Scholar] [CrossRef] [PubMed]
- Economic Commission for Europe. Convention on Traffic Signs and Signals; Vienna Convention: Vienna, Austria, 1968. [Google Scholar]
- Luo, H.; Yang, Y.; Tong, B.; Wu, F.; Fan, B. Traffic sign recognition using a multi-task convolutional neural network. IEEE Trans. Intell. Transp. Syst. 2018, 19, 1100–1111. [Google Scholar] [CrossRef]
- Houben, S.; Stallkamp, J.; Salmen, J.; Schlipsing, M.; Igel, C. Detection of traffic signs in real-world images: The German Traffic Sign Detection Benchmark. In Proceedings of the 2013 International Joint Conference on Neural Networks (IJCNN), Dallas, TX, USA, 4–9 August 2013; pp. 1–8. [Google Scholar]
- Stallkamp, J.; Schlipsing, M.; Salmen, J.; Igel, C. The German traffic sign recognition benchmark: A multi-class classification competition. In Proceedings of the 2011 International Joint Conference on Neural Networks (IJCNN), San Jose, CA, USA, 31 July–5 August 2011; pp. 1453–1460. [Google Scholar]
- Li, J.; Wang, Z. Real-time traffic sign recognition based on efficient CNNs in the wild. IEEE Trans. Intell. Transp. Syst. 2018, 20, 975–984. [Google Scholar] [CrossRef]
- Madani, A.; Yusof, R. Malaysian Traffic Sign Dataset for Traffic Sign Detection and Recognition Systems. J. Telecommun. Electron. Comput. Eng. (JTEC) 2016, 8, 137–143. [Google Scholar]
- Liu, H.; Ran, B. Vision-based stop sign detection and recognition system for intelligent vehicles. Transp. Res. Rec. J. Transp. Res. Board 2001, 1748, 161–166. [Google Scholar] [CrossRef]
- Nandi, D.; Saif, A.S.; Prottoy, P.; Zubair, K.M.; Shubho, S.A. Traffic Sign Detection based on Color Segmentation of Obscure Image Candidates: A Comprehensive Study. Int. J. Mod. Educ. Comput. Sci. 2018, 10, 35. [Google Scholar] [CrossRef]
- Hannan, M.; Hussain, A.; Mohamed, A.; Samad, S.A.; Wahab, D.A. Decision fusion of a multi-sensing embedded system for occupant safety measures. Int. J. Automot. Technol. 2010, 11, 57–65. [Google Scholar] [CrossRef]
- Møgelmose, A.; Trivedi, M.M.; Moeslund, T.B. Vision-Based Traffic Sign Detection and Analysis for Intelligent Driver Assistance Systems: Perspectives and Survey. IEEE Trans. Intell. Transp. Syst. 2012, 13, 1484–1497. [Google Scholar] [CrossRef] [Green Version]
- Shao, F.; Wang, X.; Meng, F.; Rui, T.; Wang, D.; Tang, J. Real-time traffic sign detection and recognition method based on simplified Gabor wavelets and CNNs. Sensors 2018, 18, 3192. [Google Scholar] [CrossRef] [PubMed]
- Zabihi, S.J.; Zabihi, S.M.; Beauchemin, S.S.; Bauer, M.A. Detection and recognition of traffic signs inside the attentional visual field of drivers. In Proceedings of the 2017 IEEE Intelligent Vehicles Symposium (IV), Los Angeles, CA, USA, 11–14 June 2017. [Google Scholar]
- Chang, X.; Yang, Y. Semisupervised feature analysis by mining correlations among multiple tasks. IEEE Trans. Neural Netw. Learn. Syst. 2017, 28, 2294–2305. [Google Scholar] [CrossRef] [PubMed]
- Yuan, Y.; Xiong, Z.; Wang, Q. An incremental framework for video-based traffic sign detection, tracking, and recognition. IEEE Trans. Intell. Transp. Syst. 2017, 18, 1918–1929. [Google Scholar] [CrossRef]
- The Clemson University Vehicular Electronics Laboratory (CVEL). Traffic Sign Recognition Systems. Available online: https://cecas.clemson.edu/cvel/auto/systems/sign-recognition.html (accessed on 5 March 2019).
- Saadna, Y.; Behloul, A. An overview of traffic sign detection and classification methods. Int. J. Multimed. Inf. Retr. 2017, 6, 193–210. [Google Scholar] [CrossRef]
- Gündüz, H.; Kaplan, S.; Günal, S.; Akınlar, C. Circular traffic sign recognition empowered by circle detection algorithm. In Proceedings of the 2013 21st Signal Processing and Communications Applications Conference (SIU), Haspolat, Turkey, 24–26 April 2013; pp. 1–4. [Google Scholar]
- Kuang, X.; Fu, W.; Yang, L. Real-Time Detection and Recognition of Road Traffic Signs using MSER and Random Forests. Int. J. Online Eng. (IJOE) 2018, 14, 34–51. [Google Scholar] [CrossRef] [Green Version]
- Xu, X.; Jin, J.; Zhang, S.; Zhang, L.; Pu, S.; Chen, Z. Smart data driven traffic sign detection method based on adaptive color threshold and shape symmetry. Future Gener. Comput. Syst. 2019, 94, 381–391. [Google Scholar] [CrossRef]
- Liu, C.; Chang, F.; Chen, Z.; Liu, D. Fast traffic sign recognition via high-contrast region extraction and extended sparse representation. IEEE Trans. Intell. Transp. Syst. 2016, 17, 79–92. [Google Scholar] [CrossRef]
- De La Escalera, A.; Armingol, J.M.; Pastor, J.M.; Rodríguez, F.J. Visual sign information extraction and identification by deformable models for intelligent vehicles. IEEE Trans. Intell. Transp. Syst. 2004, 5, 57–68. [Google Scholar] [CrossRef]
- Ruta, A.; Li, Y.; Liu, X. Real-time traffic sign recognition from video by class-specific discriminative features. Pattern Recognit. 2010, 43, 416–430. [Google Scholar] [CrossRef]
- Gómez-Moreno, H.; Maldonado-Bascón, S.; Gil-Jiménez, P.; Lafuente-Arroyo, S. Goal evaluation of segmentation algorithms for traffic sign recognition. IEEE Trans. Intell. Transp. Syst. 2010, 11, 917–930. [Google Scholar] [CrossRef]
- Ren, F.; Huang, J.; Jiang, R.; Klette, R. General traffic sign recognition by feature matching. In Proceedings of the 24th International Conference on Image and Vision Computing New Zealand, IVCNZ’09, Wellington, New Zealand, 23–25 November 2009; pp. 409–414. [Google Scholar]
- Fleyeh, H. Shadow and highlight invariant colour segmentation algorithm for traffic signs. In Proceedings of the 2006 IEEE Conference on Cybernetics and Intelligent Systems, Bangkok, Thailand, 7–9 June 2006; pp. 1–7. [Google Scholar]
- Maldonado-Bascón, S.; Lafuente-Arroyo, S.; Gil-Jimenez, P.; Gómez-Moreno, H.; López-Ferreras, F. Road-sign detection and recognition based on support vector machines. IEEE Trans. Intell. Transp. Syst. 2007, 8, 264–278. [Google Scholar] [CrossRef]
- Khan, J.F.; Bhuiyan, S.M.; Adhami, R.R. Image segmentation and shape analysis for road-sign detection. IEEE Trans. Intell. Transp. Syst. 2011, 12, 83–96. [Google Scholar] [CrossRef]
- Prieto, M.S.; Allen, A.R. Using self-organising maps in the detection and recognition of road signs. Image Vis. Comput. 2009, 27, 673–683. [Google Scholar] [CrossRef]
- Fan, J.; Yau, D.K.; Elmagarmid, A.K.; Aref, W.G. Automatic image segmentation by integrating color-edge extraction and seeded region growing. IEEE Trans. Image Process. 2001, 10, 1454–1466. [Google Scholar]
- Varun, S.; Singh, S.; Kunte, R.S.; Samuel, R.S.; Philip, B. A road traffic signal recognition system based on template matching employing tree classifier. In Proceedings of the International Conference on Computational Intelligence and Multimedia Applications ICCIMA, Sivakasi, India, 13–15 December 2007; pp. 360–365. [Google Scholar]
- Ruta, A.; Li, Y.; Liu, X. Detection, tracking and recognition of traffic signs from video input. In Proceedings of the 11th International IEEE Conference on Intelligent Transportation Systems, ITSC 2008, Beijing, China, 12–15 October 2008; pp. 55–60. [Google Scholar]
- Jiang, Y.; Zhou, S.; Jiang, Y.; Gong, J.; Xiong, G.; Chen, H. Traffic sign recognition using ridge regression and Otsu method. In Proceedings of the 2011 IEEE Intelligent Vehicles Symposium (IV), Baden-Baden, Germany, 5–9 June 2011; pp. 613–618. [Google Scholar]
- Vázquez-Reina, A.; Lafuente-Arroyo, S.; Siegmann, P.; Maldonado-Bascón, S.; Acevedo-Rodríguez, F. Traffic sign shape classification based on correlation techniques. In Proceedings of the 5th WSEAS International Conference on Signal Processing, Computational Geometry & Artificial Vision, Alcalá de Henares, Malta, 15–17 September 2005; pp. 149–154. [Google Scholar]
- Jiménez, P.G.; Bascón, S.M.; Moreno, H.G.; Arroyo, S.L.; Ferreras, F.L. Traffic sign shape classification and localization based on the normalized FFT of the signature of blobs and 2D homographies. Signal Process. 2008, 88, 2943–2955. [Google Scholar] [CrossRef]
- Lafuente-Arroyo, S.; Salcedo-Sanz, S.; Maldonado-Bascón, S.; Portilla-Figueras, J.A.; López-Sastre, R.J. A decision support system for the automatic management of keep-clear signs based on support vector machines and geographic information systems. Expert Syst. Appl. 2010, 37, 767–773. [Google Scholar] [CrossRef]
- Li, L.; Li, J.; Sun, J. Robust traffic sign detection using fuzzy shape recognizer. In Proceedings of the MIPPR 2009: Pattern Recognition and Computer Vision, Yichang, China, 30 October–1 November2009; p. 74960Z. [Google Scholar]
- Wu, J.-Y.; Tseng, C.-C.; Chang, C.-H.; Lien, J.-J.J.; Chen, J.C.; Tu, C.T. Road sign recognition system based on GentleBoost with sharing features. In Proceedings of the 2011 International Conference on System Science and Engineering (ICSSE), Macao, China, 8–10 June 2011; pp. 410–415. [Google Scholar]
- Tagunde, G.A.; Uke, N.; Banchhor, C. Detection, classification and recognition of road traffic signs using color and shape features. Int. J. Adv. Technol. Eng. Res. 2012, 2, 202–206. [Google Scholar]
- Deshmukh, V.R.; Patnaik, G.; Patil, M. Real-time traffic sign recognition system based on colour image segmentation. Int. J. Comput. Appl. 2013, 83, 30–35. [Google Scholar]
- Nicchiotti, G.; Ottaviani, E.; Castello, P.; Piccioli, G. Automatic road sign detection and classification from color image sequences. In Proceedings of the 7th International Conference on Image Analysis and Processing, 1994; pp. 623–626. [Google Scholar]
- Priese, L.; Rehrmann, V. On hierarchical color segmentation and applications. In Proceedings of the 1993 IEEE Computer Society Conference on Computer Vision and Pattern Recognition, New York, NY, USA, 15–17 June 1993; pp. 633–634. [Google Scholar]
- Funt, B.V.; Finlayson, G.D. Color constant color indexing. IEEE Trans. Pattern Anal. Mach. Intell. 1995, 17, 522–529. [Google Scholar] [CrossRef]
- Swain, M.J.; Ballard, D.H. Color indexing. Int. J. Comput. Vis. 1991, 7, 11–32. [Google Scholar] [CrossRef]
- Park, D.-S.; Park, J.-S.; Kim, T.Y.; Han, J.H. Image indexing using weighted color histogram. In Proceedings of the International Conference on Image Analysis and Processing, Venice, Italy, 27–29 September 1999; pp. 909–914. [Google Scholar]
- Vitabile, S.; Pollaccia, G.; Pilato, G.; Sorbello, F. Road signs recognition using a dynamic pixel aggregation technique in the HSV color space. In Proceedings of the International Conference on Image Analysis and Processing ICIAP, Palermo, Italy, 26–28 September 2001; p. 0572. [Google Scholar]
- Li, C.; Luo, M.R.; Hunt, R.W.; Moroney, N.; Fairchild, M.D.; Newman, T. The performance of CIECAM02. In Proceedings of the Color and Imaging Conference, Scottland, AN, USA, 1 January 2002; pp. 28–32. [Google Scholar]
- Gao, X.W.; Podladchikova, L.; Shaposhnikov, D.; Hong, K.; Shevtsova, N. Recognition of traffic signs based on their colour and shape features extracted using human vision models. J. Vis. Commun. Image Represent. 2006, 17, 675–685. [Google Scholar] [CrossRef] [Green Version]
- Fatmehsari, Y.R.; Ghahari, A.; Zoroofi, R.A. Gabor wavelet for road sign detection and recognition using a hybrid classifier. In Proceedings of the 2010 International Conference on Multimedia Computing and Information Technology (MCIT), Sharjah, UAE, 2–4 March 2010; pp. 25–28. [Google Scholar]
- Hechri, A.; Mtibaa, A. Automatic detection and recognition of road sign for driver assistance system. In Proceedings of the 2012 16th IEEE Mediterranean Electrotechnical Conference (MELECON), Yasmine Hammamet, Tunisia, 25–28 March 2012; pp. 888–891. [Google Scholar]
- Saxena, P.; Gupta, N.; Laskar, S.Y.; Borah, P.P. A study on automatic detection and recognition techniques for road signs. Int. J. Comput. Eng. Res. 2015, 5, 24–28. [Google Scholar]
- Hu, Q.; Paisitkriangkrai, S.; Shen, C.; van den Hengel, A.; Porikli, F. Fast detection of multiple objects in traffic scenes with a common detection framework. IEEE Trans. Intell. Transp. Syst. 2016, 17, 1002–1014. [Google Scholar] [CrossRef]
- Zaklouta, F.; Stanciulescu, B. Real-time traffic-sign recognition using tree classifiers. IEEE Trans. Intell. Transp. Syst. 2012, 13, 1507–1514. [Google Scholar] [CrossRef]
- Yin, S.; Ouyang, P.; Liu, L.; Guo, Y.; Wei, S. Fast traffic sign recognition with a rotation invariant binary pattern based feature. Sensors 2015, 15, 2161–2180. [Google Scholar] [CrossRef] [PubMed]
- Gavrila, D.M. Traffic sign recognition revisited. In Mustererkennung 1999; Springer: Berlin, Germany, 1999; pp. 86–93. [Google Scholar]
- Kaur, S.; Singh, I. Comparison between edge detection techniques. Int. J. Comput. Appl. 2016, 145, 15–18. [Google Scholar] [CrossRef]
- Xu, S. Robust traffic sign shape recognition using geometric matching. IET Intell. Transp. Syst. 2009, 3, 10–18. [Google Scholar] [CrossRef]
- Barnes, N.; Zelinsky, A.; Fletcher, L.S. Real-time speed sign detection using the radial symmetry detector. IEEE Trans. Intell. Transp. Syst. 2008, 9, 322–332. [Google Scholar] [CrossRef]
- Deguchi, D.; Shirasuna, M.; Doman, K.; Ide, I.; Murase, H. Intelligent traffic sign detector: Adaptive learning based on online gathering of training samples. In Proceedings of the 2011 IEEE Intelligent Vehicles Symposium (IV), Baden-Baden, Germany, 5–9 June 2011; pp. 72–77. [Google Scholar]
- Houben, S. A single target voting scheme for traffic sign detection. In Proceedings of the 2011 IEEE Intelligent Vehicles Symposium (IV), Baden-Baden, Germany, 5–9 June 2011; pp. 124–129. [Google Scholar]
- Soetedjo, A.; Yamada, K. Improving the performance of traffic sign detection using blob tracking. IEICE Electron. Express 2007, 4, 684–689. [Google Scholar] [CrossRef] [Green Version]
- Viola, P.; Jones, M. Rapid object detection using a boosted cascade of simple features. In Proceedings of the 2001 IEEE Computer Society Conference on Computer Vision and Pattern Recognition, CVPR 2001, Kauai, HI, USA, 8–14 December 2001; pp. 511–518. [Google Scholar]
- Ruta, A.; Li, Y.; Liu, X. Towards Real-Time Traffic Sign Recognition by Class-Specific Discriminative Features. In Proceedings of the British Machine Vision Conference, Warwick, UK, 10–13 September 2007. [Google Scholar]
- Prisacariu, V.A.; Timofte, R.; Zimmermann, K.; Reid, I.; Van Gool, L. Integrating object detection with 3D tracking towards a better driver assistance system. In Proceedings of the 2010 20th International Conference on Pattern Recognition (ICPR), Istanbul, Turkey, 23–26 August 2010; pp. 3344–3347. [Google Scholar]
- Zhu, Z.; Lu, J.; Martin, R.R.; Hu, S. An optimization approach for localization refinement of candidate traffic signs. IEEE Trans. Intell. Transp. Syst. 2017, 18, 3006–3016. [Google Scholar] [CrossRef]
- Bahlmann, C.; Zhu, Y.; Ramesh, V.; Pellkofer, M.; Koehler, T. A system for traffic sign detection, tracking, and recognition using color, shape, and motion information. In Proceedings of the Intelligent Vehicles Symposium, Las Vegas, NY, USA, 6–8 June 2005; pp. 255–260. [Google Scholar]
- Chiang, H.-H.; Chen, Y.-L.; Wang, W.-Q.; Lee, T.-T. Road speed sign recognition using edge-voting principle and learning vector quantization network. In Proceedings of the 2010 International Computer Symposium (ICS), Tainan, Taiwan, 16–18 December 2010; pp. 246–251. [Google Scholar]
- Gu, Y.; Yendo, T.; Tehrani, M.P.; Fujii, T.; Tanimoto, M. Traffic sign detection in dual-focal active camera system. In Proceedings of the 2011 IEEE Intelligent Vehicles Symposium (IV), Baden-Baden, Germany, 5–9 June 2011; pp. 1054–1059. [Google Scholar]
- Wang, G.; Ren, G.; Wu, Z.; Zhao, Y.; Jiang, L. A robust, coarse-to-fine traffic sign detection method. In Proceedings of the 2013 International Joint Conference on Neural Networks (IJCNN), Dallas, TX, USA, 4–9 August 2013; pp. 1–5. [Google Scholar]
- Loy, G.; Barnes, N. Fast shape-based road sign detection for a driver assistance system. In Proceedings of the 2004 IEEE/RSJ International Conference on Intelligent Robots and Systems, (IROS 2004), Sendai, Japan, 28 September–2 October 2004; pp. 70–75. [Google Scholar]
- Pettersson, N.; Petersson, L.; Andersson, L. The histogram feature-a resource-efficient weak classifier. In Proceedings of the 2008 IEEE Intelligent Vehicles Symposium, Eindhoven, The Netherlands, 4–6 June 2008; pp. 678–683. [Google Scholar]
- Xie, Y.; Liu, L.-F.; Li, C.-H.; Qu, Y.-Y. Unifying visual saliency with HOG feature learning for traffic sign detection. In Proceedings of the 2009 IEEE Intelligent Vehicles Symposium, Xi’an, China, 3–5 June 2009; pp. 24–29. [Google Scholar]
- Creusen, I.M.; Wijnhoven, R.G.; Herbschleb, E.; de With, P. Color exploitation in hog-based traffic sign detection. In Proceedings of the 2010 IEEE International Conference on Image Processing, Hong Kong, China, 26–29 September 2010; pp. 2669–2672. [Google Scholar]
- Overett, G.; Petersson, L. Large scale sign detection using HOG feature variants. In Proceedings of the 2011 IEEE Intelligent Vehicles Symposium (IV), Baden-Baden, Germany, 5–9 June 2011; pp. 326–331. [Google Scholar]
- Hoferlin, B.; Zimmermann, K. Towards reliable traffic sign recognition. In Proceedings of the Intelligent Vehicles Symposium, Xi’an, China, 3–5 June 2009; pp. 324–329. [Google Scholar]
- Hannan, M.A.; Hussain, A.; Samad, S.A. Decision fusion via integrated sensing system for a smart airbag deployment scheme. Sens. Mater. 2011, 23, 179–193. [Google Scholar]
- Fu, M.-Y.; Huang, Y.-S. A survey of traffic sign recognition. In Proceedings of the 2010 International Conference on Wavelet Analysis and Pattern Recognition (ICWAPR), Qingdao, China, 11–14 July 2010; pp. 119–124. [Google Scholar]
- Lafuente-Arroyo, S.; Maldonado-Bascon, S.; Gil-Jimenez, P.; Acevedo-Rodriguez, J.; Lopez-Sastre, R. A tracking system for automated inventory of road signs. In Proceedings of the 2007 IEEE Intelligent Vehicles Symposium, Istanbul, Turkey, 13–15 June 2007; pp. 166–171. [Google Scholar]
- Lafuente-Arroyo, S.; Maldonado-Bascon, S.; Gil-Jimenez, P.; Gomez-Moreno, H.; Lopez-Ferreras, F. Road sign tracking with a predictive filter solution. In Proceedings of the IECON 2006—32nd Annual Conference on IEEE Industrial Electronics, Paris, France, 6–10 November 2006; pp. 3314–3319. [Google Scholar]
- Wali, S.B.; Hannan, M.A.; Hussain, A.; Samad, S.A. An automatic traffic sign detection and recognition system based on colour segmentation, shape matching, and svm. Math. Probl. Eng. 2015, 2015, 250461. [Google Scholar] [CrossRef]
- Garcia-Garrido, M.; Ocaña, M.; Llorca, D.F.; Sotelo, M.; Arroyo, E.; Llamazares, A. Robust traffic signs detection by means of vision and V2I communications. In Proceedings of the 2011 14th International IEEE Conference on Intelligent Transportation Systems (ITSC), Washington, DC, USA, 5–7 October 2011; pp. 1003–1008. [Google Scholar]
- Fang, C.-Y.; Chen, S.-W.; Fuh, C.-S. Road-sign detection and tracking. IEEE Trans. Veh. Technol. 2003, 52, 1329–1341. [Google Scholar] [CrossRef]
- Ohara, H.; Nishikawa, I.; Miki, S.; Yabuki, N. Detection and recognition of road signs using simple layered neural networks. In Proceedings of the 9th International Conference on Neural Information Processing, ICONIP’02, Singapore, 18–22 November 2002; pp. 626–630. [Google Scholar]
- Torresen, J.; Bakke, J.W.; Sekanina, L. Efficient recognition of speed limit signs. In Proceedings of the 7th International IEEE Conference on Intelligent Transportation Systems, Washington, WA, USA, 3–6 October 2004; pp. 652–656. [Google Scholar]
- Greenhalgh, J.; Mirmehdi, M. Traffic sign recognition using MSER and random forests. In Proceedings of the 2012 20th European Signal Processing Conference (EUSIPCO), Bucharest, Romania, 27–31 August 2012; pp. 1935–1939. [Google Scholar]
- Greenhalgh, J.; Mirmehdi, M. Real-time detection and recognition of road traffic signs. IEEE Trans. Intell. Transp. Syst. 2012, 13, 1498–1506. [Google Scholar] [CrossRef]
- Zaklouta, F.; Stanciulescu, B. Real-time traffic sign recognition using spatially weighted HOG trees. In Proceedings of the 2011 15th International Conference on Advanced Robotics (ICAR), Tallinn, Estonia, 20–23 June 2011; pp. 61–66. [Google Scholar]
- Zaklouta, F.; Stanciulescu, B. Segmentation masks for real-time traffic sign recognition using weighted HOG-based trees. In Proceedings of the 2011 14th International IEEE Conference on Intelligent Transportation Systems (ITSC), Washington, DC, USA, 5–7 October 2011; pp. 1954–1959. [Google Scholar]
- Zaklouta, F.; Stanciulescu, B. Real-time traffic sign recognition in three stages. Robot. Auton. Syst. 2014, 62, 16–24. [Google Scholar] [CrossRef]
- Zaklouta, F.; Stanciulescu, B. Warning traffic sign recognition using a HOG-based Kd tree. In Proceedings of the 2011 IEEE Intelligent Vehicles Symposium (IV), Baden-Baden, Germany, 5–9 June 2011; pp. 1019–1024. [Google Scholar]
- Aoyagi, Y.; Asakura, T. A study on traffic sign recognition in scene image using genetic algorithms and neural networks. In Proceedings of the 1996 IEEE IECON 22nd International Conference on Industrial Electronics, Control, and Instrumentation, Taipei, Taiwan, 9 August 1996; pp. 1838–1843. [Google Scholar]
- De La Escalera, A.; Armingol, J.M.; Salichs, M. Traffic sign detection for driver support systems. In Proceedings of the International Conference on Field and Service Robotics, Helsinki, Finland, 6–8 June 2001. [Google Scholar]
- Hannan, M.; Hussain, A.; Samad, S.; Ishak, K.; Mohamed, A. A Unified Robust Algorithm for Detection of Human and Non-human Object in Intelligent Safety Application. World Acad. Sci. Eng. Technol. Int. J. Comput. Electr. Autom. Control Inf. Eng. 2008, 2, 3838–3845. [Google Scholar]
- Ugolotti, R.; Nashed, Y.S.G.; Cagnoni, S. Real-Time GPU Based Road Sign Detection and Classification. In Parallel Problem Solving from Nature—PPSN XII; Coello, C.A.C., Cutello, V., Deb, K., Forrest, S., Nicosia, G., Pavone, M., Eds.; Springer: Berlin/Heidelberg, Germany, 2012; pp. 153–162. [Google Scholar]
- CireşAn, D.; Meier, U.; Masci, J.; Schmidhuber, J. Multi-column deep neural network for traffic sign classification. Neural Netw. 2012, 32, 333–338. [Google Scholar] [CrossRef] [Green Version]
- Fang, C.-Y.; Fuh, C.-S.; Yen, P.; Cherng, S.; Chen, S.-W. An automatic road sign recognition system based on a computational model of human recognition processing. Comput. Vis. Image Underst. 2004, 96, 237–268. [Google Scholar] [CrossRef]
- Broggi, A.; Cerri, P.; Medici, P.; Porta, P.P.; Ghisio, G. Real time road signs recognition. In Proceedings of the 2007 IEEE Intelligent Vehicles Symposium, Istanbul, Turkey, 13–15 June 2007; pp. 981–986. [Google Scholar]
- Li, L.-B.; Ma, G.-F. Detection and classification of traffic signs in natural environments. J. Harbin Inst. Technol. 2009, 41, 682–687. [Google Scholar]
- Sheng, Y.; Zhang, K.; Ye, C.; Liang, C.; Li, J. Automatic detection and recognition of traffic signs in stereo images based on features and probabilistic neural networks. In Proceedings of the Optical and Digital Image Processing, Strasbourg, France, 25 April 2008; p. 70001I. [Google Scholar]
- Fištrek, T.; Lončarić, S. Traffic sign detection and recognition using neural networks and histogram based selection of segmentation method. In Proceedings of the 2011 ELMAR, Zadar, Croatia, 14–16 September 2011; pp. 51–54. [Google Scholar]
- Carrasco, J.-P.; de la Escalera, A.D.L.E.; Armingol, J.M. Recognition stage for a speed supervisor based on road sign detection. Sensors 2012, 12, 12153–12168. [Google Scholar] [CrossRef]
- Kim, H.-K.; Park, J.H.; Jung, H.-Y. An Efficient Color Space for Deep-Learning Based Traffic Light Recognition. J. Adv. Transp. 2018, 2018, 2365414. [Google Scholar] [CrossRef]
- Zhu, Y.; Liao, M.; Yang, M.; Liu, W. Cascaded Segmentation-Detection Networks for Text-Based Traffic Sign Detection. IEEE Trans. Intell. Transp. Syst. 2018, 19, 209–219. [Google Scholar] [CrossRef]
- Qian, R.; Zhang, B.; Yue, Y.; Wang, Z.; Coenen, F. Robust Chinese traffic sign detection and recognition with deep convolutional neural network. In Proceedings of the 2015 11th International Conference on Natural Computation (ICNC), Zhangjiajie, China, 15–17 August 2015; pp. 791–796. [Google Scholar]
- Kumar, A.D. Novel deep learning model for traffic sign detection using capsule networks. arXiv 2018, arXiv:1805.04424. [Google Scholar]
- Ciresan, D.C.; Meier, U.; Masci, J.; Schmidhuber, J. A committee of neural networks for traffic sign classification. In Proceedings of the IJCNN, San Jose, CA, USA, 31 July–5 August 2011; pp. 1918–1921. [Google Scholar]
- Sermanet, P.; LeCun, Y. Traffic sign recognition with multi-scale Convolutional Networks. In Proceedings of the IJCNN, San Jose, CA, USA, 31 July–5 August 2011; pp. 2809–2813. [Google Scholar]
- Lee, H.S.; Kim, K. Simultaneous traffic sign detection and boundary estimation using convolutional neural network. IEEE Trans. Intell. Transp. Syst. 2018, 19, 1652–1663. [Google Scholar] [CrossRef]
- Jin, J.; Fu, K.; Zhang, C. Traffic sign recognition with hinge loss trained convolutional neural networks. IEEE Trans. Intell. Transp. Syst. 2014, 15, 1991–2000. [Google Scholar] [CrossRef]
- Abdi, L.; Meddeb, A. Deep learning traffic sign detection, recognition and augmentation. In Proceedings of the Symposium on Applied Computing, Marrakech, Morocco, 3–7 April 2017; pp. 131–136. [Google Scholar]
- Aghdam, H.H.; Heravi, E.J.; Puig, D. A practical approach for detection and classification of traffic signs using convolutional neural networks. Robot. Auton. Syst. 2016, 84, 97–112. [Google Scholar] [CrossRef]
- Li, J.; Liang, X.; Wei, Y.; Xu, T.; Feng, J.; Yan, S. Perceptual generative adversarial networks for small object detection. In Proceedings of the IEEE Conference on Computer Vision and Pattern Recognition, Honolulu, HI, USA, 21–26 July 2017; pp. 1222–1230. [Google Scholar]
- Lai, Y.; Wang, N.; Yang, Y.; Lin, L. Traffic Signs Recognition and Classification based on Deep Feature Learning. In Proceedings of the ICPRAM, Medea, Algeria, 24–25 November 2018; pp. 622–629. [Google Scholar]
- Lim, K.; Hong, Y.; Choi, Y.; Byun, H. Real-time traffic sign recognition based on a general purpose GPU and deep-learning. PLoS ONE 2017, 12, e0173317. [Google Scholar] [CrossRef] [PubMed]
- Freund, Y.; Schapire, R.E. A decision-theoretic generalization of on-line learning and an application to boosting. J. Comput. Syst. Sci. 1997, 55, 119–139. [Google Scholar] [CrossRef]
- Li, Y.; Pankanti, S.; Guan, W. Real-time traffic sign detection: An evaluation study. In Proceedings of the 2010 20th International Conference on Pattern Recognition (ICPR), Istanbul, Turkey, 23–26 August 2010; pp. 3033–3036. [Google Scholar]
- Chen, L.; Li, Q.; Li, M.; Mao, Q. Traffic sign detection and recognition for intelligent vehicle. In Proceedings of the 2011 IEEE Intelligent Vehicles Symposium (IV), Baden-Baden, Germany, 5–9 June 2011; pp. 908–913. [Google Scholar]
- Lin, C.-C.; Wang, M.-S. Road sign recognition with fuzzy adaptive pre-processing models. Sensors 2012, 12, 6415–6433. [Google Scholar] [CrossRef]
- Huang, Y.-S.; Le, Y.-S.; Cheng, F.-H. A method of detecting and recognizing speed-limit signs. In Proceedings of the 2012 Eighth International Conference on Intelligent Information Hiding and Multimedia Signal Processing (IIH-MSP), Piraeus, Greece, 18–20 July 2012; pp. 371–374. [Google Scholar]
- Chen, L.; Li, Q.; Li, M.; Zhang, L.; Mao, Q. Design of a multi-sensor cooperation travel environment perception system for autonomous vehicle. Sensors 2012, 12, 12386–12404. [Google Scholar] [CrossRef]
- Liu, C.; Li, S.; Chang, F.; Dong, W. Supplemental Boosting and Cascaded ConvNet Based Transfer Learning Structure for Fast Traffic Sign Detection in Unknown Application Scenes. Sensors 2018, 18, 2386. [Google Scholar] [CrossRef]
- Gomes, S.L.; Rebouças, E.D.S.; Neto, E.C.; Papa, J.P.; de Albuquerque, V.H.; Rebouças Filho, P.P.; Tavares, J.M.R. Embedded real-time speed limit sign recognition using image processing and machine learning techniques. Neural Comput. Appl. 2017, 28, 573–584. [Google Scholar] [CrossRef]
- Soendoro, D.; Supriana, I. Traffic sign recognition with Color-based Method, shape-arc estimation and SVM. In Proceedings of the 2011 International Conference on Electrical Engineering and Informatics (ICEEI), Bandung, Indonesia, 17–19 July 2011; pp. 1–6. [Google Scholar]
- Siyan, Y.; Xiaoying, W.; Qiguang, M. Road-sign segmentation and recognition in natural scenes. In Proceedings of the 2011 IEEE International Conference on Signal Processing, Communications and Computing (ICSPCC), Xi’an, China, 14–16 September 2011; pp. 1–4. [Google Scholar]
- Bascón, S.M.; Rodríguez, J.A.; Arroyo, S.L.; Caballero, A.F.; López-Ferreras, F. An optimization on pictogram identification for the road-sign recognition task using SVMs. Comput. Vis. Image Underst. 2010, 114, 373–383. [Google Scholar] [CrossRef]
- Martinović, A.; Glavaš, G.; Juribašić, M.; Sutić, D.; Kalafatić, Z. Real-time detection and recognition of traffic signs. In Proceedings of the 2010 Proceedings of the 33rd International Convention (MIPRO), Opatija, Croatia, 24–28 May 2010; pp. 760–765. [Google Scholar]
- Min, K.-I.; Oh, J.-S.; Kim, B.-W. Traffic sign extract and recognition on unmanned vehicle using image processing based on support vector machine. In Proceedings of the 2011 11th International Conference on Control, Automation and Systems (ICCAS), Gyeonggi-do, Korea, 26–29 October 2011; pp. 750–753. [Google Scholar]
- Bui-Minh, T.; Ghita, O.; Whelan, P.F.; Hoang, T. A robust algorithm for detection and classification of traffic signs in video data. In Proceedings of the 2012 International Conference on Control, Automation and Information Sciences (ICCAIS), Ho Chi Minh City, Vietnam, 26–29 November 2012; pp. 108–113. [Google Scholar]
- Park, J.-G.; Kim, K.-J. Design of a visual perception model with edge-adaptive Gabor filter and support vector machine for traffic sign detection. Expert Syst. Appl. 2013, 40, 3679–3687. [Google Scholar] [CrossRef]
- Chang, X.; Yu, Y.-L.; Yang, Y.; Xing, E.P. Semantic pooling for complex event analysis in untrimmed videos. IEEE Trans. Pattern Anal. Mach. Intell. 2017, 39, 1617–1632. [Google Scholar] [CrossRef]
- Yang, L.; Kwon, K.-R.; Moon, K.; Lee, S.-H.; Kwon, S.-G. Broken traffic sign recognition based on local histogram matching. In Proceedings of the Computing, Communications and Applications Conference (ComComAp), Hong Kong, China, 11–13 January 2012; pp. 415–419. [Google Scholar]
- Sebanja, I.; Megherbi, D. Automatic detection and recognition of traffic road signs for intelligent autonomous unmanned vehicles for urban surveillance and rescue. In Proceedings of the 2010 IEEE International Conference on Technologies for Homeland Security (HST), Waltham, MA, USA, 8–10 November 2010; pp. 132–138. [Google Scholar]
- Huang, Y.-S.; Fu, M.-Y.; Ma, H.-B. A combined method for traffic sign detection and classification. In Proceedings of the 2010 Chinese Conference on Pattern Recognition (CCPR), Chongqing, China, 21–23 October 2010; pp. 1–5. [Google Scholar]
- Soheilian, B.; Paparoditis, N.; Vallet, B. Detection and 3D reconstruction of traffic signs from multiple view color images. ISPRS J. Photogramm. Remote Sens. 2013, 77, 1–20. [Google Scholar] [CrossRef]
- Pei, D.; Sun, F.; Liu, H. Supervised low-rank matrix recovery for traffic sign recognition in image sequences. IEEE Signal Process. Lett. 2013, 20, 241–244. [Google Scholar] [CrossRef]
- Gonzalez-Reyna, S.E.; Avina-Cervantes, J.G.; Ledesma-Orozco, S.E.; Cruz-Aceves, I. Eigen-gradients for traffic sign recognition. Math. Probl. Eng. 2013, 2013, 364305. [Google Scholar] [CrossRef]
- Măriuţ, F.; Foşalău, C.; Zet, C.; Petrişor, D. Experimental traffic sign detection using I2V communication. In Proceedings of the 2012 35th International Conference on Telecommunications and Signal Processing (TSP), Prague, Czech Republic, 3–4 July 2012; pp. 141–145. [Google Scholar]
- Wang, W.; Wei, C.-H.; Zhang, L.; Wang, X. Traffic-signs recognition system based on multi-features. In Proceedings of the 2012 IEEE International Conference on Computational Intelligence for Measurement Systems and Applications (CIMSA), Tianjin, China, 2–4 July 2012; pp. 120–123. [Google Scholar]
- Islam, K.T.; Raj, R.G. Real-time (vision-based) road sign recognition using an artificial neural network. Sensors 2017, 17, 853. [Google Scholar] [CrossRef]
- Khan, J.; Yeo, D.; Shin, H. New dark area sensitive tone mapping for deep learning based traffic sign recognition. Sensors 2018, 18, 3776. [Google Scholar] [CrossRef] [PubMed]
- Laguna, R.; Barrientos, R.; Blázquez, L.F.; Miguel, L.J. Traffic sign recognition application based on image processing techniques. IFAC Proc. Vol. 2014, 47, 104–109. [Google Scholar] [CrossRef]


| Country | US | Japan | Pakistan | Ethiopia | Libya | New Guinea |
|---|---|---|---|---|---|---|
| Sign |  |  |  |  |  |  |
| Dataset | Country | Classes | TS Scenes | TS Images | Image Size (px) | Sign Size (px) | Include Videos |
|---|---|---|---|---|---|---|---|
| GTSDRB (2012 and 2013) | Germany | 43 | 9000 | 39,209 (training), 12,630 (testing) | 15 × 15 to 250 × 250 | 15 × 15 to 250 × 250 | No |
| KULD (2009) | Belgium | 100+ | 9006 | 13,444 | 1628 × 1236 | 100 × 100 to 1628 × 1236 | Yes, 4 tracks |
| STSD (2011) | Sweden | 7 | 20,000 | 3488 | 1280 × 960 | 3 × 5 to 263 × 248 | No |
| RUGD (2003) | The Netherlands | 3 | 48 | 48 | 360 × 270 | N/A | No |
| Stereopolis (2010) | France | 10 | 847 | 251 | 1920 × 1080 | 25 × 25 to 204 × 159 | No |
| LISAD (2012) | US | 49 | 6610 | 7855 | 640 × 480 to 1024 × 52 | 6 × 6 to 167 × 168 | All annotations |
| UKOD (2012) | UK | 100+ | 43,509 | 1200 (synthetic) | 648 × 480 | 24 × 24 | No |
| RTSD (2013) | Russia | 140 | N/A | 80,000+ (synthetic) | 1280 × 720 | 30 × 30 | No |
| Techniques | Paper | Segmentation Methods | Advantages | Sign Type | No. of Test Images | Test Image Type |
|---|---|---|---|---|---|---|
| Color Thresholding Segmentation | [37] | RGB color segmentation | Simple | Any color | 2000 | N/A |
| [38] | RGB color segmentation with enhancement of color | Fast and high detection rate | Red, blue, yellow | 135 | Video data | |
| HSI/HSV Transform | [40] | HSI thresholding with addition for white signs | Segments adversely illuminated signs | Any color | N/A | High-res |
| [33] | HSI color-based segmentation | Simple and fast | Any color | N/A | N/A | |
| [41] | RGB to HSI transformation | Segments adversely illuminated signs | Any color | N/A | Low-res | |
| [42] | RGB to HSI transformation | N/A | Red | N/A | Low-res | |
| [43] | RGB to HSI transformation | N/A | Any color | 3028 | Low-res | |
| [44] | HSI color-based segmentation | Simple and high accuracy rate | Red, blue | N/A | Video data | |
| [45] | HSI color-based segmentation | Simple and real time application | Any color | 632 | High-res | |
| Region Growing | [48] | Started with seed and expand to group pixels with similar affinity | N/A | N/A | N/A | N/A |
| [47] | N/A | N/A | High-res | |||
| Color Indexing | [50] | Comparison of two any-color images is done by comparing their color histogram | Straightforward, fast method | Any color | N/A | Low-res |
| [49] | Any color | N/A | N/A | |||
| Dynamic Pixel Aggregation | [52] | Dynamic threshold in pixel aggregation on HSV color space | Hue instability reduced | Any color | 620 | Low-res |
| CIECAM97 Model | [54] | RGB to CIE XYZ transformation, then to LCH space using CIECAM97 model | Invariant in different lighting conditions | Red, blue | N/A | N/A |
| YCbCr Color Space | [55] | RGB to YCbCr transformation then dynamic thresholding is performed in Cr component to extract red object | Simple and high accuracy | Red | 193 | N/A |
| [56] | High accuracy less processing time | Any color | N/A | Low-res |
| Technique | Paper | Overall Process | Recognition Feature | Advantages | Sign Type | No. of Test Image | Test Image Type |
|---|---|---|---|---|---|---|---|
| Hough Transform | [77] | Each pixel of edge image votes for the object center at object boundary | N/A | Invariant to in-plane rotation and viewing angle | Octagon, square, triangle | 45 | Low-res |
| [78] | AdaBoost | High accuracy | Any sign | N/A | Low-res | ||
| [79] | N/A | Robustness to illumination, scale, pose, viewpoint change and even partial occlusion | Red (circular), blue (square) | 500+ | Low-res | ||
| [80] | N/A | Reducing memory consumption and increasing utilization Hough-based SVM | Any sign | 3000 | High-res | ||
| [81] | N/A | Robustness | Red (circular) | N/A | 768 × 580 | ||
| [59] | Random Forest | Improve efficiency of K-d tree, random forest and SVM | Triangular and circular | 14,763 | 752 × 480 px | ||
| [82] | SIFT and SURF based MLP | Applying another state refinement | Red circular | N/A | Video data | ||
| Similarity Detection | [52] | Computes a region and sets binary samples for representing each traffic sign shape. | NN | Straight forward method | Any color | 620 | Low-res |
| DTM | [61] | Capturing object shape by template hierarchy. | RBF Network | Detects objects of arbitrary shape | Circular and triangular | 1000 | 360 × 288 px |
| Edge Detection Feature | [63] | A set of connected curves is found which indicates the boundaries of objects within the image. | Geometric matching | Invariant in translation, rotation and scaling | Any color | 1000 | 640 × 480 |
| [64] | Normalized cross correlation | Reliability and high accuracy in real time | Speed limit sign | N/A | 320 × 240 px video data | ||
| [65] | N/A | Improved accuracy by training negative sample | Red (circular) | 3907 | Low-res | ||
| [66] | N/A | Invariant in noise and lighting | Triangle, circular | 847 | High-res | ||
| [67] | CDT | Invariant in noise and illumination | Red, blue, yellow | ||||
| Edges with Haar-like Features | [69] | Sums three pixel intensities and calculates the difference of sums by Haar-like features | CDT | Smoother and noise invariant | Rectangular, any color | Video data | |
| [70] | SVM | Fast method | Circular, triangular upside-down, rectangle and diamond | 640 × 480 px video data |
| Technique | Paper | Advantages | Performance |
|---|---|---|---|
| Kalman Filter | [82] | For avoiding incorrect assignment, rule-based approach utilizing combined distance direction difference is used. | N/A |
| [89] | Takes less time in tracking and verifying | Using 320 × 240 pixel images, takes 0.1 s to 0.2 s. | |
| [88] | Used stereo parameters to reduce the error of stereo measurement | N/A | |
| Advanced Kalman Filter | [85] | Fast and advanced method, high detection and tracking rate | Using 400 × 300 pixel images, can process 3.26 frames per second. |
| Ref | Detection Feature | Advantages | True Positive Rate | False Positive Rate | No. of Test Images | Overall Accuracy | Time |
|---|---|---|---|---|---|---|---|
| [90] | RGB to HSV then contrast stretching | Fast and straight forward method | N/A | N/A | N/A | <95% | N/A |
| [91] | N/A | N/A | N/A | 100 | 90.9% | N/A |
| Ref | Detection Feature | Advantages | True Positive Rate | False Positive Rate | No. of Test Images | Overall Accuracy | Time | Dataset |
|---|---|---|---|---|---|---|---|---|
| [94] | HOG based SVM | Used GTSRB and ETH 80 dataset and compared | 90.9% | N/A | 12,569 | 90.46% | 17.9 ms | GTSRB and ETH 80 |
| [95,96] | Used Gaussian weighting in HOG to improve performance by 15% | 90% | N/A | 12,569 | 97.2% | 17.9 ms | Own created | |
| [92] | MSER based HOG | Eliminating hand labeled database, robust to various lighting and illumination | 83.3% | 0.85 | 640 × 480 px video data | 87.72% | N/A | Own created |
| [97] | HOG | Remove false alarm up to 94% | N/A | N/A | 12,569 | 92.7% | 17.9 ms | Own created |
| Ref | Detection Feature | Advantages | True Positive Rate | False Positive Rate | No. of Test Images | Overall Accuracy | Time |
|---|---|---|---|---|---|---|---|
| [98,99] | Genetic Algorithm | Unaffected by illumination problem | N/A | N/A | Video data | N/A | N/A |
| Ref | Detection Feature | Advantages | True Positive Rate | False Positive Rate | No. of Test Images | Overall Accuracy | Time | Dataset |
|---|---|---|---|---|---|---|---|---|
| [56] | YCbCr and normalized cross correlation | Robustness and adaptability | 0.96 | 0.08 | 640 × 480 px video data | 97.6% | 0.2 s | Own created |
| [101] | N/A | Flexibility and high accuracy | N/A | N/A | N/A | 98.52–99.46% | N/A | Own created |
| [106] | Adaptive shape analysis | Invariant in illumination | N/A | N/A | 220 | 95.4% | 0.6 s | Own created |
| [107] | NN | Robustness | N/A | N/A | 467 | N/A | N/A | Own created |
| [108] | Bimodal binarization and thresholding | Compared TM and NN elaborately | 0.96 | 0.08 | 640 × 480 px video data | 97.6% | 0.2 s | Own created |
| Ref | Detection Feature | Advantages | True Positive Rate | False Positive Rate | No. of Test Images | Overall Accuracy | Time | Dataset |
|---|---|---|---|---|---|---|---|---|
| [115] | Object bounding box prediction | Predicting position and precise boundary simultaneously | >0.88 mPA | <3 pixels | 3,719 | 91.95% | N/A | GTSDB |
| [120] | YCbCr model | High accuracy and speed | N/A | N/A | Video data | 98.6% | N/A | Own created |
| [111] | Color space thresholding | Implementing detection and classification | 90.2% | 2.4% | 20,000 | 95% | N/A | GTSRB |
| [121] | SVM | Robust against illumination changes | N/A | N/A | Video data | 97.9% | N/A | Own created |
| [117] | Scanning window with a Haar cascade detector | Enhanced detection capability with good time performance | N/A | N/A | 16,630 | 99.36% | N/A | GTSRB |
| Ref | Detection Feature | Advantages | True Positive Rate | False Positive Rate | No. of Test Images | Overall Accuracy | Time | Dataset |
|---|---|---|---|---|---|---|---|---|
| [123] | Sobel edge detection | Comparison of SVM and AdaBoost | N/A | 0.25 | N/A | 92% | N/A | Own created |
| [124] | AdaBoost | Fast | N/A | N/A | 200 | >90% | 50 ms | Own created |
| [125] | AdaBoost | Invariant in speed, illumination and viewing angle | 92.47% | 0% | 350 | 94% | 51.86 ms | Own created |
| [126] | AdaBoost and CHT | Real-time and robust system with efficient SLS detection and recognition | 0.97 | 0.26 | 1850 | 94.5% | 30–40 ms | Own created |
| [127] | Haar-like method | Reliability and accuracy | 0.9 | 0.4 | 200 | 92.7% | 50 ms | Own created |
| Ref | Detection Feature | Advantages | True Positive Rate | False Positive Rate | No. of Test Images | Overall Accuracy | Time | Dataset |
|---|---|---|---|---|---|---|---|---|
| [44] | DtBs and SVM | Fast, high accuracy | N/A | N/A | Video data | 92.3% | N/A | GRAM |
| [55] | Gabor Filter | Simple and high accuracy | N/A | N/A | 58 | 93.1% | N/A | Own created |
| [130] | CIELab and Ramer–Douglas–Peucker algorithm | Illumination proof and high accuracy | N/A | N/A | 405 | 97% | N/A | Own created |
| [131] | RGB to HSI then shape analysis | Less processing time | N/A | N/A | 92.6% | Avg. 5.67 s | Own created | |
| [88] | Hough transform | Reliability and accuracy | N/A | N/A | Video data | Avg. 92.3% | 35 ms | Own created |
| [132] | RGB to HIS then shape localization | Reduce the memory space and time for testing new sample | N/A | N/A | N/A | 95% | N/A | Own created |
| [133] | MSER | Invariant in illumination and lighting condition | 0.97 | 0.85 | 43,509 | 89.2% | N/A | Own created |
| [134] | HSI and edge detection | Less processing time | N/A | N/A | Video data | N/A | N/A | Own created |
| [135] | RGB to HSI | Identify the optimal image attributes | 0.867 | 0.12 | 650 | 86.7% | 0.125 s | Own created |
| [136] | Edge Adaptive Gabor Filtering | Reliability and Robustness | 85.93% | 11.62% | 387 | 95.8%. | 3.5–5 ms | Own created |
| Ref | Method | Detection Feature | Advantages | True Positive Rate | False Positive Rate | No. of Test Images | Overall Accuracy | Time | Dataset |
|---|---|---|---|---|---|---|---|---|---|
| [138] | SIFT matching | N/A | Effective in recognizing low light and damaged signs | N/A | N/A | 60 | N/A | N/A | Own created |
| [34] | Fringe-adjusted joint Transform Correlation | Color Feature Extraction using Gabor Filter | Excellent discrimination ability between object and non-object | 783 | 217 | 587 | N/A | N/A | Own created |
| [139] | Principal Component Analysis | HSV, CIECAM97 and PCA | High accuracy rate | N/A | N/A | N/A | 99.2% | 2.5 s | Own created |
| [140] | Improved Fast Radial Symmetry and Pictogram Distribution Histogram based SVM | RGB to LaB color space then IFRS detection | High accuracy rate | N/A | N/A | 300 | 96.93% | N/A | Own created |
| [144] | Infrastructures of vehicles | N/A | Eliminating possibility of false positive rate because of ID coding | N/A | N/A | Video data | N/A. | N/A | Own created |
| [145] | FCM and Content Based Image Recorder | Fuzzy c means (FCM) | Effective in real time application | N/A | N/A | Video data | <80% | N/A | Own created |
| [141] | Template matching and 3D reconstruction algorithm | N/A | Very effective in recognizing damaged or occulted road signs | In 3D, 54 out of 63 | In 3D, 6 out of 63 and 3 signs were missing | 4800 | N/A | N/A | Own created |
| [142] | Low Rank Matrix Recovery (LRMR) | N/A | Fast computation and parallel execution | N/A | N/A | 40,000 | 97.51% | >0.2 | GTSRB |
| [143] | Karhunen–Loeve Transform and MLP | Oriented gradient maps | Invariant in illumination an different lighting condition | N/A | N/A | 12,600 | 95.9% | 0.0054 s/image | GTSRB |
| [35] | Self-Organizing Map | N/A | Fast and accurate | N/A | N/A | N/A | <99% | N/A | Own created |
© 2019 by the authors. Licensee MDPI, Basel, Switzerland. This article is an open access article distributed under the terms and conditions of the Creative Commons Attribution (CC BY) license (http://creativecommons.org/licenses/by/4.0/).
Share and Cite
Wali, S.B.; Abdullah, M.A.; Hannan, M.A.; Hussain, A.; Samad, S.A.; Ker, P.J.; Mansor, M.B. Vision-Based Traffic Sign Detection and Recognition Systems: Current Trends and Challenges. Sensors 2019, 19, 2093. https://doi.org/10.3390/s19092093
Wali SB, Abdullah MA, Hannan MA, Hussain A, Samad SA, Ker PJ, Mansor MB. Vision-Based Traffic Sign Detection and Recognition Systems: Current Trends and Challenges. Sensors. 2019; 19(9):2093. https://doi.org/10.3390/s19092093
Chicago/Turabian StyleWali, Safat B., Majid A. Abdullah, Mahammad A. Hannan, Aini Hussain, Salina A. Samad, Pin J. Ker, and Muhamad Bin Mansor. 2019. "Vision-Based Traffic Sign Detection and Recognition Systems: Current Trends and Challenges" Sensors 19, no. 9: 2093. https://doi.org/10.3390/s19092093