
Understanding the Potential of WO3 Based Sensors for Breath Analysis

Abstract
:1. Introduction
2. Biomarkers
2.1. Ethanol (C2H6O)
2.2. Acetone (C3H6O)
2.3. Ammonia (NH3)
2.4. Toluene (C7H8)
2.5. Nitrogen Monoxide (NO)
2.6. Hydrogen Sulfide (H2S)
3. Conclusions
Conflicts of Interest
References
- Dweik, R.; Amann, A. NIH Public Access. J Breath Res. 2008, 2, 1–6. [Google Scholar]
- Pauling, L.; Robinson, A.B.; Teranishi, R.; Cary, P. Quantitative analysis of urine vapor and breath by gas-liquid partition chromatography. Proc. Natl. Acad. Sci. USA 1971, 68, 2374–2376. [Google Scholar] [CrossRef] [PubMed]
- Risby, T.H.; Pleil, J.D. Breath analysis-past, present and future: A special issue in honour of Michael Phillips’ 70th birthday. J. Breath Res. 2013, 7, 10201. [Google Scholar] [CrossRef] [PubMed]
- Phillips, M.; Greenberg, J.; Sabas, M. Alveolar gradient of pentane in normal human breath. Free Radic. Res. 1994, 20, 333–337. [Google Scholar] [CrossRef] [PubMed]
- Drobek, M.; Kim, J.H.; Bechelany, M.; Vallicari, C.; Julbe, A.; Kim, S.S. MOF-Based Membrane Encapsulated ZnO Nanowires for Enhanced Gas Sensor Selectivity. ACS Appl. Mater. Interfaces 2016, 8, 8323–8328. [Google Scholar] [CrossRef] [PubMed]
- Liu, Y.; Yao, S.; Yang, Q.; Sun, P.; Gao, Y.; Liang, X.; Liu, F.; Lu, G. Highly sensitive and humidity-independent ethanol sensors based on In2O3 flower/SnO2 nanoparticle composites. RSC Adv. 2015, 5, 52252–52258. [Google Scholar] [CrossRef]
- Righettoni, M.; Amann, A.; Pratsinis, S.E. Breath analysis by nanostructured metal oxides as chemo-resistive gas sensors. Mater. Today 2015, 18, 163–171. [Google Scholar] [CrossRef]
- Righettoni, M.; Tricoli, A.; Gass, S.; Schmid, A.; Amann, A.; Pratsinis, S.E. Breath acetone monitoring by portable Si:WO3 gas sensors. Anal. Chim. Acta 2012, 738, 69–75. [Google Scholar] [CrossRef] [PubMed]
- Labidi, A.; Gillet, E.; Delamare, R.; Maaref, M.; Aguir, K. Ethanol and ozone sensing characteristics of WO3 based sensors activated by Au and Pd. Sens. Actuators B Chem. 2006, 120, 338–345. [Google Scholar] [CrossRef]
- Ahmad, M.Z.; Kang, J.H.; Sadek, A.Z.; Moafi, A.; Sberveglieri, G.; Wlodarski, W. Synthesis of WO3 nanorod based thin films for ethanol and H2 Sensing. Procedia Eng. 2012, 47, 358–361. [Google Scholar] [CrossRef]
- Nayak, A.K.; Ghosh, R.; Santra, S.; Guha, P.K.; Pradhan, D. Hierarchical Nanostructured WO3-SnO2 for Selective Sensing of Volatile Organic Compounds. Nanoscale 2015, 7, 12460–12473. [Google Scholar] [CrossRef] [PubMed]
- Mitsubayashi, K.; Yokoyama, K.; Takeuchi, T.; Karube, I.; Takeuchl, T. Gas-Phase Biosensor for Ethanol. Anal. Chem. 1994, 66, 3297–3302. [Google Scholar] [CrossRef]
- Righettoni, M.; Ragnoni, A.; Güntner, A.T.; Loccioni, C.; Pratsinis, S.E.; Risby, T.H. Monitoring breath markers under controlled conditions. J. Breath Res. 2015, 9, 47101. [Google Scholar] [CrossRef] [PubMed]
- Li, X.-L.; Lou, T.-J.; Sun, X.-M.; Li, Y.-D. Highly Sensitive WO3 Hollow-Sphere Gas Sensors. Inorg. Chem. 2004, 43, 5442–5449. [Google Scholar] [CrossRef] [PubMed]
- Choi, K.-I.; Hwang, S.-J.; Dai, Z.; Kang, Y.C.; Lee, J.-H. Rh-catalyzed WO3 with anomalous humidity dependence of gas sensing characteristics. RSC Adv. 2014, 4, 53130–53136. [Google Scholar] [CrossRef]
- Righettoni, M.; Tricoli, A.; Pratsinis, S.E. Si:WO3 Sensors for Highly Selective Detection of Acetone for Easy Diagnosis of Diabetes by Breath Analysis. Anal. Chem. 2010, 82, 3581–3587. [Google Scholar] [CrossRef] [PubMed]
- Wang, L.; Teleki, A. Ferroelectric WO3 Nanoparticles for Acetone Selective Detection. Chem. Mater. 2008, 20, 4794–4796. [Google Scholar] [CrossRef]
- Kim, S.-J.; Choi, S.-J.; Jang, J.-S.; Kim, N.-H.; Hakim, M.; Tuller, H.L.; Kim, I.-D. Mesoporous WO3 Nanofibers with Protein Templated Nanoscale Catalysts for Detection of Trace Biomarkers in Exhaled Breath. ACS Nano 2016, 10, 5891–5899. [Google Scholar] [CrossRef] [PubMed]
- Deng, C.; Zhang, J.; Yu, X.; Zhang, W.; Zhang, X. Determination of acetone in human breath by gas chromatography-mass spectrometry and solid-phase microextraction with on-fiber derivatization. J. Chromatogr. B Anal. Technol. Biomed. Life Sci. 2004, 810, 269–275. [Google Scholar] [CrossRef]
- Maekawa, T.; Tamaki, J.; Miura, N.; Yamazoe, N. Gold-Loaded Tungsten Oxide Sensor for Detection of Ammonia in Air. Chem. Lett. 1992, 4, 639–642. [Google Scholar] [CrossRef]
- Llobet, E.; Molas, G.; Molinàs, P.; Calderer, J.; Vilanova, X.; Brezmes, J.; Sueiras, J.E.; Correig, X. Fabrication of Highly Selective Tungsten Oxide Ammonia Sensors. J. Electrochem. Soc. 2000, 147, 776. [Google Scholar] [CrossRef]
- Takács, M.; Dücső, C.; Lábadi, Z.; Pap, A.E. Effect of hexagonal WO3 morphology on NH3 sensing. Proc. Eng. 2014, 87, 1011–1014. [Google Scholar] [CrossRef]
- Wang, L.; Pfeifer, J.; Balázsi, C.; Gouma, P.I. Synthesis and Sensing Properties to NH3 of Hexagonal WO3 Metastable Nanopowders. Mater. Manuf. Process. 2007, 22, 773–776. [Google Scholar] [CrossRef]
- Jiménez, I.; Centeno, M.A.; Scotti, R.; Morazzoni, F.; Cornet, A.; Morante, J.R. NH3 Interaction with Catalytically Modified Nano-WO3 Powders for Gas Sensing Applications. J. Electrochem. Soc. 2003, 150, 72–80. [Google Scholar] [CrossRef]
- Davies, S.; Spanel, P.; Smith, D. Quantitative analysis of ammonia on the breath of patients in end-stage renal failure. Kidney Int. 1997, 52, 223–228. [Google Scholar] [CrossRef] [PubMed]
- Miao, B.; Zeng, W.; Mu, Y.; Yu, W.; Hussain, S.; Xu, S.; Zhang, H.; Li, T. Controlled synthesis of monodisperse WO3·H2O square nanoplates and their gas sensing properties. Appl. Surf. Sci. 2015, 349, 380–386. [Google Scholar] [CrossRef]
- Vallejos, S.; Gracia, I.; Figueras, E.; Cane, C. Nanoscale Heterostructures Based on Fe2O3@WO3−x Nanoneedles and Their Direct Integration into Flexible Transducing Platforms for Toluene Sensing. ACS Appl. Mater. Interfaces 2015, 7, 18638–18649. [Google Scholar] [CrossRef] [PubMed]
- Kim, N.H.; Choi, S.J.; Yang, D.J.; Bae, J.; Park, J.; Kim, I.D. Highly sensitive and selective hydrogen sulfide and toluene sensors using Pd functionalized WO3 nanofibers for potential diagnosis of halitosis and lung cancer. Sens. Actuators B Chem. 2014, 193, 574–581. [Google Scholar] [CrossRef]
- Choi, S.-J.; Kim, S.-J.; Koo, W.-T.; Cho, H.-J.; Kim, I.-D. Catalyst-loaded porous WO3 nanofibers using catalyst-decorated polystyrene colloid templates for detection of biomarker molecules. Chem. Commun. (Camb.) 2015, 51, 2609–2612. [Google Scholar] [CrossRef] [PubMed]
- Gouma, P.I.; Kalyanasundaram, K. A selective nanosensing probe for nitric oxide. Appl. Phys. Lett. 2008, 93, 1–4. [Google Scholar] [CrossRef]
- Moon, H.G.; Choi, Y.R.; Shim, Y.S.; Choi, K.I.; Lee, J.H.; Kim, J.S.; Yoon, S.J.; Park, H.H.; Kang, C.Y.; Jang, H.W. Extremely sensitive and selective NO probe based on villi-like WO3 nanostructures for application to exhaled breath analyzers. ACS Appl. Mater. Interfaces 2013, 5, 10591–10596. [Google Scholar] [CrossRef] [PubMed]
- Fruhberger, B.; Stirling, N.; Grillo, F.G.; Ma, S.; Ruthven, D.; Lad, R.J.; Frederick, B.G. Detection and quantification of nitric oxide in human breath using a semiconducting oxide based chemiresistive microsensor. Sens. Actuators B Chem. 2001, 76, 226–234. [Google Scholar] [CrossRef]
- Xu, Z.; Vetelino, J.F.; Lec, R.; Parker, D.C. Electrical properties of tungsten trioxide films. J. Vac. Sci. Technol. A Vac. Surf. 1990, 8, 3634–3638. [Google Scholar] [CrossRef]
- Rout, C.S.; Hegde, M.; Rao, C.N.R. H2S sensors based on tungsten oxide nanostructures. Sens. Actuators B Chem. 2008, 128, 488–493. [Google Scholar] [CrossRef]
- Choi, S.J.; Fuchs, F.; Demadrille, R.; Grevin, B.; Jang, B.H.; Lee, S.J.; Lee, J.H.; Tuller, H.L.; Kim, I.D. Fast responding exhaled-breath sensors using WO3 hemitubes functionalized by graphene-based electronic sensitizers for diagnosis of diseases. ACS Appl. Mater. Interfaces 2014, 6, 9061–9070. [Google Scholar] [CrossRef] [PubMed]
- Tangerman, A.; Winkel, E.G. Intra- and extra-oral halitosis: Finding of a new form of extra-oral blood-borne halitosis caused by dimethyl sulphide. J. Clin. Periodontol. 2007, 34, 748–755. [Google Scholar] [CrossRef] [PubMed]
- Christian, J.; Gaur, R.P.S.; Wolfe, T.; Trasorras, J.R.L. Tungsten Chemicals and Their Applications; International Tungsten Industry Association: London, UK, 2011. [Google Scholar]
- Zheng, H.; Ou, J.Z.; Strano, M.S.; Kaner, R.B.; Mitchell, A.; Kalantar-Zadeh, K. Nanostructured tungsten oxide-properties, synthesis, and applications. Adv. Funct. Mater. 2011, 21, 2175–2196. [Google Scholar] [CrossRef]
- Long, H.; Zeng, W.; Zhang, H. Synthesis of WO3 and its gas sensing: A review. J. Mater. Sci. Mater. Electron. 2015, 26, 4698–4707. [Google Scholar] [CrossRef]
- Hübner, M.; Simion, C.E.; Haensch, A.; Barsan, N.; Weimar, U. CO sensing mechanism with WO3 based gas sensors. Sens. Actuators B Chem. 2010, 151, 103–106. [Google Scholar] [CrossRef]
- Akamatsu, T.; Itoh, T.; Izu, N.; Shin, W. NO and NO2 sensing properties of WO3 and Co3O4 based gas sensors. Sensors 2013, 13, 12467–12481. [Google Scholar] [CrossRef] [PubMed]
- Baumann, S.L. Detektions-Mechanismen Auf WO3 Bei Einsatz in Verbrennungsabgasen; Dissertation Jutus Liebig Universität Gießen: Gießen, Germany, 2003. (In German) [Google Scholar]
- Reyes, L.F.; Saukko, S.; Hoel, A.; Lantto, V.; Granqvist, C.G. Structure engineering of WO3 nanoparticles for porous film applications by advanced reactive gas deposition. J. Eur. Ceram. Soc. 2004, 24, 1415–1419. [Google Scholar] [CrossRef]
- Barsan, N.; Weimar, U. Conduction model of metal oxide gas sensors. J. Electroceramics 2001, 7, 143–167. [Google Scholar] [CrossRef]
- Weil, M.; Schubert, W. The Beautiful Colours of Tungsten Oxides; International Tungsten Industry Association: London, UK, 2013. [Google Scholar]
- Pokhrel, S.; Birkenstock, J.; Dianat, A.; Zimmermann, J.; Schowalter, M.; Rosenauer, A.; Ciacchi, L.C.; Mädler, L. In situ high temperature X-ray diffraction, transmission electron microscopy and theoretical modeling for the formation of WO3 crystallites. CrystEngComm 2015, 17, 6985–6998. [Google Scholar] [CrossRef]
- Xin, G.; Guo, W.; Ma, T. Effect of annealing temperature on the photocatalytic activity of WO3 for O2 evolution. Appl. Surf. Sci. 2009, 256, 165–169. [Google Scholar] [CrossRef]
- Gerand, B.; Nowogrocki, G.; Guenot, J.; Figlarz, M. Structural study of a new hexagonal form of tungsten trioxide. J. Solid State Chem. 1979, 29, 429–434. [Google Scholar] [CrossRef]
- Faller, A.; Michael, S. Der Körper des Menschen: Einführung in Bau und Funktion, 17th ed.; Georg Thiem Verlag: Stuttgart, Germany, 2016. (In German) [Google Scholar]
- Measuring Alcohol in the Body; Draeger: Luebeck, Germany. Available online: http://www.draeger.com/sites/assets/PublishingImages/Products/cdi_alcotest_9510/TR/measuring_alcohol_in_the_body_br_9044525_en.pdf (accessed on 27 October 2016).
- Lemaire, N. Technical Evaluation: ACS and Dräger Breath Alcohol Ignition Interlock Devices (BAIIDs); European Conference of Transport Research Institutes: Brussel, Belgium, 2005. [Google Scholar]
- Rosenberg, E. A Study of the Accuracy and Precision of Selected Breath Alcohol Measurement Devices (‘Breathalyzers’); TUW CTA 2015/27EN; Vienna University of Technology: Vienna, Austria, 2015; pp. 1–45. [Google Scholar]
- Santra, S.; Sinha, A.K.; de Luca, A.; Ali, S.Z.; Udrea, F.; Guha, P.K.; Ray, S.K.; Gardner, J.W. Mask-less deposition of Au–SnO2 nanocomposites on CMOS MEMS platform for ethanol detection. Nanotechnology 2016, 27, 125502. [Google Scholar] [CrossRef] [PubMed]
- Kumar, A. Performance analysis of zinc oxide based alcohol sensors. J. Appl. Sci. Eng. Res. 2015, 4, 427–436. [Google Scholar]
- Comini, E. Metal oxide nanowire chemical sensors: Innovation and quality of life. Mater. Today 2016, in press. [Google Scholar] [CrossRef]
- Trawka, M.; Smulko, J.; Hasse, L.; Granqvist, C.G.; Annanouch, F.E.; Ionescu, R. Fluctuation enhanced gas sensing with WO3-based nanoparticle gas sensors modulated by UV light at selected wavelengths. Sens. Actuators B Chem. 2016, 234, 453–461. [Google Scholar] [CrossRef]
- Neri, G. First Fifty Years of Chemoresistive Gas Sensors. Chemosensors 2015, 3, 1–20. [Google Scholar] [CrossRef]
- Rooth, G.; Ostenson, S. Acetone in alveolar air, and the control of diabetes. Lancet 1966, 2, 1102–1105. [Google Scholar] [CrossRef]
- Essiet, I. Diagnosis of kidney failure by analysis of the concentration of ammonia in exhaled human breath. J. Emerg. Trends Eng. Appl. Sci. 2013, 4, 859–862. [Google Scholar]
- Epifani, M.; Andreu, T.; Magana, C.R.; Diaz, R.; Arbiol, J.; Siciliano, P.; Morante, J.R. From doping to phase transformation: Ammonia sensing performances of chloroalkoxide-derived WO3 powders modified with chromium. Sens. Actuators B Chem. 2010, 148, 200–206. [Google Scholar] [CrossRef]
- De Boer, M.; van Dillen, A.J.; Koningsberger, D.C.; Janssen, F.J.J.G.; Koerts, T.; Geus, J.W. Selective oxidation of ammonia to nitrogen over silica supported molybdena catalysts. A structure-selectivity relationship. Stud. Surface Sci. Catal. 1992, 72, 133–145. [Google Scholar]
- Solga, S.F.; Mudalel, M.; Spacek, L.A.; Lewicki, R.; Tittel, F.; Loccioni, C.; Russo, A.; Risby, T.H. Factors influencing breath ammonia determination. J. Breath Res. 2013, 7, 37101. [Google Scholar] [CrossRef] [PubMed]
- Li, F.; Li, C.; Zhu, L.; Guo, W.; Shen, L.; Wen, S.; Ruan, S. Enhanced toluene sensing performance of gold-functionalized WO3·H2O nanosheets. Sens. Actuators B Chem. 2016, 223, 761–767. [Google Scholar] [CrossRef]
- Carlsson, A. Exposure to toluene. Uptake, distribution and elimination in man. Scand. J. Work. Environ. Heal. 1982, 8, 43–55. [Google Scholar] [CrossRef]
- Itoh, T.; Matsubara, I.; Tamaki, J.; Kanematsu, K. Effect of High-Humidity Aging on Performance of Tungsten Oxide-Type Aromatic Compound Sensors. Sens. Mater. 2012, 24, 13–19. [Google Scholar]
- Barnes, P.J.; Kharitonov, S.A. Exhaled nitric oxide: A new lung function test. Thorax 1996, 51, 233–237. [Google Scholar] [CrossRef] [PubMed]
- Morris, S.M.; Billiar, T.R. New insights into the regulation of inducible nitric oxide synthesis. Am. J. Physiol. 1994, 266, E829–E839. [Google Scholar] [PubMed]
- Gouma, P.; Sood, S.; Stanacevic, M.; Simon, S. Selective chemosensing and diagnostic breathanalyzer. Procedia Eng. 2014, 87, 9–15. [Google Scholar] [CrossRef]
- Dweik, R.A.; Boggs, P.B.; Erzurum, S.C.; Irvin, C.G.; Leigh, M.W.; Lundberg, J.O.; Olin, A.; Plummer, A.L.; Taylor, D.R.; Thoracic, A.; et al. An Official ATS Clinical Practice Guideline: Interpretation of Exhaled Nitric Oxide Levels (FENO) for Clinical Applications. Am. J. Respir. Crit. Care Med. 2011, 184, 602–615. [Google Scholar] [CrossRef] [PubMed]
- Struben, V.M.D.; Wieringa, M.H.; Mantingh, C.J.; Bommeljé, C.; Don, M.; Feenstra, L.; de Jongste, J.C. Nasal NO: Normal values in children age 6 through to 17 years. Eur. Respir. J. 2005, 26, 453–457. [Google Scholar] [CrossRef] [PubMed]
- Offline, N.O. Recommendations for Standardized Procedures for the Online and Offline Measurement of Exhaled Lower Respiratory Nitric Oxide and Nasal Nitric Oxide in Adults and Children—1999. Am. J. Respir. Crit. Care Med. 1999, 160, 2104–2117. [Google Scholar]
- Paschke, K.M.; Mashir, A.; Dweik, R.A. Clinical applications of breath testing. Med. Rep. 2010, 2, 56. [Google Scholar] [CrossRef] [PubMed]
- Aerocrine. Mastering the Measurement of Feno Nitric Oxide Monitoring System NIOX® Flex—Nitric Oxide Monitoring System; Aerocrine: Solna, Sweden, 2007. [Google Scholar]
- Washio, J.; Sato, T.; Koseki, T.; Takahashi, N. Hydrogen sulfide-producing bacteria in tongue biofilm and their relationship with oral malodour. J. Med. Microbiol. 2005, 54, 889–895. [Google Scholar] [CrossRef] [PubMed]
- Paetznick, D.J.; Reineccius, G.A.; Peppard, T.L.; Herkert, J.M.; Lenton, P. Comparison of breath and in-mouth collection for the measurement of oral malodorous compounds by gas chromatography using sulfur chemiluminescence detection. J. Breath Res. 2010, 4, 17106. [Google Scholar] [CrossRef] [PubMed]
- Solis, J.L.; Hoel, A.; Kish, L.B.; Granqvist, C.G. Gas-Sensing Properties of Nanocrystalline WO3 Films Made by Advanced Reactive Gas Deposition. J. Am. Ceram. Soc. 2001, 84, 1504–1508. [Google Scholar] [CrossRef]
- De Geest, S.; Laleman, I.; Teughels, W.; Dekeyser, C.; Quirynen, M. Periodontal diseases as a source of halitosis: A review of the evidence and treatment approaches for dentists and dental hygienists. Periodontol. 2000 2016, 71, 213–227. [Google Scholar] [CrossRef] [PubMed]
- Choi, S.-J.; Ku, K.H.; Kim, B.J.; Kim, I.-D. Novel templating route using Pt infiltrated block copolymer micro-particles for catalytic Pt functionalized macroporous WO3 nanofibers and its application in breath pattern recognition. ACS Sens. 2016, 1, 1124–1131. [Google Scholar] [CrossRef]


| Gas | Biomarker Origin | Concentration |
|---|---|---|
| Ethanol [9,10,11] | Blood Alcohol Concentration | >130–650 ppm [12] |
| Acetone [13,14,15,16,17,18] | Diabetes | up to 3.73 ppm [19] |
| NH3 [20,21,22,23,24] | Renal Failure | around 4.8 ppm [25] |
| Toluene [26,27,28,29] | Exposure to Toxin | >56 ppm |
| Lung Cancer | 80–100 ppb [28] | |
| Nitric oxide [30,31,32] | Asthma | >30 ppb [31] |
| H2S [33,34,35] | Halitosis | >20.6 ppb [36] |
| Crystal Phase | Symmetry | Temperature |
|---|---|---|
| ε-WO3 | Monoclinic | Under −40 °C |
| δ-WO3 | Triclinic | −40–17 °C |
| γ-WO3 | Monoclinic | 17–320 °C |
| β-WO3 | Orthorhombic | 320–720 °C |
| α-WO3 | Tetragonal | Over 720 °C |
| h-WO3 | Hexagonal | Metastabile |
| Manufacturer | Model | Detector Type | Price in € | Accuracy [52] | Precision [52] |
|---|---|---|---|---|---|
| ACE | Neo | Fuel Cell | ~99 a | 95.7% | 2.6% |
| ACE | II Basic | Fuel Cell | ~110 a | 99.0% | 1.3% |
| ACE | III Basic | Fuel Cell | ~150 a | 95.6% | 2.6% |
| ACE | III Premium | Fuel Cell | ~160 a | 86.2% | 29.7% |
| ACE | AF-33 | Fuel Cell | ~100 a | 97.9% | 2.6% |
| ACE | Alco 5500 | SMOX | ~36 a | 96.2% | 17.5% |
| ACE | Pro Med Basic | Fuel Cell | ~350 b | 88.5% | 20.6% |
| ACE | One | Fuel Cell | ~120 a | 98.6% | 2.0 % |
| Draeger | Alcotest 3000 | Fuel Cell | ~300 a | 98.9 % | 2.7% |
| ACE | Public V | Fuel Cell | ~1400 a | 98.0% | 2.8% |
| ACE | Stationary Alcohol Analyzer | Fuel Cell | Not Found | 77.1% | 1.4% |
| Sample | Nanostructure | Crystal Structure | Ethanol Concentration |
|---|---|---|---|
| Au:WO3 [9] | Nanoparticles 40 nm (Crystallites) | Unknown | 2% in Dry Air |
| WO3 [10] | Nanorods 50 nm (Diameter) | Monoclinic WO3 | 12.5–31.25 ppm |
| WO3-SnO2 [11] | Nanoplates 40–400 nm (Length) 20–60 nm (Thickness) | Monoclinic WO3 | 180–2800 ppm |
| Au-NP Decorated WO3 [56] | Nanowires ~5 μm (Length) 60–120 nm (Diameter) | Unknown | With UV Irradiation 25–75 ppm |
| Sensor | Nanostructure | Crystal Structure | Acetone Concentration |
|---|---|---|---|
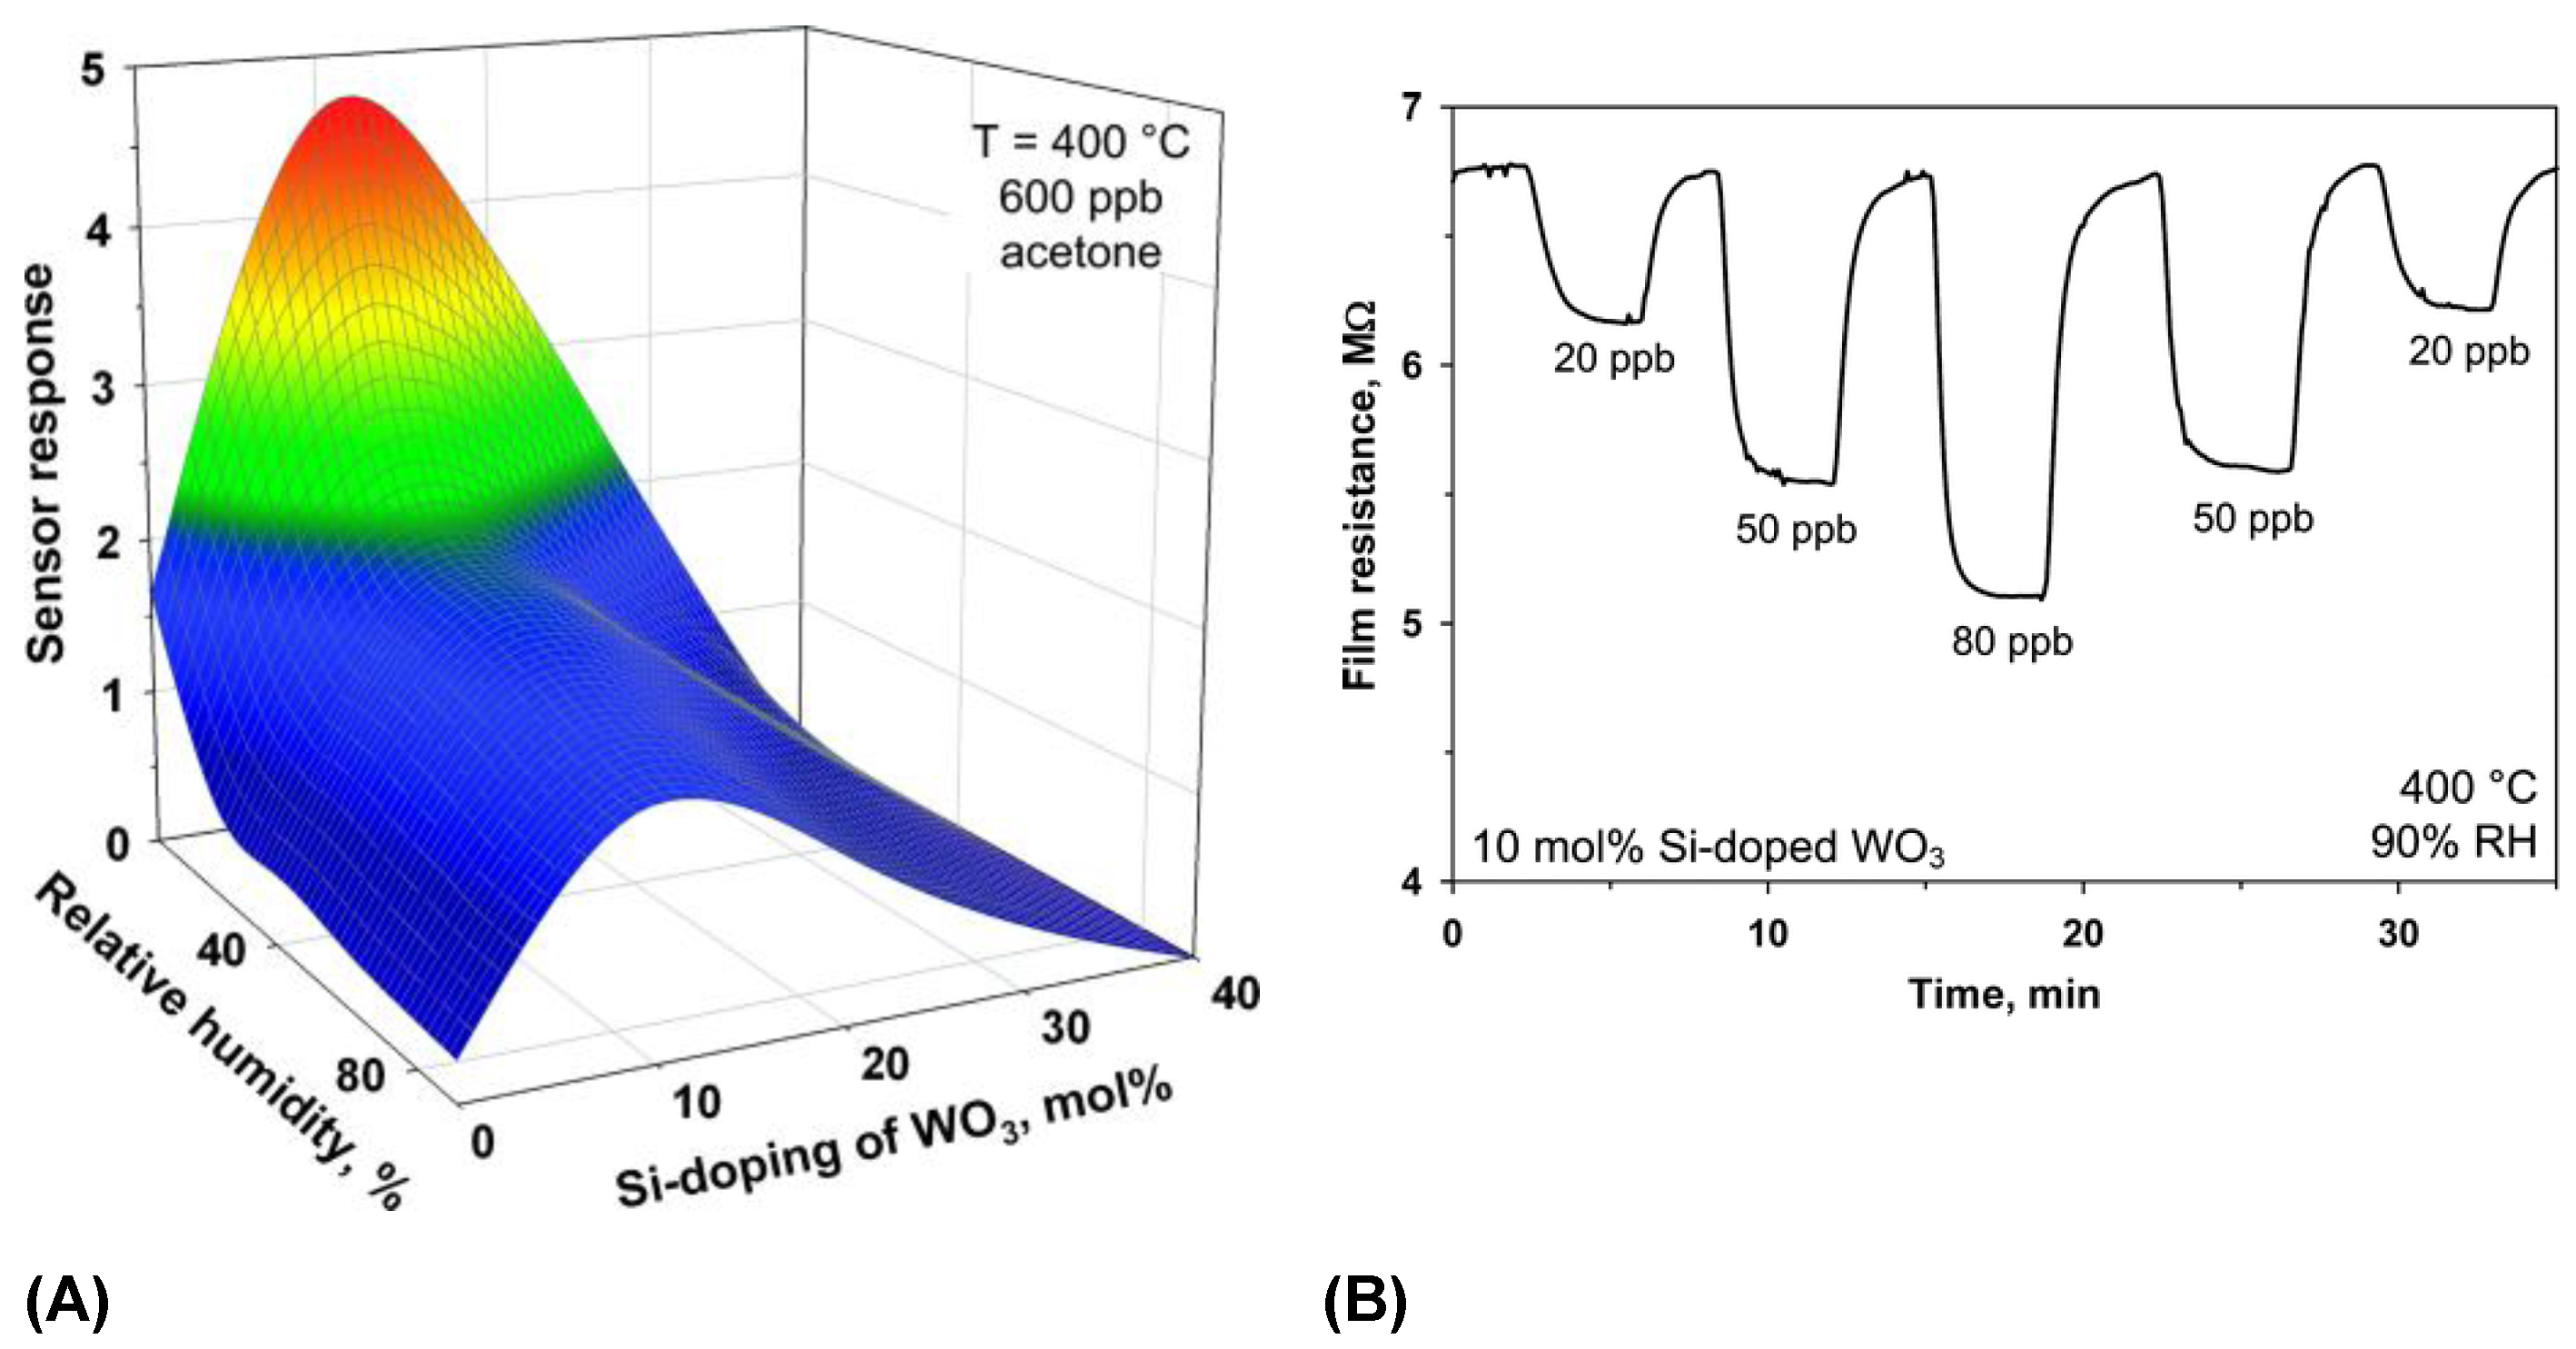
| 10 mol% Si:WO3 [16] | 12 nm | Monoclinic ε-WO3 | 100–600 ppb in Dry Air to 90% RH |
| WO3 [14] | Hollow Spheres 400 nm (Diameter) 30 nm (Shell) 12 nm (Crystallites) | Monoclinic (JCPDS card no. 72-0677 | 50–500 ppm |
| Rh-Loaded WO3 [15] | Hollow Spheres 25 nm (Shell) | Orthorhombic β-WO3 | 0.2–20 ppm in Dry Air up to 80% RH |
| 20 at% Cr-Doped WO3 [17] | Nanoparticles 20 nm (Crystallites) | ε-WO3 | 0.2–1 ppm |
| 0.022 wt% Pt Loaded WO3 [18] | Nanoparticles 28 nm (Crystallites) | Not Defined | 0.1–5 ppm |
| Sensor | Nanostructure | Crystal Structure | Ammonia Concentration |
|---|---|---|---|
| 0.4 wt% Au loaded WO3 [20] | Unknown | Unknown | 0.001–100 ppm |
| WO3 [21] | Undefined | Unknown | 10–1000 ppm in dry air |
| WO3 [22] | Carnation 500 nm (Length) 80 nm (Diameter) | Hexagonal h-WO3 | 10–100 ppm |
| WO3 [23] | Nanorod 30–100 nm (Diameter) 100–300 nm (Length) Nanoparticles 10–40 nm | Hexagonal h-WO3 | 80–200 ppm |
| Cu and V Modified WO3 [24] | Nanoparticles 19–64 nm | Monoclinic γ-WO3 and Triclinic δ-WO3 | 500 ppm |
| Sensor | Nanostructure | Crystal Structure | Toluene Concentration |
|---|---|---|---|
| WO3·H2O [26] | Nanoplates 20–30 nm (Thickness) 150–200 nm (Length) | Orthorhombic β-WO3 | 10–200 ppm |
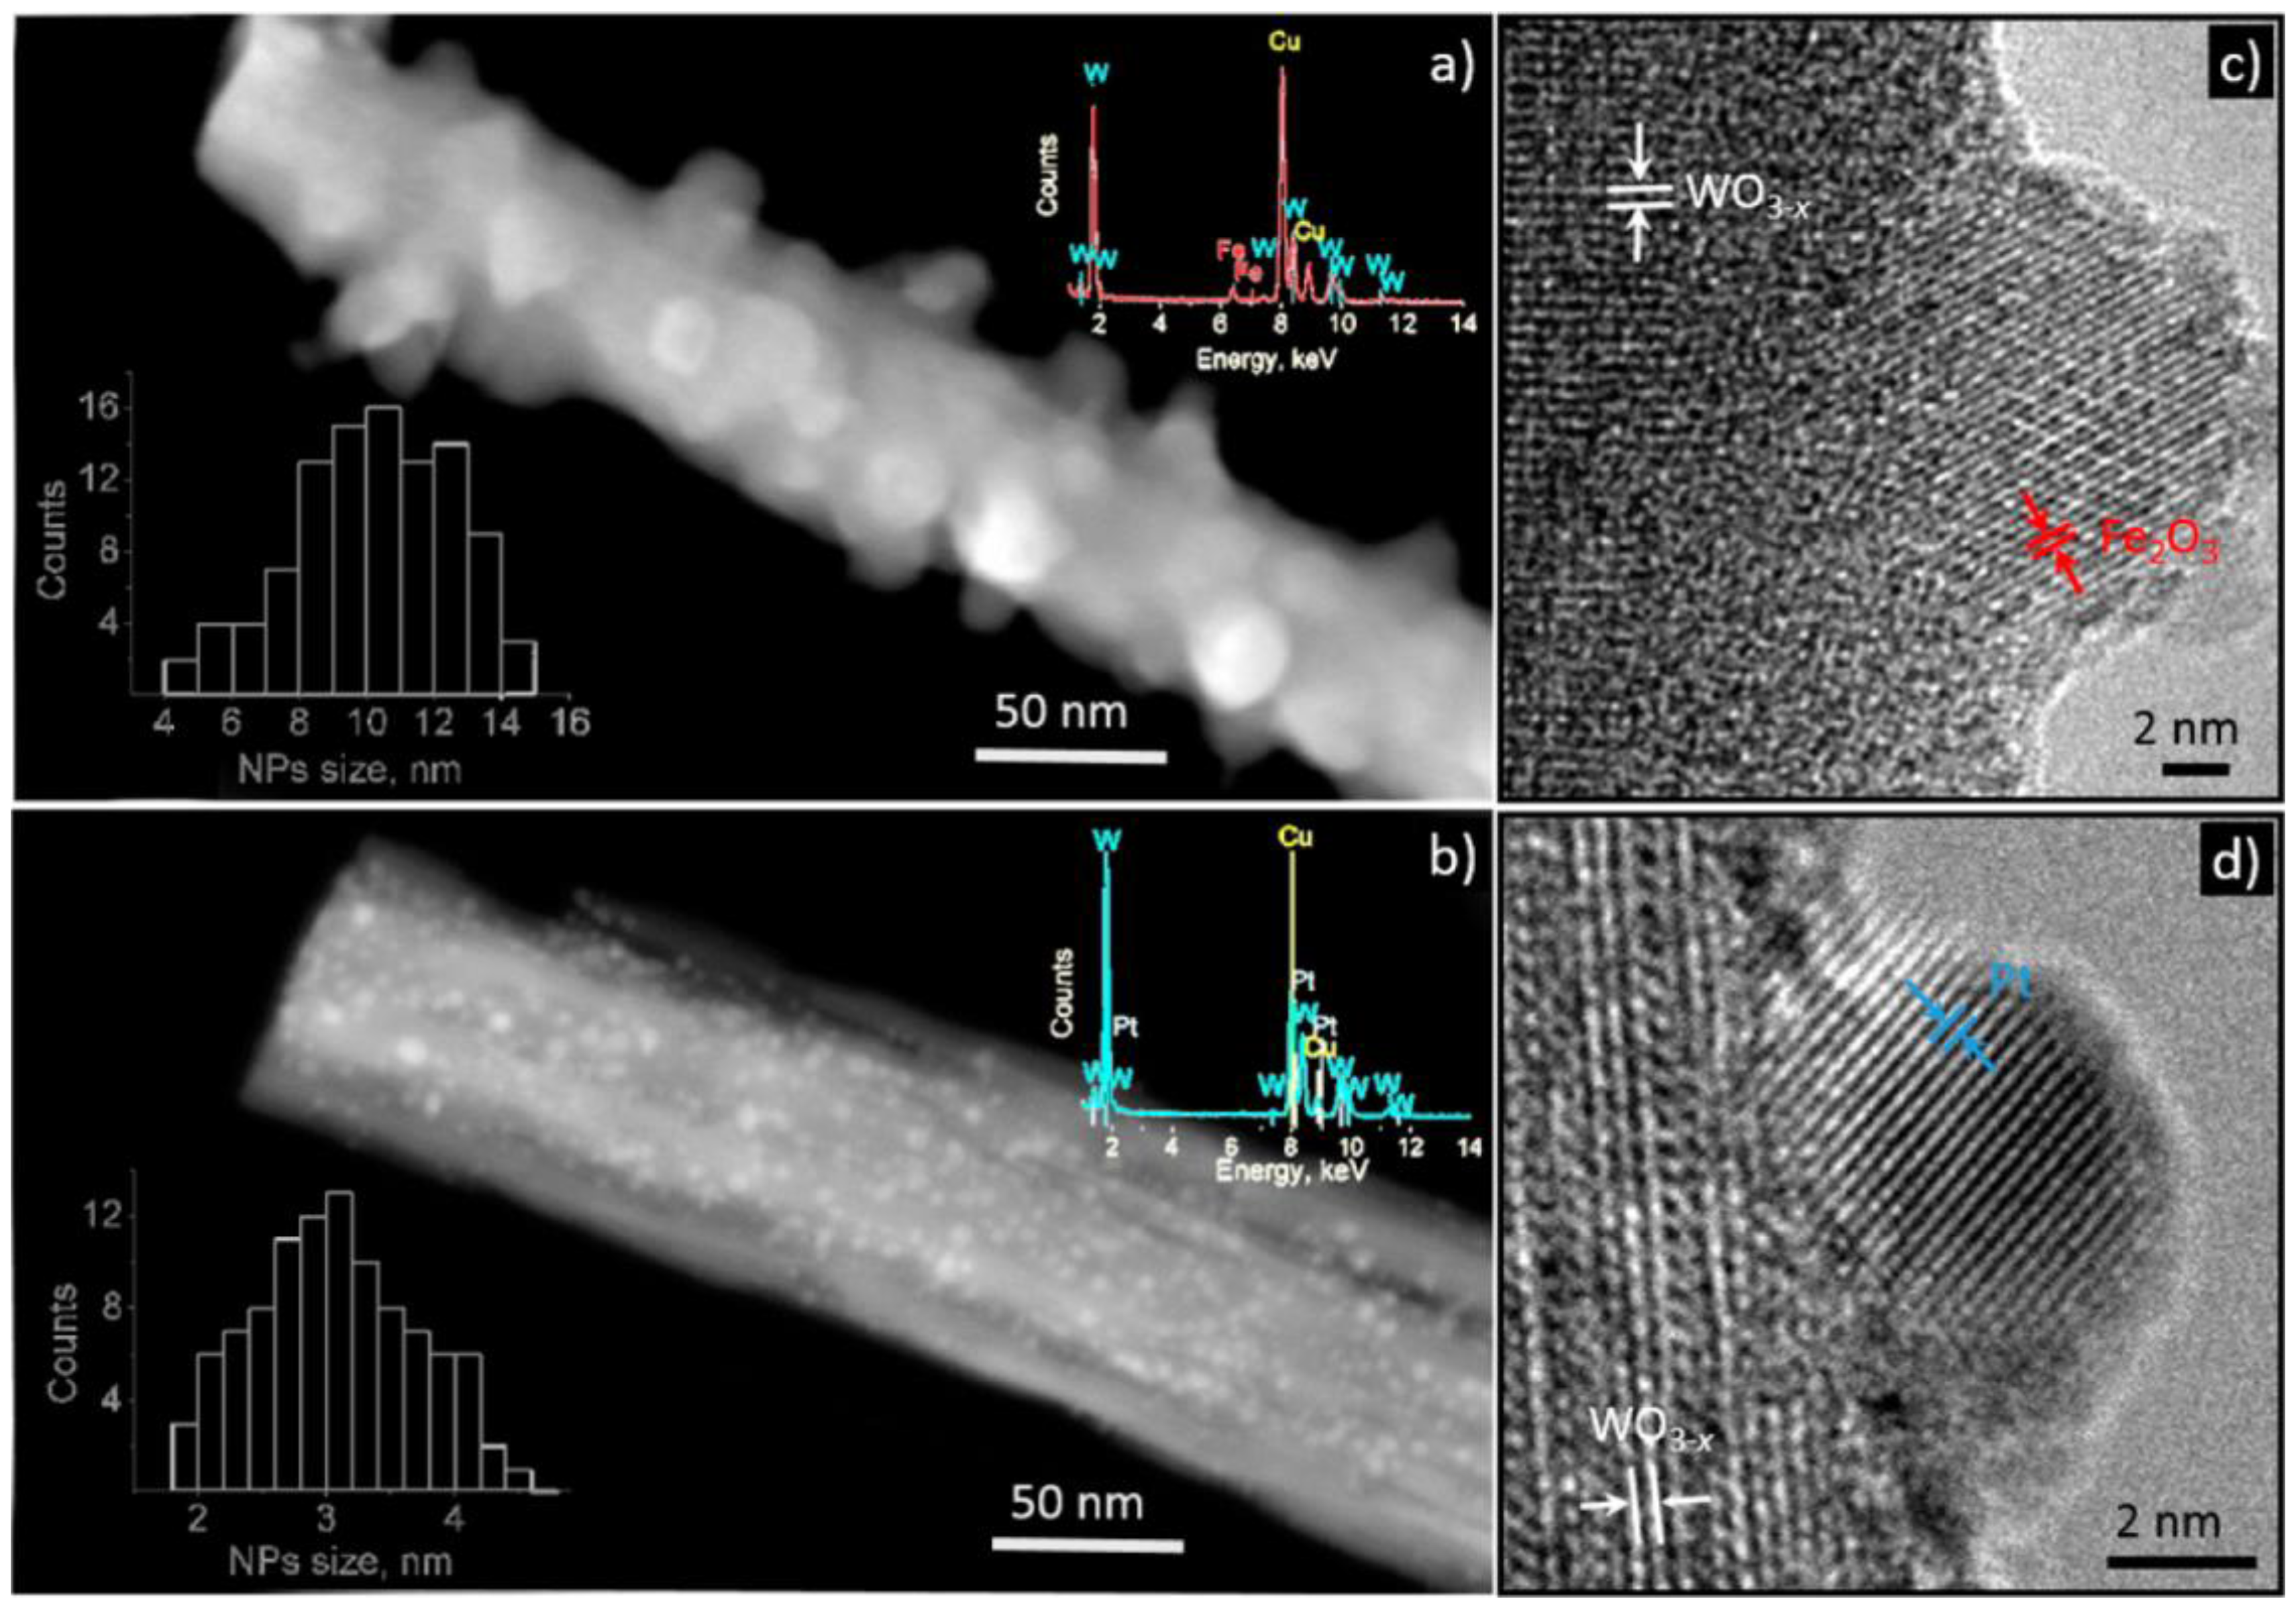
| Fe2O3@WO3‑x [27] | Nanoneedles 50–100 nm (Diameter) ~10µm (Length) | Monoclinic ((P21/n), ICCD card no. 72-0677) | 20–100 ppm |
| 0.5 wt% Pd-nanoparticles/0.5 wt% Pd-embedded WO3 [28] | Nanofibers 300–600 nm (Diameter) 17.4–32.59 nm (Crystallites) | Monoclinic (PDF#43-1035) | 1–5 ppm |
| Pd loaded WO3 [29] | Nanofibers 200–300 nm (Diameter) | Unknown | 0.1–5 ppm in 90% RH |
| Sensor | Nanostructure | Crystal Structure | NO Concentration |
|---|---|---|---|
| WO3 [30] | Nanoparticles 15–20 nm | Monoclinic γ-WO3 | 0.3–1 ppm |
| WO3 [31] | Villi (Single Crystalline) 40–50 nm (Diameter) | Monoclinic WO3 | 0.2–1 ppm in 80% RH |
| WO3 with a Filter and Oxidizing Agent (KMnO4) [32] | Unknown | Unknown | 60 ppb |
| Sensor | Grain Size | Crystal Structure | H2S Concentration |
|---|---|---|---|
| WO3 [33] | Unknown | Unknown | 10–100 ppm |
| WO2.72 [34] | Nanowires (Single Crystal) 5–15 nm | Monoclinic (JCPDS no: 36-101) | 1–1000 ppm |
| Graphene Functionalized WO3 [35] | Hemitubes 200–300 nm (Diameters) | Monoclinic (JCPDS no: 43-1035) | 1–5 ppm |
| WO3 [76] | Nanoparticles ~11 nm (Crystallites) | Monoclinic and Tetragonal WO3 | 10 ppm |
| WO3 [43] | Nanoparticles ~10 nm (Crystallites) | Monoclinic and Tetragonal | 10 ppm |
| Pt Functionalized WO3 [78] | Nanofiber ~900 nm (Diameter) | Unknown | 1–5 in Dry Air to 95% RH |
© 2016 by the authors; licensee MDPI, Basel, Switzerland. This article is an open access article distributed under the terms and conditions of the Creative Commons Attribution (CC-BY) license (http://creativecommons.org/licenses/by/4.0/).
Share and Cite
Staerz, A.; Weimar, U.; Barsan, N. Understanding the Potential of WO3 Based Sensors for Breath Analysis. Sensors 2016, 16, 1815. https://doi.org/10.3390/s16111815
Staerz A, Weimar U, Barsan N. Understanding the Potential of WO3 Based Sensors for Breath Analysis. Sensors. 2016; 16(11):1815. https://doi.org/10.3390/s16111815
Chicago/Turabian StyleStaerz, Anna, Udo Weimar, and Nicolae Barsan. 2016. "Understanding the Potential of WO3 Based Sensors for Breath Analysis" Sensors 16, no. 11: 1815. https://doi.org/10.3390/s16111815