Determination of the NOx Loading of an Automotive Lean NOx Trap by Directly Monitoring the Electrical Properties of the Catalyst Material Itself


Abstract
: Recently, it has been shown that the degree of loading of several types of automotive exhaust aftertreatment devices can be directly monitored in situ and in a contactless way by a microwave-based method. The goal of this study was to clarify whether this method can also be applied to NOx storage and reduction catalysts (lean NOx traps) in order to obtain further knowledge about the reactions occurring in the catalyst and to compare the results with those obtained by wirebound NOx loading sensors. It is shown that both methods are able to detect the different catalyst loading states. However, the sensitivity of the microwave-based method turned out to be small compared to that previously observed for other exhaust aftertreatment devices. This may limit the practical applicability of the microwave-based NOx loading detection in lean NOx traps.1. Introduction
Increasing fuel costs and the need to reduce CO2 emissions are the main drivers for the market penetration of fuel-efficient leanly operated internal combustion engines in the field of passenger cars. Due to their lean operation mode, NOx removal with a conventional three-way catalyst is not possible [1]. At the same time, the emission limits for NOx have been strongly tightened. Besides the ammonia-selective catalytic reduction process, in which NOx is selectively reduced to nitrogen and water even under lean conditions [2], the NOx storage catalyst (abbreviated NSR, also often denoted as lean NOx trap, abbreviated as LNT) has been developed [3], especially for direct injection gasoline engines that operate in the lean mode. During a lean phase, NOx is oxidized, absorbed, and stored in the form of nitrates. Once NOx cannot be stored anymore, a short rich period follows, in which the formed nitrates decompose and the reduction of the released NOx occurs. By now, the LNT concept has been applied also for diesel exhaust gas aftertreatment [4], and the SCR system has been discussed for leanly operated gasoline engines [5]. Even the combination of both NOx abatement techniques, with ammonia being formed during the short rich phase in the LNT, is an in-series application [6].
The NOx storage catalyst devices consist of ceramic cordierite honeycomb structures coated with fine-grained oxides to increase the open surface [7,8] and with catalytically active materials, namely platinum group metals, with alkaline (-earth) oxides or carbonates, and with oxygen storage components, typically ceria-zirconia solid solutions [9,10]. On the surface of the platinum group metals, NO molecules are oxidized to NO2, which also get oxidized and stored on the alkaline (-earth) based storage sites in the form of nitrates. Equations (1) and (2) reflect this for a barium-based LNT formulation:
Just before the storage capacity of a NOx storage catalyst is exhausted and the catalyst begins to let NOx pass, the engine is switched to the rich operation mode and the stored NOx species are reduced by the platinum group metals to N2 [10].
In order to take full advantage of the provided NOx storage capacity, LNT based exhaust gas aftertreatment catalysts usually cannot be operated in an open loop. Therefore, a NOx sensor is mounted downstream of the LNT to detect NOx breakthroughs and to act as a part of a closed-loop control system, helping to not overload the LNT. In addition, a λ-probe ensures that the regeneration period is only as long as necessary, since otherwise CO or hydrocarbon breakthroughs may occur [11].
This makes clear that appropriate exhaust gas sensors become more and more important, not only for engine control, but also for OBD (on-board diagnosis) purposes [12,13]. Besides the direct measurement of the exhaust gas component NOx or of the normalized air-to-fuel ratio λ, it would be beneficial for an optimized control to know the degree of catalyst loading [14]. In the past few years, R&D focused in two directions. On the one hand, two conventional types of NOx gas sensors have reached a maturity for serial production [15,16], on the other hand, in research labs initial work is being conducted to measure directly the status of an exhaust gas catalyst—without the detour to the exhaust gas concentration [17].
This direct status detection method can be divided in a wirebound and a contactless microwave-based approach [14]. With respect to the wirebound technique, it has been shown that, by measuring the electrical impedance of the coating material itself in situ in a frequency range from 20 Hz to 1 MHz, the state of an LNT with respect to NOx loading, regeneration, sulfurization (poisoning), and thermal aging can be determined [18,19].
The microwave-based approach has been suggested recently to determine quantitatively the degree of oxygen loading in three-way catalysts [20] and to quantitatively measure the soot mass of diesel particulate filters [21]. When storing gas in the catalyst or when soot is deposited on the filter walls, the electrical properties such as the conductivity of the catalyst material change. Electromagnetic waves propagating inside the metallic exhaust pipe are influenced by this conductivity change. This leads, for instance, to the perturbation of a cavity resonator, which is the fundamental effect of the microwave-based catalyst monitoring method [22]. With oxygen or soot loading, the electrical conductivity changes by decades leading to marked effects in the microwave absorption. Very recently, this method has been successfully proven to determine the ammonia loading of zeolite-based SCR catalysts [23], in spite of far lower conductivity changes in this case [24]. Another very interesting related approach is the use of the microwave technique in combination with sensitive layers for gas sensing purposes [25].
For LNT systems, one has to expect only small conductivity changes with NOx loading [19]. In addition, one has to distinguish between NOx loading and oxygen loading, the latter occurring in the ceria-zirconia components of the commercial LNT coating formulation. However, preliminary results (Figure 7 in Reference [17]) indicate that it might be possible to use the microwave-based approach also for LNT control.
In this study, we compare the wirebound and the microwave-based catalyst state observation techniques directly. The paper is structured as follows: first, the microwave-based approach is introduced and the results are discussed. Second, the results obtained with several wirebound sensors installed in line in the LNT device along the gas flow axis are shown and discussed. In a third section, the results obtained simultaneously from both methods under special NOx loading cycles are shown and compared in the light of the NOx storage process in the catalyst. One difference in the methods is obvious from the outset: while a wirebound NOx loading sensor measures the NOx loading locally (spatially resolved), the microwave-based technique integrates over the entire catalyst. It also an aim of this study to evaluate whether the microwave-based technique has the potential for a serial application in lean NOx traps for NOx abatement in the automotive exhaust.
2. Microwave-Based Approach
The microwave-based approach exploits the perturbation of a microwave cavity resonator. The approach is similar to the ones that are widely used for determining the dielectric material properties at microwave frequencies [26]. In contrast to the conventionally applied method, it is not the perturbation of a previously empty cavity by a small material sample that is considered here, but rather the perturbation of the entire LNT material-filled cavity by changes in the electrical material properties of the catalyst itself.
2.1. Microwave-Based Approach: Experimental
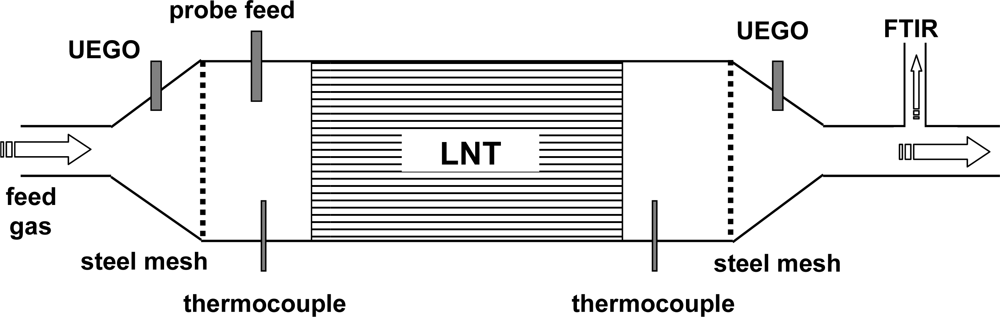
All measurements were conducted in a lab test bench for catalysts. Figure 1 shows the setup schematically. The barium-based LNT device was mounted in a stainless steel housing. The dimensions of the LNT device were 118 mm × 124 mm (diameter × length). The housing was flange-connected with two cones to the gas feed (synthetic exhaust gas) and to the vent. Upstream and downstream of the LNT, wideband λ-probes (UEGO sensor, for details see [27]), and thermocouples (type K) were mounted in the catalyst housing as shown in Figure 1. The UEGO sensors measure the normalized air-to-fuel ratio λ in a wide range.
The steel canning of the LNT acts as a cylindrical electromagnetic waveguide. A short stub antenna serving as a microwave probe feed (as described in [28]) was also installed. The resulting microwave one-port element was connected with an automatic vector network analyzer by coaxial lines. To obtain a precisely defined cylindrical cavity resonator, gas permeable steel meshes (mesh width: 4 mm) were inserted on both sides of the catalyst (for details see [28]). The distance between the meshes was 375 mm. The entire test bench was electrically heated to an operation temperature between 300 °C and 350 °C at a gas flow of 20 L/min. The test bench had two different gas lines to switch very rapidly from lean to rich feed gas. A part of the outlet gas was pumped into a Fourier transform infrared (FTIR) spectroscopy analyzer measuring the concentrations of the optically active gas components downstream of the LNT. The canned LNT is characterized by its frequency-dependent input reflection factor:
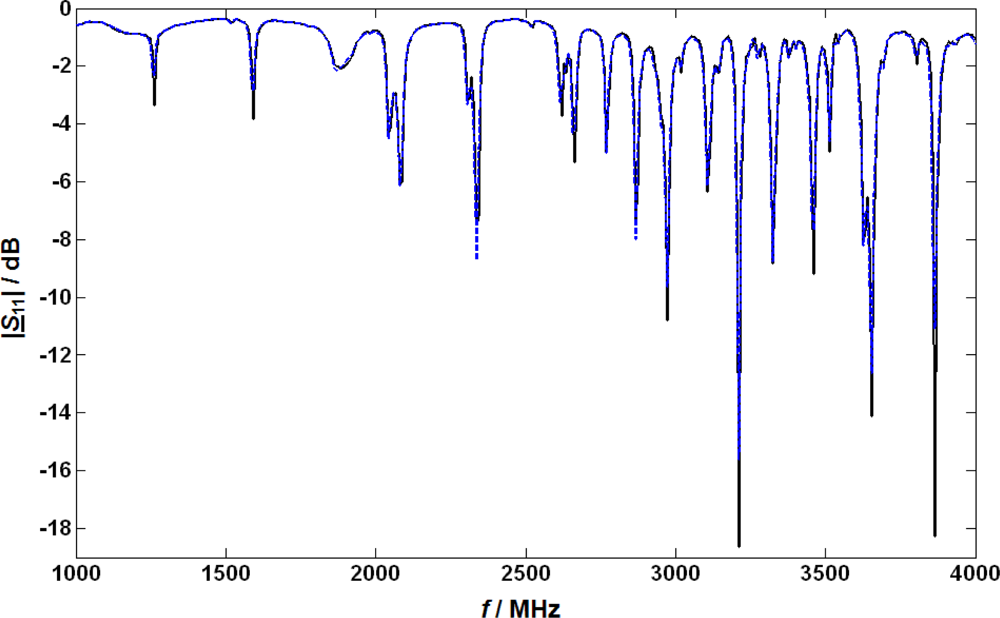
For the basic tests of the microwave system, the LNT catalyst was heated to 300 °C, and the LNT was regenerated using 1% H2, 100 ppm C3H8, 5,000 ppm CO and 8% H2O in N2. Then, a lean base gas without NO or NO2 was applied to the LNT (5% CO2, 1% O2, and 8% H2O in N2). After the UEGO sensor downstream of the LNT indicated a fully oxygen loaded state of the catalyst, a microwave spectrum was taken in the frequency range from 1,000 to 4,000 MHz to record the properties in the lean but completely NOx depleted catalyst (due to the absence of NO). The absolute value of the obtained reflection parameter |S11| is plotted (in dB; solid curve) versus frequency f in Figure 2. Depending on the applied frequency, resonance effects occur recognizable by the dips at distinct frequencies. Then, 4,000 ppm NO were added to the base gas and when the NOx concentration downstream of the catalyst reached the NO inlet concentration, a second basic spectrum of S11 was taken. The absolute value of |S11| in this state is also plotted in Figure 2 (dashed). At first glance, the results seem disappointing since both curves look very similar. However, a closer look shows that a small shift in the resonance frequencies and also a very slight broadening of the minimum peak occurs, but both effects are far less pronounced than in the previously investigated three-way catalysts [20] or diesel particulate filters [21]. The fractional changes in the resonance frequency due to NOx loading Δfres/fres were compared for all resonance frequencies and the resonance frequency with the highest effect of NOx was used for further studies. The following first study was conducted at around 2,615 MHz. Due to system modifications (e.g., the addition of the NOx sensors and a different catalyst temperature) the optimum frequency for further tests with NOx sensors included was found to be about 3,500 MHz.
2.2. Microwave-Based Approach: Results and Discussion
The time-dependent tests were carried out as follows. At the beginning of the test run, a lean base gas without NOx was applied to the LNT (5% CO2, 1% O2, and 8% H2O in N2) at t1 ≈ 0.5 h after a previous rich regeneration phase (1% H2, 100 ppm C3H8, 5,000 ppm CO and 8% H2O in N2) to fully remove stored NOx. Starting at t2 ≈ 2.5 h, 2,000 ppm NO were added to the base gas for 2 h. The concentration of NO in the feed gas was increased to 4,000 ppm at t3 ≈ 4.5 h. At about t4 ≈ 6.5 h the NO concentration was switched back to 2,000 ppm, and after t5 ≈ 8.5 h, the feed gas consisted of only base gas without NO. During the whole measurement, the catalyst temperature was kept constant at 300 °C.
First, the λ values obtained by the UEGO sensors upstream and downstream of the LNT during this test run are compared in Figure 3(a). At t = t1 the feed gas switches from the rich to the lean composition. The UEGO sensor upstream of the catalyst reflects this fast switch, whereas the UEGO sensor downstream has a slightly delayed response. Its signal remains around λ ≈ 1 for several minutes before it reaches the same value as the sensor upstream of the catalyst. The delay is caused by the oxygen storage component of the LNT formulation. As soon as the LNT is completely oxygen loaded, both UEGO sensor signals coincide. Starting from t ≈ t2, NO is added to the feed gas. The trace of the UEGO sensor signal, as highlighted in the inset, mirrors the NOx storage behavior. As soon as NO is added to the gas mixture, λ of the feed gas increases a little. In contrast, λ downstream of the LNT drops a bit at the same time. This is not surprising, since according to Equations (1) and (2), oxygen is required for the storage reaction and therefore, as long as the LNT stores NOx, λ downstream of the LNT should be lower than without NO in the feed. At about 3.5 h, the catalyst is saturated (for 2,000 ppm NO in the feed), and no NOx can be stored anymore, i.e., there is no more oxygen consumption, and λ downstream of the LNT reaches the feed gas value again. A similar behavior occurs after t3, when the NO concentration is further increased. Due to the chemical equilibrium of the storage reaction, the storage capacity of the LNT is greater at higher NO gas concentrations and more NOx can be stored. Analogously, the equilibrium changes back to lower loading states when NO is decreased to 2,000 ppm again at t4 (6.5 h) as well as to 0 ppm at t5 (8.5 h). In both cases NOx desorbs from the LNT.
These storage and release processes are proven by the gas analysis downstream of the LNT (not shown here). NOx was not detected by the FTIR spectrometer until about 3.1 h, i.e., the LNT stored all offered NO beginning at t2 (2.5 h) until NOx slip occurs at about 3.1 h. The storage capacity is exhausted at about 3.5 h, when NOx downstream of the catalyst reaches a constant level and the λ values upstream and downstream of the LNT begin to coincide. With increasing NO concentration in the feed gas, additional NOx storage occurs, indicated by a difference in the λ values and a slightly delayed increase of the FTIR spectroscopy signal. Also, the delayed decrease of the NOx concentration in the outlet gas (measured by the FTIR spectrometer) after changing back to 2,000 ppm NO and 0 ppm NO reveals a loss of NOx in the LNT.
Balancing the nitrogen oxide concentrations upstream and downstream of the LNT during the loading period should yield information on the stored amount of NOx in the LNT. The total stored NO mass, mNO, can be calculated from the volumetric flow rate V and the NO density ρNO by Equation (4). The NOx concentration in the outlet obtained from the FTIR spectroscopy, cNOx,FTIR, is subtracted from the NO concentration added to the gas flow, cNO. The integration yields the stored mass of NO:
The calculated stored amount of nitrogen oxide during this test is shown in Figure 3(b). It meets the expectations and indicates a constantly increasing mNO due to complete storage of the dosed NO between t2 = 2.5 h and the beginning of the NOx slip in the outlet at 3.1 h. The increased NO concentration in the feed gas for t3 < t < t4 goes along with a slightly increased stored amount of NO. The corresponding opposite behavior can be observed, when the NO feed gas concentration is lowered to 2,000 ppm at t4 = 6.5 h and the LNT releases NOx. After t5 = 8.5 h (0 ppm NO in the feed), the loading level decreases further due to NOx desorption from the LNT.
The same picture is given by the microwave resonance frequency, fres, in Figure 3(c) (note that the ordinate axis points downward to facilitate the comparison between the resonance frequency curve and the curve for the total stored NO mass, mNO). One can see clearly the difference of the signal between the rich and lean gas atmospheres soon after t1 at the beginning of the experiment. This is caused by the oxygen storage capability of the LNT formulation. As known from three-way catalysts, the oxidation state of ceria (as an oxygen storage component) has a major influence on the microwave absorption [28]. With the beginning of the NOx storage at t2, fres decreases constantly until about 3.3 h. From then on, it remains constant. The curve strongly resembles the NO mass loading curve in Figure 3(b). A further increased NO concentration in the feed gas (t3 < t < t4) also affects the microwave signal, indicating an increasing mass of stored NO in the LNT. Switching back to 2,000 ppm NO at t = t4, the resonance frequency shifts a little, reflecting the NOx release. Both, the curves of the calculated mass of stored NO and of the resonance frequency show that the second phase with 2,000 ppm NO results in a higher NOx loading compared to the first phase with the same concentration between t2 and t3 (3.5 h and 4.5 h). The desorption of NOx after switching to base feed gas without NO at t5 = 8.5 h is indicated by an increasing resonance frequency and therefore a lowered NOx loading level.
In summary, the results of this experiment give a first hint that the data obtained from the microwave-based approach indicate the NOx loading state of the LNT catalyst. The results coincide with the gas analysis in the outlet. This indicates that the NOx loading of the LNT can be measured directly by the contactless microwave-based monitoring technique.
3. Wirebound Impedimetric Sensor Approach
This section deals with the setup of the impedimetric sensors as well as with basic impedimetric measurements of one sensor sample. This is a precondition for the subsequent section, in which we report on the in situ observation of the entire LNT device by several impedimetric sensors along the catalyst combined with the microwave-based technique.
3.1 Wirebound Impedimetric Sensor Approach: Experimental Setup
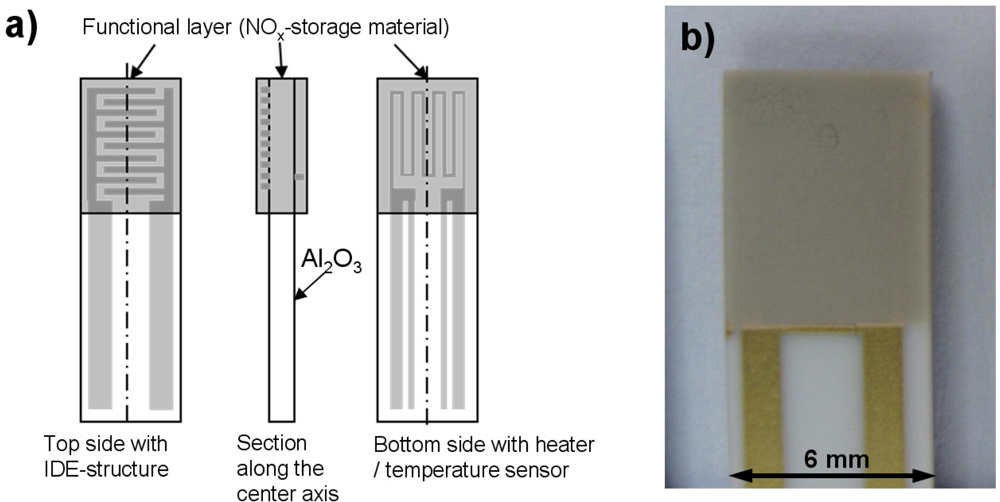
In order to directly measure the electrical properties (especially the electrical conductivity σ) of the NOx storage material in situ while NOx is sorbed or released, impedimetric sensors with the catalyst material as sensitive layers were constructed. Figure 4(a) shows sketches of the setup of the NOx loading sensor; Figure 4(b) is a photograph of one of the sensors employed. Alumina substrates (purity 99.6%) with the dimension of 51 mm × 6 mm and a thickness of 630 μm served as sensor substrates. At first, a platinum heater structure was screen-printed on the bottom side of the sensor and was fired at 1,200 °C for 20 min. The gold interdigitated electrode (IDE) structure on the top side was also screen-printed. Both the distances between the gold interdigitated electrodes and their width were 50 μm. The gold structures were fired at 850 °C for 20 min. Afterwards, an electrically insulating protection layer was screen-printed on top of the heater structure and fired at 850 °C for 2 h. Finally, the transducer was coated with the lean NOx trap (LNT) material itself. This material is identical with the LNT catalyst formulation, hence the sensitive layer represents the catalyst material itself. To deposit the LNT functional layer on the IDE structure, the sensors were dipped into the slurry consisting of the LNT powder mixed with distilled water. The LNT coated substrates were fired at 600 °C for 6 h. The sensors were degreened in lean-rich cycles for several hours to obtain stable signals for reproducible measurement results.
3.2 Wirebound Impedimetric Sensor Approach: Basic Results
In [19] and [29] it was found that the electrical conductivity of NOx storage materials at the operation temperature of several hundred °C depends on the state of the catalyst. These changes in the complex impedance Z can be analyzed via impedance spectroscopy.
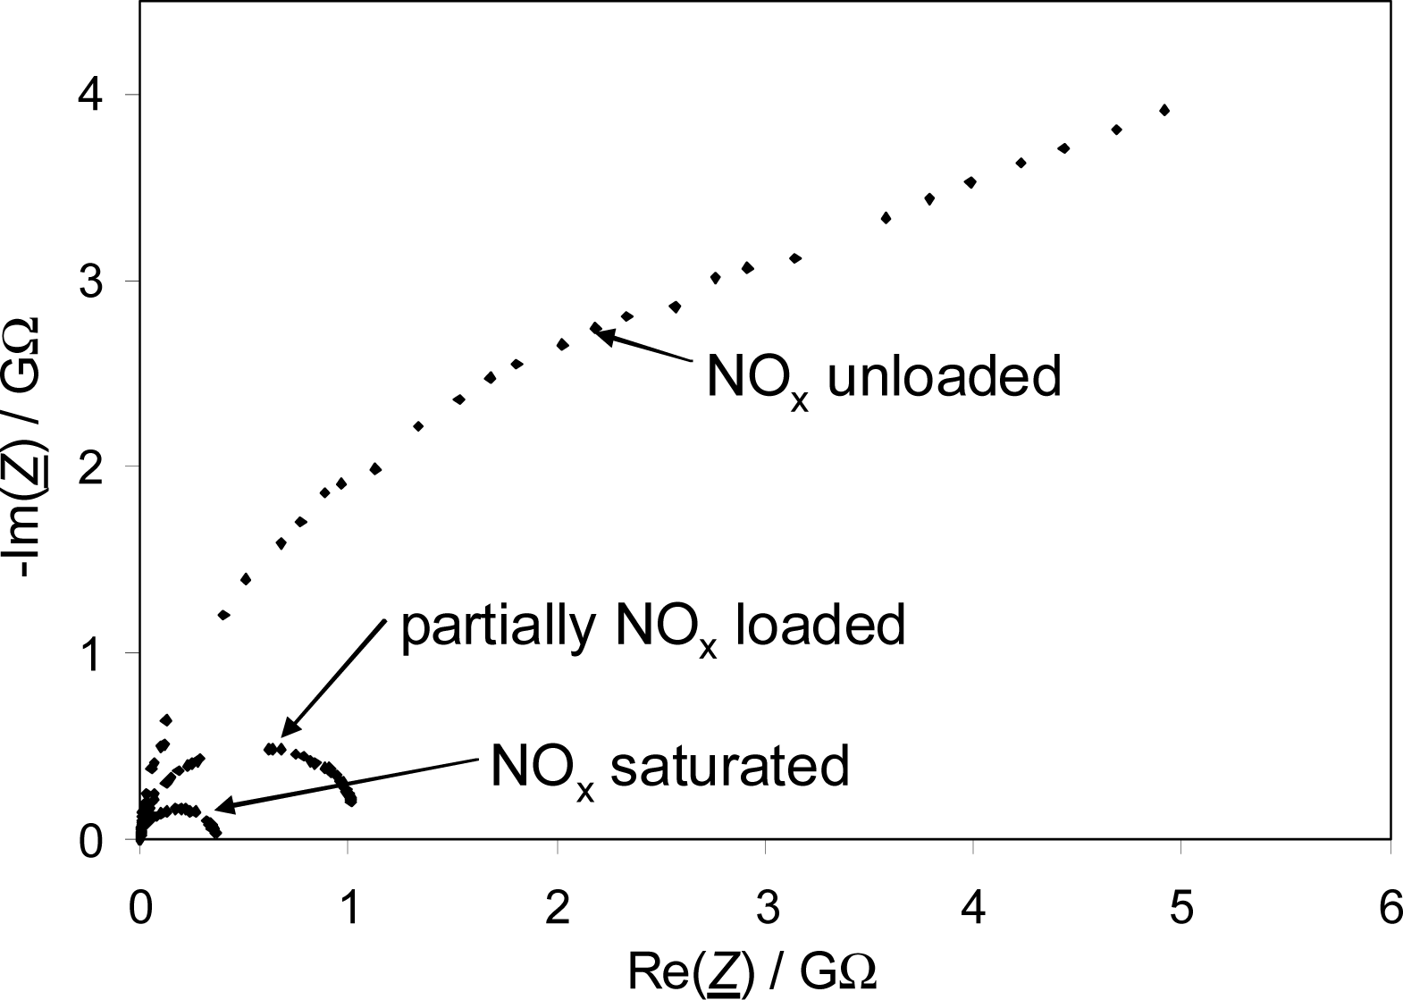
The measured impedance spectrum of a sensor coated with the LNT formulation reveals a semi-circle in the complex plane (-Im(Z) vs Re(Z)), at least if a little NOx is stored in the material. This is the typical appearance of an equivalent parallel circuit consisting of a resistor and a capacitor (Figure 5). The dielectric permittivity of the alumina substrate and to some extent of the LNT material contribute to the capacitance C. If the conductivity of alumina could be neglected, the measured resistance R would reflect the conductivity of the LNT material, which depends on its NOx loading state.
At first, before installing the impedimetric sensor device in the catalyst housing, the functionality of each single sensor was tested in a lean gas mixture (10% O2, 5% CO2 and 2% H2O in N2) at 350 °C. The complex impedance of the LNT material was observed while loading the storage sites with 24 ppm NOx (12 ppm NO and 12 ppm NO2). As an example, an impedance plot in the complex plane for different NOx loading states of one sensor is shown in Figure 5. Obviously, the sensor behaves as expected. Especially with increasing NOx loading, semicircles appear. With progressing NOx loading, the diameters of the semicircles, reflecting R, decrease clearly, which means that the conductivity of the material increases with NOx loading. In the unloaded state, however, the very high resistance of the LNT material may not be measured correctly. The resistance R in the NOx unloaded state gives a value in the range of 10 GΩ. Taking into account the geometry of the electrodes, a rough estimation of the resistivity using the geometry factor defined in [30] gives a value of about 1011 Ωcm. For comparison, at 350 °C, the resistivity of 99.6% alumina was determined to be about 1014 Ωcm by reference [31]. Therefore, the conductivity of the alumina substrate should have only a minor influence in the unloaded state. With increased NOx loading, the conductivity of the LNT-material increases also and the influence of the alumina substrate can be fully neglected.
4. Combination of Wirebound and Microwave-Based Method
With the microwave-based approach it was found that the loading state of the whole catalyst volume can be monitored, since the signal correlates with the average electrical properties whereas one can observe the change in the conductivity with a certain spatial resolution by impedimetric sensors with a catalyst coating. In this section, both techniques will be combined to obtain further information about the catalyst system.
4.1. Combination of Wirebound and Microwave-Based Method: Experimental Setup
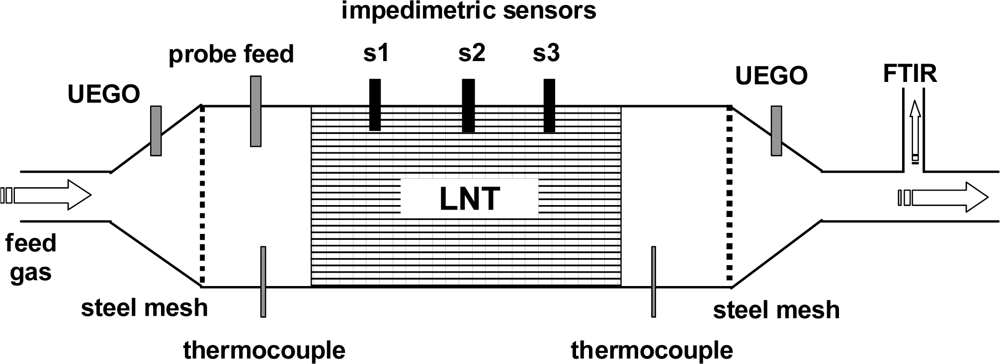
For the combined wirebound and microwave-based experiments, the test setup shown in Figure 1 was modified so that three impedimetric NOx loading sensors could be installed equidistantly in the housing of the catalyst. This expanded setup is shown in Figure 6. Each sensor was coated with a catalyst-identical film, so the impedance of each sensor reflects the NOx loading state at the corresponding position. The distance between each of the three sensors was 31 mm. Test cycles consisting of lean NOx loading and rich regeneration cycles were applied to the LNT catalyst. The results obtained with the FTIR spectroscopy are compared with the overall signal of the microwave-based technique and the locally resolved responses from the NOx loading sensors mounted along the gas flow axis of the LNT.
The entire test bench was heated to an operation temperature of 320 °C at a gas flow rate of 20 L/min. Either a lean base gas mixture of 5% CO2, 10% O2, and 2% H2O in N2 or a rich gas mixture (for regeneration) of 5% CO2, 1.5% H2 and 2% H2O in N2 was applied. The sensor in the middle of the catalyst volume (sensor S2) was measured with an impedance analyzer at a frequency of 1 kHz and an amplitude of 1 V. The resistance, R, of the sensitive layer was calculated from the impedance assuming an R||C equivalent circuit. For the sensors S1 and S3, the resistance was determined by measuring the voltage drop over the sensor by a voltage divider with a serial resistance of 1 MΩ and an applied dc voltage of 10 V. Thus, a digital multichannel voltmeter could be used instead of several impedance analyzers. Additionally, other sensor signals like the UEGO sensor and the thermocouples could be measured at the same time with the multichannel voltmeter.
The measured resistance and the NOx sensitivity of the sensors depend on the exact geometry of the sensitive layer and therefore vary little from sensor to sensor. For a better comparison of all sensor signals, a normalized sensor response A is introduced by:
Here, Runloaded and Rsaturated denote the resistances in the unloaded and the NOx saturated states, respectively. By relating the resistance change due to NOx loading to the maximal resistance change in the saturated state, the normalized sensor response A is always in the range of 0 and 100%.
4.2. Combination of Wirebound and Microwave-Based Method: Results
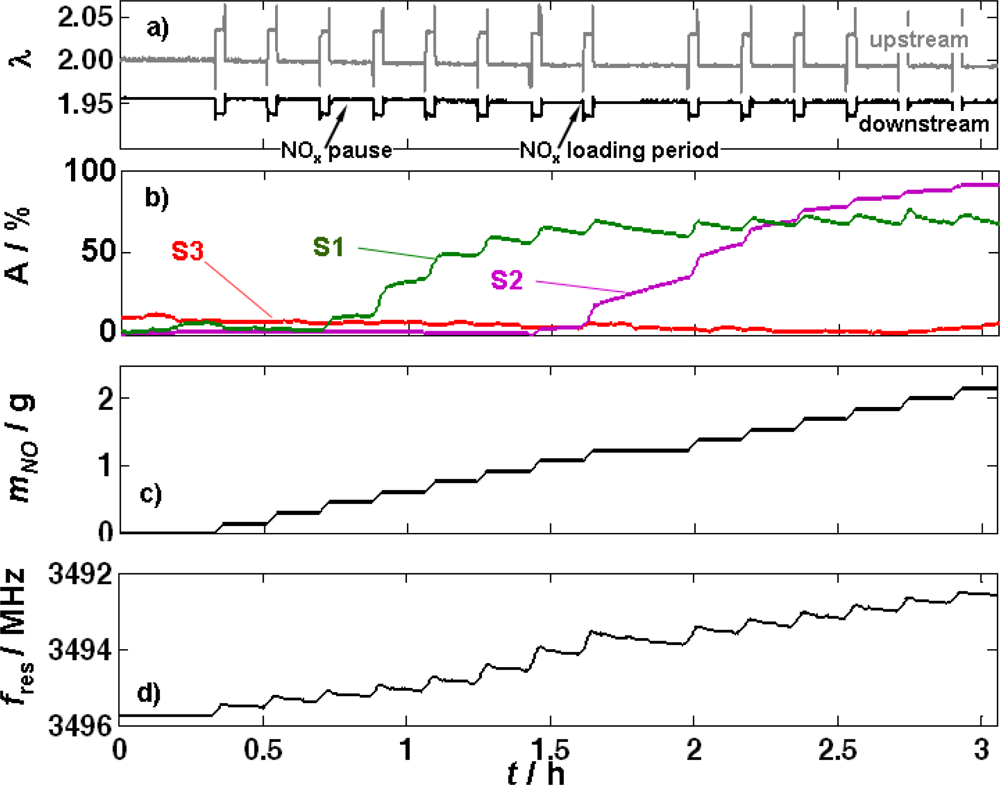
In the first experiment, the fully regenerated catalyst was loaded stepwise with a mixture of NO2 and NO. In Figure 7, the recorded data of this measurement are shown: the λ signals upstream and downstream of the catalyst [Figure 7(a)], the NOx loading sensor signals [Figure 7(b)], the amount of stored NO [Figure 7(c)], calculated from of the outlet NOx concentration determined by FTIR spectroscopy), and the curve of the resonance frequency [Figure 7(d)]. 2,750 ppm total NOx (consisting of 2,000 ppm NO and 750 ppm NO2) were added to the base gas for 120 s (labeled as NOx loading period) followed by a NOx-free interval for 540 s (denominated as NOx pause). This procedure was repeated several times to load successively the catalyst with NOx.
The sensor signal of the UEGO sensor upstream of the catalyst, displayed in Figure 7(a), acts as an auxiliary indicator for the presence of a NOx loading phase or a NOx pause. After the eighth loading phase (at about 1.7 h) a longer lasting NOx pause is eye-catching. It was intended to study the effects of a longer period without NOx on the loading sensor signals. As already described in Section 2.2, λ downstream of the catalyst is lower in the presence of NOx due to the consumption of O2 in the NOx storage process. The catalyst was able to store all the offered NOx in this experiment as no NOx slip occurred, which was proven by the NOx concentration data in the outlet taken by the FTIR spectrometer (not displayed here). λ downstream of the catalyst [Figure 7(a)] reflects this as well.
The normalized sensor response of the first loading sensor (S1) was the first to increase after introducing NOx to the feed gas [Figure 7(b)]. Already during the third NOx loading phase, its signal started to increase with each single NOx loading pulse. This is in accordance with the results from the pretests - the conductivity of the catalyst material is increasing in the presence of NOx. During the NOx pauses, the normalized sensor response of S1 remained constant during the first three NOx pauses, but later, when S1 was almost fully NOx loaded, A decreased again, indicating that some of the formerly stored NOx was released during NOx pauses. Since (practically) no NOx was found in the outlet gas (FTIR spectroscopy data), one has to assume that a “redistribution” of the stored NOx in the catalyst volume occurs. In other words, the released NOx from the material on S1 or the catalyst material around it (indicated by the normalized sensor response decrease during a NOx pause starting at t > 1.1 h), must have been restored on storage sites downstream of this position that have not been filled with NOx up to this point in time. Due to the high catalytic activity of the coating, one has to assume that the composition of the released NOx with respect to the NO2/NO ratio is in the equilibrium. At 320 °C, the equilibrium ratio of NO2/NO is about 70/30 [32]. After the seventh NOx pulse, the normalized sensor response of S2 also starts to change stepwise from the unloaded to the NOx saturated state. But the normalized sensor response of S2 (being downstream of S1) increases further in the NOx pause—in contrast to that of S1. This might also be an indicator for the rearrangement of the NOx stored in the catalyst in NOx pauses: NOx released in the front part can be restored in the rear part of the catalyst with unoccupied storage sites being available. The normalized sensor response of S3 appears to just start changing its value at the end of this experiment. This agrees with the observation that no NOx slip occurs during these 14 NOx pulses.
The total amount of stored NO during this test is calculated as described by Equation (4) and shown in Figure 7(c). The stored NO mass increases stepwise since NO was added to the feed gas in 14 steps and no NOx breakthrough was detected by the FTIR spectrometer.
The resonance frequency, which is related to the amount of stored NOx according to Figure 3(c), is shown in Figure 7(d), again with an inverted ordinate. At first glance, it shows the expected behavior—a continuous increase during each NOx loading phase and a constant value during NOx pauses. By comparing the curve of the total stored NO mass in Figure 7(c) with the resonance frequency data, it seems as if the non-continuous stepwise NOx loading of the catalyst can also be monitored by the microwave-based technique. In contrast to the impedimetric NOx loading sensors installed along the catalyst axis, it cannot measure the NOx loading locally. Therefore one would not have expected any kind of NOx rearrangement in the catalyst volume occurring during the NOx pauses to show up in the microwave signal. Since no NOx was detected by the FTIR spectrometer in the outlet gas, it is excluded that NOx left the catalyst. Hence, the slight resonance frequency increases occurring during NOx pauses between the NOx loading periods must be attributed to either a local rearrangement reaction or to the involvement of different storage reactions (e.g., nitrite-nitrate conversion) [9].
Altogether, the NOx loading sensors are able to give spatially resolved information on the NOx loading state, whereas the perturbation method mainly yields the average state of the catalyst volume. However, with respect to an exact NOx loading detection, the fact that the resonance frequency changes in the absence of NOx in the exhaust gas although the total mass of NOx stored in the LNT material was constant has to be seen very critically.
In order to distinguish between the influence of NO and NO2 in the feed gas, two separate experiments were carried out. In both gases, the LNT was kept at 320 °C and it was NOx loaded for 4 h. Either 750 ppm of NO or NO2 were added to the lean base gas. The NO or NO2 dosing started at t1 in both cases. The measurement results are compared in Figure 8.
In Figure 8(a), λ upstream and downstream of the catalyst obtained from the UEGO sensors is plotted. In the case of NO-dosing, λ upstream of the LNT jumps from 2.020 to 2.022 [indicated by “upstream (NO)”] as soon as NO is admixed to the base gas at t1. In contrast, λ rises up to 2.045 when NO2 is added instead of NO [“upstream (NO2)”. Downstream of the LNT, λ is 2.016 if NO and 2.038 if NO2 is admixed [“downstream (NO)” and “downstream (NO2)”, respectively]. The differences in λ downstream of the catalyst during NO or NO2 exposure can be explained the following: The catalytically active precious metal particles of the LNT catalyze the equilibrium reaction of NO and NO2. As described earlier, the NO2/NO-ratio is about 70/30 at 320 °C. In the case of the addition of NO to the feed gas, NO needs to be oxidized. Since this reaction consumes O2, λ decreases after adding NO. The opposite happens if one adds NO2 to the base gas: O2 is produced due to the reduction of some NO2 to NO and λ downstream of the catalyst increases. In the course of the experiment, the signals of the UEGO sensors downstream of the catalyst started to increase noticeably. In the case of NO exposure this occurs approximately at t2aNO ≈ 2.4 h and at t2aNO2 ≈ 3.3 h if NO2 is added to the base gas. Obviously, NOx slip starts to occur earlier if NO instead of NO2 is dosed.
This observation is confirmed by the FTIR gas analysis concentration downstream of the catalyst [Figure 8(b)]. Here, in both experiments NOx, was detected a little earlier (t2bNO and t2bNO2, respectively) compared to the increase in λ. The NO2/NO-ratio measured by the FTIR spectrometer was at about 70/30 in both cases, which agrees with the theoretically expected values [32], proving the high catalytic activity of the catalyst. The increase of the NOx levels when the first NOx slip occurs is higher if only NO is added to the base gas than it is in the case of NO2 admixture.
In Figure 8(c), the total mass of stored NO calculated from Equation (4) is displayed. Until the first NOx slip occurs at t2bNO, the lines corresponding to the dosing of NO and NO2 are the same and the slope is constant.
Figure 8(d) compares the resonance frequencies of both experiments. The resonance frequency decreases during NO as well as during NO2 exposure. At the early stage of the experiment, the resonance frequency decreases slightly faster in the case of loading with NO than with NO2. The slope of the curve when only NO is added to the feed gas increases with time, but approximately at t2bNO the curve starts to flatten again and a plateau establishes. This behavior is different if only NO2 is admixed to the feed gas. Then, an almost constant but small decrease of the resonance frequency can be observed for about 2 h of NO2 exposure, later the slope increases for about 0.5 h and flattens as well. It seems that the plateau corresponding to a constant NOx loading begins to settle at the end of the experiment. The plateau in the case of NO2 is at slightly lower values than that of NO, indicating a higher storage level, which is in accordance with the data in Figure 7(c).
The catalyst properties determined from the storage [Figure 8(b)] as well as the time characteristics of λ downstream of the LNT agree well with the literature [10]. It is well known that the NOx storage properties of LNTs are enhanced if exposing the catalyst to NO2 instead of NO and that therefore NOx slips occur at an earlier stage in the case of NO [10].
Looking at the outlet NOx concentration [Figure 8(b)] and the corresponding total stored NOx mass in Figure 8(c), it is obvious that the amount of NOx stored in the catalyst is the same for both experiments until NOx slip occurs at t2bNO. Up to this point, the average loading state of the catalyst in the case of NO dosing is equal to those during admixed NO2 in the feed gas. The curves of the resonance frequencies [Figure 8(d)] already differ from each other at this early stage, which suggests that the NOx loading state of the catalyst is not mirrored correctly in the microwave cavity resonance frequency.
Due to the high catalytic activity of the precious metals in the LNT, one would have expected that NO and NO2 are almost in an equilibrium and, therefore, the LNT should have behaved the same, independently of whether NO or NO2 is the basis for the nitrate formation. However, these effects have already been addressed in the literature, for instance in [9] or [33]. It has been shown that the special distribution of the NOx molecules stored in the catalyst is different when NO or NO2 is in the feed [33] and it has been suggested that different NOx storage reactions prevail in NO2 [9]. It is not the aim of this paper to study catalyst chemistry, but it is clear that such effects also may affect the conductivity of the involved materials and therefore influence the microwave parameters.
5. A Comparison of the Microwave-Based Approach for LNT NOx Loading Detection with other Exhaust Gas Aftertreatment Devices
The comparative analysis of the microwave data, the λ values, and the FTIR spectroscopy data reveals that the microwave cavity resonance frequency does not unambiguously depend on the average NOx loading state of the LNT as calculated from the gas analysis data. The results suggest that the involved storage reactions and the spatial distribution of the stored NOx in the catalyst depend on the type of NOx dosing. This might be mainly due to a better NO2 incorporation in the front area of the catalyst, since in the rear part of the catalyst NO and NO2 are in equilibrium owing to the high catalytic activity of the precious metals in the catalyst. The microwave-based method appears to be influenced by these local distributions and, therefore, may not be adequate to monitor the instantaneous average NOx loading state of the LNT in situ.
Two of the most crucial parameters of any measurement system for the loading states of catalysts in exhaust gas aftertreatment systems are the sensitivity and the cross-sensitivity. In the case of the microwave-based system, a normalized sensitivity may be defined by:
As can be inferred from Figure 7, the frequency difference between the unloaded and the fully loaded state is about Δfres ≈ −4 MHz and the resonance frequency at 0% NOx load is fres,unloaded ≈ 3,496 MHz. This yields Sload ≈ 11.4 ppm/%. In other words, for the investigated temperature and an O2 and NOx concentration in the feed gas as given above, each percent NOx loading (compared to the fully loaded state) reduces the resonance frequency by 11.4 ppm. For ammonia SCR catalysts, data are available from [23]. Here, some frequencies exist, at which water has only a negligible influence, e.g., at about 1,623 MHz. Under the conditions of reference [23] (Table 1; T = 300 °C; saturation at 500 ppm loading assumed as 100% ammonia load), a sensitivity of Sload ≈ 46.58 ppm/% is observed. By far larger sensitivities occur for the TWC and DPF cases. If one considers a fully soot loaded DPF of 9.2 g/L, one obtains a resonance frequency shift of about 60 MHz at a resonance frequency of ca 1,370 MHz [21]. This leads to a sensitivity of Sload ≈ 438 ppm/%. An effect of similar magnitude is found in TWCs. In this case, the resonance frequency changes very selectively (no cross effects towards H2O, CO, CO2 and only a very slight one towards the gas flow velocity) between 1,235 MHz in the rich oxygen-depleted case and 1,270 MHz in the fully oxidized lean case, corresponding to a sensitivity of Sload ≈ −276 ppm/% [35].
It should be noted at this point that it is very difficult to define 100% full load, since it mostly depends on the gas concentration, as this is also the case for LNT [cf. Figure 3(b); there is an additional storage after increasing the inlet NO concentration from 2,000 to 4,000 ppm]. Therefore, the Sload values are only rough estimates, but the trend that the sensitivity in the case of the LNT is much lower remains. This is attributed to the fact that, despite the conductivity increase of the NOx storage material due to the NOx loading, the material always remains a bad conductor [19,29,36], especially when compared with the conductivity changes in the case of TWC coating material or of soot deposited in DPFs.
In TWCs, ceria-zirconia mixed oxides in the washcoat serve as oxygen storage components. Ce changes its valence state from Ce4+ to Ce3+ when it gets reduced and back to Ce4+ when it gets oxidized. Since the concentration of Ce3+ is identical with the free electron concentration, the conductivity of the TWC coating responds strongly to oxygen loading [37]. This effect is so pronounced that even conductometric oxygen gas sensors using ceria zirconia mixtures are under investigation [38]. The difference in conductivity between the oxygen-depleted and the oxygen-loaded states is about three decades. Small side effects stemming from responses towards NO2 or CO, as they can typically be expected for n-type semiconductors [39], occur in the small region around the interface between grains and exhaust and barely affect the overall conductivity. Hence, the microwave signal hardly responds to these possible interfering gas components [35].
In DPFs, soot is deposited in the filter channels of the ceramic wall flow filters [40]. Since soot is electrically conducting—the electrical surface conductivity of planar alumina substrates changes by decades during soot deposition [41,42]—the microwave properties are strongly affected. The effects are large, since already a small soot load leads to significant microwave absorption and resonance frequency shifts [21], and disturbing effects are negligible.
In ammonia SCR catalysts, the knowledge of the ammonia loading is crucial, especially at low catalyst operation temperatures. The importance of the ammonia loading on zeolite-based SCR-catalyst has been shown for example in reference [43]. Although the resonance shift is smaller than in the case of DPFs and TWCs and only a little larger than in the case of LNTs, one cannot compare the effects occurring for LNTs and zeolite-based SCR catalysts, as there is a significant difference in the mechanism that leads to conductivity increases in these lean NOx abatement systems. In the zeolites, the conductivity is an ionic one, and owing to the framework structure in combination with the assumed Grotthus type conduction mechanism [44], a very selective conductivity change occurs with ammonia loading [24,45]. Clearly, a strong temperature dependency has to be expected in the case of zeolite-based SCR catalysts, but compared to the LNT, at least there is no cross-sensitivity towards the oxygen concentration [see the differences between lean and rich in Figure 3(c)]. In addition, in the TWC and DPF systems, the reproducibility is high. For instance, in the study of DPFs in Reference [21], seven different samples were investigated and all samples behaved in a very similar manner. In the present study, only one LNT device was used. Small changes in the setup and maybe also in the sample temperature lead to a shift in the resonance frequencies that exceeds the measuring effect. This can be seen for instance in the small difference of the resonance frequencies in the unloaded state between Figures 7 and 8. Furthermore, from impedimetric measurements of the LNT materials, a strong temperature dependence is known [34]. Hence, one can expect that the microwave signals in LNTs are by far more affected by temperature than they are for instance in soot-loaded DPFs.
6. Conclusion
Two powerful in-situ measurement techniques—one wirebound and one microwave-based—were applied to a NOx storage and reduction catalyst (LNT) to obtain further knowledge about the reactions occurring in the catalyst volume. As a result of previous research on other catalyst systems (three-way catalyst, SCR systems and diesel particulate filters) the signals of the microwave-based approach were expected to mainly reflect the average loading state of the whole catalyst volume, whereas the wirebound sensors were assumed to locally resolve it.
It was shown that both systems are able to detect the different catalyst conditions “lean without NOx” and “lean with NOx” as a result of differences in the electrical properties of the storage material.
In addition to the microwave-based setup, three impedimetric sensors—coated with the catalyst material—were inserted in the catalyst device equidistantly. With this combined setup, the progression of the NOx loading front along the catalyst during NOx in the feed could be monitored simultaneously with the microwave-based as well as with the wirebound technique. The measurement results with the impedimetric sensors demonstrated that the NOx loading starts in the front part of the catalyst volume and propagates downstream. The stepwise loading of the catalyst by switching between lean gas with and without NOx could be seen in the microwave data as well as in the sensor response. The sensor signals showed additionally that there is a reordering of the formerly stored NOx in the absence of NO in the feed gas. This release and restoring process yields a broadening of the storage profile in the catalyst. The resonance frequency appears to be also influenced by this reordering, which might be caused by the differences in the distribution of the stored NOx in the catalyst. In addition, the influence of the kind of NOx dosing was investigated: the curve of the gas analysis data showed that NO2 can be stored more easily and to a higher extent in the catalyst volume compared to NO. The resonance frequency curve also reflected this up to a certain extent of loading. But already prior to the first NOx slip, the resonance frequency shift decreased nonlinearly and deviated from the loading state of the catalyst calculated by balancing the mass of stored NO. This effect became very pronounced when the influence on the microwave signal was studied for separate admixtures of NO or NO2 to the lean feed gas. The differences in the resonance shifts cannot be explained by a different NOx loading level of the LNT.
As a conclusion, our experiments indicate that in general the NOx loading state of an LNT can be detected by the microwave-based technique. However, the sensitivity of the method is small compared to that previously observed for three-way catalysts, SCR catalysts and diesel particulate filters. For this reason, interfering effects gain in importance, which may limit the practical applicability of the microwave-based NOx loading detection in lean NOx traps.
Acknowledgments
Catalytic converters have kindly been provided by Umicore AG & Co. KG. The authors Ralf Moos and Gerhard Fischerauer thank the German Research Foundation (DFG) for supporting this work under grant numbers FI 956/3-1, FI 956/5-1, MO 1060/6-1, and MO 1060/13-1.
References
- Alkemade, UG; Schumann, B. Engines and exhaust after treatment systems for future automotive applications. Solid State Ionics 2006, 177, 2291–2296. [Google Scholar]
- Gabrielsson, PLT. Urea-SCR in automotive applications. Topics in Catalysis 2004, 28, 177–184. [Google Scholar]
- Takeuchi, M; Matsumoto, S. NOx storage-reduction catalysts for gasoline engines. Topics Catal 2004, 28, 151–156. [Google Scholar]
- Kašpar, J; Fornasiero, P; Hickey, N. Automotive catalytic converters: current status and some perspectives. Catal. Today 2003, 77, 419–449. [Google Scholar]
- Baik, JH; Yim, SD; Nam, I-S; Mok, YS; Lee, J-H; Cho, BK; Oh, SH. Control of NOx emissions from diesel engine by selective catalytic reduction (SCR) with urea. Topics Catal 2004, 30–31, 37–41. [Google Scholar]
- Weibel, M; Waldbüßer, N; Wunsch, R; Chatterjee, D; Bandl-Konrad, B; Krutzsch, B. A Novel Approach to Catalysis for NOx Reduction in Diesel Exhaust Gas. Topics Catal 2009, 52, 1702–1708. [Google Scholar]
- Dawody, J; Skoglundh, M; Wall, S; Fridell, E. Role of Pt-precursor on the performance of Pt/BaCO3/Al2O3•NOx storage catalysts. J. Molecul. Catal. A: Chem 2005, 225, 259–269. [Google Scholar]
- Nova, I; Castoldi, L; Lietti, L; Tronconi, E; Forzatti, P; Prinetto, F; Ghiotti, G. NOx adsorption study over Pt-Ba/alumina catalysts: FT-IR and pulse experiments. J. Catal 2004, 222, 377–388. [Google Scholar]
- Roy, S; Baiker, A. NOx Storage catalysis: From mechanism und materials properties to storage-reduction performance. Chem. Rev 2009, 109, 4054–4091. [Google Scholar]
- Epling, WS; Campbell, LE; Yezerets, A; Currier, NW; Parks, JE. Overview of the fundamental reactions and degradation mechanisms of NOx storage/reduction Catalysts. Catal. Rev 2004, 6, 163–245. [Google Scholar]
- Hertzberg, A. Betriebsstrategien für einen Ottomotor mit Direkteinspritzung und NOx-Speicher-Katalysator; (in German), Ph.D. Thesis, Universität Karlsruhe, Karlsruhe, Germany. 2001. [Google Scholar]
- Zhuiykov, S; Miura, N. Development of zirconia-based potentiometric NOx sensors for automotive and energy industries in the early 21st century: What are the prospects for sensors? Sens. Actuat. B: Chem 2007, 121, 639–651. [Google Scholar]
- Fergus, JW. Materials for high temperature electrochemical NOx gas sensors. Sens. Actuat. B: Chem 2007, 121, 652–663. [Google Scholar]
- Moos, R. Catalysts as sensors—A promising novel approach in automotive exhaust gas aftertreatment. Sensors 2010, 10, 6773–6787. [Google Scholar]
- Kato, N; Kokune, N; Lemire, B; Walde, T. Long Term Stable NOx Sensor with Integrated In-Connector Control Electronics; Technical Paper 1999-01-0202; SAE International: Warrendale, PA, USA, 1999. [Google Scholar]
- Sasaki, H; Scholl, D; Parsons, M; Inagaki, H; Shiotani, K; Visser, J; Zawacki, G; Kawai, T; Teramoto, S; Kubinski, D. Development of an Al2O3/ZrO2-Composite High-Accuracy NOx Sensor; Technical Paper 2010-01-0041; SAE International: Warrendale, PA, USA, 2010. [Google Scholar]
- Moos, R; Wedemann, M; Spörl, M; Reiß, S; Fischerauer, G. Direct Catalyst Monitoring by Electrical Means: An Overview on Promising Novel Principles. Topics Catal 2009, 52, 2035–2040. [Google Scholar]
- Moos, R; Zimmermann, C; Birkhofer, T; Knezevic, A; Plog, C; Busch, MR; Ried, T. Sensor for directly determining the state of a NOx storage catalyst; Technical Paper 2008-01-0447; SAE International: Warrendale, PA, USA, 2008. [Google Scholar]
- Zimmermann, C. Neuartiger Sensor zur Bestimmung des Zustandes eines NOx-Speicherkatalysators; (in German). Moos, R, Fischerauer, G, Eds.; Bayreuther Beiträge zur Sensorik und Messtechnik; Shaker-Verlag: Aachen, Germany, 2007; Volume 2. [Google Scholar]
- Reiß, S; Spörl, M; Hagen, G; Fischerauer, G; Moos, R. Combination of wirebound and microwave measurements for in-situ characterization of automotive three-way catalysts. IEEE Sensors J 2011, 11, 434–438. [Google Scholar]
- Fischerauer, G; Förster, M; Moos, R. Sensing the soot load in automotive diesel particulate filters by microwave methods. Meas. Sci. Tech 2010, 21, 035108. [Google Scholar]
- Fischerauer, G; Spörl, M; Reiß, S; Moos, R. Mikrowellengestützte Aufklärung elektrochemischer Vorgänge in Katalysatoren und verwandten Systemen (In German). Technisches Messen 2010, 77, 419–427. [Google Scholar]
- Reiß, S; Schönauer, D; Hagen, G; Fischerauer, G; Moos, R. Monitoring the ammonia loading of zeolite-based ammonia SCR catalysts by a microwave method. Chem. Eng. Tech 2011, 34, 791–796. [Google Scholar]
- Kubinski, DJ; Visser, JH. Sensor and method for determining the ammonia loading of a zeolite SCR catalyst. Sens. Actuat. B: Chem 2008, 130, 425–429. [Google Scholar]
- Barochi, G; Rossignol, J; Bouvet, M. Development of microwave gas sensors. Sens. Actuat. B: Chem 2011, 157, 374–379. [Google Scholar]
- Chao, SH. Measurements of microwave conductivity and dielectric constant by the cavity perturbation method and their errors. IEEE Trans. Microwave Theory Tech 1985, 33, 519–526. [Google Scholar]
- Riegel, J; Neumann, H; Wiedenmann, HM. Exhaust Gas Sensors for Automotive Emission Control. Solid State Ionics 2002, 152–153, 783–800. [Google Scholar]
- Fischerauer, G; Spörl, M; Gollwitzer, A; Wedemann, M; Moos, R. Catalyst State Observation via the Perturbation of a Microwave Cavity Resonator. Frequenz 2008, 62, 180–184. [Google Scholar]
- Geupel, A; Schönauer, D; Röder-Roith, U; Kubinski, DJ; Mulla, S; Ballinger, TH; Chen, H-Y; Visser, JH; Moos, R. Integrating nitrogen oxide sensor: A novel concept for measuring low concentrations in the exhaust gas. Sens. Actuat. B: Chem 2010, 145, 756–761. [Google Scholar]
- Schönauer, D; Moos, R. Detection of water droplets on exhaust gas sensors. Sens. Actuat. B: Chem 2010, 148, 624–629. [Google Scholar]
- Rettig, F; Wickles, M; Kita, J; Moos, R. Anwendbarkeit von kommerziellen LTCC-Materialien für Gassensoren. cfi/Ber. DKG 2005, 82, 197–200. [Google Scholar]
- Rodrigues, F; Juste, L; Potvin, C; Tempère, JF; Blanchard, G; Djèga-Mariadassou, G. NOx storage on barium-containing three-way catalyst in the presence of CO2. Catal. Lett 2001, 72, 59–64. [Google Scholar]
- AL-Harbi, M; Epling, WS. Investigating the Effect of NO Versus NO2 on the Performance of a Model NOx Storage/Reduction Catalyst. Catal. Lett 2009, 130, 121–129. [Google Scholar]
- Geupel, A; Kubinski, DJ; Mulla, S; Ballinger, TH; Chen, H-Y; Visser, JH; Moos, R. Integrating NOx Sensor for Automotive Exhausts—A Novel Concept. Sensor Lett 2011, 9, 311–315. [Google Scholar]
- Reiß, S; Wedemann, M; Spörl, M; Fischerauer, G; Moos, R. Effects of H2O, CO2, CO, and flow rates on the RF-based monitoring of three-way catalysts. Sensor Lett 2011, 9, 316–320. [Google Scholar]
- Tamaki, J; Fujimori, K; Miura, N; Yamazoe, N. Sensing characteristics of semiconductor barium carbonate sensor to nitrogen oxides at elevated temperature. Proceedings of the Second East Asia Conference on Chemical Sensors, Xi’an, China, 5–8 October 1995; pp. 81–84.
- Reiß, S; Wedemann, M; Moos, R; Rösch, M. Electrical in-situ characterization of three-way catalyst coatings. Topics Catal 2009, 52, 1898–1902. [Google Scholar]
- Izu, N; Oh-hori, N; Shin, W; Matsubara, I; Murayama, N; Itou, M. Response of resistive oxygen sensors using Ce1-xZrxO2 (x = 0.05, 0.10) thick films in propane combustion gas. Sens. Actuat. B: Chem 2008, 130, 105–109. [Google Scholar]
- Williams, DE. Semiconducting oxides as gas-sensitive resistors. Sens. Actuat. B: Chem 1999, 57, 1–16. [Google Scholar]
- Twigg, MV; Phillips, PR. Cleaning the air we breathe—Controlling diesel particulate emissions from passenger cars. Platinum Metals Rev 2009, 53, 27–34. [Google Scholar]
- Ochs, T; Schittenhelm, H; Genssle, A; Kamp, B. Particulate Matter Sensor for on Board Diagnostics (OBD) of Diesel Particulate Filters (DPF); Technical Paper 2010-01-0307; SAE International: Warrendale, PA, USA, 2010. [Google Scholar]
- Hagen, G; Feistkorn, C; Wiegärtner, S; Heinrich, A; Brüggemann, D; Moos, R. Conductometric soot sensor for automotive exhausts: Initial studies. Sensors 2010, 10, 1589–1598. [Google Scholar]
- Kröcher, O; Devadas, M; Elsener, M; Wokaun, A; Söger, N; Pfeifer, M; Demel, Y; Mussmann, L. Investigation of the selective catalytic reduction of NO by NH3 on Fe-ZSM5 monolith catalysts. Appl. Catal. B: Environ 2006, 66, 208–216. [Google Scholar]
- Simon, U; Flesch, U; Maunz, W; Müller, R; Plog, C. The effect of NH3 on the ionic conductivity of dehydrated zeolites Na beta and H beta. Microporous Mesoporous Mater 1998, 21, 111–116. [Google Scholar]
- Franke, M; Simon, U; Moos, R; Knezevic, A; Müller, R; Plog, C. Development and working principle of an ammonia gas sensor based on a refined model for solvate supported proton transport in zeolites. Phys. Chem. Chem. Phys 2003, 5, 5195–5198. [Google Scholar]


© 2011 by the authors; licensee MDPI, Basel, Switzerland. This article is an open access article distributed under the terms and conditions of the Creative Commons Attribution license (http://creativecommons.org/licenses/by/3.0/).
Share and Cite
Fremerey, P.; Reiß, S.; Geupel, A.; Fischerauer, G.; Moos, R. Determination of the NOx Loading of an Automotive Lean NOx Trap by Directly Monitoring the Electrical Properties of the Catalyst Material Itself. Sensors 2011, 11, 8261-8280. https://doi.org/10.3390/s110908261
Fremerey P, Reiß S, Geupel A, Fischerauer G, Moos R. Determination of the NOx Loading of an Automotive Lean NOx Trap by Directly Monitoring the Electrical Properties of the Catalyst Material Itself. Sensors. 2011; 11(9):8261-8280. https://doi.org/10.3390/s110908261
Chicago/Turabian StyleFremerey, Peter, Sebastian Reiß, Andrea Geupel, Gerhard Fischerauer, and Ralf Moos. 2011. "Determination of the NOx Loading of an Automotive Lean NOx Trap by Directly Monitoring the Electrical Properties of the Catalyst Material Itself" Sensors 11, no. 9: 8261-8280. https://doi.org/10.3390/s110908261