Detection of Hydrofluoric Acid by a SiO2 Sol-Gel Coating Fiber-Optic Probe Based on Reflection-Based Localized Surface Plasmon Resonance

Abstract
: A novel fiber-optic probe based on reflection-based localized surface plasmon resonance (LSPR) was developed to quantify the concentration of hydrofluoric acid (HF) in aqueous solutions. The LSPR sensor was constructed with a gold nanoparticle-modified PMMA fiber, integrated with a SiO2 sol-gel coating. This fiber-sensor was utilized to assess the relationship between HF concentration and SiO2 sol-gel layer etching reduction. The results demonstrated the LSPR sensor was capable of detecting HF-related erosion of hydrofluoric acid solutions of concentrations ranging from 1% to 5% using Relative RI Change Rates. The development of the LSPR sensor constitutes the basis of a detector with significant sensitivity for practical use in monitoring HF solution concentrations.1. Introduction
Hydrofluoric acid (HF) is a contact poison and highly corrosive. It is used in certain specific chemical processes, such as wafer cleaning in the microelectronics industry [1], TFT-LCD manufacturing [2,3], and utilization for etching procedures on circuit boards and as a glass thinner. It is also used in dentistry to etch porcelain laminate veneers to produce micro-undercuts for bonding restoratives to fractured porcelain [4–6]. Nevertheless, the noxious characteristics of hydrofluoric acid can cause tremendous problems in the human body, such as severe burns and occupational poisoning. To effectively monitor online the concentration of HF is thus an enormously important and challenging task in chemical processing control which, in turn, will significantly affect product yields and environmental regulations.
Analytical methods currently employed to measure HF in an industrial environment include the infrared (IR) spectroscopic method [7,8], electrochemical methods [9], interferometry [10,11], acoustic wave sensors [12–15] and microcantilevers [16], etc. The IR spectroscopic method requires expensive and complex instrumentation and is therefore unsuitable for field analysis of multiple samples. Other acoustic wave devices such as surface transverse wave (STW) devices [12,13], LOVE-wave devices [14], and STW devices deposited on AT quartz coated by a fused silica layer [15] are excellent for real-time, in-field analysis of HF in the ppm level. Tang et al. applied a SiO2 microcantilever to detect HF at the femtomolal level [16]. However, the application of chemical processing control to online monitor the concentration of HF in weight-percent range of these systems has not been sufficiently developed.
Recently, a novel fiber-based sensor based on the particular optic properties of gold nanoparticles has been developed [17–19]. When an optical field is incident upon noble metal nanoparticles, absorption occurs if the optical frequency is resonant with the collective oscillation of the conduction electrons. This phenomenon is known as localized surface plasmon resonance (LSPR), and does not occur in bulk metals. The local environment of metal nanoparticles tends to significantly influence the resonance frequency and absorption of LSPR [20,21]. The light absorption level of gold nanoparticles is sensitive to both the refractive index (RI) of the surrounding solvent and the binding events of those functionalized nanoparticles.
The application of a SiO2 sol-gel coating LSPR for detecting HF is particularly feasible, as SiO2 tends to react uniquely with HF. The characteristics of HF to selectively react with SiO2 have been well reported [22–25]. The corresponding reaction schemes are as shown below:
It seems promising to design a highly selective and sensitive detector for HF by utilizing the characteristics of SiO2 to selectively react with HF, but not with the other acids such as HCl or H2SO4, so its specificity to detect HF can be highly reliable. A novel SiO2 sol-gel coating LSPR sensor constructed with gold-nanoparticle modified optical fibers with high sensitivity for monitoring HF is therefore reported in this study. Instead of glass optical fiber, polyethylmethacrylate (PMMA) optical fiber [26] was used in this study to avoid the fibers being eroded by hydrofluoric acid during the detection process.
2. Materials and Methods
2.1. Reagents and materials
Plastic optical fibers (graded-index PMMA, Corning) were structured as the core and cladding with diameters of 400 and 430 μm, respectively. The chemicals (supplier) applied in this study included: n-hexadecyltrimethylammonium bromide (CTAB, Fluka), sodium borohydride (Lancaster), 3-(mercaptopropyl)trimethoxysilane (APTES, Acros), N-(2-mercaptopropionyl) glycine (MG, Fluka), cystamine dihydrochloride (Sigma), glutaraldehyde (Sigma), 1-ethyl-3-(3-dimethylaminopropyl)-carbo-diimide hydrochloride (EDC, Sigma), and N-hydroxysuccinimide (NHS, Sigma). All the aqueous solutions were prepared with purified water with a specific resistance of 18 MΩ cm generated by a Ropure ST water purification system (Barnstead).
2.2. Preparation of colloidal gold solutions
Hydrogen tetrachloroaurate solution (4.52 × 10⁻⁴ M) was prepared by mixing an aqueous solution of hydrogen tetracholoraurate (1.78 mL, 25.4 nM) with chloroform (8.22 mL) and an ethanol solution of CTAB (0.4 mL, 0.02 M). The mixed solution was thoroughly stirred for 10 minutes. Freshly prepared ethanolic NaBH4 solution (0.8 mL, 0.15 M) was added to the hydrogen tetrachloroaurate solution with vigorous stirring for 30 minutes. The ruby-colored organic phase was thereafter separated. Absorption spectra of the samples were investigated by utilizing a Hitachi U-2001 UV–VIS spectrophotometer. A Jeol transmission electron microscope (TEM) 1200EX was applied to observe the dispersed samples after they were dried on copper grids. Histograms derived from TEM image analysis showed that the mean diameter of the Au nanoparticles was 9.6 ± 2.3 nm.
2.3. Preparation of gold nanoparticle-modified PMMA optical fibers
The unclad portion (5 cm) of the PMMA optical fibers was cleaned and soaked in vials of NaOH (1M) for 24 hours. Subsequently these optical fibers were rinsed, dried, and submerged into the solution prepared by mixing APTES (0.0357 g), NHS (0.0295 g), EDC (0.0408 g) with 1% solution of APTES in EtOH contained within a 15-mL deionized water vials. The PMMA optical fibers were hence cleaned with ethanol and dried at 80 °C for ten minutes. As soon as its temperature dropped to the room temperature, the optic fibers were immediately immersed in colloidal gold solutions for 2 hours. They were thereafter withdrawn, rinsed, and soaked with deionized water for a day. The PMMA optical fibers modified with gold nanoparticles were thenceforth ready for this study once deionized water rinsing and drying were completed. TEM image analysis revealed that the thickness of the Au nanoparticles coating on the PMMA optical fiber was around 40 nm.
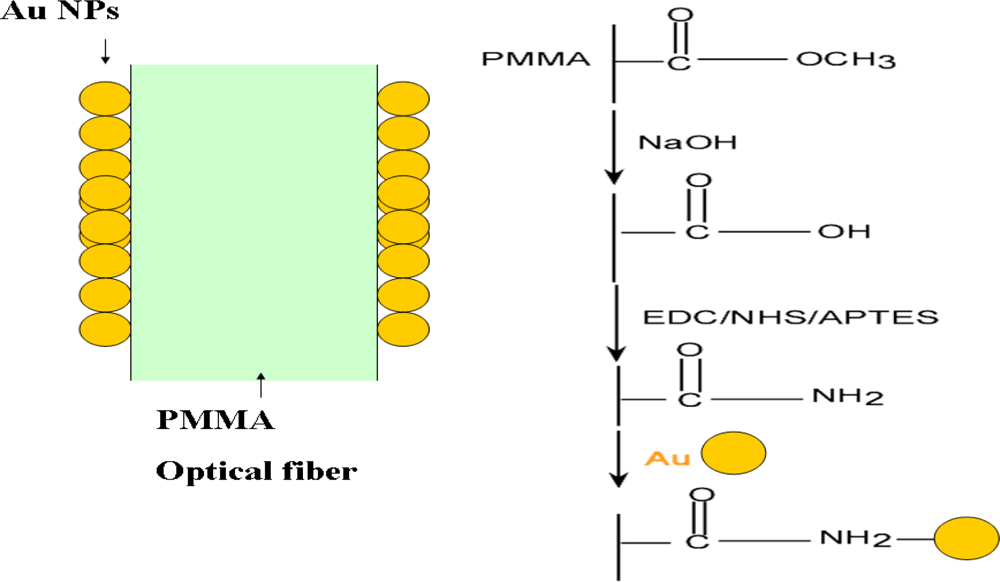
The reaction mechanism of the immobilization and localization of the gold nanoparticles on PMMA optical fiber is shown schematically in Figure 1. The -COOCH3 functional groups on the PMMA surface tends to be hydrolyzed into -COOH groups as the PMMA was soaked in NaOH solution. The conversion of the -COOH functional groups into -CONH2 ones could be achieved by using EDC/NHS treatment with APTES. The -NH2 molecular structure is part of the terminal functional group in CONH2, which is modified on PMMA surface. The -NH2 structure inclines to bond with gold nanoparticles in water phase by electrostatic attraction between negative and CTAB-capped gold nanoparticles [27].
2.4. Preparation of PMMA optical fibers with sol-gel SiO2 coating
The synthesis of sol-gel solutions of SiO2 started with the preparation of the inorganic precursor sol from tetramethylorthosilicate (TMOS, 98%). The pH value during the preparation was adjusted by differential combination of HCl and NH4OH, which would act as catalysts. Since the structure of pore size and mechanical strength of bulk SiO2 were critically controlled by the molal ratio of H2O/TMOS during the sol-gel synthesis, this molal ratio (R value) was ranged from 4 to 15 in this study. The SiO2 coating process started with having sol-gel solutions dipped in the ice bath at 4 °C for 30 minutes, and afterwards it was placed in the environment at the room temperature for 150 minutes. The gold-modified PMMA optical fibers were then steadily inserted into the sol-gel; subsequently had them withdrawn at the speed of 3 cm per minute, and dried for 1 hour. These optic fibers were positioned into sol-gel filled cylindrical molds again at the room temperature for 12 hours, and thereafter the freeze-dried procedure was executed to obtain a layer of thick-film bulk coating. The coating thickness could be increased by repeating the molding procedure as needed.
2.5. HF detection
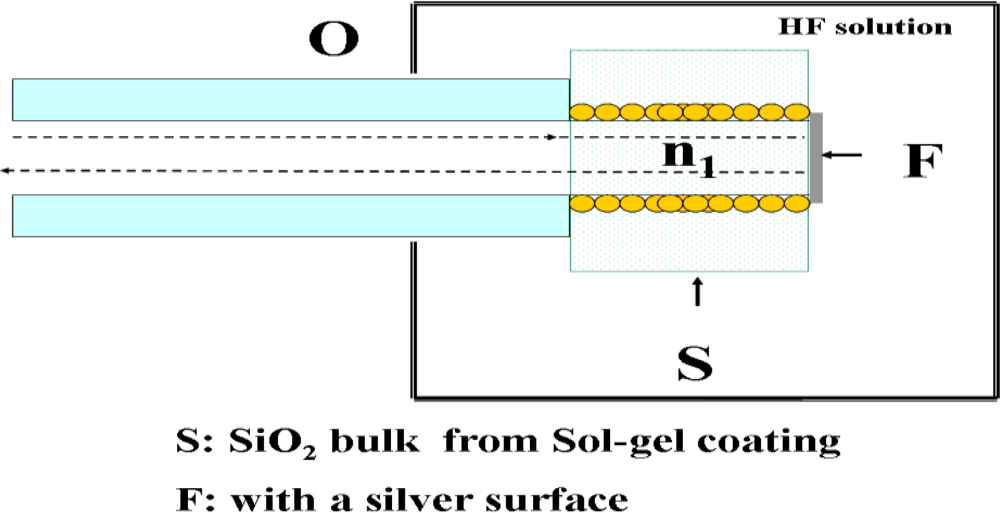
To enhance the reflection capacity of the LSPR fiber-optic probe, its distal ends were polished to form an optically smooth surface so that the reflection efficiency could be magnified. A silver film was then coated at the polished distal end. In this study, various lengths of unclad portions were used in order to obtain the optimal length for each type of gold-nanoparticle modified optical fibers (NMAuOFs). Their differential responses in terms of sensing capacity were compared in different refractive index (RI) media made up of sucrose solutions.
The LSPR sensor in this study was constructed with gold-modified nanoparticles on the unclad portion of PMMA fiber, which integrated with SiO2 sol-gel coating (Figure 2). A silver film [Figure 2(F)] was embedded to the terminal end of the unclad portion of the probe, and the light reflected by sensing material of SiO2 sol-gel coating was collected at the proximal end of the fiber probe.
For the assessment of sensing the sol-gel SiO2 coating LSPR fiber-optic probe was exposed to HF concentrations in a range from 0.25% to 8% for 30–120 minutes. At least five replicates were performed for each measurement. The sensitivity of the LSPR NMAuOFs sensor was defined as changes of the normalized intensity when measurement of a unit concentration of HF was performed.
2.6. Principle of the reflection-based LSPR fiber-optic sensor
When an optical field is incident upon noble metal nanoparticles, absorption will occur spontaneously if the optical frequency is resonant with the collective oscillation of the conduction electrons. This unique optical property makes LSPR sensing possible. However, the local environment of noble metal nanoparticles will significantly influence the resonance frequency and absorption of LSPR. Therefore, the absorption level of gold nanoparticles is highly sensitive to the refractive index (RI) of surrounding solvents as well as to the binding events of those functionalized nanoparticles.
The evanescent field absorption measurements of the fiber-optic were performed by comparing the light intensity of a sensor immersed in the analyzed HF solution at a testing condition (I) to the intensity of the sensor in a blank or a maximal value as a referring condition (IR). According to Nath and Chilkoti [28], the absorbance of the NMAu changed in a solution of RI different from that of a blank. At an absorbance wavelength, the light attenuation can be described by Degrandpre and Burgess [29] as:
The first term of Equation (3) describes that at a non-absorbing wavelength, the attenuation of absorbance signal results from the change in numerical aperture (NA), which is affected by a shift in critical angle for internal reflection [30]. In this term, the NA and NAR are given by:
The second term of Equation (3) describes the attenuation caused by absorption of light in the cladding. It shows a pseudo-Beer’s-dependence of the absorbance on the absorptivity of NMAu, which will vary with NMAuOF length, density of gold nanoparticles on the fiber, and mean absorption cross-section of the gold nanoparticles. The power distribution ηp is the fraction of total light intensity in the evanescent field; α is the absorptivity of NMAu per unit length, and L is the fiber length. The power distribution can be calculated by the following equation [28]:
2.7. Instrumentation and measurements
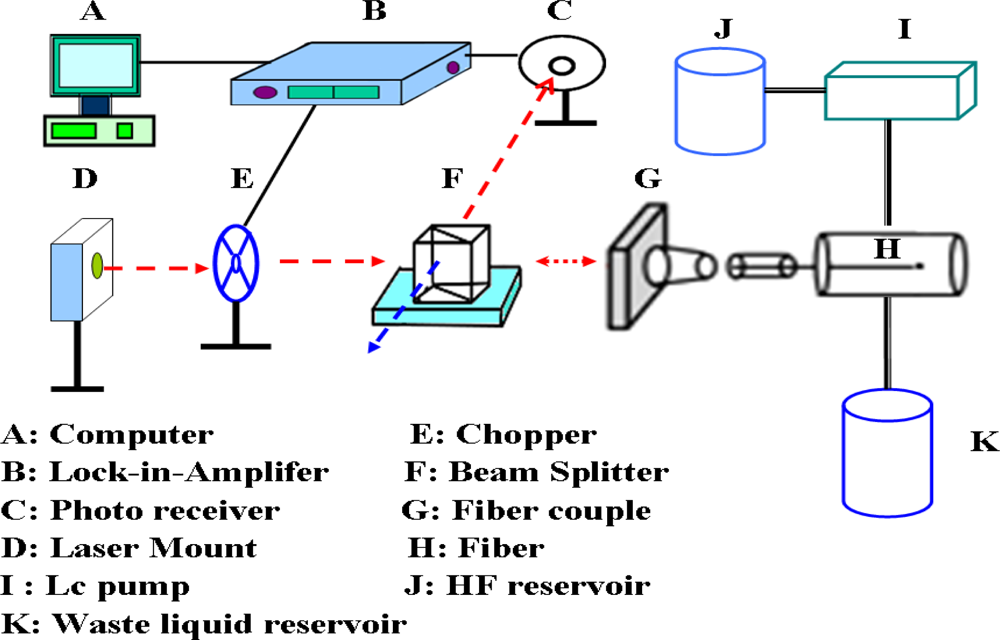
The configuration of the reflection-based LSPR sensing system for HF monitoring is shown in Figure 3. The system consisted of a laser (Hitachi HL6320G laser diode, 635 nm, 10 mW; Thorlabs LDC500 laser diode controller; Thorlabs TEC2000 temperature controller; Thorlabs TCLDM9 laser mount), a chopper (Stanford Research SR540), a beam splitter, a lock-in amplifier (Stanford Research SR830), a photoreceiver (Thorlabs PDA55), and the sensing unit maintained at 25 °C to stabilize the rate of SiO2 etching by the HF solutions.
3. Results and Discussion
3.1. Signal processing of LSPR sensing probe
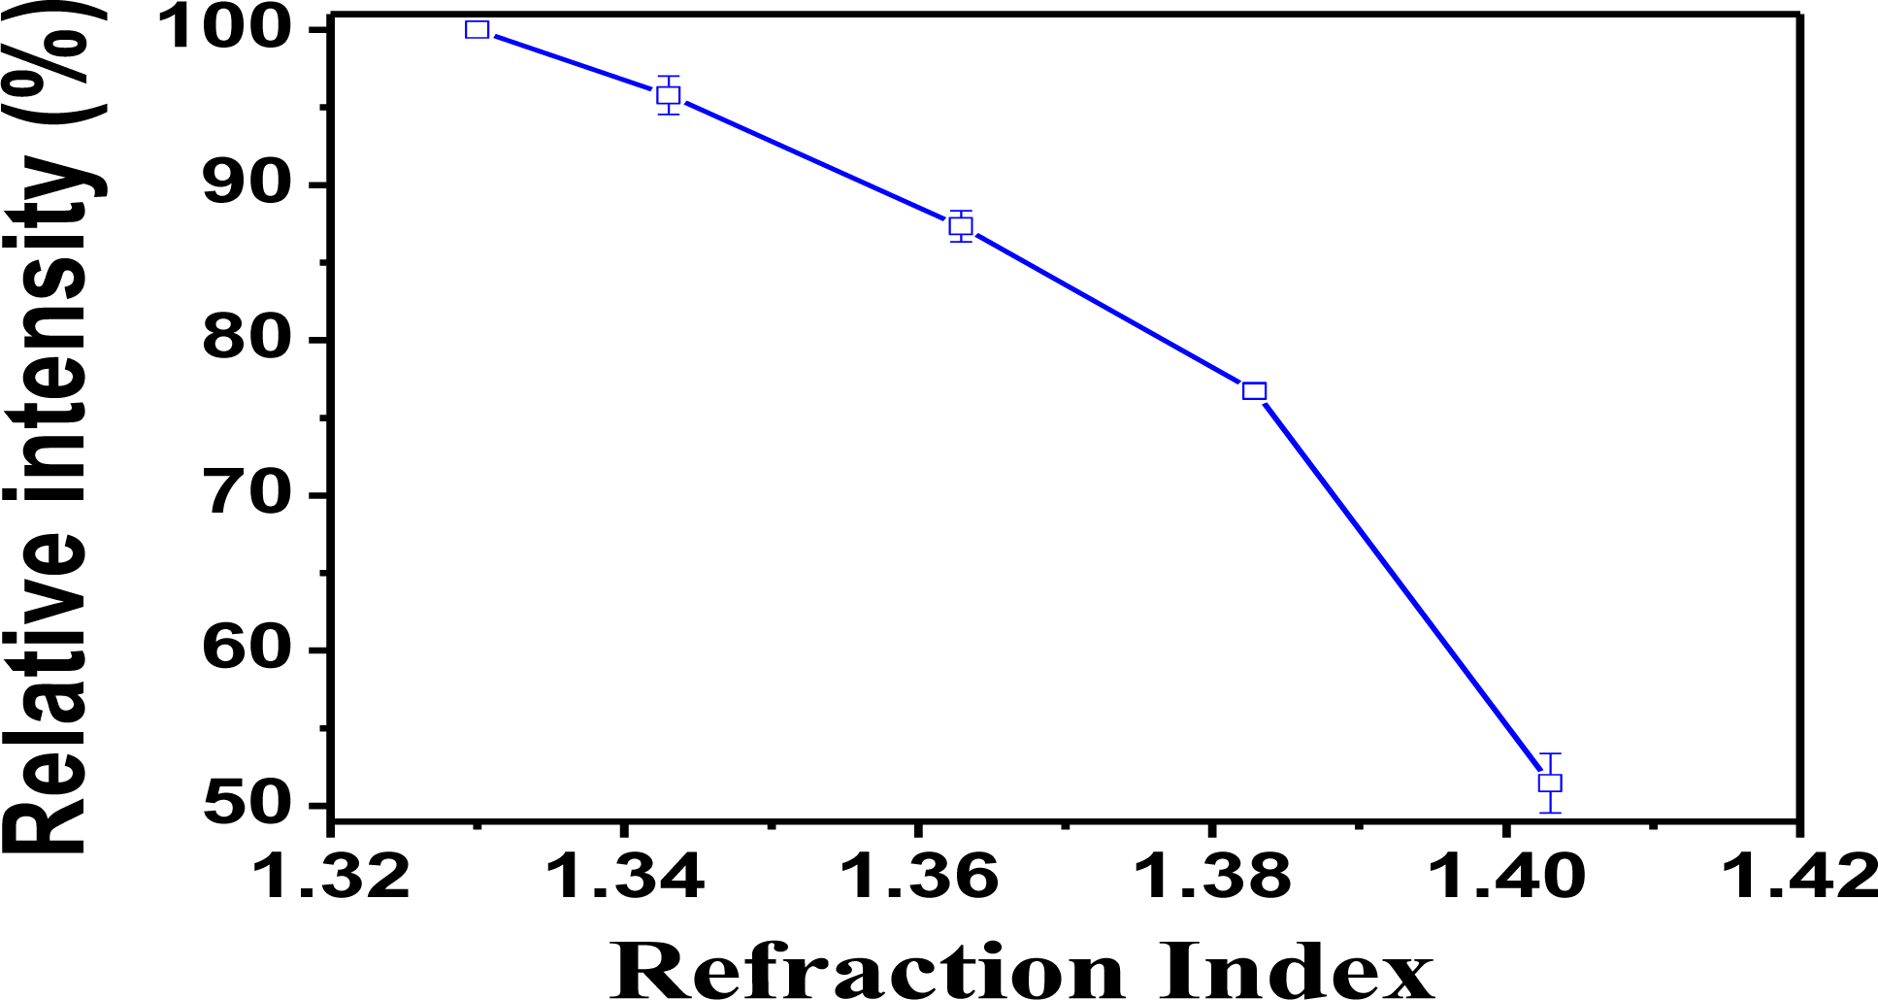
To demonstrate HF detection via fiber optic probe, the reflection-based LSPR sensing system was fabricated with a Au-nanoparticle (NMAu) modified PMMA fiber, which integrated a SiO2 sol-gel coating. Figure 4 shows the plot of relative intensity versus refractive index (RI) of sucrose solution used to calibrate the RI measurments. This was obtained with NMAu modified PMMA fiber in the SiO2/LSPR sensing probe configuration. The signal of the SiO2/LSPR sensing probe indicated a trend of decreasing relative intensity with increasing refractive index.
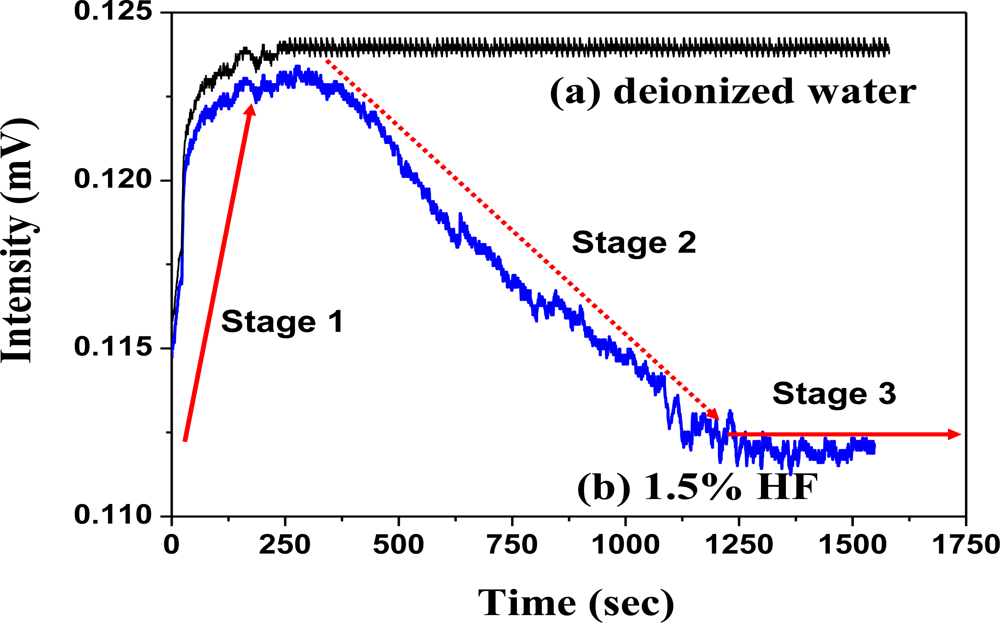
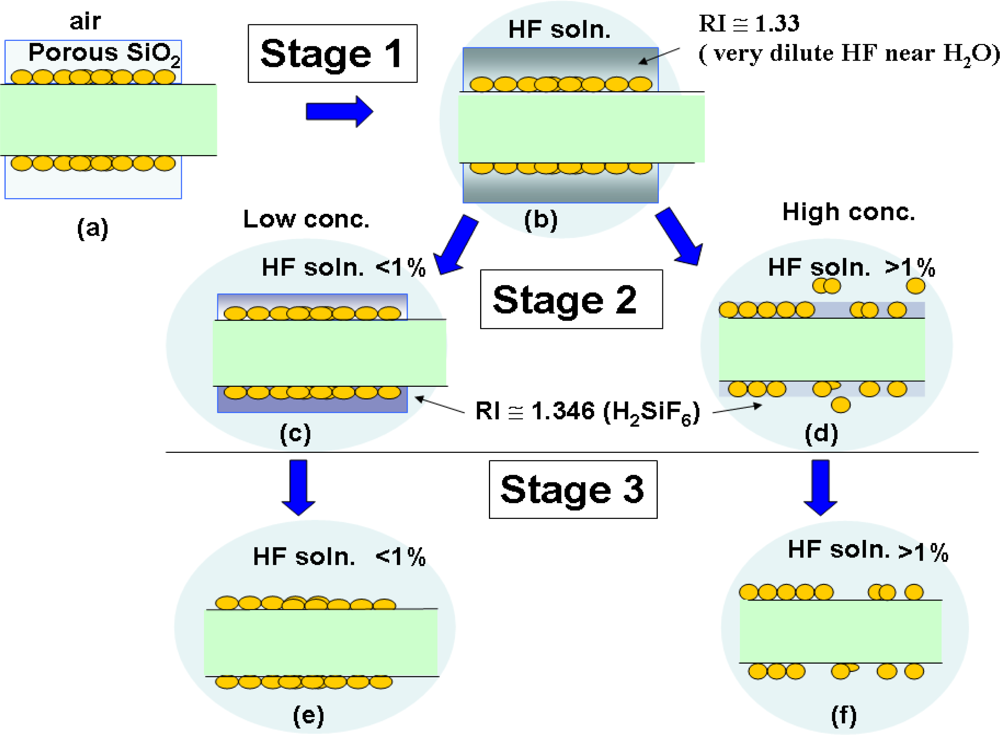
A comparison of the sensing responses between water as background and 1.5% HF solution was carried out [Figure 5(a); Figure 5(b)]. The sensing mechanism of the SiO2/LSPR sensing probe in HF solution could be sequentially categorized into three stages [Figure 5(b); Figure 6]. These 3-stage processes included:
stage-1: porous SiO2 layer was filled with HF solution (Figures 6a∼6b);
stage-2: SiO2 layer commenced to be eroded by HF, and thereafter produced H2SiF6, which would accumulate in the inner surface of SiO2 porous layer (Figures 6c∼6d);
stage-3: SiO2 layer was completely eroded (Figures 6e∼6f).
Its sensing characteristics in signal input [Figure 5(a); Figure 5(b)] demonstrated an increasing tendency when the LSPR sensing probe was initially inserted into the solution (Figure 6a). This phenomenon was due to the gradual water penetration into the porous layer of the SiO2 sol-gel coating (Figure 6b), which caused refractive index changes. The signal of the LSPR sensing probe when detecting deionized water tended to remain stable (Figure 5a). Nevertheless the signal gradually decreased in the HF solution as the SiO2 layer was eroded by HF (Figure 5b). This clearly implied the grounds for the declining signals as SiO2 layer was slowly corroded by HF. This induced the loss of NMAu (Figure 6d), as well as reduced the amount of bonded NMAu, and consequently reduced in signal transduction of LSPR sensing probe (Figure 6f).
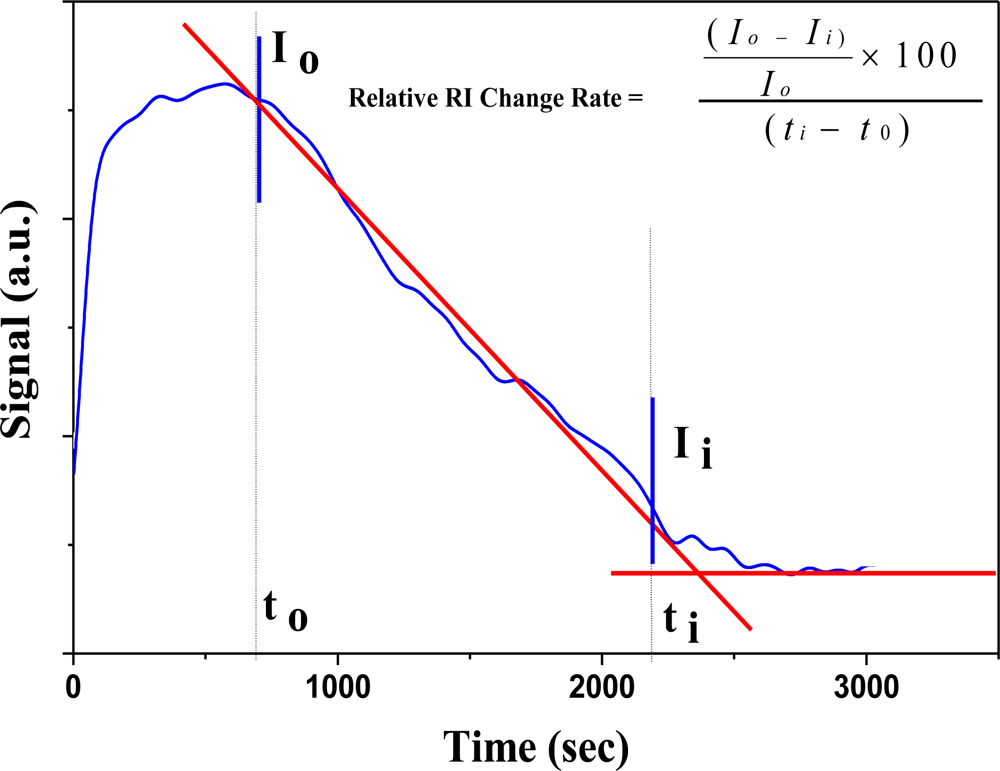
According to the dynamic responses of LSPR sensing probe to the HF solution (Figure 5b), the calculation by numerical analysis of the signal could represent Relative RI Change Rate as an indicator for measuring the concentration of HF in this study. Figure 7 shows the signal changes of LSPR sensing probe in the expression rate of the algorithm as Relative RI Change Rate. The signal change of LSPR sensing probe in HF solution was in the initial location of signal decrease. A tangent was drawn according the decreasing portion of the curve where there was a vertex intersection. This point was set as I0, which corresponded to X axis of time t0. Another tangent was performed in the region of signal stability after declination. There would be an intersection of two tangents; Ii was set as the second intersection on declined signal curve plateau. It corresponded to X axis of time ti. And Relative RI Change Rate was defined as:
3.2. LSPR sensing probe with SiO2 sol-gel coating
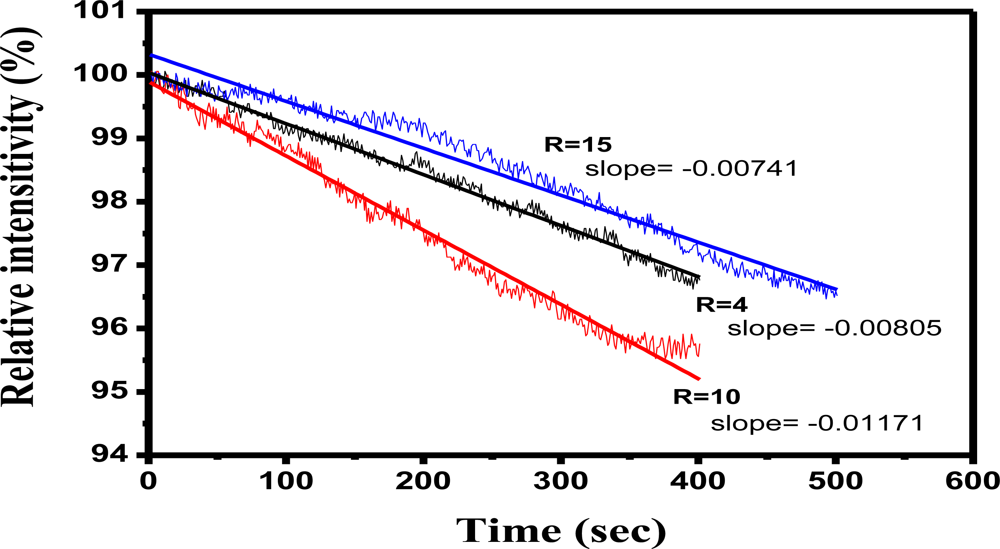
The structure of the pore size and mechanical strength of bulk SiO2 were controlled by the molal ratio of H2O/TMOS in the sol-gel synthesis. Comparison of hydrolysis conditions for the formation of bulk SiO2 showed that if the H2O/TMOS molal ratio (R value) was low, this would imply a higher TMOS composition. Consequently bulk SiO2 would be hard, and brittle fractures tended to occur easily. In contrast, if R value was high, that would indicate a higher proportion of H2O. Therefore, the bulk SiO2 is relatively soft and it does not crack easily. Figure 8 shows the comparative effect of the molal ratio of H2O/TMOS in the LSPR sensing probe with SiO2 sol-gel coating in detecting 3.0% HF aqueous solution at R = 4, R = 10, and R = 15. HF etching caused the signal change in the slopes of the sensing curves at R = 4 (slope = −0.00805), R = 10 (slope = −0.01171), and R = 15 (slope = −0.00741), respectively. Observation of bulk SiO2 demonstrated that it tended to crack in the formation at R = 4, while the bulk material would contain much higher moisture at R = 15, and it inclined to soak easily in HF. The ideal formation of SiO2 bulk observed in this study was at R = 10.
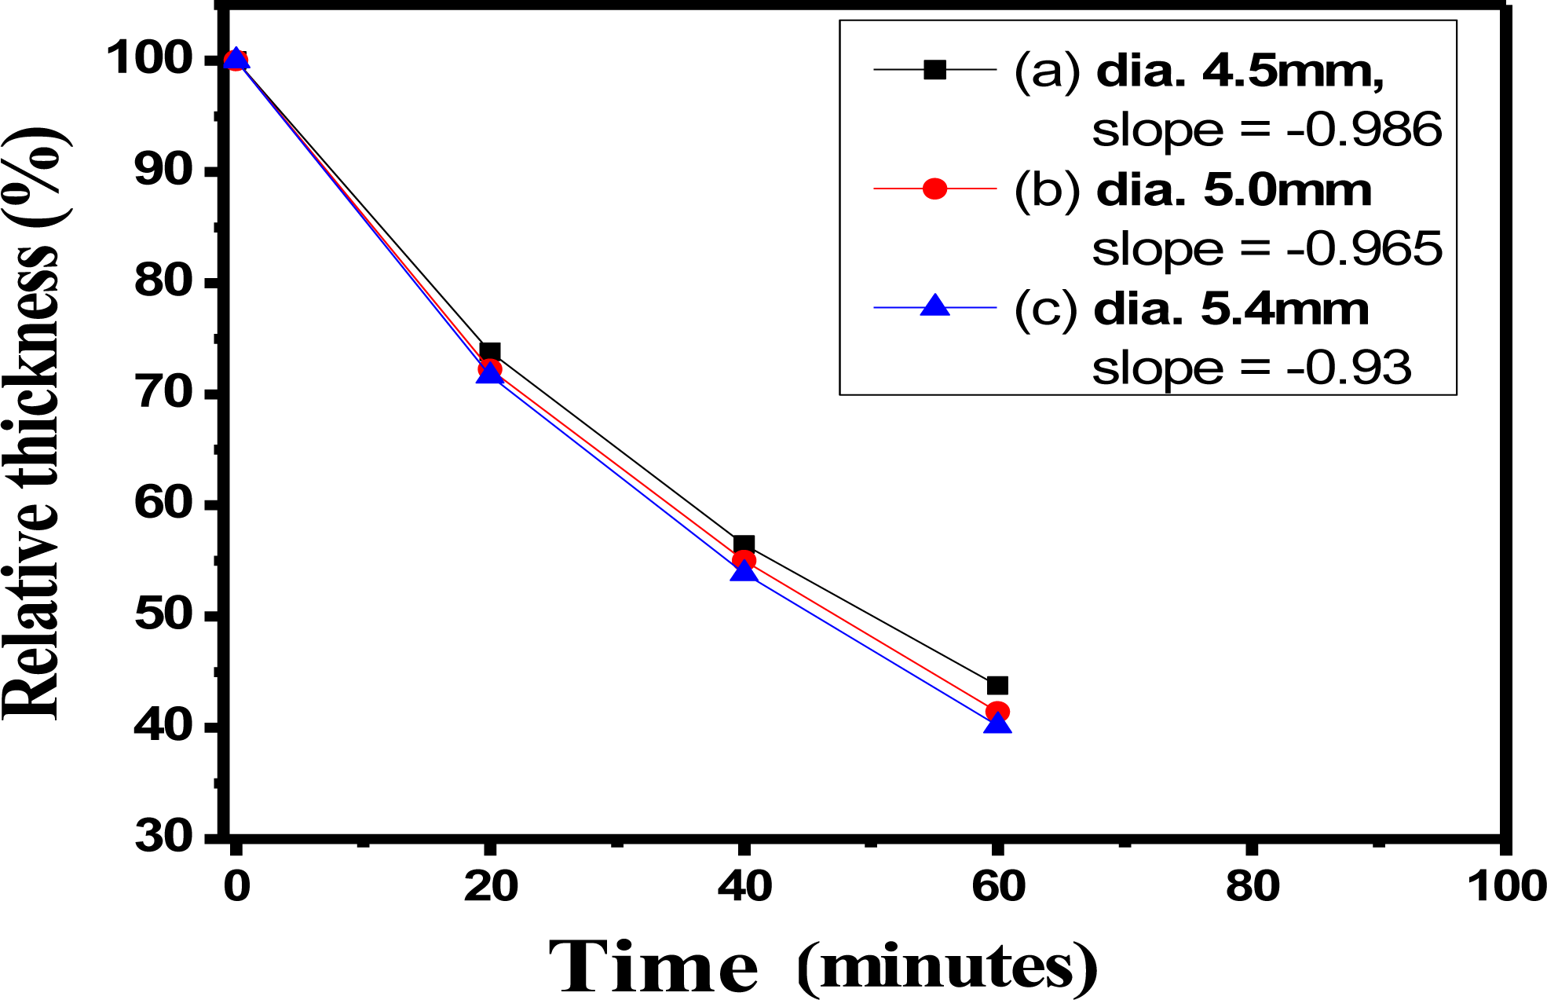
Figure 9 reveals the curves of relative thickness versus time with bulk SiO2 of 4.5 mm diameter of (slope = −0.986), 5.0 mm (slope = −0.965), and 5.4 mm (slope = −0.930) in the HF solution (1.0%), respectively. For the same HF solution concentration, the slopes of bulk SiO2 samples with different relative thicknesses were similar to those resulting from erosion in this study, but thinner bulk SiO2 samples tended to be more sensitive.
Figure 10 demonstrates the curves of thickness change versus time, with 4.5-mm bulk SiO2 for various HF concentrations of 0.25% (slope = −0.0002), 0.5% (slope = −0.0003), 1.0% (slope = −0.0007), and 2.0% (slope = −0.001), respectively. These thickness change versus time curves indicated that the slopes tended to decline much quicker as the concentration of HF increased. The comparisons among the curves of relative thickness versus time showed that the lower HF concentrations (≤0.5%) were almost linear lines, while those of the higher concentrations (≥1.0%) were closer to the second curves. Therefore, these results suggested the higher concentrations of HF (≥1.0%) would possess stronger penetration for bulk sol-gel SiO2 than those of lower concentrations (≤0.5%).
3.3. HF detection with the calculation of Relative RI Change Rate value of sol-gel SiO2/LSPR sensing probe
In this study, signal processing of sol-gel coating SiO2/LSPR sensing probe to analyze HF solutions was represented as Relative RI Change Rates from calculation of the dynamic responses described in Figure 7 and Equation (8). The ideal condition of bulk sol-gel SiO2 formation was at R = 10, at pH = 4, after standing for 3 days. Figure 11 demonstrates the comparison of Relative RI Change Rates from calculating the dynamic responses of SiO2/LSPR sensing probe (diameter = 4.5 mm) to HF solutions of various concentrations (0.25%, 0.5%, 1.0%, 2.0%, 3.0% and 4.0%). Figure 12 shows the curves of relative intensity versus time with various-diameter bulk SiO2 samples (4.5 mm, 5.0 mm, and 5.4 mm) in SiO2/LSPR sensing probe under the various HF solutions of 1.0%, 2.0%, and 4.0%, respectively. For identical HF concentrations, the slopes of bulk SiO2 with relative intensity change were similar to those of erosion in this study (Figure 9), and the sensing probe with the smaller thickness tended to be more sensitive. These curves of intensity change versus time indicated the slopes would decline much quicker as the concentration of HF increased.
Statistical data from repeated measurements (n = 3) obtained in the same Relative RI Change Rates from calculating the dynamic responses of SiO2/LSPR sensing probes of 4.5 mm, 5.0 mm, and 5.4 mm in diameter was tabulated in Table 1. The data was also plotted in Figure 13 to represent the curves of Relative RI Change Rates versus concentrations of HF detected by SiO2/LSPR sensing probe with various-diameter bulk SiO2 samples for various HF concentrations of 0.25%, 0.5%, 1.0%, 2.0%, 3.0%, and 4.0%, respectively. Figure 13 indicated that Relative RI Change Rates declined as HF concentration decreased between the observed ranges from 4% to 1%, but that it increased in the 0.5% HF solution, and subsequently it declined again when the HF concentration was 0.25%.
These interactions between Relative RI change Rates and HF concentration-curve for various-diameter bulk SiO2 samples can be proposed as below. The calculation of Relative RI Change Rates from the dynamic responses of SiO2/LSPR sensing probe on HF detection indicate the decrease of signal intensity was graphically demonstrated in stage-2 of Figure 5. The original refractive index of the diluted HF solution was 1.33. Initially, the SiO2 bulk was profoundly penetrated by HF, and produced SiF4 as well as H2O. The large amounts of these products present would therefore generate silicon fluoride acid (H2SiF6) with refractive index 1.3460. Logically, the eroded SiO2 by HF was very likely to generate more H2SiF6 with the larger refractive index, and resulted in speedy signal decline of the LSPR sensing probe.
Nevertheless, the reasons of signal shifts of SiO2/LSPR sensing probe in different concentrations of HF solution were twofold. One (a-effect) was the accumulation of the produced H2SiF6 would increase refractive index of medium, which tended to diminish the relative intensity (Figure 4). The other (b-effect) was the lost attachment of NMAu on PMMA optical fibers, which occurred during the SiO2erosive process. This tended to decrease the SPR functions. These twofold effects produced by HF to corrode SiO2 may possess two differential mechanisms under the different concentrations of HF solution.
The surface reaction mechanism of SiO2/LSPR sensing probes to HF solution with concentrations ranged from 4% to 1% was demonstrated in Figures 6d and 6f. Although the reaction would produce significant amounts of H2SiF6, the porous structure of SiO2 had been destroyed and therefore the amount of H2SiF6 existing on the SiO2 structure would be minimal. The major contribution to signal change in this condition would be (b)-effect, i.e., the loss of NMAu and impairment of the SPR functions due to the erosion of SiO2.
However, the change of Relative RI Change Rates in the low concentrations of HF solution (≤0.5%) was mainly contributed by large amounts of accumulated H2SiF6 in the porous structure (Figure 6c; Figure 6e). The erosive process initially only produced the infiltration of porous SiO2 bulk and slightly surface etching (Figure 6b). It meant that (a)-effect brought about by the excessive deposition of H2SiF6 would increase the refractive index and reduce the relative intensity under these circumstances, rather than the enormous loss of attached NMAu on PMMA optical fibers. The same situation of H2SiF6 deposition would also occur in HF solution of 0.25%. Yet the amount of produced H2SiF6 remained in the porous structure would be less than that in 0.5% HF solution.
In this study, SiO2 bulks of SiO2/LSPR sensing probe were 4.5 mm, 5.0 mm and 5.4 mm in diameter with the formation at R = 10, at pH = 4, after for 3 days. It was suitable to detect the HF solution with concentrations ranging from 1 to 5%. However, SiO2/LSPR sensing probe will be quickly eroded with higher concentrations of HF (>8%), and it will be more difficult to reproduce the detecting capability of SiO2/LSPR sensing probes. As to detecting HF solutions o low concentration (<1.0%), it requires further investigation to design the appropriate SiO2 film, so that the precise sensing in this field can be achieved.
4. Conclusions
A novel fiber-optic probe with reflection-based localized surface plasmon resonance (LSPR) was developed to quantitatively assess the concentration of hydrofluoric acid (HF) solution. The LSPR sensor was fabricated with a gold-nanoparticle modified PMMA fiber, integrated with a SiO2 sol-gel coating. This LSPR sensing probe was applied to evaluate the relationship between HF concentrations and SiO2 sol-gel layer etching reduction. The results demonstrated the LSPR sensor was properly designed to detect HF-related erosion rate with Relative RI Change Rates ranged from 1% to 5% of hydrofluoric acid solution and thus constitutes the basis of its use as a detector applicable to monitoring HF solution. Further investigations are required in order to produce reliable fully functional sensors for either higher (>8%) or lower (<1%) concentrations of HF solution.
Acknowledgments
This research was funded by the Technology Industrial Technology Research Institute (ITRI) development program under the project of “Development of Micro Health Care System Applications” supported by the Ministry of Economic Affairs. The fabrication processes and SPR measurements were executed in the Department of Chemical Engineering, National Chung-Cheng University. All the staff assisting us to complete this project are deeply appreciated.
References and Notes
- Becker, D.S.; Schmidt, W.R.; Peterson, C.A.; Burkman, D.C. Microelectronics Processing: Inorganic Materials Characterization. ACS Symp. Ser 1986, 366–376. [Google Scholar]
- Totsuka, H.; Sato, I.; Yamamoto, H.; Anma, M. Effect of buffered hydrofluoric acid etching on LCD glass substrates. J. Soc. Inf. Disp 2002, 10, 381–387. [Google Scholar]
- Totsuka, H.; Chen, D.H.; Sato, I.; Anma, M. The Chemical Durability of New LCD Glass Substrate. SID Conference Record of the International Display Research Conference, Nagoya, Japan, 16–19 October 2001; pp. 477–480.
- Kondo, M.; Ikeda, M.; Takeuchi, N.; Kanamori, K.; Kamiya, K.; Gomi, A. Study on the porcelain veneer restoration. 3. Effect of various treatments of porcelain surface on the bonding strength at porcelain-resin interface. Aich Gakuin Daigaku Shigakkai Shi 1990, 28, 631–638. [Google Scholar]
- Wolf, D.M.; Powers, J.M.; O’Keefe, K.L. Bond strength of composite to porcelain treated with new porcelain repair agents. Dent. Mater 1992, 8, 158–161. [Google Scholar]
- Hegedüs, C.; Flora-Nagy, E.; Cserhati, C. Scanning electron microscopy in the study of surface treatment methods used in the repair of porcelain fused-to-metal restorations. Fogorv Sz 1995, 88, 133–139. [Google Scholar]
- Vander Wal, R.L.; Holmes, B.E.; Jeffries, J.B.; Danehy, P.M.; Farrow, R.L.; Rakestraw, D.J. Detection of HF using infrared degenerate four-wave mixing. J. Chem. Phys. Lett 1992, 191, 251–258. [Google Scholar]
- Richter, D.; Fried, A.; Tyndall, G.S.; Oteiza, E.; Erdelyi, M.; Tittel, F.K. All-telecom diode laser based mid-IR source for spectroscopic detection of HF, H2O and HDO. Trends Opt. Photonics 2002, 69. No. ThD3.. [Google Scholar]
- Imaya, H.; Ishiji, T.; Takahashi, K. Detection properties of electrochemical acidic gas sensors using halide–halate electrolytic solutions. Sens. Actuat. B: Chem 2005, 108, 803–807. [Google Scholar]
- Qi, Z.-M.; Itoh, K.; Murabayashi, M.; Matsuda, N. Monitoring of interaction on the solid-liquid interface by use of composite optical waveguide polarimetric interferometers. Chem. Sensor 2001, 17, 76–78. [Google Scholar]
- Letant, S.E.; Sailor, M.J. Detection of HF gas with a porous Si interferometer. Adv. Mater 2000, 12, 355–359. [Google Scholar]
- Blondeau-Patissier, V.; Ballandras, S.; Lengaigne, G.; Daniau, W.; Martin, G.; Blind, P.; Hauden, D.; Nadal, M.H. High sensitivity anhydride hexafluorhydric acid sensor. Sens. Actuat. B: Chem 2005, 111, 219–224. [Google Scholar]
- Ballandras, S.; Nadal, M.H.; Daniau, W.; Blondeau-Patissier, V.; Martin, G.; Eyraud, V.; Hauden, D.; Guichardaz, B.; Hairault, L.; Lebret, B.; Blind, P. Development of a high sensitivity anhydride hexafluorhydric acid sensor. Proceedings of the IEEE IFCS, Tampa, FL, USA, 5–8 May 2003; pp. 927–930.
- Mchale, G.; Newton, M.I.; Martin, F.; Gizeli, E.; Melzak, K.A. Resonant conditions for Love wave guiding layer thickness. Appl. Phys. Lett 2001, 79, 3542–3543. [Google Scholar]
- Jakoby, B.; Vellekoop, M.J. Properties of Love waves: Applications in sensors, Special issue on SAW devices and their applications. J. Smart Mater. Struct 1997, 6, 668–679. [Google Scholar]
- Tang, Y.; Fang, J.; Xu, X.; Ji, H.-F.; Brown, M.; Thundat, T. Detection of femtomolar concentrations of HF using a SiO2 microcantilever. Anal. Chem 2004, 76, 2478–2481. [Google Scholar]
- Chau, L.-K; Lin, Y.-F; Cheng, S.-F.; Lin, T.-J. Fiber-optic chemical and biochemical probes based on localized surface plasmon resonance. Sens. Actuat. B 2006, 113, 100–105. [Google Scholar]
- Lin, T.-J.; Chung, M.-F. Using Monoclonal Antibody to Determine Lead Ions with a Localized Surface Plasmon Resonance Fiber-optic Biosensor. Sensors 2008, 8, 582–593. [Google Scholar]
- Bosch, M.E.; R.Sánchez, A.J.; Rojas, F.S.; Ojeda, C.B. Recent Development in Optical Fiber Biosensors. Sensors 2007, 7, 797–859. [Google Scholar]
- Jensen, T.R.; Schatz, G.C.; Van Duyne, R.P. Nanosphere Lithography: Surface Plasmon Resonance Spectrum of a Periodic Array of Silver Nanoparticles by Ultraviolet−Visible Extinction Spectroscopy and Electrodynamic Modeling. J. Phys. Chem. B 1999, 103, 2394–2401. [Google Scholar]
- Nath, N.; Chilkoti, A. A Colorimetric Gold Nanoparticle Sensor to Interrogate Biomolecular Interactions in Real Time on a Surface. Anal. Chem 2002, 74, 504–509. [Google Scholar]
- Mikeska, R.; Bennison, J.; Grise, S.L. Corrosion of Ceramics in Aqueous Hydrofluoric Acid. J. Am. Ceram. Soc 2000, 83, 1160–1164. [Google Scholar]
- Sharkawy, S.W.; El-Aslabi, A.M.; Sharkawy, S.W.; El-Aslabi, A.M. Corrosion of silicon nitride ceramics in aqueous hcl and hf solutions at 27–80 °C. Corros. Sci 1998, 40, 1119–1129. [Google Scholar]
- Lee, J.H.; Jang, W.I.; Lee, C.S.; Lee, Y.I.; Choi, C.A.; Baek, J.T.; Yoo, H.J. Characterization of anhydrous HF gas-phase etching with CH3OH for sacrificial oxide removal. Sens. Actuat. A 1998, 64, 27–32. [Google Scholar]
- Watanabe, S. In-situ infrared characterization of a chemically oxidized silicon surface dissolving in aqueous hydrofluoric acid. Surf. Sci 1995, 341, 304–310. [Google Scholar]
- Biswas, A.; Ilyashenko, V. Characterization of plastic optical fiber. Automot. Light. Technol 1998, 1323, 131–134. [Google Scholar]
- Flavel, B.S.; Nussio, M.R.; Quinton, J.S.; Shapter, J.G. Adhesion of chemically and electrostatically bound gold nanoparticles to a self-assembled silane monolayer investigated by atomic force volume spectroscopy. J. Nanopart. Res 2009, 11, 2013–2022. [Google Scholar]
- Nath, N.; Chilkoti, A. A colorimetric gold nanoparticle sensor to interrogate biomolecular interactions in real time on a surface. Anal. Chem 2002, 74, 504–509. [Google Scholar]
- DeGrandpre, M.D.; Burgess, L.W. A Fiber-optic FT-NIR evanescent field absorbance sensor. Appl. Spectrosc 1990, 44, 273–279. [Google Scholar]
- Conzen, J.-P.; urck, J.B.; Ache, H.-J. Characterization of a fiber-optic evanescent wave absorbance sensor for nonpolar organic compounds. Spectroscopy 1993, 47, 753–763. [Google Scholar]
- Kennerly, S.W.; Little, J.W.; Warmack, R.J.; Ferrel, T.L. Optical properties of heated Ag films. Phys. Rev. B: Condens. Matter 1984, 29, 2926–2929. [Google Scholar]


| The concentrations of HF solution | The diameters of sol-gel SiO2 of LSPR sensing probes | ||
|---|---|---|---|
| 4.5 mm | 5.4 mm | 5.4 mm | |
| Relative RI change rates | |||
| 0.25% | 0.0047 ± 0.00016 | 0.0040 ± 0.00036 | 0.0022 ± 0.00025 |
| 0.5% | 0.0074 ± 0.00017 | 0.0060 ± 0.00025 | 0.0040 ± 0.00020 |
| 1% | 0.0033 ± 0.00008 | 0.0022 ± 0.00012 | 0.0019 ± 0.00012 |
| 2% | 0.0055 ± 0.00022 | 0.0046 ± 0.00021 | 0.0024 ± 0.00012 |
| 3% | 0.0114 ± 0.00040 | 0.0084 ± 0.00012 | 0.0055 ± 0.00008 |
| 4% | 0.0149 ± 0.00012 | 0.0133 ± 0.0008 | 0.0095 ± 0.00037 |
© 2011 by the authors; licensee MDPI, Basel, Switzerland. This article is an open access article distributed under the terms and conditions of the Creative Commons Attribution license (http://creativecommons.org/licenses/by/3.0/).
Share and Cite
Chen, I.-C.; Lin, S.-S.; Lin, T.-J.; Du, J.-K. Detection of Hydrofluoric Acid by a SiO2 Sol-Gel Coating Fiber-Optic Probe Based on Reflection-Based Localized Surface Plasmon Resonance. Sensors 2011, 11, 1907-1923. https://doi.org/10.3390/s110201907
Chen I-C, Lin S-S, Lin T-J, Du J-K. Detection of Hydrofluoric Acid by a SiO2 Sol-Gel Coating Fiber-Optic Probe Based on Reflection-Based Localized Surface Plasmon Resonance. Sensors. 2011; 11(2):1907-1923. https://doi.org/10.3390/s110201907
Chicago/Turabian StyleChen, I-Cherng, Shiu-Shiung Lin, Tsao-Jen Lin, and Je-Kang Du. 2011. "Detection of Hydrofluoric Acid by a SiO2 Sol-Gel Coating Fiber-Optic Probe Based on Reflection-Based Localized Surface Plasmon Resonance" Sensors 11, no. 2: 1907-1923. https://doi.org/10.3390/s110201907