Surface Motion and Structural Instability Monitoring of Ming Dynasty City Walls by Two-Step Tomo-PSInSAR Approach in Nanjing City, China

 ,
,  ,
,
Abstract
:
1. Introduction
2. Study Site and Data Used
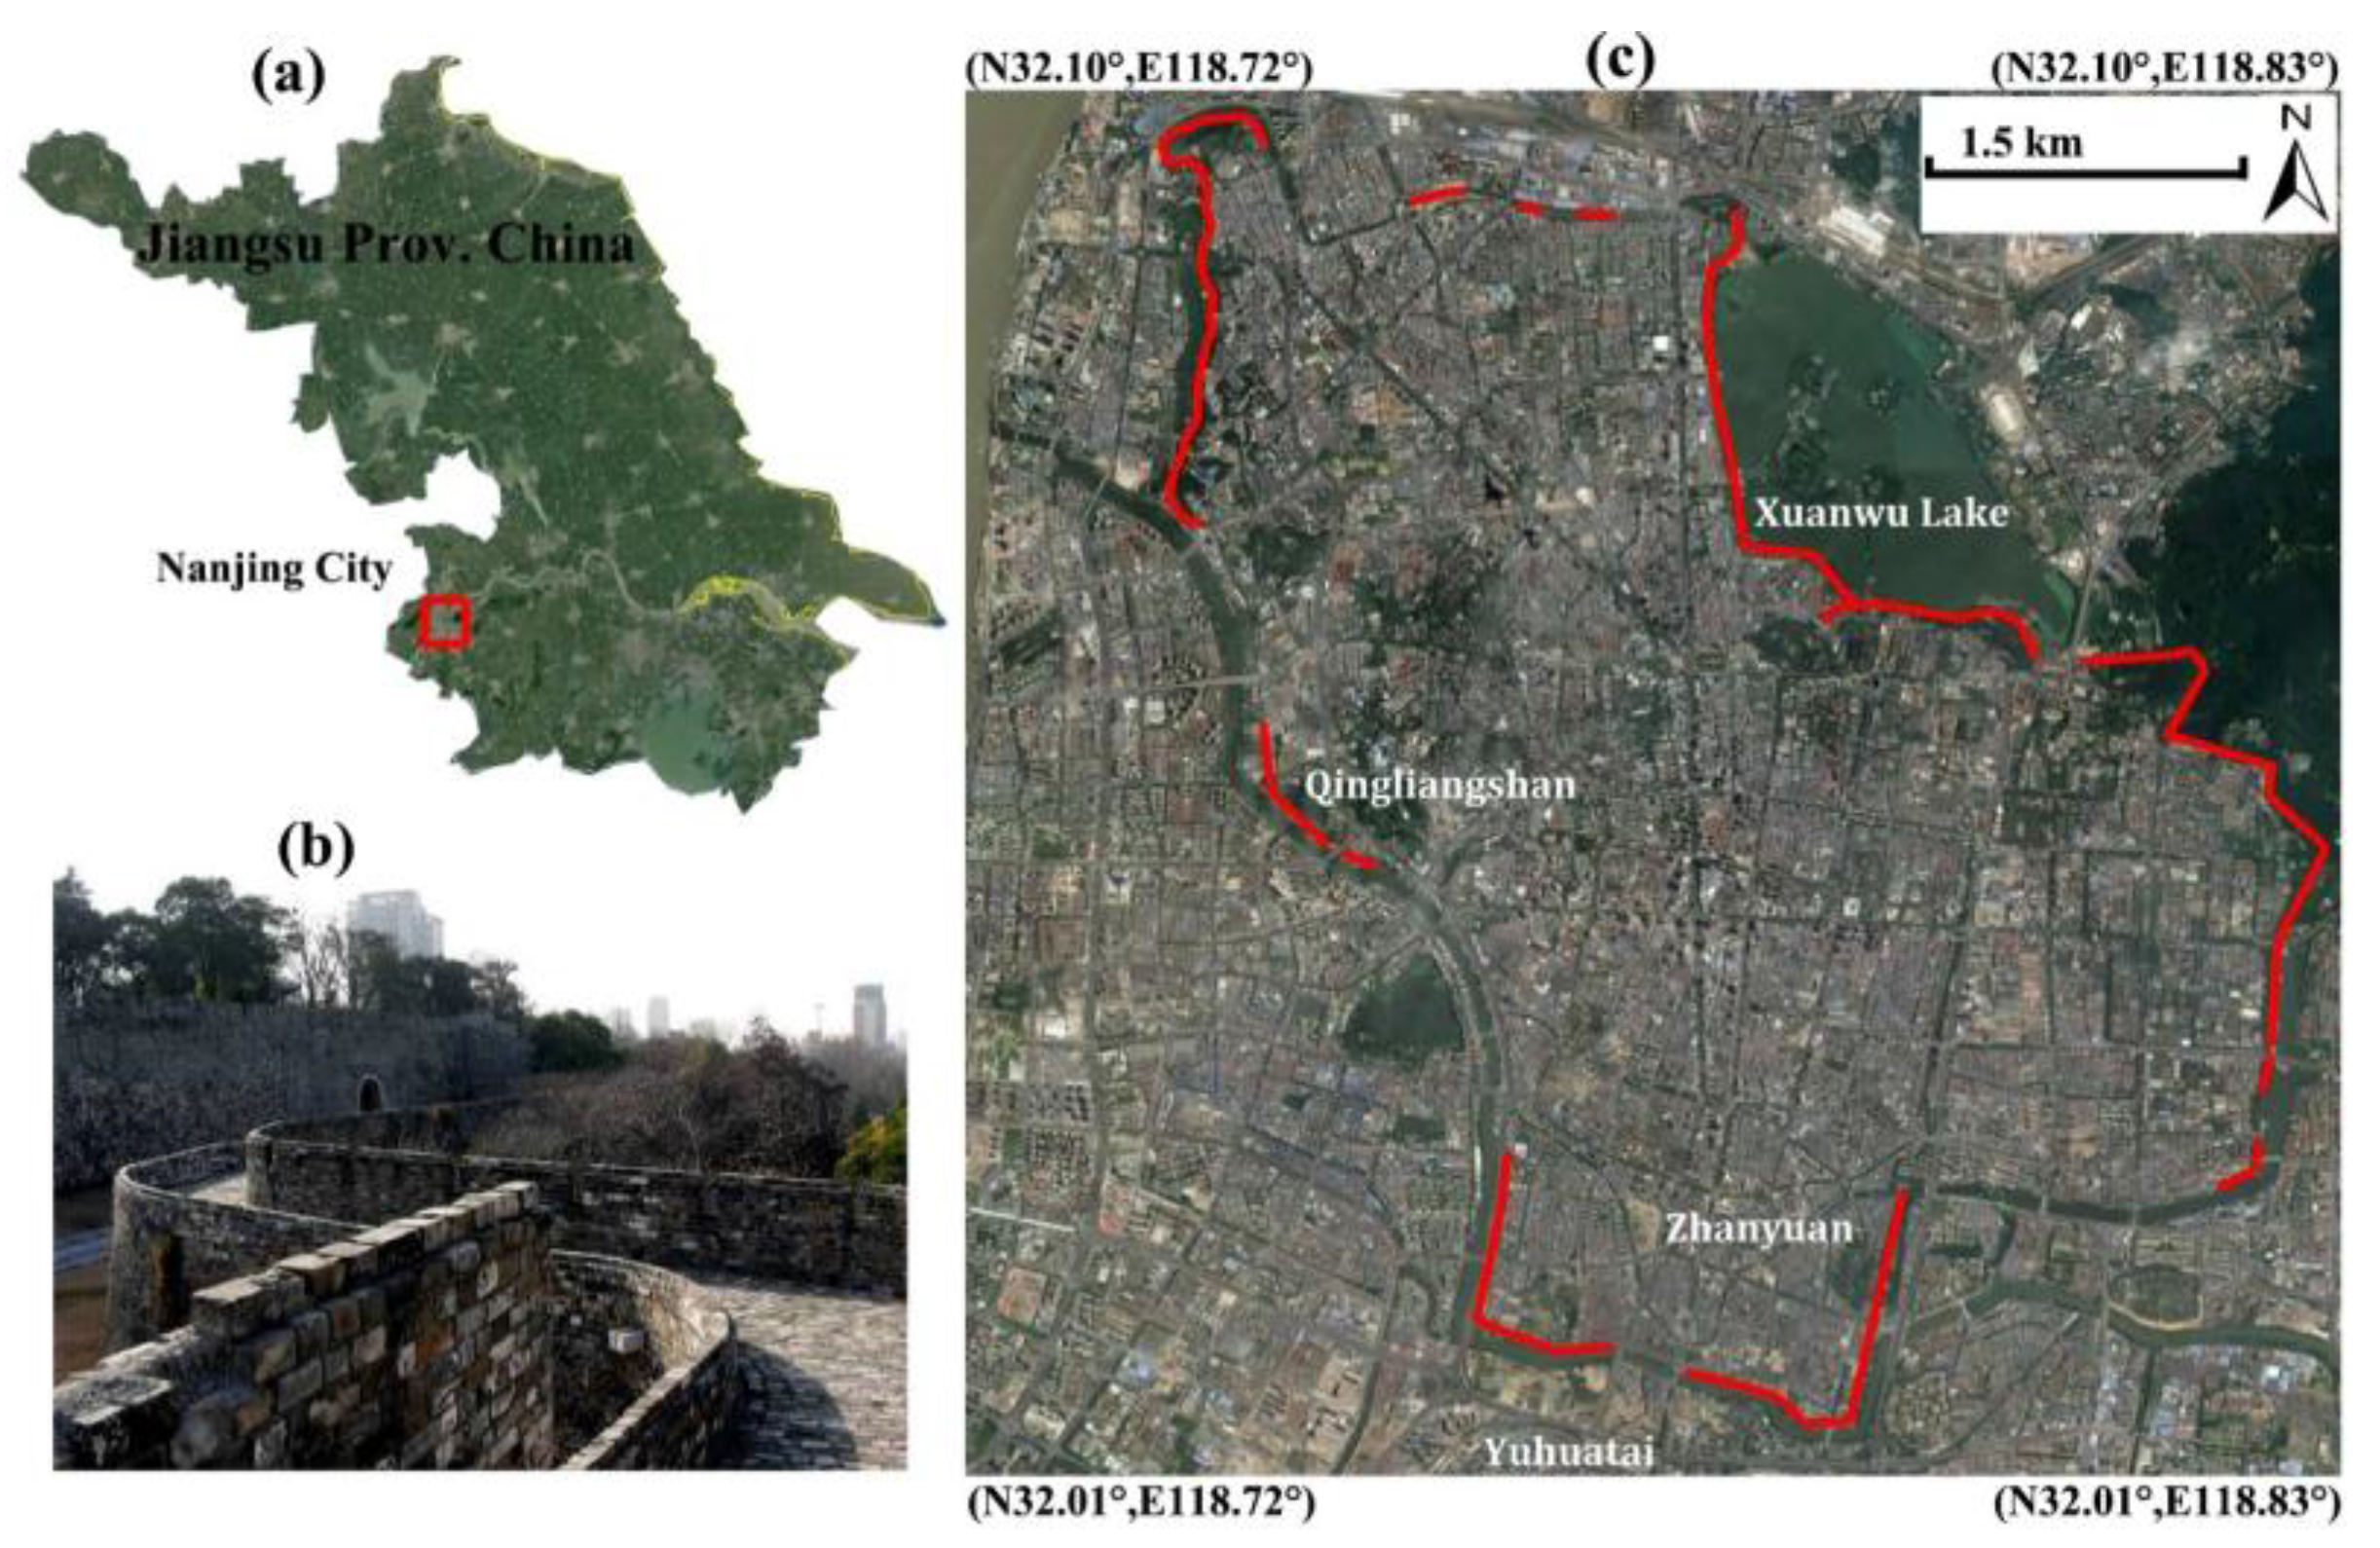
2.1. Study Site
2.2. TerraSAR-X and Other Complimentary Data
3. Principles and Methodology
3.1. Rational Basis
3.2. Two-Step Tomo-PSInSAR Approach
3.3. Technology Improvements
4. Results and Interpretation
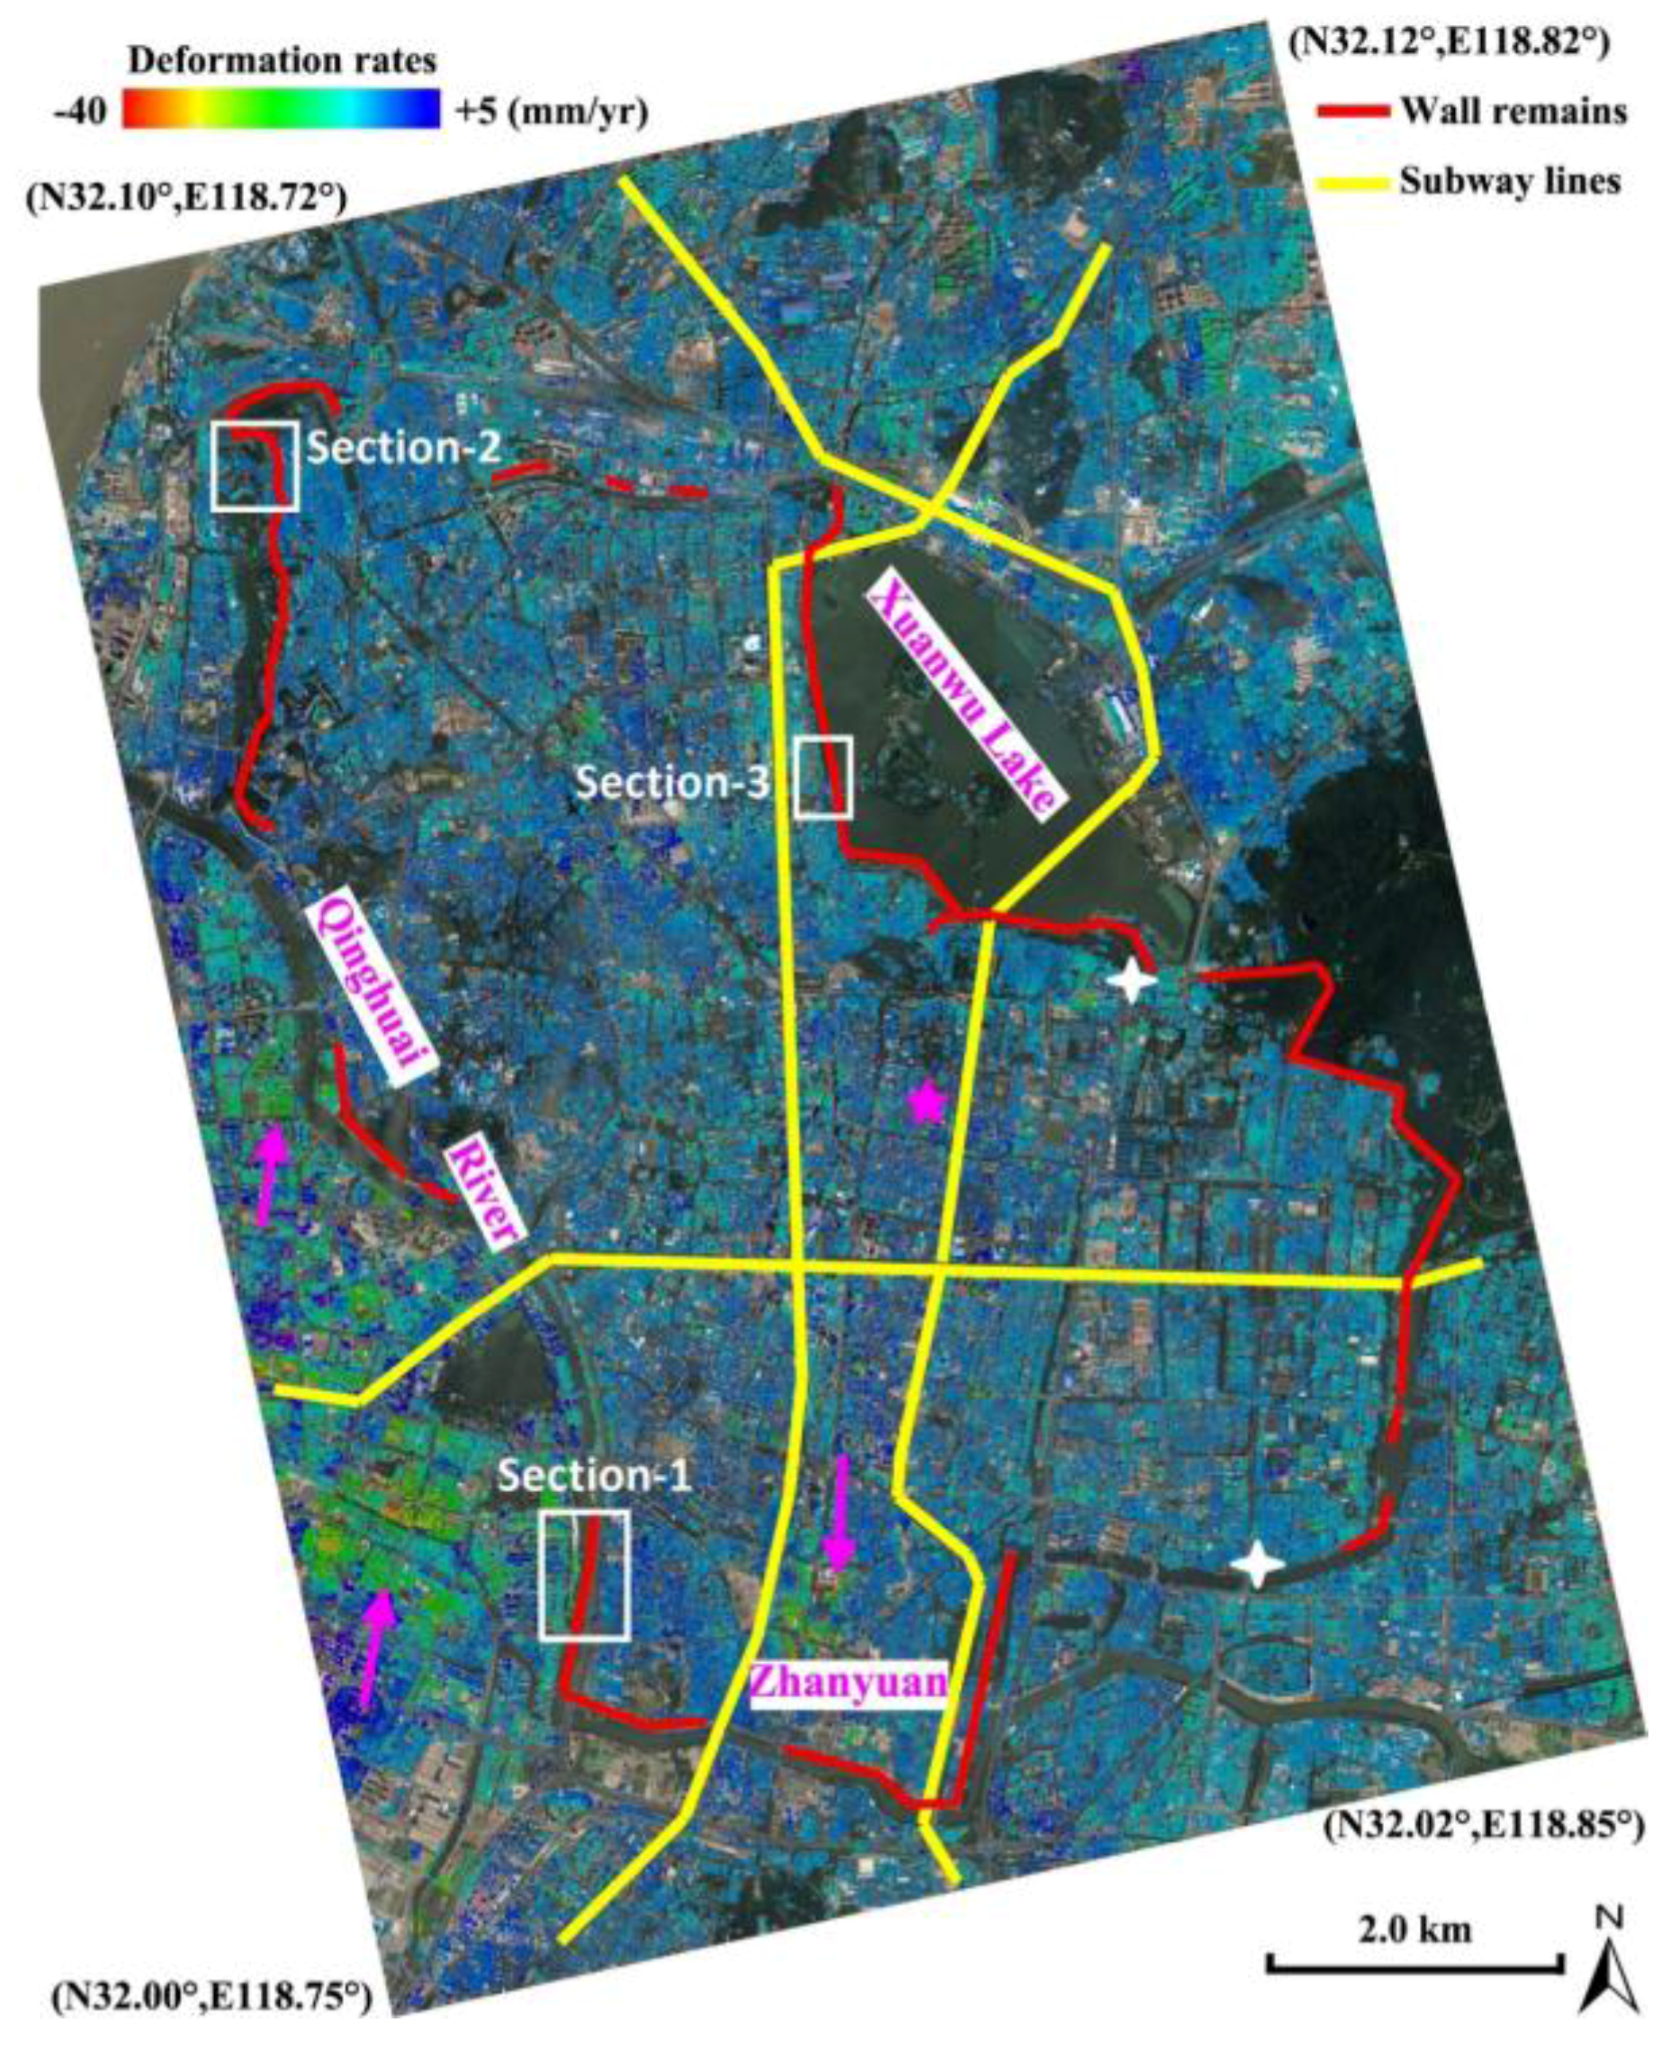
4.1. Regional-Scale Monitoring
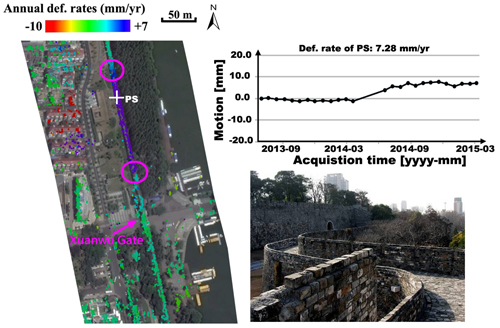
4.2. Monument-Scale Monitoring
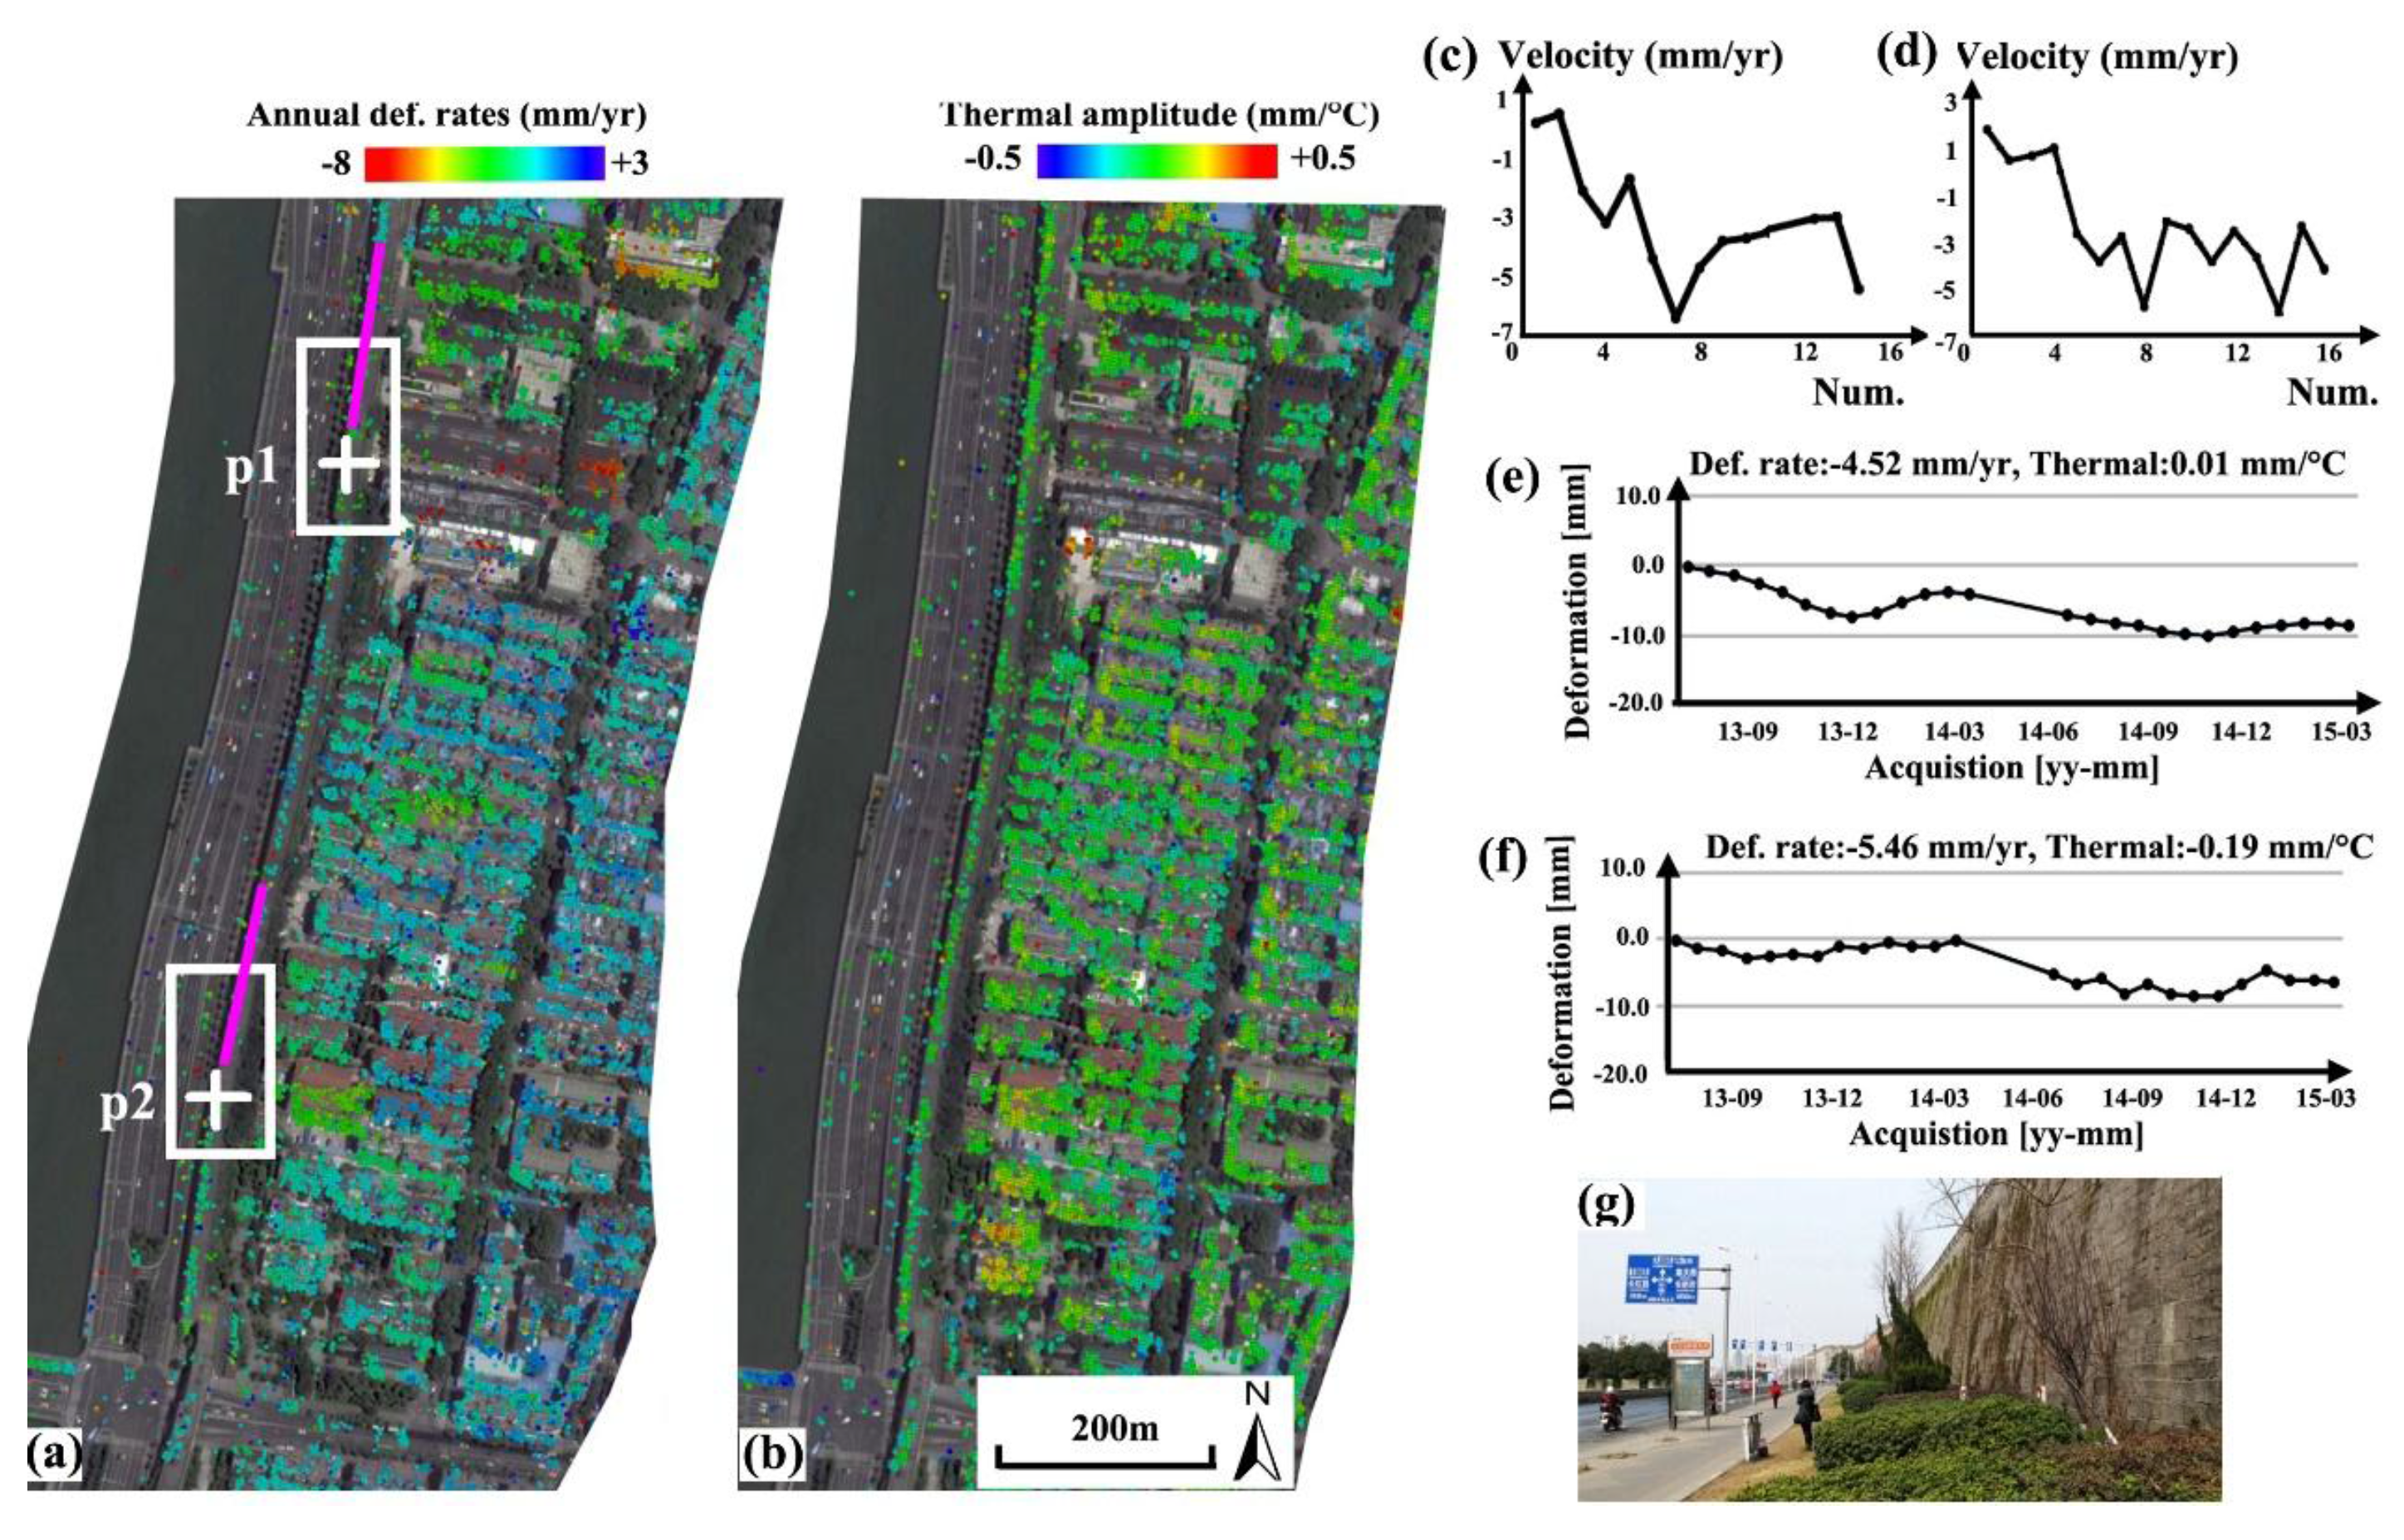
4.2.1. Section-1
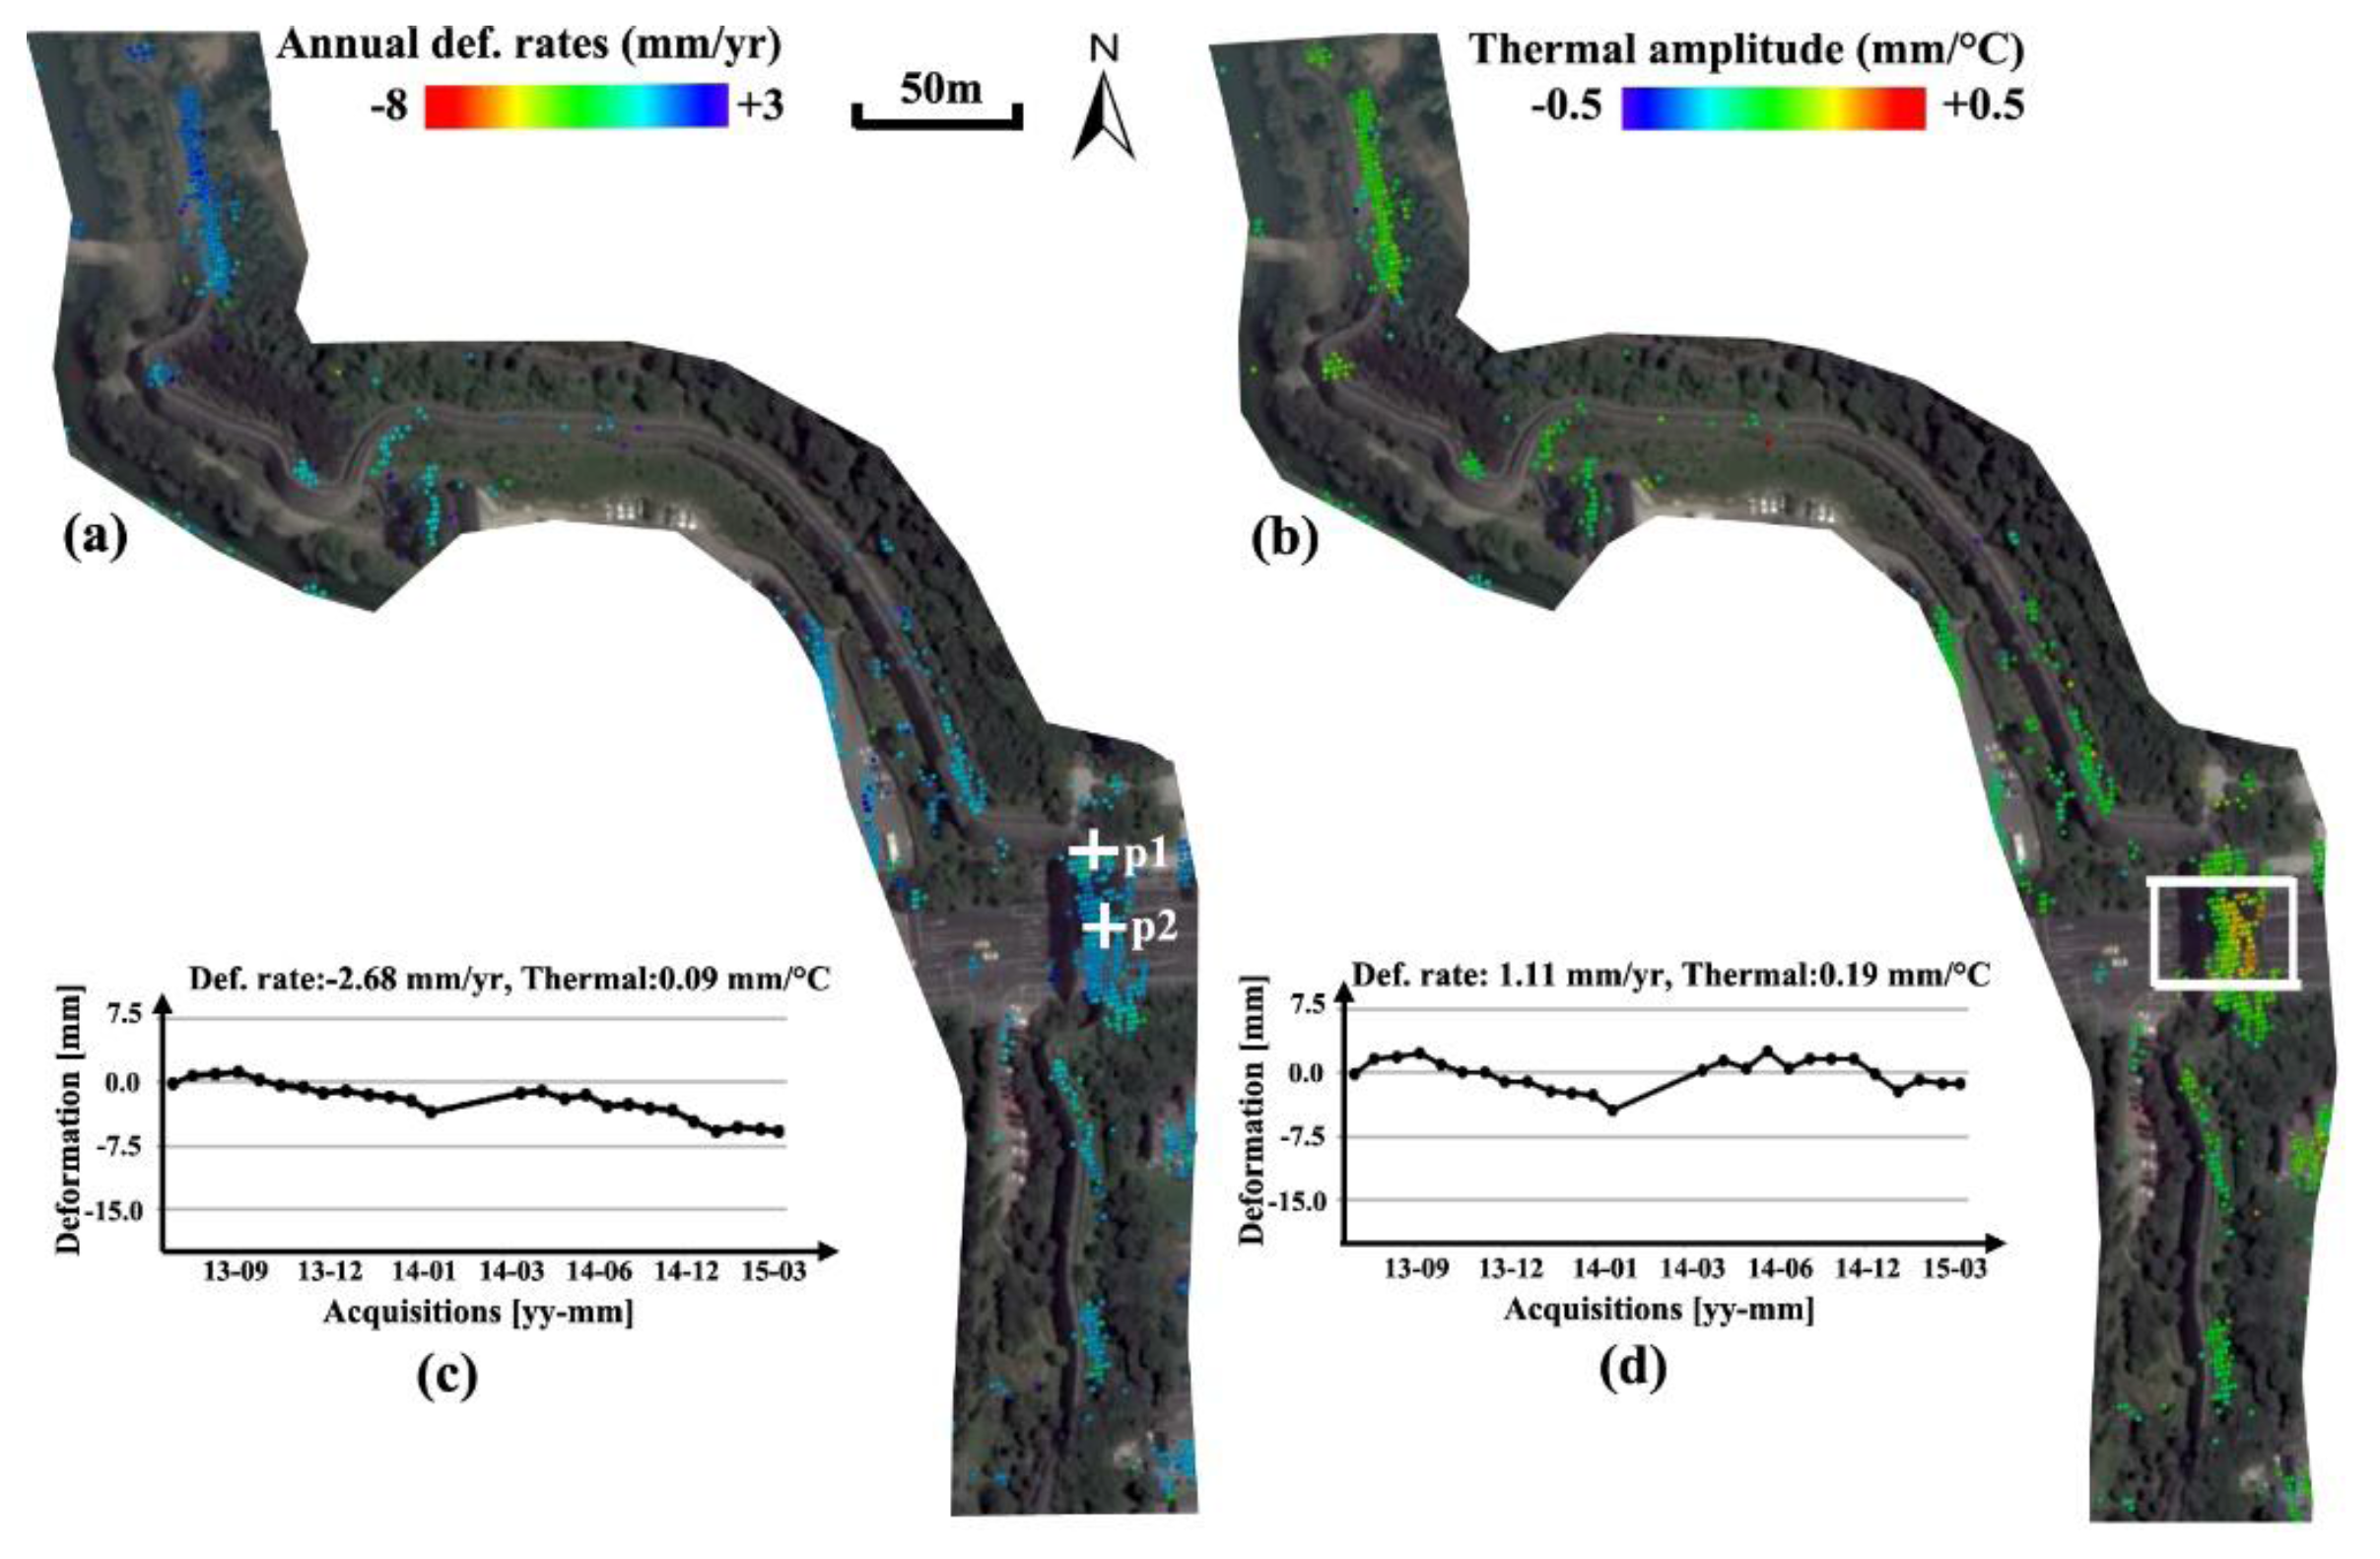
4.2.2. Section-2
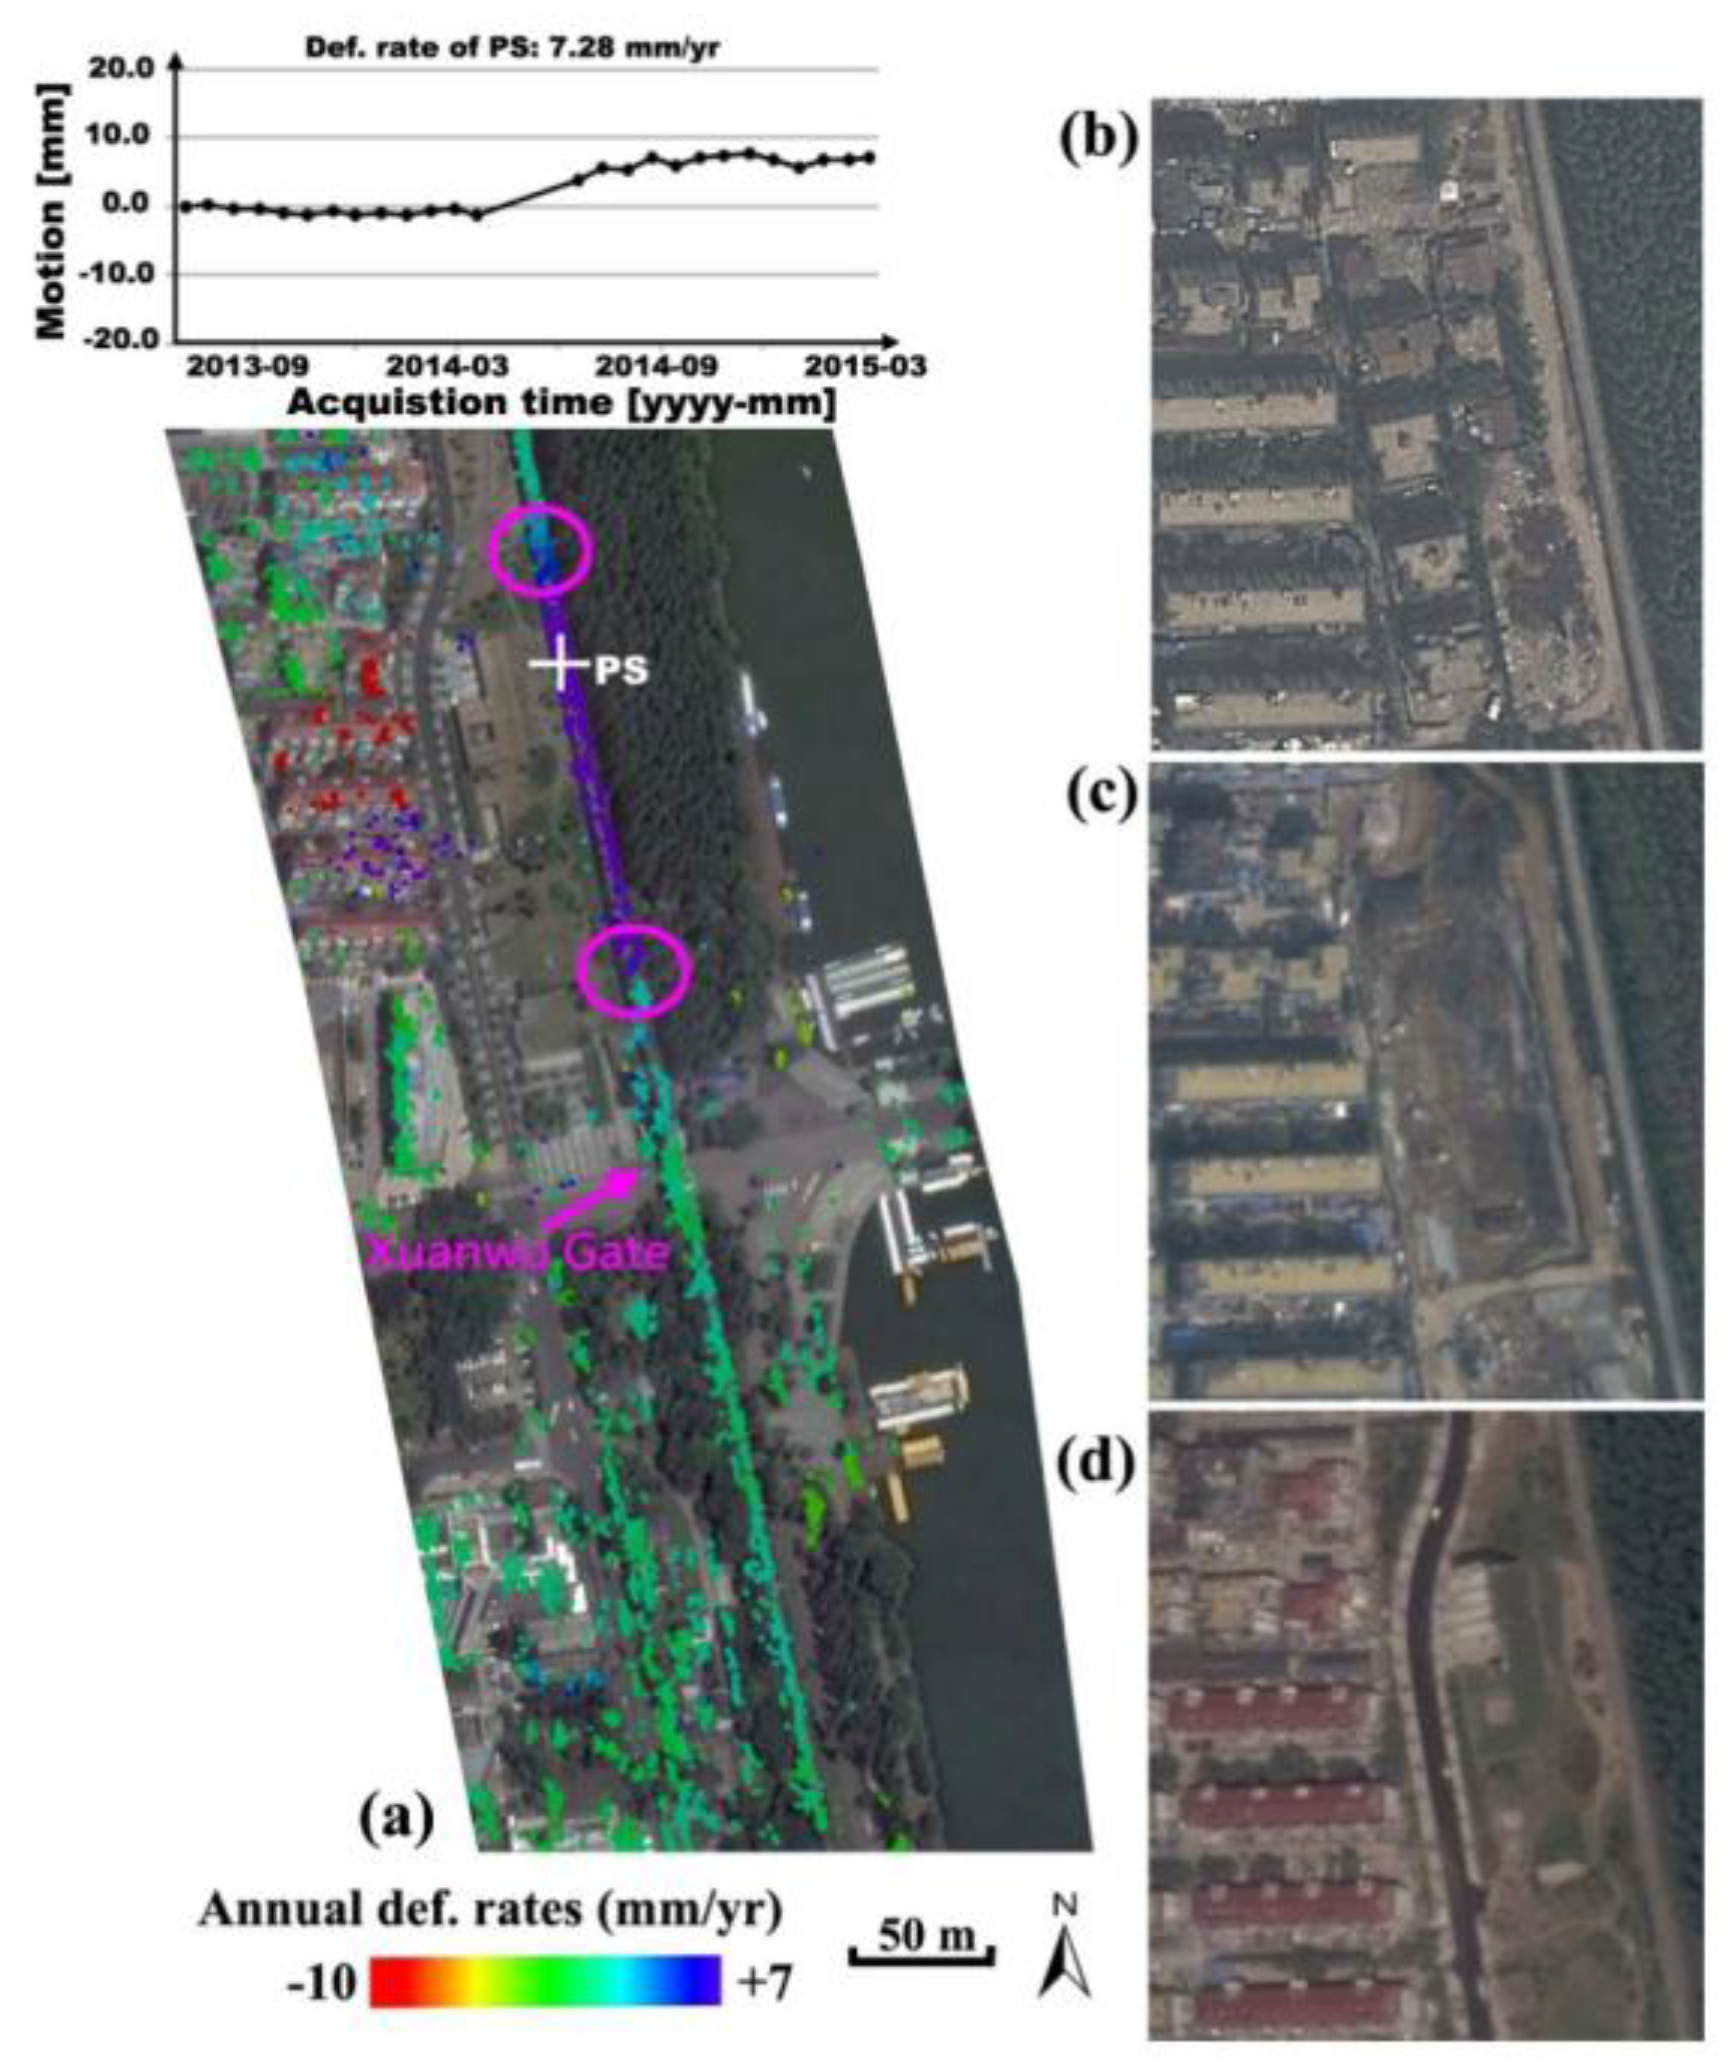
4.2.3. Section-3
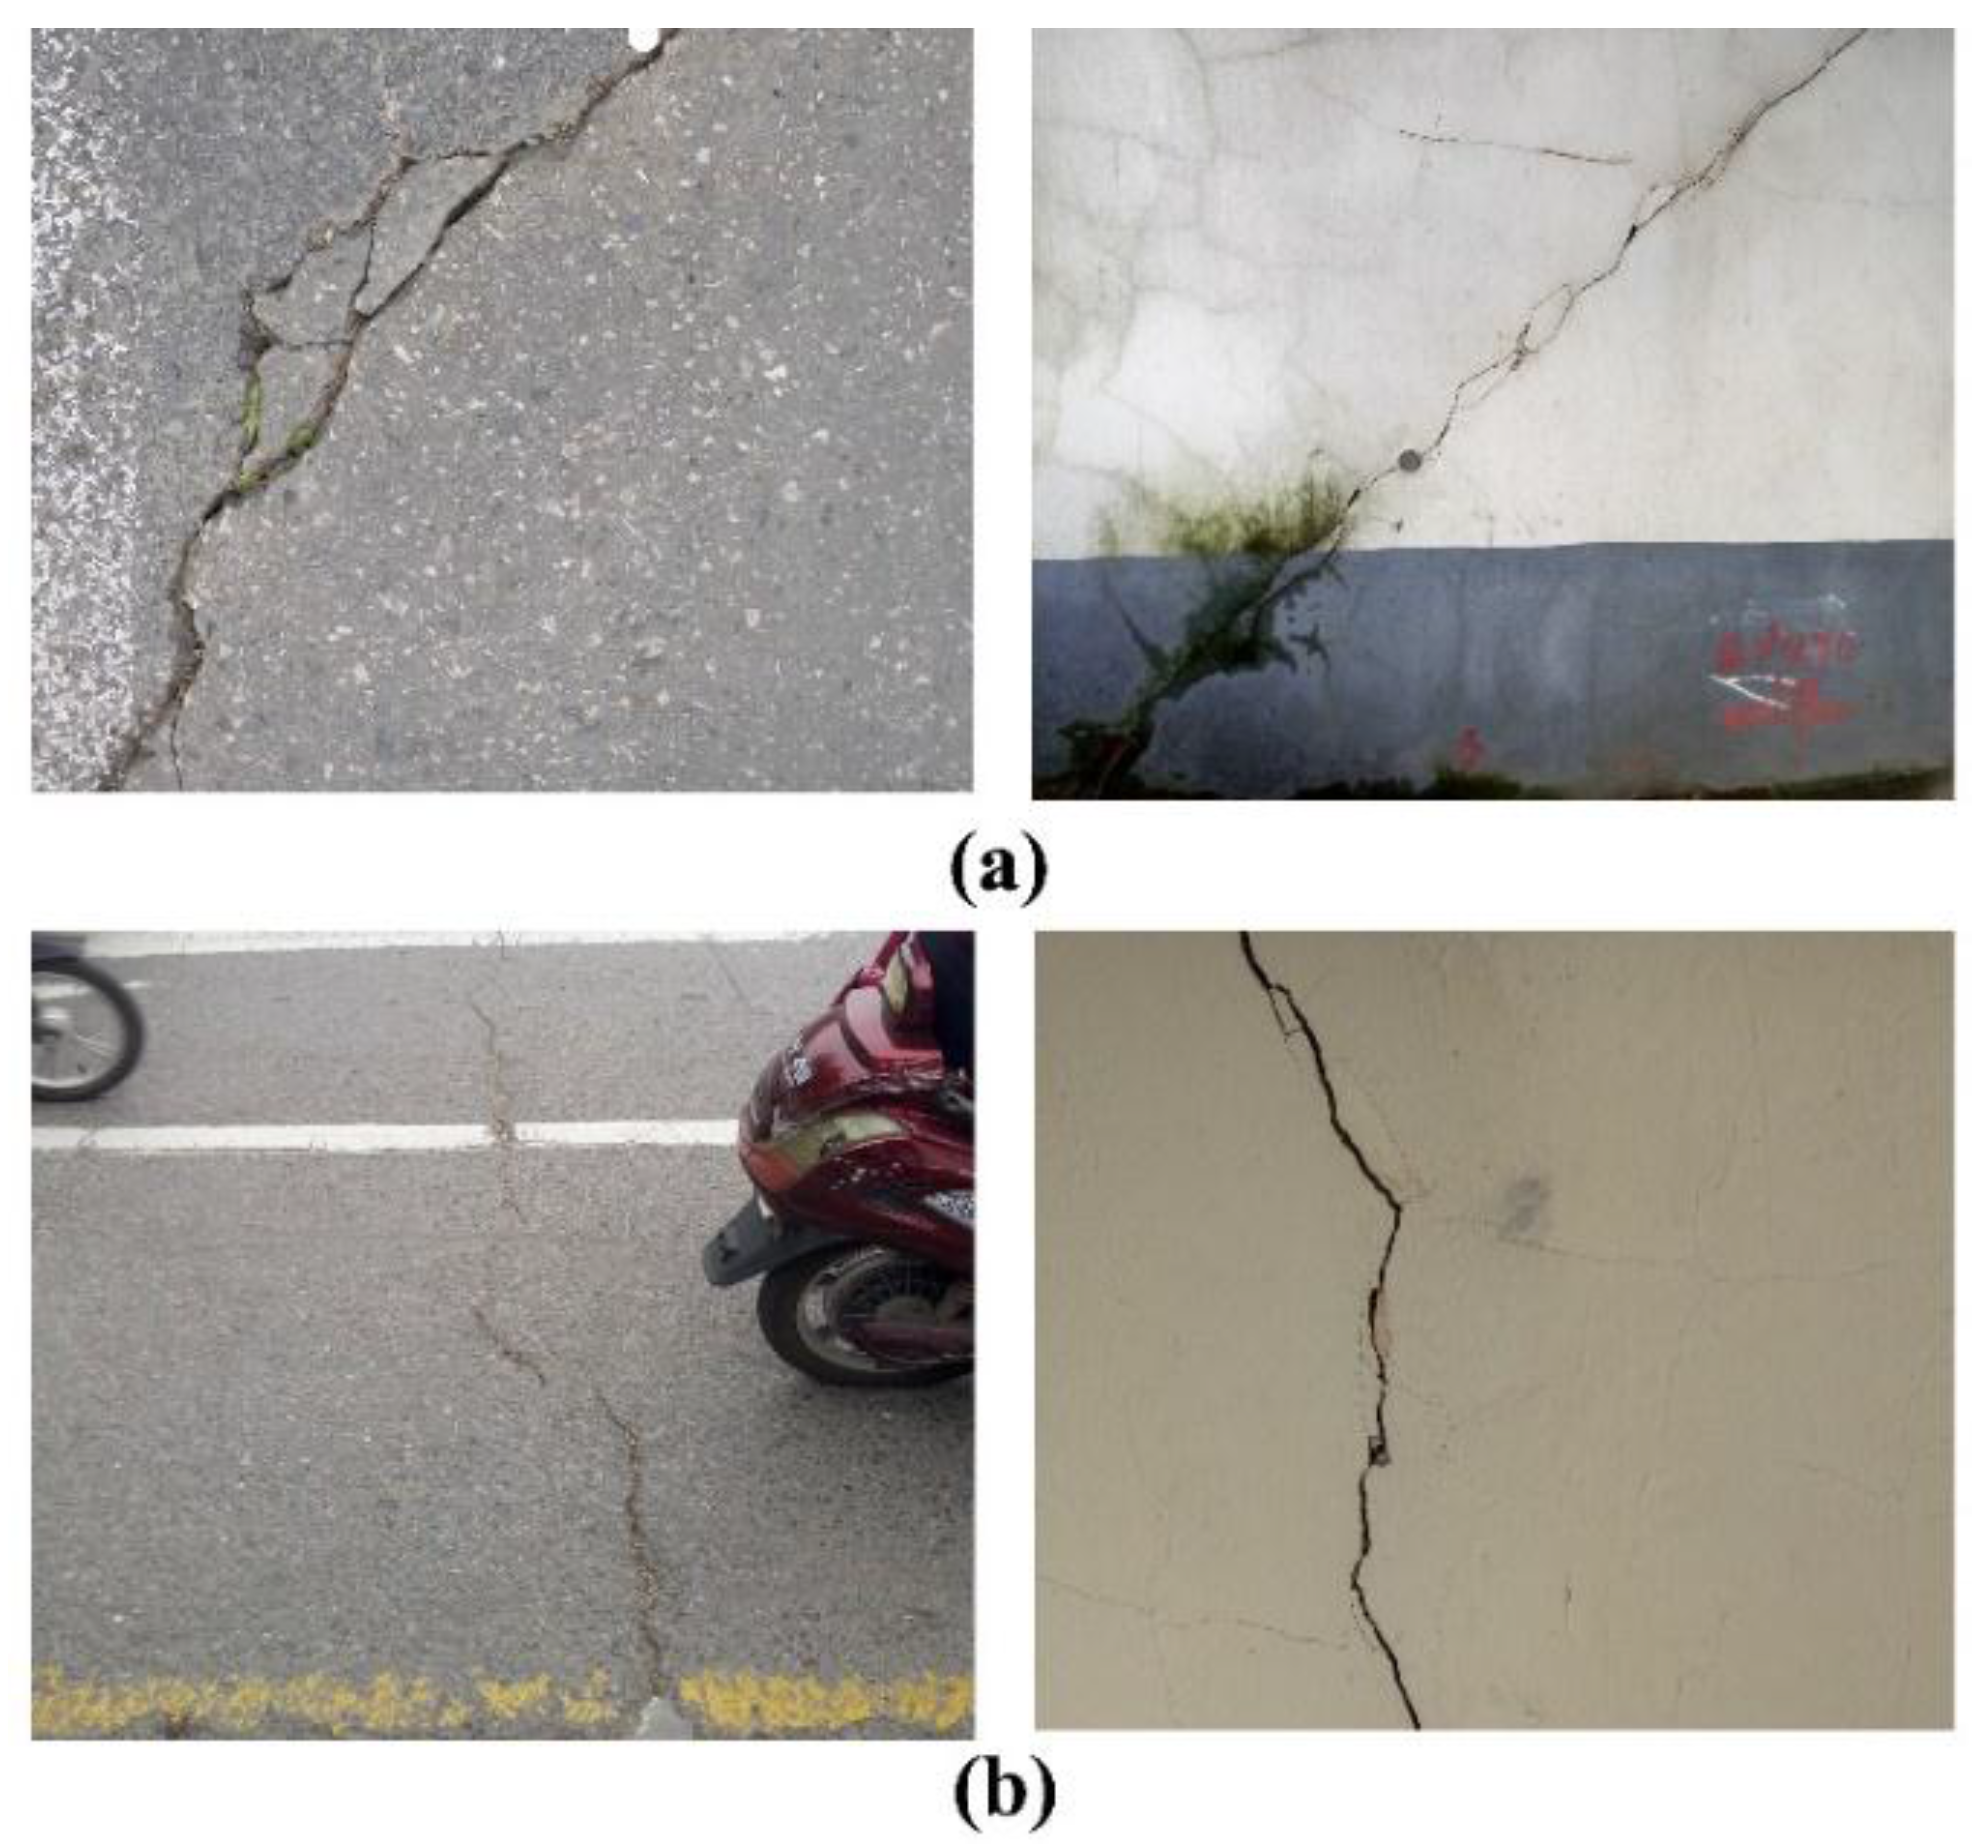
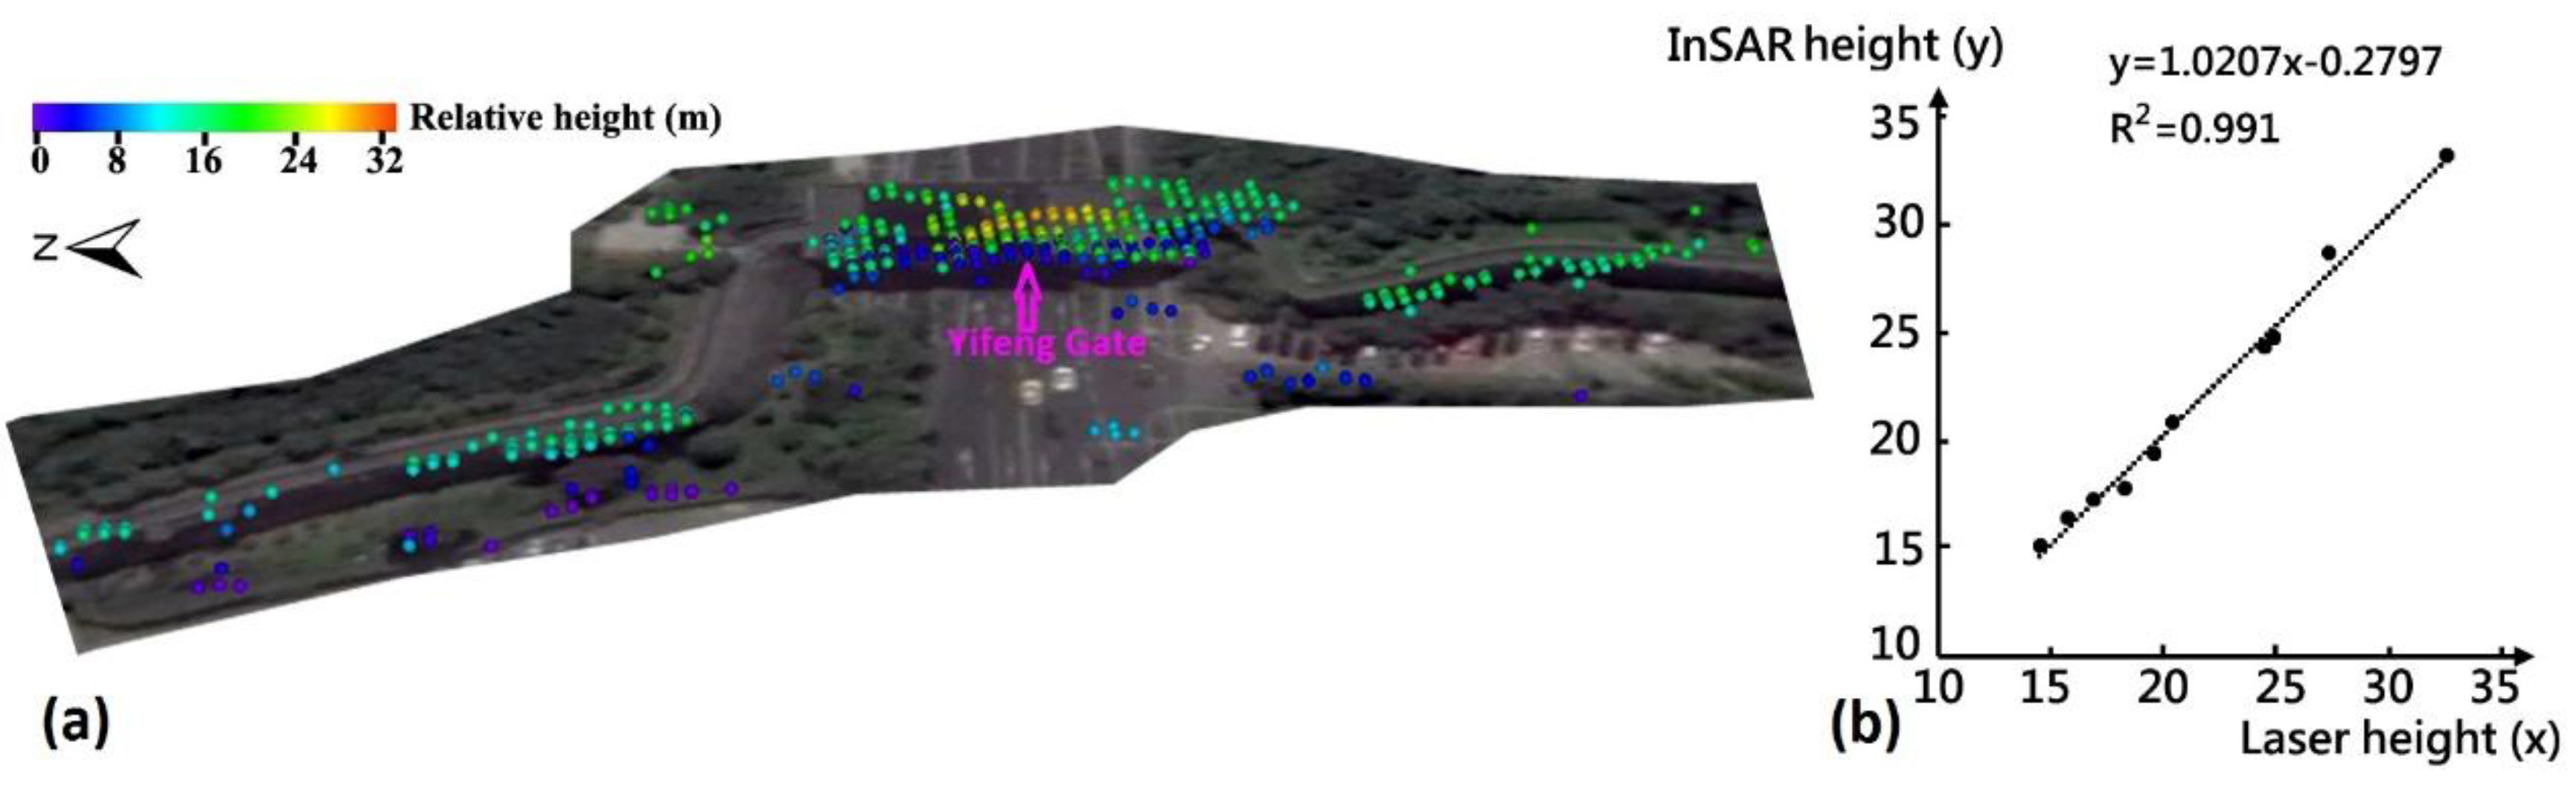
4.3. Validation
5. Discussion
6. Conclusions
Acknowledgments
Author Contributions
Conflicts of Interest
References
- Chen, F.; Lin, H.; Hu, X. Slope superficial displacement monitoring by small baseline SAR interferometry using data from L-band ALOS PALSAR and X-band TerraSAR: A case study of Hong Kong. Remote Sens. 2014, 6, 1564–1586. [Google Scholar] [CrossRef]
- Ferretti, A.; Prati, C.; Rocca, F. Permanent scatterers in SAR interferometry. IEEE Trans. Geosci. Remote Sens. 2001, 39, 8–20. [Google Scholar] [CrossRef]
- Ferretti, A.; Prati, C.; Rocca, F. Nonlinear subsidence rate estimation using permanent scatterers in differential SAR interferometry. IEEE Trans. Geosci. Remote Sens. 2000, 38, 2202–2212. [Google Scholar] [CrossRef]
- Kampes, B.M. Radar Interferometry: Persistent Scatterer Technique; Springer: Dordrecht, The Netherlands, 2006. [Google Scholar]
- Hooper, A.; Segall, P.; Zebker, H. Persistent scatterer interferometric synthetic aperture radar for crustal deformation analysis, with application to Volcán Alcedo, Galápagos. J. Geophys. Res. 2007, 112, B07407. [Google Scholar] [CrossRef]
- Berardino, P.; Fornaro, G.; Lanari, R.; Sansosti, E. A new algorithm for surface deformation monitoring based on small baseline differential SAR interferograms. IEEE Trans. Geosci. Remote Sens. 2002, 40, 2375–2383. [Google Scholar] [CrossRef]
- Ferretti, A.; Fumagalli, A.; Novali, F.; Prati, C.; Rocca, F. A New algorithm for processing interferometric data-stacks: SqueeSAR. IEEE Trans. Geosci. Remote Sens. 2011, 49, 3460–3470. [Google Scholar] [CrossRef]
- Tapete, D.; Fanti, R.; Cecchi, R. Satellite radar interferometry for monitoring and early-stage warning of structural instability in archaeological sites. J. Geophys. Eng. 2012, 9, 10–25. [Google Scholar] [CrossRef]
- Cigna, F.; Lasaponara, R.; Masini, N.; Milillo, P.; Tapete, D. Persistent Scatterer Interferometry Processing of COSMO-SkyMed StripMap HIMAGE Time Series to Depict Deformation of the Historic Centre of Rome, Italy. Remote Sens. 2014, 6, 12593–12618. [Google Scholar] [CrossRef]
- Chen, F.; Jiang, A.; Ishwaran, N. Angkor site monitoring and evaluation by radar remote sensing. Proceedings of Land Surface Remote Sensing II, Asia-Pacific Remote Sensing Symposium 2014, Beijing, China, 13–17 October 2014. [Google Scholar]
- Chaussard, E.; Wdowinski, S.; Cabral-Cano, E.; Amelung, F. Land subsidence in central Mexico detected by ALOS InSAR time-series. Remote Sens. Environ. 2014, 140, 94–106. [Google Scholar] [CrossRef]
- Tang, P.; Chen, F.; Zhu, X.; Zhou, W. Monitoring cultural heritage sites with advanced multi-temporal InSAR technique: The case study of the Summer Palace. Remote Sens. 2016, 8, 432. [Google Scholar] [CrossRef]
- De Maio, A.; Fornaro, G.; Pauciullo, A. Detection of single scatterers in multidimensional SAR imaging. IEEE Trans. Geosci. Remote Sens. 2009, 47, 2284–2297. [Google Scholar] [CrossRef]
- Ma, P.; Lin, H.; Lan, H.; Chen, F. Multi-dimensional SAR tomography for monitoring the deformation of newly built concrete buildings. ISPRS J. Photogramm. Remote Sens. 2015, 106, 118–128. [Google Scholar] [CrossRef]
- Fornaro, G.; Serafino, F.; Reale, D. 4-D SAR imaging: the case study of Rome. IEEE Geosci. Remote Sens. Lett. 2010, 7, 236–240. [Google Scholar] [CrossRef]
- Zhu, X.X.; Montazeri, S.; Gisinger, C.; Hanssen, R.F.; Bamler, R. Geodetic SAR Tomography. IEEE Trans. Geosci. Remote Sens. 2016, 54, 18–35. [Google Scholar] [CrossRef]
- Wei, L.; Balz, T.; Zhang, L.; Liao, M. A novel fast approach for SAR tomography: Two-step iterative shrinkage/thresholding. IEEE Geosci. Remote Sens. Lett. 2015, 12, 1377–1381. [Google Scholar]
- Schmitt, M.; Shahzad, M.; Zhu, X.X. Reconstruction of individual trees from multi-aspect TomoSAR data. Remote Sens. Environ. 2015, 165, 175–185. [Google Scholar] [CrossRef]
- Lombardini, F. Differential tomography: A new framework for SAR interferometry. IEEE Trans. Geosci. Remote Sens. 2005, 43, 37–44. [Google Scholar] [CrossRef]
- Crosetto, M.; Monserrat, O.; Cuevas-González, M.; Devanthéry, N.; Luzi, G.; Crippa, B. Measuring thermal expansion using X-band persistent scatter interferometry. ISPRS J. Photogramm. Remote Sens. 2015, 100, 84–91. [Google Scholar] [CrossRef]
- Ma, P.; Lin, H. Robust detection of single and double persistent scatterers in urban built environments. IEEE Trans. Geosci. Remote Sens. 2016, 54, 2124–2139. [Google Scholar] [CrossRef]
- Lombardini, F.; Viviani, F. New development of 4D+ differential SAR tomography to probe complex dynamic scenes. In Proceedings of the IGARSS 2014, Quebec City, QC, Canada, 13–18 July 2014; pp. 3362–3365. [Google Scholar]
- Siddique, M.A.; Wegmüller, U.; Hajnsek, I.; Frey, O. Single-look SAR tomography as an add-on to PSI for improved deformation analysis in urban areas. IEEE Trans. Geosci. Remote Sens. 2016, 54, 6119–6137. [Google Scholar] [CrossRef]
- Huber, P.J. Robust estimation of a location parameter. Ann. Math. Stat. 1964, 35, 73–101. [Google Scholar] [CrossRef]
- Fornaro, G.; Lombardini, F.; Pauciullo, A.; Reale, D.; Viviani, F. Tomographic Processing of Interferometric SAR Data: Developments, applications, and future research perspectives. IEEE Signal Process. Mag. 2014, 31, 41–50. [Google Scholar] [CrossRef]
- Xu, S.; Yan, C.; Sun, Y. Environmental geological problems of urban underground engineering. J. Eng. Geol. 2003, 11, 127–132. [Google Scholar]
- Shi, S.Q.; Pan, F.Y.; Miao, B.Z. Old channel and its influence on municipal construction in Nanjing city. Jiangsu Geol. 1990, 1, 31–34. [Google Scholar]
- Tapete, D.; Morelli, S.; Fanti, R.; Casagli, N. Localising deformation along the elevation of linear structures: An experiment with spaceborne InSAR and RTK GPS on the Roman Aqueducts in Rome, Italy. Appl. Geogr. 2015, 58, 65–83. [Google Scholar] [CrossRef]
- Chang, L.; Hanssen, R.F. Detection of cavity migration and sinkhole risk using radar interferometric time series. Remote Sens. Environ. 2014, 147, 56–64. [Google Scholar] [CrossRef]


| No. | Acquisitions | Bperp (m) | Temp. (°C) |
|---|---|---|---|
| 1 | 2013-05-31 | 113.83 | 24.0 |
| 2 | 2013-06-22 | 303.16 | 31.0 |
| 3 | 2013-07-14 | 254.63 | 32.0 |
| 4 | 2013-08-05 | 68.81 | 36.0 |
| 5 | 2013-08-27 | −102.96 | 32.0 |
| 6 | 2013-09-18 | 23.02 | 29.0 |
| 7 | 2013-10-10 | 35.22 | 28.0 |
| 8 | 2013-11-01 | −33.09 | 20.0 |
| 9 | 2013-11-23 | −125.49 | 18.0 |
| 10 | 2013-12-15 | 0.66 | 12.0 |
| 11 | 2014-01-06 | −87.22 | 13.0 |
| 12 | 2014-01-28 * | 0 | 13.0 |
| 13 | 2014-02-19 | 140.29 | 5.0 |
| 14 | 2014-05-18 | −49.15 | 25.0 |
| 15 | 2014-06-09 | 375.85 | 31.0 |
| 16 | 2014-07-01 | −10.11 | 25.0 |
| 17 | 2014-07-23 | −219.30 | 35.0 |
| 18 | 2014-08-14 | −28.35 | 24.0 |
| 19 | 2014-09-05 | 127.44 | 29.0 |
| 20 | 2014-09-27 | 19.78 | 28.0 |
| 21 | 2014-10-19 | 149.93 | 27.0 |
| 22 | 2014-11-10 | 91.43 | 17.0 |
| 23 | 2014-12-02 | −154.36 | 6.0 |
| 24 | 2014-12-24 | 195.37 | 12.0 |
| 25 | 2015-01-15 | −151.47 | 10.0 |
| 26 | 2015-02-06 | 76.89 | 9.0 |
| Velocity Rates (mm/Year) | |||||||||||||||
|---|---|---|---|---|---|---|---|---|---|---|---|---|---|---|---|
| 0.3 | 0.6 | −2.0 | −3.1 | −1.6 | −4.3 | −6.3 | −4.6 | −3.7 | −3.6 | −3.4 | −1.7 | −0.6 | −3.2 | ||
| 1.8 | 0.5 | 0.7 | 1.0 | −2.6 | −3.8 | −2.7 | −5.7 | −2.1 | −2.4 | −3.8 | −2.5 | −3.6 | −5.9 | −2.3 | −4.1 |
© 2017 by the authors. Licensee MDPI, Basel, Switzerland. This article is an open access article distributed under the terms and conditions of the Creative Commons Attribution (CC BY) license (http://creativecommons.org/licenses/by/4.0/).
Share and Cite
Chen, F.; Wu, Y.; Zhang, Y.; Parcharidis, I.; Ma, P.; Xiao, R.; Xu, J.; Zhou, W.; Tang, P.; Foumelis, M. Surface Motion and Structural Instability Monitoring of Ming Dynasty City Walls by Two-Step Tomo-PSInSAR Approach in Nanjing City, China. Remote Sens. 2017, 9, 371. https://doi.org/10.3390/rs9040371
Chen F, Wu Y, Zhang Y, Parcharidis I, Ma P, Xiao R, Xu J, Zhou W, Tang P, Foumelis M. Surface Motion and Structural Instability Monitoring of Ming Dynasty City Walls by Two-Step Tomo-PSInSAR Approach in Nanjing City, China. Remote Sensing. 2017; 9(4):371. https://doi.org/10.3390/rs9040371
Chicago/Turabian StyleChen, Fulong, Yuhua Wu, Yimeng Zhang, Issaak Parcharidis, Peifeng Ma, Ruya Xiao, Jia Xu, Wei Zhou, Panpan Tang, and Michael Foumelis. 2017. "Surface Motion and Structural Instability Monitoring of Ming Dynasty City Walls by Two-Step Tomo-PSInSAR Approach in Nanjing City, China" Remote Sensing 9, no. 4: 371. https://doi.org/10.3390/rs9040371