
Active Deformation Areas of Potential Landslide Mapping with a Generalized Convolutional Neural Network


 ,
,
Abstract
:
1. Introduction
2. Materials and Methods
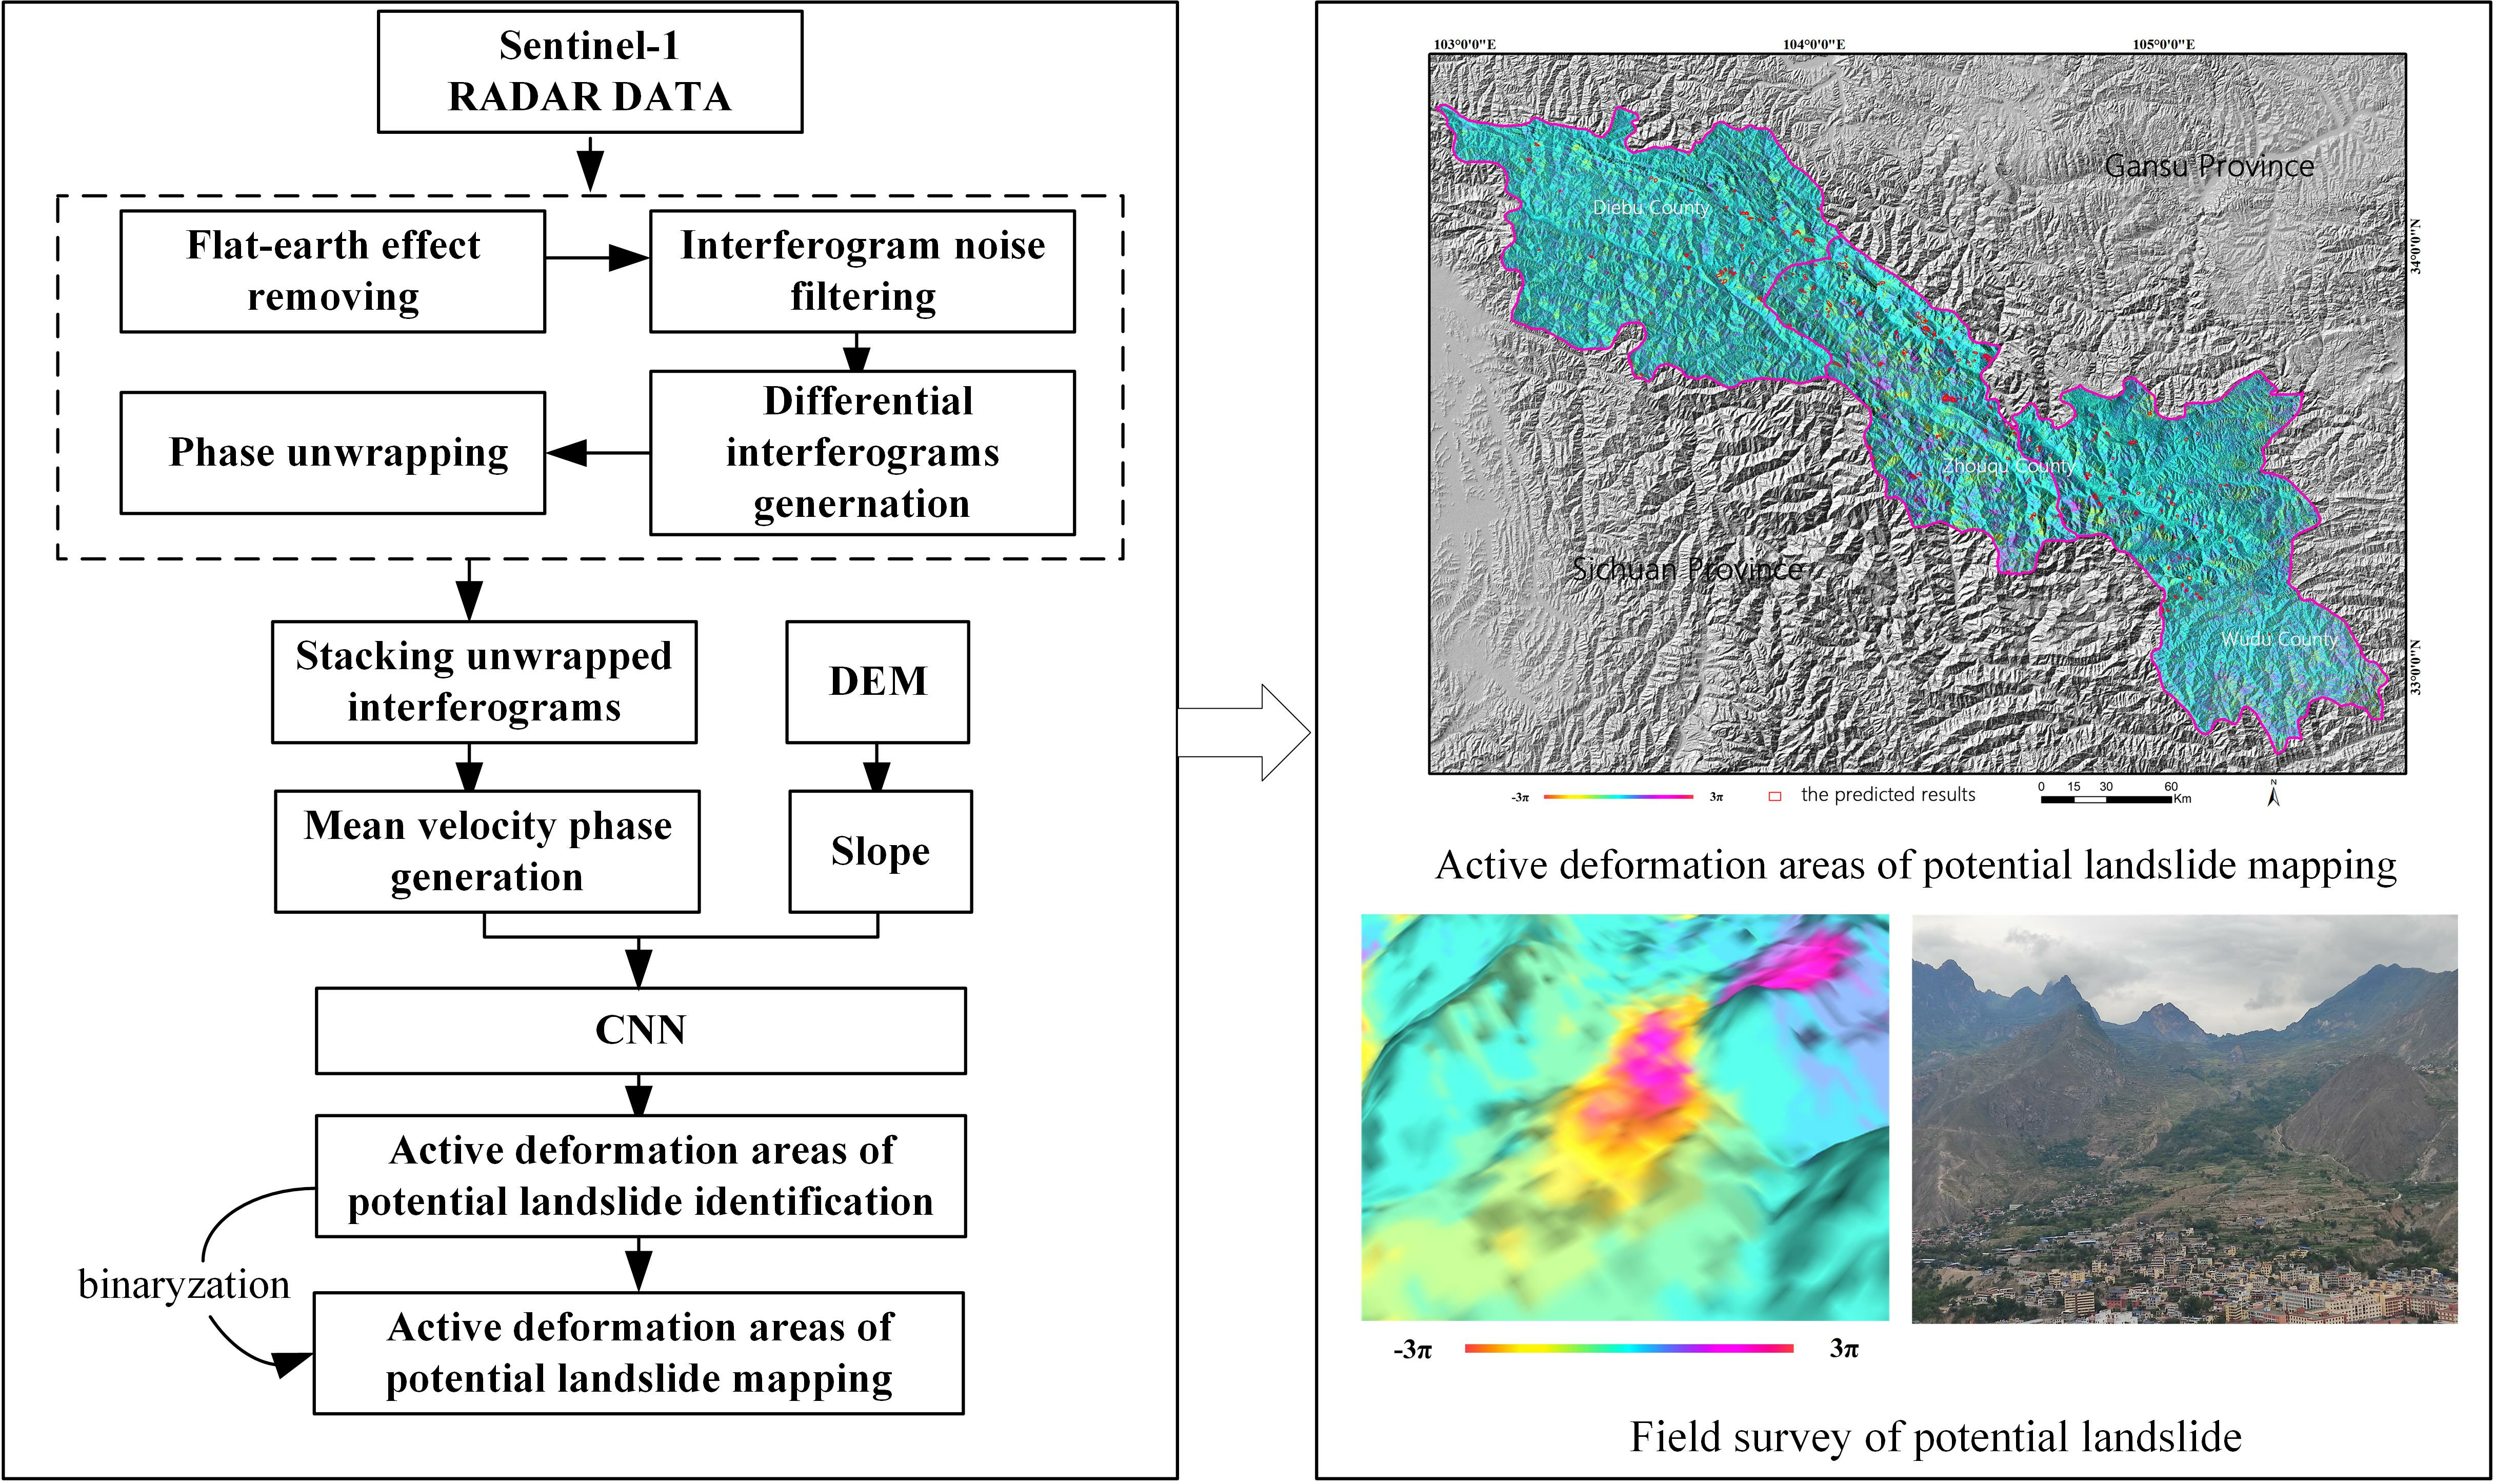
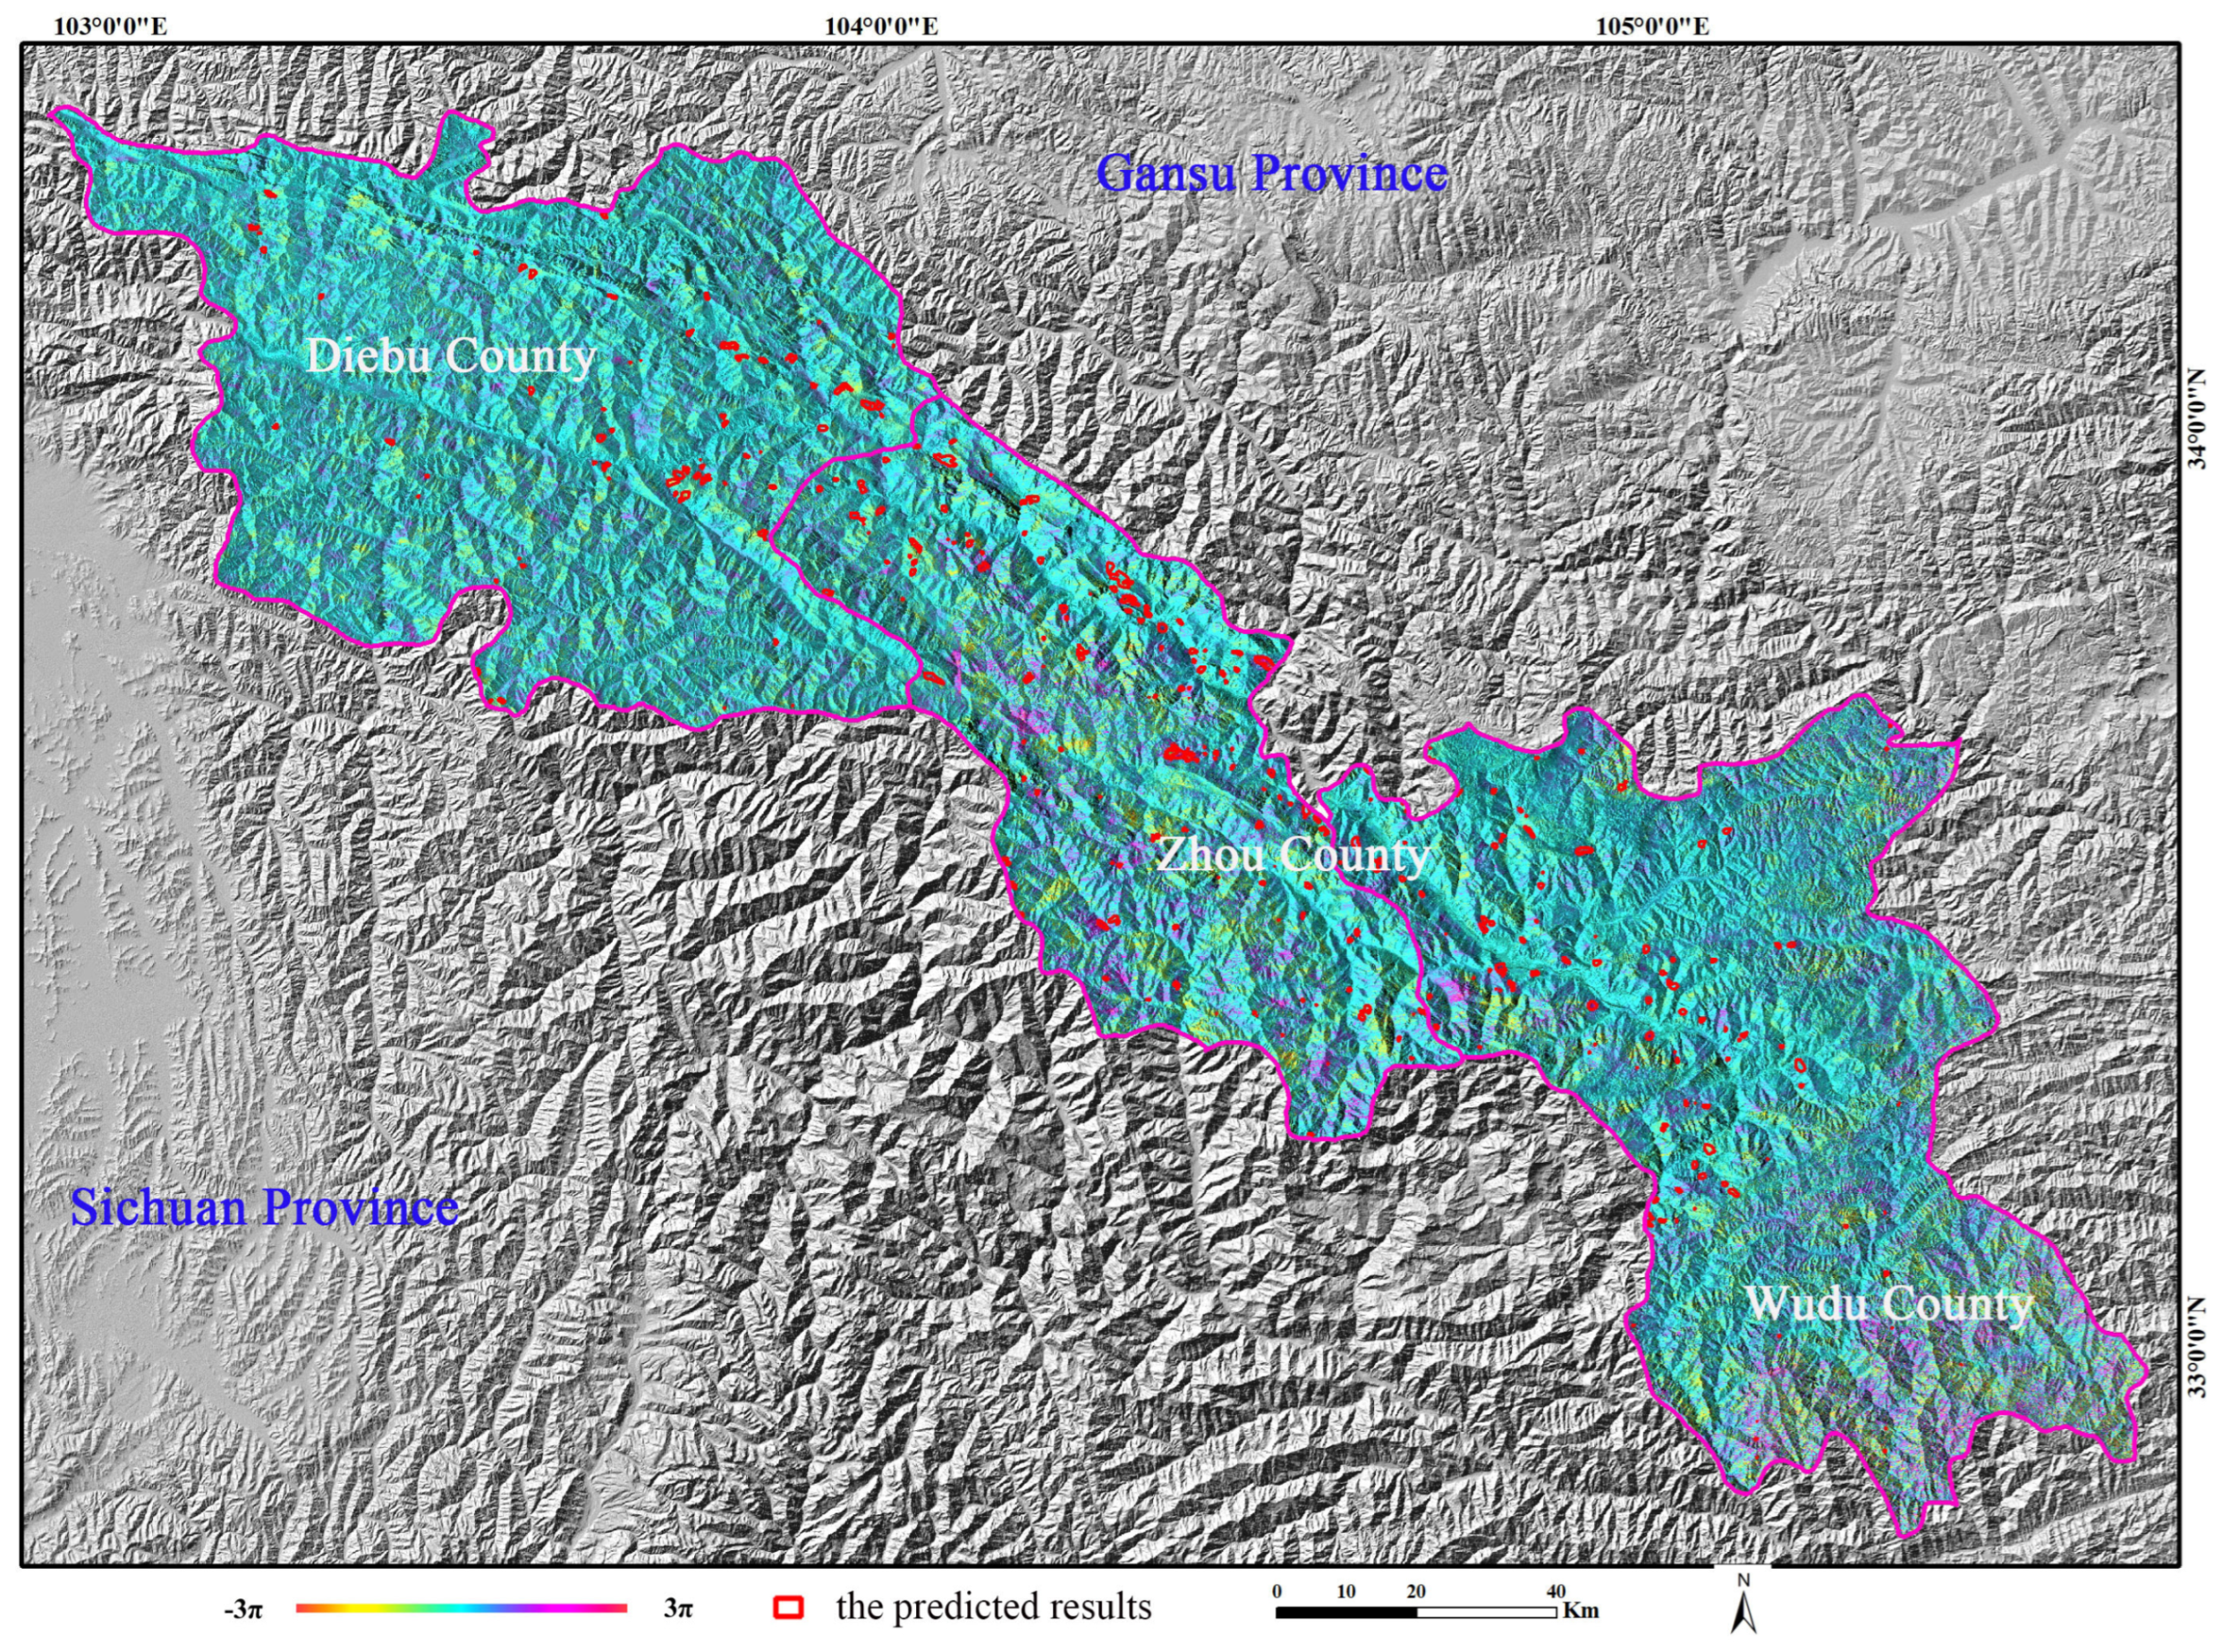
2.1. Study Area
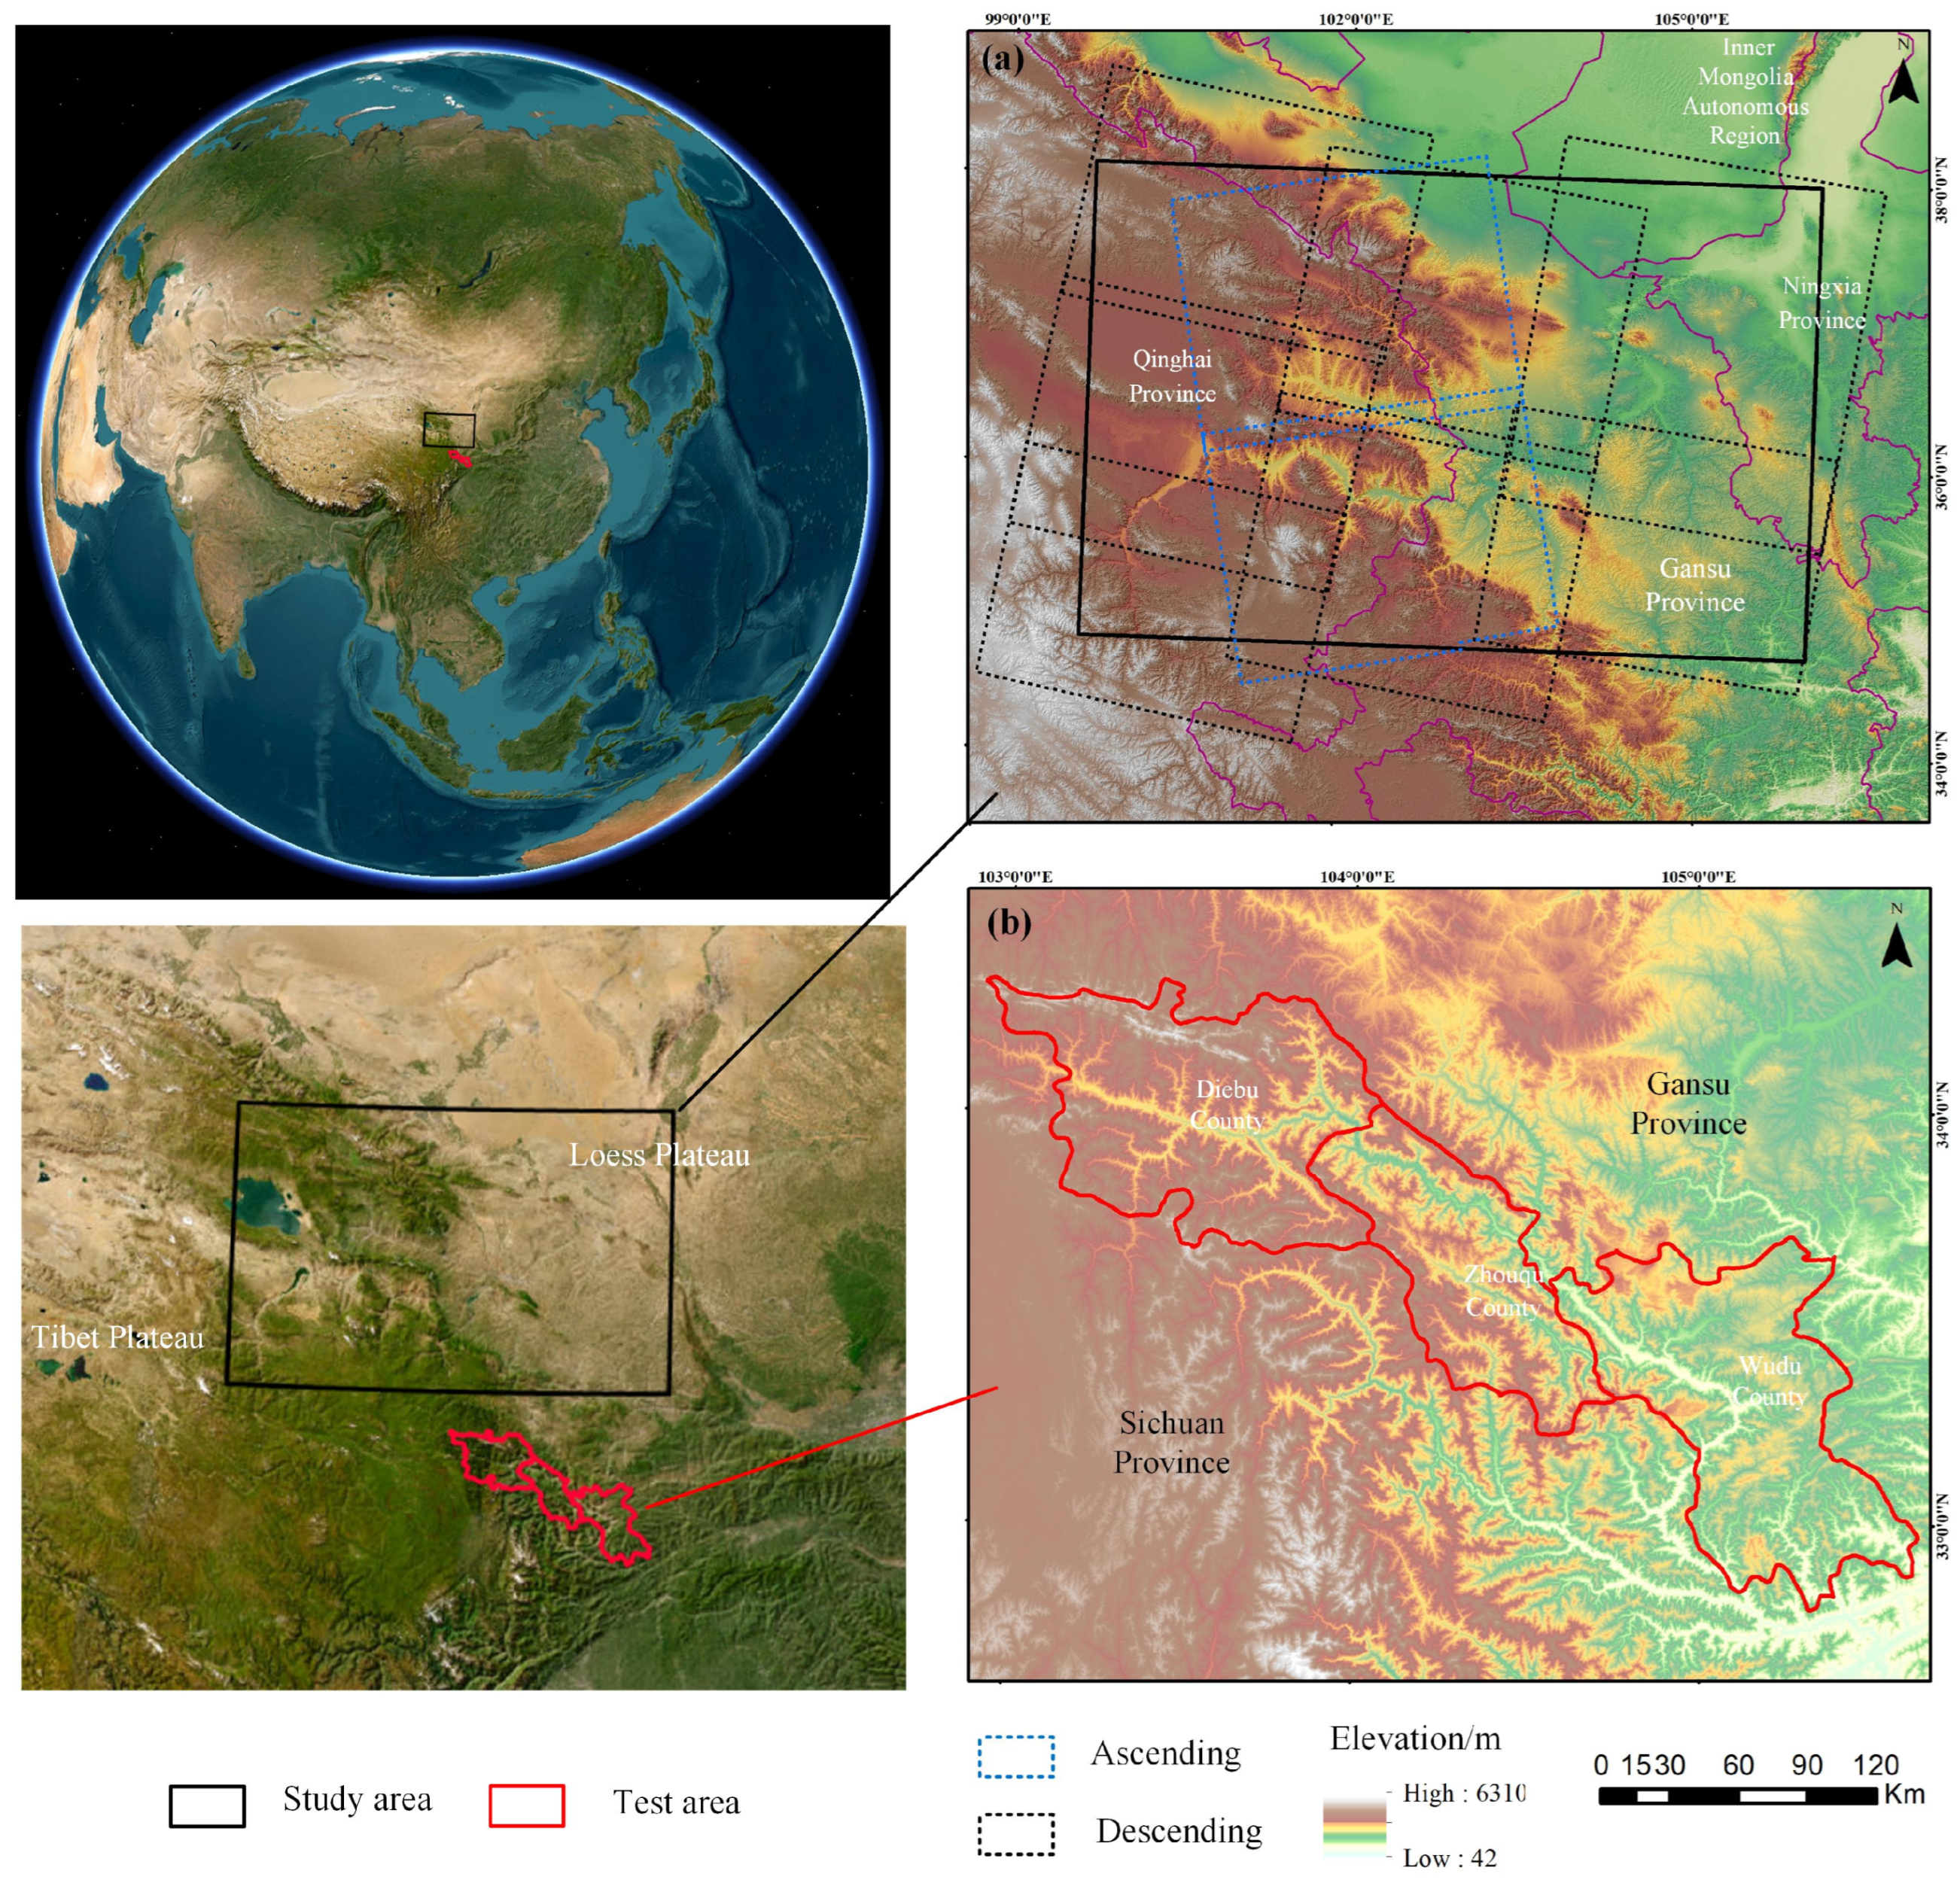
2.2. Data
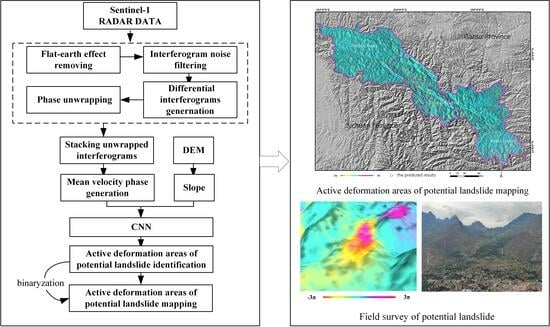
2.3. Methods
2.3.1. Stacking InSAR Technology
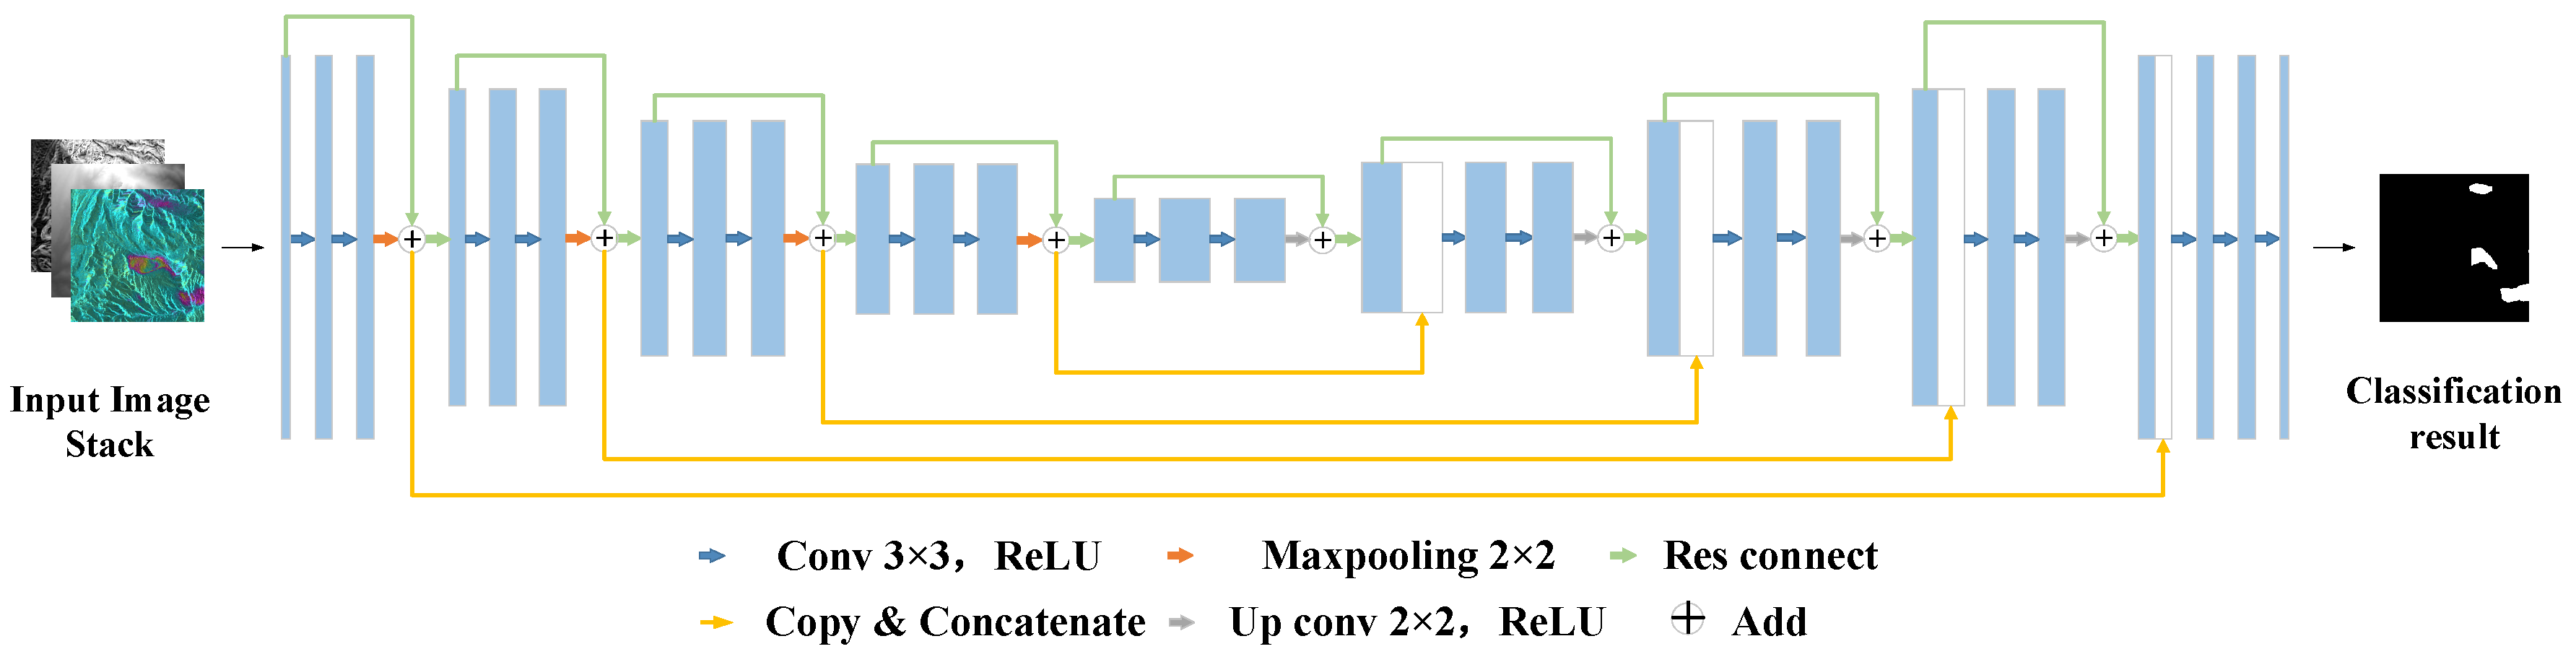
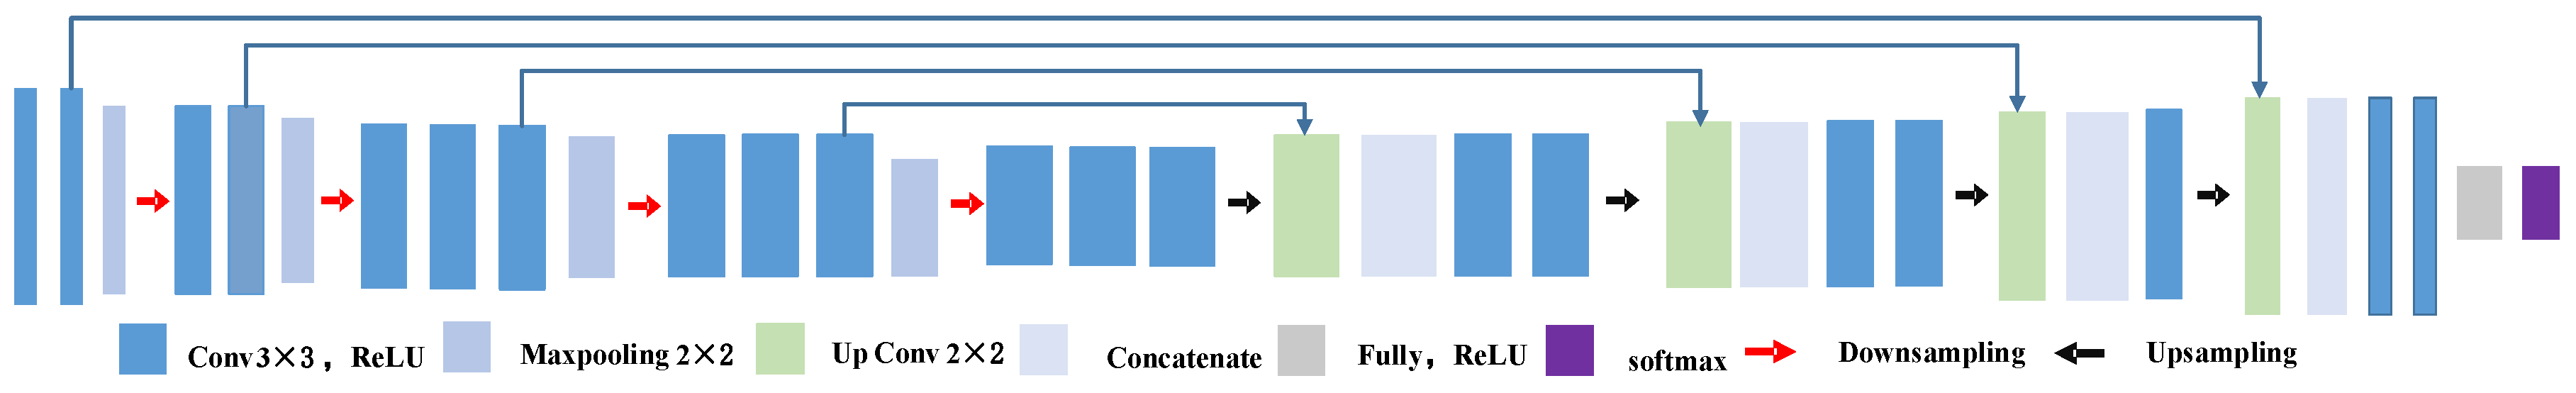
2.3.2. Deep Learning Technology
2.3.3. Accuracy Evaluation
3. Results
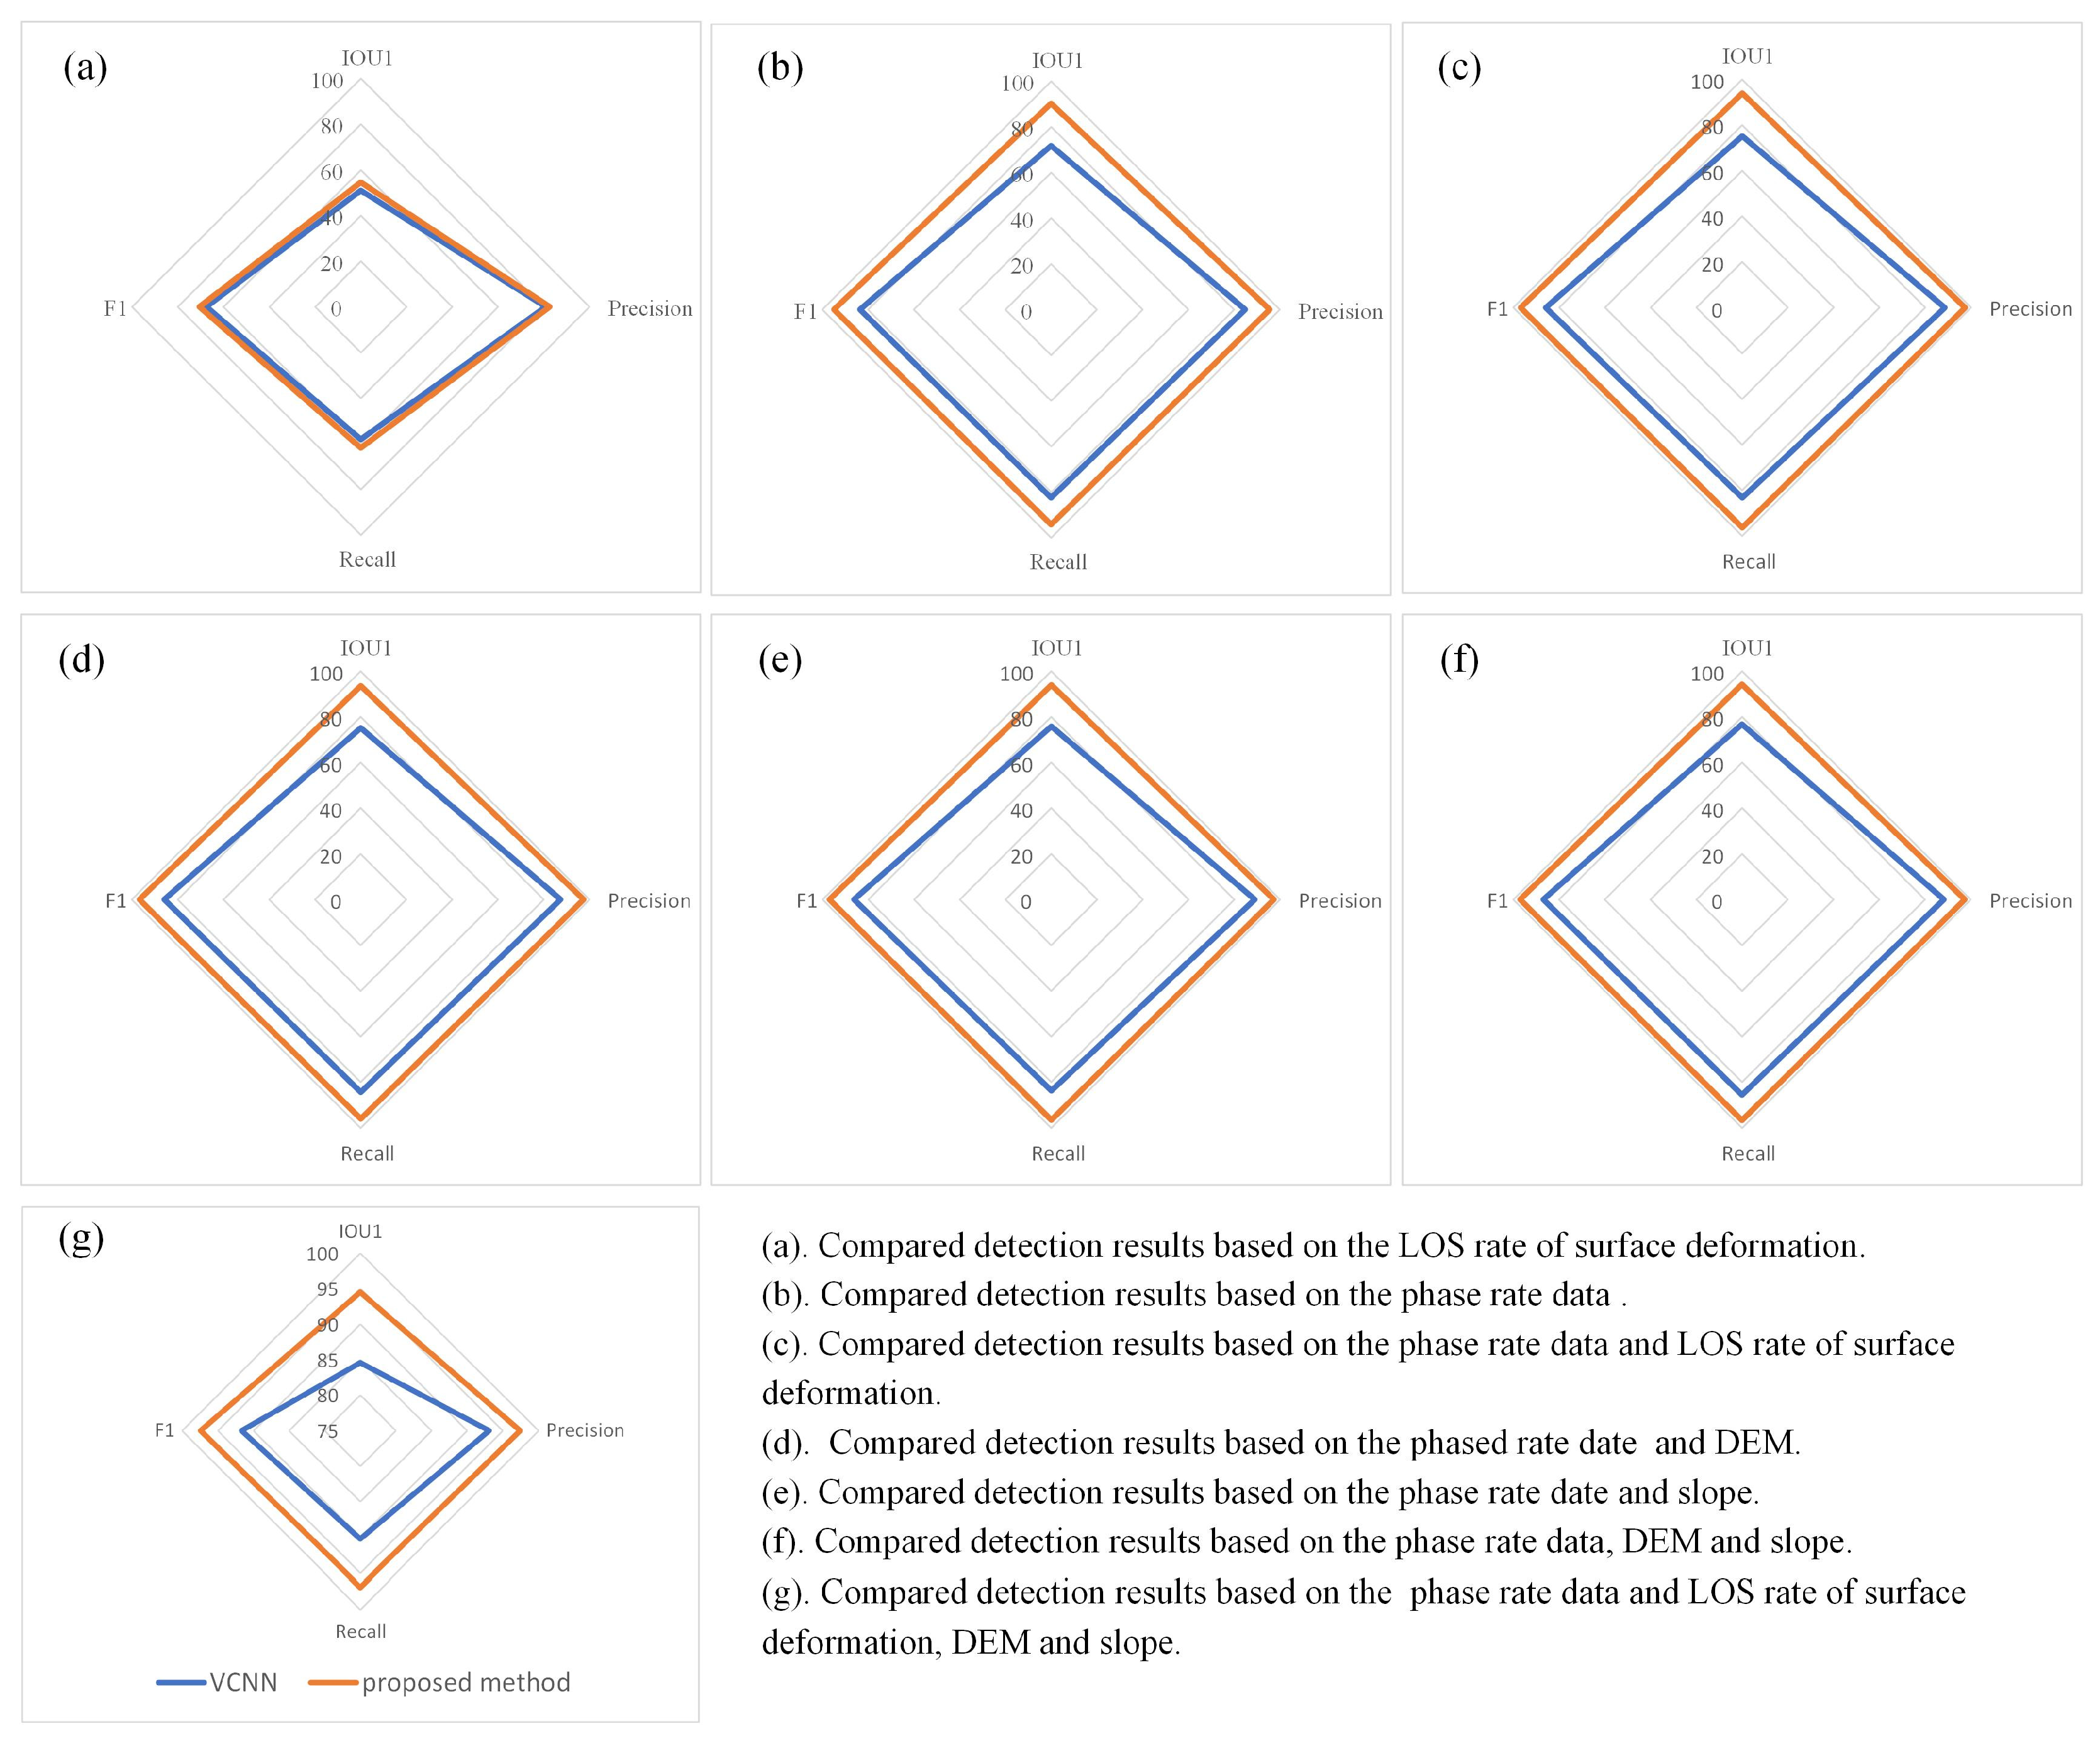
3.1. Evaluation of Detection Model Based on Different Source Domains
3.2. Comparison of Different Network Architectures
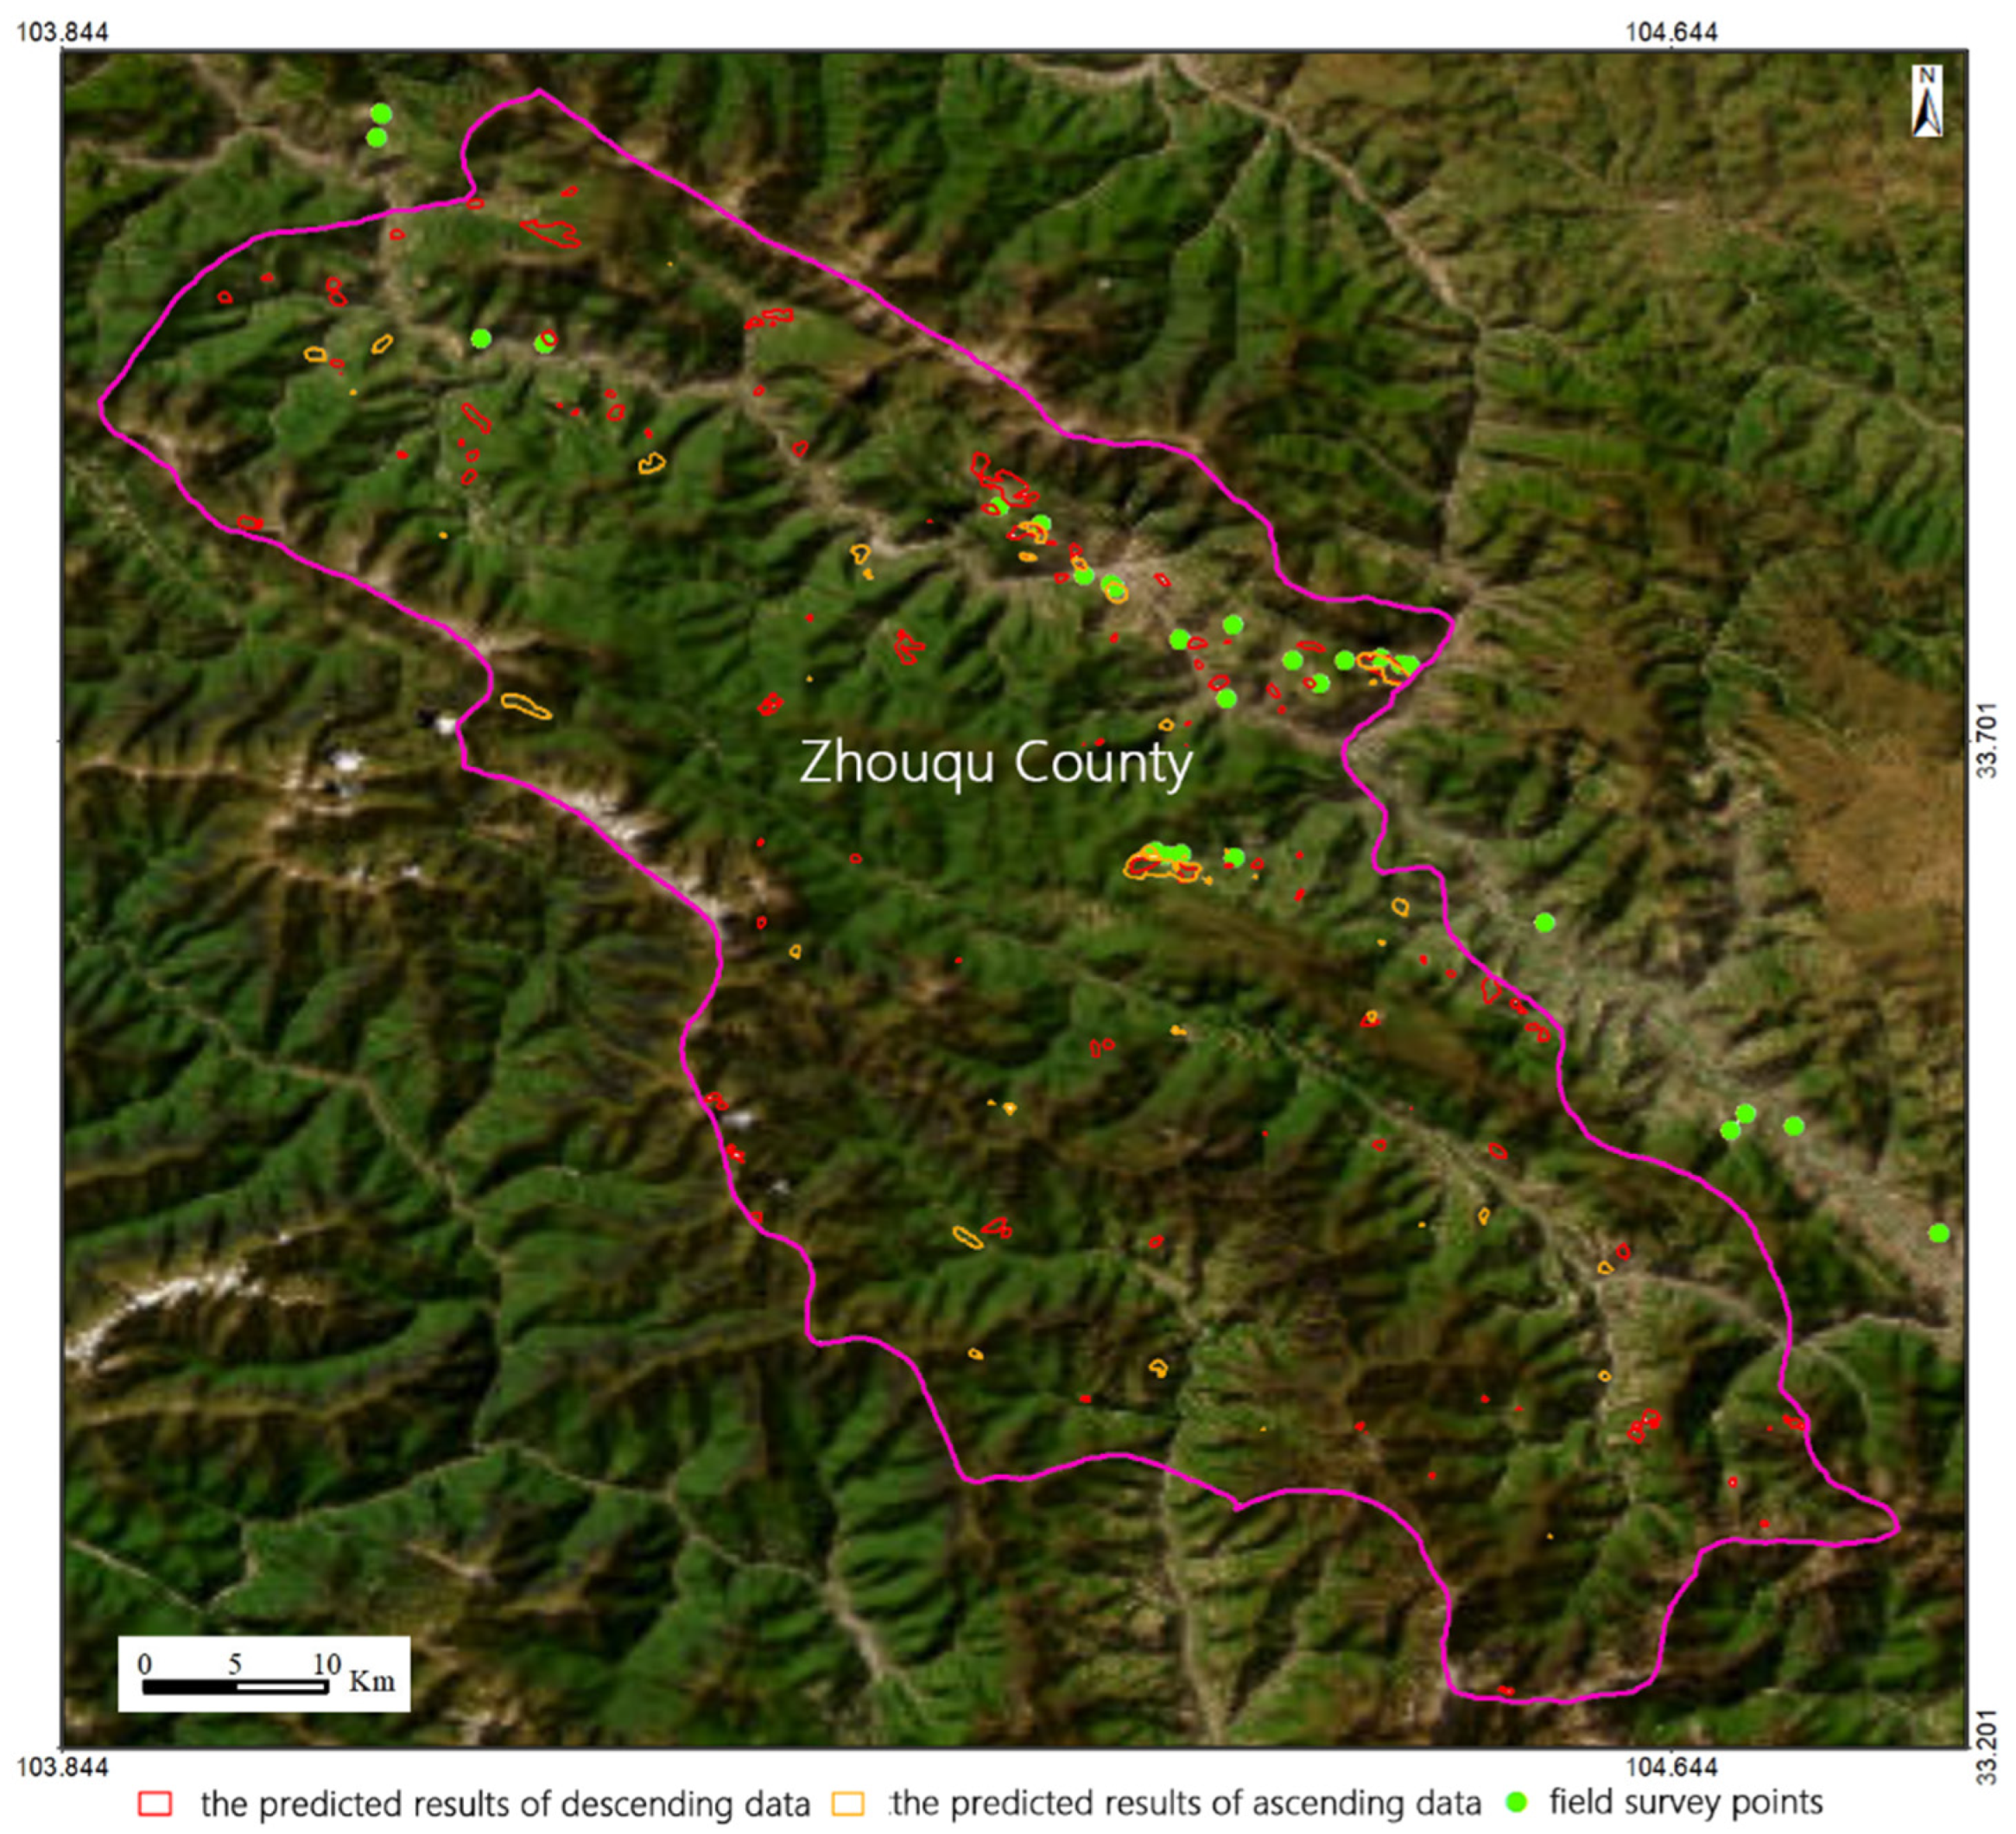
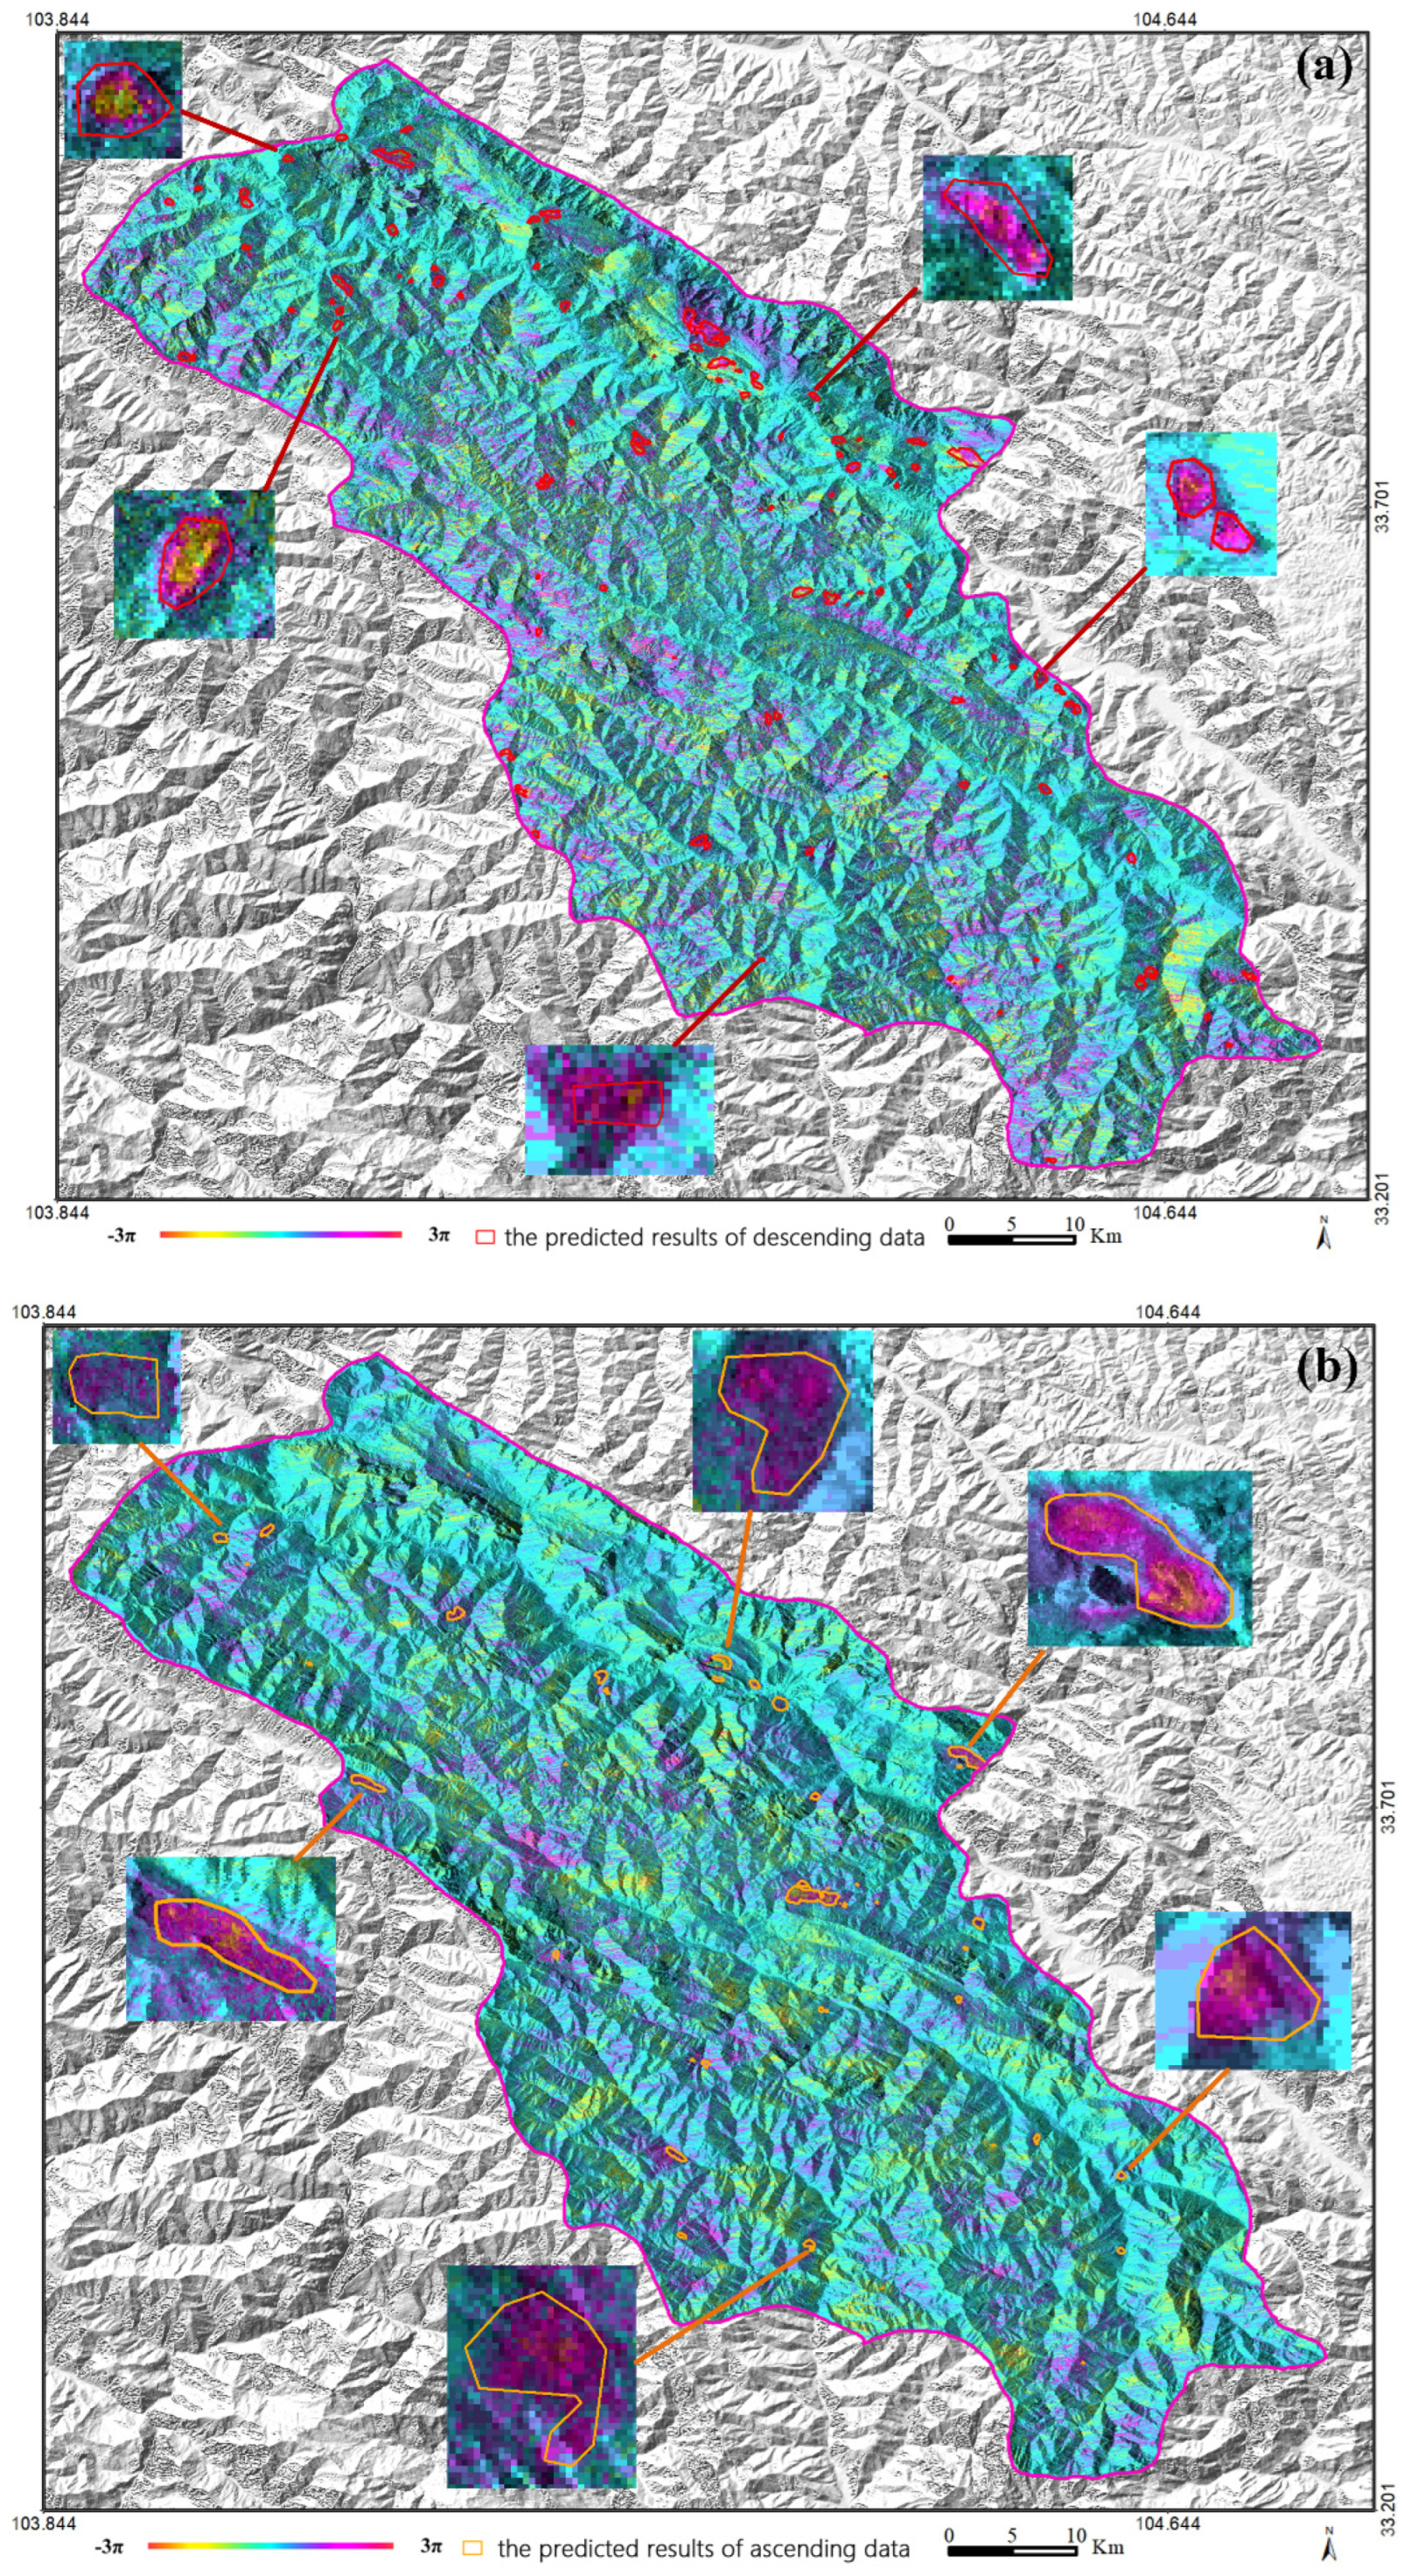
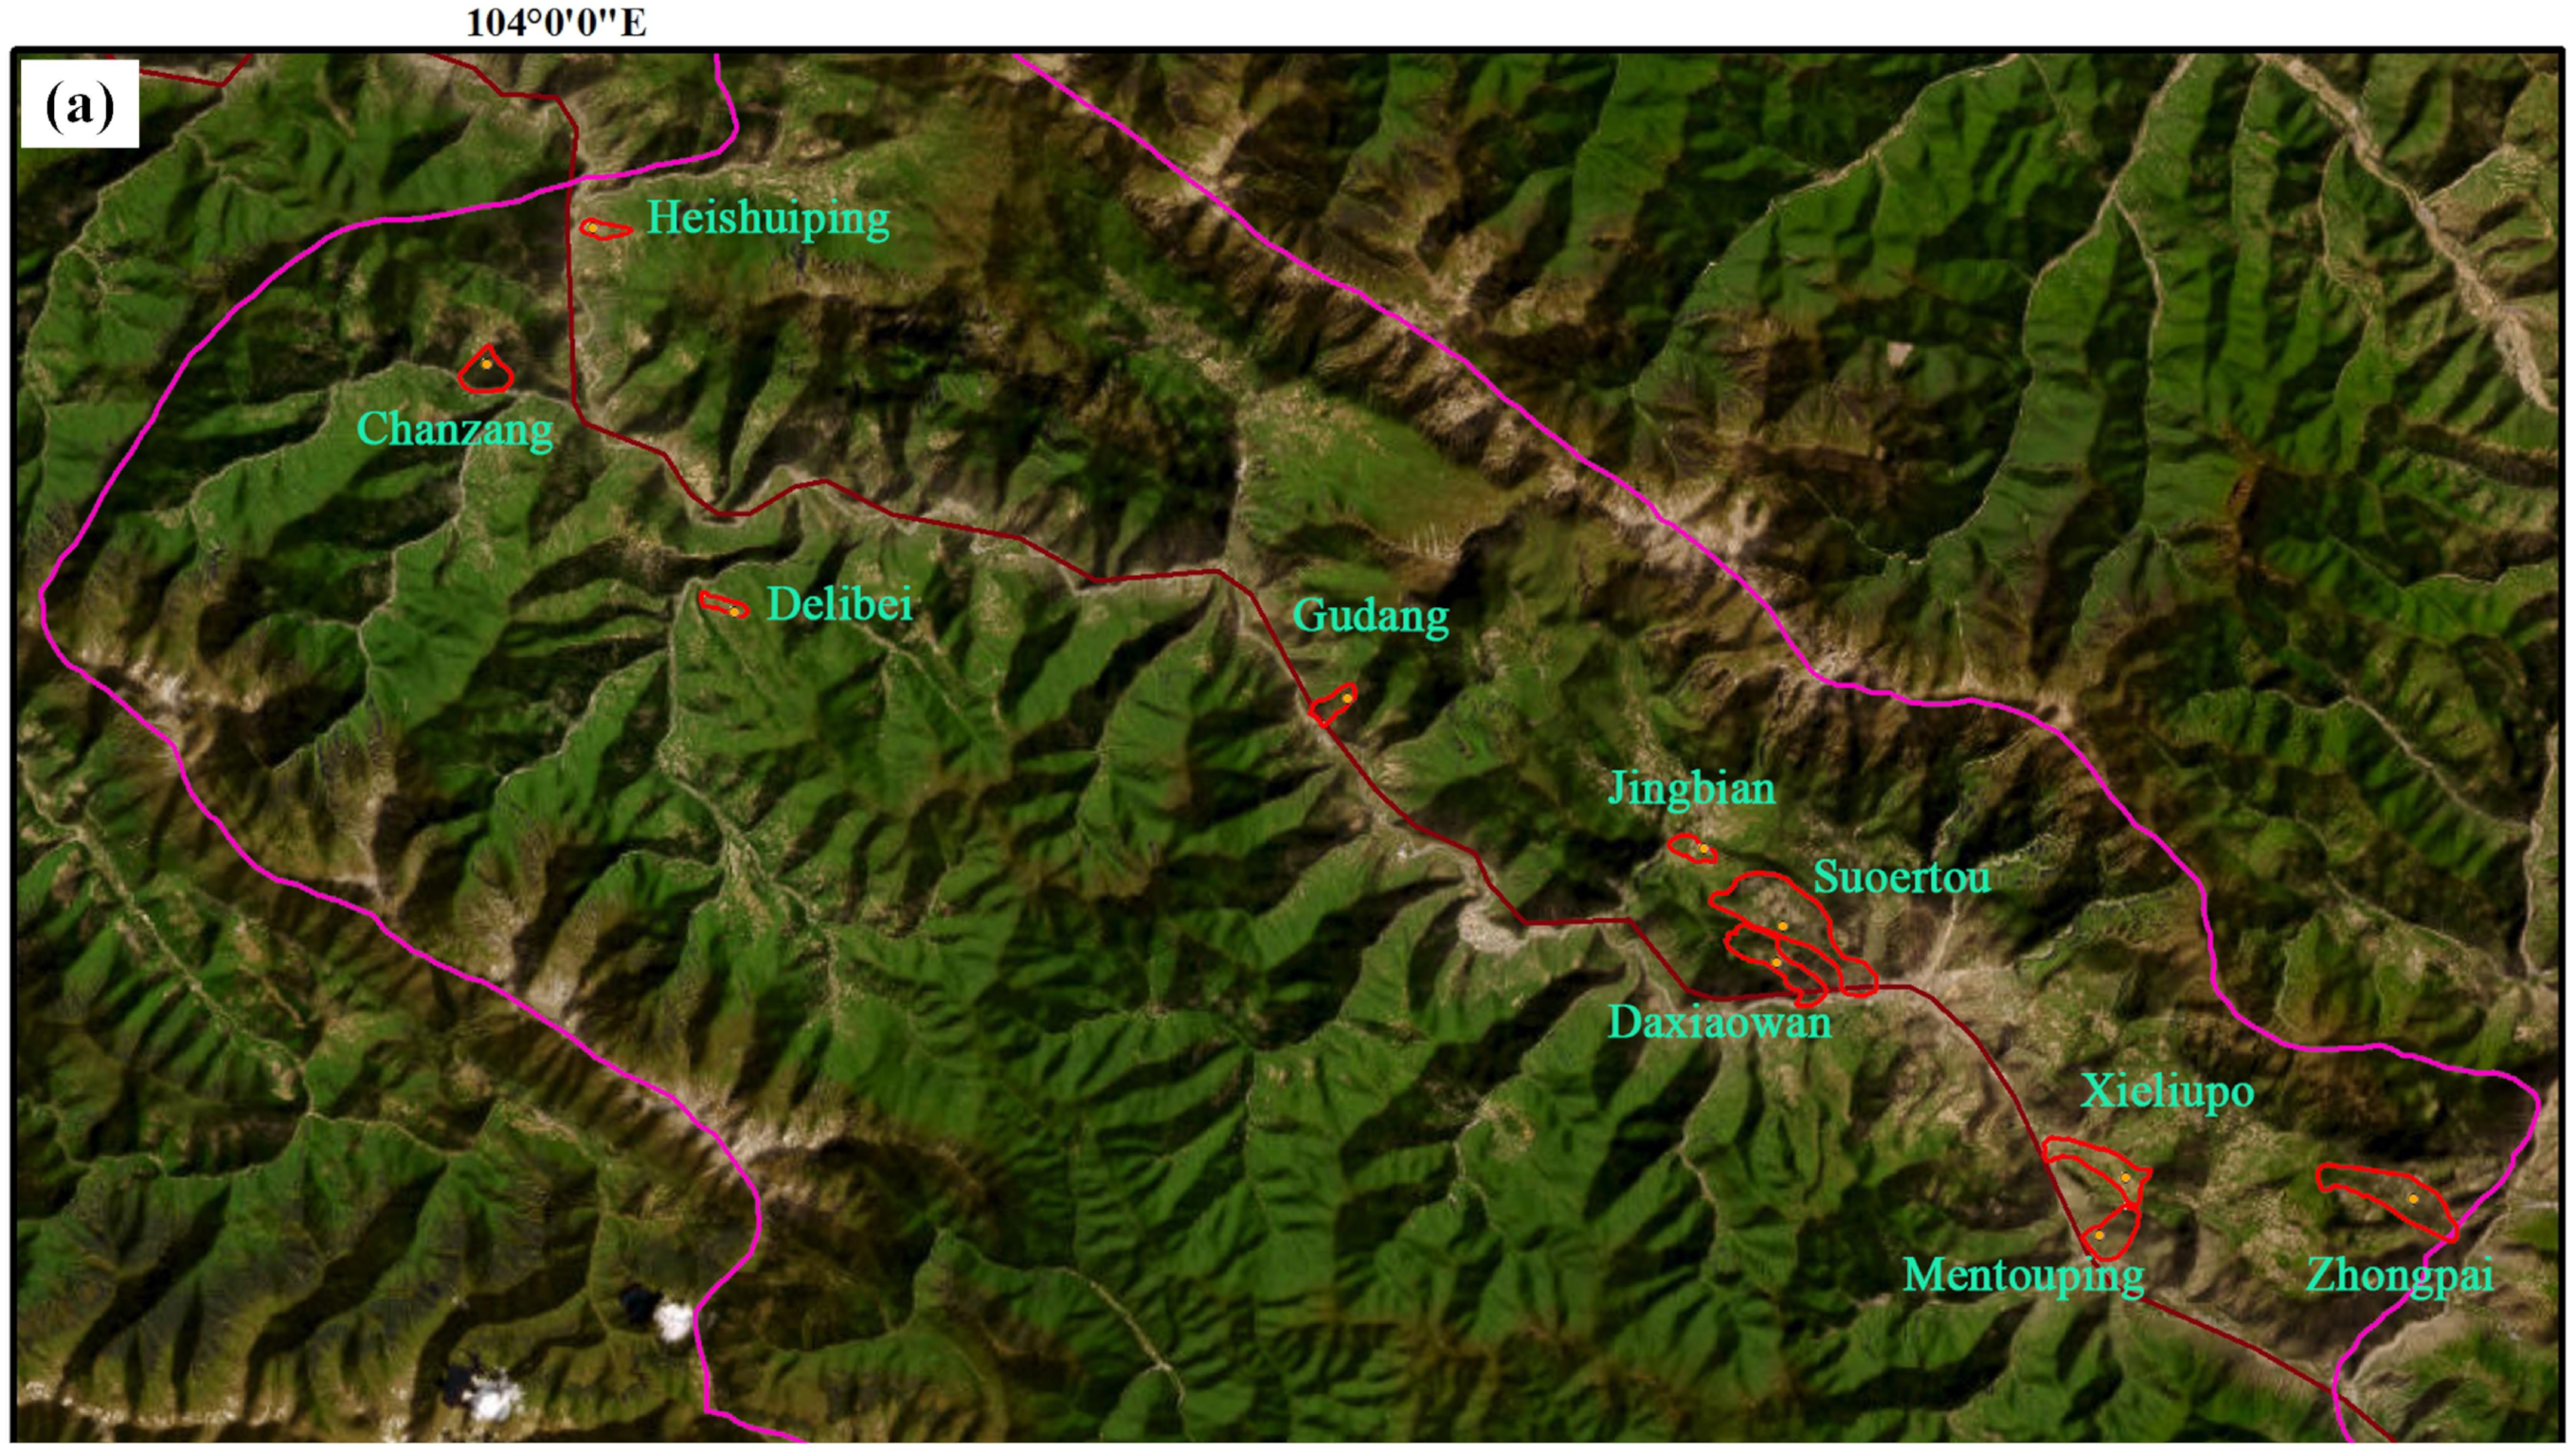
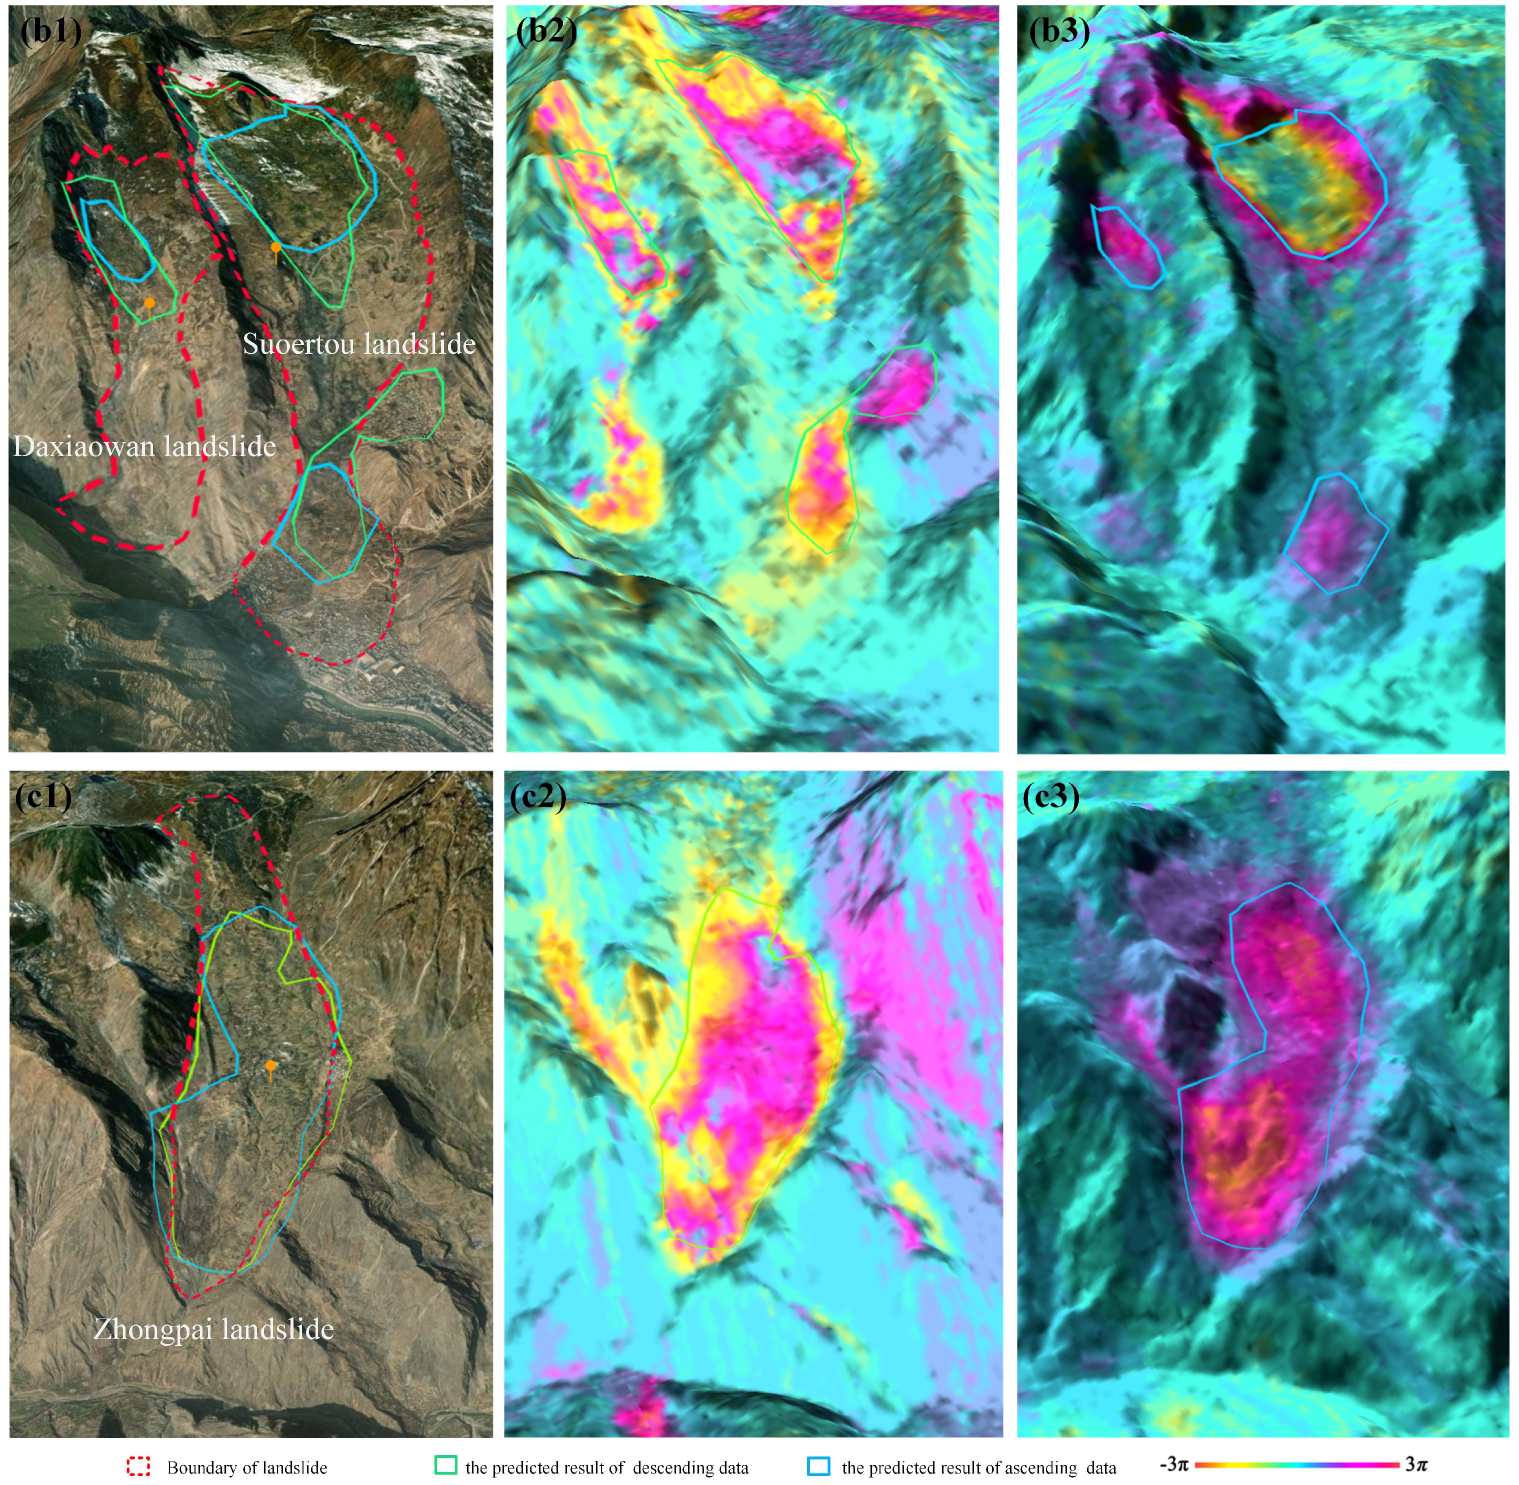
3.3. Identifying the Active Deformation Area of the Unknown Region
4. Discussion
4.1. Omission of Active Deformation Areas from InSAR Technology
4.2. Keys Affecting Identification Precision
4.3. Comparison Methods of Identifying Related Landslides
4.4. Limitations and Future Prospects
5. Conclusions
Author Contributions
Funding
Data Availability Statement
Acknowledgments
Conflicts of Interest
References
- Guzzetti, F.; Mondini, A.C.; Cardinali, M.; Fiorucci, F.; Santangelo, F.; Chang, K.T. Landslide inventory maps: New tools for an old problem. Earth Sci. Rev. 2012, 112, 42–66. [Google Scholar] [CrossRef]
- Heim, A. Landslides and Human Lives (Bergsturz and Menschenleben); Skermer, N., Ed.; Bi-Tech Publishers: Vancouver, BC, Canada, 1932; p. 196. [Google Scholar]
- Hungr, O.; Leroueil, S.; Picarelli, L. The Varnes classification of landslide types, an update. Landslides 2014, 11, 167–194. [Google Scholar] [CrossRef]
- Cai, J.; Zhang, L.; Dong, J.; Dong, X.; Li, M.; Xu, Q.; Liao, M. Detection and characterization of slow-moving landslides in the 2017 jiuzhaigou earthquake area by combining satellite sar observations and airborne lidar dsm. Eng. Geol. 2022, 305, 106730. [Google Scholar] [CrossRef]
- Lacroix, P.; Handwerger, A.L.; Bièvre, G. Life and Death of Slow-Moving Landslides. Nat. Rev. Earth Environ. 2020, 1, 404–419. [Google Scholar] [CrossRef]
- Tomas, R.; José, I.P.; José, A.N.; Cano, M.; Pastor, J.L.; Riquelme, A.; Cuevas-González, M.; Crosetto, M.; Barra, A.; Monserrat, O.; et al. Semi-Automatic Identification and Pre-Screening of Geological-Geotechnical Deformational Processes Using Persistent Scatterer Interferometry Datasets. Remote Sens. 2019, 11, 1675. [Google Scholar] [CrossRef]
- Mondini, A.C.; Guzzetti, F.; Chang, K.T.; Monserrat, M.; Martha, T.R.; Manconi, A. Landslide failures detection and mapping using Synthetic Aperture Radar: Past, present and future. Earth-Sci. Rev. 2021, 216, 103574. [Google Scholar] [CrossRef]
- Xu, Q.; Zhao, B.; Dai, K.; Dong, X.; Li, W.; Zhu, X.; Yang, Y.; Xiao, X.; Wang, X.; Huang, J.; et al. Remote sensing for landslide investigations: A progress report from China. Eng. Geol. 2023, 323, 107156. [Google Scholar] [CrossRef]
- Rose, N.D.; Hungr, O. Forecasting potential rock slope failure in open pit mines using the inverse velocity method. Int. J. Rock Mech. Min. Sci. 2007, 44, 308–320. [Google Scholar] [CrossRef]
- Guo, Z.; Chen, L.; Gui, L.; Du, J.; Yin, K.; Do, H.M. Landslide displacement prediction based on variational mode decomposition and WA-GWO-BP model. Landslides 2019, 17, 567–583. [Google Scholar] [CrossRef]
- Merlin, A.B.; Solarte, A.; Bellis, L.M.; Carignano, C.; Argaaraz, J.P. DInSAR and statistical modeling to assess landslides: The case study of Sierras Chicas (central Argentina). J. S. Am. Earth Sci 2021, 108, 103179. [Google Scholar] [CrossRef]
- Colesanti, C.; Ferretti, A.; Prati, C.; Rocca, F. Monitoring landslides and tectonic motions with the Permanent Scatterers Technique. Eng. Geol 2003, 68, 3–14. [Google Scholar] [CrossRef]
- Martire, D.D.; Tessitore, S.; Brancato, D.; Ciminelli, M.G.; Costabile, S.; Costantini, M.; Graziano, G.V.; Minati, F.; Ramondini, M.; Calcaterra, D. Landslide detection integrated system (LaDIS) based on in-situ and satellite SAR interferometry measurements. Catena 2015, 137, 406–421. [Google Scholar] [CrossRef]
- Bekaert, D.P.S.; Handwerger, A.L.; Agram, P.; Kirschbaum, D.B. InSAR-based detection method for mapping and monitoring slow-moving landslides in remote regions with steep and mountainous terrain: An application to Nepal. Remote Sens. Environ. 2020, 249, 111983. [Google Scholar] [CrossRef]
- Li, L.; Wen, B.; Yao, X.; Zhou, Z.; Zhu, Y. InSAR-based method for monitoring the long-time evolutions and spatial-temporal distributions of unstable slopes with the impact of water-level fluctuation: A case study in the Xiluodu reservoir. Remote Sens. Environ. 2023, 295, 113686. [Google Scholar] [CrossRef]
- Lanari, R.; Mora, O.; Manunta, M.; Mallorquí, J.J.; Berardino, P.; Sansosti, E. A small-baseline approach for investigating deformation on full-resolution differential SAR interferograms. IEEE Trans. Geosci. Remote Sens. 2004, 42, 1377–1386. [Google Scholar] [CrossRef]
- Bianchini, S.; Cigna, F.; Righini, G.; Proietti, C.; Casagli, N. Landslide hotspot mapping by means of persistent scatterer interferometry. Environ. Earth Sci. 2012, 67, 1155–1172. [Google Scholar] [CrossRef]
- Calò, F.; Ardizzone, F.; Raffaele, C.; Piernicola, L.; Pietro, T.; Fausto, G.; Riccardo, L.; Maceo, G.A.; Fabrizio, P.; Michele, M. Enhanced landslide investigations through advanced DInSAR techniques: The Ivancich case study, Assisi, Italy. Remote Sens. Environ. 2014, 142, 69–82. [Google Scholar] [CrossRef]
- Shi, X.; Yang, C.; Zhang, L.; Jiang, H.; Liao, M.; Zhang, L.; Liu, X. Mapping and characterizing displacements of active loess slopes along the upstream yellow river with multi-temporal InSAR datasets. Sci. Total Environ. 2019, 674, 200–210. [Google Scholar] [CrossRef] [PubMed]
- Singh, S.; Raju, A.; Banerjee, S. Detecting slow-moving landslides in parts of Darjeeling-Sikkim Himalaya, NE India: Quantitative constraints from PS InSAR and its relation to the structural discontinuities. Landslides 2022, 19, 2347–2365. [Google Scholar] [CrossRef]
- Roy, P.; Martha, T.R.; Khanna, K.; Jain, N.; Kumar, K.V. Time and path prediction of landslides using insar and flow model. Remote Sens. Environ. 2022, 271, 112899. [Google Scholar] [CrossRef]
- Barra, A.; Solari, L.; Béjar-pizarro, M.; Monserrat, O.; Bianchini, S.; Herrera, G.; Crosetto, M.; Sarro, R.; Gonzalez-alonso, E.; Mateos, R.M.; et al. A methodology to detect and update active deformation areas based on sentinel-1 sar images. Remote Sens. 2017, 9, 1002. [Google Scholar] [CrossRef]
- Navarro, J.A.; María, C.; Roberto, T.; Anna, B.; Michele, C. Automating the Detection and Classification of Active Deformation Areas-A Sentinel-Based Toolset. Proceedings 2019, 19, 15. [Google Scholar]
- Navarro, J.; Tomás, R.; Barra, A.; Pagán, J.; Reyes-Carmona, C.; Solari, L.; Lopez Vinielles, J.; Falco, S.; Crosetto, M. ADA tools: Automatic Detection and Classification of Active Deformation Areas from PSI Displacement Maps. Int. J. Geo-Inf. 2020, 9, 584. [Google Scholar] [CrossRef]
- Schwegmann, C.P.; Kleynhans, W.; Engelbrecht, J.; Mdakane, L.W.; Meyer, R.G. Subsidence feature discrimination using deep convolutional neural networks in synthetic aperture radar imagery. In Proceedings of the 2017 IEEE International Geoscience and Remote Sensing Symposium (IGARSS), Fort Worth, TX, USA, 23–28 July 2017; pp. 4626–4629. [Google Scholar]
- Anantrasirichai, P.; Biggs, J.; Albino, F.; Hill, P.; Bull, D. Application of machine learning to classification of volcanic deformation in routinely generated InSAR data. J. Geophys. Res. Solid Earth 2018, 123, 6592–6606. [Google Scholar] [CrossRef]
- Rotter, P.; Muron, W. Automatic detection of subsidence troughs in SAR interferograms based on convolutional neural networks. IEEE Trans. Geosci. Remote Sens. 2021, 18, 82–86. [Google Scholar] [CrossRef]
- Wu, Z.; Wang, T.; Wang, Y.; Wang, R.; Ge, D. Deep Learning for the Detection and Phase Unwrapping of Mining-Induced Deformation in Large-Scale Interferograms. IEEE Trans. Geosci. Remote Sens. 2022, 60, 21532879. [Google Scholar] [CrossRef]
- Wang, J.; Chen, G.; Jaboyedoff, M.; Derron, M.H.; Li, F.; Li, H.; Luo, X. Loess landslides detection via a partially supervised learning and improved Mask-RCNN with multi-source remote sensing data. CATENA 2023, 231, 107371. [Google Scholar] [CrossRef]
- Jiang, S.; Wen, B.; Zhao, C.; Li, R.; Li, Z. Kinematics of a giant slow-moving landslide in northwest china: Constraints from high resolution remote sensing imagery and GPSmonitoring. J. Asian Earth Sci. 2016, 123, 34–46. [Google Scholar] [CrossRef]
- Xiang, L.; Handwerger, A.L.; Giuseppe, B. Viscoplastic modelling of rainfall-driven slow-moving landslides: Application to california coast ranges. Landslides 2023, 123, 34–46. [Google Scholar]
- Cook, M.E.; Brook, M.S.; Hamling, I.J.; Murry, C.; Tunnicliffe, J.F.; Rachel, H. Investigating slow-moving shallow soil landslides using sentinel-1 insar data in gisborne, new zealand. Landslides 2023, 20, 1101–1113. [Google Scholar] [CrossRef]
- Du, J.; Li, Z.; Song, C.; Zhu, W.; Ji, Y.; Zhang, C.; Chen, B.; Su, S. InSAR-based active landslide detection and characterization along the upper reaches of the Yellow River. IEEE J. Sel. Top. Appl. Earth Obs. Remote Sens. 2023, 16, 3819–3830. [Google Scholar] [CrossRef]
- Zhang, L.L.; Dai, K.R.; Deng, J.; Ge, D.Q.; Liang, R.B.; Li, W.L.; Xu, Q. Identifying Potential Landslides by Stacking-InSAR in Southwestern China and Its Performance Comparison with SBAS-InSAR. Remote Sens. 2021, 13, 3662. [Google Scholar] [CrossRef]
- Yu, H.; Ma, Y.; Wang, L.; Wang, X. A landslide intelligent detection method based on CNN and RSG_R. In Proceedings of the 2017 IEEE International Conference on Mechatronics and Automation (ICMA), Takamatsu, Japan, 6–9 August 2017. [Google Scholar]
- Ghorbanzadeh, O.; Blaschke, T.; Gholamnia, K.; Meena, S.R.; Tiede, D.; Aryal, J. Evaluation of Different Machine Learning Methods and Deep-Learning Convolutional Neural Networks for Landslide Detection. Remote Sens. 2019, 11, 196. [Google Scholar] [CrossRef]
- Ji, S.; Yu, D.; Shen, C.; Li, W.; Xu, Q. Landslide detection from an open satellite imagery and digital elevation model dataset using attention boosted convolutional neural networks. Landslides 2020, 17, 1337–1352. [Google Scholar] [CrossRef]
- Qin, S.; Guo, X.; Sun, J.; Qiao, S.; Zhang, L.; Yao, J.; Cheng, Q.; Zhang, Y. Landslide Detection from Open Satellite Imagery Using Distant Domain Transfer Learning. Remote Sens. 2021, 13, 3383. [Google Scholar] [CrossRef]
- Nikhil, P.; Andrea, M.; Simon, L. A new strategy to map landslides with a generalized convolutional neural network. Sci. Resports 2021, 11, 9722. [Google Scholar]
- Yu, B.; Xu, C.; Chen, F.; Wang, N.; Wang, L. HADeenNet: A hierarchical-attention multi-scale deconvolution network for landslide detection. Int. J. Appl. Earth Obs. Geoinf. 2022, 111, 102853. [Google Scholar] [CrossRef]
- Han, W.; Zhang, X.; Wang, Y.; Wang, L.; Huang, X.; Li, J.; Wang, S.; Chen, W.; Li, X.; Feng, R.; et al. A survey of machine learning and deep learning in remote sensing of geological environment: Challenges, advances, and opportunities. ISPRS J. Photogramm. Remote Sens. 2023, 202, 87–113. [Google Scholar] [CrossRef]
- Zhang, P.; Xu, C.; Ma, S.; Shao, X.; Wen, B. Automatic extraction of seismic landslides in large areas with complex environments based on deep learning: An example of the 2018 iburi earthquake, Japan. Remote Sens. 2020, 12, 3992. [Google Scholar] [CrossRef]
- Wu, Z.; Li, H.; Yuan, S.; Gong, Q.; Wang, J.; Zhang, B. Mask R-CNN–Based Landslide Hazard Identification for 22.6 Extreme Rainfall Induced Landslides in the BeijiangRiver Basin, China. Remote Sens. 2023, 15, 4898. [Google Scholar] [CrossRef]
- Fu, L.; Wang, T.; Zhang, Q.; Wang, T.; Li, W.; Xu, Q.; Ge, D. Detecting slow-moving landslides using InSAR phase-gradient stacking and deep-learning network. Front. Environ. Sci. 2022, 10, 963322. [Google Scholar] [CrossRef]
- De Zan, F.; Guarnieri, A.M. TOPSAR: Terrain Observation by Progressive Scans. IEEE Trans. Geosci. Remote Sens. 2006, 44, 2352–2360. [Google Scholar] [CrossRef]
- GAMMA_SOFTWARE-20201211. Available online: https://www.gamma-rs.ch/software (accessed on 1 March 2024).
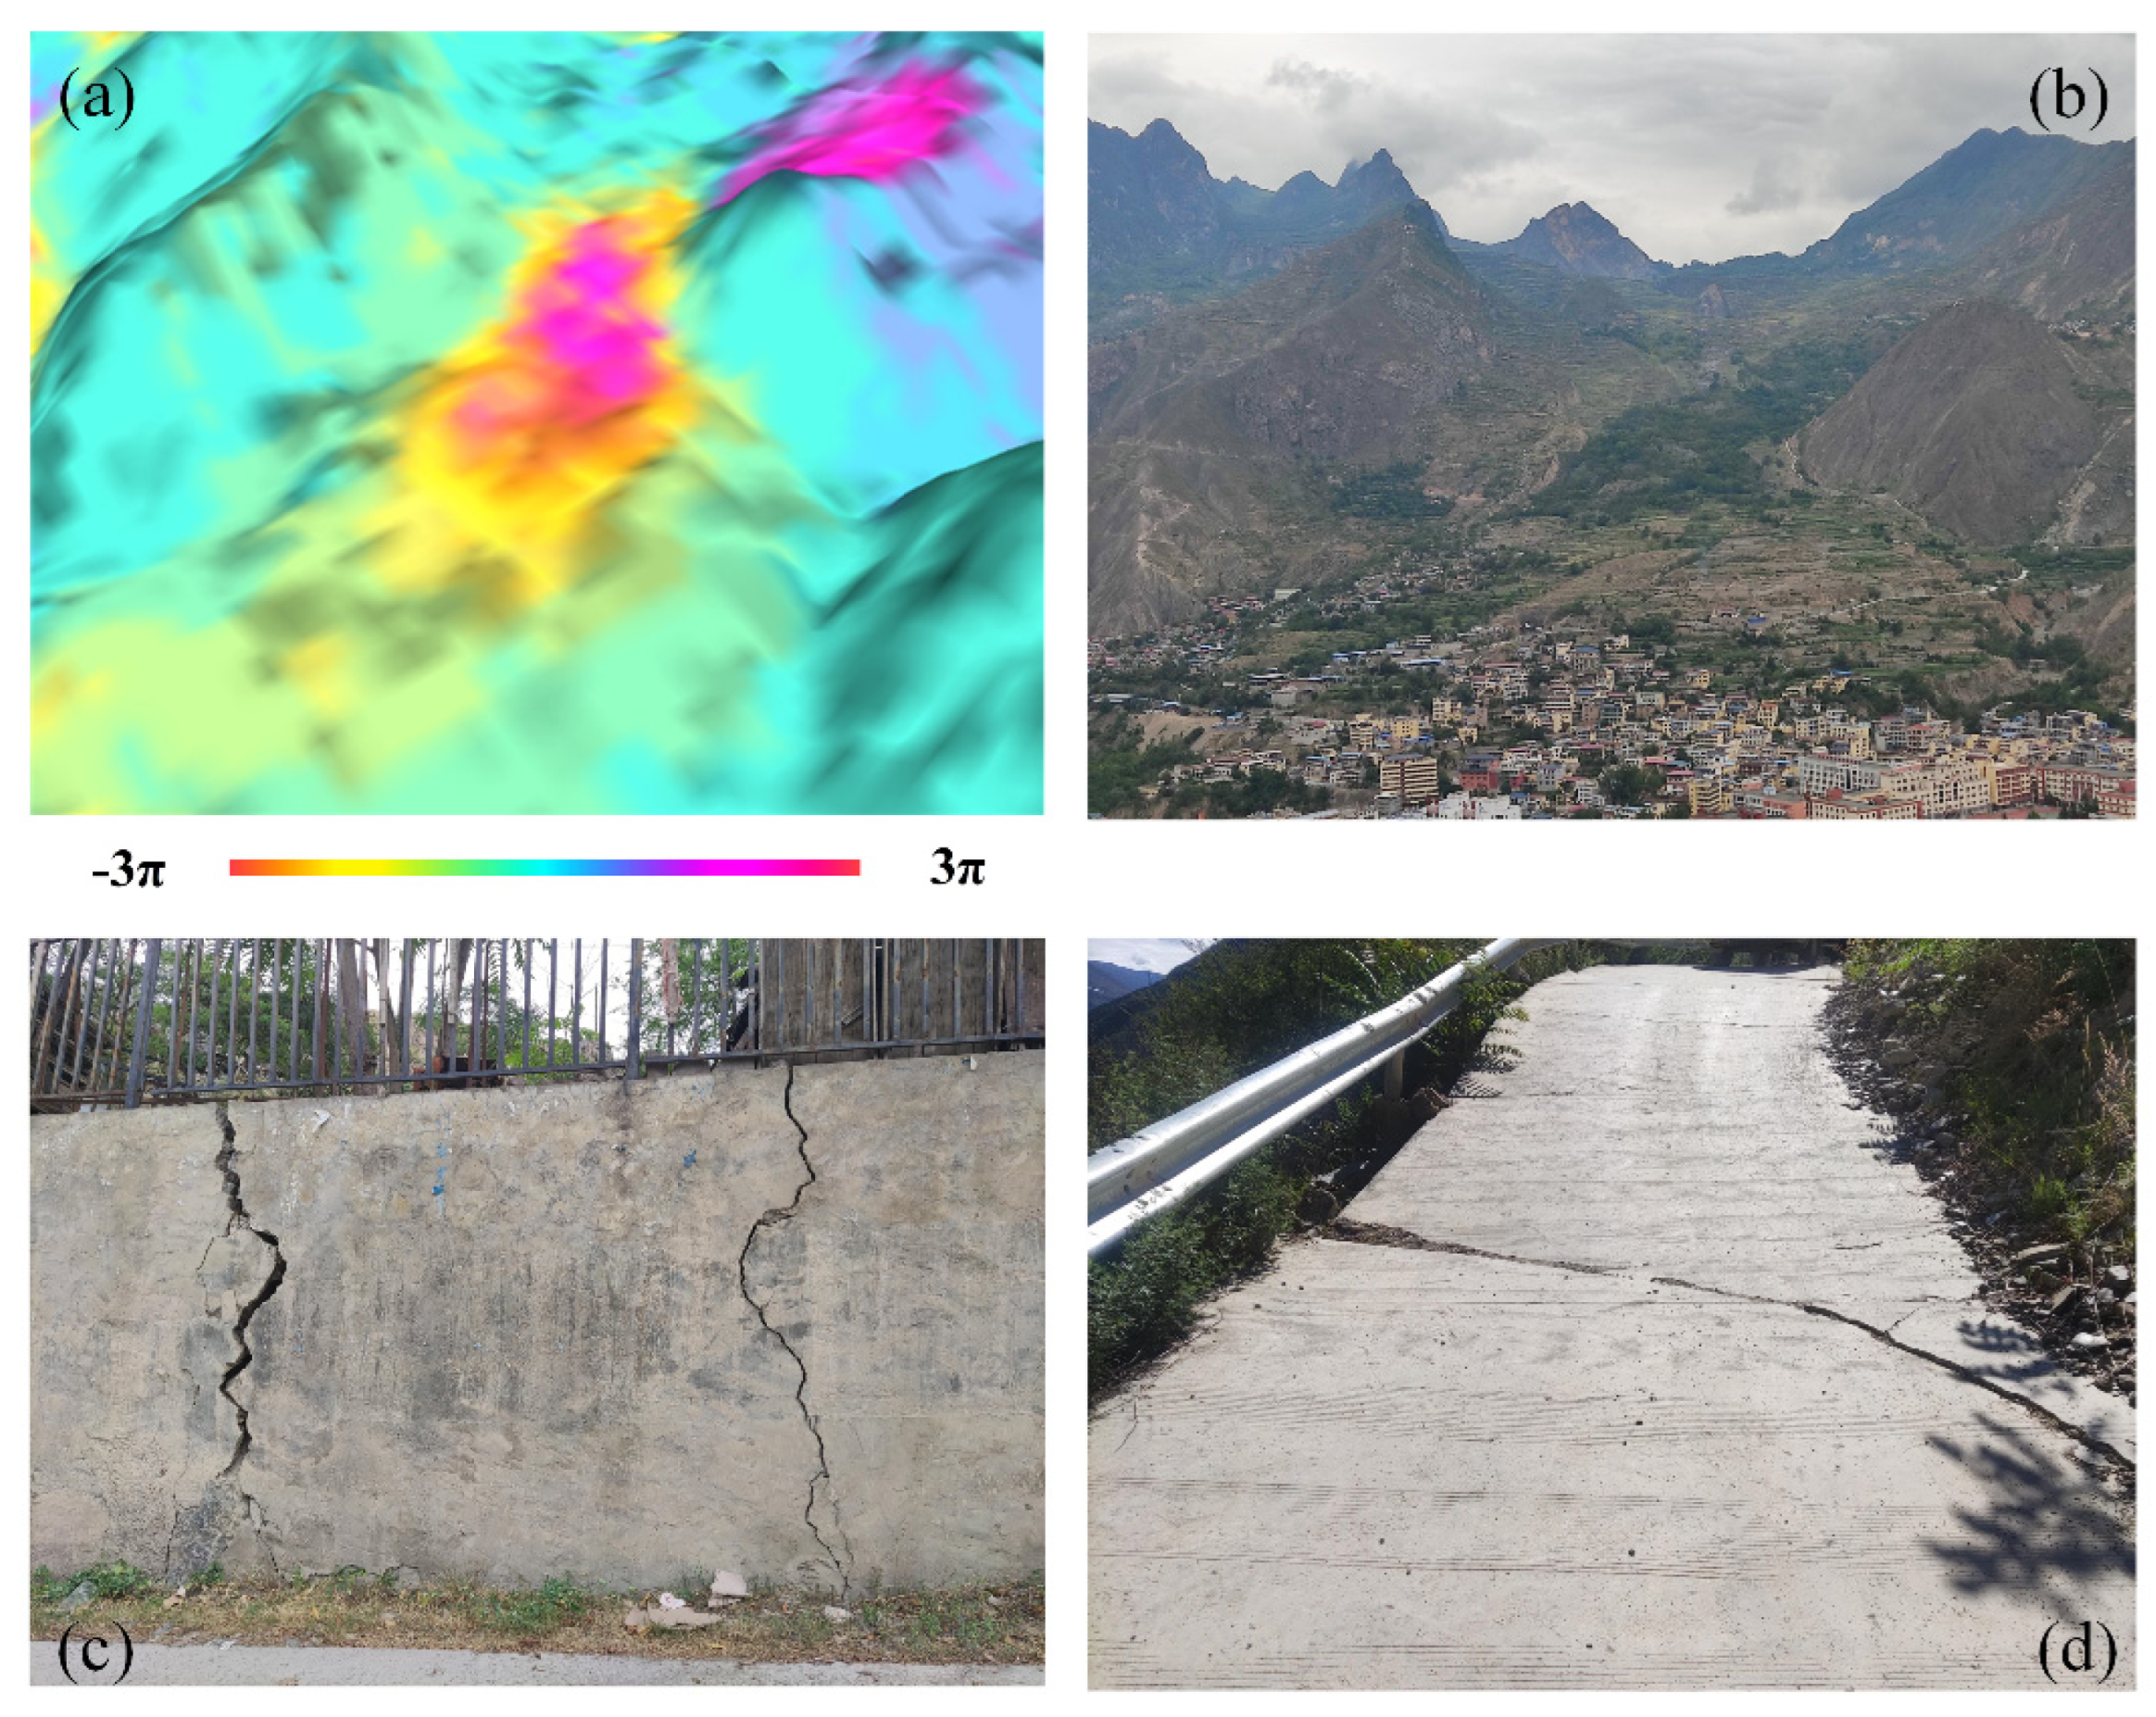
- Li, M.; Zhang, L.; Yang, M.; Liao, M. Complex Surface Displacements of the Nanyu Landslide in Zhouqu, China Revealed by Multi-platform InSAR Observations. Eng. Geol. 2022, 317, 107069–107085. [Google Scholar] [CrossRef]
- Jin, J.; Chen, G.; Meng, X.; Zhang, Y.; Shi, W.; Li, Y.; Yang, Y.; Jiang, W. Prediction of river damming susceptibility by landslides based on a logisticregression model and InSAR techniques: A case study of the Bailong River Basin, China. Eng. Geol. 2022, 299, 106562. [Google Scholar] [CrossRef]
- Qi, T.; Meng, X.; Qing, F.; Zhao, Y.; Shi, W.; Chen, G.; Zhang, Y.; Li, Y.; Yue, D.; Su, X.; et al. Distribution and characteristics of large landslides in a fault zone: A case study of the NE Qinghai-Tibet Plateau. Geomorphology 2021, 379, 107592. [Google Scholar] [CrossRef]
- Wang, Y.; Cui, X.; Che, Y.; Li, P.; Jiang, Y.; Peng, X. Automatic Identification of Slope Active Deformation Areas in the Zhouqu Region of China with DS-InSAR Results. Front. Environ. Sci. 2022, 10, 883427. [Google Scholar] [CrossRef]
- Zhang, Y.; Meng, X.; Jordan, C.; Novellino, A.; Dijkstra, T.; Chen, G. Investigating slow-moving landslides in the Zhouqu region of China using InSAR time series. Landslides 2018, 15, 1299–1315. [Google Scholar] [CrossRef]
- Liu, X.; Zhao, C.; Zhang, Q.; Zhong, L.; Li, Z.; Yang, C.; Zhu, W.; Liu, Z.; Chen, L.; Liu, C. Integration of Sentinel-1 and ALOS/PALSAR-2 SAR datasets for mapping active landslides along the Jinsha River corridor, China. Eng. Geol. 2021, 284, 106033. [Google Scholar] [CrossRef]
- Yang, R.L.; Zhang, F.; Xia, J.; Wu, C. Landslide Extraction Using Mask R-CNN with Background-Enhancement Method. Remote Sens. 2022, 14, 2206. [Google Scholar] [CrossRef]


| Path Number | Imaging Period | Scene Numbers |
|---|---|---|
| 128 | From 20 March 2017 to 24 January 2023 | 230 |
| 62 | From 19 February 2017 to 19 January 2023 | 346 |
| 33 | From 25 March 2017 to 24 December 2022 | 495 |
| 135 | From 20 March 2017 to 24 January 2023 | 308 |
| Data | Spatial Resolution | Data Resource |
|---|---|---|
| The phase rate data | 30 m | Average phase rate data over the period of 2017–2022 |
| The LOS rate of surface deformation | 30 m | Average LOS rate over the period of 2017–2022 |
| DEM | 30 m | ALOS WORLD 3D from the Japan Aerospace Exploration Agency |
| Slope | 30 m | Calculated from DEM |
| Stage | Input Size | Operator | Out-Chs |
|---|---|---|---|
| 1 | 256 256 | Conv2d 7 BatchNorm 2d Relu | 64 |
| 2 | 128 128 | Maxpool 3 Bottleneck 3 | 256 |
| 3 | 64 64 | Bottleneck 4 | 512 |
| 4 | 32 32 | Bottleneck 6 | 1024 |
| 5 | 16 16 | Bottleneck 3 | 2048 |
| Stage | Input Size | Operator | Out-Chs |
|---|---|---|---|
| 1 | 16 16 | UpsamplingBilinear Concatenate | 512 |
| 2 | 16 16 32 32 | UpsamplingBilinear Concatenate | 256 |
| 3 | 32 32 64 64 | UpsamplingBilinear Concatenate | 128 |
| 4 | 64 64 64 64 | UpsamplingBilinear Concatenate | 64 |
| 5 | 64 64 | UpsamplingBilinear | 256 |
| Data Type | IOU1 | Precision (%) | Recall (%) | F1 (%) |
|---|---|---|---|---|
| The LOS rate of surface deformation | 54.61 | 82.57 | 61.73 | 70.65 |
| The phase rate data | 90.25 | 95.55 | 94.21 | 94.88 |
| The phase rate data and the LOS rate of surface deformation | 93.88 | 97.43 | 96.27 | 96.85 |
| The phase rate data and DEM | 93.63 | 97.39 | 96.04 | 96.71 |
| The phase rate data and slope | 94.03 | 97.26 | 96.58 | 96.92 |
| The phase rate data, DEM, and slope | 94.23 | 97.34 | 96.72 | 97.03 |
| The phase rate data, the LOS rate of surface deformation, DEM, and slope | 94.49 | 97.41 | 96.93 | 97.41 |
| Data Type | IOU1 | Precision (%) | Recall (%) | F1 (%) |
|---|---|---|---|---|
| The LOS rate of surface deformation | 51.04 | 80.82 | 58.08 | 67.59 |
| The phase rate data | 71.82 | 84.84 | 82.4 | 83.6 |
| The phase rate data and the LOS rate of surface deformation | 75.17 | 88.54 | 83.28 | 85.83 |
| The phase rate data and DEM | 75.20 | 87.36 | 84.38 | 85.84 |
| The phase rate data and slope | 75.84 | 88.96 | 83.72 | 86.26 |
| The phase rate data, DEM, and slope | 76.75 | 88.2 | 85.53 | 86.84 |
| The phase rate data, the LOS rate of surface deformation, DEM, and slope | 84.59 | 93.09 | 90.26 | 91.65 |
Disclaimer/Publisher’s Note: The statements, opinions and data contained in all publications are solely those of the individual author(s) and contributor(s) and not of MDPI and/or the editor(s). MDPI and/or the editor(s) disclaim responsibility for any injury to people or property resulting from any ideas, methods, instructions or products referred to in the content. |
© 2024 by the authors. Licensee MDPI, Basel, Switzerland. This article is an open access article distributed under the terms and conditions of the Creative Commons Attribution (CC BY) license (https://creativecommons.org/licenses/by/4.0/).
Share and Cite
Wu, Q.; Ge, D.; Yu, J.; Zhang, L.; Ma, Y.; Chen, Y.; Wan, X.; Wang, Y.; Zhang, L. Active Deformation Areas of Potential Landslide Mapping with a Generalized Convolutional Neural Network. Remote Sens. 2024, 16, 1090. https://doi.org/10.3390/rs16061090
Wu Q, Ge D, Yu J, Zhang L, Ma Y, Chen Y, Wan X, Wang Y, Zhang L. Active Deformation Areas of Potential Landslide Mapping with a Generalized Convolutional Neural Network. Remote Sensing. 2024; 16(6):1090. https://doi.org/10.3390/rs16061090
Chicago/Turabian StyleWu, Qiong, Daqing Ge, Junchuan Yu, Ling Zhang, Yanni Ma, Yangyang Chen, Xiangxing Wan, Yu Wang, and Li Zhang. 2024. "Active Deformation Areas of Potential Landslide Mapping with a Generalized Convolutional Neural Network" Remote Sensing 16, no. 6: 1090. https://doi.org/10.3390/rs16061090