Technical Note

Fine-Scale (10 m) Dynamics of Smallholder Farming through COVID-19 in Eastern Thailand

1
Laboratory for Remote Sensing and Environmental Change (LRSEC), Department of Geography and Earth Sciences, University of North Carolina at Charlotte, Charlotte, NC 28223, USA
2
Department of Geography and Earth Sciences, University of North Carolina at Charlotte, Charlotte, NC 28223, USA
3
Charlotte Action Research Project, University of North Carolina at Charlotte, Charlotte, NC 28223, USA
4
Regional, Urban, & Built Environmental Analytics, Faculty of Architecture, Chulalongkorn University, Bangkok 10330, Thailand
5
Faculty of Architecture and Planning, Thammasat University, Pathumthani 12121, Thailand
6
David R. Ravin School of Architecture, University of North Carolina at Charlotte, Charlotte, NC 28223, USA
7
Department of Sociology, University of North Carolina at Charlotte, Charlotte, NC 28223, USA
8
Environment, Ecology and Energy Program, University of North Carolina at Chapel Hill, Chapel Hill, NC 27516, USA
*
Author to whom correspondence should be addressed.
Remote Sens. 2024, 16(6), 1035; https://doi.org/10.3390/rs16061035
Submission received: 8 January 2024 / Revised: 4 March 2024 / Accepted: 12 March 2024 / Published: 14 March 2024

Abstract

:
This study aims to understand the spatiotemporal changes in patterns of tropical crop cultivation in Eastern Thailand, encompassing the periods before, during, and after the COVID-19 pandemic. Our approach involved assessing the efficacy of high-resolution (10 m) Sentinel-2 dense image time series for mapping smallholder farmlands. We integrated harmonic regression and random forest to map a diverse array of tropical crop types between summer 2017 and summer 2023, including durian, rice, rubber, eucalyptus, oil palm, pineapple, sugarcane, cassava, mangosteen, coconut, and other crops. The results revealed an overall mapping accuracy of 85.6%, with several crop types exceeding 90%. High-resolution imagery demonstrated particular effectiveness in situations involving intercropping, a popular practice of simultaneously growing two or more plant species in the same patch of land. However, we observed overestimation in the majority of the studied cash crops, primarily those located in young plantations with open tree canopies and grass-covered ground surfaces. The adverse effects of the COVID-19 pandemic were observed in specific labor-intensive crops, including rubber and durian, but were limited to the short term. No discernible impact was noted across the entirety of the study timeframe. In comparison, financial gain and climate change appeared to be more pivotal in influencing farmers’ decisions regarding crop cultivation. Traditionally dominant crops such as rice and oil palm have witnessed a discernible decline in cultivation, reflecting a decade-long trend of price drops preceding the pandemic. Conversely, Thai durian has seen a significant upswing even over the pandemic, which ironically served as a catalyst prompting Thai farmers to adopt e-commerce to meet the surging demand, particularly from China.

Graphical Abstract

1. Introduction

More than three years into the COVID-19 pandemic, the UN World Health Organization (WHO) officially declared an end to this global health emergency on 5 May 2023 [1]. Over the past years, the immediate impact of the pandemic on the agricultural system has been confirmed in a number of studies, including the loss of the workforce due to infection or quarantine [2], shortages of cultivation supplies [3], restricted transportation and trade [4,5], and disruptions to retail business [6]. However, the long-term impact of the crisis on agricultural systems remains to be well understood. In particular, crop cultivation is an integral part of the agricultural supply chain. While the pandemic apparently disrupted cultivation temporarily, it is unclear whether there may be a slow recovery or a permanent change in the cultivation landscape (e.g., crop acreage and types) during and after the pandemic. Understanding the landscape change of crop cultivation is especially critical for Thailand, whose agricultural sector contributed over 8% to the nation’s gross domestic product (GDP), employed about 30% of the total workforce, and played a key role in providing financial support to 6.4 million households [7]. Thailand’s agriculture not only affects its domestic economy but also has a major influence on the global market. As a world-leading food exporter, Thailand’s trade in agricultural products totaled 1.55 trillion baht (~43 billion USD) in 2022, with major markets including China, Japan, India, South Korea, Australia, New Zealand, Peru, and ASEAN (Association of Southeast Asian Nations) members [8].
Thailand is located in the Indo-Burmese Region, a global hotspot of biodiversity [9]. A variety of crops are extensively cultivated in the country, including rice, rubber, durian, eucalyptus, oil palm, pineapple, sugarcane, cassava, mangosteen, and coconut. Particularly, durian (Durio zibethinus), known as the ‘king of fruits,’ has become one of Thailand’s most important exports. Even during the pandemic, Thailand reported exporting $2.2 billion U.S. dollars’ worth of durian to China in 2020, a rise of 47% from the previous year [10]. However, the pandemic has had a lasting effect on the country’s agricultural sector, creating a shortage of agricultural laborers, particularly migrant workers and workers who are members of minority ethnic groups, which will take time to recover to pre-crisis levels [11]. In northern Thailand, COVID-19 dramatically increased the cost of planting by 57.4% and the cost of agrochemicals and fertilizers by 69.9% [12]. To cope with such challenges, farmers in Thailand have started to adopt new farming technologies or skills to improve crop yield and resort to new business strategies, such as transitioning from onsite markets to e-commerce [13]. Yet, there is a lack of understanding of the spatiotemporal change patterns of crop cultivation through the pandemic. Policymakers and stakeholders have primarily relied on field surveys to gain such information, which is time-consuming and lacks spatiotemporal details to inform effective decision-making. To date, the post-pandemic recovery of Thailand’s agriculture remains to be well investigated. For example, have major crops recovered from the adverse effects of the pandemic? Has there been a shift in cultivation from one crop type to another?
Remote sensing has gained popularity in crop mapping over the past few decades. Particularly after Landsat opened its data archive to all users at no charge on 21 April 2008 [14], there has been a substantial number of studies capitalizing on satellite image time series to monitor the spatial distribution of crop cultivation. Recent sensor systems offer an even higher spatial resolution than Landsat, such as Sentinel-2, with 10 m visible and near-infrared image bands. These free and dense image time series have demonstrated the potential to capture crop phenology, i.e., the physiological development stages of plant growth from planting to harvest, and hence map crop types [15,16]. This helps address the classic challenge of high spectral similarities among diverse crop types when using single-date imagery. Moderate success has been reported at both local and regional scales (e.g., [17,18]). However, medium- and low-resolution sensors (e.g., Landsat and MODIS, respectively) have been utilized in the majority of studies for crop type mapping. This has posed challenges in regions like Southeast Asia, especially Thailand, which has a long-term tradition of family farming, and the vast majority of farmland is run by smallholder farmers. Half of Thai farming households owned below 10 rai (1.6 ha) of farmland, with an average size of 14.3 rai (2.3 ha; [19]). At a medium- or coarse-resolution, an image pixel may contain one or more farming patches resulting in strong mixing spectral signatures. Such a mixing effect is not only caused by the size of the land. To maximize economic returns from smallholdings, Thai farmers often practice mixed cultivation or cropping (also known as intercropping), which involves growing two or more plant species simultaneously in the same patch of land. For example, pineapples have a shallow root system and start to produce fruits in two years in Eastern Thailand. Thus, in a young rubber plantation, a mixed cultivation of pineapples and rubber trees (Figure 1) allows farmers to generate income before rubber trees reach maturity and can be tapped in 6–7 years [18]. While dense image time series can carefully capture crop growing stages, there is a lack of investigation into the effect of mixed cultivation on crop mapping performance. We note that relatively high-resolution data have been recently used in tropical crop mapping; however, previous studies have been restricted to small geographic regions or to extracting single or a limited number of crop types (e.g., [20,21,22,23]).
Based on the above considerations, the main objective of this study was to map and analyze the spatiotemporal change patterns of tropical crop cultivation in Eastern Thailand through (i.e., before, during, and after) the COVID-19 pandemic. We focused on Eastern Thailand because it is particularly illustrative for its diversity of smallholder crop production (including high-value export crops such as rubber, rice, durian, and rambutans) and the rapidly evolving land use change due to the planned urbanization of land near beaches and industrial corridors. The region also includes the Eastern Economic Corridor (EEC), which has been promised strong government support to accelerate the country’s economic growth in the new era of Thailand 4.0 [24]. Specifically, we ask two questions in the study: (i) How accurate is it to use high-resolution (10 m), dense image time series to map diverse types of tropical crops on smallholder farmlands? (ii) How did the crop cultivation pattern change (i.e., shift in crop type and areal size) through the pandemic in Eastern Thailand, and why?

2. Materials and Methods
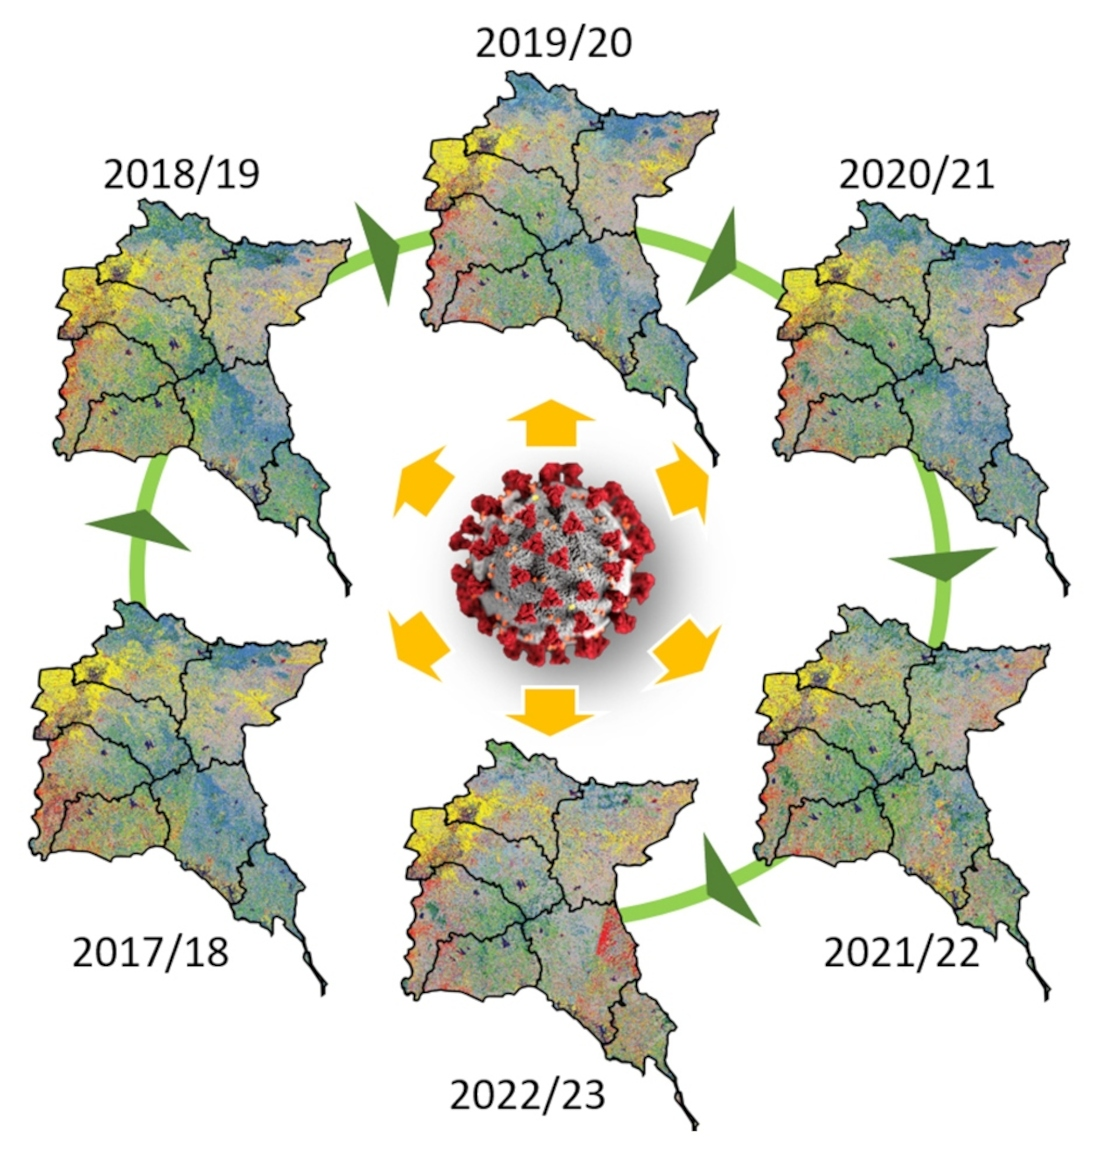
2.1. Study Area

The study area is located in Eastern Thailand, which consists of seven provinces: Chachoengsao, Chanthaburi, Chon Buri, Prachin Buri, Rayong, Sa Kaeo, and Trat. Bangkok is adjacent to the region and borders the province of Chachoengsao (Figure 2). The entire area of the region occupies approximately 34,000 km2, with a total population of over 4.8 million [25]. We did not include the islands (e.g., Koh Chang, Koh Kood, and Ko Mak) located in the south of Trat due to the small presence of farmlands and logistical challenges in field data collection. Though temperature and rainfall vary slightly by province, the general climate of Eastern Thailand is characterized by three distinct seasons: the hot season from March to May, the wet season from May to October, and the cool season from November to March. In recent years, however, the effects of climate change have made Thai seasons less predictable, causing concern for agricultural growing seasons [26].
The dominant crop types in the region are durian, rice, eucalyptus, oil palm, pineapple, sugarcane, cassava, rubber, mangosteen, and coconut, which were the main focus of this study. However, each of the seven provinces in Eastern Thailand have different concentrations of crop types. For example, rice is more common in the eastern part of Chachoengsao, following the growing patterns of Central Thailand. The availability of water, influenced by rivers and coastlines, plays a role in crop planting decisions within the region. Overall, Eastern Thailand has a robust agricultural economy, where agricultural land use for each of the seven provinces varies between 54.47% and 69.25% of the total land area [27].
Dominated by smallholder farming, the region has been influenced by both domestic and foreign investments aimed at expanding agricultural growth. The Thai government has long been involved in supporting or constraining agricultural production nation-wide, especially for rice. A significant shift away from subsistence production to growing goods for the market took place after World War II, driven by international (US) influence in trade, government patronage, and the flow of credit and inputs into smallholder agricultural communities [28]. Following protests in the 1990s, eventually consolidated under the umbrella of the Assembly of the Poor, the national government instituted several policies to reduce taxes on agriculture and provide subsidies for farmers. This included programs that supported the price of rice on the domestic market, sought to reduce the amount of land devoted to rice cultivation (to keep prices higher), and encouraged self-sufficiency economies. Successive governments have implemented (sometimes contradictory) programs to help small-scale farmers produce and market specific crops and gain better access to markets.
Additionally, to protect smallholder farms from excessive foreign investment and conversion into corporate farms, Thailand has implemented the Foreign Business Act and its Amendments, preventing foreigners from buying land for farming [29]. This measure ensures the continued production of crops and maintains the significance of smallholder farms in Thailand’s agricultural sector. However, the EEC region is a government-sponsored development zone along Thailand’s Eastern seaboard, specifically the provinces of Rayong, Chon Buri, and Chachoengsao. Twelve key industries are specifically targeted for foreign investment within the EEC, including ‘advanced agriculture and biotechnology’ and ‘food for the future’ [24]. The EEC investments have spurred urbanization and changes in land cover as well as sharp increases in water demands that now compete with nearby smallholder agriculture [30].

2.2. Data

2.2.1. Field Data

In summer of 2023, we conducted a field survey in all seven provinces of the study area to acquire crop types and their spatial location. We applied the stratified random sampling strategy, where field samples were randomly distributed across the agricultural lands. Due to logistical challenges, the samples were slightly adjusted to ensure that they were within walking distance to a local road for easy access. Each sample point was located within at least a 10 m × 10 m area of a single crop type or a significantly dominant crop type, which was consistent with the spatial resolution of the satellite imagery used in this study (see Section 3.2). A total of 886 sample points were collected, predominantly consisting of major crop types, namely paddy rice (84), durian (57), eucalyptus (69), oil palm (85), pineapple (58), sugarcane (47), cassava (53), rubber plantation (82), mangosteen (29), and coconut (22). Additionally, samples were gathered for urban (61), water (40), forest (33), grass/shrub (39), bare ground (51), and others (76). Please refer to Section 2.3.1 for details of the classification scheme. Overall, the number of samples for each crop type roughly corresponded to its spatial coverage in the study area. However, we intentionally included additional samples for certain crops due to their high variation in species type or plantation style. For instance, Thailand boasts various durian types, such as Mon Thong, Cha Nee, and Kan Yao. Although durian’s spatial coverage is much lower than several other major crops, we added extra samples to capture its variation. See sample location in Figure 2 and field photos in Figure 3 and Figure 4. The samples also included less-prominent crops, as well as non-agriculture land cover types (e.g., impervious surface and water). To accurately identify crop types in such a diverse tropical environment, we capitalized on both high-resolution Google Earth© satellite and street view imagery, as well as informal interviews with local farmers. This ensured that our samples were representative of all major crops, which were not only diverse in species type, but also showed high variation in plantation age or the crop growing stage.

2.2.2. Sentinel-2 Image Time Series
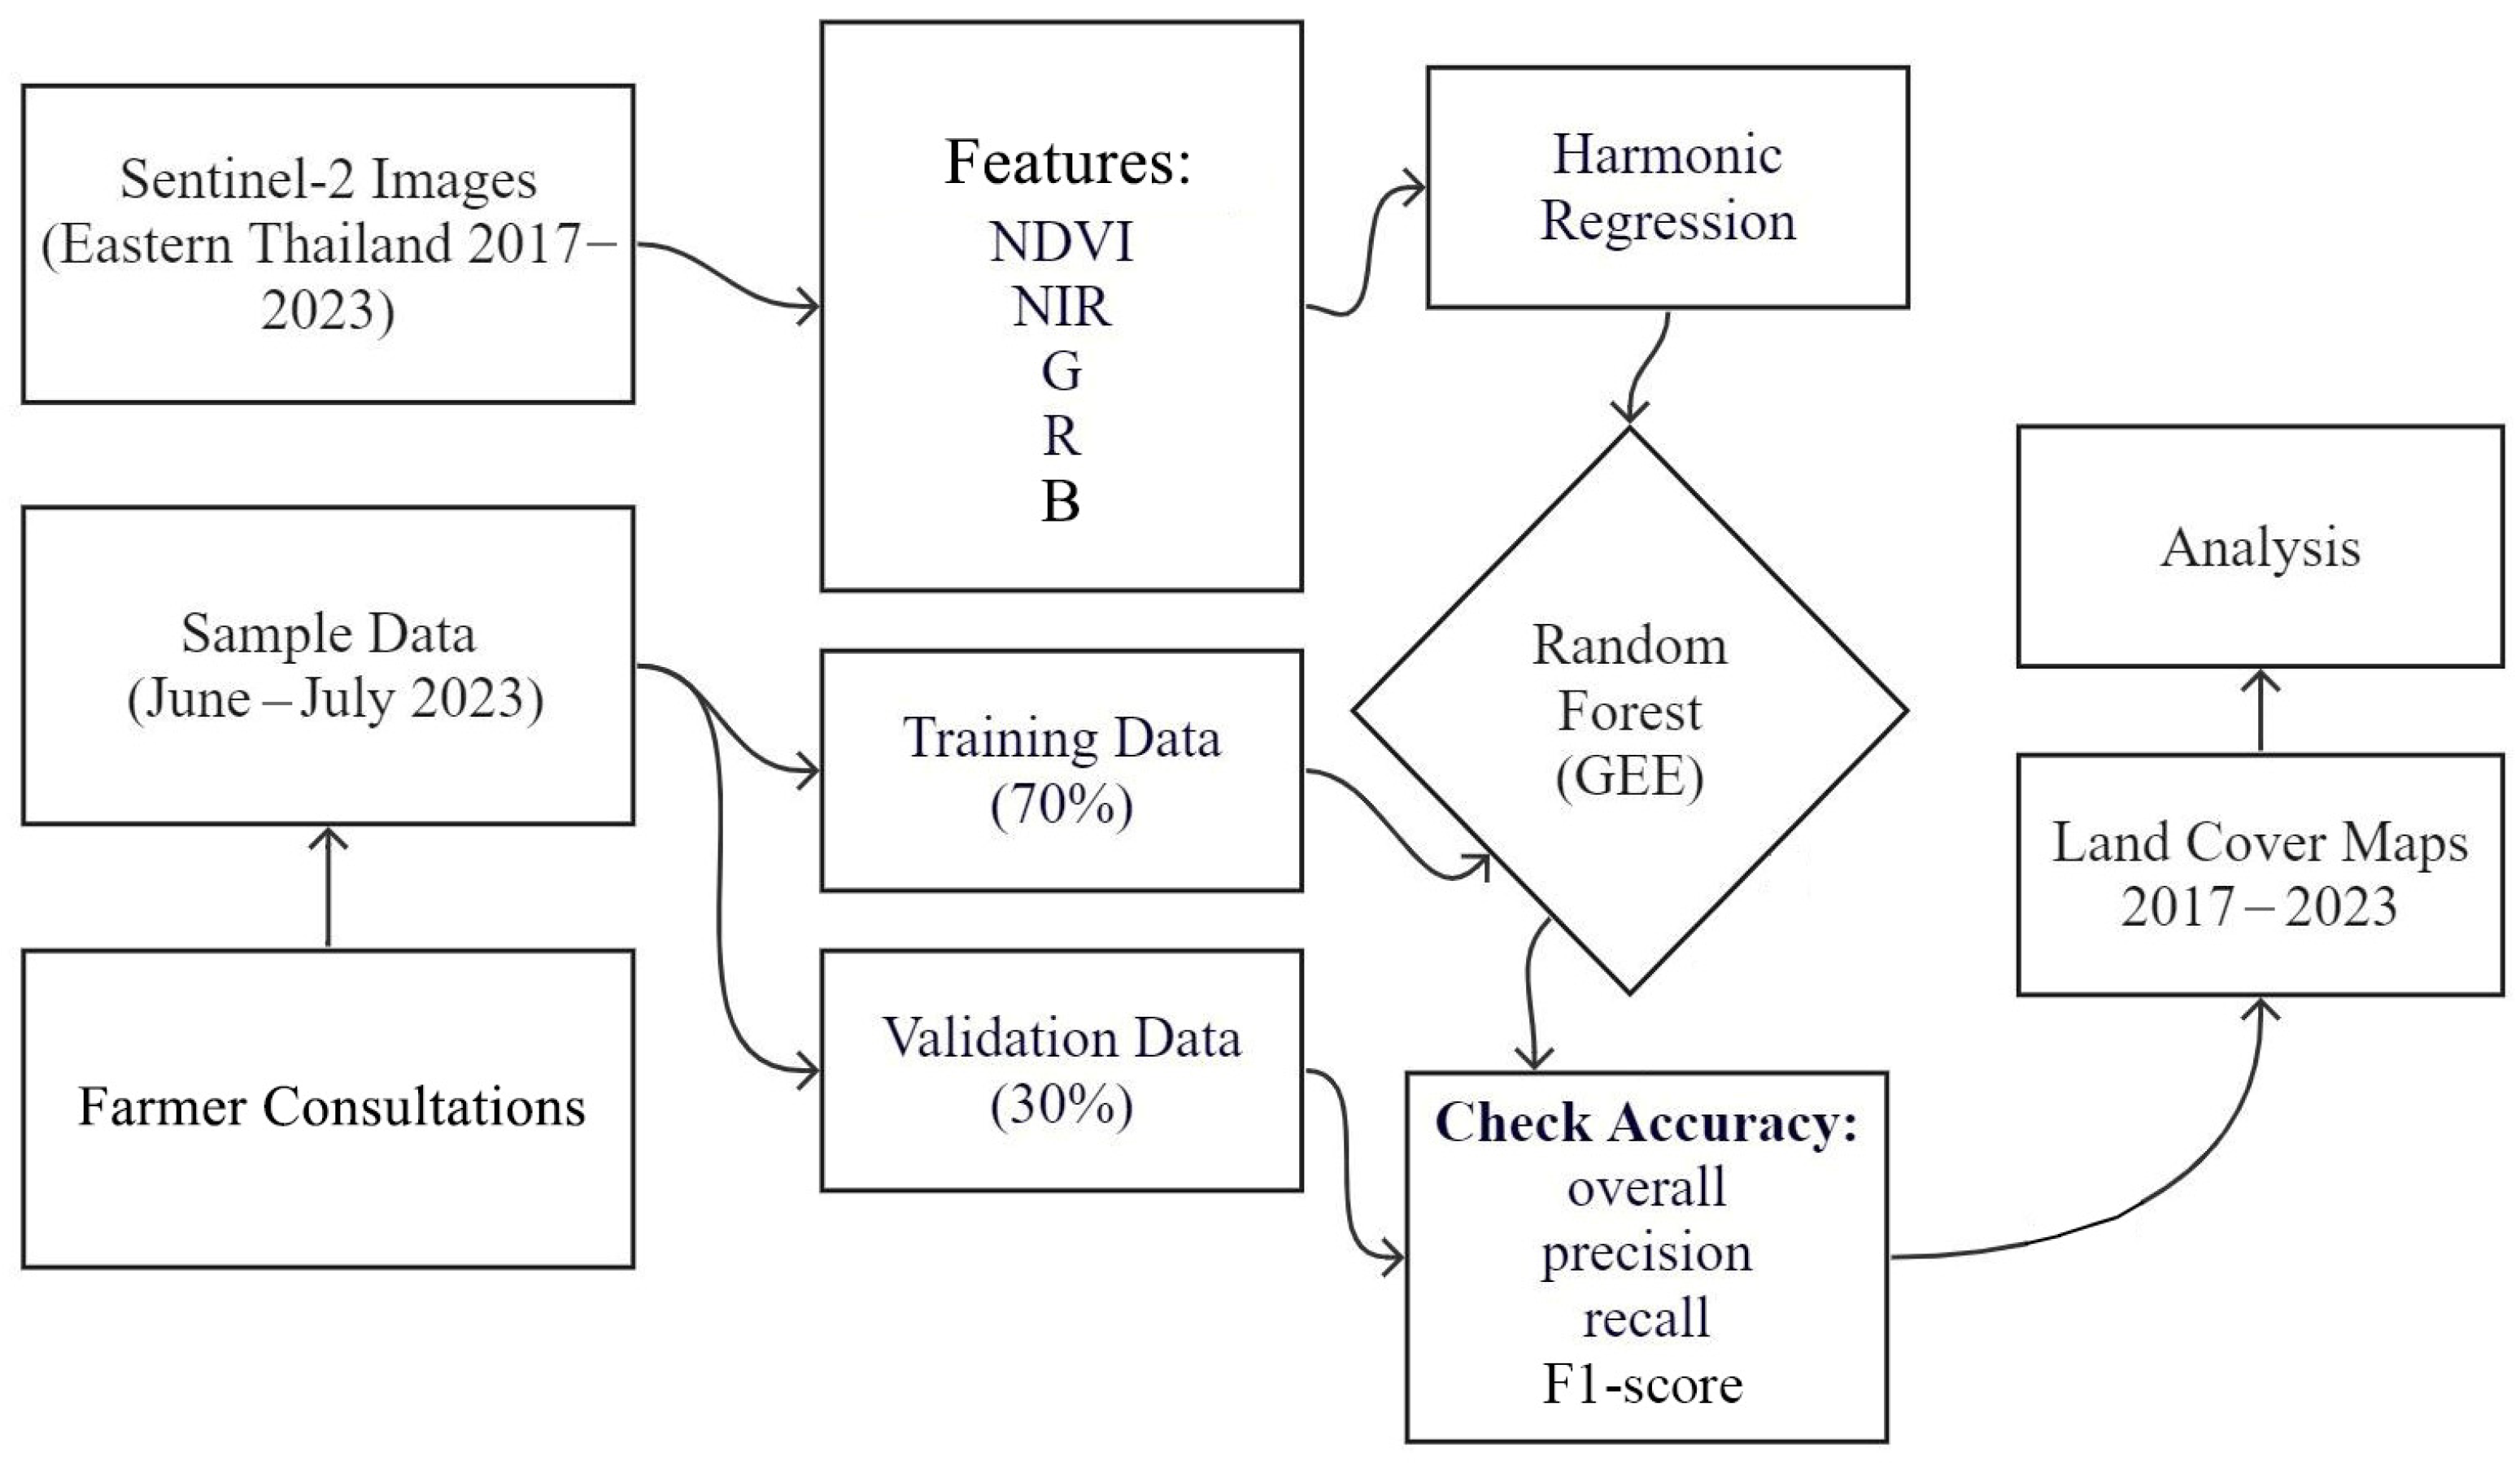
All available Sentinel-2A and Sentinel-2B images collected from June 2017 to June 2023 were used in this study. The timeframe allowed us to conduct an in-depth analysis of crop changes from a pre-pandemic and a post-pandemic perspective. The two-satellite constellation has a short revisit interval of five days, which mitigates the negative impact of heavy cloud cover on tropical crop mapping. Here, we selected the pre-processed spectral reflectance product from four image bands at the 10 m resolution, including NIR, R, G, and B, which are more suitable than the coarser resolutions to map heterogeneous, smallholder farmlands. Utilizing all accessible Sentinel-2 data enabled us to gather an ample supply of cloud-free, high-quality images for crop mapping through harmonic regression (see Section 2.3 for details). This dense image time series has the capability to accurately depict crop phenological stages (Wei et al., 2019 [16]), proving particularly effective for our study in delineating various types of crops. Notably, some of these crops exhibited comparable plant growth patterns across seasons.

2.3. Methodology

2.3.1. Classification Scheme

We designed a two-layer classification scheme, in which the first layer had broad land cover types, including agriculture, urban, water, (natural) forest, grass/shrub, and bare ground. The second layer included detailed crop types in the land cover—agriculture, i.e., durian, rice, rubber, eucalyptus, oil palm, pineapple, sugarcane, cassava, mangosteen, coconut, and others. To improve accuracy and map clarity, we focused the classification system on the crops that were both pivotal to the Thai economy and were abundant in the area. Some of the less recurrent crops such as corn, mango, and banana were included in the ‘others’ class. For the selection of major crop types in the region, we also referenced the official document ‘Agricultural Statistics of Thailand’ as developed by the Thai Office of Agricultural Economics [27].

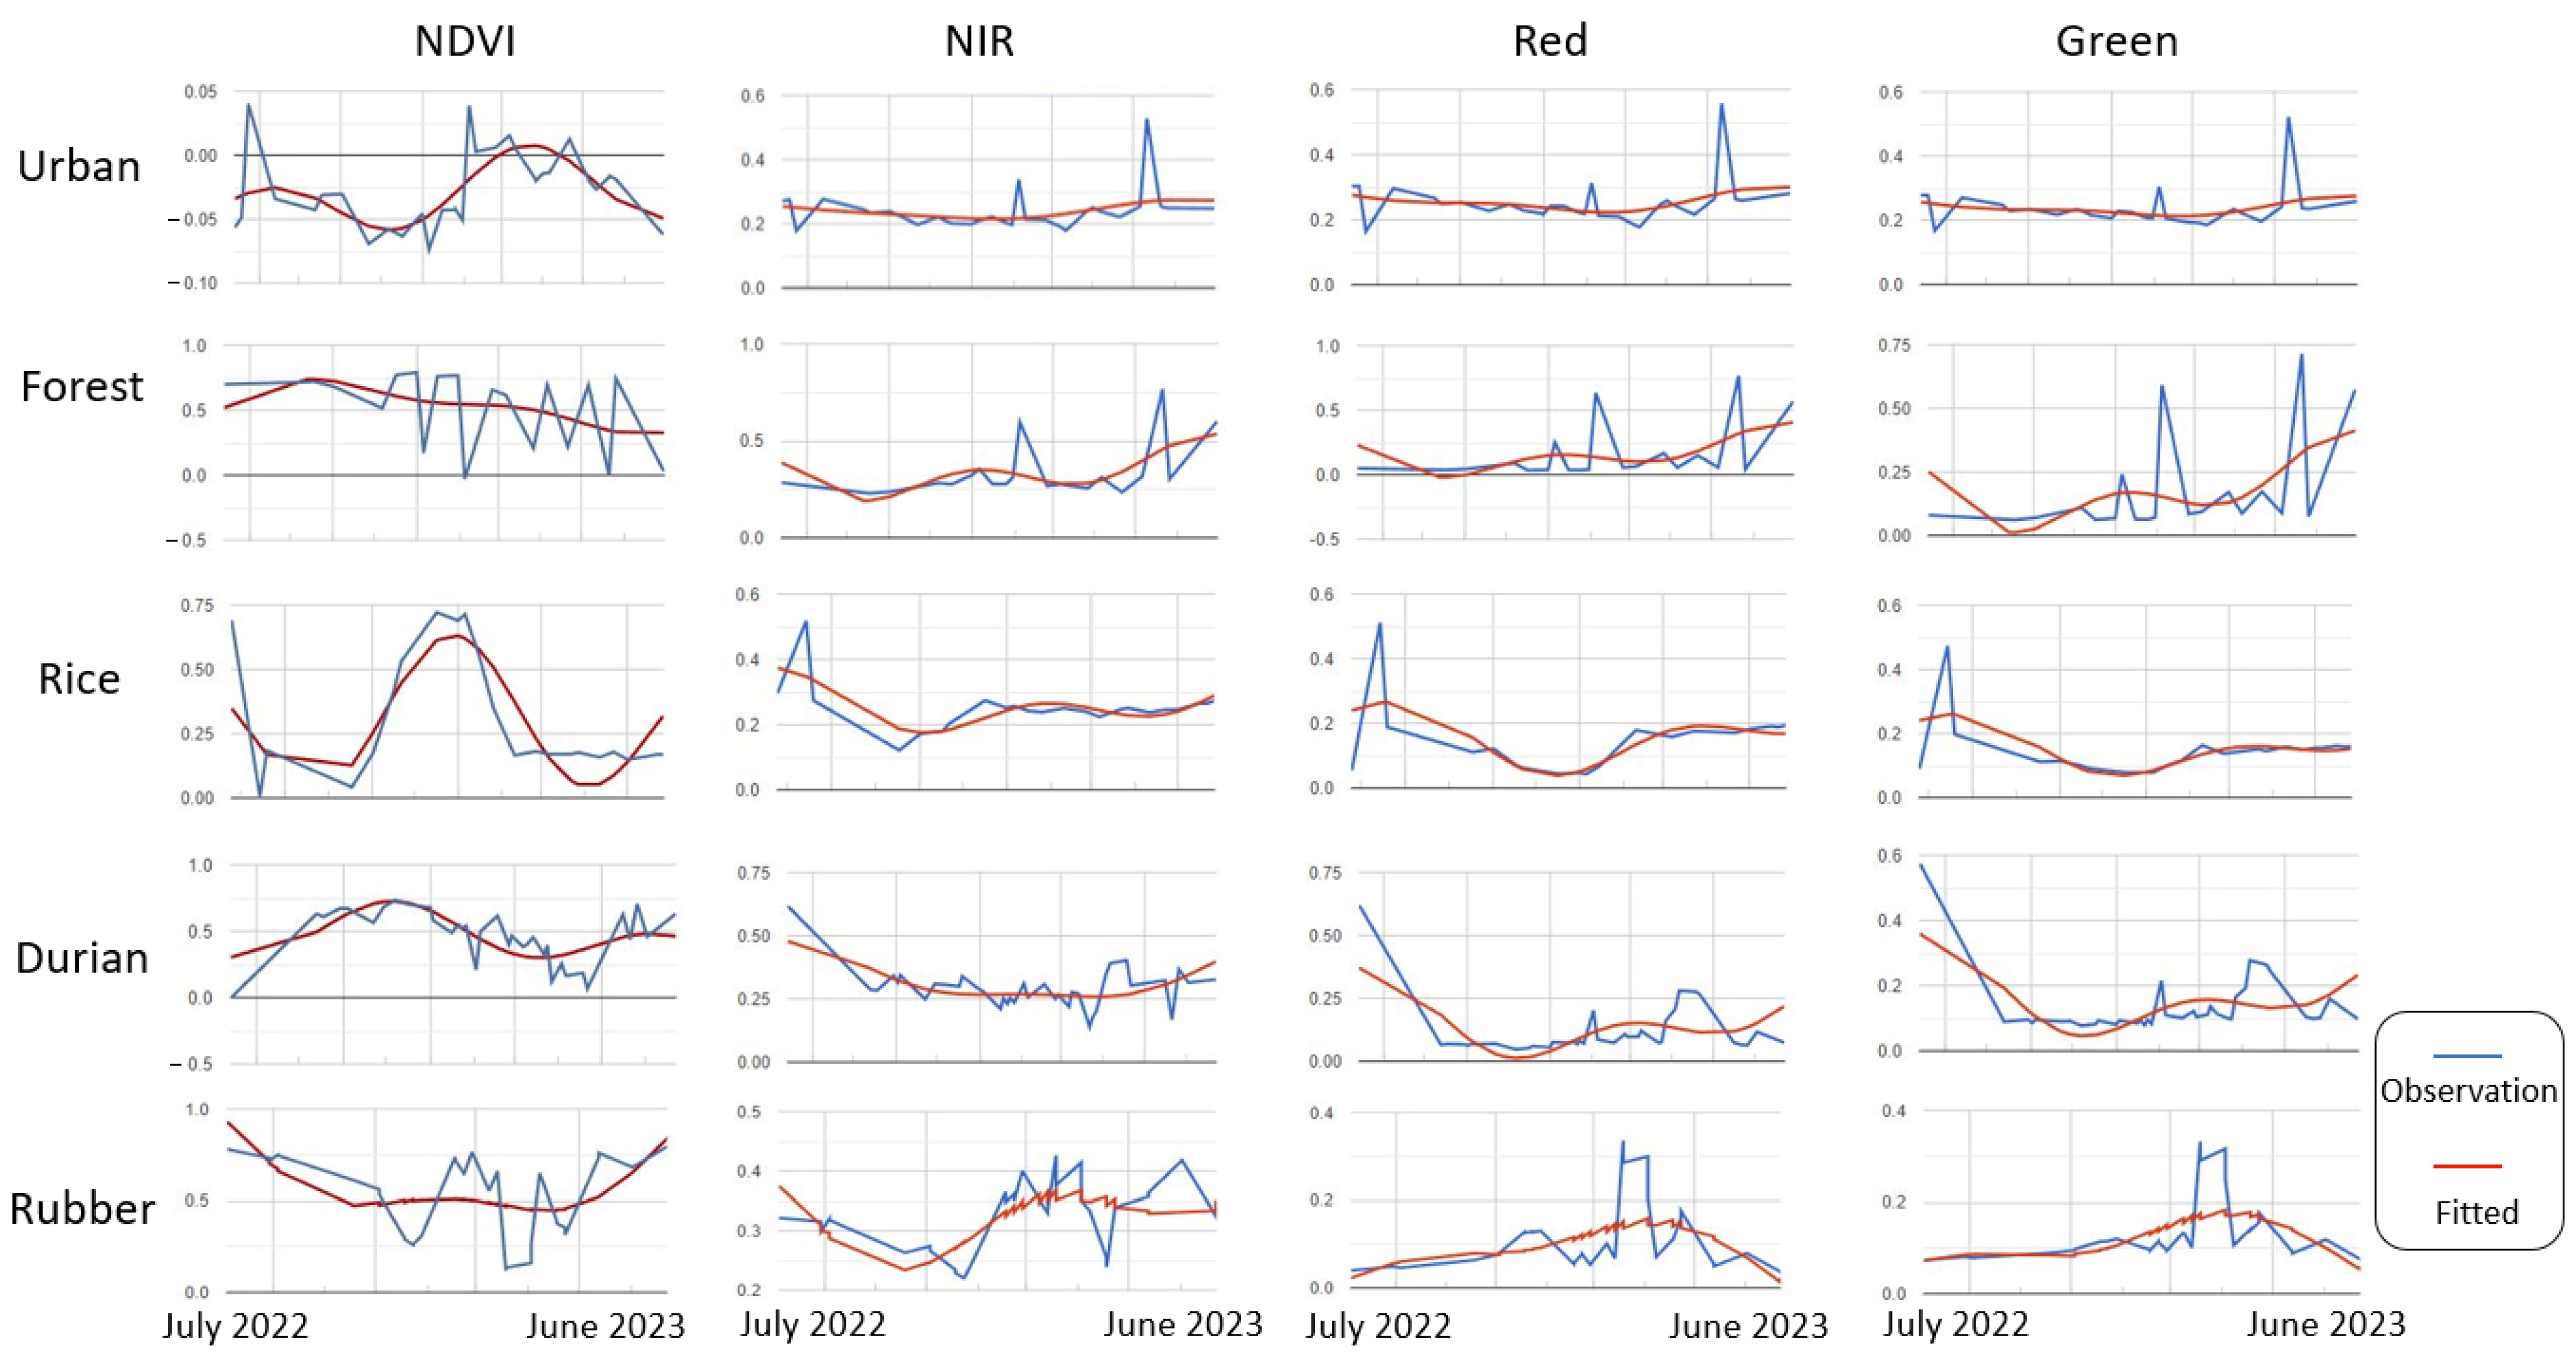
2.3.2. Crop Type Mapping

We capitalized on the open-access, high-performance computing platform Google Earth Engine© (GEE) to map crop types and their spatial–temporal distribution. Using the Sentinel-2 dense image time series, we fitted a harmonic regression model to each of the four spectral bands (NIR, R, G, and B), and the popular vegetation index NDVI (Normalized Difference Vegetation Index) to capture crop seasonal variation at the image pixel scale. The coefficients of the harmonic regression models were treated as features and were fed into the random forest (RF) algorithm for detailed crop type classification. We repeated the process for each year (e.g., June 2017 to June 2018) in the six years during the study timeframe. More details about the methods are shown in Figure 5 and the succeeding paragraphs.
Harmonic regression, also known as Fourier transform, is well suited for data patterns that reappear at regular intervals [31]. The harmonic regression model was initially intended for use in meteorology [31]; however, it has also proved effective for the classification of vegetation [32]. In this study, we fit a second-order harmonic regression to balance model complexity and computation, as large harmonics (i.e., high-order Fourier series) were determined not to be essential to explain data variance [32,33]. The following function was used for calculating the harmonic regression:
f(t) = a1cos(2πt/n) + b1sin(2πt/n) + a2cos(4πt/n) + b2sin(4πt/n) + c0
where f(t) is the predicted value at the ordinal of the date t. c0 is the constant term. a1 and b1 represent the first order seasonal harmonic coefficients, while a2 and b2 represent the second order seasonal harmonic coefficients. n controls the periodicity of the harmonic basis, and a period of 365.2421891 days per tropical year was used as the length of the annual cycle. Five coefficients were estimated for each regression model. The model was applied to fit five bands—NDVI, NIR, R, G, and B, resulting in a total of 25 coefficients, i.e., a 25-band image stored for the succeeding classification. Figure 6 shows examples of time series observations and the corresponding fitted curves using harmonic regression for urban, forest, rice, durian, and rubber pixels.
RF is an ensemble of decision trees, in which each tree is independently determined using a bootstrap sample of the data set, and a simple majority vote is taken for final prediction [34]. RF has been widely applied to map vegetation with proven success (e.g., [35,36]). In this study, RF was applied as the classifier to estimate crop types and map their extents. According to our previous experience in crop type mapping [16] and the exploratory trials with the current data, two major parameters were specified in RF: 100 for the number of trees and 3 for the number of predictor variables for each tree. Here, we combined harmonic regression and RF for the purpose of capitalizing on harmonic regression’s strong ability to capture crop phenological stages and RF’s proven success in vegetation classification.

2.3.3. Accuracy Assessment

We randomly selected 70% of the field samples for training the model, while the remainder were used for validating the model’s performance. In this study, we calculated and reported on four popular metrics—overall accuracy, users’ accuracy, producers’ accuracy [37], and F1-score [38]. Because field samples were collected in summer 2023, accuracy assessment was conducted for the 2023 map only. The trained model was then applied to the other years of the imagery to produce annual crop maps between 2017 and 2022.

3. Results

3.1. Mapping Accuracies

The overall accuracy using the 2023 validation samples was 85.6%, with the overall users’ accuracy being 87.2%, the overall producers’ accuracy 83.8%, and F1-score 85.5%. Figure 7 shows the users’ and the producers’ accuracy for each of the studied land cover types, including the 10 specific crop types. In general, the broad land cover types, such as urban, water, natural forest, and bare ground, were relatively well identified, with over 80.0% accuracy in most cases. However, there were some discrepancies between the users’ and the producers’ accuracy for some classes. For example, while urban producers’ accuracy was as high as 95.2%, its users’ accuracy was barely close to 80.0%. The opposite trend was found for bare ground, where its users’ accuracy was noticeably higher. Because unpaved roads are common in the rural regions of Thailand, the high spectral similarity between some unpaved roads and bare ground led to an overestimation of the urban area at the fine scale. However, it did not affect our interpretation of croplands. The majority of natural forests in tropical Eastern Thailand demonstrated a lower variation in phenology than crops, and they were limited to reserved regions (e.g., national parks), which made forest class identification a straightforward task. The only non-agriculture land cover that introduced noticeable uncertainties to crop mapping was grass/shrub, with a high users’ accuracy but a low producers’ accuracy. Some crops take years to reach closed canopies (e.g., rubber and durian). During the early growing years, the gaps and soil on the ground are typically covered by grass, resulting in mixed spectral signatures. This is particularly true when crops are grown at a relatively low density. However, the underestimation of grass/shrub did not cause major issues for crop mapping due to their small coverage (less than 1%) of the study area.
Mapping accuracies varied across crop types are shown in Figure 7. In general, the majority of crop types reached over 75% of the producers’ and the users’ accuracy. Particularly for rice, rubber, pineapple, oil palm, and coconut, the accuracies were above 90%. An exception was sugarcane, whose accuracy was lower than 50% of producers’/users’ accuracy. Due to the nature of sugarcane as a species of tall, perennial or semi-perennial grass, it was easily misclassified as grass/shrub or other early-stage plantation with ground surface covered by grass of similar phenological traits.

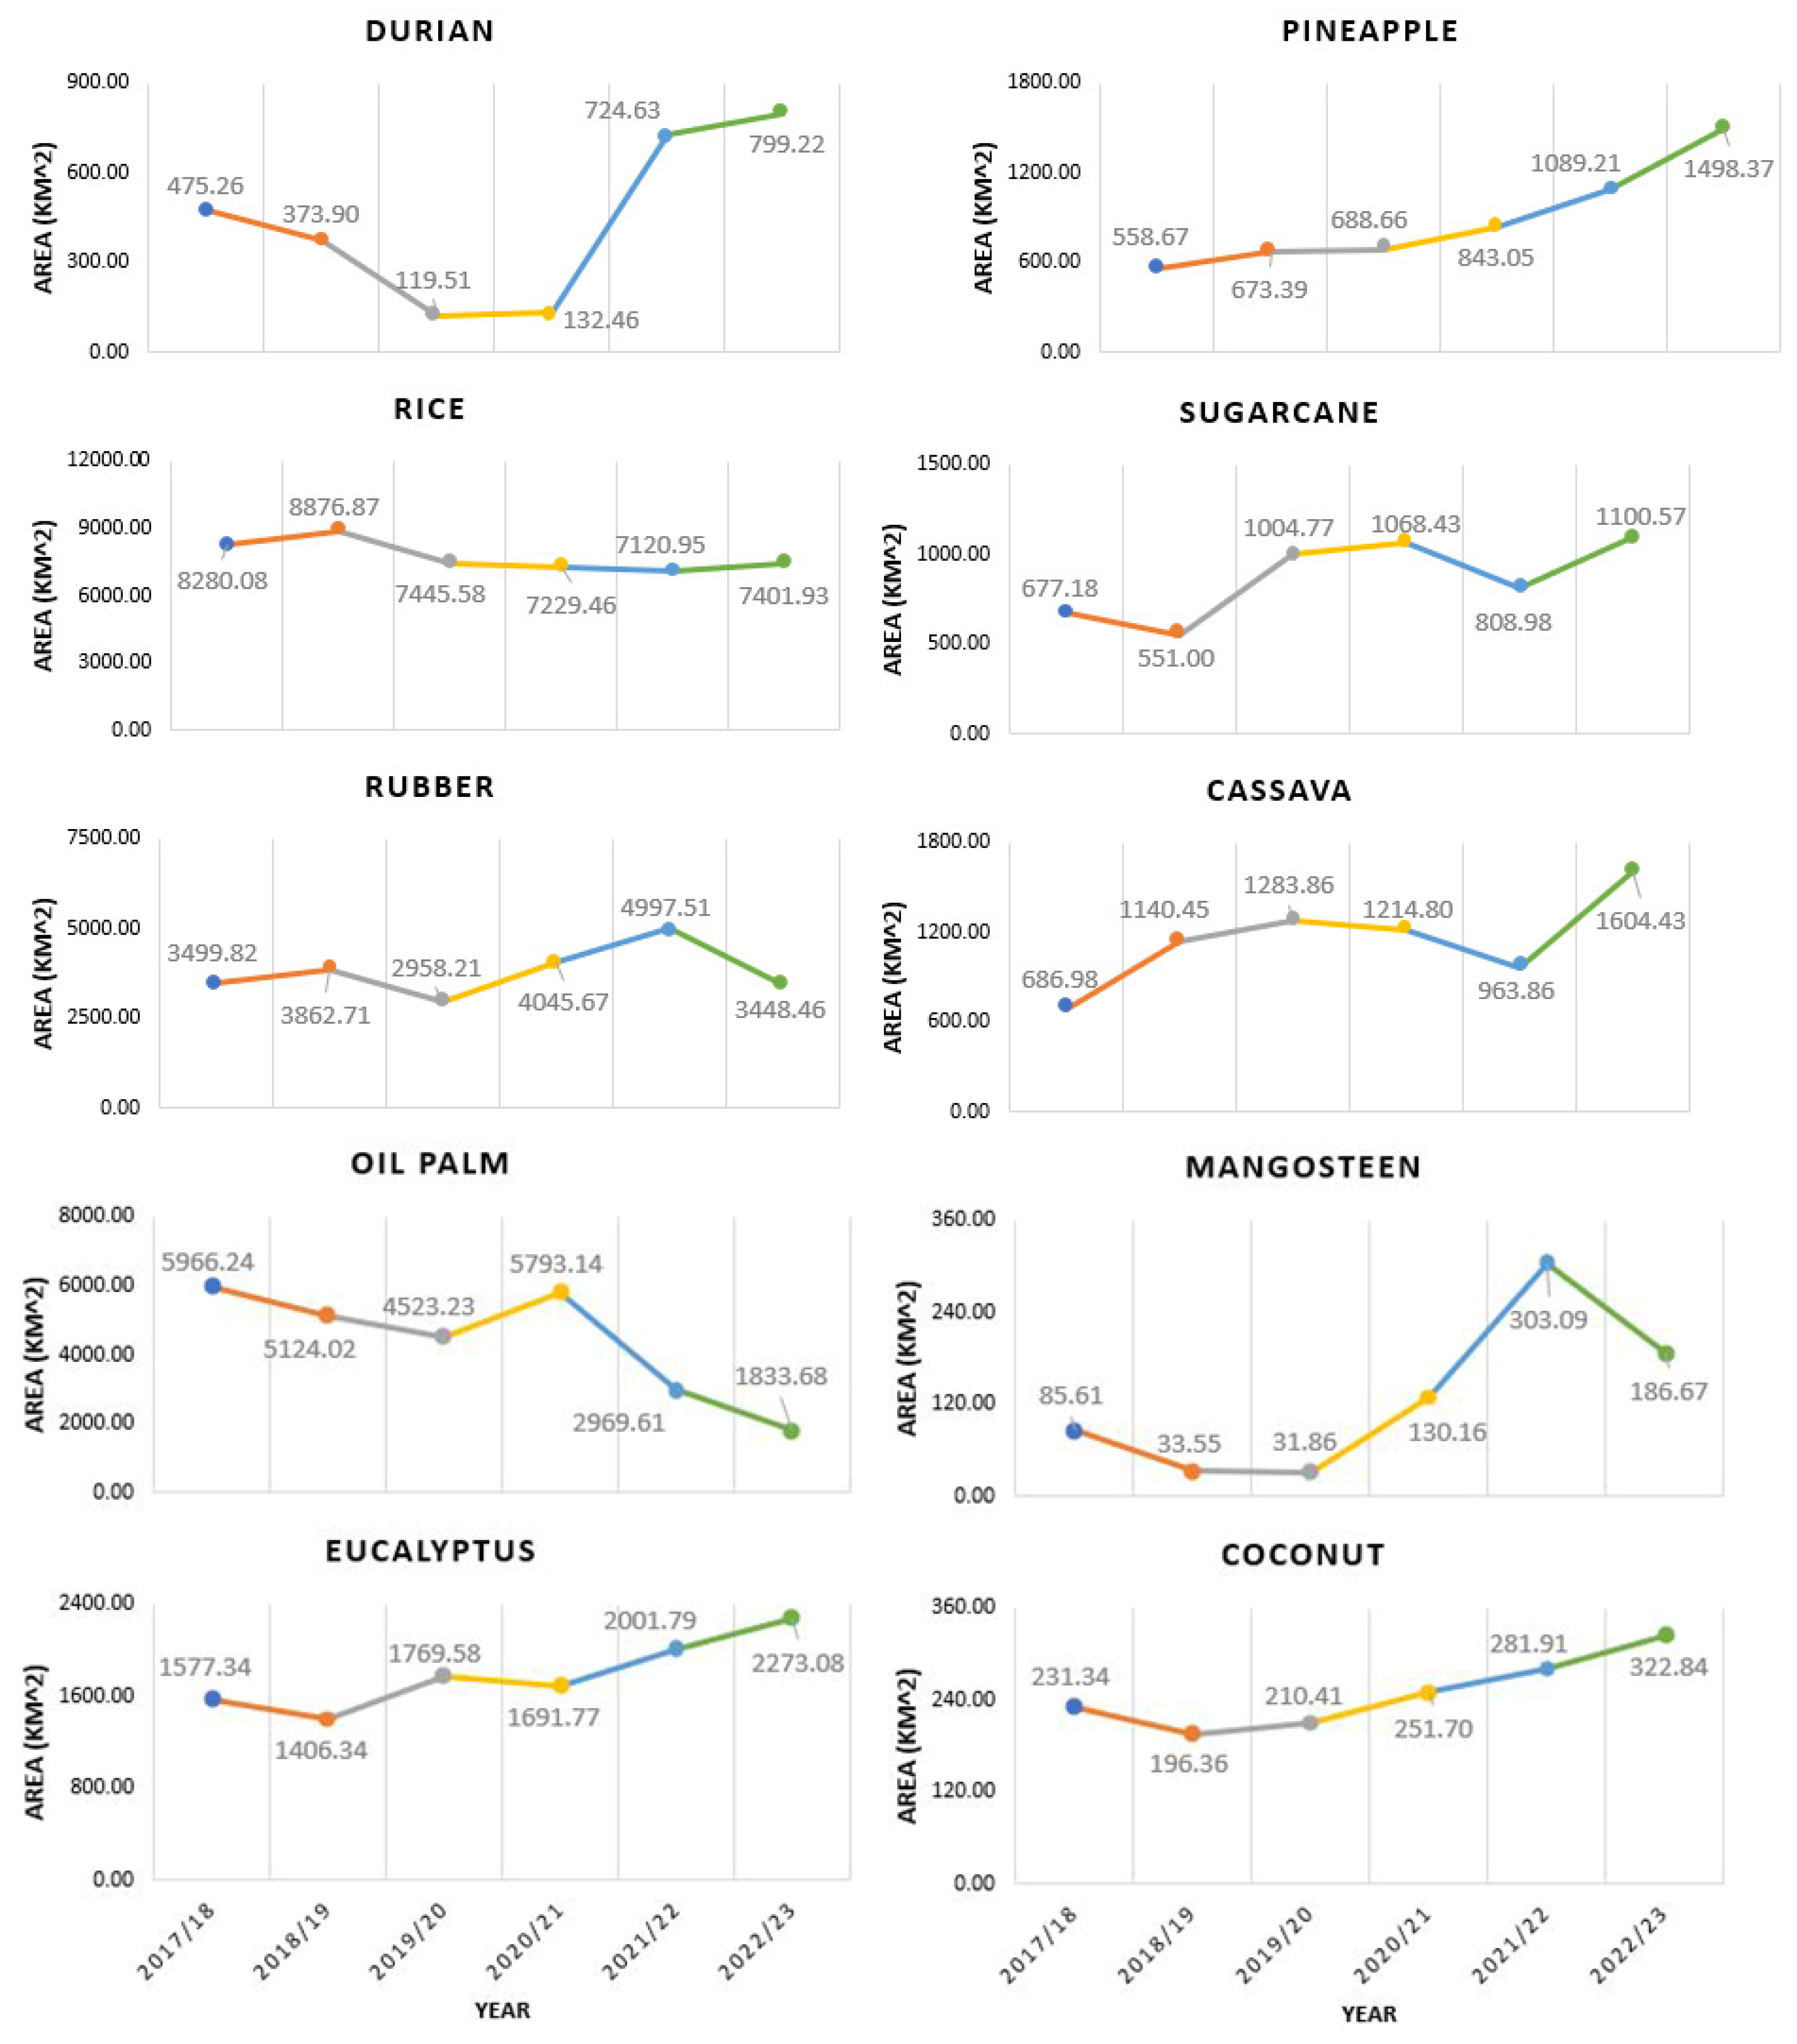
3.2. Cropland Changes

We generated annual land cover maps from summer 2017 to summer 2023 (Figure 8). In general, urban areas increased by 1799.31 km2, which was expected given the continued urbanization in the region. However, it occurred at the expense of losing open water (303.58 km2) and natural forest lands (570.03 km2). One exception was the overestimation of urban areas for the eastern part of Chanthaburi in the 2022/2023 map due to cloud contamination, which occurs frequently in the tropics. Grass/shrub had only a slight decrease, with a loss of 1.18 km2. There was an increase in bare ground by 449.84 km2, much of which was related to land clearing for imminent agricultural use.
Agricultural lands also showed variation in acreage changes across the pandemic (Figure 9). For example, rice farms had land loss, with a change in land area of 878.15 km2, a 10.6% decrease. A significant decrease in the oil palm farm area was present with the loss of 4132.58 km2 being measured, a 69.3% decrease. A small yet noticeable decline in rubber farming was present with a loss of 51.35 km2 corresponding to a 1.46% decrease. On the other hand, several crop types were found to increase in area size. There was a significant increase in the area occupied by durian orchards with the addition of 323.96 km2, a 158.2% increase. An increase in the area of eucalyptus land was present with the addition of 695.74 km2, a 44.1% increase, as well as a 168.2% increase in pineapple farm area with an additional 939.70 km2. There was also a 62.5% increase in sugarcane farming area with the addition of 423.39 km2. An increase in the cassava farming area was measured with an increase of 917.45 km2, a 133.5% increase. Mangosteen orchards also increased by 118.1% with 101.06 km2. Lastly, land covered by coconut trees increased by 91.50 km2, a 39.6% increase. Throughout the pandemic, the change trends varied across different types of crops. For example, durian and mangosteen showed a decreasing trend during and even before the pandemic (e.g., 2019). However, they recovered quickly from the pandemic, and their acreage is now above the pre-pandemic level. In contrast, rice and oil palm which are the major crops in the region continued to decline over the years. Eucalyptus, pineapple, sugarcane, cassava, and coconut showed a relative upward trend during the studied timeframe. Rubber production was slightly affected at the beginning of the pandemic but was able to recover to the pre-pandemic level.
In our study area, rice cultivation was primarily concentrated in the northern regions, specifically within three provinces: Chachoengsao, Prachin Buri, and Sa Kaeo. While the cultivation of rice remained consistent in this area over the years, both its spatial coverage and density experienced a gradual decline. Regarding tree plantations, rubber trees were extensively distributed throughout the study area, particularly in Chachoengsao, Chanthaburi, Rayong, Chon Buri, and Trat. Although the spatial coverage of rubber plantations exhibited fluctuations during the study period, the overall spatial pattern remained relatively stable. In contrast, the spatial distribution of durian plantations presented a distinct pattern. Particularly noteworthy is the significant increase in durian plantation coverage observed in Rayong, Chanthaburi, and Trat provinces since 2022. Given that durian trees typically require 3–6 years to mature and produce fruit, it is plausible that the surge in durian cultivation began several years prior to being accurately captured by remote sensing. This phenomenon may also elucidate some spatial inconsistencies observed in durian plantation regions before 2022 when trees were small. Furthermore, it is worth noting that the variability in measurements of crop distribution over the years could also be influenced by atmospheric noise, a challenge often encountered in tropical regions and difficult to completely eliminate from the data.

4. Discussion

4.1. Effectiveness of Fine-Scale Image Time Series in Tropical Crop Type Mapping

Satellite image time series have gained increasing popularity in mapping Asian cropping patterns over the past decade. This trend has benefited from the availability of openly accessible satellite datasets (e.g., MODIS, Landsat, and Sentinel imagery), the maturity of remote sensing algorithms simulating plant phenological cycles, and fast-growing computing capabilities. In Asia, particularly Southeast Asia, the majority of crop mapping activities have employed medium- or low-resolution Landsat or MODIS image time series (e.g., [16,39,40,41,42]). With the recent availability of Sentinel-2′s 10-m resolution imagery, it has become easier to address the spectral mixing issue over smallholder farmlands. To date, most studies have focused on identifying individual crop types, such as sugarcane [43], mung bean [44], and paddy rice [45], with reported accuracies typically higher than 90%. Some other studies have attempted to map multiple, but limited numbers of, crop types (equal to or fewer than five) in one modeling framework (e.g., [46,47,48]). The reported accuracies were typically lower than mapping one single crop type, due to the similarity in phenology among the studied crops, making inter-class variation challenging to capture. However, their accuracies were mostly higher than 70%.
In our endeavor to map a diverse array of crop types across smallholder farmlands, we observed significant variation in model performance, ranging from less than 50% to 100%. Notably, rice, as the predominant crop in the region, achieved a relatively high accuracy. Rice paddies, characterized by partial flooding, allow for up to three harvests annually in Thailand. Despite governmental advisories urging farmers to forgo one crop due to recent drought events [49], the distinct phenology of crops within paddy fields facilitates differentiation from those with lower water requirements. For high-value cash crops such as rubber, pineapple, eucalyptus, coconut, durian, and oil palm, phenology proved effective in mapping mature plantations using high-resolution image time series. However, we observed overestimation in the majority of these cash crops, primarily attributed to young plantations with open tree canopies, where the ground surface is covered by grass and shrubs, leading to spectral confusion. This phenomenon also contributed to the high underestimation of the non-crop land cover grass/shrub. While object-based image analysis demonstrated effectiveness in mapping individual crop types, such as rubber plantations [18], determining the optimal object size becomes challenging in regions with a diverse mix of crop types at various growth stages. Deep learning presents another potential solution (e.g., [48,50]), though logistical challenges often hinder the collection of large volumes of field samples for model training. In contrast to urban mapping, where human photo interpretation can efficiently provide large sample volumes, accurate crop type identification often necessitates on-site assessments. Despite these challenges, our study achieved an overall mapping accuracy of 85.6%, with some crop types surpassing 90%, which was comparable to recent studies on multi-crop mapping. Furthermore, the use of high-resolution imagery demonstrated effectiveness in situations involving intercropping, such as durian or rubber plantations mixed with pineapple or cassava. Compared to the use of medium- or low-resolution data, young plantations in smallholder farmlands can be more accurately identified, providing crucial insights for effective policymaking. While it is possible to consider combined classes in crop mapping owing to mixed cultivation, they do not align with the popular classification schemes employed in Thailand or many other countries in Southeast Asia. In addition, the presence of mixed croplands can exacerbate spectral variation considerably due to the diverse growing stages of individual crops. Obtaining a substantial number of additional field samples posed logistical challenges for achieving precise mapping of the combined classes.
When compared with the data sourced from the Office of Agricultural Economics of Thailand [27], our study revealed a blend of consistent trends and distinctive insights. Specifically, our findings confirm the reported increases in durian plantations, with Chanthaburi experiencing a 51% rise, Trat a 102% surge, and Rayong a 41% expansion from 2018 to 2022. This aligns with our observations (see Figure 9), in which we too detected a notable uptick in the spatial coverage of durian trees. Similarly, our study noted the stability of rubber plantation dynamics over time, consistent with the aforementioned report. An intriguing divergence emerges in regions like Chanthaburi and Rayong, where extensive rubber plantations have undergone a substantial transition to durian cultivation—a trend mirrored in both the government’s findings and our own. Nevertheless, an inconsistency arises concerning rice cultivation trends. Our analysis identified a 10% decrease in rice cultivation from 2018 to 2022, contradicting the government’s portrayal of a relatively stable trend. This disparity could be attributed to uncertainties inherent in field surveys to complete the government report or remote sensing techniques. From the remote sensing perspective, recent drought events [49] have affected crop phenology within paddy fields and/or their surface spectral characteristics, possibly causing modeling errors using remote observations.

4.2. Impact of COVID-19 and Other Factors on Crop Choice

The COVID-19 pandemic markedly disrupted both international and domestic tourism, primarily attributed to stringent travel restrictions. These limitations extended beyond affecting traditional tourists; in Thailand, they also impacted migrant workers who found themselves unable to traverse borders or even move between provinces. For instance, in Chanthaburi, a directive was issued prohibiting the entry of migrant workers from other provinces, necessitating authorization for agricultural workers to move within the region [51]. Given the essential role played in the Thai agricultural economy by migrant laborers, who constitute a substantial portion of the sector’s workforce [52], many farmers were compelled to pivot away from or suspend activities related to labor-intensive crops (e.g., rubber and durian). Instead, there was a discernible shift towards cultivating less labor-intensive crops, such as mangosteen and pineapple. This adjustment in agricultural practices may elucidate the observed marginal decline in rubber and durian production in the year 2020.
However, financial gain (e.g., crop market price) emerged as a pivotal factor influencing farmers’ decisions regarding crop cultivation. An illustrative instance is the surge in durian cultivation. The export of Thai durians has witnessed a significant upswing in recent years, primarily driven by the burgeoning demand from China. While the industry initially grappled with a shortage of labor and supplies during the pandemic, it swiftly adapted. Notably, some individuals, under the misconception that durian contains sulfur and can help prevent COVID-19 [53], increased their consumption of the fruit from Thailand. To counter the challenge of losing intermediaries or distributors due to border closures and travel restrictions, along with the associated disruption in business connections with customers, many Thai farmers have embraced online sales channels. They leveraged established platforms such as Alibaba©, eBay©, or their own online stores [13,54]. The success of e-commerce, shifting away from traditional wholesale markets, has not only mitigated the negative impact of the pandemic but has also substantially elevated durian sales to unprecedented levels [55]. This success aligns with our findings of the rapid expansion of durian cultivation in Eastern Thailand. In contrast, crops like rice and oil palm, traditionally dominant in the region, have experienced a noticeable decline in cultivation over the years. Rice prices dropped from over $600 U.S. dollars per metric ton in 2011 to $400 in 2019, and palm oil prices exhibited an even more dramatic decline from over $1100 per metric ton in 2011 to $500 in 2019, according to Federal Reserve Economic Data [56]. These trends mirror the changes in cultivation acreage observed in this study, where rice farmlands decreased by 10%, and nearly 70% of oil palm farmlands vanished (Figure 9). Meanwhile, the lucrative financial returns offered by crops like durian have further fueled this shift in cultivation. However, Thai farmers now face stiff competition from their international counterparts in Vietnam, Malaysia, and the Philippines, with durian prices unexpectedly plunging to a low level in 2023 [57]. This trend may affect future cultivation patterns.
Climate change plays a crucial role in agriculture, and Thailand has witnessed a notable rise in temperatures over the last four decades, with the mean temperature escalating by 0.95 °C between 1955 and 2009 [58]. Specifically, during the 2019/2020 season, an abnormally brief monsoon period and a 15% reduction in annual rainfall triggered a severe drought in the country [49], resulting in substantial crop yield losses. To address this, the Thai government implemented restrictions on rice irrigation [59]. Our findings underscore the impact of these climate challenges, revealing a 16.12% decrease in rice cultivation between 2019 and 2020. In addition to drought, irregular and intensified extreme climate events, such as hurricanes, have adversely affected the region over the past decade, as reported by local farmers in our informal communications with them. While the pandemic exacerbated these challenges, it also served as a catalyst for Thai farmers to embrace innovative technologies. For instance, some farmers have adopted drone-assisted crop management for plant health monitoring and pesticide spraying, proving its effectiveness for smallholder farming (see Figure 10).

5. Conclusions

While numerous studies have explored the immediate ramifications of the COVID-19 pandemic on agricultural systems, only a limited number have delved into the enduring effects of this global health crisis. This study assessed the spatiotemporal patterns of change in tropical crop cultivation in Eastern Thailand across periods preceding, during, and subsequent to the pandemic. Additionally, we sought to evaluate the role of COVID-19 in driving such changes. Given the traditional cultivation of a diverse array of tropical crops on smallholder farmlands in Thailand, we examined the effectiveness of a high-resolution (10 m) Sentinel-2 dense image time series. These data, incorporated into harmonic regression and random forest methodologies, were employed for mapping various crops, including durian, rice, rubber, eucalyptus, oil palm, pineapple, sugarcane, cassava, mangosteen, coconut, and others. Our approach demonstrated efficacy in mapping the majority of the studied crop types, particularly in situations involving intercropping—an established practice of cultivating multiple plant species simultaneously in the same patch of land. However, when attempting to map multiple crop types within a single framework, notable variations in accuracy were observed. Overestimation occurred, notably in young plantations characterized by open tree canopies and grass-covered ground surfaces. Furthermore, we identified the short-term impact of the pandemic on labor-intensive crops, such as rubber and durian. Nevertheless, no discernible impact was observed throughout the entire study period. In contrast, farmers’ decisions regarding crop cultivation appeared more influenced by factors such as financial gain and climate change. There was a significant increase in durian cultivation even during the pandemic, which ironically prompted Thai farmers to adopt e-commerce to meet the escalating international demand, particularly from China.

Author Contributions

Conceptualization, G.C., C.H., S.A. and N.T.; methodology, G.C., A.R.T., W.W.H., H.M.R., M.G.C., G.M.B. and J.E.K.III; validation, A.R.T., W.W.H., H.M.R., M.G.C., G.M.B. and J.E.K.III; formal analysis, A.R.T., W.W.H., H.M.R., M.G.C., G.M.B. and J.E.K.III; resources, G.C., S.A., N.T.; data curation, G.C.; writing—original draft preparation, G.C., A.R.T., W.W.H., H.M.R., M.G.C., G.M.B. and J.E.K.III; writing—review and editing, G.C. and C.H.; project administration, G.C.; funding acquisition, G.C. and C.H. All authors have read and agreed to the published version of the manuscript.

Funding

This research was funded by the U.S. National Science Foundation (OISE #2153579).

Data Availability Statement

The original contributions presented in the study are included in the article, further inquiries can be directed to the corresponding author.

Acknowledgments

The authors would like to thank numerous contributors who provided vital field and technical support, including Prasit Deewatthanawong, Witsanu Attavanich, Krittidech Yoorod, Suwit Sappavitthayasiri, Joseph Hoff, Xiaoxia Newton, Cuizhen Wang, Penelope Karagounis, Noot Sittitoon, Mew Korrakot, Kheawwhan Nichaphat, and Gift Srisuwon. The authors are also grateful to the editor and three anonymous reviewers for their constructive comments, which helped to improve this paper.

Conflicts of Interest

The authors declare no conflicts of interest.

References

  1. WHO. Chief Declares End to COVID-19 as a Global Health Emergency. Available online: https://news.un.org/en/story/2023/05/1136367 (accessed on 1 October 2023).
  2. Stephens, E.C.; Martin, G.; van Wijk, M.; Timsina, J.; Snow, V. Editorial: Impacts of COVID-19 on agricultural and food systems worldwide and on progress to the sustainable development goals. Agric. Syst. 2020, 183, 102873. [Google Scholar] [CrossRef]
  3. Torero, M. Without food, there can be no exit from the pandemic. Countries must join forces to avert a global food crisis from COVID-19. Nature 2020, 580, 588–589. [Google Scholar] [CrossRef]
  4. Laborde, D.; Martin, W.; Swinnen, J.; Vos, R. COVID-19 risks to global food security. Science 2020, 369, 500–502. [Google Scholar] [CrossRef]
  5. Boughton, D.; Goeb, J.; Lambrecht, I.; Headey, D.; Takeshima, H.; Mahrt, K.; Masias, I.; Goudet, S.; Ragasa, C.; Maredia, M.K.; et al. Impacts of COVID-19 on agricultural production and food systems in late transforming Southeast Asia: The case of Myanmar. Agric. Syst. 2021, 188, 103026. [Google Scholar] [CrossRef] [PubMed]
  6. Middendorf, B.J.; Faye, A.; Middendorf, G.; Stewart, Z.P.; Jha, P.K.; Prasad, P.V.V. Smallholder farmer perceptions about the impact of COVID-19 on agriculture and livelihoods in Senegal. Agric. Syst. 2021, 190, 103108. [Google Scholar] [CrossRef] [PubMed]
  7. Food and Agriculture Organization of the United Nations. Scaling up Climate Ambition on Land Use and Agriculture through Nationally Determined Contributions and National Adaptation Plans (SCALA). Available online: https://www.fao.org/in-action/scala/countries/thailand/en (accessed on 3 March 2024).
  8. Thai Ministry of Agriculture and Cooperatives. Thailand Is Now the World’s 13th Largest Exporter of Agricultural Products; Minster. Available online: https://www.nationthailand.com/thailand/economy/400241878/ (accessed on 1 October 2023).
  9. van Welzen, P.C.; Madern, A.; Raes, N.; Parnell, J.A.N.; Simpson, D.A.; Byrne, C.; Curtis, T.; Macklin, J.; Trias-Blasi, A.; Prajaksood, A.; et al. The current and future status of floristic provinces in Thailand. In Land Use, Climate Change and Biodiversity Modeling: Perspectives and Applications; IGI Global: Hershey, PA, USA, 2011; pp. 219–247. [Google Scholar]
  10. China Importing $2.2 Billion Durian from Thailand in 2020. Available online: https://www.globaltimes.cn/page/202102/1216754.shtml#:~:text=China%20imported%20575%2C000%20tons%20of,from%20Thailand%2C%20the%20ministry%20said (accessed on 1 October 2023).
  11. Tansuchat, R.; Suriyankietkaew, S.; Petison, P.; Punjaisri, K.; Nimsai, S. Impacts of COVID-19 on Sustainable Agriculture Value Chain Development in Thailand and ASEAN. Sustainability 2022, 14, 12985. [Google Scholar] [CrossRef]
  12. Sapbamrer, R.; Sittitoon, N.; La-up, A.; Pakvilai, N.; Chittrakul, J.; Sirikul, W.; Kitro, A.; Hongsibsong, S. Changes in agricultural context and mental health of farmers in different regions of Thailand during the fifth wave of the COVID-19 pandemic. BMC Public Health 2022, 22, 2050. [Google Scholar] [CrossRef]
  13. Pimoljinda, T.; Hongwiset, S. Food Safety, Consumer Behaviour, and Government Policy after the COVID-19 Pandemic in Thailand: A Review. In Proceedings of the International Conference on Politics, Social, and Humanities Sciences, Purwokerto, Indonesia, 12–13 October 2022; KnE Social Sciences: Dubai, United Arabic Emirates, 2023; pp. 249–259. [Google Scholar]
  14. Woodcock, C.E.; Allen, R.; Anderson, M.; Belward, A.; Bindschadler, R.; Cohen, W.; Gao, F.; Goward, S.N.; Helder, D.; Helmer, E.; et al. Free access to Landsat imagery. Science 2008, 320, 1011. [Google Scholar] [CrossRef]
  15. Gao, F.; Zhang, X. Mapping crop phenology in near real-time using satellite remote sensing: Challenges and opportunities. J. Remote Sens. 2021, 2021, 8379391. [Google Scholar] [CrossRef]
  16. Wei, Y.; Tong, X.; Chen, G.; Liu, D.; Han, Z. Remote Detection of Large-Area Crop Types: The Role of Plant Phenology and Topography. Agriculture 2019, 9, 150. [Google Scholar] [CrossRef]
  17. Liu, X.; Zhai, H.; Shen, Y.; Lou, B.; Jiang, C.; Li, T.; Hussain, S.B.; Shen, G. Large-scale crop mapping from multisource remote sensing images in google earth engine. IEEE J. Sel. Top. Appl. Earth Obs. 2020, 13, 414–427. [Google Scholar] [CrossRef]
  18. Chen, G.; Thill, J.-C.; Anantsuksomsri, S.; Tontisirin, N.; Tao, R. Stand age estimation of rubber (Hevea brasiliensis) plantations using an integrated pixel- and object-based tree growth model and annual Landsat time series. ISPRS J. Photogramm. Remote Sens. 2018, 144, 94–104. [Google Scholar] [CrossRef]
  19. United Nations. Thai Agricultural Sector: From Problems to Solutions. Available online: https://thailand.un.org/en/103307-thai-agricultural-sector-problems-solutions (accessed on 1 October 2023).
  20. Talema, T.; Hailu, B.T. Mapping rice crop using sentinels (1 SAR and 2 MSI) images in tropical area: A case study in Fogera wereda, Ethiopia. Remote Sens. Appl. Soc. Environ. 2020, 18, 100290. [Google Scholar] [CrossRef]
  21. Ibrahim, E.S.; Rufin, P.; Nill, L.; Kamali, B.; Nendel, C.; Hostert, P. Mapping crop types and cropping systems in Nigeria with sentinel-2 imagery. Remote Sens. 2021, 13, 3523. [Google Scholar] [CrossRef]
  22. Maskell, G.; Chemura, A.; Nguyen, H.; Gornott, C.; Mondal, P. Integration of Sentinel optical and radar data for mapping smallholder coffee production systems in Vietnam. Remote Sens. Environ. 2021, 266, 112709. [Google Scholar] [CrossRef]
  23. Yin, L.; Ghosh, R.; Lin, C.; Hale, D.; Weigl, C.; Obarowski, J.; Zhou, J.; Till, J.; Jia, X.; You, N.; et al. Mapping smallholder cashew plantations to inform sustainable tree crop expansion in Benin. Remote Sens. Environ. 2023, 295, 113695. [Google Scholar] [CrossRef]
  24. Royal Thai Government. EEC Development Plan. Available online: https://www.eeco.or.th/en/government-initiative (accessed on 1 October 2023).
  25. Thai National Statistical Office. Demography Population and Housing Branch. Available online: http://statbbi.nso.go.th/staticreport/page/sector/en/01.aspx (accessed on 1 October 2023).
  26. Asian Development Bank. Climate Risk Country Profile: Thailand. Available online: https://www.adb.org/sites/default/files/publication/722251/climate-risk-country-profile-thailand.pdf (accessed on 1 October 2023).
  27. Thai Office of Agricultural Economics. Agricultural Statistics of Thailand; Thai Office of Agricultural Economics: Bangkok, Thailand, 2022; 224p. [Google Scholar]
  28. Baker, C.; Baker, C.J.; Phongpaichit, P. A History of Thailand; Cambridge University Press: Cambridge, UK, 2022. [Google Scholar]
  29. Thai Ministry of Commerce. Foreign Business Act Amendment. Available online: http://thailawforum.com/foreignbusinessactamendmentstranslation.html (accessed on 1 October 2023).
  30. Tontisirin, N.; Anantsuksomsri, S. Economic development policies and land use changes in Thailand: From the Eastern Seaboard to the Eastern Economic Corridor. Sustainability 2021, 13, 6153. [Google Scholar] [CrossRef]
  31. Sellers, P.J.; Tucker, C.J.; Collatz, G.J.; Los, S.O.; Justice, C.O.; Dazlich, D.A.; Randall, D.A. A revised land surface parameterization (SiB2) for atmospheric GCMs. Part II: The generation of global fields of terrestrial biophysical parameters from satellite data. J. Clim. 1996, 9, 706–737. [Google Scholar] [CrossRef]
  32. Wilson, B.T.; Knight, J.F.; McRoberts, R.E. Harmonic regression of Landsat time series for modeling attributes from national forest inventory data. ISPRS J. Photogramm. Remote Sens. 2018, 137, 29–46. [Google Scholar] [CrossRef]
  33. Zhou, Q.; Zhu, Z.; Xian, G.; Li, C. A novel regression method for harmonic analysis of time series. ISPRS J. Photogramm. Remote Sens. 2022, 185, 48–61. [Google Scholar] [CrossRef]
  34. Breiman, L. Random Forests. Mach. Learn. 2001, 45, 5–32. [Google Scholar] [CrossRef]
  35. Hultquist, C.; Chen, G.; Zhao, K. A Comparison of Gaussian Process Regression, Random Forests and Support Vector Regression for Burn Severity Assessment in Diseased Forests. Remote Sens. Lett. 2014, 5, 723–732. [Google Scholar] [CrossRef]
  36. Wang, S.; Azzari, G.; and Lobell, D.B. Crop type mapping without field-level labels: Random forest transfer and unsupervised clustering techniques. Remote Sens. Environ. 2019, 222, 303–317. [Google Scholar] [CrossRef]
  37. Story, M.; Congalton, R.G. Accuracy assessment: A user’s perspective. Photogramm. Eng. Remote. Sens. 1986, 52, 397–399. [Google Scholar]
  38. Goutte, C.; Gaussier, E. A probabilistic interpretation of precision, recall and F-score, with implication for evaluation. In Proceedings of the European Conference on Information Retrieval, Santiago de Compostela, Spain, 21–23 March 2005; Springer: Berlin/Heidelberg, Germany, 2005; pp. 345–359. [Google Scholar]
  39. Gumma, M.K.; Nelson, A.; Thenkabail, P.S.; Singh, A.N. Mapping rice areas of South Asia using MODIS multitemporal data. J. Appl. Remote Sens. 2011, 5, 053547. [Google Scholar] [CrossRef]
  40. Gumma, M.K.; Thenkabail, P.S.; Panjala, P.; Teluguntla, P.; Yamano, T.; Mohammed, I. Multiple agricultural cropland products of South Asia developed using Landsat-8 30 m and MODIS 250 m data using machine learning on the Google Earth Engine (GEE) cloud and spectral matching techniques (SMTs) in support of food and water security. GIScience Remote Sens. 2022, 59, 1048–1077. [Google Scholar] [CrossRef]
  41. Dong, J.; Xiao, X.; Menarguez, M.A.; Zhang, G.; Qin, Y.; Thau, D.; Biradar, C.; Moore, B., III. Mapping paddy rice planting area in northeastern Asia with Landsat 8 images, phenology-based algorithm and Google Earth Engine. Remote Sens. Environ. 2016, 185, 142–154. [Google Scholar] [CrossRef]
  42. Park, S.; Im, J.; Park, S.; Yoo, C.; Han, H.; Rhee, J. Classification and mapping of paddy rice by combining Landsat and SAR time series data. Remote Sens. 2018, 10, 447. [Google Scholar] [CrossRef]
  43. Wang, J.; Xiao, X.; Liu, L.; Wu, X.; Qin, Y.; Steiner, J.L.; Dong, J. Mapping sugarcane plantation dynamics in Guangxi, China, by time series Sentinel-1, Sentinel-2 and Landsat images. Remote Sens. Environ. 2020, 247, 111951. [Google Scholar] [CrossRef]
  44. Kamal, M.; Schulthess, U.; Krupnik, T.J. Identification of mung bean in a smallholder farming setting of coastal South Asia using manned aircraft photography and sentinel-2 images. Remote Sens. 2020, 12, 3688. [Google Scholar] [CrossRef]
  45. Soriano-González, J.; Angelats, E.; Martínez-Eixarch, M.; Alcaraz, C. Monitoring rice crop and yield estimation with Sentinel-2 data. Field Crops Res. 2022, 281, 108507. [Google Scholar] [CrossRef]
  46. Gumma, M.K.; Tummala, K.; Dixit, S.; Collivignarelli, F.; Holecz, F.; Kolli, R.N.; Whitbread, A.M. Crop type identification and spatial mapping using Sentinel-2 satellite data with focus on field-level information. Geocarto Int. 2022, 37, 1833–1849. [Google Scholar] [CrossRef]
  47. Khan, H.R.; Gillani, Z.; Jamal, M.H.; Athar, A.; Chaudhry, M.T.; Chao, H.; He, Y.; Chen, M. Early Identification of Crop Type for Smallholder Farming Systems Using Deep Learning on Time-Series. Sensors 2023, 23, 1779. [Google Scholar] [CrossRef] [PubMed]
  48. Song, W.; Feng, A.; Wang, G.; Zhang, Q.; Dai, W.; Wei, X.; Hu, Y.; Amankwah, S.O.Y.; Zhou, F.; Liu, Y. Bi-Objective Crop Mapping from Sentinel-2 Images Based on Multiple Deep Learning Networks. Remote Sens. 2023, 15, 3417. [Google Scholar] [CrossRef]
  49. NASA. Drought Hits Thailand. Available online: https://earthobservatory.nasa.gov/images/146293/drought-hits-thailand (accessed on 1 October 2023).
  50. Dutta, D.; Chen, G.; Chen, C.; Gagné, S.A.; Li, C.; Rogers, C.; Matthews, C. Detecting Plant Invasion in Urban Parks with Aerial Image Time Series and Residual Neural Network. Remote Sens. 2020, 12, 3493. [Google Scholar] [CrossRef]
  51. Khemanitthathai, S. Situation on Migrant Workers and Border Crossing during the COVID-19 Pandemic. Available online: https://mwgthailand.org/en/publication (accessed on 1 October 2023).
  52. Musikawong, S.; Jampaklay, A.; Khamkhom, N.; Tadee, R.; Kerdmongkol, A.; Buckles, L.; Khachasin, S.; Engblom, A. Working and Employment Conditions in the Agriculture Sector in Thailand: A Survey of Migrants Working on Thai Sugarcane, Rubber, Oil Palm and Maize Farms. p. 126. Available online: https://www.ilo.org/wcmsp5/groups/public/---asia/---ro-bangkok/documents/publication/wcms_844317.pdf (accessed on 1 October 2023).
  53. WHO. Fact or Fiction. Available online: https://www.who.int/southeastasia/outbreaks-and-emergencies/covid-19/What-can-we-do-to-keep-safe/fact-or-fiction (accessed on 1 October 2023).
  54. Yang, C. Cross-border expansion of digital platforms and transformation of the trade and distribution networks of imported fresh fruits from Southeast Asia to China. Glob. Netw. 2022, 22, 716–734. [Google Scholar] [CrossRef]
  55. Global Times. Thai Farmers Gear Up to Satisfy China’s Growing Appetite for “King of Fruits”. Available online: https://www.globaltimes.cn/page/202205/1265937.shtml?id=11 (accessed on 1 October 2023).
  56. Federal Reserve Bank of St. Louis. Federal Reserve Economic Data. Available online: https://fredhelp.stlouisfed.org (accessed on 1 October 2023).
  57. Bloomberg. Singapore Durian Lovers Rejoice as Prices Plunge on Surplus. Available online: https://www.bloomberg.com/news/articles/2023-06-22/singapore-s-durian-lovers-rejoice-as-prices-tumble-on-surplus (accessed on 1 October 2023).
  58. United Nations Office for Disaster Risk Reduction (UNDRR). Disaster Risk Reduction in Thailand, Status Report. 2020, p. 39. Available online: https://www.undrr.org/media/48642/download?startDownload=true (accessed on 1 October 2023).
  59. Ruensuk, N.; Rossopa, B.; Channu, C.; Paothong, K.; Prayoonsuk, N.; Rakchum, P.; Malumpong, C. Improving water use efficiency and productivity in rice crops by applying alternate wetting and drying with pregerminated broadcasting in farmers’ fields. Agric. Nat. Resour. 2021, 55, 119–130. [Google Scholar]
Figure 1. A farmland showing mixed cultivation of pineapple (low plants) and young rubber trees (photo credit: Gang Chen).
Remotesensing 16 01035 g001
Figure 2. The study area of Eastern Thailand, which consists of seven provinces: Chachoengsao, Chanthaburi, Chon Buri, Prachin Buri, Rayong, Sa Kaeo, and Trat. The Thai names in the backdrop image on the right figure represent locations and do not affect interpretation of field samples.
Remotesensing 16 01035 g002
Figure 3. (a1) A mature durian tree; (a2) durian fruit; (b1) a flooded rice paddy plantation; (b2) rice; (c1) a eucalyptus tree; (c2) eucalyptus tree seeds; (d1) an oil palm plantation; (d2) bright red foxtail palm fruit that grows on oil palm; (e1) a pineapple plantation; and (e2) pineapples. Please see the other five crop types in Figure 4.
Remotesensing 16 01035 g003
Figure 4. (f1) A sugarcane plantation; (f2) sugarcane; (g1) a cassava plantation; (g2) young cassava; (h1) a rubber plantation; (h2) a rubber tree that has been harvested for latex; (i1) a mangosteen tree; (i2) mangosteen; (j1) a coconut tree; and (j2) coconut seedlings.
Remotesensing 16 01035 g004
Figure 5. Research workflow of crop type mapping using high-resolution image time series over tropical smallholder farmlands.
Remotesensing 16 01035 g005
Figure 6. Sample time series observations and the corresponding fitted curves using harmonic regression for urban, forest, rice, durian, and rubber pixels.
Remotesensing 16 01035 g006
Figure 7. Producers’ and users’ accuracies and F1-scores for individual land cover types, including detailed crop types in the study area.
Remotesensing 16 01035 g007
Figure 8. Annual crop maps of Eastern Thailand from summer 2017 to summer 2023.
Remotesensing 16 01035 g008
Figure 9. Change of acreage of 10 main crop types in Eastern Thailand from summer 2017 to summer 2023.
Remotesensing 16 01035 g009
Figure 10. Left: A drone spraying pesticide. Right: Drone-captured NDVI of durian tree health monitoring, presented by a farmer. Photos taken in summer 2023 (credit: Gang Chen).
Remotesensing 16 01035 g010
Disclaimer/Publisher’s Note: The statements, opinions and data contained in all publications are solely those of the individual author(s) and contributor(s) and not of MDPI and/or the editor(s). MDPI and/or the editor(s) disclaim responsibility for any injury to people or property resulting from any ideas, methods, instructions or products referred to in the content.

