
Evaluation of Six Data Products of Surface Downward Shortwave Radiation in Tibetan Plateau Region
by
 , , and
Tianci Li
1,2,3,
Xiaozhou Xin
1,*,
Hailong Zhang
1,
Shanshan Yu
1,
Li Li
1,
Zhiqiang Ye
1,2,3,
Qinhuo Liu
1 and
and
He Cai
1,4 1
Aerospace Information Research Institute, Chinese Academy of Sciences, Beijing 100094, China
2
University of Chinese Academy of Sciences, Beijing 100101, China
3
College of Resources and Environment, University of Chinese Academy of Sciences, Beijing 101408, China
4
School of Computer Science and Engineering, Northeastern University, Shenyang 110167, China
*
Author to whom correspondence should be addressed.
Remote Sens. 2024, 16(5), 791; https://doi.org/10.3390/rs16050791
Submission received: 16 December 2023
/
Revised: 4 February 2024
/
Accepted: 15 February 2024
/
Published: 24 February 2024
Abstract
:The quantitative characterization of the thermal conditions in the Tibetan Plateau has long been a focal point of global research. Downward shortwave radiation, as a crucial component, plays an important role in numerous land surface processes while also serving as a significant indicator of the plateau’s thermal state. In order to gain a more comprehensive understanding of the Earth’s radiation budget in the Tibetan Plateau region, this study undertook an evaluation of six radiation products (ISCCP-FH, CERES-SYN, GLASS DSR, Himawari-8, MCD18A1, and ERA5). Two sets of ground measurements (downward shortwave radiation values from 10 CMA sites and 6 sites provided by the National Tibetan Plateau Data Center) in 2015 and 2016 were used as validation data to verify the accuracy of the remote sensing products. The results show that in the Tibetan Plateau region, CERESC products show the highest accuracy among the six data products with a bias (relative bias) of −7.57 W/m2 (3.46%), RMSE (relative RMSE) of 32.77 W/m2 (14.99%), and coefficient of determination of 0.80. Among all products, only the ERA5 products overestimated the value of downward shortwave radiation in the Tibetan Plateau region with a bias (relative bias) of 15.62 W/m2 (7.14%). By employing a spatial resolution upscaling approach, we assessed the influence of varying spatial resolutions on the validation accuracy, with the results indicating minimal impact. Through an analysis of the impact of cloud factors and aerosol factors on the validation accuracy, it is deduced that ERA5, Himawari-8, and MCD18A1 products are significantly influenced by cloud factors, whereas the CERES-SYN product is notably affected by aerosol factors.
1. Introduction
Downward shortwave radiation (DSR) refers to shortwave radiation transmitted from the top of the atmosphere to the surface. Solar radiation is subject to reflection, scattering, and absorption by atmospheric constituents during its transit through the atmosphere. DSR interacts with the atmosphere in the forms of sensible and latent heat, thereby influencing atmospheric circulation [1]. DSR plays a very important role in many land surface processes, which directly affect water vapor evaporation and plant photosynthesis, consequently affecting the water and carbon cycles [2,3,4]. The Tibetan Plateau (TP), encompassing an approximate area of 2.5 × 10⁶ km2 and featuring an average elevation exceeding 4000 m, is widely recognized as the “third pole” of the world [5,6]. The distinctive topographical features and atmospheric conditions of the Tibetan Plateau exert a profound influence on land–atmosphere interactions, particularly concerning the Asian monsoon, East Asian atmospheric circulation, and global climate change. As a result, the Tibetan Plateau has become a key region for global climate change studies and is recognized as a key driver and amplifier of global change dynamics [7,8,9].
Due to the critical importance of DSR and the unique characteristics of the Tibetan Plateau, an accurate estimation of this radiation in the region is imperative for advancing scientific understanding and modeling capabilities related to land and climate processes. Researchers globally have developed various DSR products [10,11,12,13,14]. To scientifically utilize these products in the Tibetan Plateau region, it is imperative to verify their accuracy by comparing them with ground-measured data. Yang et al. [15] assessed two satellite products (GEWEX-SRB and ISCCP-FD) of the surface radiation budget for highlands with Tibet instrumental data. It was found that the DSR of GEWEX-SRB was severely under-estimated for Tibet with an average of −48 W/m2 (−18%). For ISCCP-FD data, the DSR was estimated well, and its bias was an average of −10 W/m2 (−4%). Gui et al. [16] conducted a quality assessment and error analysis of the DSR components of GEWEX-SRB, ISCCP-FD, and CERES-FSW using data from 36 globally distributed stations (including several highland stations) and found that the CERES-FSW data have low accuracy with very small and a large RMSE. Zhang J et al. [17] analyzed the applicability of four global atmospheric reanalysis products, ERA5, ERA-Interim, CFSR, and MERRA2, and the product of CERES-SYN1deg, in mainland China by using the observation data from 91 China Meteorological Administration (CMA) radiation sites. Their results show that the overall accuracy of the ERA5 product is higher than those of the other reanalysis products in mainland China, but there is still a gap with the CERES remote sensing products. Zhang X et al. [18] evaluated four products, CERES-EBAF, GEWEX-SRB V3.0, UMD-SRB V3.3.3, and ISCCP-FD at GEBA [19] and CMA sites. The monthly DSR in CERES-FSW data showed the best performance among these four datasets, with overall correlation coefficients of 0.97 and 0.95 for GEBA and CMA, positive biases of 5.0 W/m2 and 8.1 W/m2, and RMSE values of 18.8 W/m2 and 20.5 W/m2. Yu et al. [20] validated the DSR data of Himawari-8 and CERES-SYN using data from 34 stations in East Asia, where the coefficients of determination were 0.92 and 0.87. The average root mean square error and average bias of the Himawari-8 DSR product were 24.1 W/m2 and 8.4 W/m2, while the CERES- SYN has an average root mean square error and average bias of 29.0 W/m2 and 7.3 W/m2. The Himawari-8 DSR product is better than the CERES-SYN product in terms of accuracy and spatial and temporal resolution.
In the current landscape, updated versions of various DSR products have been introduced, incorporating enhanced input data and algorithms. Consequently, there arises a pressing need for a fresh, comprehensive accuracy validation specific to the Tibetan Plateau region. The sparse distribution of China Meteorological Administration (CMA) sites in this region has posed a challenge, limiting the ability of previous validation results to fully capture its unique characteristics. To address this limitation, this study utilized the long-term (2005–2016) dataset of hourly integrated land–atmosphere interaction observations [21] from the National Tibetan Plateau Data Center, compensating for the lack of CMA stations in the southern and western parts of the region.
This study validated six DSR products (ISCCP-FH [11,12], CERES-SYN [22,23], GLASS DSR [14,24], Himawari-8 [13], MCD18A1 [25], and ERA5 [26]) using ground measurement data from 10 CMA sites and 6 sites provided by the National Tibetan Plateau Data Center. This article was structured to first describe data and validation methods (Section 2), present validation results (Section 3), analyze factors influencing accuracy (Section 4), and finally, summarize conclusions (Section 5). The proposed approach aims to contribute to a deeper understanding of the accuracy of DSR products in the Tibetan Plateau region.
2. Materials and Methods
2.1. Materials
2.1.1. Ground Measurements
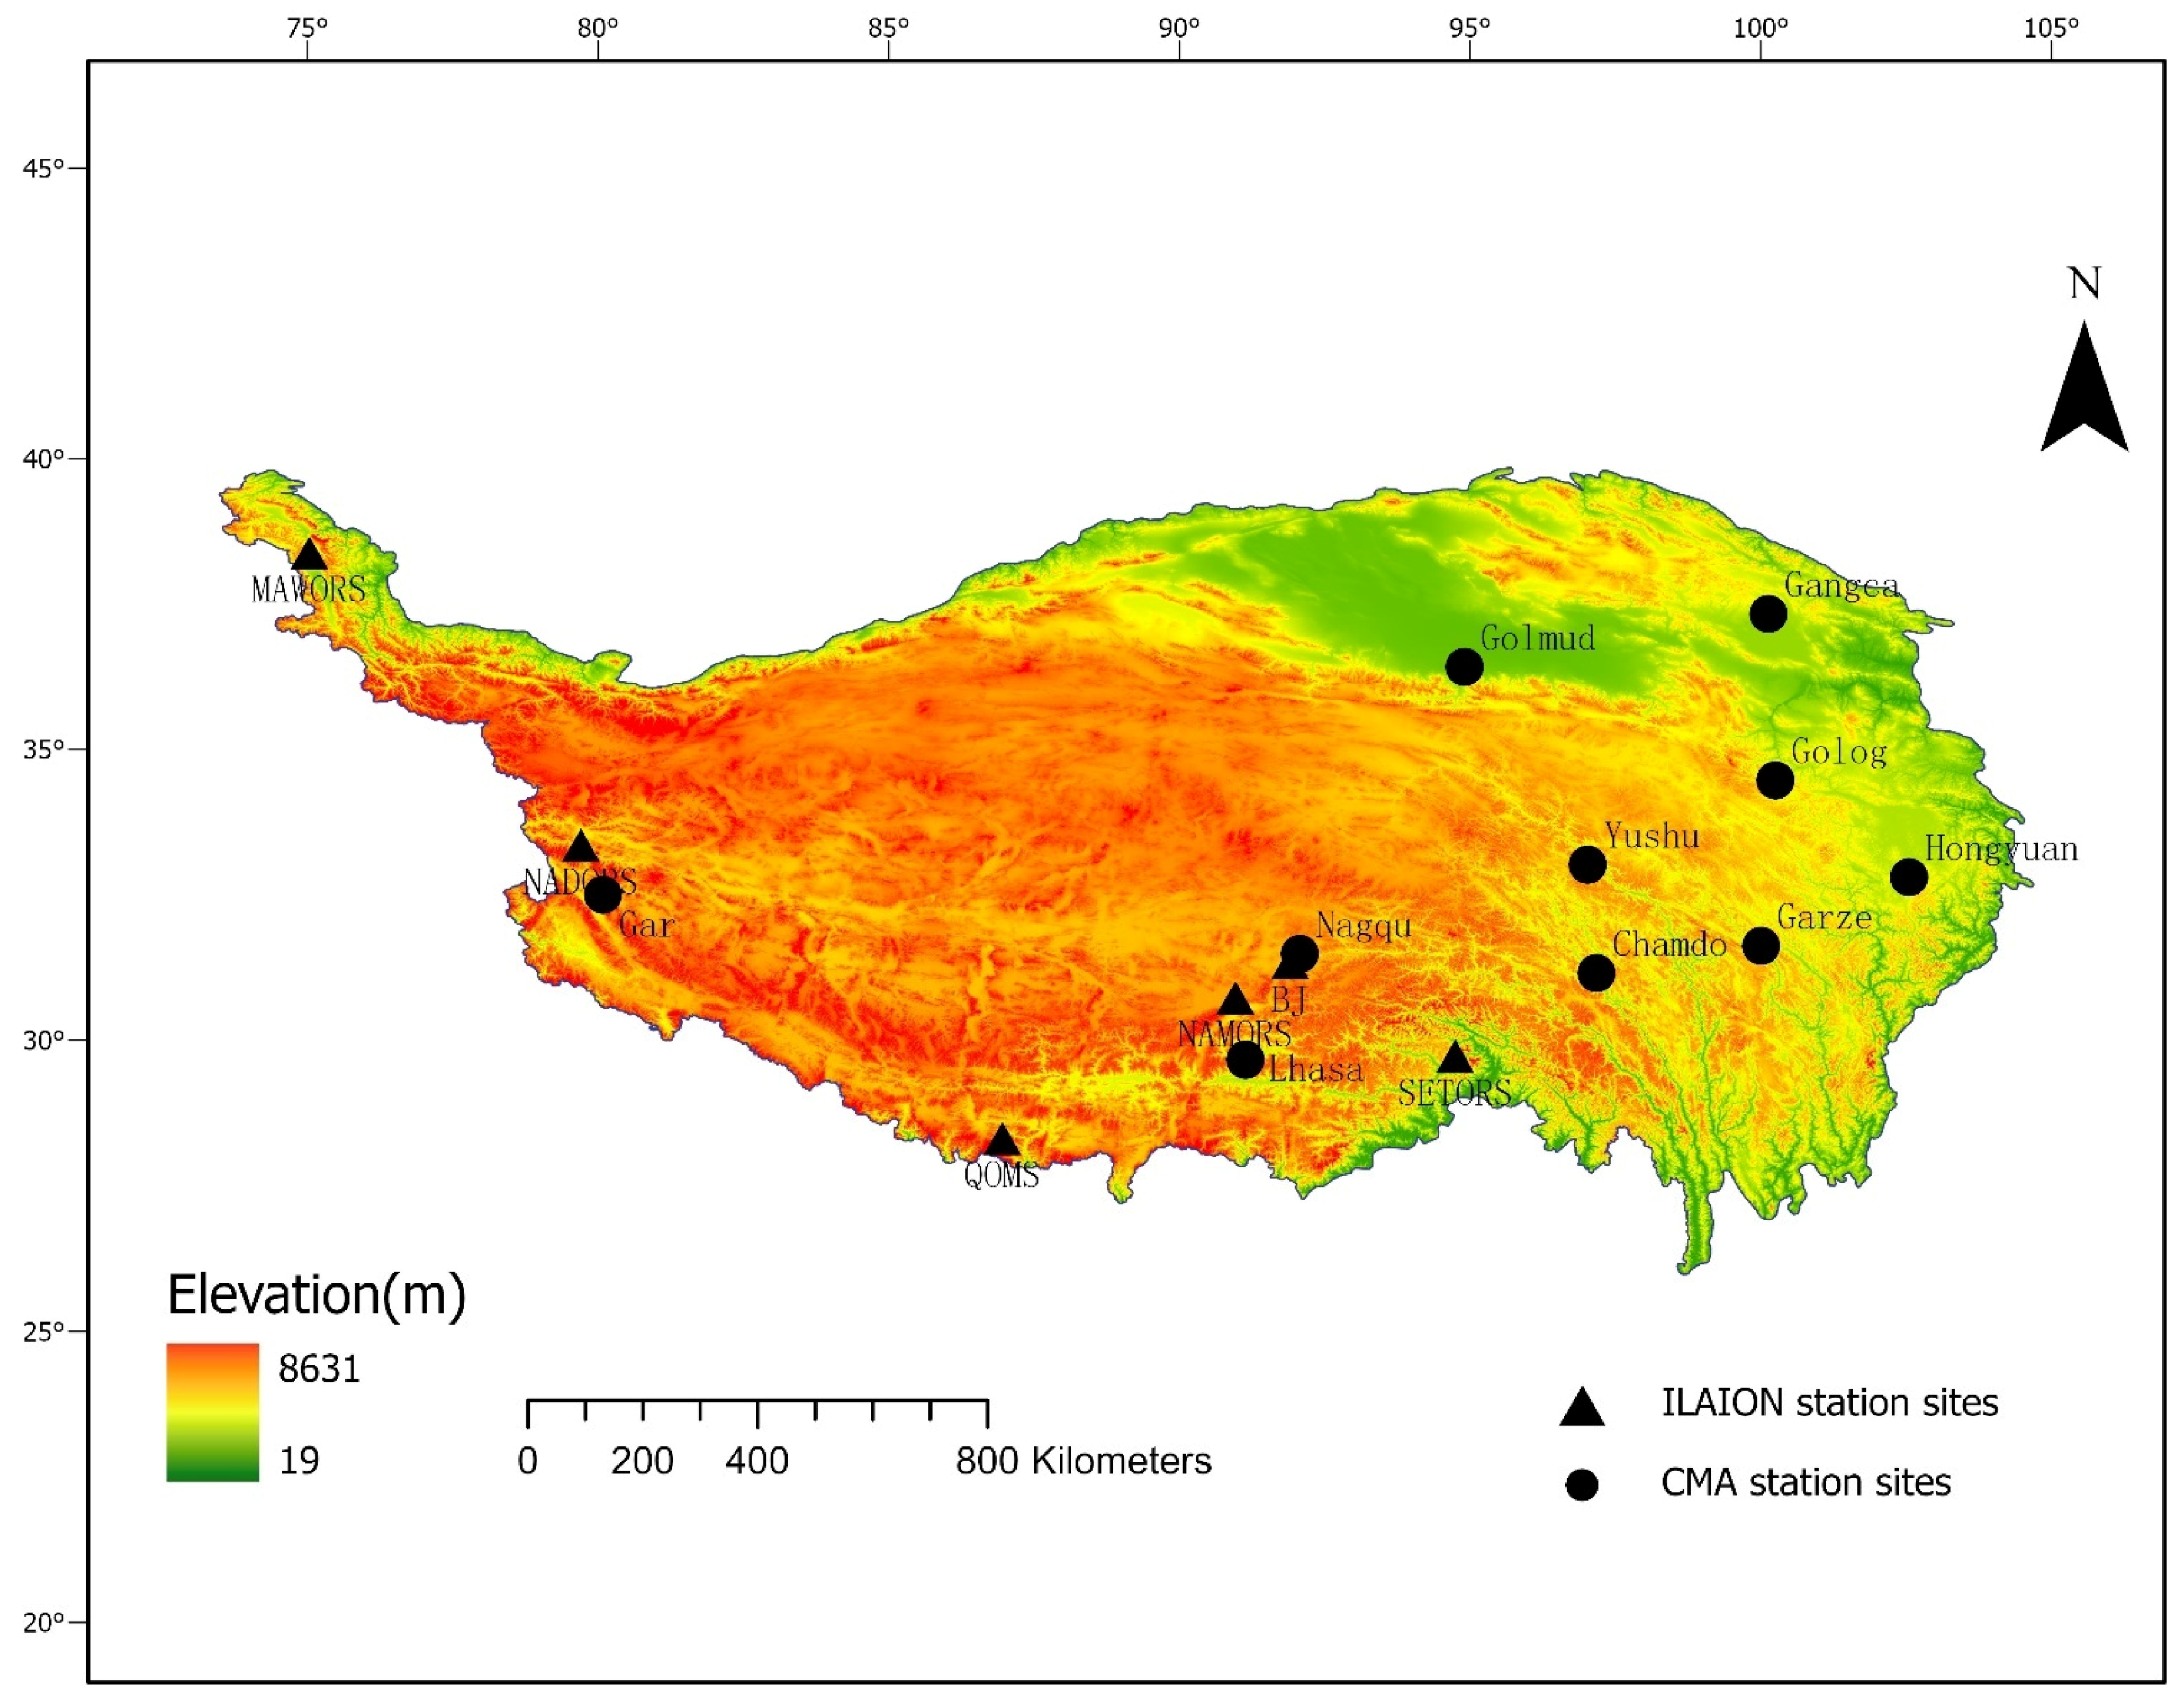
The ground measurements of DSR used in this study were supplied by the CMA Meteorological Information Center and the National Tibetan Plateau Data Center. The first sets consist of daily radiation observations measured at 10 CMA radiation stations, indicated by black circles in Figure 1. Although the pyrometers used for global radiation measurements at the CMA radiation stations are calibrated through a series of standard procedures, the radiation observations collected at the CMA stations often contain some suspicious values, which may be due to improper instrument operation and/or instrument defects [27,28,29]. In order to reduce the uncertainty caused by suspicious radiation data, this study employed a physical threshold test to exclude spurious and erroneous measurements.
The second sets were the radiation component of the long-term (2005–2016) dataset of hourly integrated land–atmosphere interaction observations on the Tibetan Plateau provided by the National Tibetan Plateau Data Center, which are abbreviated as ILAION in this paper, indicated by black triangles in Figure 1. Long-term, high-quality, high temporal resolution observations of the Tibetan Plateau are not only extremely scarce, but also important for gaining insight into key surface processes. This dataset provides the most comprehensive and high-quality continuous in situ observations with the highest temporal resolution (hourly) to date, compared to previous open access daily meteorological observations over the Tibetan Plateau. As such, these fine-resolution data products can be used to quantify the uncertainties in satellite and model products, assess the biases and gaps that exist between model simulations and reality, and contribute to the development and improvement of models of surface processes in the Tibetan Plateau.
2.1.2. DSR Products
The DSR products to be validated in this paper consist of five remote sensing products, including two coarse-resolution gridded products (ISCCP-FH, CERES-SYN), three kilometer-scale products (GLASS DSR, Himawari-8, MCD18A1), and one reanalysis product (ERA5). The details of the above radiation products are shown below and are summarized in Table 1.
- (1)
- ISCCP-FH products
The ISCCP, International Satellite Cloud Climatology Project, is the first sub-program of the World Climate Research Program (WCRP). The ISCCP-H series of shortwave radiance products are results from a 110 km equal-area global network acquired every three hours. The ISCCP-FH products contain longwave (5.0–200.0 μm) and shortwave (0.2–5.0 μm) radiative flux datasets for all-sky, clear, and cloudy (overcast) skies, as well as the input data used for flux calculations. The core of the algorithm used for this dataset is the correlated K-distribution method described by Hansen et al. [30] for the radiative transfer models of the NASA Goddard Institute for Space Studies (GISS) GCM models I and II. The input dataset is the ISCCP H-series data products from weather and polar-orbiting satellite sensors.
- (2)
- CERES-SYN products
The Clouds and the Earth’s Radiant Energy System (CERES) is a key component of the Earth Observing System (EOS) program. The SYN1deg Ed4A product is designed to provide the highest temporal resolution TOA and surface flux datasets by incorporating hourly GEO imager data and utilizing additional GEO imager channels to improve cloud attribute retrieval, the computation of surface fluxes, and GEO-derived TOA fluxes. CERES-syn products are computed from a two-stream radiation code containing 15 shortwave bands and 12 longwave bands, known as the “Langley Fu-Liou code”. CERES provides shortwave radiation data from 2000 to the present, with temporal resolution products for every 1 h, every 3 h, daily and monthly averages, and a spatial resolution of 1 degree.
- (3)
- GLASS DSR products
The GLASS DSR (v1.0) was developed based on an improved LUT method using data from multiple polar-orbiting and geostationary satellites. Due to the time-consuming processing and the generation of long-term DSR products using these data, the GLASS DSR product (V2.0) was generated from MODIS TOA reflectance based on a direct estimation method [24]. GLASS DSR (V2.0) currently provides shortwave radiation data from 2000 to 2020 with a temporal resolution of 3 h and a spatial resolution of 5 km.
- (4)
- Himawari-8 products
Himawari-8 is a new generation of geostationary meteorological satellites equipped with state-of-the-art optical sensors. The shortwave radiation parameterization method used in the Himawari-8 DSR products are based on the work of Frouin and Murakami [13]. The algorithm employs the theory of plane-parallel radiative transfer, treats the effects of a clear atmosphere and clouds separately, and assumes that the planetary atmosphere can be modeled as a clear atmosphere, located above the clouds. It performs a full disk scan of the hemispheric region including the Pacific Ocean with a spatial resolution of 1 km in Japan (Rectangular area: 24°N–50°N, 123°E–150°E) and 5 km in other regions and a temporal resolution of 10 min.
- (5)
- MCD18A1 products
MCD18A1 version 6.1 is a Moderate Resolution Imaging Spectroradiometer (MODIS) Terra and Aqua combination Downward Shortwave Radiation (DSR) gridded level 3 product that generates daily DSR estimates every 3 h at a resolution of 1 km pixels. The MCD18 products are based on a prototype algorithm that utilizes multi-temporal features of MODIS data to derive surface reflectance, and then calculates incident DSR using a look-up table (LUT) method that accounts for different types of aerosol and cloud loadings under various illumination/observation geometries. Global DSR products are generated from MODIS and geostationary satellite data.
- (6)
- ERA5 reanalysis data
ERA5 is the fifth generation of ECMWF reanalysis used to analyze global climate and weather over the past 80 years. Data that are available from 1940.ERA5 superseded the ERA-Interim reanalysis. The reanalysis uses the laws of physics to combine model data with observations from all over the world to form a globally complete and consistent dataset, based on a principle called data assimilation. The shortwave radiation products in the ERA5 reanalysis have a spatial resolution of 0.25 degrees and a temporal resolution of 1 h.
2.2. Methods
2.2.1. Temporal Matching of Different Products
The validation and comparison in this paper involves DSR data from the two ground datasets and six products mentioned above. All six products were validated against the ground-based measurements to verify their accuracy. It should be noted that the temporal resolutions of the radiation products used in this validation include instantaneous, 1 h, 3 h, and daily averages, and the spatial resolution ranges from 1 km to 1°. Therefore, dealing with the various temporal and spatial matches of the different products and ensuring that all the data being compared are inherently comparable were important steps in this study.
Since the temporal resolution of the CMA sites is daily, in this study, all products were compared on a daily average scale. For the 1 h and 3 h averaged products, radiation samples with daily resolution were generated through a simple averaging process. The instantaneous data were organized by extracting the nearest surface radiation based on the instantaneous time of the corresponding radiation product. For the 3 h instantaneous data (MCD18A1, ISCCP-FH), the average of the eight 3 h instantaneous data points is used as the daily average. For the spatial resolution, in this study, remotely sensed DSR values at the original grid scale were directly compared with ground measurements in the comparison process.
2.2.2. Data Quality Control
For the CMA radiation dataset, despite its series of normalized calibrations for the DFY-4 thermopile total radiometer (which measures DSR at the surface), resulting in its nominal data measurement accuracy within 5% [31], several studies [32,33] point out that there are systematic errors in these data due to instrumental and technical problems. Since the quality of the measured data at ground stations affects the validation results of the surface DSR data products, it is important to perform additional data quality control work on the CMA radiation dataset to exclude observations that are of questionable quality before carrying out specific validation work.
In this study, the BSRN quality checking method [34] was used to process the CMA radiation dataset comprising two processing steps named the “physically possible” procedure and the “extremely rare” procedure. The “physically possible” procedure aims at detecting extremely large errors in the DSR data. The DSR data falling in the intervals defined as follows are considered “physically possible”:
The limits in the “extremely rare” procedure are narrower than those of the “physically possible” test. DSR data that violate these limits may occur over very short time periods under very rare conditions. These limits are as follows:
where the DSR is the ground truth, is the solar constant, and μ is the cosine solar zenith angle.
Surface-measured data records that lie outside the physically possible intervals and within the extremely rare intervals were then excluded in this study.
2.2.3. Evaluation Indicators
In this study, five evaluating indicators were selected for validating the accuracy of different datasets: bias (bias), relative bias (rbias), root mean square error (RMSE), relative root mean square error (rRMSE) and the coefficient of determination (), and each indicator is defined as follows:
where is the radiation product value; is the ground radiation measurements; is the average of ground radiation measurements; and n is the total number of samples.
3. Results
After the data processing in Section 2, the accuracies of the DSR products were validated against the quality-controlled ground-based observations. In this study, the data of 2015 and 2016 were selected for comparisons at the original spatial resolution and daily average scale. Five indicators, including bias (bias), relative bias (rbias), root mean square error (RMSE), relative root mean square error (rRMSE) and the coefficient of determination () were used as the accuracy validation indices. In order to compare the accuracies of different products in an intuitive and comprehensive way, this study compared the overall accuracy of all products and the distribution of accuracy at different sites.
3.1. Overall Validation Results
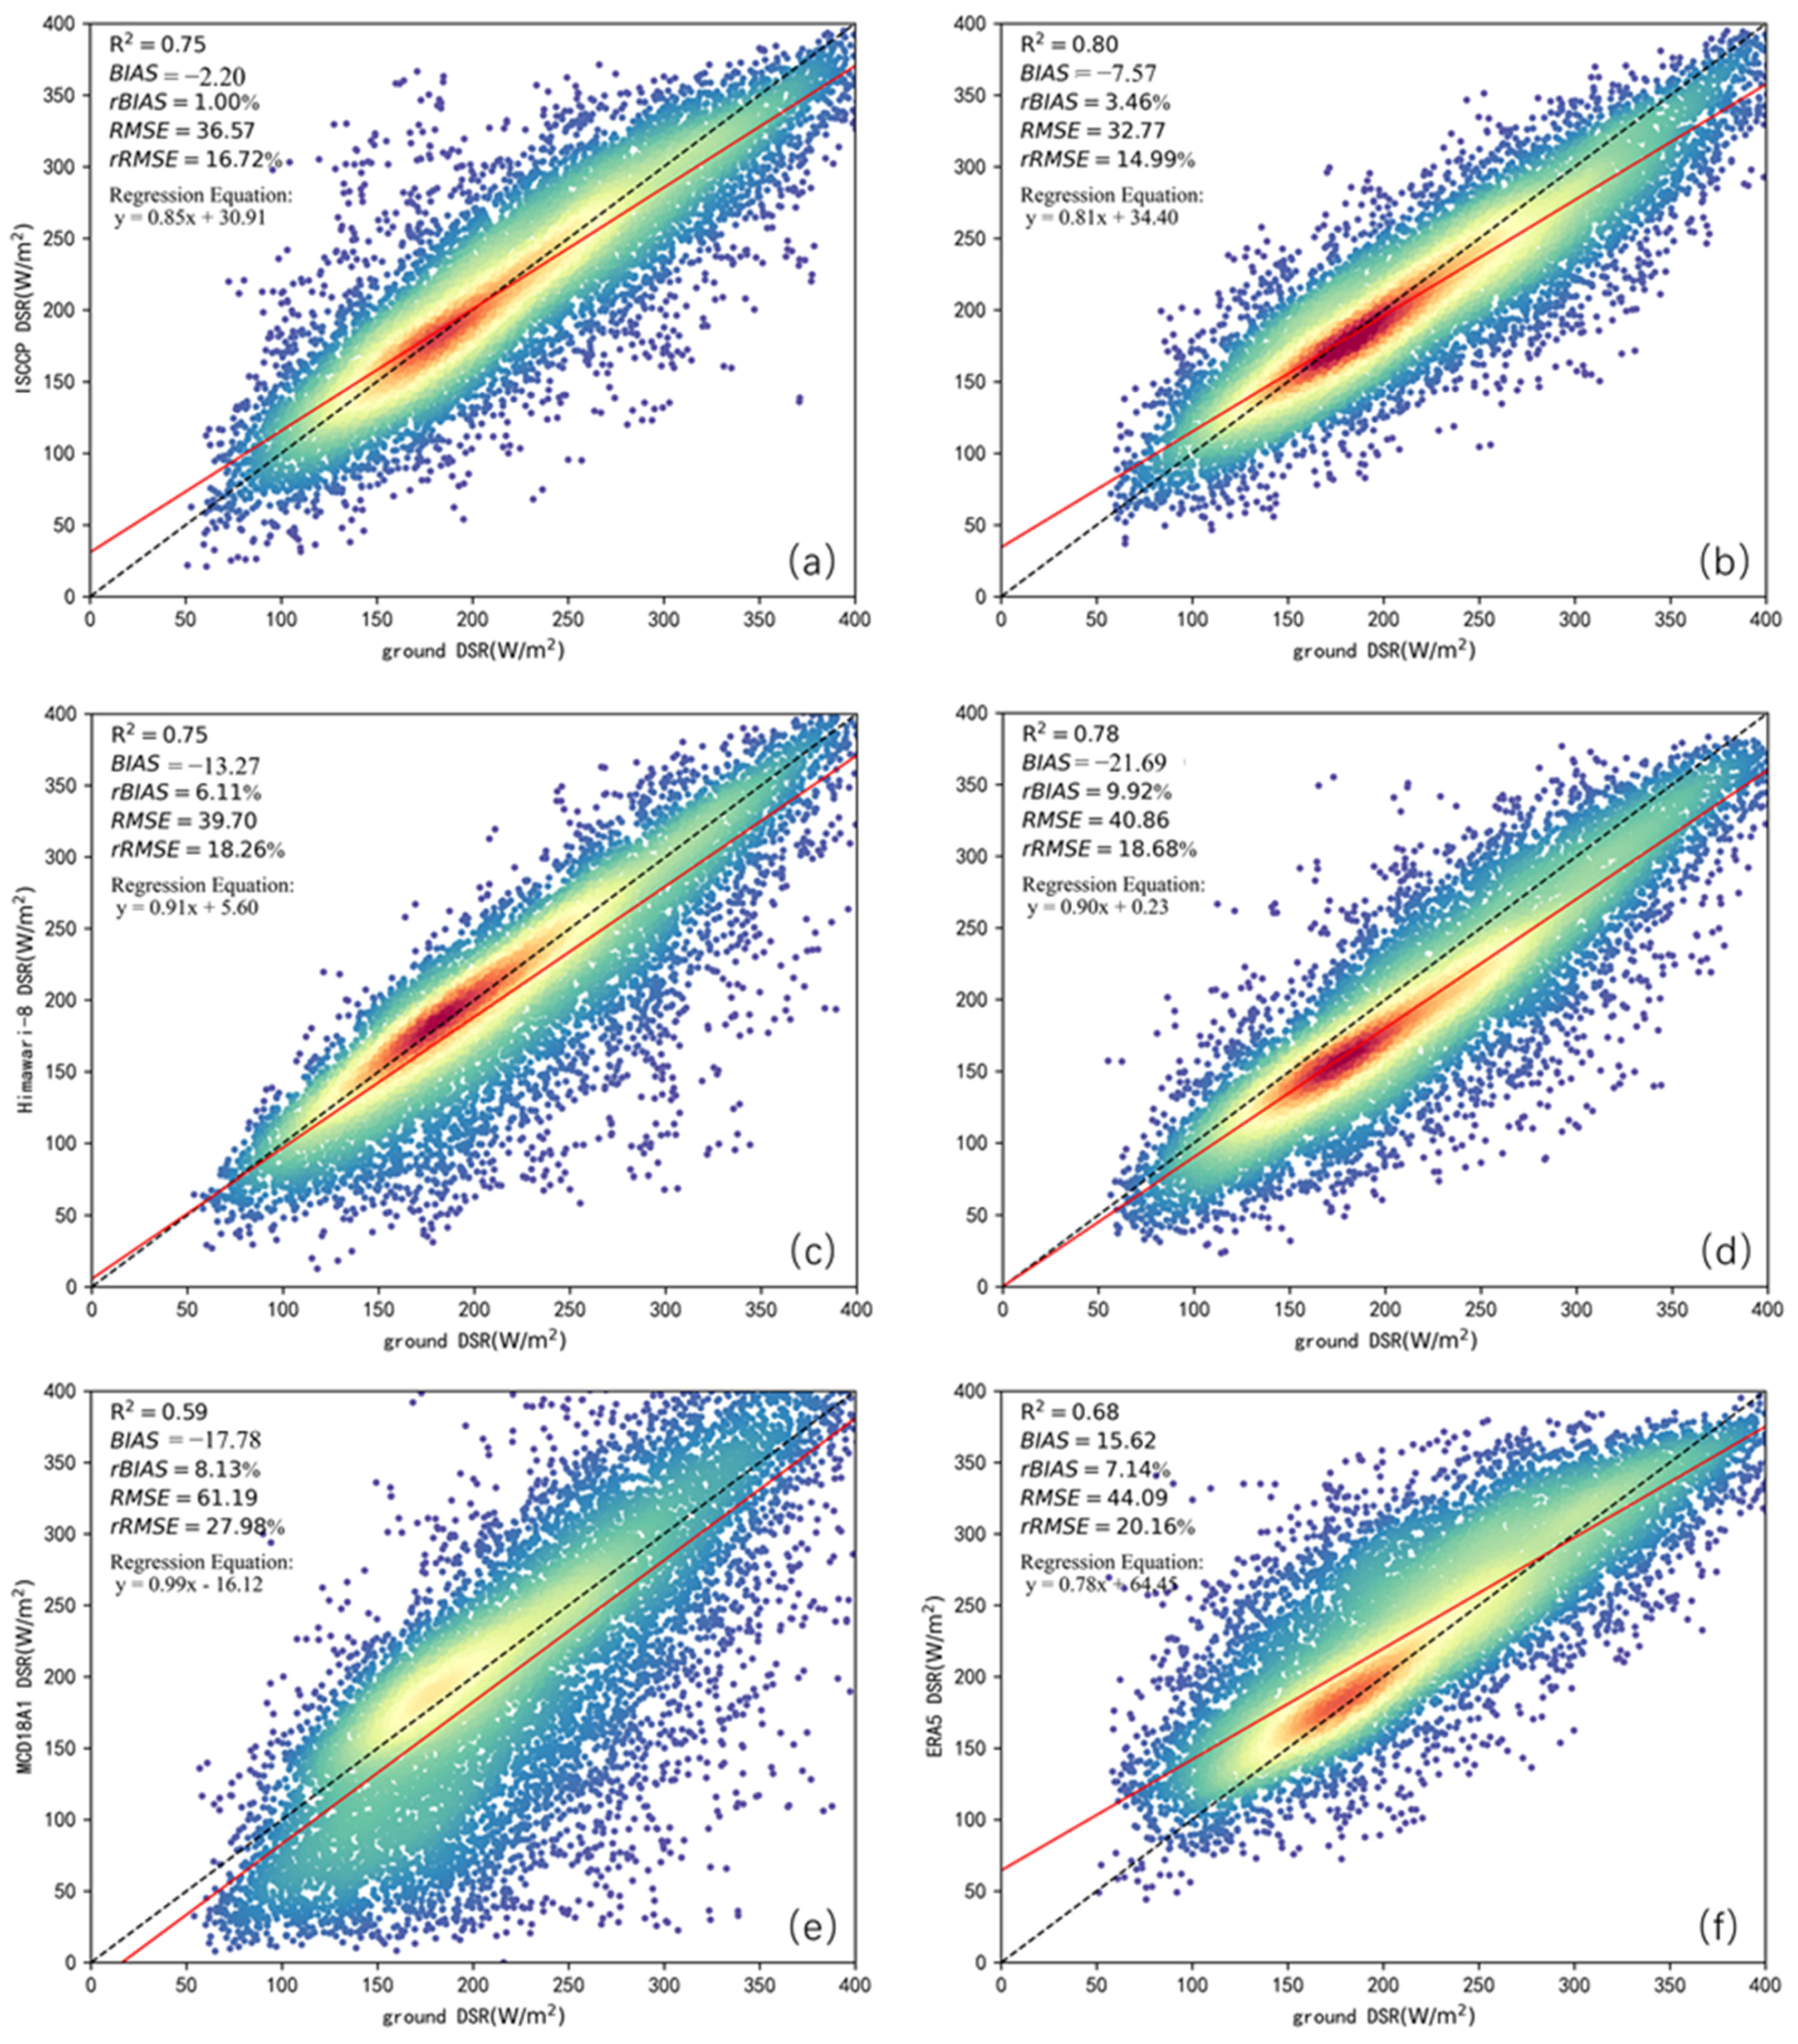
A comparison of daily DSR between remote sensing products and ground measurements is shown in Figure 2, where the warm colors represent high-density point clusters, and the cool colors represent low-density point clusters.
As can be seen in Figure 2, all the data exhibit varying degrees of underestimation, except for the ERA5 data, which exhibit a significant overestimation of the daily average DSR. Underestimation is most obvious for the GLASS and MCD18A1 data, with biases (relative bias) of the validation results of −21.69 W/m2 (9.92%) and −17.78 W/m2 (8.13%), while the ISCCP and CERES data show slight underestimation, with biases (relative bias) of the validation results of −2.20 W/m2 (1.00%) and −7.57 W/m2 (3.46%), respectively. In general, the CERES data demonstrated the highest accuracy among the six data products, with the smallest root mean square error and relative mean square error (32.77 W/m2, 14.99%) and the highest coefficient of determination (0.80). The ERA5 and MCD18A1 data have the worst accuracy performance among these six data products, with root mean square errors (relative RMSE) of 44.09 W/m2 (20.16%) and 61.19 W/m2 (27.98%) and coefficients of determination of 0.68 and 0.59. The aforementioned assertion is further substantiated by the observation that the distribution of point pairs in the plots of Figure 2e,f demonstrate a heightened degree of dispersion.
It is essential to note that these findings contribute to our understanding of the discrepancies between remote sensing and ground-based measurements of DSR, emphasizing the importance of careful consideration and validation when utilizing such dataset in scientific analyses.
3.2. Monthly Variations of Validation Results
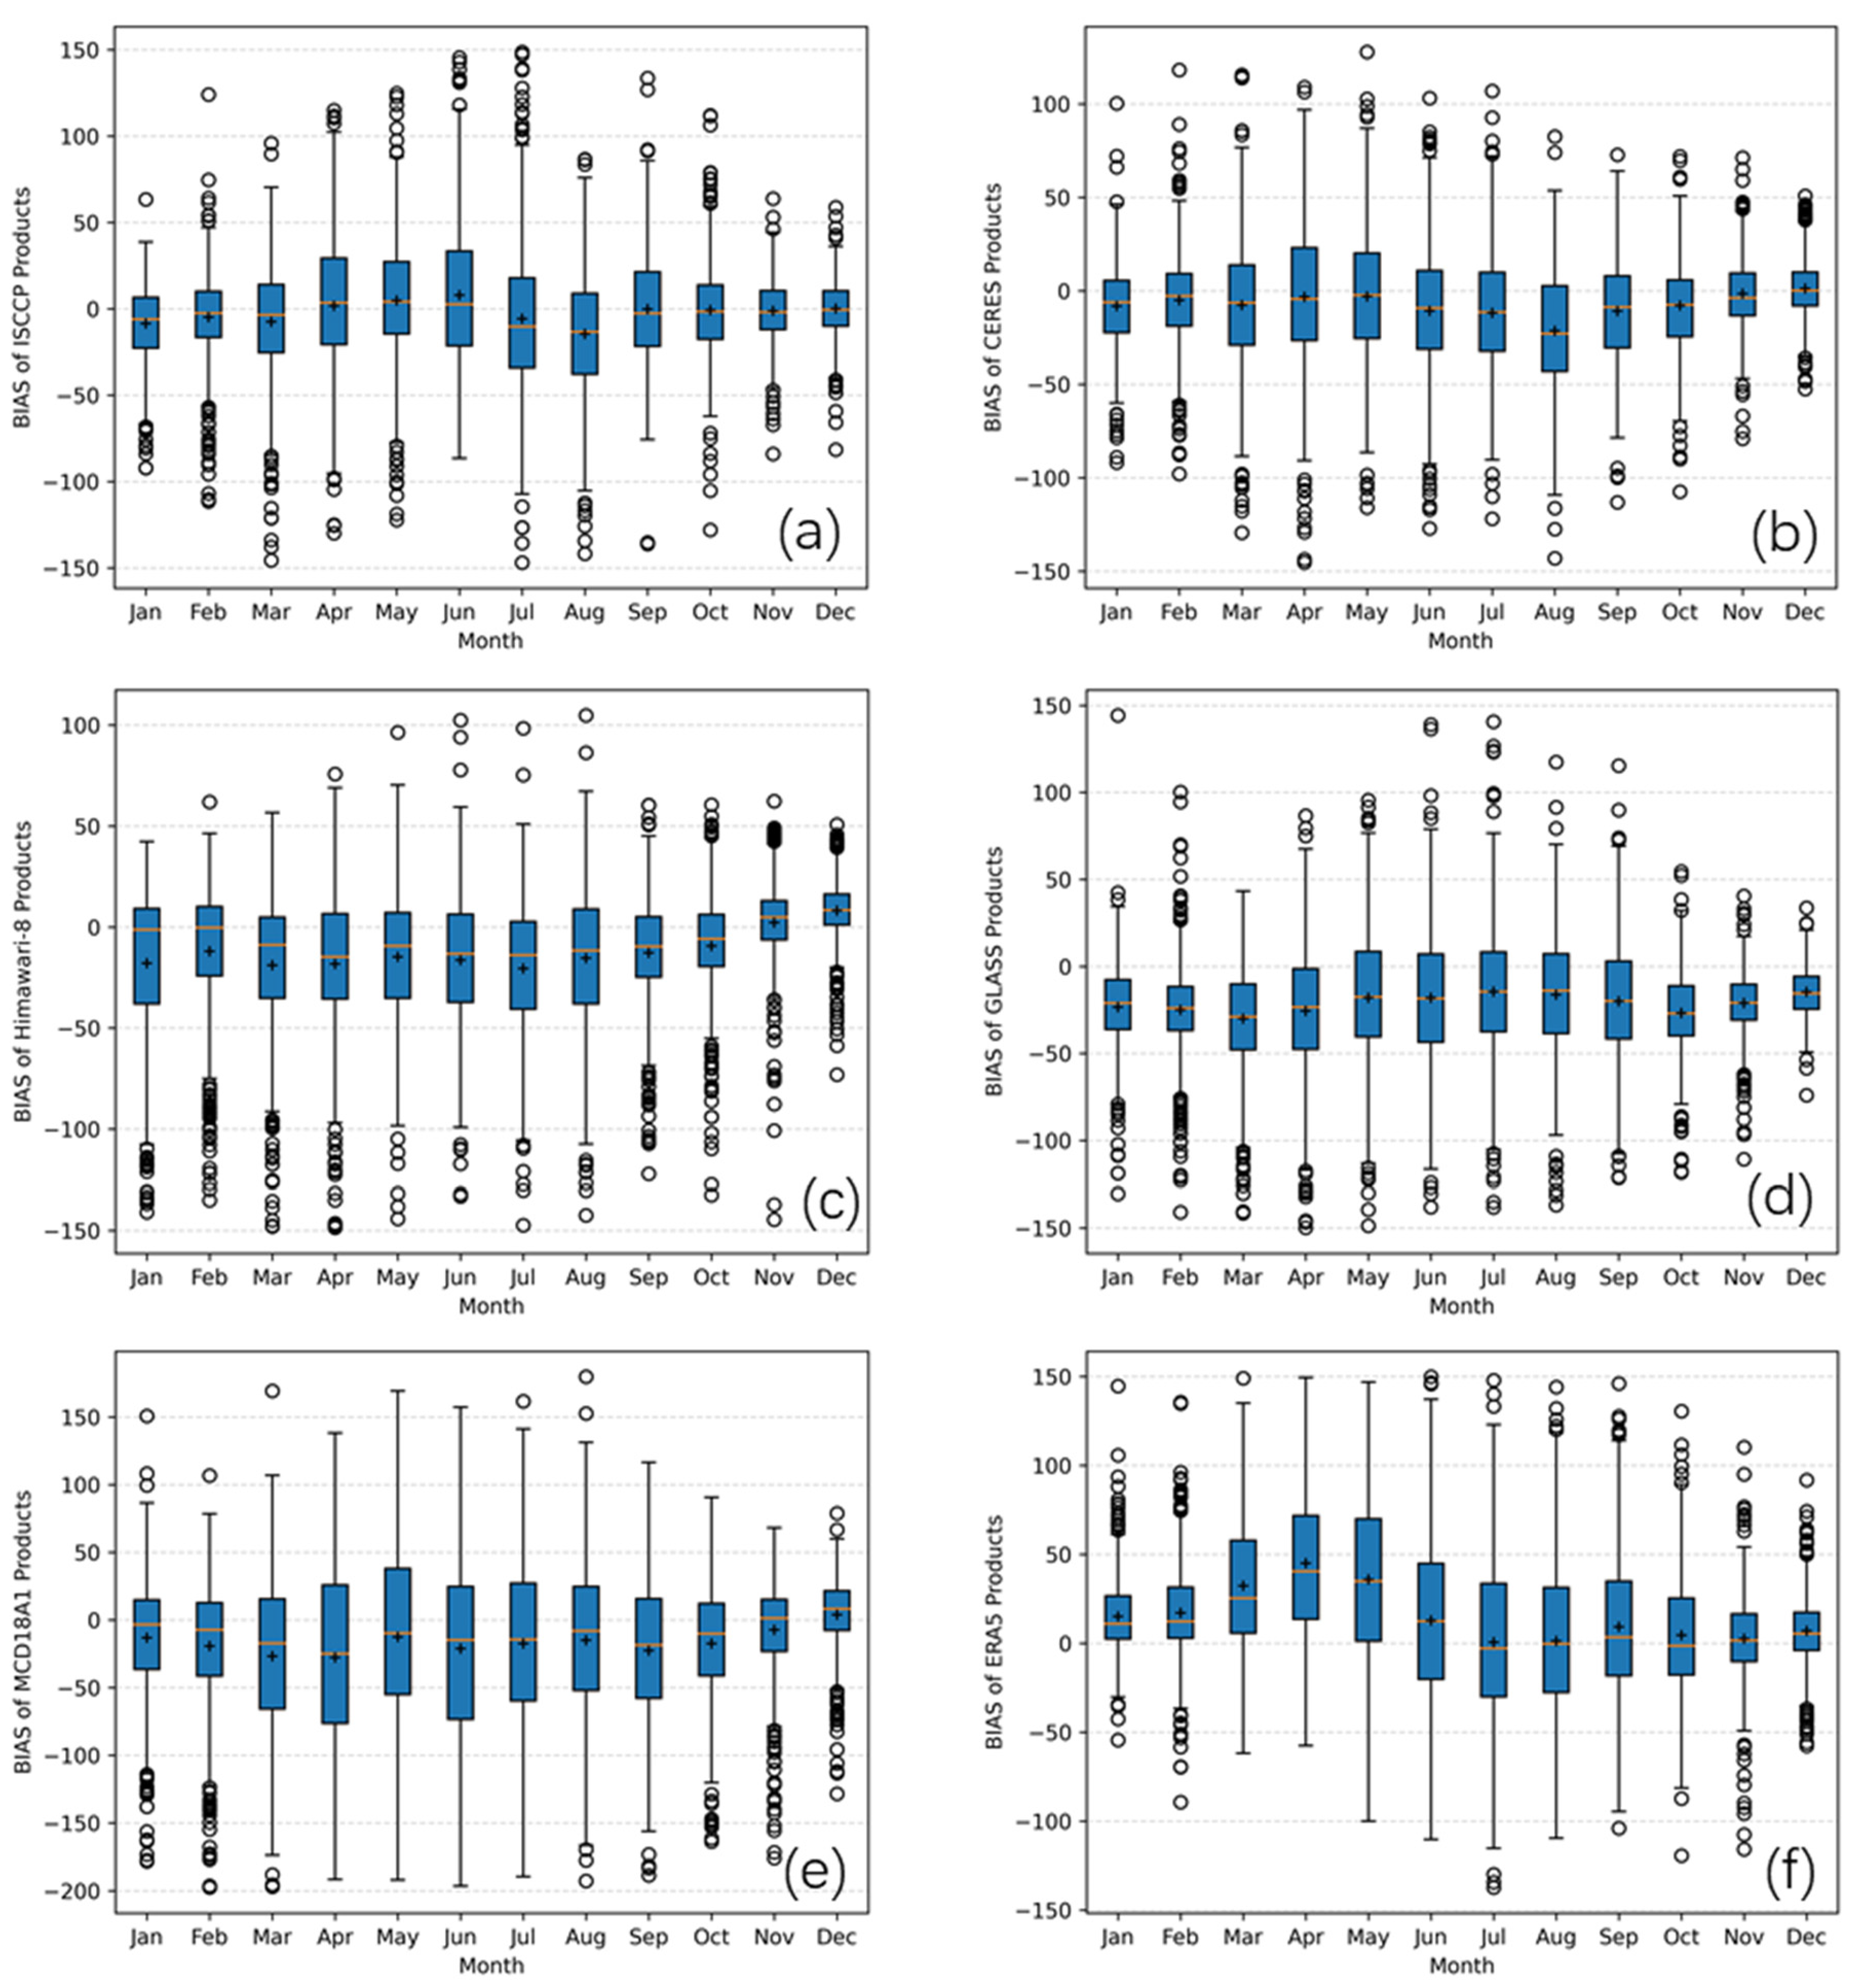
In this section, we statistically analyze the bias index of the daily DSR for each product. The results are depicted through monthly and quarterly boxplots in Figure 3a–e. As can be seen in Figure 3, the ISCCP and CERES products have the largest errors in July and August, and Himawari-8, GLASS, MCD18A1, and ERA5 have the largest errors in March and April, which are manifested by the mean values being furthest from the zero axis.
In the Tibetan plateau region, broadly speaking, the temporal classification aligns with meteorological seasons, designating March/April/May as spring, June/July/August as summer, October/September/November as autumn, and December/February as winter. Hence, it can be inferred that the validation accuracies of these six radiation products arecomparatively lower during the spring and summer seasons as opposed to the autumn and winter seasons.
Furthermore, it is conspicuously clear that these products exhibit a broader spectrum of validation bias fluctuations during the spring and summer months, as indicated by the extended length of the respective boxes. This phenomenon arises from the enrichment of aerosols in the Tibetan Plateau region during the spring and the frequent occurrence of cloud and precipitation activities attributable to the summer monsoon. These findings contribute to a deeper understanding of the temporal and seasonal variations in the validation accuracy and bias of the studied radiation products.
3.3. Spatial Distribution of Validation Results across Sites
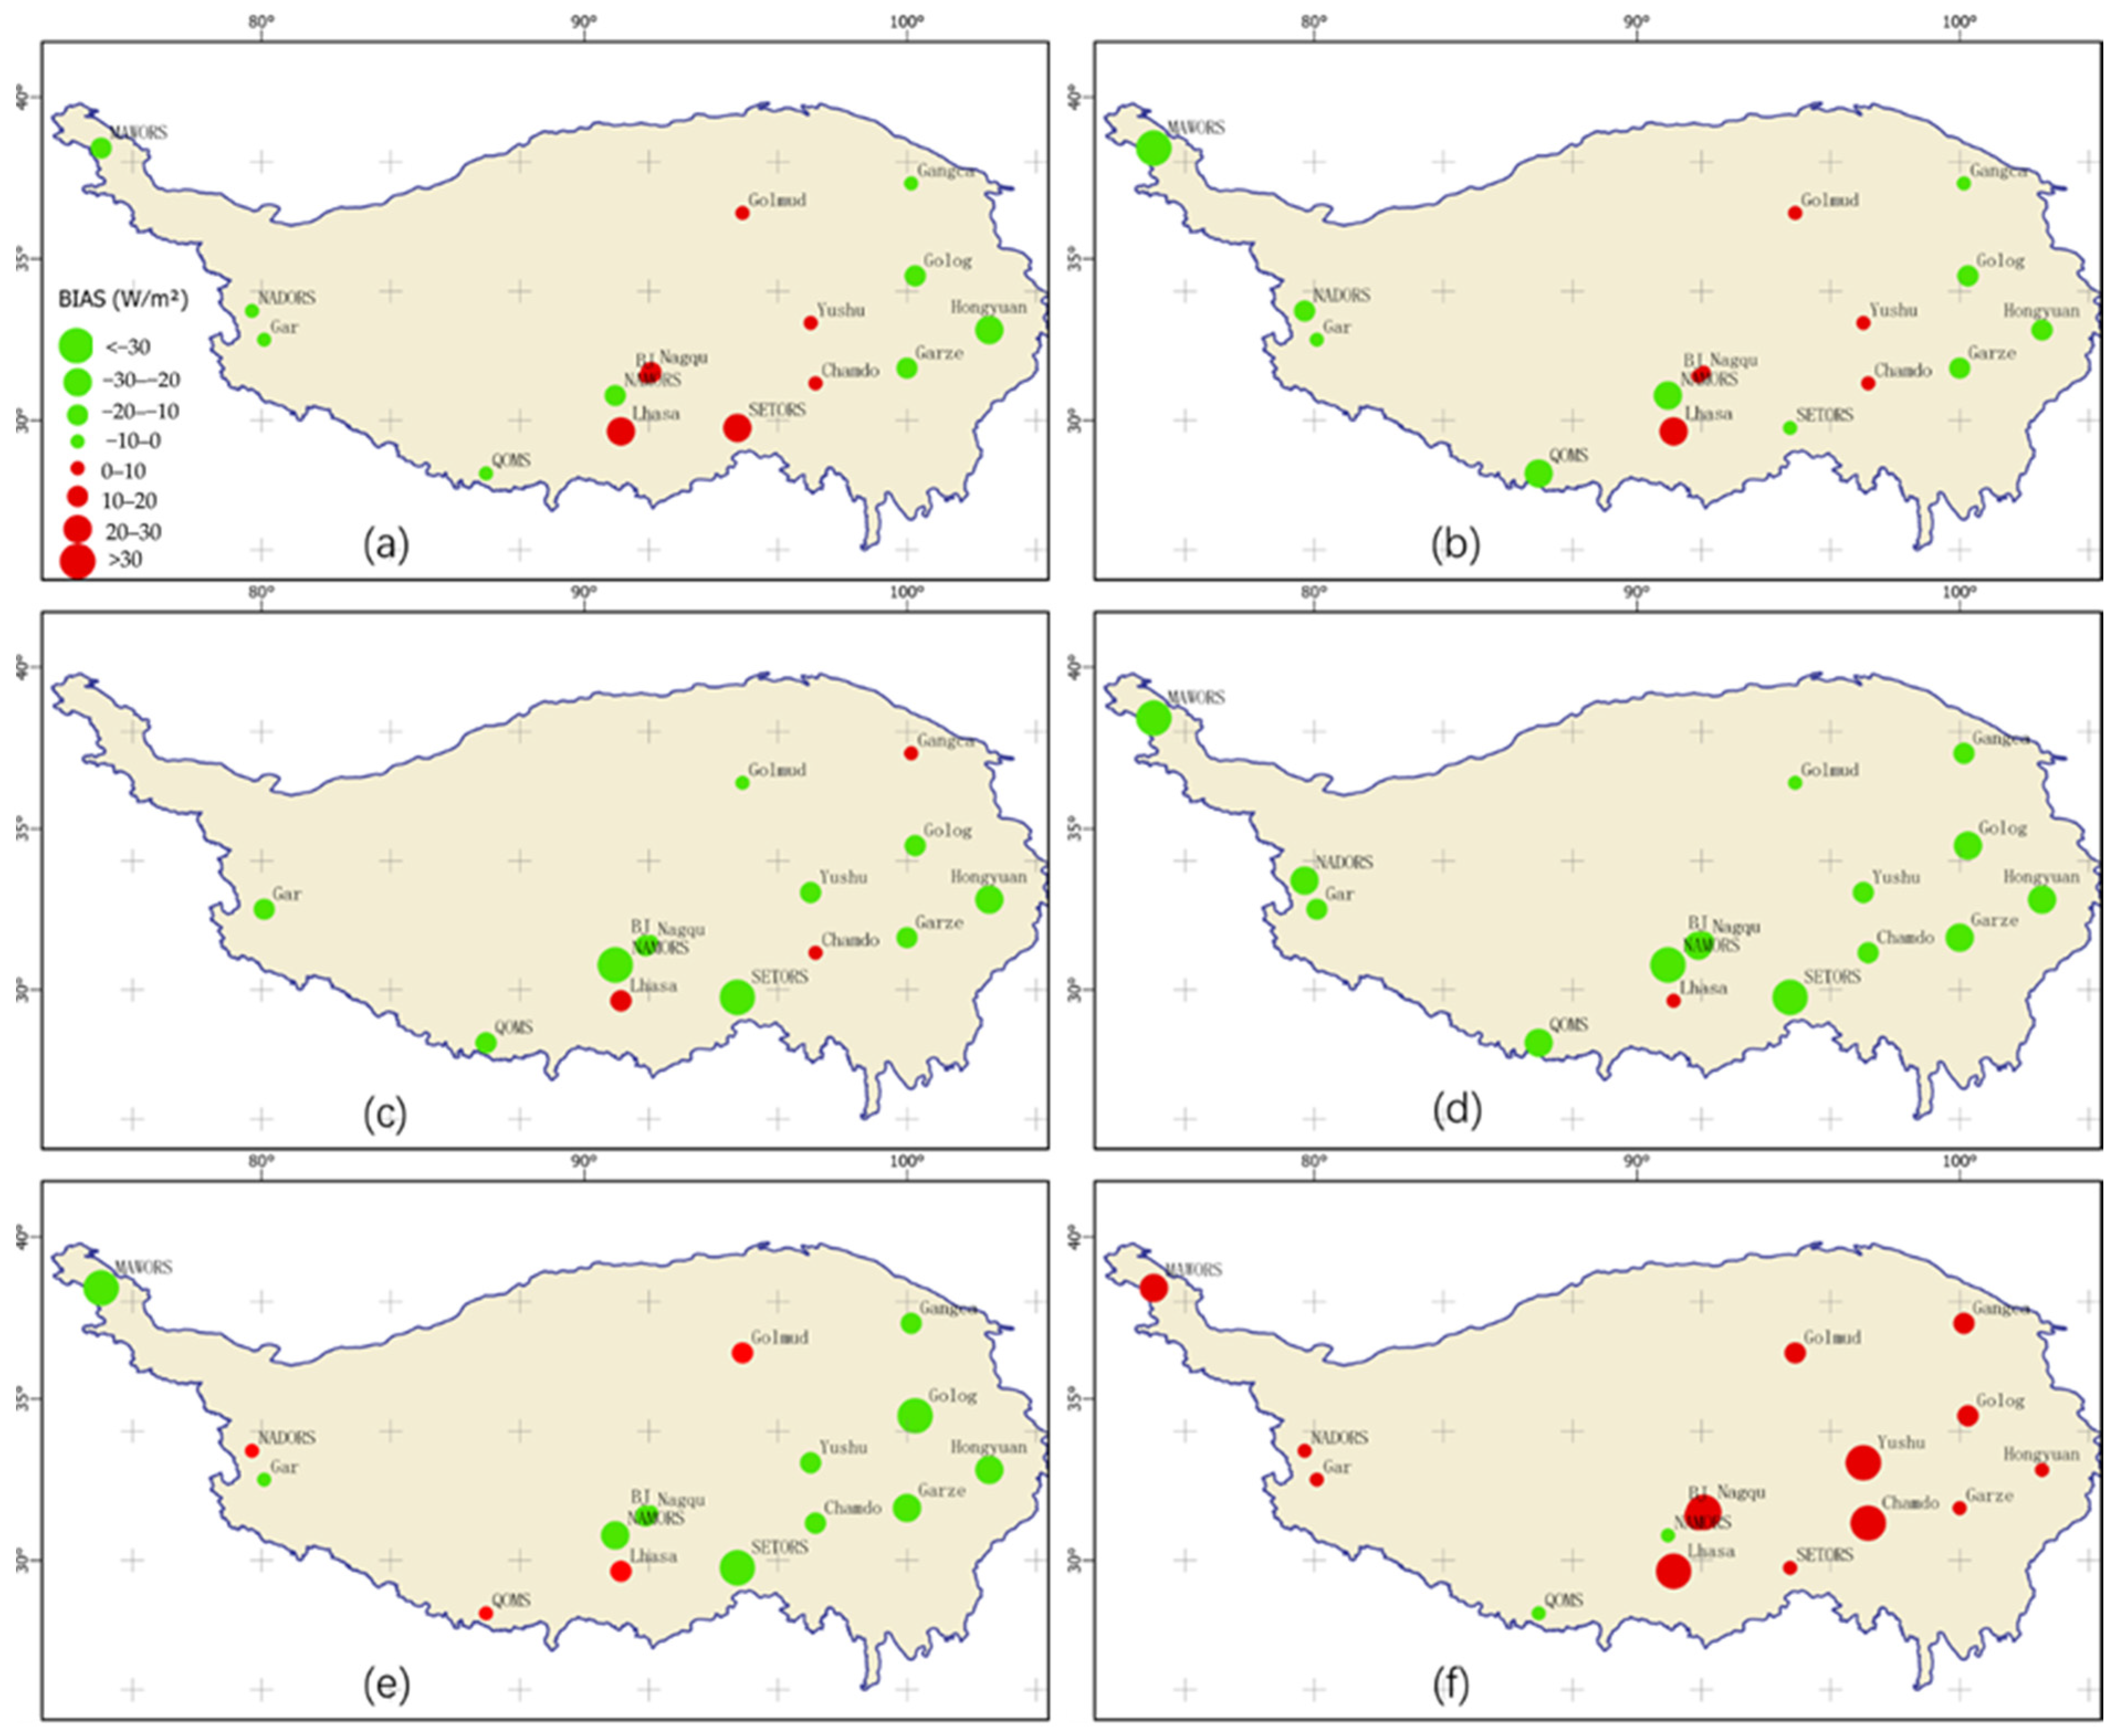
In this section, we provide a comprehensive overview of the validation results for the six DSR products at each site during 2015 and 2016. Two performance metrics, bias and root mean square error, were chosen for analysis, and the detailed results are presented in Table 2. It is worth noting that since Himawari-8 data were acquired only between 80 degrees East and 160 degrees West, NADORS and MAWORS are not included. In order to facilitate spatial comprehension of the different validation results associated with various products, the spatial distributions of the bias and root mean square error (Figure 4 and Figure 5) are plotted in this paper.
From Figure 4, it can be observed that the accuracy validation biases of ISCCP and CERES products exhibit similar spatial distribution patterns. This pattern continues with positive validation errors at sites on the central Tibetan Plateau, with most error values below 20 W/m2. In the eastern Tibetan Plateau, both products show a slight underestimation (−20 W/m2). In the western part of the Tibetan Plateau, both products are underestimated, but the ISCCP product performs better than the CERES product. In most parts of the Tibetan Plateau, the Himawari-8, GLASS, and MCD18A1 product accuracy validation biases show a general pattern of underestimation. In the eastern Tibetan Plateau, the Himawari-8 and GLASS products are more accurate than MCD18A1. The validation results for the ERA5 products are significantly different from the others, as demonstrated by the generalized overestimation across the Tibetan Plateau. In conclusion, the examination of the bias in the validation results of these various products shows that the validation results are more favorable in the eastern part of Tibetan Plateau, while the results are relatively poor in the southern part of the Tibetan Plateau. For the western part of the Tibetan Plateau, due to the shortage of validation sites, we can conclude only that the validation accuracy is better at the NADORS and Gar sites (the absolute value of the bias is generally less than 20 W/m2), and the results are poorer at MAWORS. The complex topography of the western and southern Tibetan Plateau poses a significant challenge for algorithms aimed at mitigating terrain effects in the process of producing DSR products. Therefore, the intricate topographical conditions are a crucial factor contributing to variations in product validation accuracy across different regions of the Tibetan Plateau.
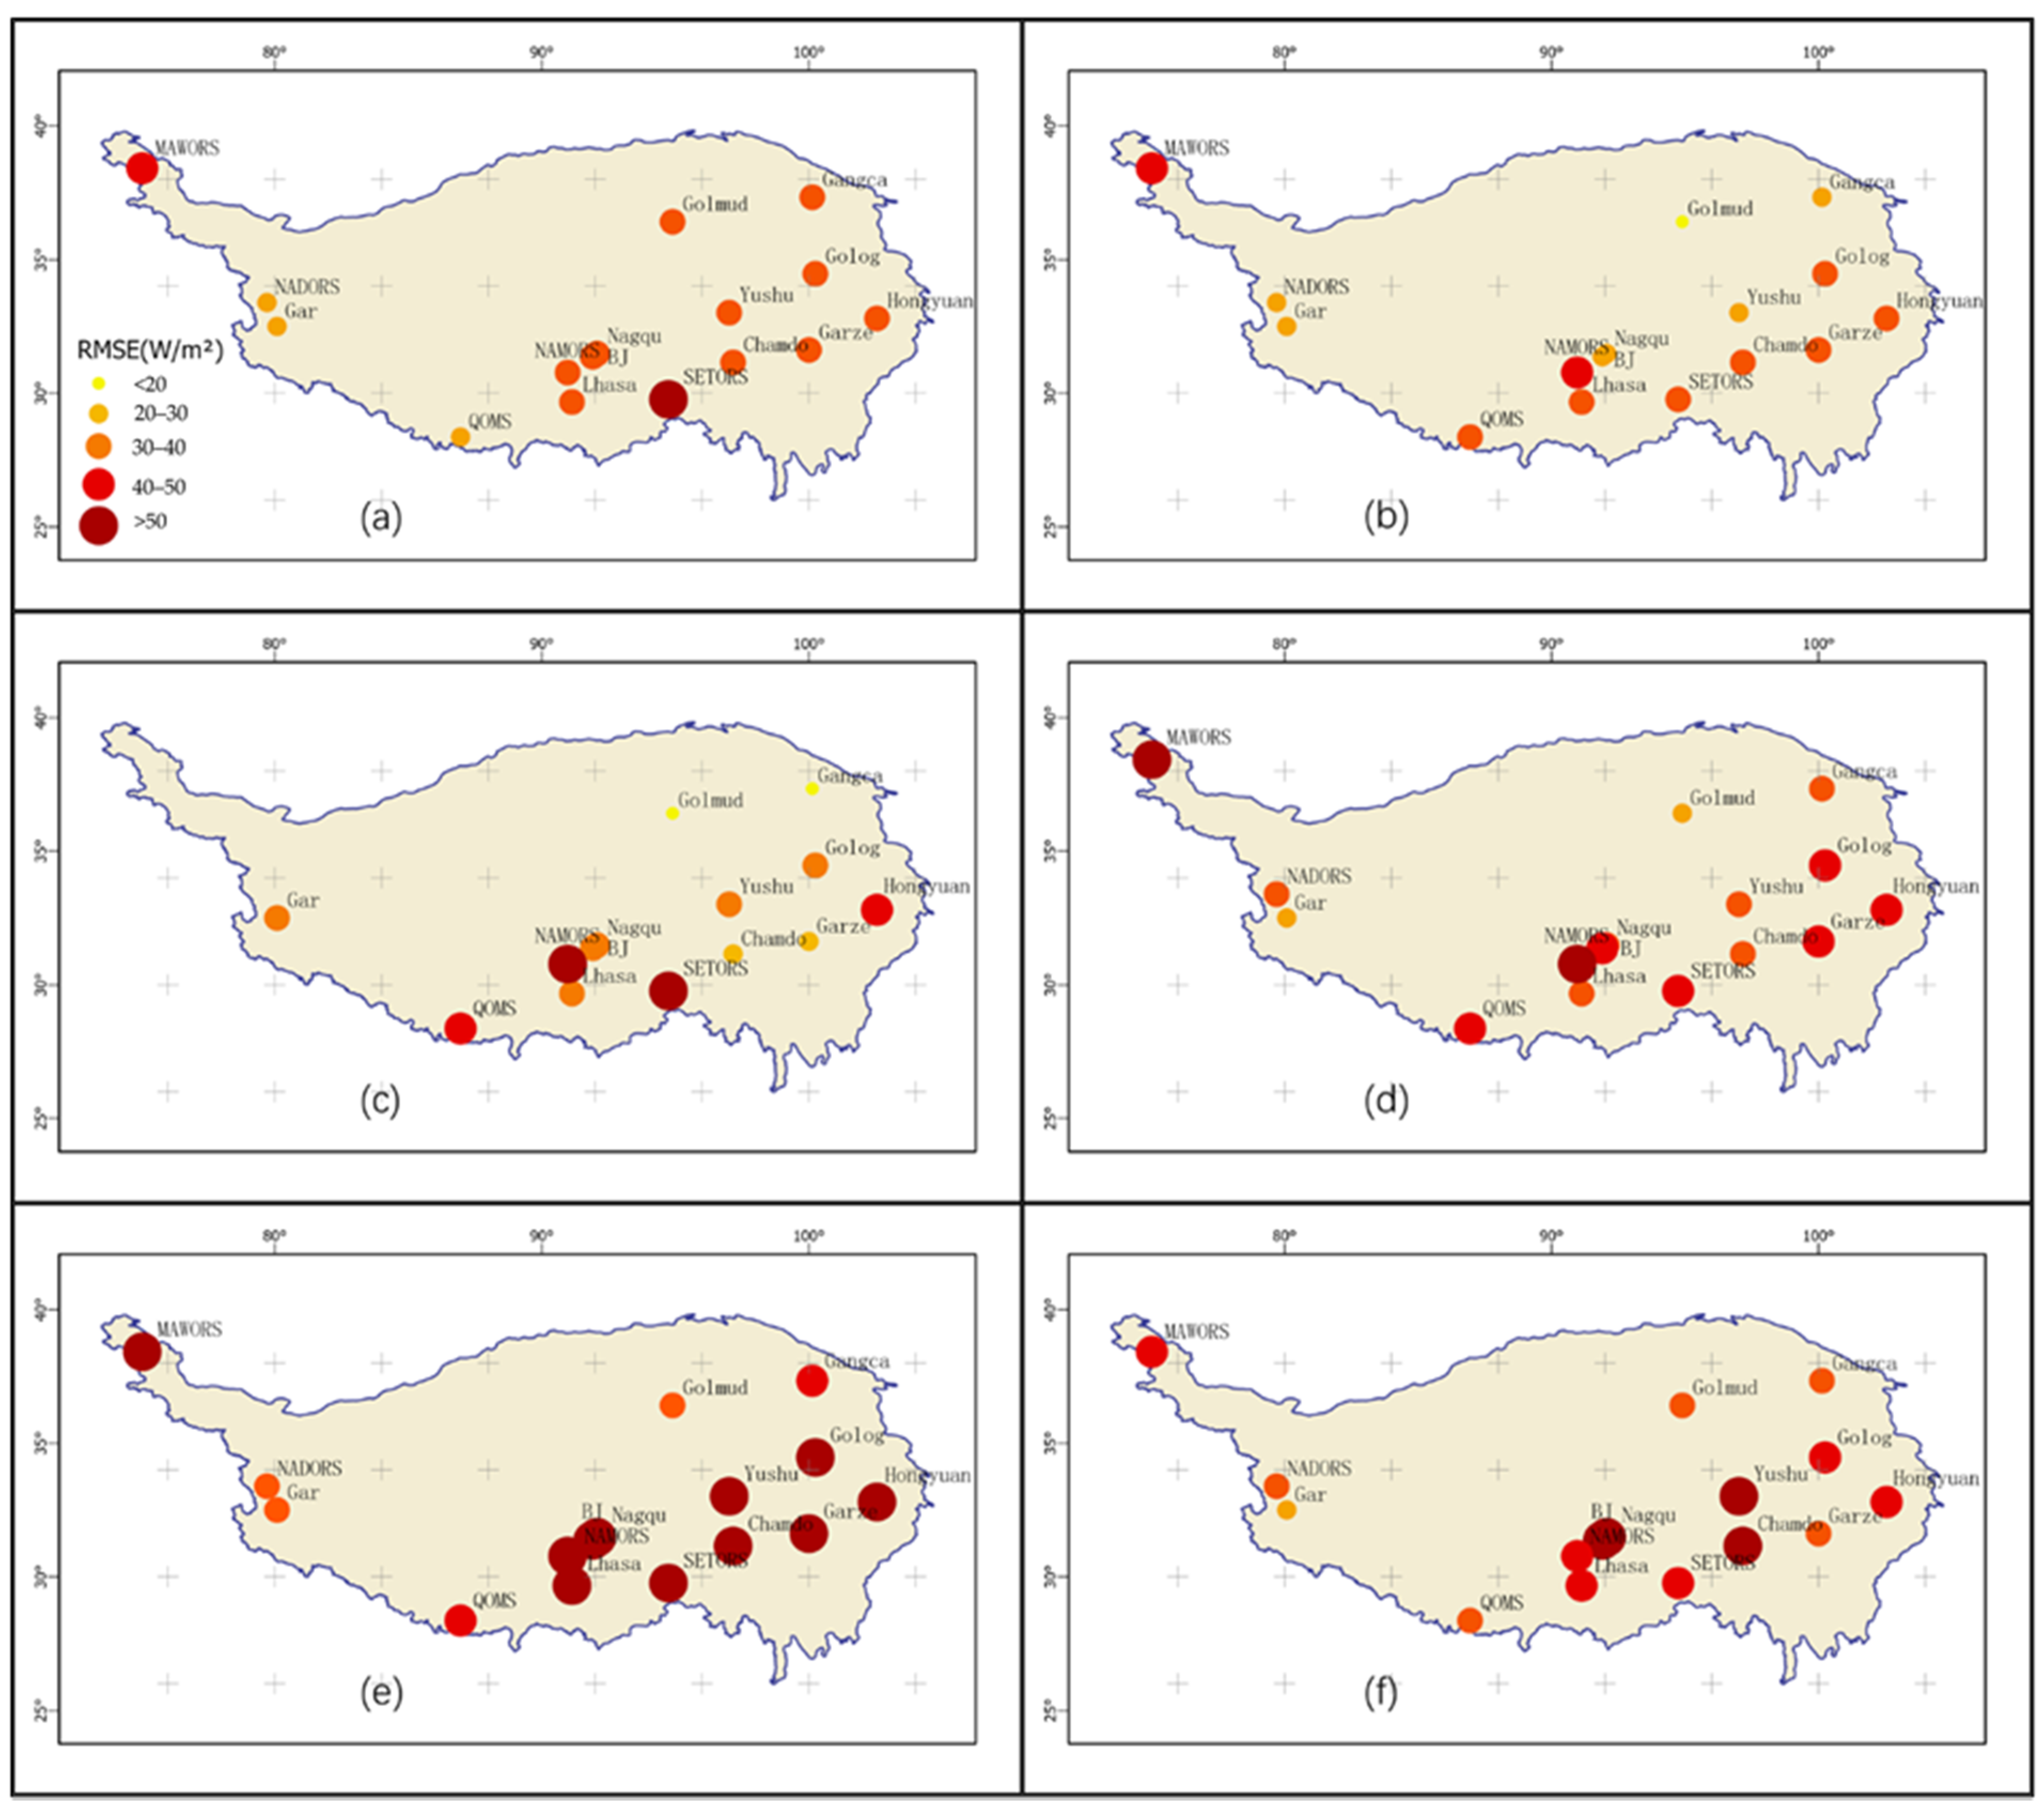
From Figure 5, it can be observed that the accuracy validation RMSEs of CERES and Himawari-8 products exhibit similar spatial distribution patterns. This pattern is represented by the fact that the RMSE values of the validation results are smaller in the eastern part of the Tibetan Plateau than in the southern part. Statistically, in the southern part of the Tibetan Plateau, the validation results of CERES were better than those of Himawari-8, and in the eastern part of the Tibetan Plateau, the validation results of Himawari-8 were better than those of CERES. For the other four products, it is difficult to see any spatial distribution pattern; the RMSE values of the validation results for each product are more consistent across the Tibetan Plateau region. It is relatively clear that among the four products, ISCCP has the best RMSE validation results and MCD has the worst validation results. For the western part of the Tibetan Plateau, same as bias results, we can conclude only that the validation accuracy is better at the NADORS and Gar sites, and the results are poorer at MAWORS (larger than 50 W/m2).
4. Discussion
In general, the discrepancy between DSR products and ground-based measurements can be attributed to the following influences: solar angle, clouds, aerosols, Sun-Cloud-Satellite Geometry (SCSG) [35], uncertainties in radiative transfer calculations and approximations [36], spatial scaling issues between ground-based measurements and remotely sensed products, and instrument-induced measurement errors. From the results in Section 3, the coarse-resolution gridded products (ISCCP-FH, CERES-SYN) do have better validation results than kilometer-scale products, but this does not prove that a coarser spatial resolution results in a higher accuracy of remote sensing products. Since the uncertainties in radiative transfer calculations and approximations and instrumental measurements are difficult to assess, the discussion part of this paper focuses on analyzing the effects of spatial resolution-, cloud-, and aerosol-related factors on the precision of the products.
4.1. Effects of Spatial Resolution
Spatial representativeness errors contribute to discrepancies between in situ measurements and DSR product estimates [37]. Nevertheless, there are conflicting perspectives on specific products. For instance, Wang G et al. [38] validated the 3 h DSR at its original resolution (1 × 1 km) and a coarser scale of 1° × 1°, finding a nearly unchanged accuracy. In contrast, Wang D et al. [39] demonstrated that aggregating instantaneous MCD18A1 from 1 to 50 km led to a decrease in the root mean square error by 12%.
In order to analyze the effect of different spatial resolutions on the accuracy validation of DSR products, the accuracies of different products were validated at three spatial scales, 1°, 0.25°, and 5 km. In using the method of bilinear interpolation, the products with high spatial resolution were sampled to a low resolution and compared with the quality-controlled ground station data. Five comparison metrics mentioned in Section 2 are selected, and the results are presented in Table 3.
The validation results of the same product data under different spatial resolution conditions are very stable, and there is no drastic change in the accuracy of the product with the change of spatial resolution. Therefore, the experimental results outlined in this paper demonstrate that spatial resolution is not a factor influencing the accuracy of the validation results for these six radiation products at daily scale.
4.2. Effects of Cloud Factor
Many studies have pointed out that clouds are the most important factor affecting the accuracy of DSR retrieval under all-weather conditions [40,41]. In order to quantitatively assess the influence of clouds on the accuracy of DSR data products at the surface, this study selected the cloud parameter data products of the CERES_SYN1deg_Ed4.1 series of products and extracted cloud area fraction and cloud optical thickness data from them. The changes in different statistical indicators (mentioned in Section 2) with cloud area fraction (cloud optical thickness) were calculated, and the linear regression equations of each indicator on cloud area fraction (cloud optical thickness) and the coefficients of determination of the regression equations are given. In this study, according to the coefficient of determination () of the regression equation, the strength of the correlation was categorized into the following cases (the same as in the following section): if the coefficient of determination is greater than or equal to 0.7, it is defined as the two variables being highly correlated; if the coefficient of determination is greater than 0.3 and less than 0.7, it is defined as the two variables being moderately correlated; and if the coefficient of determination is less than or equal to 0.3, it is defined as the two variables being poorly correlated.
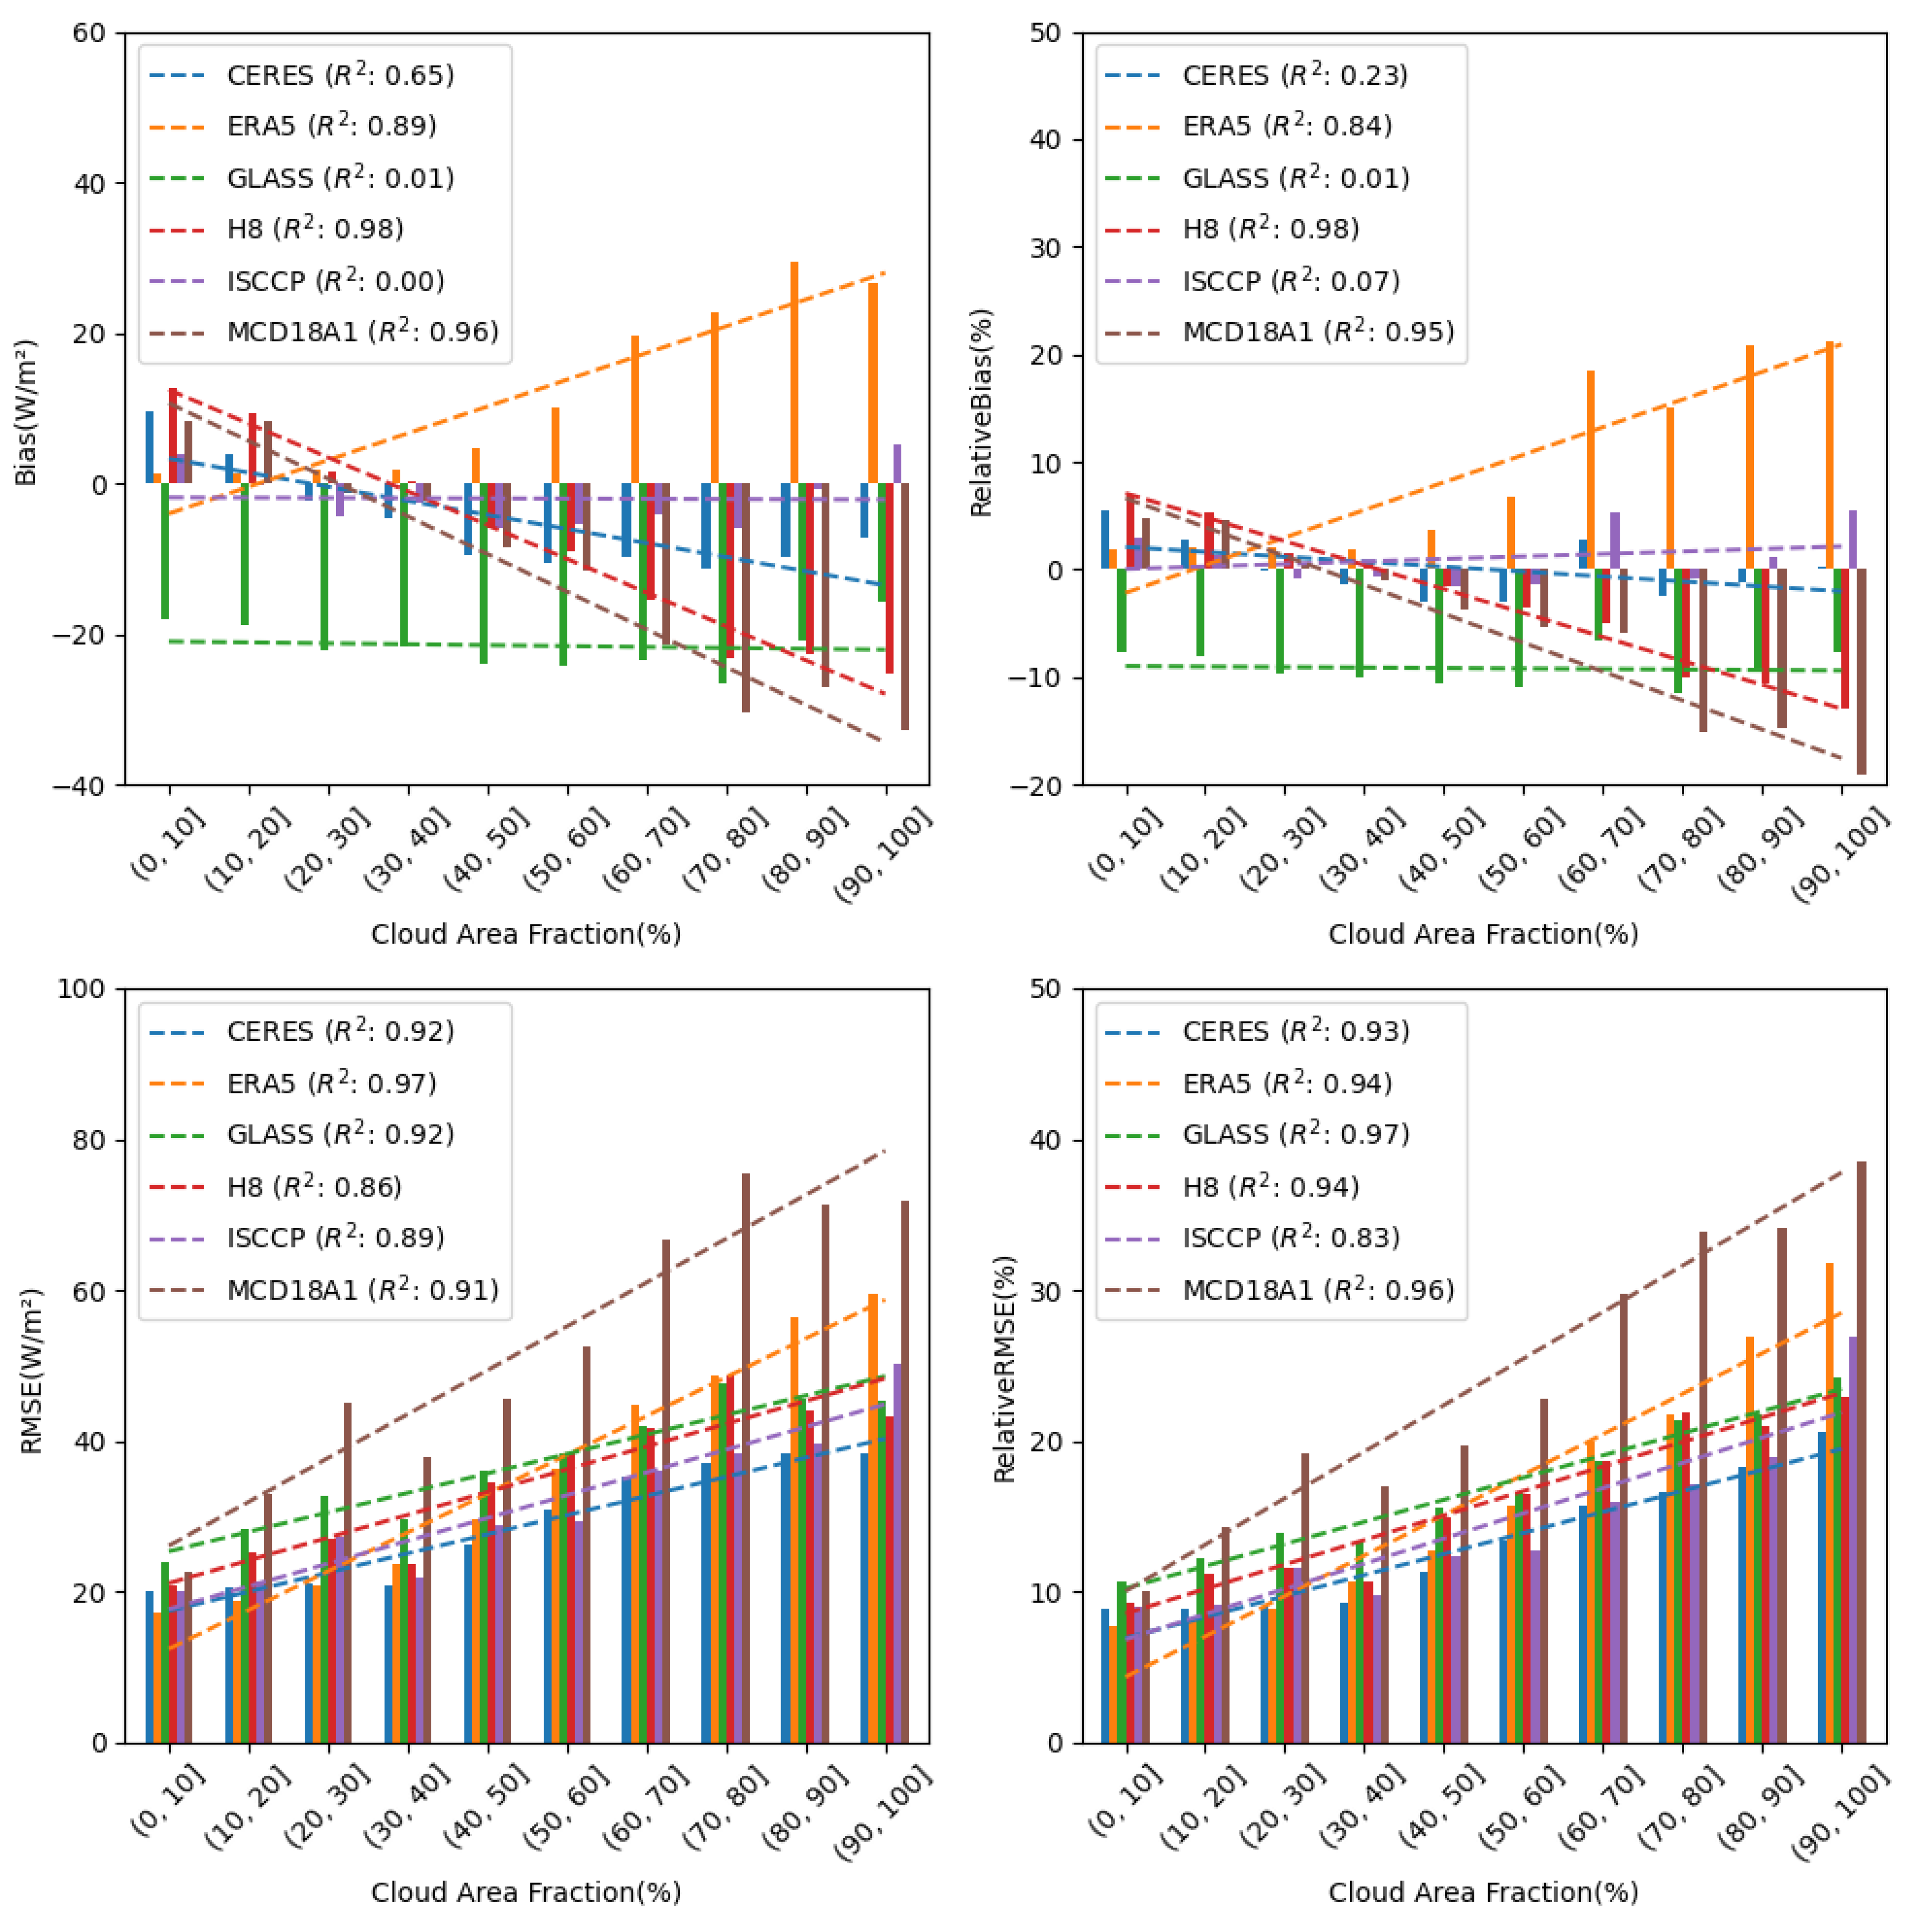
4.2.1. Effects of Cloud Area Fraction
In Figure 6, the bias (relative bias) of the estimation results of the ERA5, Himawari-8, and MCD18A1 data products are highly correlated with the cloud area fraction data, and the biases (relative bias) of these three products gradually increase with the increase in the cloud area fraction. The bias of the CERES data product estimates is moderately correlated with cloud area fraction, but the relative bias is weakly correlated with the cloud area fraction data. The bias (relative bias) of the estimation results of the GLASS and ISCCP data products are not correlated with the cloud area fraction data.
From Figure 6, it can be seen that for the root mean square error and relative root mean square error, all products are highly correlated with cloud area fraction. The root mean square error and relative root mean square error increase gradually with cloud area fraction, but the speed of increase varies, with MCD18A1 and ERA5 increasing faster than others.
In summary, the validation results of the GLASS and ISCCP products exhibit robustness with respect to cloud area fraction, whereas the validation accuracies of ERA5, Himawari-8, and MCD18A1 products are significantly influenced by the cloud area fraction.
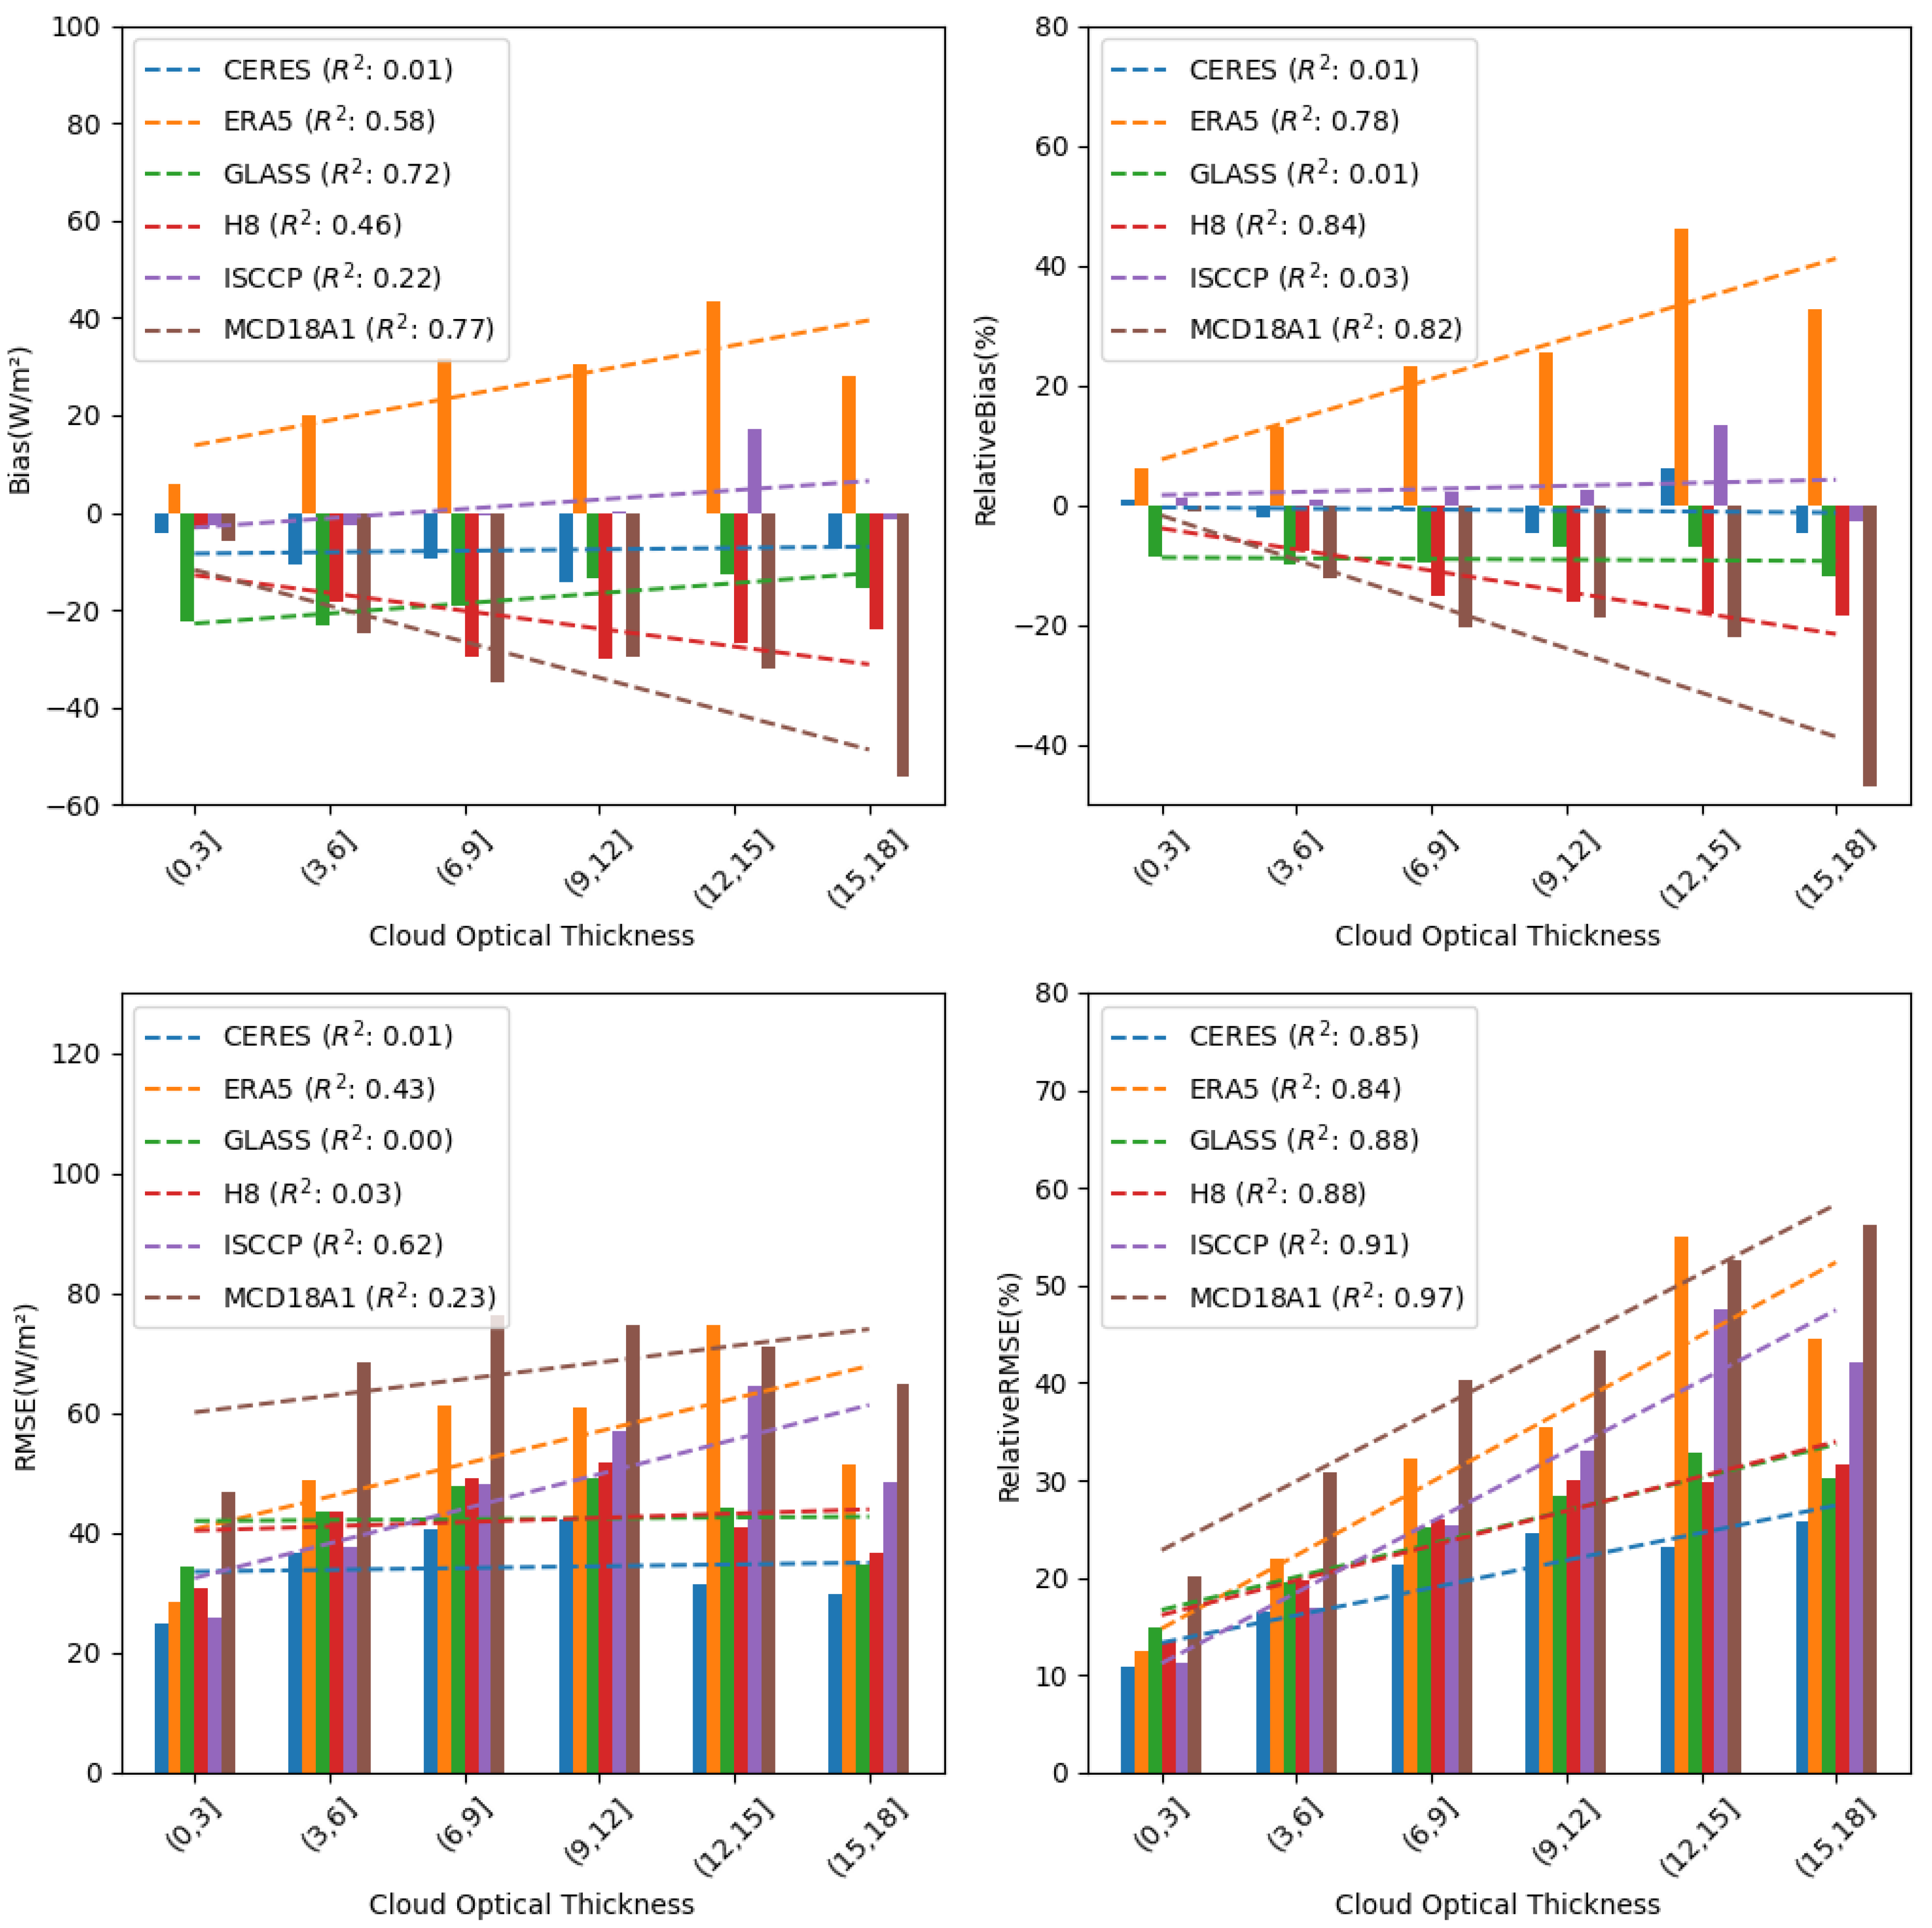
4.2.2. Effects of Cloud Optical Thickness
As can be seen in Figure 7, the biases of the GLASS and MCD18A1 data products are highly correlated with the cloud optical thickness data, and the ERA5 and Himawari-8 data products are moderately correlated with the cloud optical thickness data. With the exception of the GLASS product, the biases of the other products increase with the augmentation of cloud optical thickness, whereas GLASS data demonstrate an inverse trend. Additionally, the relative biases of the ERA5, Himawari-8, and MCD18A1 data products exhibit a high correlation with cloud optical thickness data, while GLASS data show no such correlation. The bias (relative bias) of the estimation results of the ISCCP and CERES data products shows no correlation with cloud optical thickness.
Concerning the root mean square error, ERA5 and ISCCP data exhibit a moderate correlation with cloud optical thickness. The remaining four data products show no correlation. In the context of the relative root mean square error, all products exhibit a strong correlation with cloud optical thickness data. The relative root mean square error gradually increases with an elevation in cloud optical thickness, albeit at varying rates. Notably, MCD18A1, ISCCP, and ERA5 demonstrate a relatively rapid increase in this context.
In summary, the validation results of the CERES and ISCCP products exhibit robustness with respect to cloud optical thickness, whereas the validation accuracies of the ERA5, Himawari-8, and MCD18A1 products are significantly influenced by cloud optical thickness.
4.3. Effects of Aerosol Optical Depth
Aerosols can modify radiative fluxes through the atmosphere, thereby influencing the energy balance of the entire Earth–atmosphere system. Aerosols can directly absorb and scatter incoming solar radiation in the atmosphere, resulting in a reduction in DSR. Additionally, aerosols can indirectly reduce DSR by influencing cloud albedo [42] and cloud lifecycles [43]. Absorptive aerosols can also enhance atmospheric stability through a semi-direct effect [44]. The Tibetan Plateau region is one of the few areas on Earth that is relatively less polluted [45]. The Tibetan Plateau exhibits a clean atmospheric environment, rendering it more susceptible to the direct and indirect impacts of aerosols. Compared to regions characterized by higher aerosol concentrations, the amplification of aerosols within the Tibetan Plateau region will result in more pronounced direct and indirect effects [46,47,48]. In order to quantitatively assess the influence of aerosol on the accuracy of DSR data products at the surface, this study selected the aerosol optical depth data of the CERES_SYN1deg_Ed4.1 series of products. The assessment methodology was the same as in the previous section
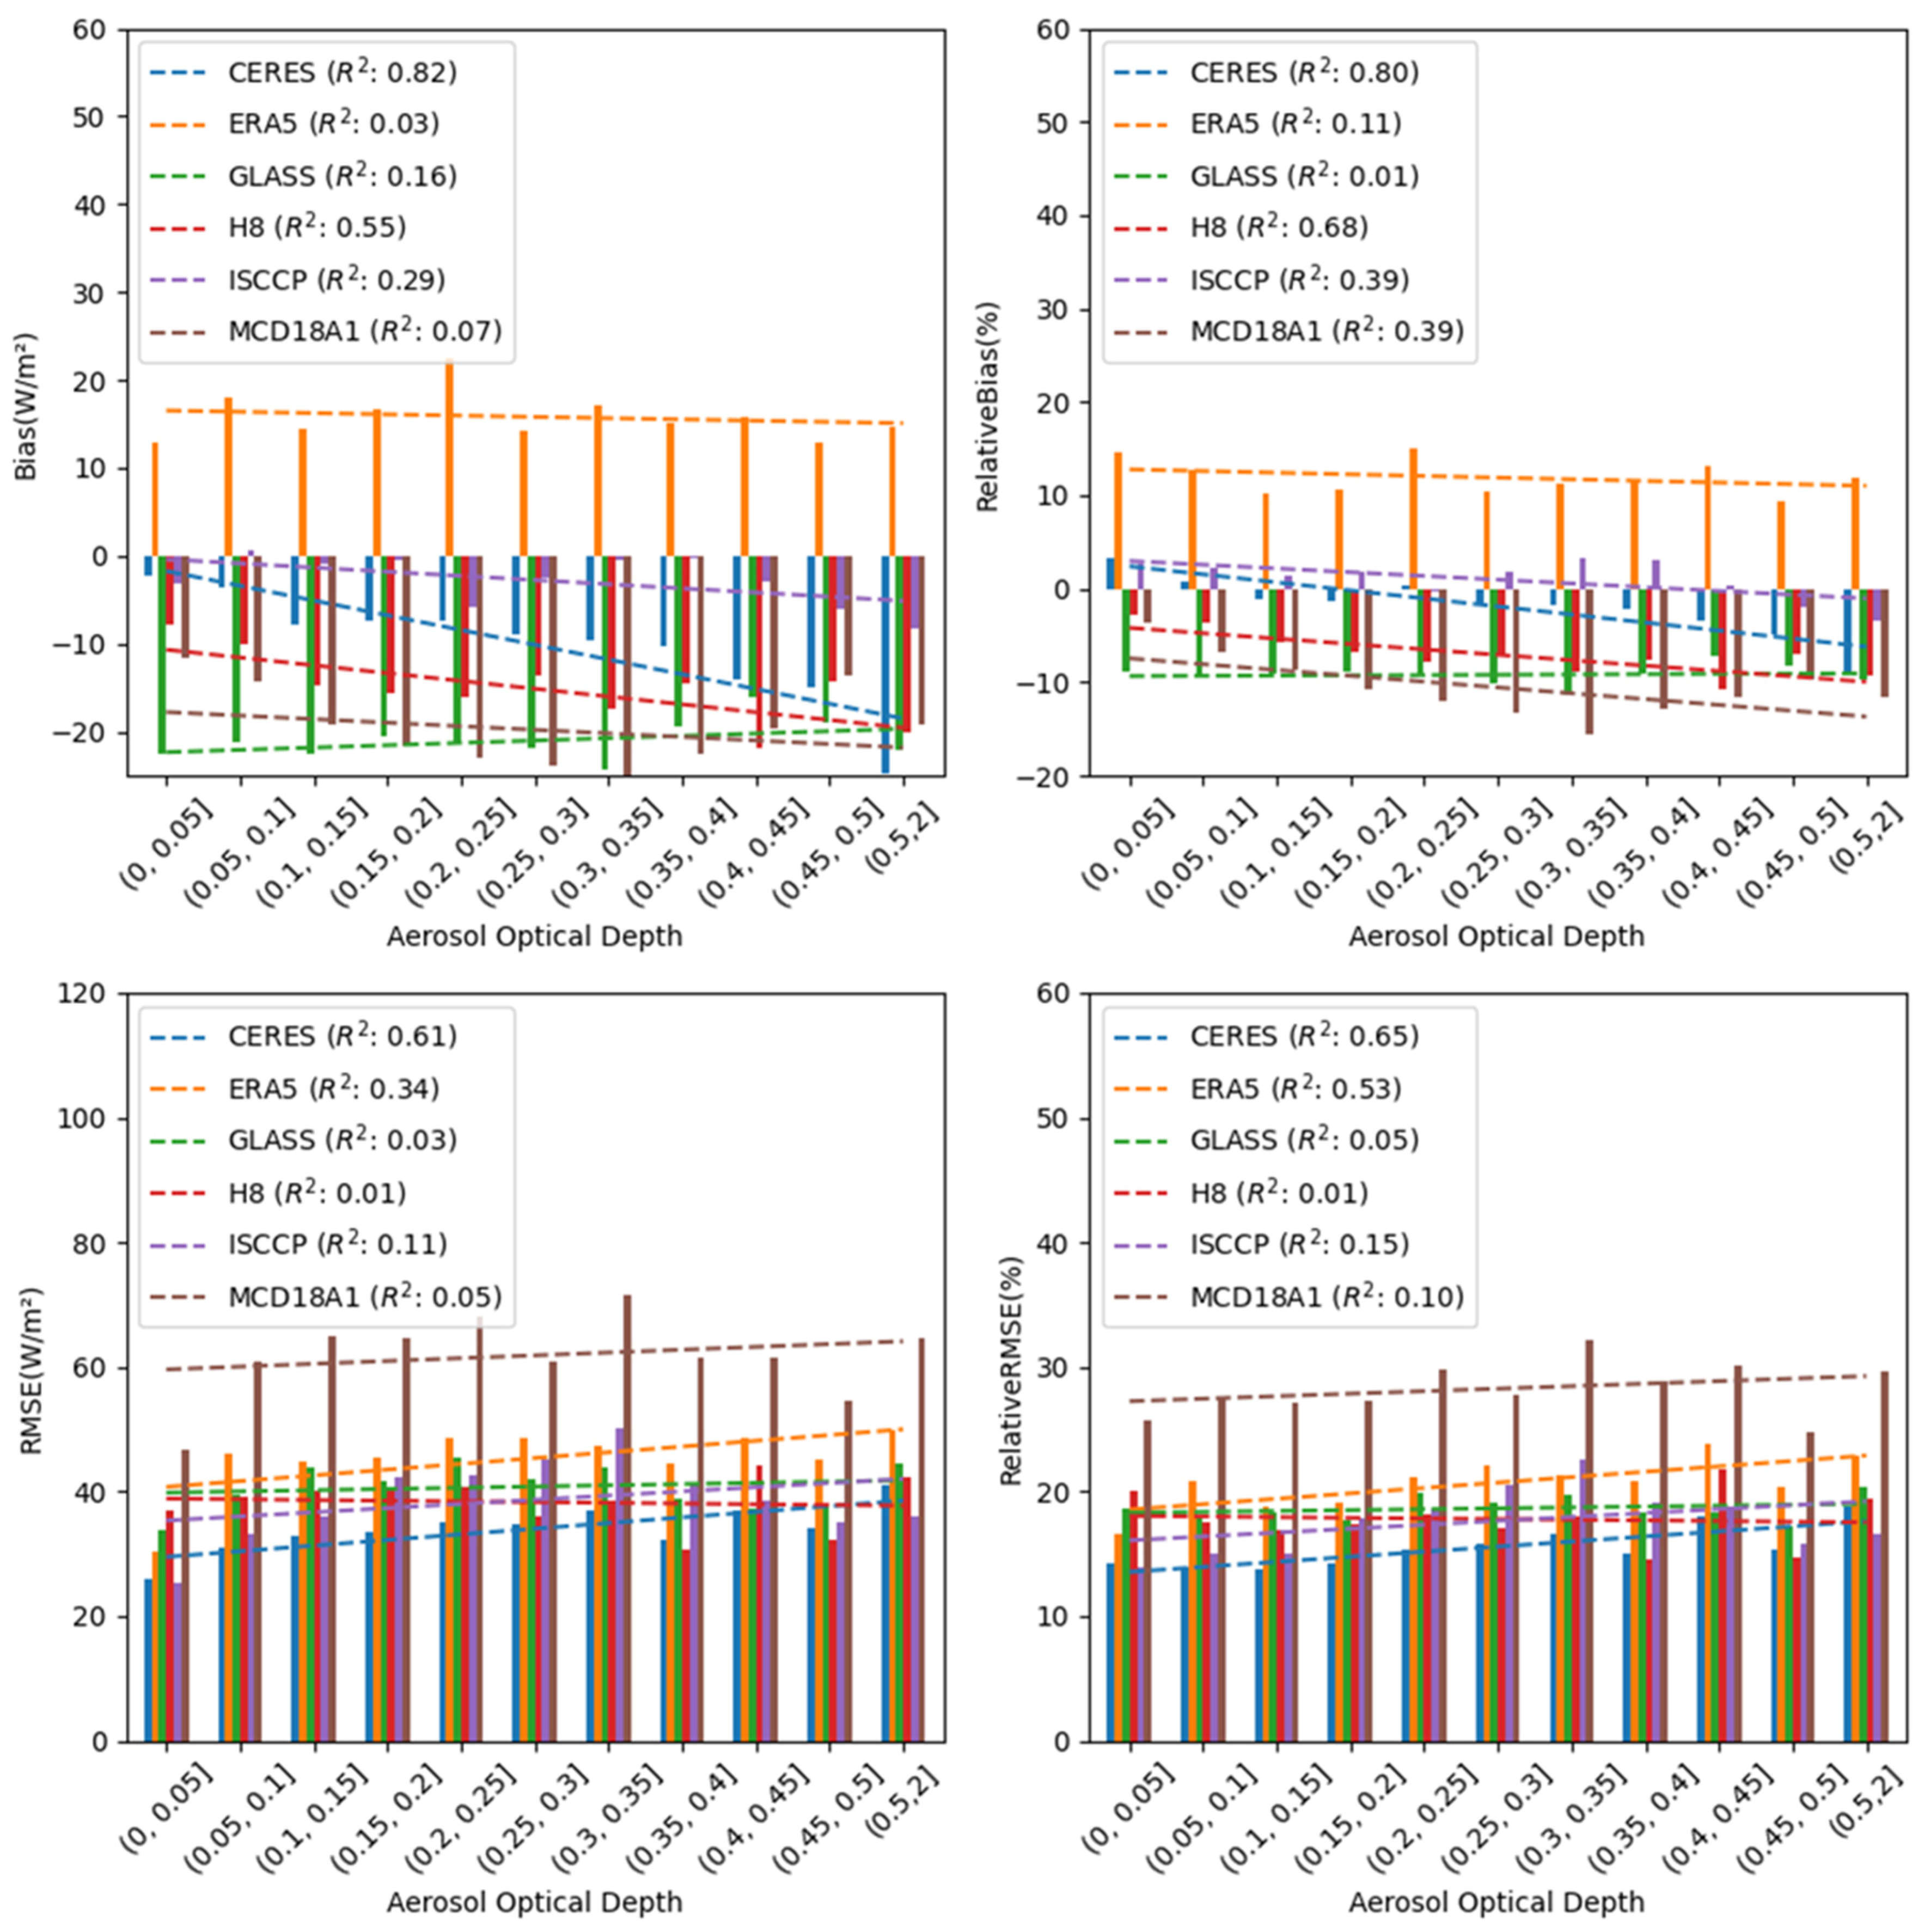
As can be seen in Figure 8, the bias (relative bias) in the estimated results of the CERES products exhibits a strong correlation with aerosol optical depth data, with the bias (relative bias) increasing progressively as aerosol optical depth rises. The bias (relative bias) in the estimated results of the Himawari-8 data demonstrates a moderate correlation with aerosol optical depth. The biases (relative bias) of the estimation results of the ERA5, GLASS, and MCD18A1 products correlate poorly with aerosol optical thickness data.
Regarding the root mean square error and relative root mean square error, those of the CERES and ERA5 products exhibit a moderate correlation with aerosol optical depth data, manifesting as a gradual increase with the rising aerosol optical depth. The root mean square errors and relative root mean square errors of the estimated results of the GLASS, Himawari-8, ISCCP, and MCD18A1 data products are not correlatedwith aerosol optical depth.
In summary, the validation results of the ERA5, GLASS, and MCD18A1 products exhibit robustness with respect to aerosol optical depth, whereas the validation accuracy of the CERES products is significantly influenced by aerosol optical depth.
5. Conclusions
Taking into account the significance of the Tibetan Plateau region in global climate change and the uncertainties associated with DSR product accuracy, this study selected ten sites from the China Meteorological Administration and six sites from the National Tibetan Plateau Data Center. These sites were utilized for the validation of the accuracy of six widely used radiation products. Additionally, an analysis was conducted to examine the influences of spatial resolution, cloud factors, and aerosol factors on the validation accuracy of these products. This study drew the following conclusions:
- (1)
- The CERES products demonstrate the highest accuracy among the six data products. The MCD18A1 products have the worst accuracy performance among the six data products. With the exception of the ERA5 products, the other products underestimate the value of DSR in the Tibetan Plateau region.
- (2)
- Analyzing the spatial distribution of these product validation results reveals a more favorable performance in the eastern regions of the Tibetan Plateau, while comparatively poorer validation results were observed in the southern part of Tibetan Plateau. As for the western regions of the Tibetan Plateau, due to the limited availability of validation sites, this study refrained from drawing definitive conclusions.
- (3)
- Regarding current products and analysis methods, there is no notable correlation between the validation accuracy of a product and the spatial resolution employed.
- (4)
- The validation results of the GLASS and ISCCP products exhibit robustness with respect to cloud area fraction; the validation results of the CERES and ISCCP products exhibit robustness with respect to cloud optical thickness; and the validation accuracies of the ERA5, Himawari-8, and MCD18A1 products are significantly influenced by these two cloud factors.
- (5)
- The validation results of the ERA5, GLASS, and MCD18A1 products exhibit robustness with respect to aerosol optical depth, whereas the validation accuracy of the CERES products is significantly influenced by aerosol optical depth.
Author Contributions
Conceptualization, X.X.; Methodology, T.L.; Software, T.L. and H.C.; Formal Analysis, T.L.; Investigation, X.X., H.Z. and S.Y.; Data Curation, T.L.; Writing—Original Draft, T.L.; Writing—Review and Editing, T.L., X.X., L.L. and Z.Y.; Supervision, X.X.; Project Administration, X.X.; Funding Acquisition, X.X. and Q.L. All authors have read and agreed to the published version of the manuscript.
Funding
This research was funded by the National Natural Science Foundation of China under grant number 41930111.
Data Availability Statement
Data are contained within the article.
Acknowledgments
The ground-measured downward shortwave radiation datasets were collected from the CMA at http://www.cma.gov.cn/ (accessed on 20 March 2022) and from the National Tibetan Plateau Data Center at http://data.tpdc.ac.cn. The ISCCP-FH SRF data, provided by the National Aeronautics and Space Administration Goddard Institute for Space Studies, were obtained from the website at https://isccp.giss.nasa.gov/pub/flux-fh/tar-nc4_SRF/ (accessed on 20 March 2022). The CERES-SYN1deg Ed4A data were obtained through the NASA Langley Research Center CERES ordering tool at https://ceres.larc.nasa.gov/data/ (accessed on 20 March 2022). The GLASS DSR (V2.0) data were downloaded from http://www.glass.umd.edu (accessed on 20 March 2022). The Himawari-8 data, provided by the Meteorological Satellite Center (MSC) of the Japan Meteorological Agency (JMA), were obtained from the JAXA website at http://www.eorc.jaxa.jp/ptree/index.html (accessed on 20 March 2022). The MCD18A1 products were downloaded from https://lpdaac.usgs.gov/products/mcd18a1v061/ (accessed on 20 March 2022). The ERA5 reanalysis datasets were downloaded from https://cds.climate.copernicus.eu/cdsapp#!/dataset/reanalysis-era5-single-levels?tab=overview (accessed on 20 March 2022). The authors are very grateful to these organizations for providing the data used in this study.
Conflicts of Interest
The authors declare no conflicts of interest. The funders had no role in the design of the study; in the collection, analyses, or interpretation of data; in the writing of the manuscript; or in the decision to publish the results.
References
- Xin, X. Remote Sensing of Land Surface Radiation Budget. In Remote Sensing of Energy Fluxes and Soil. Moisture Content; Science Press: Abingdon, UK, 2018. [Google Scholar]
- Guruprasad, K.; Bhattacharjee, S.; Kataria, S.; Yadav, S.; Tiwari, A.; Baroniya, S.; Rajiv, A.; Mohanty, P. Growth Enhancement of Soybean (Glycine Max) upon Exclusion of UV-B and UV-B/A Components of Solar Radiation: Characterization of Photosynthetic Parameters in Leaves. Photosynth. Res. 2008, 96, 115. [Google Scholar] [CrossRef]
- Wild, M.; Folini, D.; Schär, C.; Loeb, N.; Dutton, E.G.; König-Langlo, G. The Global Energy Balance from a Surface Perspective. Clim. Dyn. 2013, 40, 3107–3134. [Google Scholar] [CrossRef]
- Tang, W.; Qin, J.; Yang, K.; Liu, S.; Lu, N.; Niu, X. Retrieving high-resolution surface solar radiation with cloud parameters derived by combining MODIS and MTSAT data. Atmos. Chem. Phys. 2016, 16, 2543–2557. [Google Scholar] [CrossRef]
- Cong, Z.; Kang, S.; Liu, X.; Wang, G. Elemental Composition of Aerosol in the Nam Co Region, Tibetan Plateau, during Summer Monsoon Season. Atmos. Environ. 2007, 41, 1180–1187. [Google Scholar] [CrossRef]
- Zhong, L.; Ma, Y.; Salama, M.S.; Su, Z. Assessment of Vegetation Dynamics and Their Response to Variations in Precipitation and Temperature in the Tibetan Plateau. Clim. Change 2010, 103, 519–535. [Google Scholar] [CrossRef]
- Alley, R.B.; Meese, D.A.; Shuman, C.A.; Gow, A.J.; Taylor, K.C.; Grootes, P.M.; White, J.W.C.; Ram, M.; Waddington, E.D.; Mayewski, P.A.; et al. Abrupt increase in Greenland snow accumulation at the end of the Younger Dryas event. Nature 1993, 362, 527–529. [Google Scholar] [CrossRef]
- Ma, Y.; Zhong, L.; Su, Z.; Ishikawa, H.; Menenti, M.; Koike, T. Determination of Regional Distributions and Seasonal Variations of Land Surface Heat Fluxes from Landsat-7 Enhanced Thematic Mapper Data over the Central Tibetan Plateau Area: Regional Land Surface Heat Fluxes. J. Geophys. Res. 2006, 111, D10305. [Google Scholar] [CrossRef]
- Yanai, M.; Wu, G.-X. Effects of the Tibetan Plateau. In The Asian Monsoon; Springer Praxis Books; Springer: Berlin/Heidelberg, Germany, 2006; pp. 513–549. ISBN 978-3-540-40610-5. [Google Scholar]
- Gupta, S.K.; Ritchey, N.A.; Wilber, A.C.; Whitlock, C.H.; Gibson, G.G.; Stackhouse, P.W. A Climatology of Surface Radiation Budget Derived from Satellite Data. J. Clim. 1999, 12, 2691–2710. [Google Scholar] [CrossRef]
- Zhang, Y.; Rossow, W.B. Global Radiative Flux Profile Data Set: Revised and Extended. JGR Atmos. 2023, 128, e2022JD037340. [Google Scholar] [CrossRef]
- Zhang, Y.; Rossow, W.B.; Lacis, A.A.; Oinas, V. Calculation, Evaluation and Application of Long-Term, Global Radiative Flux Datasets at ISCCP: Past and Present. In Studies of Cloud, Convection and Precipitation Processes Using Satellite Observations; Lectures in Climate Change; World Scientific: Singapore, 2022; Volume 3, pp. 151–177. ISBN 978-981-12-5690-5. [Google Scholar]
- Frouin, R.; Murakami, H. Estimating Photosynthetically Available Radiation at the Ocean Surface from ADEOS-II Global Imager Data. J. Oceanogr. 2007, 63, 493–503. [Google Scholar] [CrossRef]
- Zhang, X.; Liang, S.; Zhou, G.; Wu, H.; Zhao, X. Generating Global LAnd Surface Satellite Incident Shortwave Radiation and Photosynthetically Active Radiation Products from Multiple Satellite Data. Remote Sens. Environ. 2014, 152, 318–332. [Google Scholar] [CrossRef]
- Yang, K.; Koike, T.; Stackhouse, P.; Mikovitz, C.; Cox, S.J. An Assessment of Satellite Surface Radiation Products for Highlands with Tibet Instrumental Data. Geophys. Res. Lett. 2006, 33, L22403. [Google Scholar] [CrossRef]
- Gui, S.; Liang, S.; Wang, K.; Li, L.; Zhang, A.X. Assessment of Three Satellite-Estimated Land Surface Downwelling Shortwave Irradiance Data Sets. IEEE Geosci. Remote Sens. Lett. 2010, 7, 776–780. [Google Scholar] [CrossRef]
- Zhang, J.; Shen, R.; Shi, C.; Bai, L.; Liu, J.; Sun, S. Evaluation and Comparison of Downward Solar Radiation from New Generation Atmospheric Reanalysis ERA5 across Mainland China. J. Geo-Inf. Sci. 2021, 23, 2261–2274. [Google Scholar]
- Zhang, X.; Liang, S.; Wild, M.; Jiang, B. Analysis of Surface Incident Shortwave Radiation from Four Satellite Products. Remote Sens. Environ. 2015, 165, 186–202. [Google Scholar] [CrossRef]
- Gilgen, H.; Ohmura, A. The Global Energy Balance Archive. Bull. Amer. Meteor. Soc. 1999, 80, 831–850. [Google Scholar] [CrossRef]
- Yu, Y.; Shi, J.; Wang, T.; Letu, H.; Yuan, P.; Zhou, W.; Hu, L. Evaluation of the Himawari-8 Shortwave Downward Radiation (SWDR) Product and Its Comparison With the CERES-SYN, MERRA-2, and ERA-Interim Datasets. IEEE J. Sel. Top. Appl. Earth Obs. Remote Sens. 2019, 12, 519–532. [Google Scholar] [CrossRef]
- Ma, Y.; Hu, Z.; Xie, Z.; Ma, W.; Wang, B.; Chen, X.; Li, M.; Zhong, L.; Sun, F.; Gu, L.; et al. A Long-Term (2005–2016) Dataset of Hourly Integrated Land–Atmosphere Interaction Observations on the Tibetan Plateau. Earth Syst. Sci. Data 2020, 12, 2937–2957. [Google Scholar] [CrossRef]
- Doelling, D.R.; Loeb, N.G.; Keyes, D.F.; Nordeen, M.L.; Morstad, D.; Nguyen, C.; Wielicki, B.A.; Young, D.F.; Sun, M. Geostationary Enhanced Temporal Interpolation for CERES Flux Products. J. Atmos. Ocean. Technol. 2013, 30, 1072–1090. [Google Scholar] [CrossRef]
- Doelling, D.R.; Sun, M.; Nguyen, L.T.; Nordeen, M.L.; Haney, C.O.; Keyes, D.F.; Mlynczak, P.E. Advances in Geostationary-Derived Longwave Fluxes for the CERES Synoptic (SYN1deg) Product. J. Atmos. Ocean. Technol. 2016, 33, 503–521. [Google Scholar] [CrossRef]
- Zhang, X.; Zhao, X.; Li, W.; Liang, S.; Wang, D.; Liu, Q.; Yao, Y.; Jia, K.; He, T.; Jiang, B.; et al. An Operational Approach for Generating the Global Land Surface Downward Shortwave Radiation Product From MODIS Data. IEEE Trans. Geosci. Remote Sens. 2019, 57, 4636–4650. [Google Scholar] [CrossRef]
- Wang, D. MODIS/Terra+Aqua Surface Radiation Daily/3-Hour L3 Global 1 km SIN Grid V061 [Data Set]. NASA EOSDIS Land Processes Distributed Active Archive Center. 2021. Available online: https://ladsweb.modaps.eosdis.nasa.gov/missions-and-measurements/products/MCD18A1/ (accessed on 11 March 2021).
- Hersbach, H.; Bell, B.; Berrisford, P.; Biavati, G.; Horányi, A.; Muñoz Sabater, J.; Nicolas, J.; Peubey, C.; Radu, R.; Rozum, I.; et al. ERA5 Hourly Data on Single Levels from 1940 to Present; Copernicus Climate Change Service (C3S) Climate Data Store (CDS): Brussels, Belgium, 2023. [Google Scholar] [CrossRef]
- Shi, G.-Y.; Hayasaka, T.; Ohmura, A.; Chen, Z.-H.; Wang, B.; Zhao, J.-Q.; Che, H.-Z.; Xu, L. Data Quality Assessment and the Long-Term Trend of Ground Solar Radiation in China. J. Appl. Meteorol. Climatol. 2008, 47, 1006–1016. [Google Scholar] [CrossRef]
- Tang, W.; Yang, K.; He, J.; Qin, J. Quality Control and Estimation of Global Solar Radiation in China. Sol. Energy 2010, 84, 466–475. [Google Scholar] [CrossRef]
- Tang, W.-J.; Yang, K.; Qin, J.; Cheng, C.C.K.; He, J. Solar Radiation Trend across China in Recent Decades: A Revisit with Quality-Controlled Data. Atmos. Chem. Phys. 2011, 11, 393–406. [Google Scholar] [CrossRef]
- Hansen, J.; Russell, G.; Rind, D.; Stone, P.; Lacis, A.; Lebedeff, S.; Ruedy, R.; Travis, L. Efficient Three-Dimensional Global Models for Climate Studies: Models I and II. Mon. Weather. Rev. 1983, 111, 609–662. [Google Scholar] [CrossRef]
- Tang, W.; Yang, K.; Sun, Z.; Qin, J.; Niu, X. Global Performance of a Fast Parameterization Scheme for Estimating Surface Solar Radiation From MODIS Data. IEEE Trans. Geosci. Remote Sens. 2017, 55, 3558–3571. [Google Scholar] [CrossRef]
- Tang, W.; Yang, K.; Qin, J.; Min, M. Development of a 50-Year Daily Surface Solar Radiation Dataset over China. Sci. China Earth Sci. 2013, 56, 1555–1565. [Google Scholar] [CrossRef]
- Wang, D.; Liang, S.; He, T. Mapping High-Resolution Surface Shortwave Net Radiation from Landsat Data. IEEE Geosci. Remote Sens. Lett. 2014, 11, 459–463. [Google Scholar] [CrossRef]
- Roesch, A.; Wild, M.; Ohmura, A.; Dutton, E.G.; Long, C.N.; Zhang, T. Assessment of BSRN Radiation Records for the Computation of Monthly Means. Atmos. Meas. Tech. 2011, 4, 339–354. [Google Scholar] [CrossRef]
- Wang, T.; Shi, J.; Husi, L.; Zhao, T.; Ji, D.; Xiong, C.; Gao, B. Effect of Solar-Cloud-Satellite Geometry on Land Surface Shortwave Radiation Derived from Remotely Sensed Data. Remote Sens. 2017, 9, 690. [Google Scholar] [CrossRef]
- Chen, L.; Yan, G.; Wang, T.; Ren, H.; Calbó, J.; Zhao, J.; McKenzie, R. Estimation of Surface Shortwave Radiation Components under All Sky Conditions: Modeling and Sensitivity Analysis. Remote Sens. Environ. 2012, 123, 457–469. [Google Scholar] [CrossRef]
- Huang, G.; Li, Z.; Li, X.; Liang, S.; Yang, K.; Wang, D.; Zhang, Y. Estimating Surface Solar Irradiance from Satellites: Past, Present, and Future Perspectives. Remote Sens. Environ. 2019, 233, 111371. [Google Scholar] [CrossRef]
- Wang, G.; Wang, T.; Xue, H. Validation and Comparison of Surface Shortwave and Longwave Radiation Products over the Three Poles. Int. J. Appl. Earth Obs. Geoinf. 2021, 104, 102538. [Google Scholar] [CrossRef]
- Wang, D.; Liang, S.; Zhang, Y.; Gao, X.; Brown, M.G.L.; Jia, A. A New Set of MODIS Land Products (MCD18): Downward Shortwave Radiation and Photosynthetically Active Radiation. Remote Sens. 2020, 12, 168. [Google Scholar] [CrossRef]
- Polo, J.; Wilbert, S.; Ruiz-Arias, J.A.; Meyer, R.; Gueymard, C.; Súri, M.; Martín, L.; Mieslinger, T.; Blanc, P.; Grant, I.; et al. Preliminary Survey on Site-Adaptation Techniques for Satellite-Derived and Reanalysis Solar Radiation Datasets. Sol. Energy 2016, 132, 25–37. [Google Scholar] [CrossRef]
- Thomas, C.; Wey, E.; Blanc, P.; Wald, L. Validation of Three Satellite-Derived Databases of Surface Solar Radiation Using Measurements Performed at 42 Stations in Brazil. Adv. Sci. Res. 2016, 13, 81–86. [Google Scholar] [CrossRef]
- Twomey, S. The Influence of Pollution on the Shortwave Albedo of Clouds. J. Atmos. Sci. 1977, 34, 1149–1152. [Google Scholar] [CrossRef]
- Albrecht, B.A. Aerosols, Cloud Microphysics, and Fractional Cloudiness. Science 1989, 245, 1227–1230. [Google Scholar] [CrossRef] [PubMed]
- Shi, G. Atmospheric Radiation; Science Press: Beijing, China, 2007. [Google Scholar]
- Zhou, X.; Bei, N.; Liu, H.; Cao, J.; Xing, L.; Lei, W.; Molina, L.T.; Li, G. Aerosol Effects on the Development of Cumulus Clouds over the Tibetan Plateau. Atmos. Chem. Phys. 2017, 17, 7423–7434. [Google Scholar] [CrossRef]
- You, Q.; Sanchez-Lorenzo, A.; Wild, M.; Folini, D.; Fraedrich, K.; Ren, G.; Kang, S. Decadal Variation of Surface Solar Radiation in the Tibetan Plateau from Observations, Reanalysis and Model Simulations. Clim. Dyn. 2013, 40, 2073–2086. [Google Scholar] [CrossRef]
- Yang, S.; Wang, X.L.; Wild, M. Causes of Dimming and Brightening in China Inferred from Homogenized Daily Clear-Sky and All-Sky in Situ Surface Solar Radiation Records (1958–2016). J. Clim. 2019, 32, 5901–5913. [Google Scholar] [CrossRef]
- Jia, A.; Liang, S.; Wang, D.; Jiang, B.; Zhang, X. Air Pollution Slows down Surface Warming over the Tibetan Plateau. Atmos. Chem. Phys. 2020, 20, 881–899. [Google Scholar] [CrossRef]
Figure 1.
Distribution of ground stations used to validate the accuracies of six radiation products.
Figure 1.
Distribution of ground stations used to validate the accuracies of six radiation products.

Figure 2.
Validation results of six DSR remote sensing products with ground-based measurements in 2015 and 2016. (a) ISCCP; (b) CERES; (c) Himawari-8; (d) GLASS; (e) MCD18A1; (f) ERA5.
Figure 2.
Validation results of six DSR remote sensing products with ground-based measurements in 2015 and 2016. (a) ISCCP; (b) CERES; (c) Himawari-8; (d) GLASS; (e) MCD18A1; (f) ERA5.

Figure 3.
Monthly variations in bias of monthly DSR. (a) ISCCP; (b) CERES; (c) Himawari-8; (d) GLASS; (e) MCD18A1; (f) ERA5. Units are W/m2.
Figure 3.
Monthly variations in bias of monthly DSR. (a) ISCCP; (b) CERES; (c) Himawari-8; (d) GLASS; (e) MCD18A1; (f) ERA5. Units are W/m2.

Figure 4.
Spatial distribution of bias in daily mean scale validation results for six DSR products at 16 ground station sites in 2015 and 2016. (a) ISCCP; (b) CERES; (c) Himawari-8; (d) GLASS; (e) MCD18A1; (f) ERA5; (A larger circle corresponds to a greater numerical magnitude, with the color green signifying negative values and red signifying positive values).

Figure 5.
Spatial distribution of RMSE in daily mean scale validation results for six DSR products at 16 ground station sites in 2015 and 2016. (a) ISCCP; (b) CERES; (c) Himawari-8; (d) GLASS; (e) MCD18A1; (f) ERA5. (The larger the circle, the darker its color, indicating a higher value).
Figure 5.
Spatial distribution of RMSE in daily mean scale validation results for six DSR products at 16 ground station sites in 2015 and 2016. (a) ISCCP; (b) CERES; (c) Himawari-8; (d) GLASS; (e) MCD18A1; (f) ERA5. (The larger the circle, the darker its color, indicating a higher value).

Figure 6.
Relationship between various statistical metrics of daily average validation results for DSR products and cloud area fraction.
Figure 6.
Relationship between various statistical metrics of daily average validation results for DSR products and cloud area fraction.

Figure 7.
Relationship between various statistical metrics of daily average validation results for DSR products and cloud optical thickness.
Figure 7.
Relationship between various statistical metrics of daily average validation results for DSR products and cloud optical thickness.

Figure 8.
Relationship between various statistical metrics of daily average validation results for DSR products and aerosol optical depth.
Figure 8.
Relationship between various statistical metrics of daily average validation results for DSR products and aerosol optical depth.


Table 1.
Detailed information of each radiation product used in this study.
| Products | Resolutions | Coverage | Main Methods |
|---|---|---|---|
| ISCCP-FH | Spatial: 1° × 1° | 1983.7–2017.7 | correlated K-distribution |
| Temporal: 3 h | |||
| CERES-SYN1deg Ed4A | Spatial: 1° × 1° | 2000.3–current | Fu-Liou radiative transfer code |
| Temporal: 1 h; 3 h; daily; monthly | |||
| GLASS DSR (V2.0) | Spatial: 5 km × 5 km | 2000–2020 | direct estimation method |
| Temporal: daily | |||
| Himawari-8 | Spatial: 5 km × 5 km | 2015–current | parameterization method |
| Temporal: 10 min; 1 h; daily; monthly | |||
| MCD18A1 (v061) | Spatial: 1 km × 1 km | 2001–current | look-up table (LUT) |
| Temporal: 3 h | |||
| ERA5 | Spatial: 0.25° × 0.25° | 1940–current | data assimilation |
| Temporal: 1 h |
Table 2.
Summary statistics of radiation product data compared to ground measurements, ‘/’ preceded by RMSE and followed by bias, units are W/m2.
Table 2.
Summary statistics of radiation product data compared to ground measurements, ‘/’ preceded by RMSE and followed by bias, units are W/m2.
| Site | ISCCP | CERES | ERA5 | GLASS | H8 | MCD18A1 | Average |
|---|---|---|---|---|---|---|---|
| Gangca | 30.81/−4.52 | 25.16/−6.19 | 36.72/12.05 | 31.12/−12.31 | 19.44/1.4 | 48.43/−10.97 | 31.95/−3.42 |
| Golmud | 33.47/0.07 | 19.48/0.44 | 31.71/11.27 | 23.79/−8.26 | 17.89/−2.63 | 35.08/10.53 | 26.9/1.9 |
| Gar | 20.48/−2.26 | 24.11/−7.4 | 27.84/5.94 | 29.54/−16.3 | 35.71/−12.81 | 39.12/−0.68 | 29.47/−5.58 |
| Nagqu | 36.73/13.86 | 29.66/3.44 | 55.03/32.99 | 39.54/−12.87 | 30.51/−7.91 | 57.53/−9.85 | 41.5/3.28 |
| Lhasa | 36.11/26.48 | 33.26/21.11 | 47.97/31.23 | 32.22/2.02 | 35.36/14.46 | 50.68/11.75 | 39.27/17.84 |
| Yushu | 34.23/1.47 | 29.12/2.75 | 51.84/32.82 | 38.76/−17.78 | 39.15/−13.95 | 54.7/−12.43 | 41.3/−1.19 |
| Golog | 34.78/−15.1 | 33.6/−15.52 | 40.24/14.21 | 46.55/−29.86 | 31.39/−14.99 | 65.41/−31.59 | 42.0/−15.48 |
| Chamdo | 35.14/10.0 | 33.69/4.09 | 53.02/31.86 | 32.97/−14.53 | 22.04/0.21 | 55.02/−11.44 | 38.65/3.37 |
| Garze | 33.04/−16.22 | 32.23/−11.95 | 39.92/8.75 | 41.55/−26.29 | 28.23/−10.08 | 57.81/−21.21 | 38.8/−12.83 |
| Hongyuan | 36.68/−23.03 | 32.0/−11.65 | 41.88/9.43 | 48.17/−27.68 | 43.74/−21.82 | 58.94/−24.43 | 43.57/−16.53 |
| BJ | 31.95/0.64 | 27.14/2.55 | 51.38/23.97 | 42.07/−25.89 | 34.74/−17.01 | 59.56/−12.84 | 41.14/−4.76 |
| QOMS | 29.69/−6.47 | 37.94/−27.99 | 33.88/−0.82 | 41.51/−28.42 | 40.73/−12.2 | 46.96/8.72 | 38.45/−11.2 |
| SETORS | 65.58/20.94 | 30.98/−3.65 | 48.33/2.46 | 47.36/−31.92 | 73.48/−57.87 | 89.78/−51.71 | 59.25/−20.29 |
| NADORS | 24.65/−6.05 | 27.39/−14.11 | 32.6/5.92 | 35.76/−27.53 | -/- | 35.33/1.02 | 31.15/−8.15 |
| MAWORS | 41.48/−16.36 | 47.03/−33.09 | 48.34/22.75 | 52.66/−37.98 | -/- | 73.18/−45.33 | 52.54/−18.34 |
| NAMORS | 38.83/−11.87 | 44.01/−28.87 | 45.62/−0.5 | 52.13/−33.83 | 62.36/−36.83 | 62.06/−21.95 | 50.84/−22.31 |
Table 3.
Accuracies of each product at different spatial resolutions.
| Products | ISCCP | CERES | ERA5 | Himawari-8 | GLASS | MCD18A1 | |
|---|---|---|---|---|---|---|---|
| 1° | bias (W/m²) | −2.20 | −7.57 | 16.30 | −12.77 | −21.35 | −16.24 |
| rbias (%) | 1.00 | 3.46 | 7.41 | 5.80 | 9.70 | 7.38 | |
| RMSE (W/m²) | 36.57 | 32.77 | 45.11 | 41.22 | 41.75 | 63.42 | |
| rRMSE (%) | 16.72 | 14.99 | 20.63 | 18.85 | 19.09 | 29.00 | |
| 0.75 | 0.80 | 0.66 | 0.72 | 0.75 | 0.57 | ||
| 0.25° | bias (W/m²) | 15.62 | −12.83 | −20.55 | −16.97 | ||
| rbias (%) | 7.14 | 5.83 | 9.34 | 7.71 | |||
| RMSE (W/m²) | 44.09 | 40.10 | 41.26 | 62.57 | |||
| rRMSE (%) | 20.16 | 18.34 | 18.89 | 28.61 | |||
| 0.68 | 0.72 | 0.78 | 0.61 | ||||
| 5 km | bias (W/m²) | −13.27 | −21.69 | −17.42 | |||
| rbias (%) | 6.11 | 9.92 | 7.92 | ||||
| RMSE (W/m²) | 39.70 | 40.86 | 61.77 | ||||
| rRMSE (%) | 18.26 | 18.68 | 28.24 | ||||
| 0.75 | 0.78 | 0.59 | |||||
Disclaimer/Publisher’s Note: The statements, opinions and data contained in all publications are solely those of the individual author(s) and contributor(s) and not of MDPI and/or the editor(s). MDPI and/or the editor(s) disclaim responsibility for any injury to people or property resulting from any ideas, methods, instructions or products referred to in the content. |
© 2024 by the authors. Licensee MDPI, Basel, Switzerland. This article is an open access article distributed under the terms and conditions of the Creative Commons Attribution (CC BY) license (https://creativecommons.org/licenses/by/4.0/).
Share and Cite
MDPI and ACS Style
Li, T.; Xin, X.; Zhang, H.; Yu, S.; Li, L.; Ye, Z.; Liu, Q.; Cai, H. Evaluation of Six Data Products of Surface Downward Shortwave Radiation in Tibetan Plateau Region. Remote Sens. 2024, 16, 791. https://doi.org/10.3390/rs16050791
AMA Style
Li T, Xin X, Zhang H, Yu S, Li L, Ye Z, Liu Q, Cai H. Evaluation of Six Data Products of Surface Downward Shortwave Radiation in Tibetan Plateau Region. Remote Sensing. 2024; 16(5):791. https://doi.org/10.3390/rs16050791
Chicago/Turabian StyleLi, Tianci, Xiaozhou Xin, Hailong Zhang, Shanshan Yu, Li Li, Zhiqiang Ye, Qinhuo Liu, and He Cai. 2024. "Evaluation of Six Data Products of Surface Downward Shortwave Radiation in Tibetan Plateau Region" Remote Sensing 16, no. 5: 791. https://doi.org/10.3390/rs16050791
Note that from the first issue of 2016, this journal uses article numbers instead of page numbers. See further details here.