
Technology Demonstration of Space Situational Awareness (SSA) Mission on Stratospheric Balloon Platform
 , ,
, ,
Abstract
:1. Introduction
1.1. Application of Wide Field-of-View (WFOV) Imagers for SSA
1.2. Research Objective
2. Mission Overview
3. Payload Design
3.1. Structure
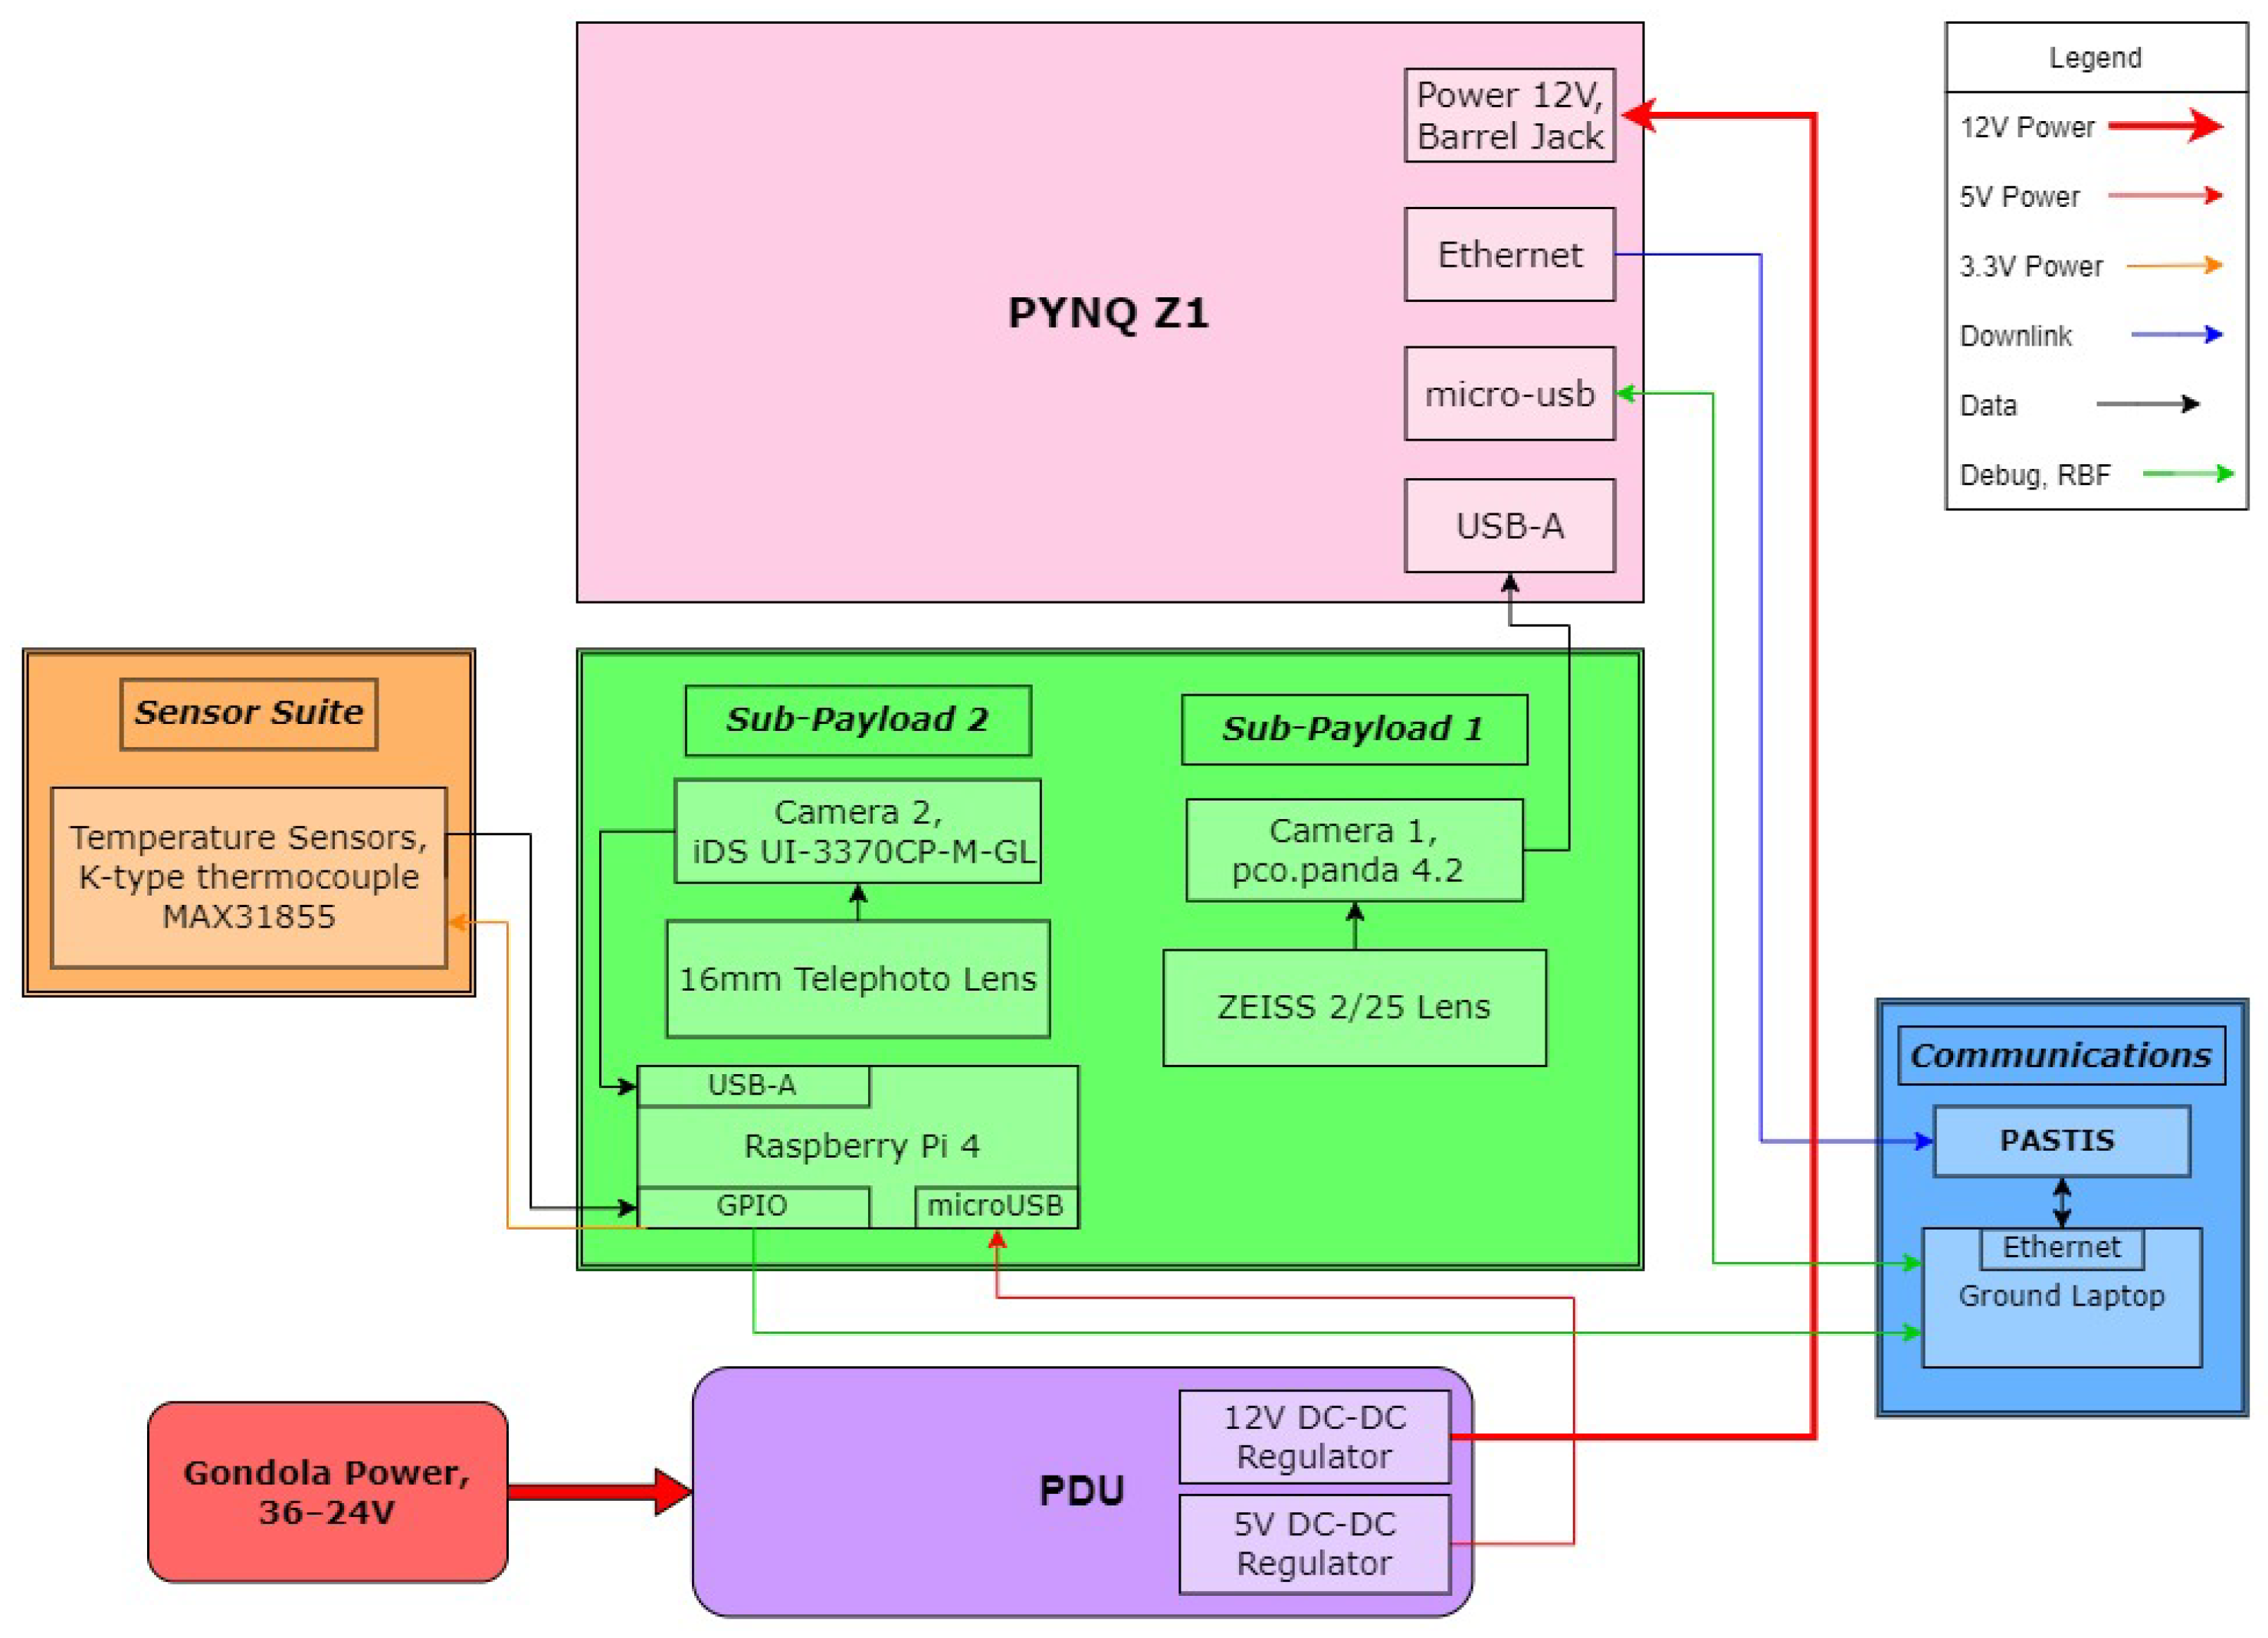
3.2. Electrical
3.3. Subpayload 1: Data Acquisition System
3.3.1. Optics
3.3.2. Electronics
3.3.3. Communications
3.4. Subpayload 2: Star Tracker Attitude and RSO Detection for Unified Space Technologies (STARDUST)
4. Payload Development
4.1. Mechanical Simulations
4.2. Thermal Testing
4.3. Vacuum Testing
4.4. Long-Form Communication Testing
4.5. Field Campaigns
5. Modes of Operation
5.1. Data Acquisition System (Subpayload 1) RSO Imaging
5.2. STARDUST (Subpayload 2) Camera Real-Time Operation
5.2.1. Real-Time Attitude Determination
5.2.2. Real-Time RSO Detection
6. Data Collection and Analysis
6.1. Flight Summary
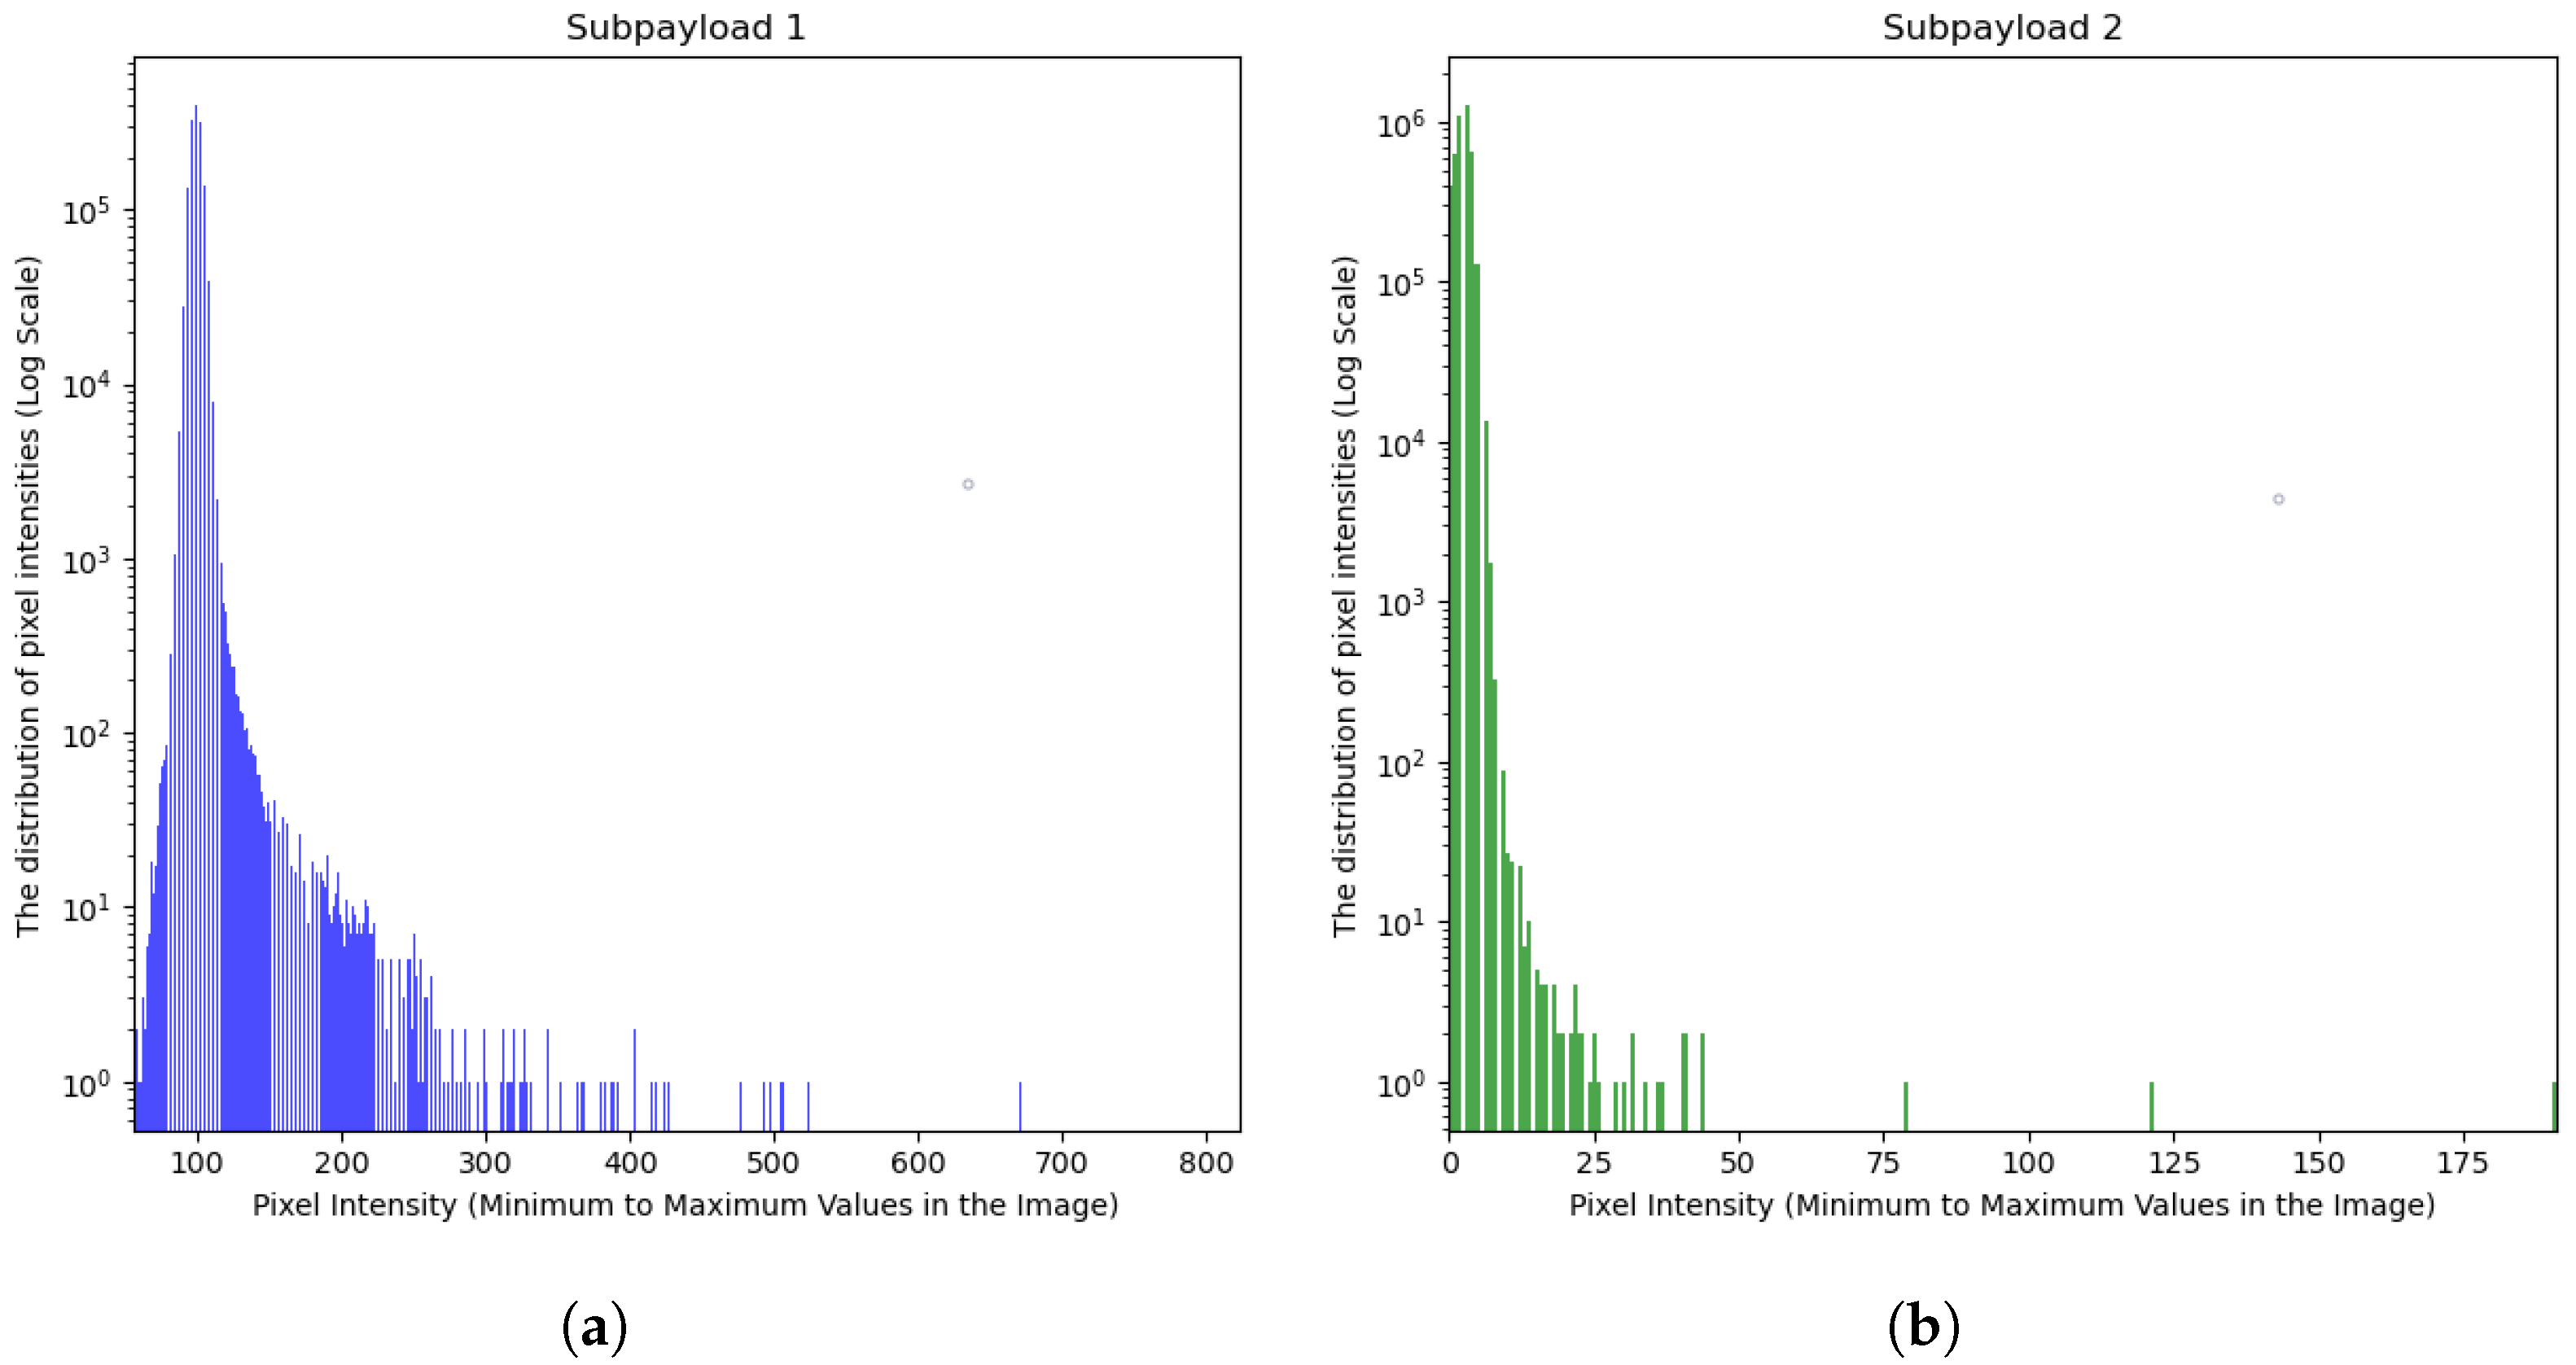
6.2. Subpayload 1
Data Telemetry
6.3. Subpayload 2
7. Results
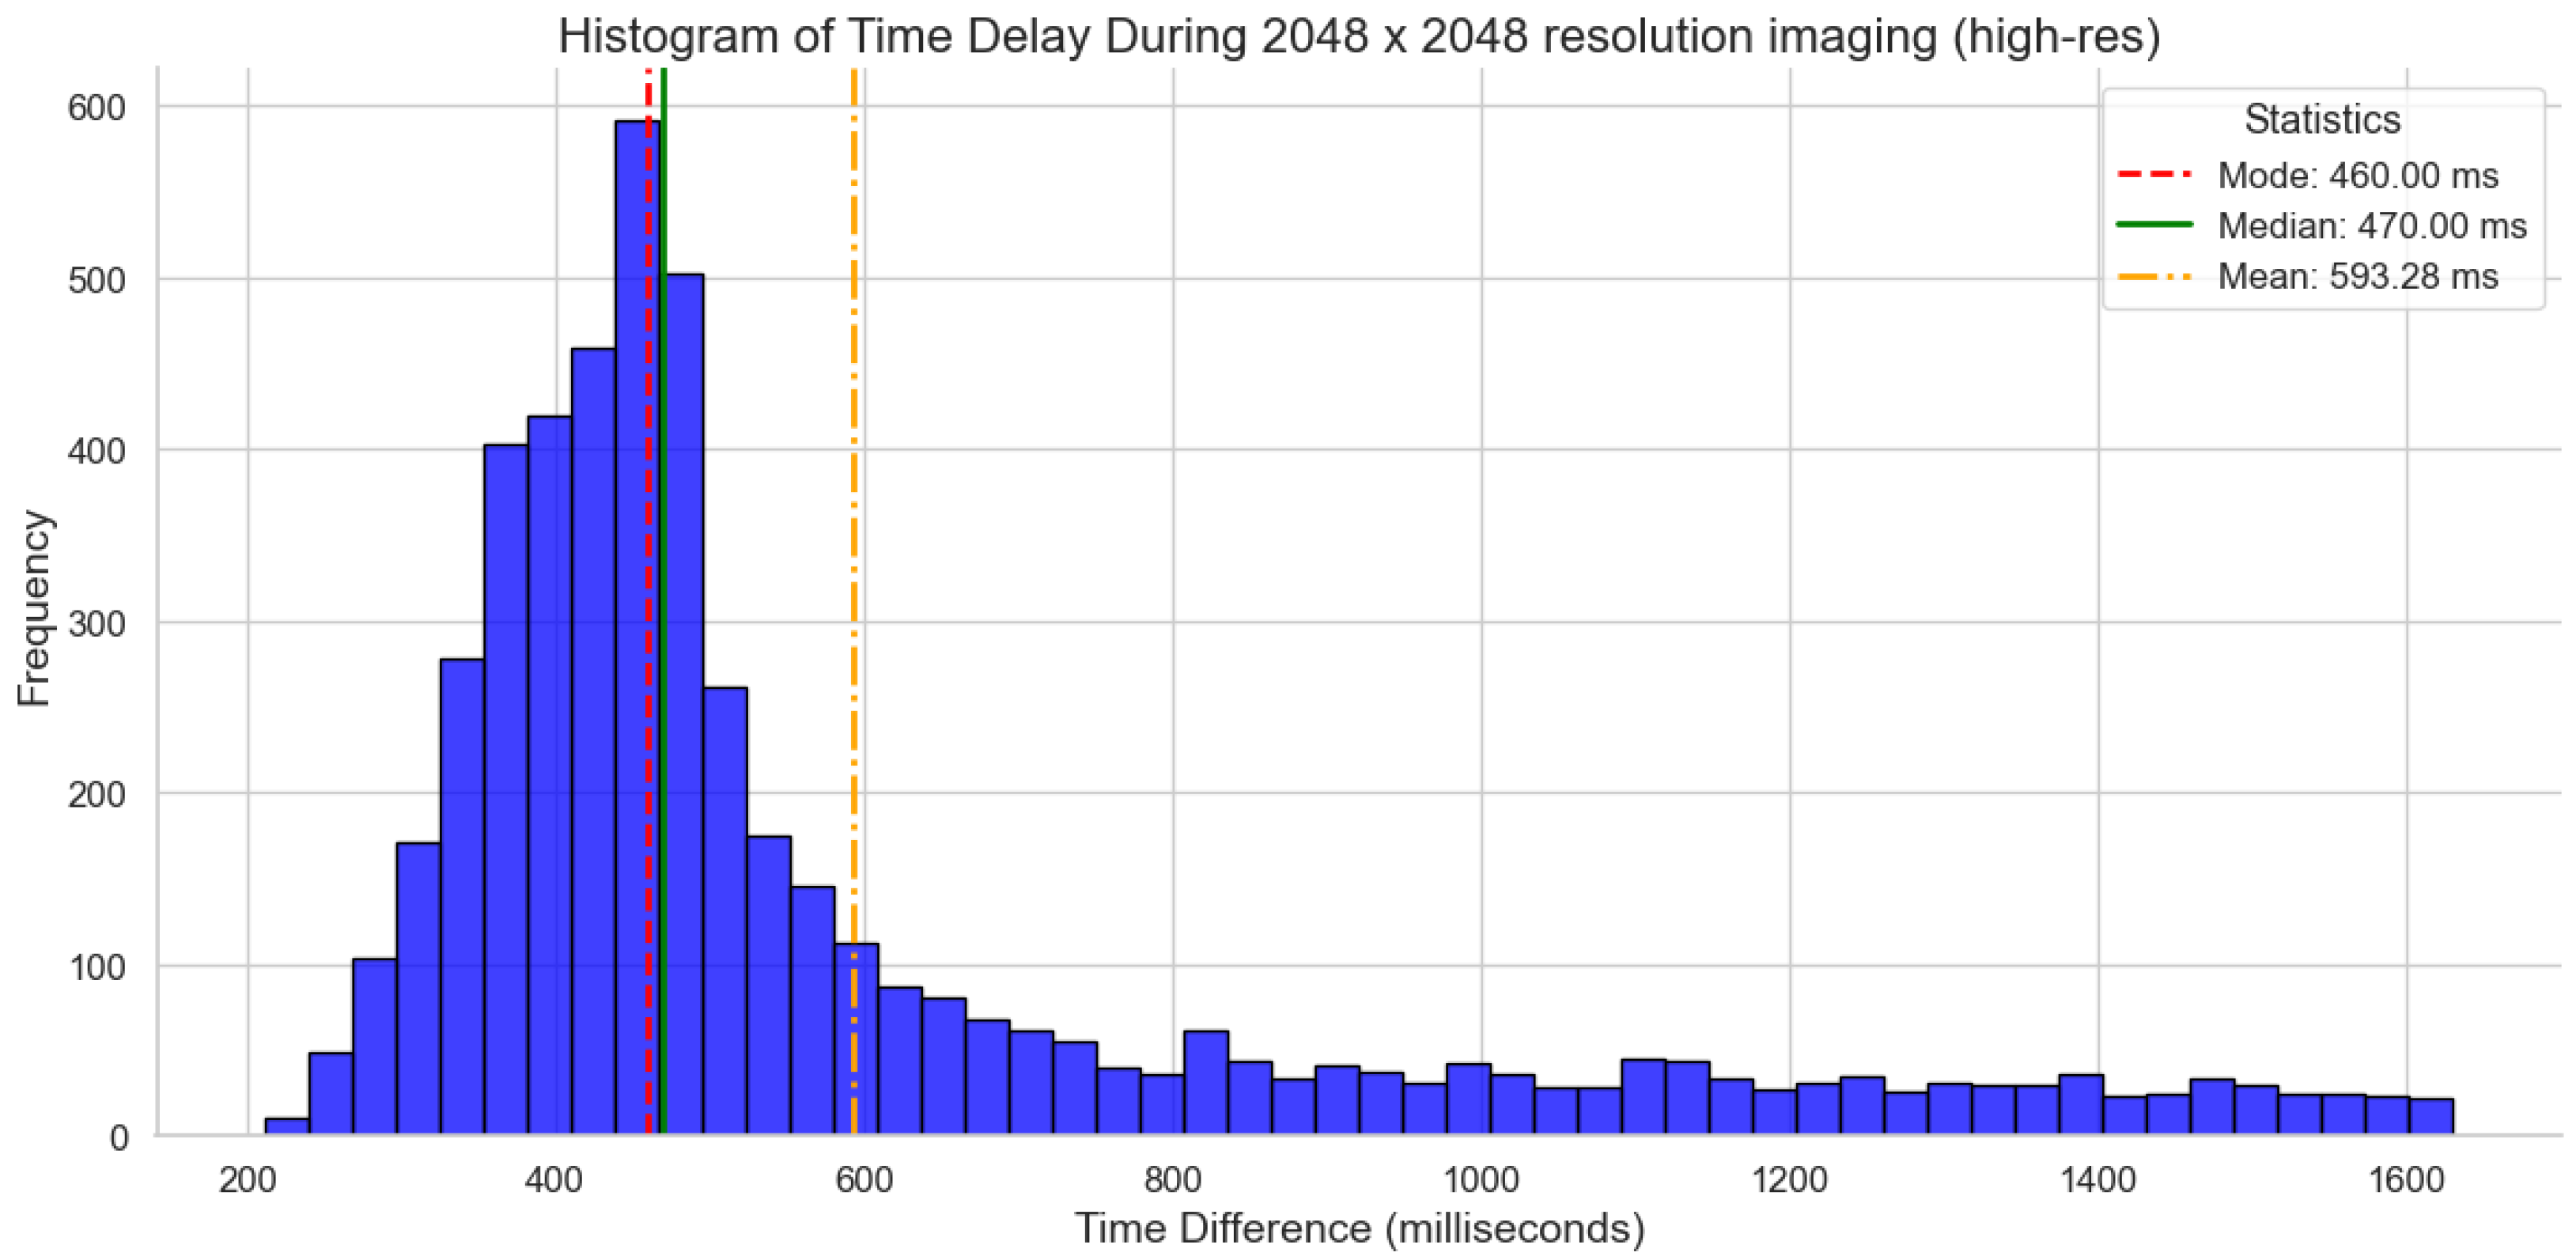
7.1. Delay Analysis
7.2. Thermal Analysis
7.3. Sensor Comparison
7.3.1. Limiting Magnitude
7.3.2. Field of View (FOV)
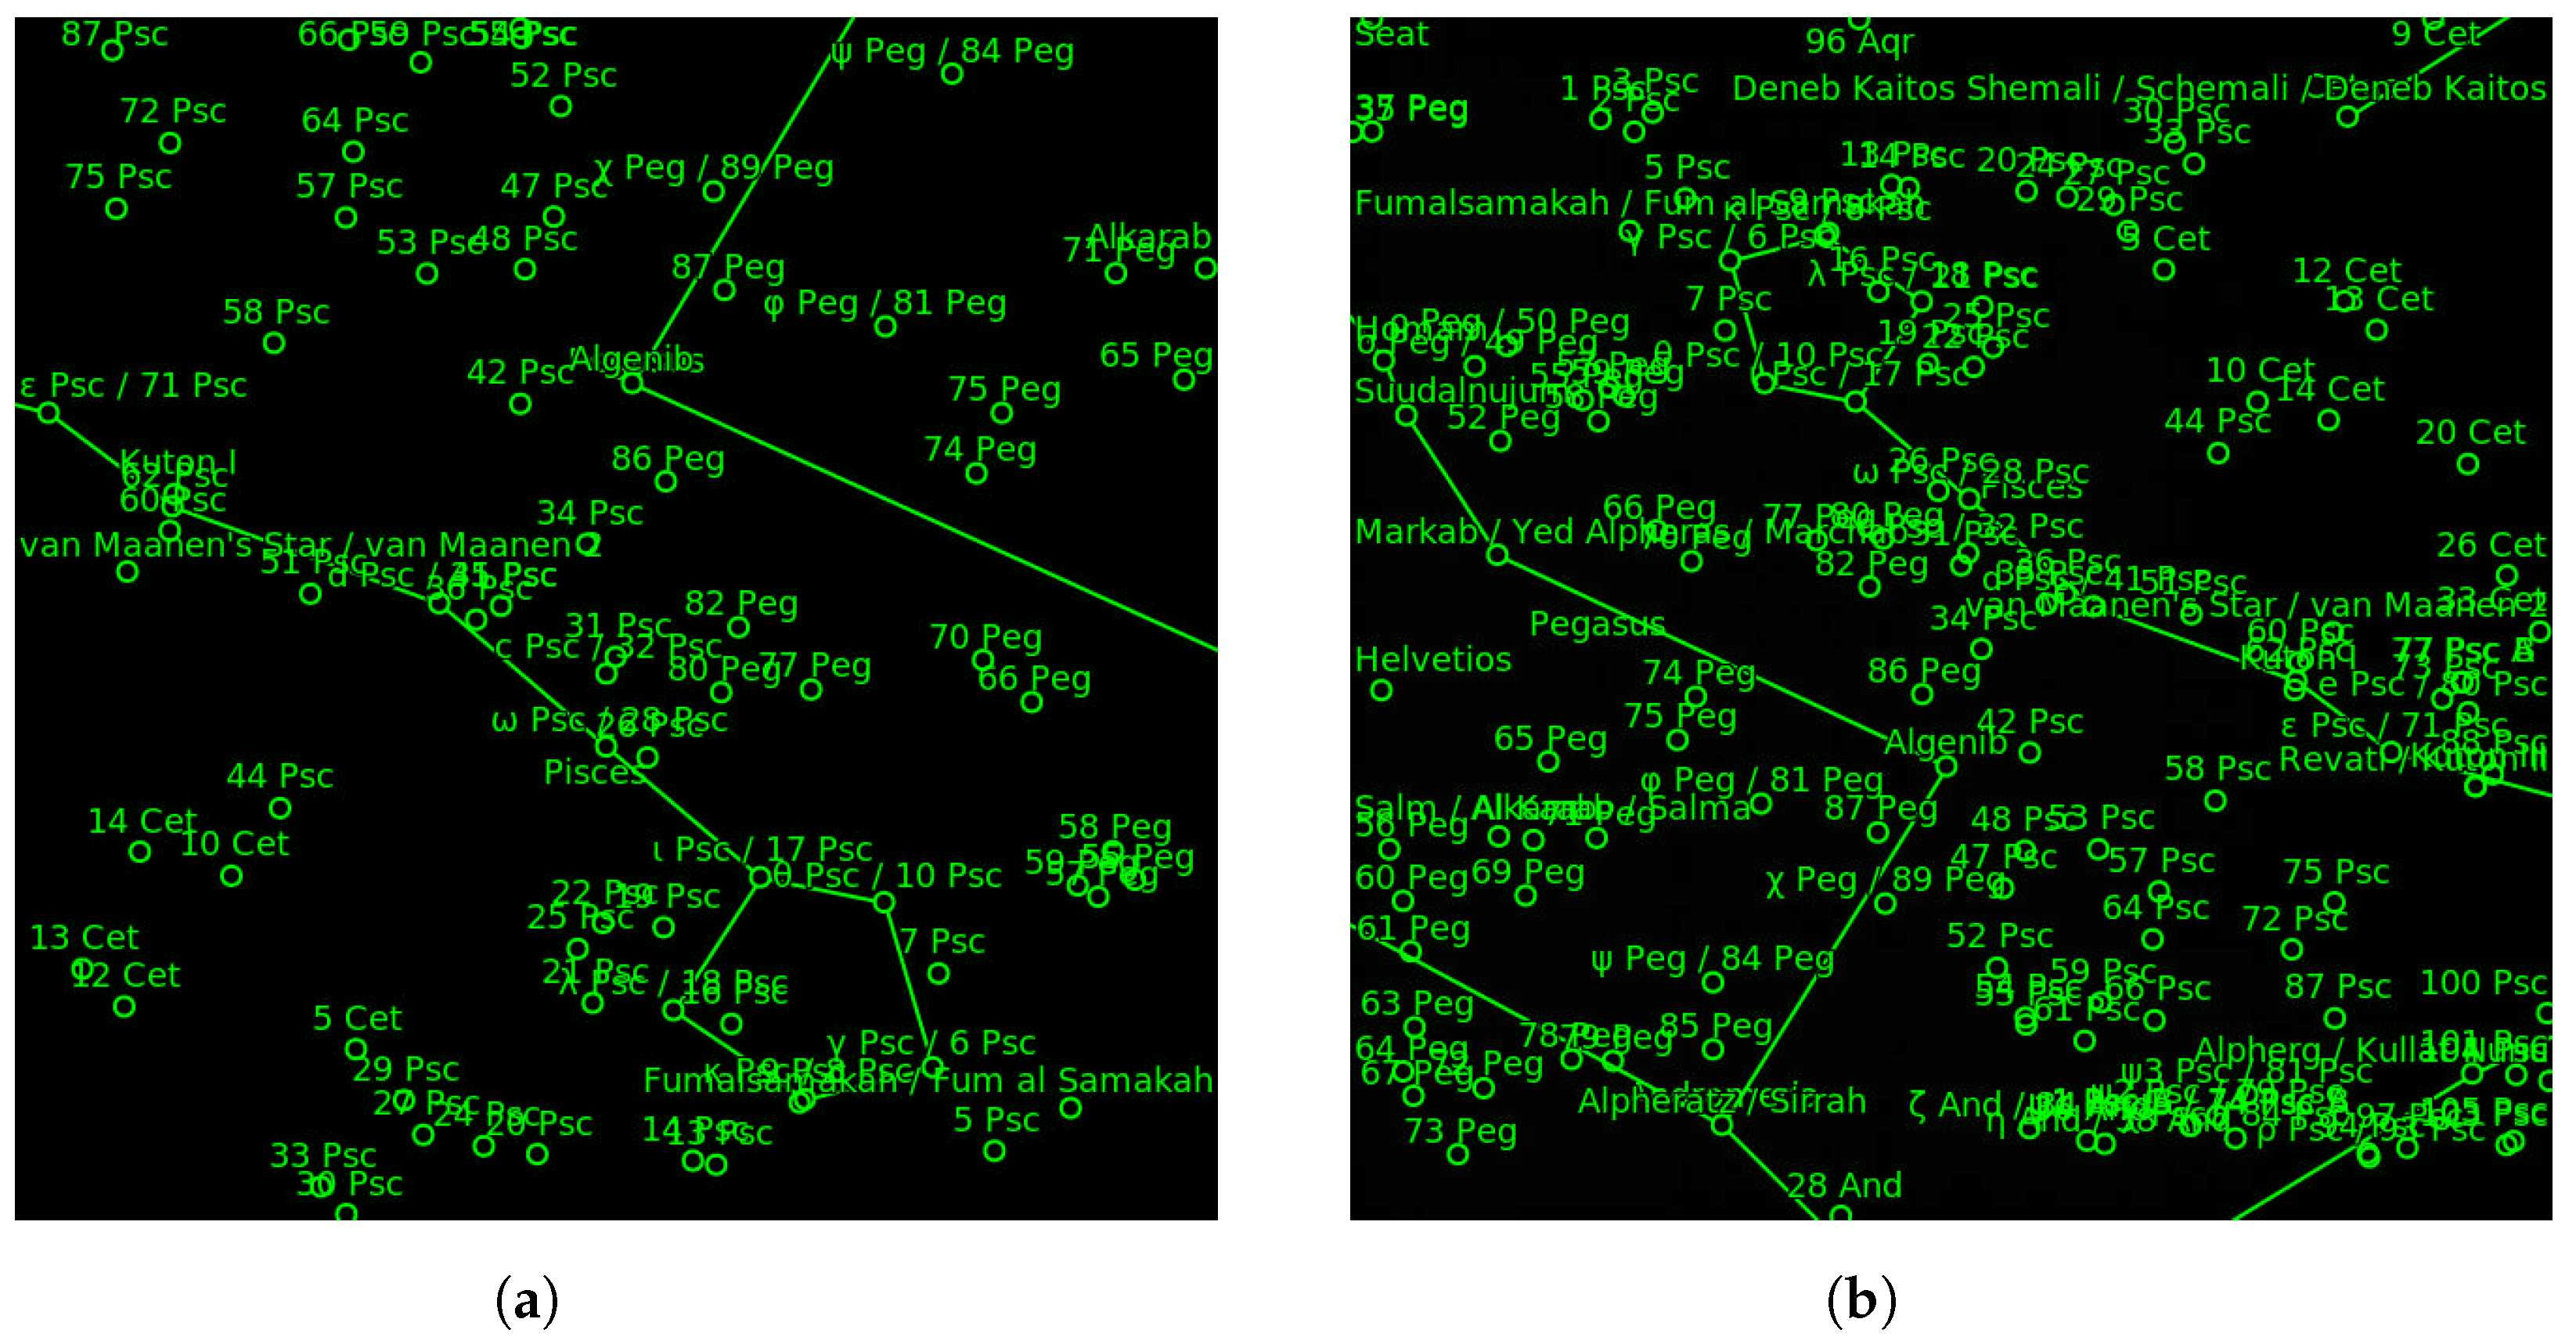
7.3.3. Star Detectability
7.3.4. RSO Detection
8. Discussion
8.1. Delay Analysis
8.2. Thermal Analysis
8.3. Sensor Comparison
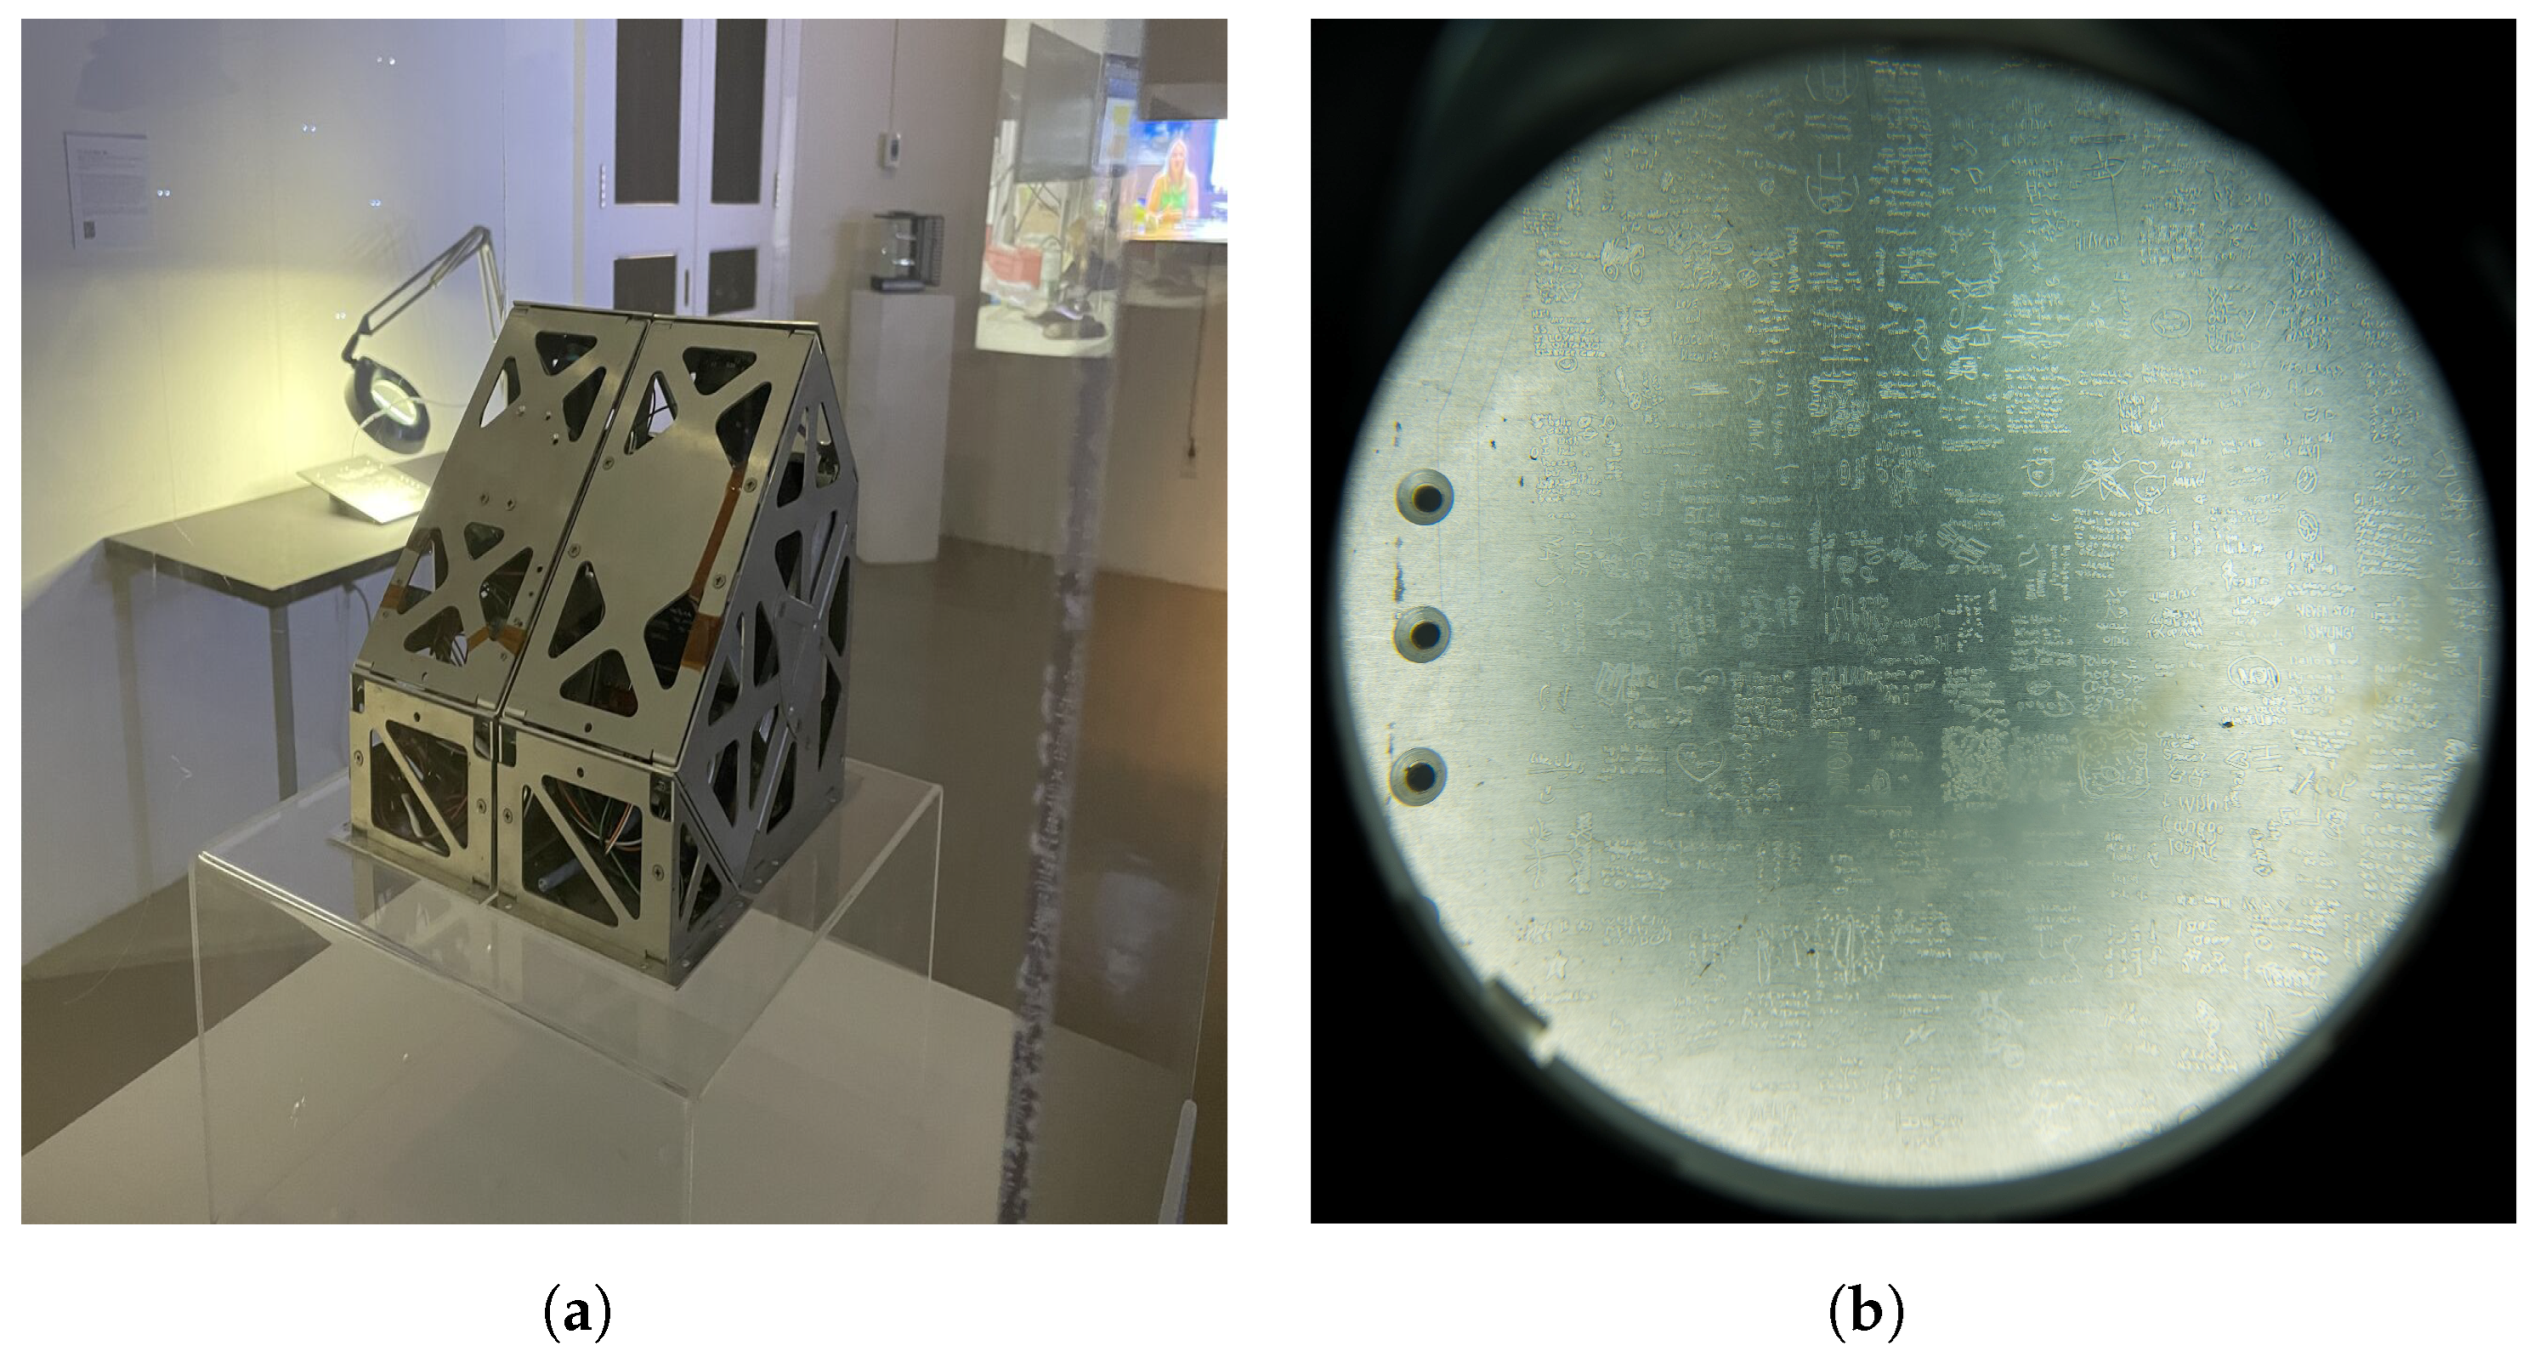
9. Outreach
10. Conclusions
Author Contributions
Funding
Data Availability Statement
Acknowledgments
Conflicts of Interest
References
- United Nations Office for Outer Space Affairs. Convention on Registration of Objects Launched into Outer Space. 1974. Available online: https://www.unoosa.org/oosa/en/ourwork/spacelaw/treaties/registration-convention.html (accessed on 18 January 2024).
- Johnson, N. The Collision of Iridium 33 and Cosmos 2251: The Shape of Things to Come. In Proceedings of the 60th International Astronautical Congress, Daejeon, Republic of Korea, 12–16 October 2009; Available online: https://ntrs.nasa.gov/citations/20100002023 (accessed on 18 January 2024).
- Astromaterials Research & Exploration Science. NASA Orbital Debris Program Office. Available online: https://orbitaldebris.jsc.nasa.gov/faq/ (accessed on 18 January 2024).
- Space Based Space Surveillance. Space Operations Command (SpOC). Available online: https://www.spoc.spaceforce.mil/About-Us/Fact-Sheets/Display/Article/2381700/space-based-space-surveillance (accessed on 18 January 2024).
- AURICAM Monitoring Camera. Sodern. Available online: https://sodern.com/wp-content/uploads/2021/12/Auricam.pdf (accessed on 18 January 2024).
- pco.panda 4.2 Ultra Compact SCMOS Camera; Excelitas PCO GmbH. pp. 1–7. Available online: https://www.excelitas.com/product-category/pco?referer=pco (accessed on 18 January 2024).
- Oelkers, R.J.; Stassun, K.G. Precision Light Curves from TESS Full-frame Images: A Different Imaging Approach. Astron. J. 2018, 156, 132. [Google Scholar] [CrossRef]
- Qashoa, R.; Lee, R. Classification of Low Earth Orbit (LEO) Resident Space Objects’ (RSO) Light Curves Using a Support Vector Machine (SVM) and Long Short-Term Memory (LSTM). Sensors 2023, 23, 6539. [Google Scholar] [CrossRef] [PubMed]
- Dave, S.; Clark, R.; Lee, R.S. RSOnet: An Image-Processing Framework for a Dual-Purpose Star Tracker as an Opportunistic Space Surveillance Sensor. Sensors 2022, 22, 5688. [Google Scholar] [CrossRef]
- Kunalakantha, P.; Baires, A.V.; Dave, S.; Clark, R.; Chianelli, G.; Lee, R.S. Stratospheric Night Sky Imaging Payload for Space Situational Awareness (SSA). Sensors 2023, 23, 6595. [Google Scholar] [CrossRef] [PubMed]
- Suthakar, V.; Sanvido, A.A.; Qashoa, R.; Lee, R.S.K. Comparative Analysis of Resident Space Object (RSO) Detection Methods. Sensors 2023, 23, 9668. [Google Scholar] [CrossRef]
- Strato-Science 2023 Campaign. Canadian Space Agency. Available online: https://www.asc-csa.gc.ca/eng/sciences/balloons/campaign-2023.asp (accessed on 18 January 2024).
- Ekos Precision Machining Inc. Available online: http://www.ekosprecisionmachining.com/ (accessed on 20 February 2024).
- McMaster Carr. Available online: https://www.mcmaster.com/ (accessed on 20 February 2024).
- MIL-DTL-26482 H. Available online: http://everyspec.com/MIL-SPECS/MIL-SPECS-MIL-DTL/MIL-DTL-26482H_6891/ (accessed on 20 February 2024).
- DC-DC Converter, PYBE30 Series. CUI Inc. Tualatin, USA. Available online: https://www.cui.com/product/resource/pybe30-t.pdf (accessed on 18 January 2024).
- ZEISS Dimension 2/25; Carl Zeiss AG. 2018, pp. 1–5. Available online: https://www.zeiss.com/content/dam/consumer-products/downloads/industrial-lenses/datasheets/en/dimension-lenses/datasheet-zeiss-dimension-225.pdf (accessed on 18 January 2024).
- Cogger, L.; Howarth, A.; Yau, A.; White, A.; Enno, G.; Trondsen, T.; Asquin, D.; Gordon, B.; Marchand, P.; Ng, D.; et al. Fast Auroral Imager (FAI) for the e-POP Mission. Space Sci. Rev. 2015, 189, 15–25. [Google Scholar] [CrossRef]
- Clemens, S.; Lee, R.; Harrison, P.; Soh, W. Feasibility of Using Commercial Star Trackers for On-Orbit Resident Space Object Detection. In Proceedings of the Advanced Maui Optical and Space Surveillance (AMOS) Technologies Conference, Maui, HI, USA, 11–14 September 2018; Available online: https://amostech.com/TechnicalPapers/2018/Space-Based_Assets/Clemens.pdf (accessed on 18 January 2024).
- Clark, R.; Fu, Y.; Dave, S.; Lee, R. Simulation of RSO images for space situation awareness (SSA) using parallel processing. Sensors 2021, 21, 7868. [Google Scholar] [CrossRef] [PubMed]
- PYNQ-Z1 Reference Manual. Digilent. Available online: https://digilent.com/reference/programmable-logic/pynq-z1/reference-manual?redirect=1 (accessed on 18 January 2024).
- Datasheet MicroSD Card 3TE4 Series; Innodisk: New Taipei City, Taiwan, 2021; pp. 1–2. Available online: https://www.innodisk.com/en/products/flash-storage/sd-card-and-microsd-card/microsd-card-3te4 (accessed on 18 January 2024).
- A Guide to Speed Classes for SD and microSD Cards. Kingston Technology. Available online: https://www.kingston.com/en/blog/personal-storage/memory-card-speed-classes (accessed on 18 January 2024).
- Raspberry Pi 4 Model B Datasheet. Raspberry Pi Foundation. Pencoed, Wales. Available online: https://www.raspberrypi.com/products/raspberry-pi-4-model-b/ (accessed on 18 January 2024).
- IDS UI-3370CP Rev. 2 Camera. IDS Imaging Inc. Obersulm, Gernmany. Available online: https://en.ids-imaging.com/store/ui-3370cp-rev-2.html (accessed on 18 January 2024).
- Telephoto Lens for Raspberry Pi HQ Camera. Adafruit Industries. Available online: https://www.adafruit.com/product/4562 (accessed on 18 January 2024).
- Datasheet SanDisk Extreme MicroSD. SanDisk. Available online: https://documents.westerndigital.com/content/dam/doc-library/en_us/assets/public/sandisk/product/memory-cards/extreme-uhs-i-microsd/data-sheet-extreme-uhs-i-microsd.pdf (accessed on 18 January 2024).
- Thermocouple Amplifier MAX31855 Breakout Board (MAX6675 Upgrade). Adafruit Industries. Available online: https://www.adafruit.com/product/269 (accessed on 18 January 2024).
- Thermocouple Type-K Glass Braid Insulated Stainless Steel Tip. Adafruit Industries. Available online: https://www.adafruit.com/product/3245 (accessed on 18 January 2024).
- Batin, F.F.; Bautista, R.A.; Dela Cruz, R.A.; Kalaw, J.; Martinez, F.K.; Tucio, P. Bortle Scale: A Way to Assess and Monitor the Urban Nightsky. 2021. Available online: https://www.researchgate.net/publication/360538981_Bortle_scale_A_way_to_assess_and_monitor_the_urban_nightsky (accessed on 18 January 2024).
- IRAF Zscale Scaling Algorithm. Center for Astrophysics. Available online: https://js9.si.edu/js9/plugins/help/scalecontrols.html (accessed on 18 January 2024).
- Chianelli, G.; Kunalakantha, P.; Myhre, M.; Lee, R.S.K. A Dual-Purpose Camera for Attitude Determination and Resident Space Object Detection on a Stratospheric Balloon. Sensors 2024, 24, 71. [Google Scholar] [CrossRef] [PubMed]
- Yale Bright Star Catalog. Harvard University. Available online: http://tdc-www.harvard.edu/catalogs/bsc5.html (accessed on 18 January 2024).
- Lohmann, A. Star Imager For Nanosatellite Applications. 2017. Available online: https://yorkspace.library.yorku.ca/server/api/core/bitstreams/50ecf197-cbc3-4503-8f34-c21f5456725d/content (accessed on 18 January 2024).
- Crassidis, J.L. Angular Velocity Determination Directly from Star Tracker Measurements. J. Guid. Control. Dyn. 2002, 25, 1165–1168. [Google Scholar] [CrossRef]
- Shell, J.R. Optimizing orbital debris monitoring with optical telescopes. In Proceedings of the Advanced Maui Optical and Space Surveillance (AMOS) Technologies Conference, Maui, HI, USA, 14–17 September 2010; Available online: https://amostech.com/TechnicalPapers/2010/Systems/Shell.pdf (accessed on 18 January 2024).
- About Dynamic. Excelitas PCO Knowledge Base. Available online: https://www.excelitas.com/sites/default/files/2023-01/PCO_WhitePaper_About%20Dynamic.pdf (accessed on 18 January 2024).
- Harris, W.E. A Comment on Image Detection and the Definition of Limiting Magnitude. Publ. Astron. Soc. Pac. 1990, 102, 949–953. [Google Scholar] [CrossRef]
- Astrometry.net. Available online: https://nova.astrometry.net/ (accessed on 18 January 2024).
- Stetson, P.B. Daophot: A Computer Program for Crowded-Field Stellar Photometry. Publ. Astron. Soc. Pac. 1987, 99, 191. [Google Scholar] [CrossRef]
- Perryman, M.A.C.; Lindegren, L.; Kovalevsky, J.; Hoeg, E.; Bastian, U.; Bernacca, P.L.; Crézé, M.; Donati, F.; Grenon, M.; Grewing, M.; et al. The HIPPARCOS Catalogue. Astron. Astrophys. 1997, 323, L49–L52. [Google Scholar]
- Ochsenbein, F.; Bauer, P.; Marcout, J. The VizieR database of astronomical catalogues. Astron. Astrophys. Suppl. Ser. 2000, 143, 23–32. [Google Scholar] [CrossRef]
- The Life Cycle of Celestial Objects Exhibit. McIntosh Gallery, Western University. Available online: https://www.events.westernu.ca/events/mcintosh-gallery/2023-09/opening-reception-the-life.html (accessed on 18 January 2024).


| Item | Mass (Grams) |
|---|---|
| Payload components | 2236.3 |
| Fasteners (screws, nuts, and washers) | 150.0 |
| Aluminum Parts and Frames (main body) | 1428.9 |
| Interface Plate | 1488.0 |
| Total Mass | 5303.2 |
| Nominal | Peak | Input | Nominal | Peak | |
|---|---|---|---|---|---|
| Current (A) | Current (A) | Voltage (V) | Power (W) | Power (W) | |
| Subpayload 1 | 0.37 | 0.39 | 28 | 10.36 | 10.92 |
| Subpayload 2 | 0.29 | 0.34 | 28 | 8.12 | 9.52 |
| Total Power (W) | 18.48 | 20.44 | |||
| Characteristic | AURICAM™ | PCO | FAI | IDS |
|---|---|---|---|---|
| Number Of Pixels | ||||
| Pixel size (µm) | 5.5 | 6.5 | 26 | 5.5 |
| Field-of-View (degrees) | 35 | 29.6 | 26 | 41 |
| Focal Length (mm) | 25 | 25 | 6.89 | 16 |
| Characteristic | PCO | IDS |
|---|---|---|
| Pixel Scale (arcsec/pixel) | 52.3 | 72.1 |
| Central Right Ascension (degrees) | 1.012 | 1.170 |
| Central Declination (degrees) | 9.816 | 10.757 |
| Orientation (East of North in degrees) | −153.6 | 153.4 |
| Radius (degrees) | 21.056 | 29.004 |
| PCO Panda 4.2 | IDS UI-3370CP-M-GL | |
|---|---|---|
| Analysis Period (min) | 92 | 92 |
| Total Images | 13,477 | 21,817 |
| Exposure Time (ms) | 100 | 100 |
| Resolution (pixels × pixels) | 2048 × 2048, 1024 × 1024 | 2048 × 2048 |
| FOV (deg × deg) | 29.6 × 29.6 | 41 × 41 |
| Unique RSOs Detected | 245 | 11 |
| Total RSO Detections | 30,855 | 669 |
Disclaimer/Publisher’s Note: The statements, opinions and data contained in all publications are solely those of the individual author(s) and contributor(s) and not of MDPI and/or the editor(s). MDPI and/or the editor(s) disclaim responsibility for any injury to people or property resulting from any ideas, methods, instructions or products referred to in the content. |
© 2024 by the authors. Licensee MDPI, Basel, Switzerland. This article is an open access article distributed under the terms and conditions of the Creative Commons Attribution (CC BY) license (https://creativecommons.org/licenses/by/4.0/).
Share and Cite
Qashoa, R.; Suthakar, V.; Chianelli, G.; Kunalakantha, P.; Lee, R.S.K. Technology Demonstration of Space Situational Awareness (SSA) Mission on Stratospheric Balloon Platform. Remote Sens. 2024, 16, 749. https://doi.org/10.3390/rs16050749
Qashoa R, Suthakar V, Chianelli G, Kunalakantha P, Lee RSK. Technology Demonstration of Space Situational Awareness (SSA) Mission on Stratospheric Balloon Platform. Remote Sensing. 2024; 16(5):749. https://doi.org/10.3390/rs16050749
Chicago/Turabian StyleQashoa, Randa, Vithurshan Suthakar, Gabriel Chianelli, Perushan Kunalakantha, and Regina S. K. Lee. 2024. "Technology Demonstration of Space Situational Awareness (SSA) Mission on Stratospheric Balloon Platform" Remote Sensing 16, no. 5: 749. https://doi.org/10.3390/rs16050749