
OII: An Orientation Information Integrating Network for Oriented Object Detection in Remote Sensing Images

State Key Laboratory of Information Engineering in Surveying Mapping and Remote Sensing, Wuhan University, Wuhan 430079, China
*
Author to whom correspondence should be addressed.
Remote Sens. 2024, 16(5), 731; https://doi.org/10.3390/rs16050731
Submission received: 28 December 2023
/
Revised: 12 February 2024
/
Accepted: 16 February 2024
/
Published: 20 February 2024
(This article belongs to the Special Issue Object Detection and Information Extraction Based on Remote Sensing Imagery)
Abstract
:Oriented object detection for remote sensing images poses formidable challenges due to arbitrary orientation, diverse scales, and densely distributed targets (e.g., across terrain). Current investigations in remote sensing object detection have primarily focused on improving the representation of oriented bounding boxes yet have neglected the significant orientation information of targets in remote sensing contexts. Recent investigations point out that the inclusion and fusion of orientation information yields substantial benefits in training an accurate oriented object system. In this paper, we propose a simple but effective orientation information integrating (OII) network comprising two main parts: the orientation information highlighting (OIH) module and orientation feature fusion (OFF) module. The OIH module extracts orientation features from those produced by the backbone by modeling the frequency information of spatial features. Given that low-frequency components in an image capture its primary content, and high-frequency components contribute to its intricate details and edges, the transformation from the spatial domain to the frequency domain can effectively emphasize the orientation information of images. Subsequently, our OFF module employs a combination of a CNN attention mechanism and self-attention to derive weights for orientation features and original features. These derived weights are adopted to adaptively enhance the original features, resulting in integrated features that contain enriched orientation information. Given the inherent limitation of the original spatial attention weights in explicitly capturing orientation nuances, the incorporation of the introduced orientation weights serves as a pivotal tool to accentuate and delineate orientation information related to targets. Without unnecessary embellishments, our OII network achieves competitive detection accuracy on two prevalent remote sensing-oriented object detection datasets: DOTA (80.82 mAP) and HRSC2016 (98.32 mAP).
1. Introduction
The significance of remote sensing object detection is underscored across diverse domains, encompassing aerial reconnaissance, disaster relief, and resource exploration. Objects in aerial images pose a formidable challenge for oriented object detection due to their arbitrary orientation and dense distribution, which is in contrast to natural images. Driven by the accelerated evolution of neural networks, various methodologies have shifted towards employing convolution neural networks (CNNs) to address the intricacies associated with object detection in the realm of remote sensing.
However, conventional CNNs encounter significant challenges in representing instances with arbitrary orientation due to their inability to model orientation variation explicitly. In recent years, a common trend in the mainstream is to generate bounding boxes that accurately align with the orientation of detected objects instead of simply creating horizontal bounding boxes around them. As a result, considerable research has been dedicated to enhancing the representation of oriented bounding boxes for remote sensing detection. Parametric regression is a prevalent approach for oriented object detection, prominently involving five-parameter regression techniques [1,2,3,4] and eight-parameter regression methodologies [5,6]. The widely employed five-parameter regression methods achieve the detection of rotated bounding boxes with arbitrary orientation by defining a rectangle with parameters , introducing an additional angle parameter within the range of or . In order to address the boundary discontinuity issues arising from angular periodicity, Yang et al. [7] proposed adopting circular smooth labels (CSLs) to minimize training errors between adjacent angles. Furthermore, to better capture orientation variations, certain two-stage detectors [1,6,8,9,10] dynamically generate candidate proposals with diverse scales, aspect ratios, and angles. By embracing a densely anchor-based generation strategy, these methods enable the detection of objects with varying aspect ratios and angles while minimizing background noise. Nevertheless, it is essential to acknowledge that while these approaches effectively model orientation variations through dense anchors, they come with a notable increase in computational cost.
In conjunction with the aforementioned methodologies, several studies [11,12,13,14,15] have focused on generating enhanced features to augment the performance of oriented object detection. The efficacy of features is significantly influenced by the mechanism used for feature selection. Among the predominant techniques in feature selection, attention mechanisms are widely used to accentuate crucial spatial features while suppressing redundant ones. Zhang et al. [11] introduced a spatial- and scale-aware attention module that dynamically attends to salient regions within feature maps at relevant scales. The spatial-aware features assist the network in addressing objects and backgrounds characterized by sparse texture and low contrast, while the scale-aware features contribute to handling scale variations. The synergistic integration of these two aspects is instrumental in accurately localizing targets in remote sensing images. However, these attention modules tend to emphasize the localization information of targets in images, often neglecting orientation details. This oversight results in diminished accuracy in encapsulating oriented bounding boxes.
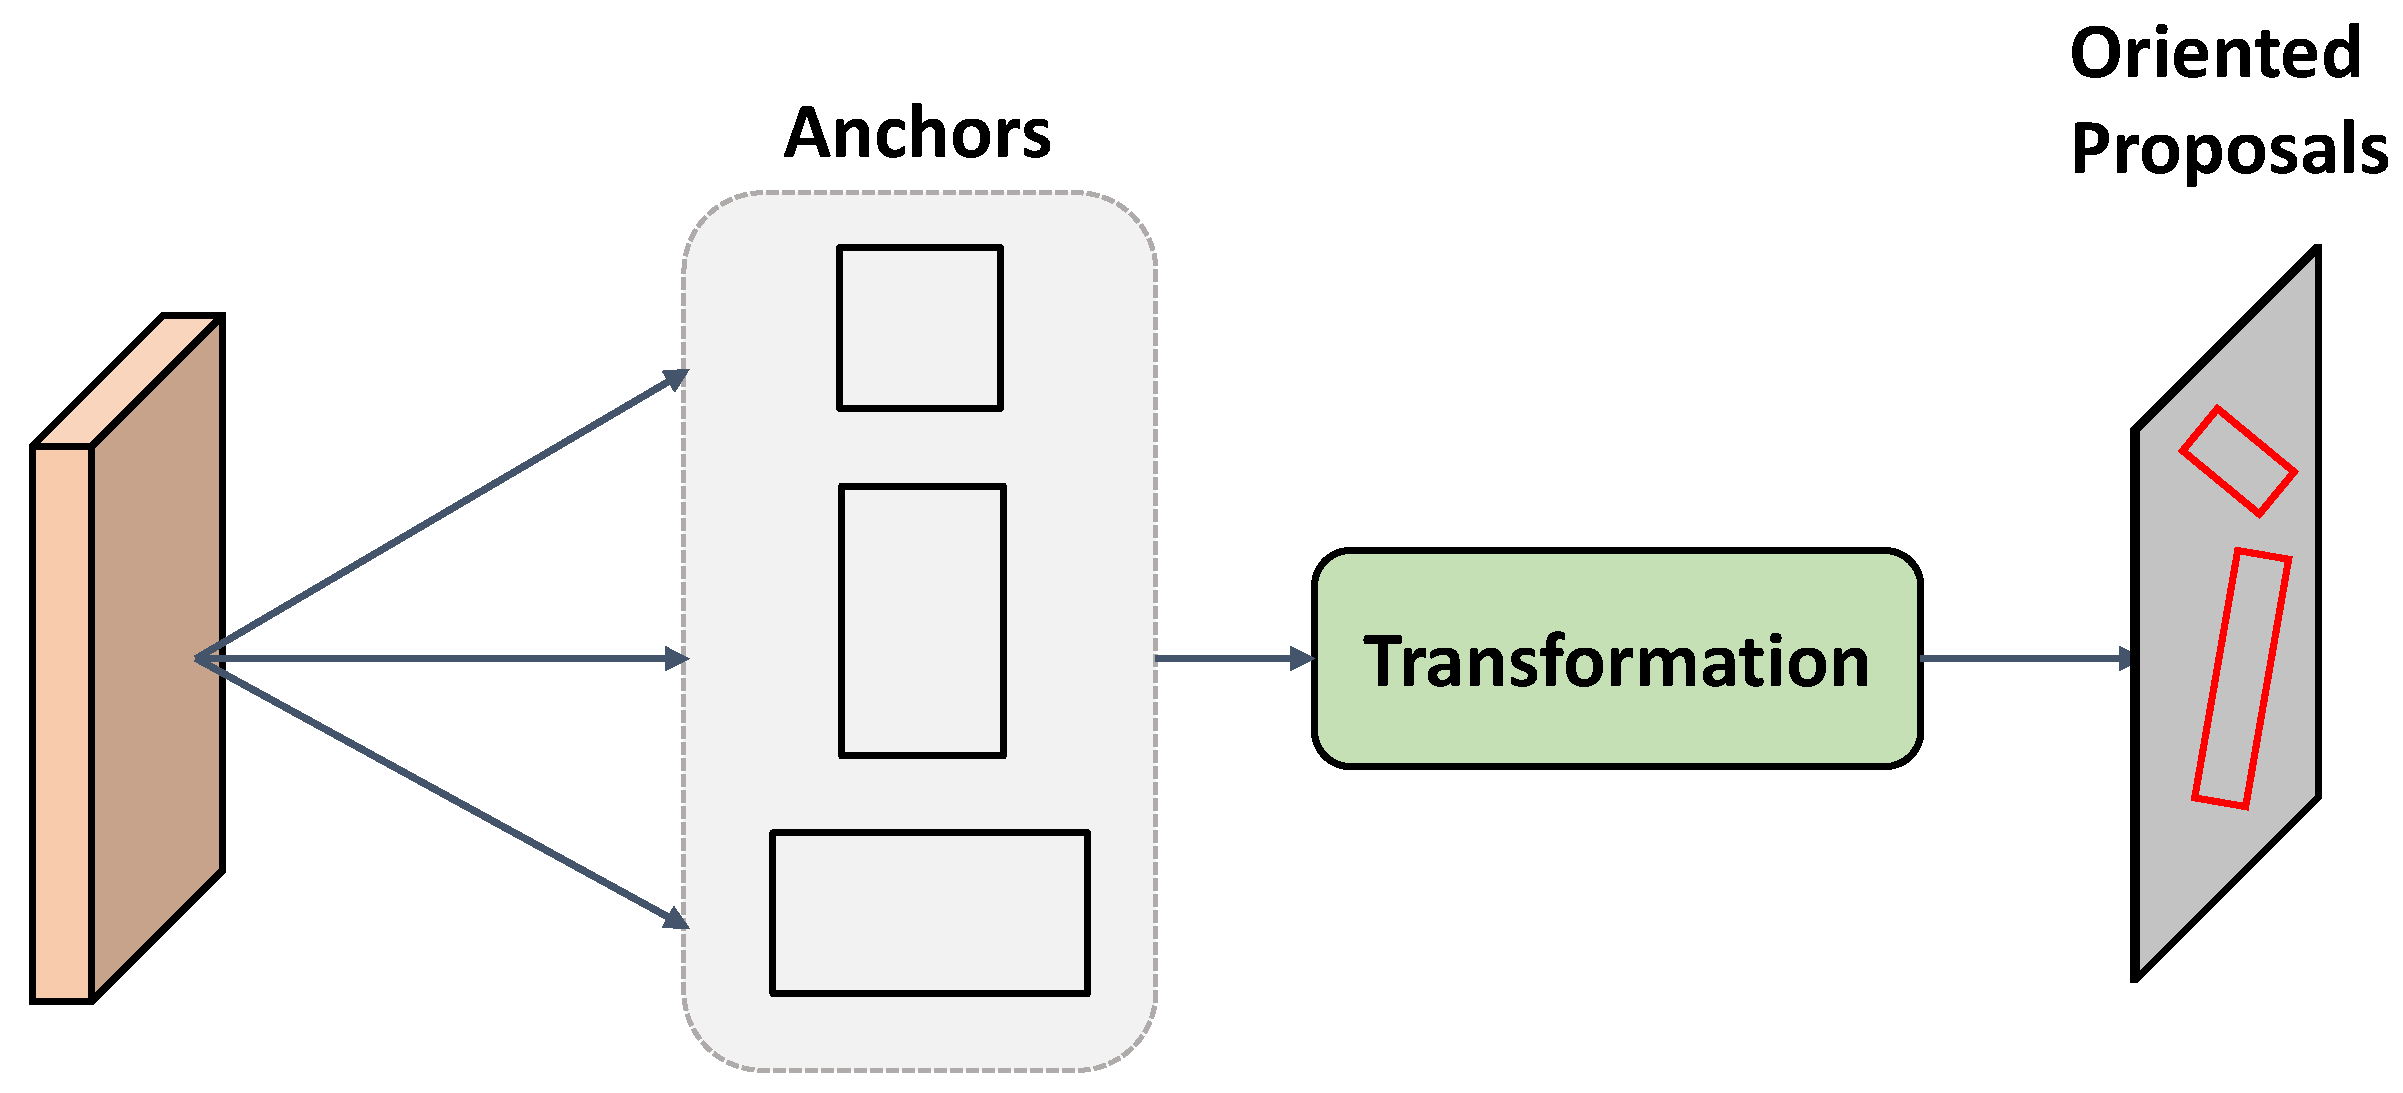
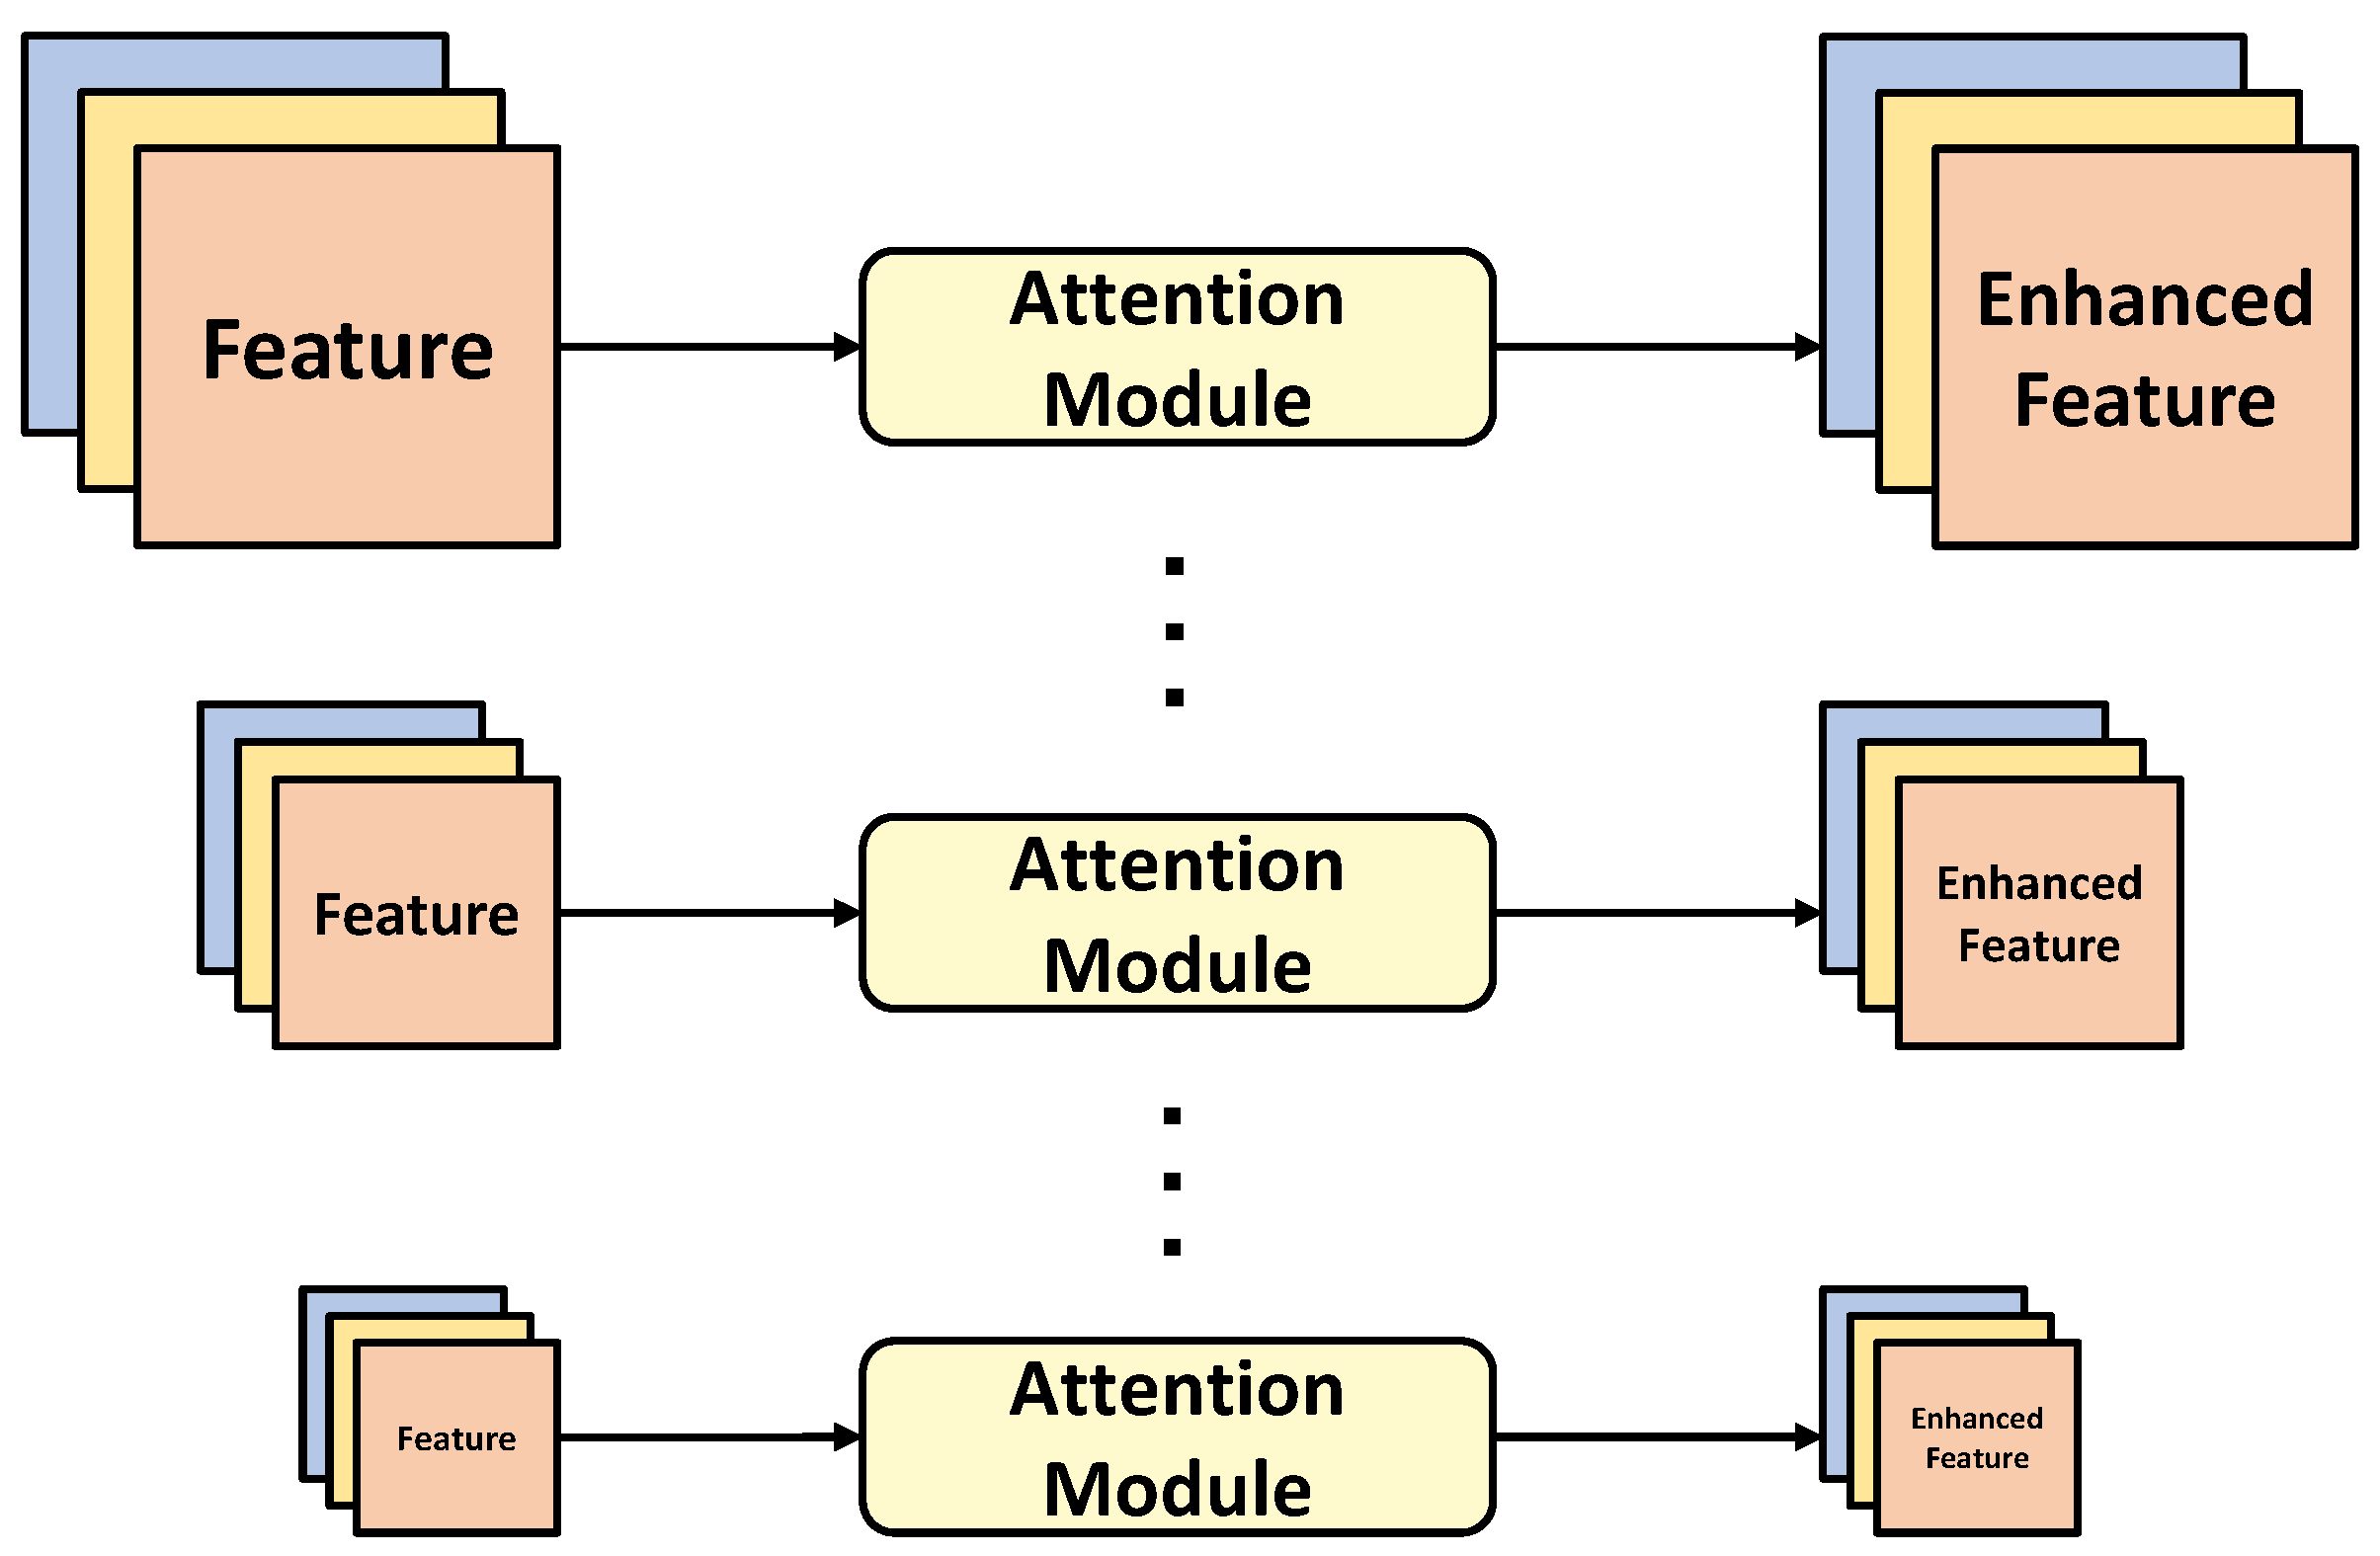
As depicted in Figure 1, contemporary two-stage rotated object detectors [1,10] have departed from the preceding dense anchor generation strategy, which incurs decreased computational demands for acquiring oriented features. After defining the anchors with different aspect ratios, such as with YOLO [16], these two-stage detectors ultimately derive rotated proposals through a sequence of transformations. Despite reducing a substantial computational burden compared to previous dense anchor strategies, these two-stage detectors still require manual prior information for network optimization. For targets densely distributed within images and exhibiting arbitrary orientations, the manual prior information is inadequate to encompass all scenarios. This limitation may result in difficulties for the detector to accurately fit certain ground truth (GT) instances, consequently leading to a degradation in detector performance. This suggests a potential need for auxiliary utilization of certain intrinsic information within images. Figure 2 illustrates the coarse architecture of feature enhancement using attention mechanisms. The attention modules and other feature enhancement components are designed to emphasize the location of targets in remote sensing images. Subsequently, classification and bounding box regression are performed on the enhanced features to obtain the final detection results. However, these enhanced features predominantly focus on the spatial positional information of the targets, neglecting orientation information and making it challenging for the network to model orientation. In order to address this challenge, Zheng et al. [17] employed a transformation from the spatial domain to the frequency domain to extract orientation information. Subsequently, self-attention was applied to amplify the feature output from the backbone block. However, incorporating self-attention operations after each backbone block resulted in a notable escalation of computational overhead and memory consumption.
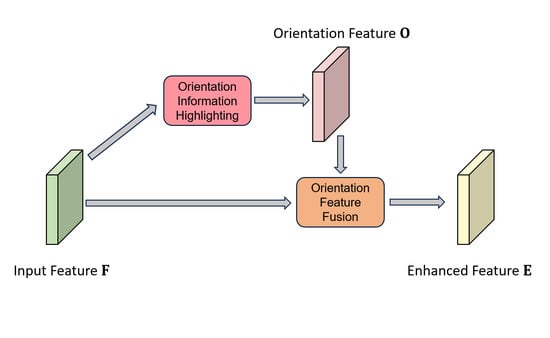
Motivated by the principles of frequency-domain orientation learning (FDOL) [17] and insights from attention mechanisms [18,19,20], we propose a novel network, termed orientation information integrating (OII), for the detection of rotated objects in remote sensing images. Initially, the orientation information highlighting (OIH) module is designed to extract orientation features with diverse angles by transitioning from the spatial domain to the frequency domain. The frequency domain analysis proves effective in accentuating details and edges between foreground objects and the background. Subsequently, an orientation feature fusion (OFF) module was developed to compute the orientation weights and original spatial weights to enhance the CNN features generated by the backbone stage layers. The combination of orientation weights and spatial weights serves as the control gate to enhance the backbone features. In contrast to prior efforts [17], our approach captures more nuanced relationships between the orientation information and the spatial location information, effectively enhancing the representation ability of the backbone features. Ultimately, the enriched features are input into the neck and box head to facilitate the efficient detection of oriented objects in remote sensing images. The primary contributions of this study encompass three key aspects:
- We introduce an innovative OIH module designed for extracting orientation features across different scales and angles. By diverging from the predefined anchors and traditional feature extraction by CNN, our OIH utilizes a straightforward yet highly efficient frequency analysis approach for capturing orientation information.
- Within the OFF module, we use a combination of a CNN attention mechanism and self-attention to generate orientation weights and original spatial weights. We integrate these two weights to reinforce our features, imbuing them with both rich orientation information and spatial positional information simultaneously.
- Upon integrating the OIH and OFF modules within the intermediary layers connecting the backbone and neck, our proposed OII network surpasses numerous state-of-the-art methods when evaluated on the DOTA and HRSC2016 datasets. This substantiates the efficacy of incorporating orientation information into CNN features for detecting rotated objects in remote sensing scenarios.
The remainder of this paper is structured as follows: Section 2 provides a comprehensive review of the recent methodologies related to oriented object detection and attention mechanisms. The specifics of our proposed method are elucidated in Section 3. Section 4 presents the results obtained from our model and shows a comparative analysis against several state-of-the-art methods. Finally, Section 5 summarizes the article and delineates the potential directions for future research.
2. Related Works
2.1. Oriented Object Detection in Remote Sensing
In contrast to object detection in natural images, oriented object detection in remote sensing images poses heightened challenges due to arbitrary orientations and diverse object scales. Conventional object detection methods [16,21,22], such as YOLO and Faster R-CNN, rely on horizontal bounding boxes and face limitations in accurately localizing oriented objects. This is attributed to the potential inclusion of excessive background noise or multiple objects within the horizontal bounding boxes, resulting in a disparity between classification confidence and localization accuracy. To address this issue, researchers have explored various avenues. The present works in oriented object detection can be categorized into anchor-based and anchor-free detectors.
For anchor-based detectors, a common strategy involves the use of rotated anchors, as demonstrated by the rotated region proposal network (rotated RPN) [9], wherein anchors are predefined with varying angles, scales, and aspect ratios. However, the adoption of a dense anchor strategy imposes a considerable computational demand and increases the overall memory footprint. In order to address this computational challenge, Ding et al. [1] introduced the RoI transformer, using fully connected layers to generate rotated regions of interest (RoIs) from candidate horizontal RoIs generated by the RPN. While this approach notably enhances the accuracy of detecting oriented objects, it introduces additional parameters and complexity to the network due to the inclusion of fully connected layers and RoI alignment operations during the learning process of rotated RoIs. In an effort to alleviate this issue, oriented RCNN [10] employs convolutions instead of fully connected layers to generate rotated RoIs. Some methodologies [23,24,25] treat oriented object detection as a point detection task [26], providing an innovative perspective on remote sensing object detection.
Moreover, certain methodologies [7,27,28,29,30,31,32,33,34,35] directly undertake the classification and regression of oriented bounding boxes without using region proposal generation and RoI alignment operations. These approaches are commonly referred to as one-stage or anchor-free methods. For instance, Han et al. [27] introduced a single-shot alignment network (ANet), which aims to mitigate the mismatch between classification scores and location accuracy through orientation-invariant feature extraction and oriented feature alignment. Ming et al. [30] devised a novel sparse label assignment (SLA) strategy, leveraging the RetinaNet [36] framework for one-stage oriented object detection. Pan et al. [31] proposed a dynamic refinement network (DRN) based on CenterNet [25], which uses an attention mechanism to dynamically refine features extracted from the backbone for more precise predictions. AOPG [37] and R3Det [32] use a progressive regression method, iteratively enhancing the precision of bounding boxes from coarse to finer granularity. Beyond CNN-based detectors, AO2-DETR [38] expands the research landscape by introducing the transformer framework, thereby fostering diversity in remote sensing object detection research.
In addition to the aforementioned methodologies, a considerable body of work [5,6,7,39,40,41,42] has explored the definition of various forms of oriented bounding boxes to represent oriented objects effectively. Xu et al. [6] introduced a novel box encoding system known as Gliding Vertex, specifically addressing the training loss challenges arising from rotation angle periodicity. Apart from CSL [7], Yang et al. [39] further proposed Gaussian Wasserstein distance (GWD) loss to mitigate inconsistencies between the localization accuracy and training loss arising from the angle boundary problem. Qian et al. [5] devised a modulated loss function to enhance the supervision of bounding box regression optimization, thereby achieving a more uniform boundary condition.
2.2. Attention Mechanism and Self-Attention
Starting with SENet [43], attention mechanisms have progressively gained attention from researchers and evolved into a straightforward yet effective feature enhancement method. In convolution networks, channel attention and spatial attention stand out as the two most commonly used attention mechanisms. Channel attention mechanisms, exemplified by SENet and ECANet [20], leverage global information to dynamically reweight feature channels, directing the network’s focus toward channels with higher weight values. Networks such as GCNet [44] and GENet [45] utilize spatial attention to capture spatial positional relationships, enabling the network to emphasize crucial regions in the image while disregarding less relevant areas. CBAM [18] implements a sequential attention structure from channels to spatial dimensions, simultaneously allocating attention across both dimensions. This dual-dimensional attention distribution enhances the effectiveness of the attention mechanism in improving model performance.
In addition to channel attention and spatial attention, many methods [46,47,48,49,50] employ different combinations of convolution kernels to achieve functionality similar to attention mechanisms. CondConv [48] utilizes parallel convolution kernels to process the same input features, subsequently employing learnable parameters to adaptively weight the features outputted by different convolution kernels, thereby achieving feature enhancement. SKNet [47] uses softmax attention to fuse features from convolution kernels of different sizes, allowing the network to adjust the receptive field size adaptively. Building upon the SKNet, SCNet [49] uses small convolution kernels in one branch to capture richer information while concurrently applying spatial attention in another branch to emphasize the location information of the targets. This further enhances the representation capabilities of the features.
Self-attention, originating from the field of natural language processing (NLP), was initially introduced to the computer vision domain in Vision Transformer (ViT [51]). Unlike the attention mechanisms mentioned earlier, self-attention requires fewer parameters for computation but effectively models long-range relationships in images. DETR [22] is the first method to apply self-attention to object detection tasks, and building upon this foundation, AO2-DETR [38] successfully extended its application to the domain of oriented object detection. Built upon stacked ViT blocks, STD [52] utilizes separate network branches to predict the position, size, and angle of bounding boxes, effectively harnessing the spatial transform potential of ViTs in a divide-and-conquer fashion.
2.3. Application of Frequency Analysis
Frequency analysis serves as a foundational and powerful technique in the realm of signal processing. Recent advancements underscore the significance of integrating frequency analysis into deep learning frameworks. In the research by Ehrlich et al. [53], frequency analysis is synergistically employed with CNNs for JPEG encoding. The ORSlm detector [54] adopts a novel spatial frequency channel feature (SFCF) that jointly considers rotation-invariant features, facilitating the modeling of arbitrary object angles and resulting in significant improvements in detection performance. Rao et al. [55] used a combination of 2D discrete Fourier transform (DFT) and 2D inverse discrete Fourier transform (IDFT) to replace the self-attention operation in GFNet, aiming to capture long-term dependencies in the frequency domain. The wavelet CNN [56] was introduced to reduce the computational cost of spectral features in hyper-spectral image (HSI) classification.
In addition to convolution networks, frequency analysis has proven to be effective in the transformer architecture. For wave-ViT [57], the researchers applied wavelet transform to the keys and values of the self-attention to achieve lossless down-sampling and reduce the computational cost. Fourier former [58] replaced the matrix dot-product with the generalized Fourier integral, which can efficiently fit any key and query distributions. In contrast to the traditional transformer with a matrix dot-product, this change brings better performance and lower redundancy. The researcher of SpectFormer [59] posits that the frequency layer and the multi-head attention layer play equally pivotal roles in the transformer architecture. Thus, they introduce the amalgamation of these two components to capture appropriate feature representation.
3. Methodology
The main objective of our proposed OII method is to utilize frequency analysis to emphasize orientation information in images and integrate the orientation feature to enhance the representation of original features. We first obtain the CNN features from the backbone, such as ResNet or VGG. Then, we employ the OIH module following the backbone to highlight the orientation information through the wavelet transformation algorithm, exposing the orientation details in images. Once the orientation features are obtained, the OFF module is adopted to fuse the features from the backbone and the orientation features. This operation makes the features contain richer information and improves the representation ability of the features. Finally, the enhanced features are fed into the neck and head to predict the result. The OII model can be inserted between any backbone and neck to improve the network’s performance in oriented object detection.
3.1. Overall Architecture
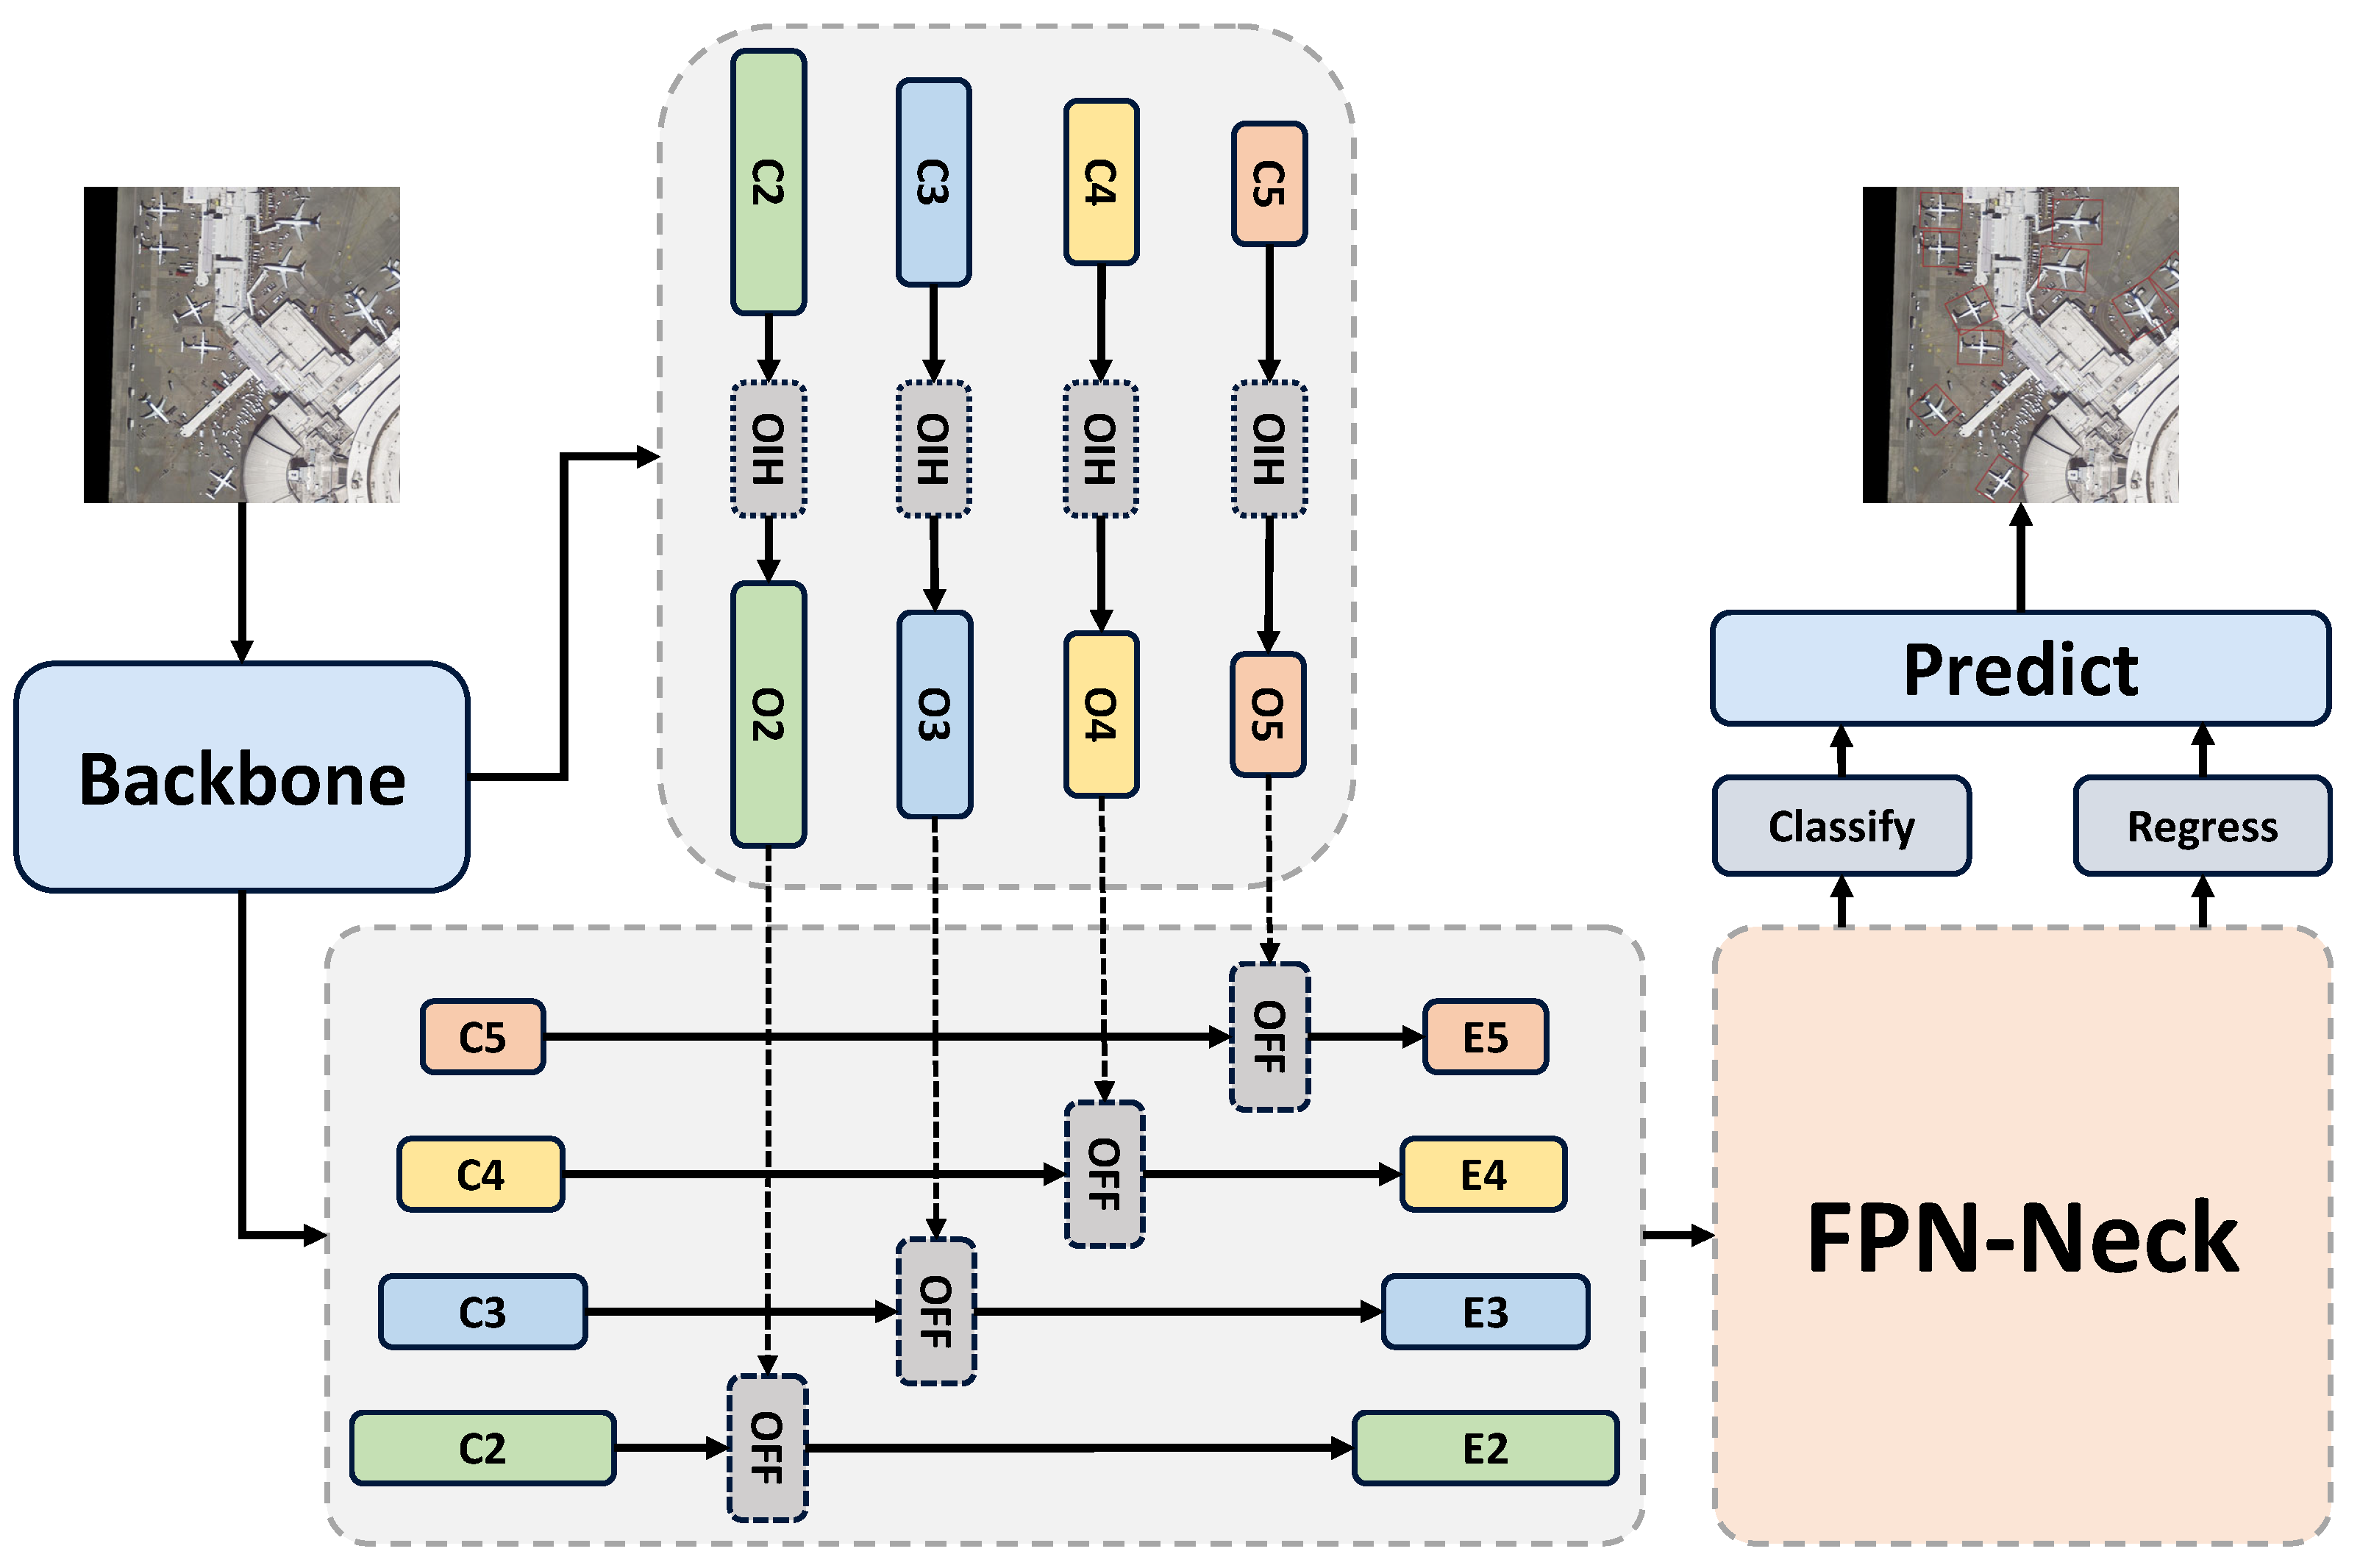
As illustrated in Figure 3, given a remote sensing image , the backbone (such as ResNet) generates features with different scales: , , , and . Then, the OIH module is implemented in each CNN feature to produce the orientation feature:
where represents the orientation feature corresponding to the backbone feature, and denotes the feature generated by the backbone. Before feeding the backbone features into the neck, we employ the OFF module to fuse them with the corresponding orientation features. This enhances the orientation awareness of the features. The process of our proposed OFF module can be described as follows:
where the represents the enhanced CNN feature that will be fed into the neck and head for prediction.
3.2. Orientation Information Highlighting Module
Before introducing the orientation information highlighting (OIH) module, we provide a succinct overview of wavelet transform (WT), a significant component in signal processing and an integral part of our OIH module. WT is a mathematical technique that is particularly effective at representing and analyzing signals or data exhibiting variations in both the frequency and time domains. By extending 1D discrete wavelet transform (DWT), 2D DWT serves as a potent tool for representing and analyzing images, capturing both local and global features.
In the computational process, a pair of high-pass and low-pass filters are alternately applied to the image, extracting information related to changes in intensity and texture in both the horizontal and vertical directions. Subsequently, each resulting feature undergoes down-sampling to mitigate redundancy and computational complexity. This division results in four quadrants: (low-low), (low-high), (high-low), and (high-high), representing the different scales and orientation information within the image. This process is iterated for the quadrant (representing a lower scale) to further decompose the image or feature into a smaller scale, allowing for the recursive extraction of details at various levels of granularity.
The ultimate output of 2D DWT is a set of coefficients representing the image at multiple scales and orientations. These coefficients encode information about the image’s content, with higher-frequency coefficients typically reflecting finer details and lower-frequency coefficients depicting coarser features. When taking the Haar wavelet as an example, the filters used for 2D-DWT are set as follows:
where represents a pair of low-pass filters, denotes a low-pass filter with a following high-pass filter, indicates a high-pass filter with a following low-pass filter, and denotes a pair of high-pass filters. Assuming that our input is f, after applying 2D-DWT with the level set to 1, we can obtain four sub-bands: with horizontal information, with vertical information, with diagonal information, and with coarse information.
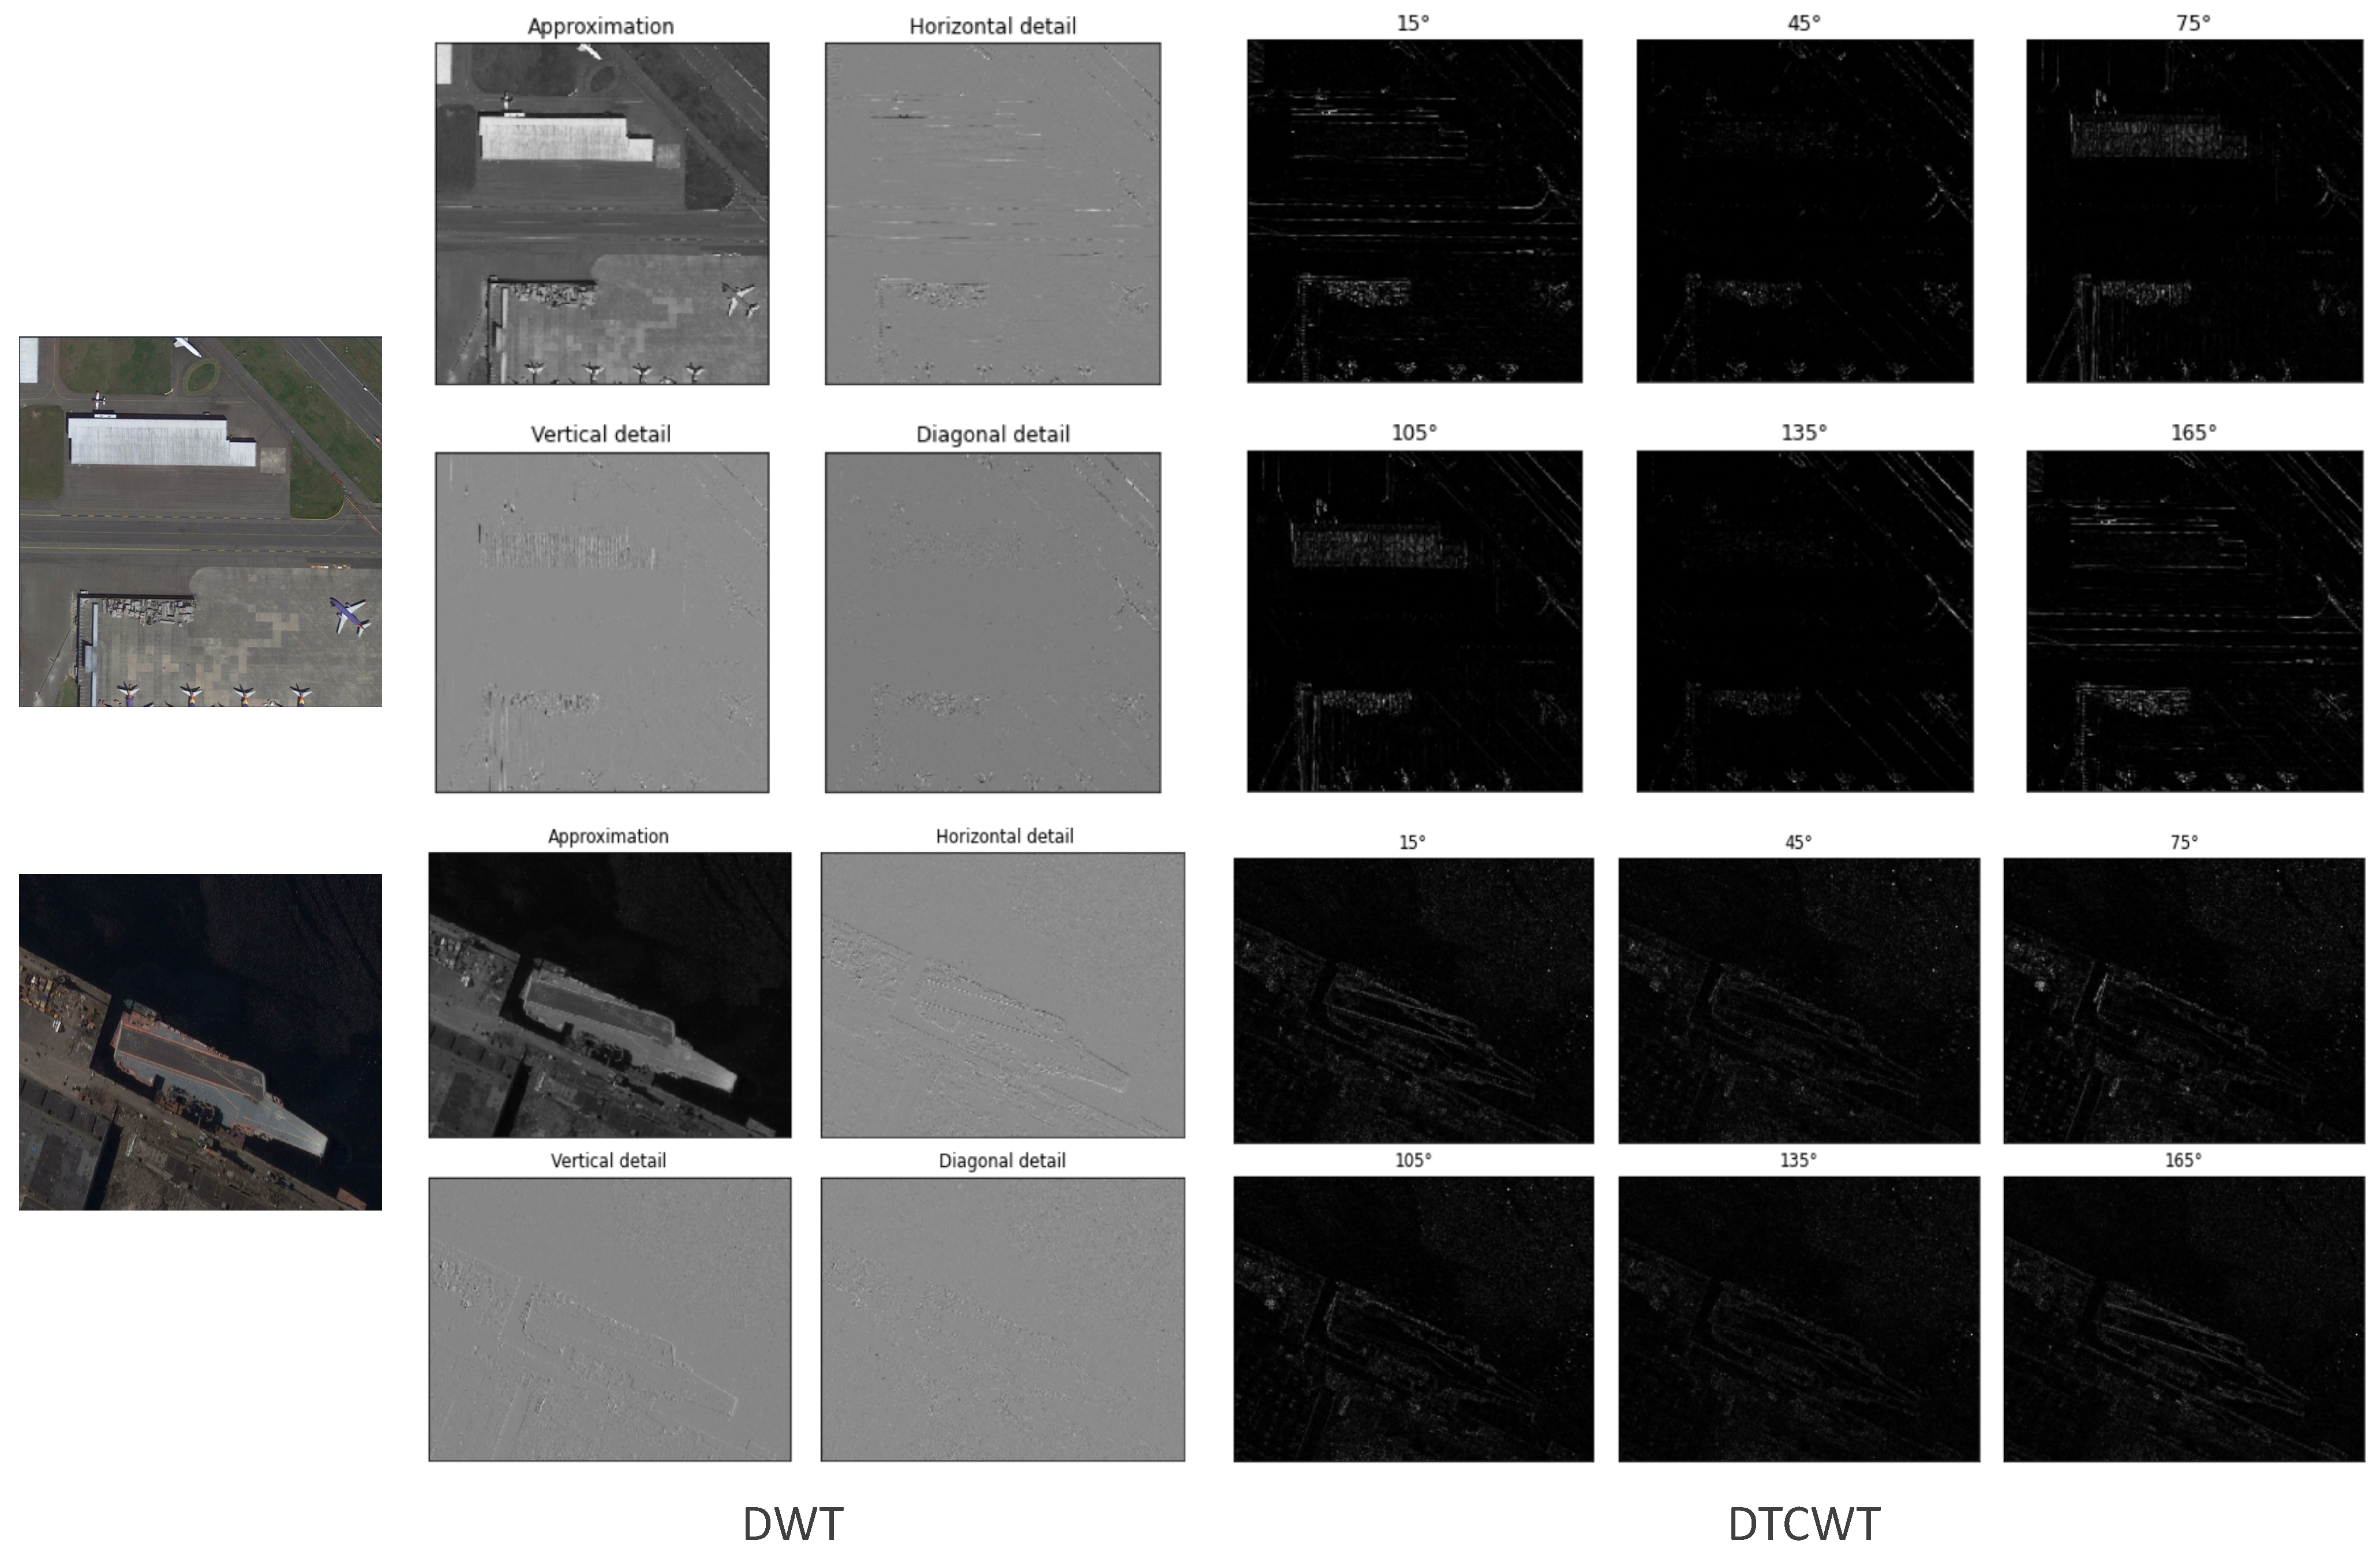
Despite the simplicity and clear structure of 2D-DWT, the obtained sub-bands only highlight orientation information in certain directions, thereby weakening the information from other directions. As illustrated in Figure 4, the diagonal sub-band cannot distinguish between the angles of and , which is not conducive to the complete extraction of image information. In order to alleviate this problem, we turn to dual-tree complex wavelet transform (DTCWT) [60]. The design of DTCWT can achieve complete reconstruction and also has the advantages of approximate shift invariance and oscillatory suppression. The traditional DWT generates one low-frequency sub-band and three high-frequency sub-bands in one decomposition, while DTCWT utilizes the redundant representation of data (for 2D-DTCWT, four times the redundancy) to obtain 12 high-frequency sub-bands, corresponding to the real and imaginary parts of the directions in , as presented in Figure 4.
The real and imaginary components obtained from DTCWT can be organized into two distinct trees. The filters associated with tree A’s low-pass and high-pass functions are denoted as and , while tree B’s low-pass and high-pass filters are represented by and . For a real-valued image M, the complex transform can be formulated as follows:
where denotes the real part, denotes the imaginary part, I represents the identity matrix, and the square matrix denotes the 2D separable wavelet transform implemented using along the rows and along the columns (the others are in the same vein). The real part and imaginary part are stored separately; then, the final complex wavelet coefficients, w, are computed as follows:
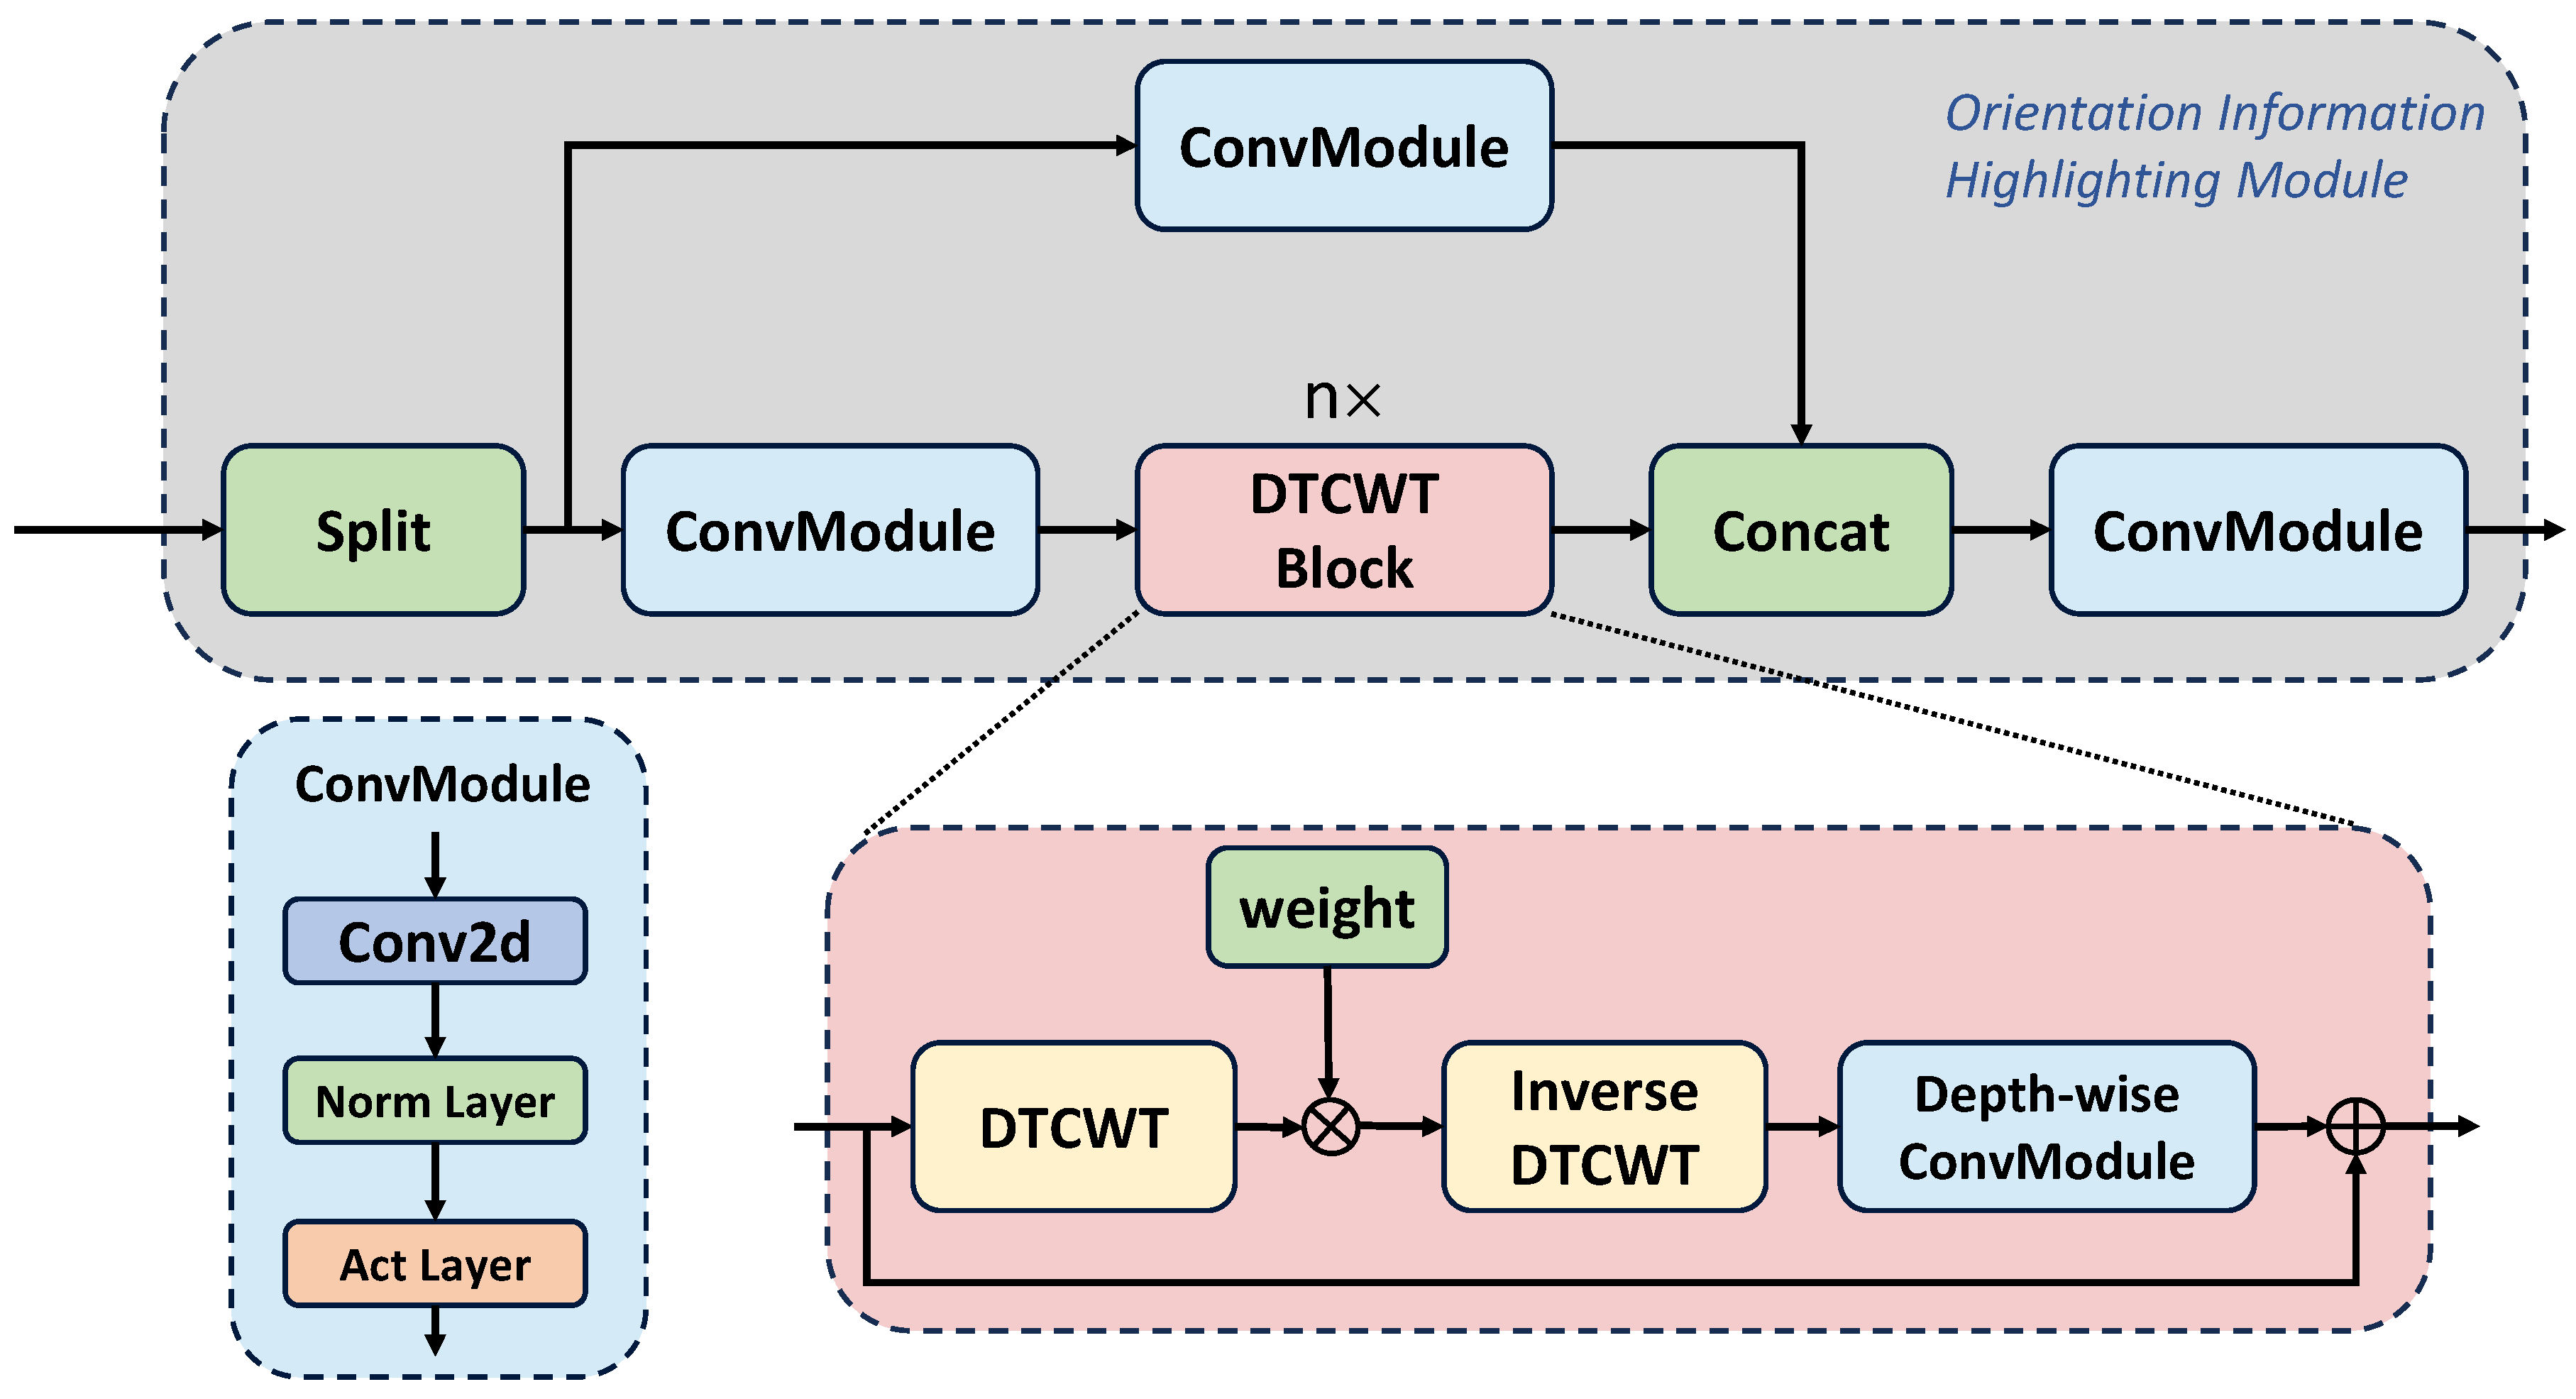
The architecture of our OIH is illustrated in Figure 5. The design of the OIH comprises one main branch and one short branch. Specifically, the input backbone feature X is first split into and along the channel dimension. Subsequently, and are separably passed through a ConvModule, which includes a convolution layer, a normalization layer, and an activation layer. Additionally, n DTCWT Blocks are implemented for to emphasize the orientation information. Each DTCWT Block contains a DTCWT operation, an inverse DTCWT operation, and a depth-wise ConvModule. The complex wavelet coefficients obtained by DTCWT are multiplied by a learnable complex weight and then restored to the input feature through inverse DTCWT. Then, and are concatenated along the channel dimension. The concatenated feature receives a ConvModule to produce the final orientation feature, , which has the same dimension as the input feature. The computation process can be formulated as follows:
After the OIH module, we obtain the orientation features with the same scales of corresponding backbone features. These orientation features are then sent to OFF module together with the backbone features for information fusion.
3.3. Orientation Feature Fusion Module
Upon acquiring the backbone features and orientation features, we need an effective approach to integrate the orientation information into the backbone features, thereby enhancing its sensitivity to orientation details. By drawing inspiration from FDOL [5], we propose a novel OFF module that utilizes the attention mechanism to aggregate the orientation information. The OFF module, illustrated in Figure 6, consists of two components: the multi-dimensional aggregation attention (MAA) module and the cross-domain attention (CA) module. The former is designed to capture contextual interactions within the input feature itself, while the latter seamlessly incorporates orientation information into the backbone features. This fusion strategy enhances the network’s ability to discern and leverage orientation features effectively.
3.3.1. Multi-Dimensional Aggregation Attention
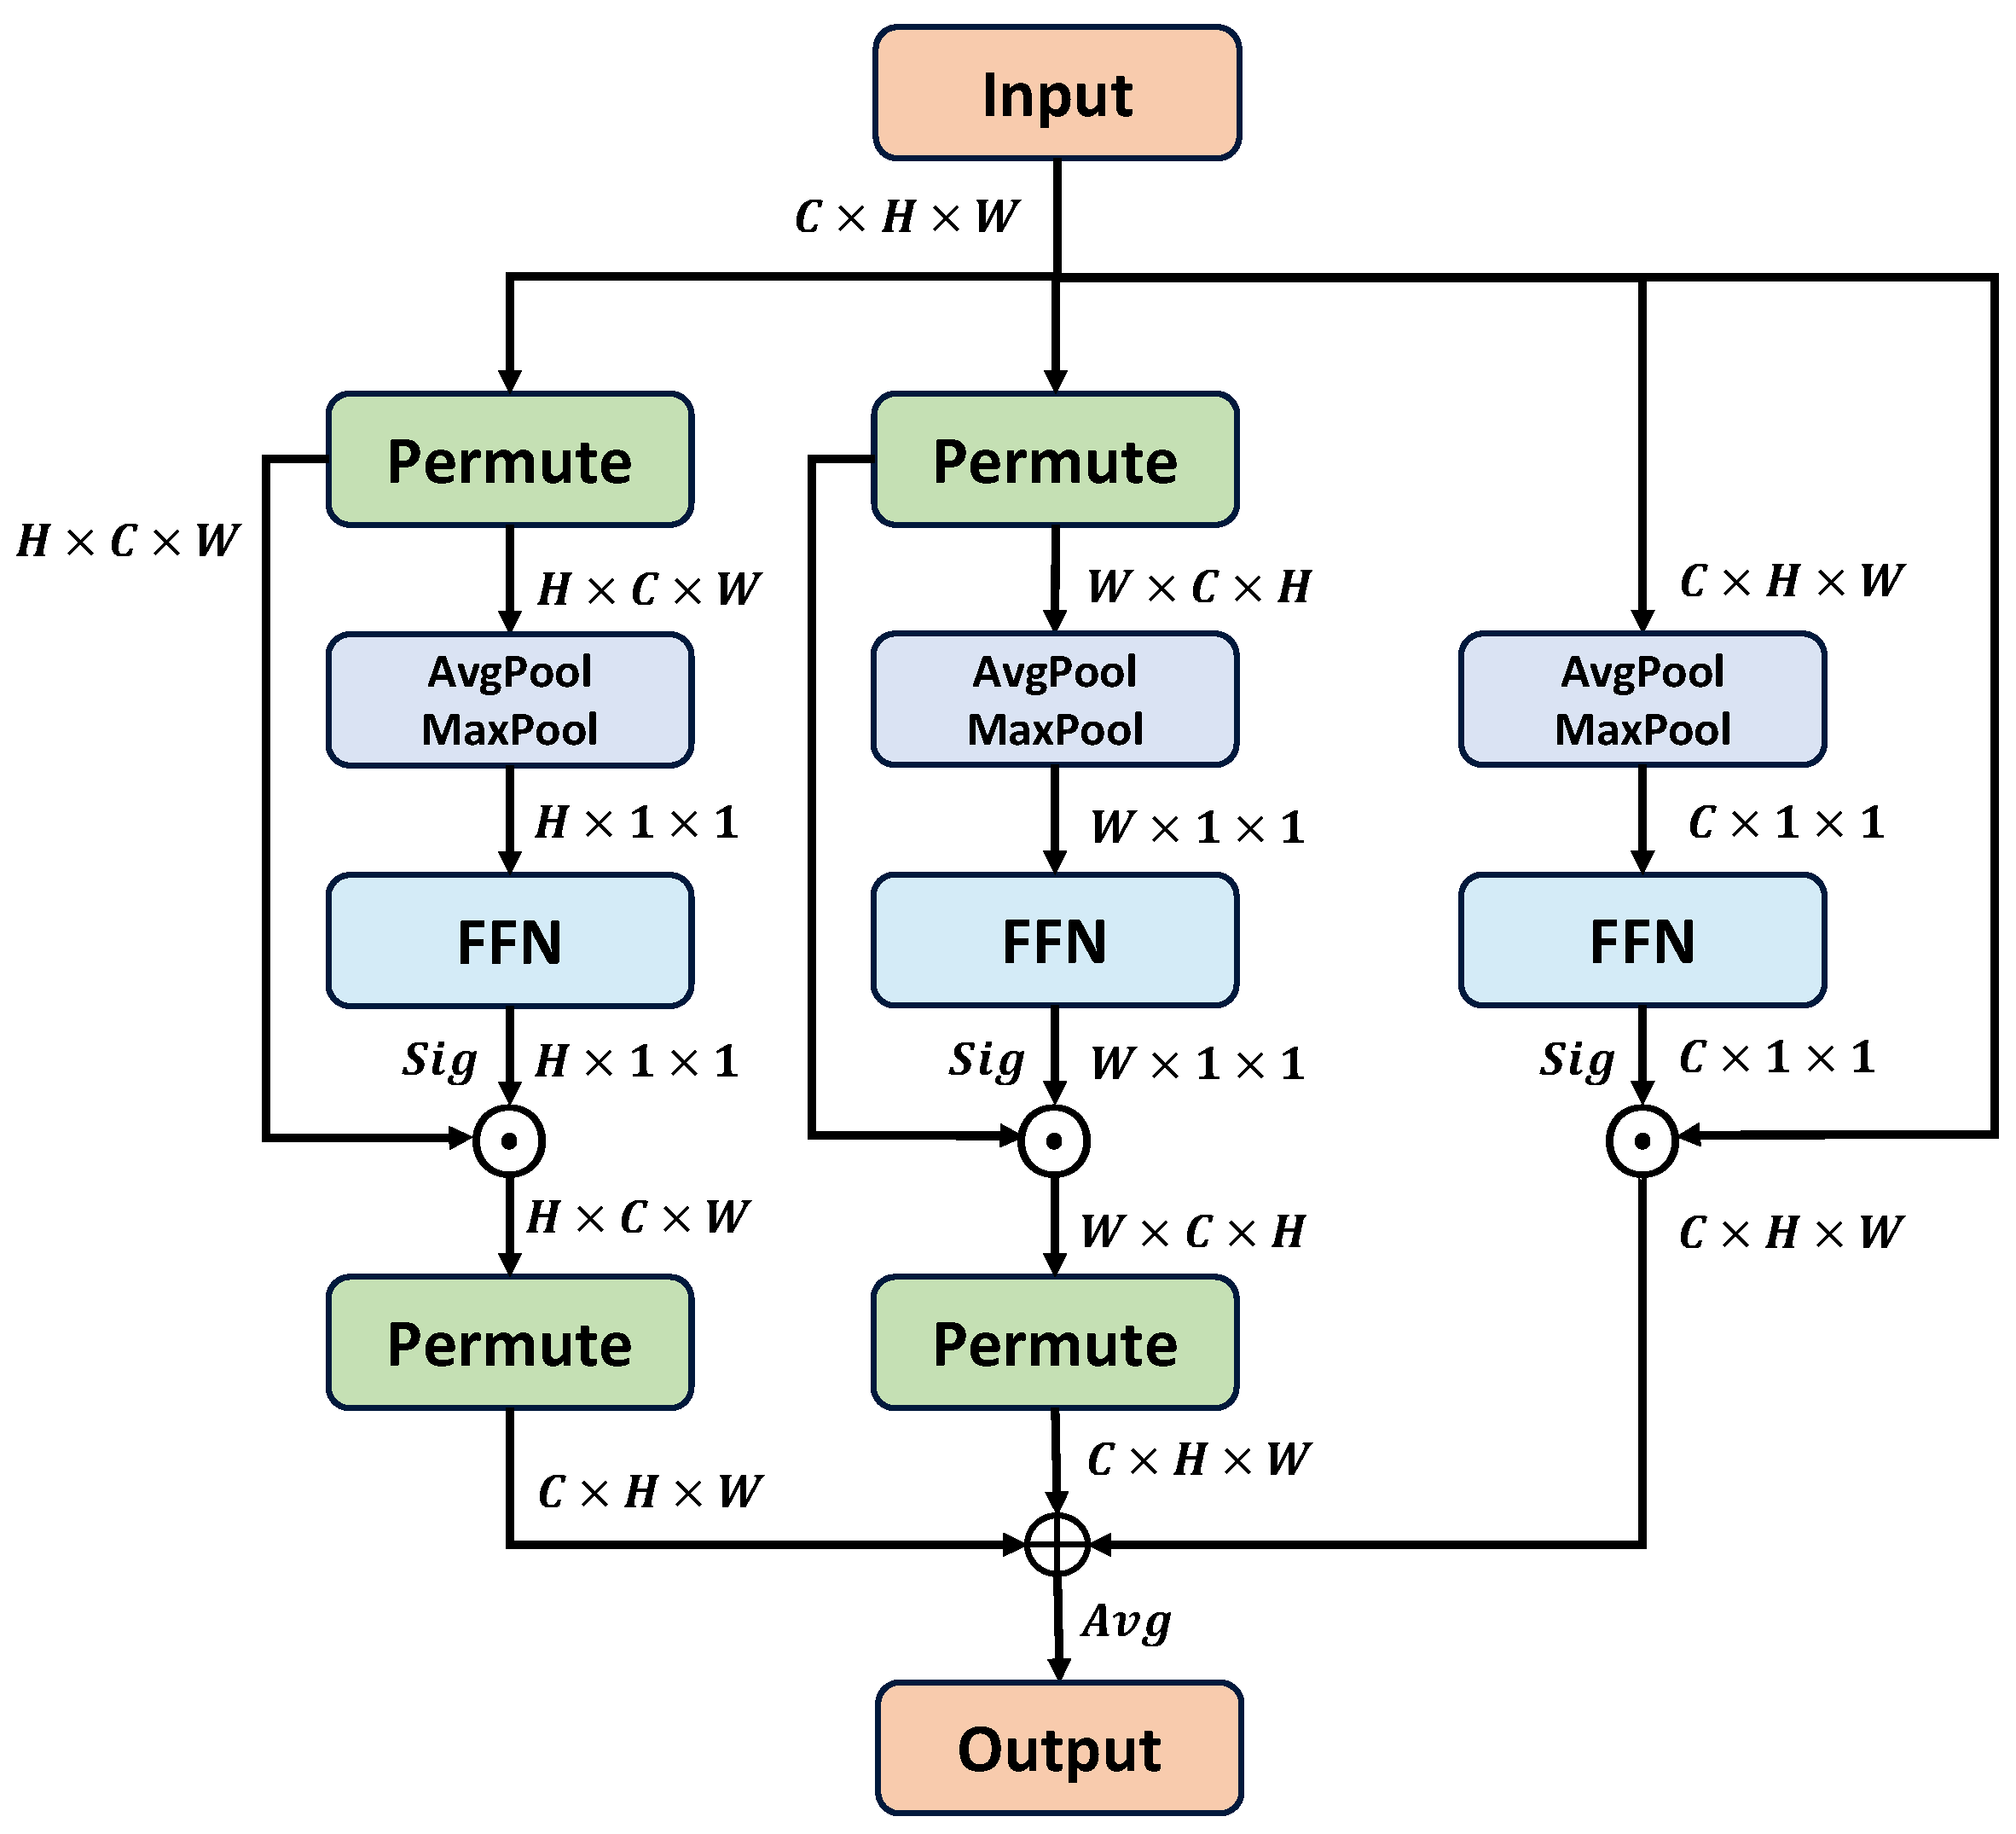
As shown in Figure 7, the MAA module contains three branches, each of which captures interaction information in one specific dimension. When taking the height dimension as an example, we first employ a permutation operation on the input feature f to exchange the height dimension and the channel dimension:
where denotes the feature with a dimension order of . In order to compute the height attention effectively, we employ max pooling and average pooling to compress the other dimensions of the permuted feature. The combination of the max-pooled feature and the average-pooled feature can greatly improve the representation ability of networks, as opposed to using each feature independently. When taking as the input, we can generate two different context descriptors through avg-pooling and max-pooling:
where denotes the avg-pooled descriptor, and denotes the max-pooled descriptor. After the acquisition of the two descriptors, we need to combine them into a unified one.
where indicates the final context descriptor, and and denote the learnable weighting parameters. Then, we use a feed-forward layer to enhance the representation of the context descriptor and apply a sigmoid function to obtain the final attention:
where denotes the final height attention. Subsequently, we perform element-wise multiplication between the height attention and the permutated features , followed by a permutation operation to revert to the original dimension order. This process yields the feature , which is enhanced along the height dimension:
Similarly, we can obtain the features and enhanced along the width dimension and channel dimension, respectively. Then, we simply use an average operation to obtain the final enhanced feature X:
3.3.2. Cross-Domain Attention
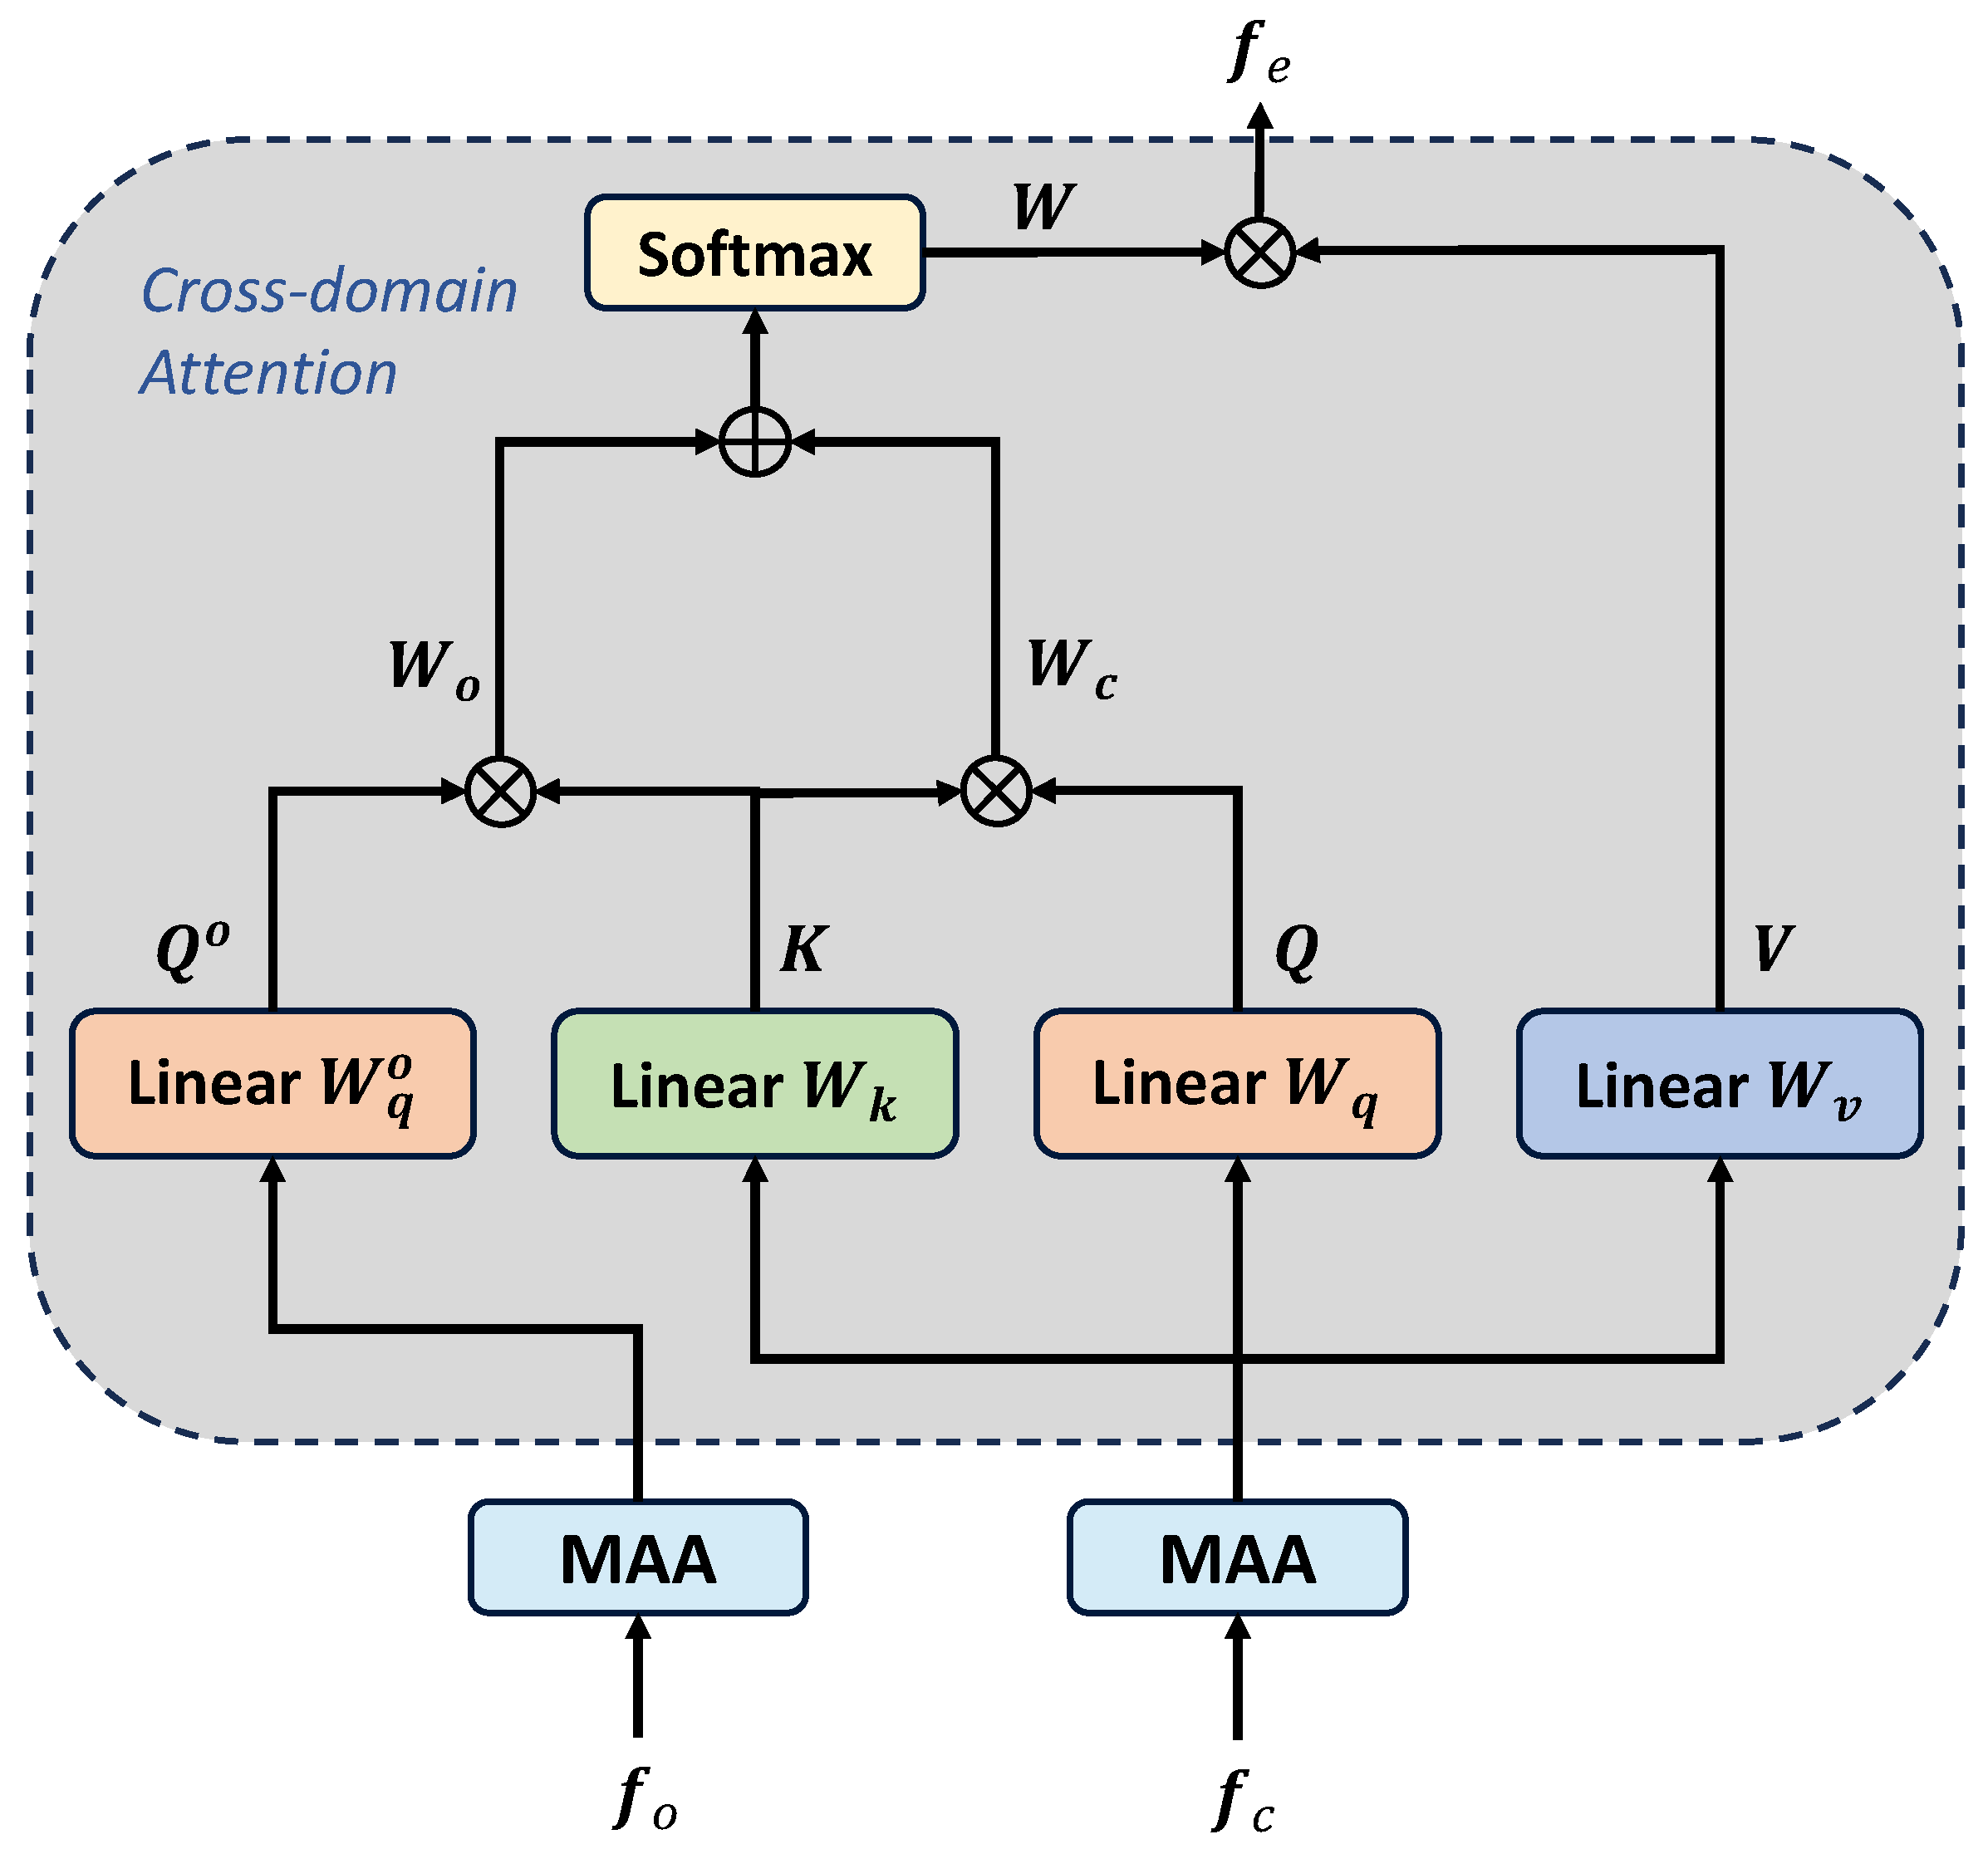
Subsequent to the enhancement achieved through the MAA, it is imperative to integrate orientation information into the backbone feature. Consequently, we introduce the cross-domain attention (CA) mechanism to amalgamate information across diverse domains. As is commonly acknowledged, self-attention employs inner products to generate the attention weight between two matrices. In the design of CA, we extend the attention weight into two parts: the original weight and the orientation weight. This extension allows the model to capture the relationships between different domains and generate a more comprehensive feature representation.
Given enhanced orientation features, , and backbone features, , we first apply a self-attention operation to the backbone feature to obtain the original weight :
where and are linear functions, denotes the matrix multiplication, and indicates the scale factor, which defaults to the channel length of the key matrix.
As illustrated in Figure 6, the computational process for orientation weight can be formulated as follows:
where transforms the orientation feature into a query matrix. Then, we combine the original weight, , and the orientation weight, , to generate the final attention weight w:
where and represent the weighting parameters, which default to 1.0 in our experiments. With the guidance of w, we can obtain the final enhanced feature integrated with the orientation information:
where denotes the softmax function, ⊙ denotes element-wise multiplication, and indicates the linear function that transforms into a value matrix.
4. Experimental Results
In order to evaluate the effectiveness of our proposed approach, we conducted comprehensive experiments on two prominent datasets in the field of remote sensing object detection, specifically DOTA [61] and HRSC2016 [62]. The experiments were conducted using an NVIDIA RTX 3090 GPU with 24 GB of memory, and the entire implementation was carried out using the PyTorch 1.12 framework. This experimental setup ensured both computational efficiency and consistency in our evaluation process.
4.1. Datasets Description
4.1.1. DOTA
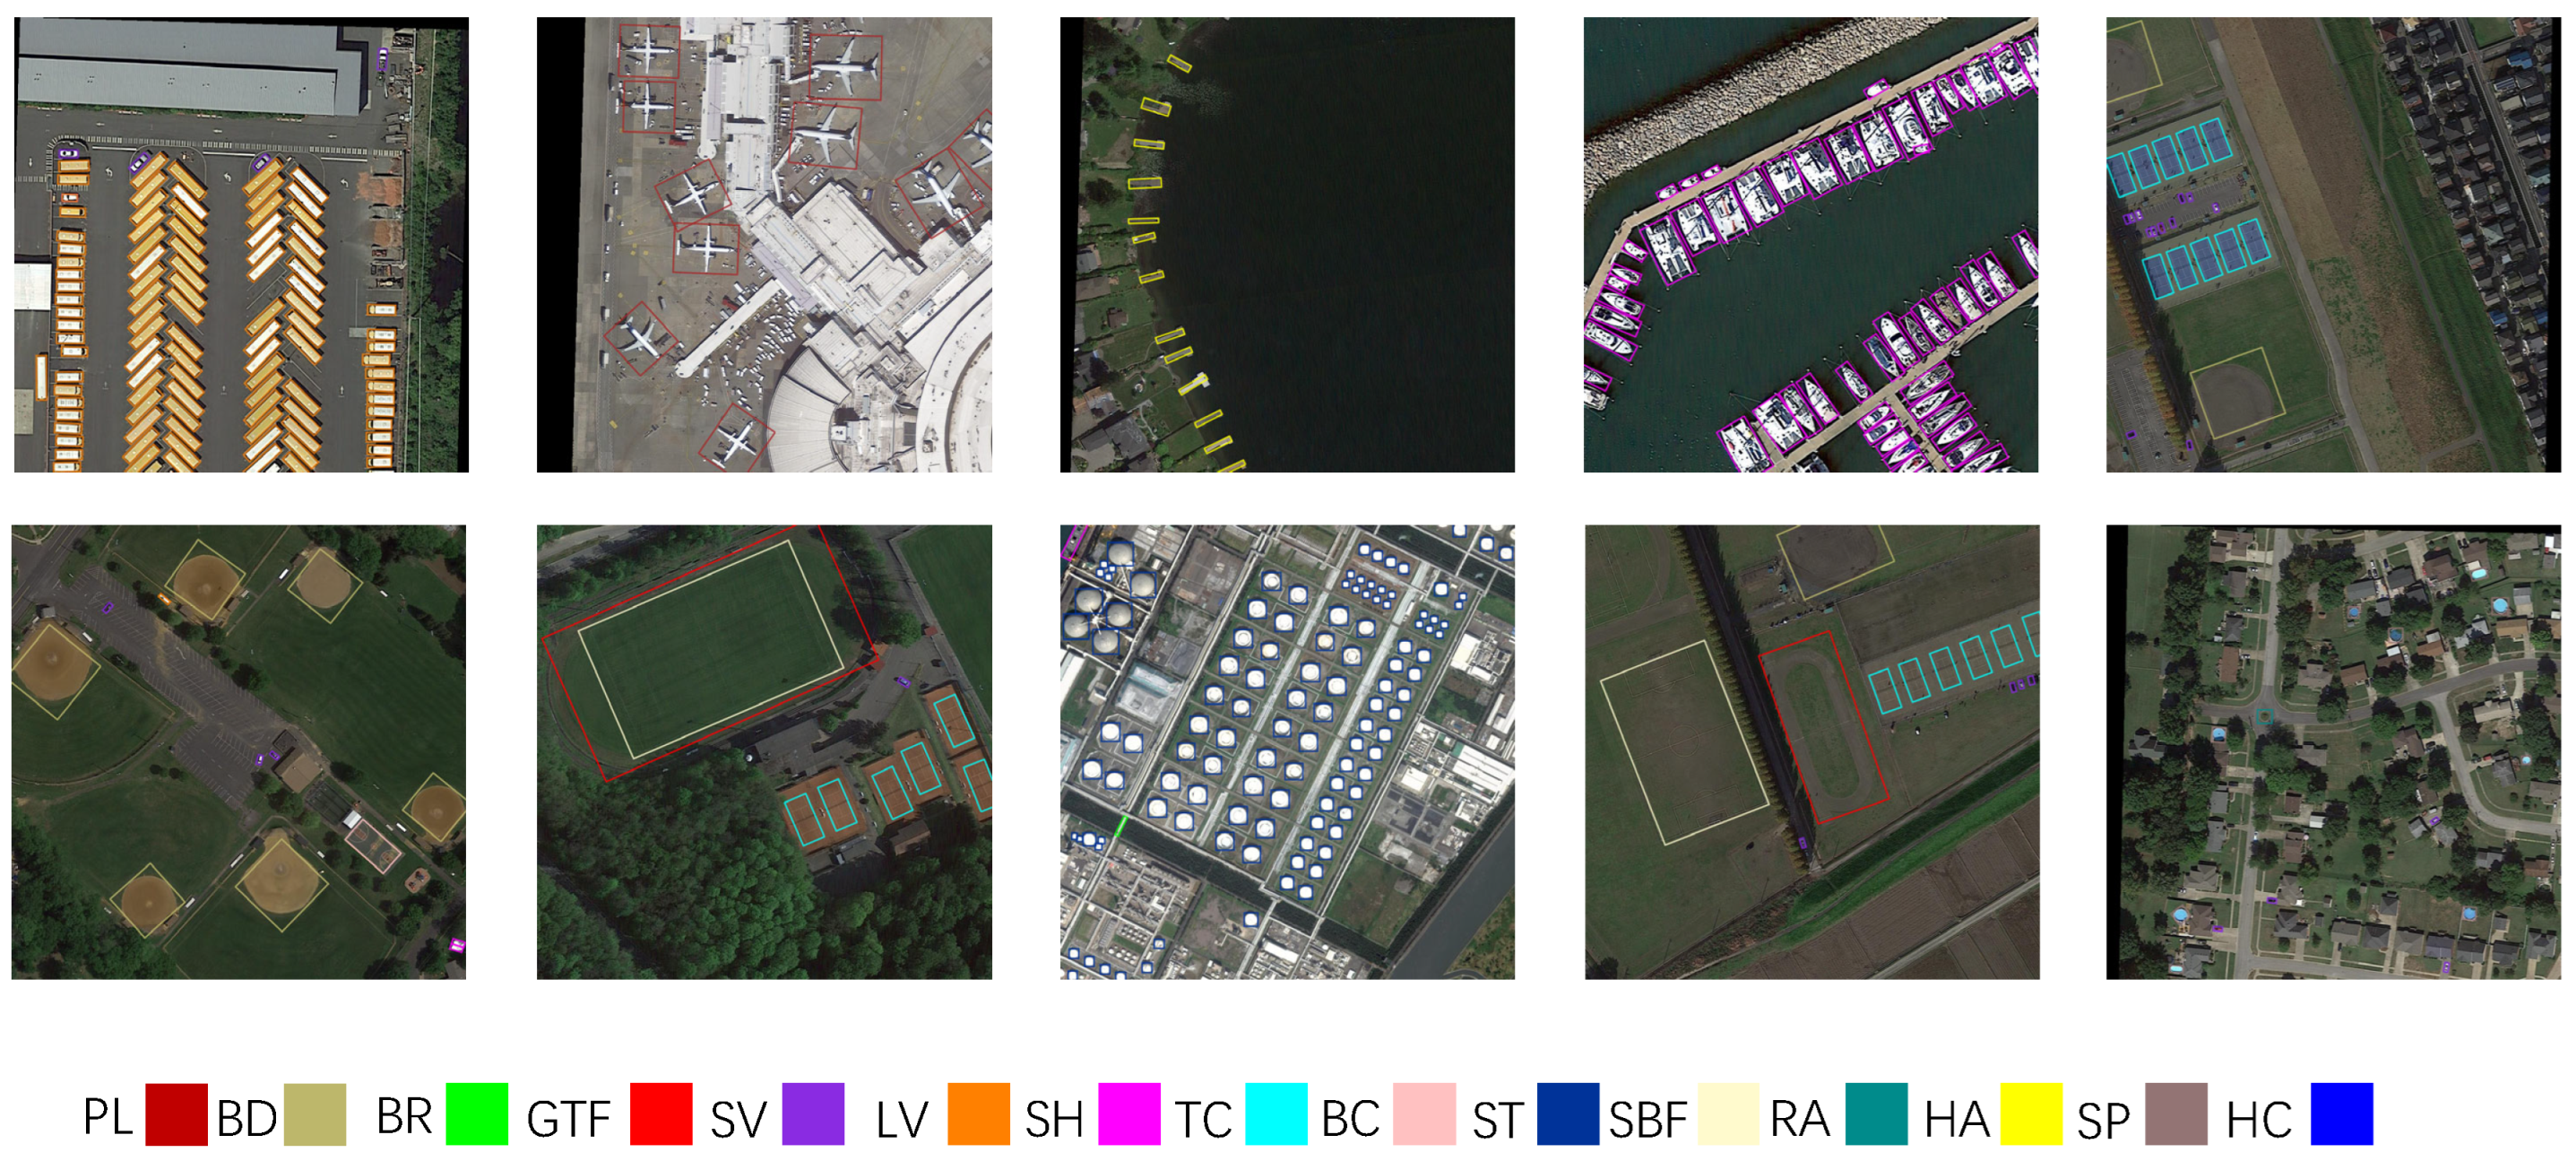
DOTA-v.10 serves as an extensive dataset curated for advancing remote sensing object detection. The dataset, comprising a total of 2806 images, contains 188,282 instances, each meticulously annotated with oriented bounding boxes. These instances collectively span 15 diverse object categories, encompassing Plane (PL), Baseball diamond (BD), Bridge (BR), Ground track field (GTF), Small vehicle (SV), Large vehicle (LV), Ship (SH), Tennis court (TC), Basketball court (BC), Storage tank (ST), Soccer-ball field (SBF), Roundabout (RA), Harbor (HA), Swimming pool (SP), and Helicopter (HC). The images within the DOTA dataset exhibit resolutions ranging from 800 × 800 to 4000 × 4000 pixels, providing a varied and comprehensive set of visual data. Following the previous methods, both the training and validation sets were employed for training purposes, with the remaining portion reserved exclusively for testing. The final result of detection accuracy involves submitting the test results to the official DOTA evaluation server, ensuring a standardized and objective evaluation of model performance.
DOTA-v1.5, an extension of DOTA-v1.0, preserves identical images while introducing annotations for extremely small instances (less than 10 pixels), resulting in an additional 215,000 instances. Notably, DOTA-v1.5 introduces a new category, “container crane”, augmenting the dataset with a more diverse range of objects.
4.1.2. HRSC2016
HRSC2016 stands out as a pivotal dataset that is specifically tailored for detecting arbitrarily oriented ships in the realm of remote sensing applications. With a total of 1061 images, the dataset comprises 2976 instances of ships, each annotated with oriented bounding boxes to facilitate precise detection. The images within the dataset exhibit resolutions ranging from 300 × 300 to 1500 × 900 pixels, crossing a diversity of scales. For training and validation, a combined set of 617 images (436 for training and 181 for validation) is employed, while the remaining images are dedicated to the testing phase. Notably, during training and testing, all images are uniformly resized to 800 × 800 pixels, ensuring consistent evaluation metrics.
4.2. Implementation Details and Evaluation Metrics
Unless explicitly stated, the OII network is inherently embedded in the architecture of oriented R-CNN, which demonstrates powerful performance and efficiency. In order to maintain experimental consistency, we strictly adhere to the configurations outlined in a previous study [10] and execute all experiments on the mmrotate platform [63]. We employ the SGD optimizer with momentum and weight decay set at 0.9 and 0.0001, respectively. In the inference stage, 2000 proposals are retained for each feature pyramid network (FPN) level in the region proposal network (RPN), followed by non-maximum suppression (NMS) using an IoU threshold of 0.8. Subsequently, the top 1K proposals, based on their classification scores, serve as inputs for the region-based convolutional neural network (RCNN) head. Within the RCNN head, we implement the rotated NMS on the predicted rotated bounding boxes to reduce the redundancy, with the confidence score exceeding 0.05 and the IoU threshold set to 0.1. All training and testing experiments were conducted on a single RTX 3090, with the batch size set to 2.
On the DOTA dataset, we cropped the original images into image patches with a resolution of 1024 × 1024 pixels. The overlap of adjacent image patches is 200 pixels, resulting in a cropping stride of 824 pixels. In addition to the basic single-scale strategy, we also employed a multi-scale augmentation strategy during training and testing. Specifically, we performed a sequential cropping at three ratios (0.5, 1.0, and 1.5) on the base of a 1024 × 1024 patch size and a 500-pixel overlap. In addition to cropping the images, we also applied random flips (probability set to 0.75) and random rotations (probability set to 0.75) to achieve data augmentation. For the optimization of the learning rate, we adopted the MultiStepLR strategy, with the initial learning rate set to 0.05. The training process spans a total of 12 epochs, and the learning rate automatically decreased to of its original value at epochs 8 and 11. For the HRSC2016 dataset, we uniformly resized the image resolution to 800 × 800 and set the training epochs to 36. The initial learning rate was set to 0.005 and was reduced to of its original value at epochs 24 and 33. The other settings remained consistent with those applied to the DOTA dataset. For clarity and readability, we list the initial training parameters in Table 1.
The evaluation of object detection models commonly relies on the well-established average precision (AP) metric proposed by Everingham et al. [64]. By following previous methods, we utilized the mean average precision (mAP) to evaluate the performance of our OII model and other comparative models on the DOTA dataset. In order to obtain mAP, we first need to calculate the precision and recall. The process can be formulated as the following:
where P represents the precision, R denotes the recall, the true positive () and the true negative () represent the correct predictions, and the false positive () and false negative () denote the incorrectly predicted samples. In order to avoid the imbalance between precision and recall, average precision is defined as the surrounding area under the precision-recall (P-R) curve. Then, we can obtain mAP as follows:
where K is the total number of classes, and represents the precision under a specific recall. For the HRSC2016 dataset, we report the results under the metrics mAP(07) and mAP(12), which indicate the mAP calculated according to the criteria of Pascal VOC 2007 and 2012, respectively.
4.3. Main Results
4.3.1. Results for the DOTA Dataset
In Table 2, we present a comprehensive overview of the performance results achieved by our proposed OII method, comparing it with other methods on the DOTA-v1.0 dataset. The results obtained through the online DOTA evaluation server follow a standardized format. Under the single-scale training and testing strategy, our method achieves a notable value of 76.98 mAP, surpassing the previous best detector ReDet by 0.73. In the multi-scale training and testing scenario, our OII model achieves a competitive value of 80.82 mAP, demonstrating parity with the other state-of-the-art methods. These outcomes indicate the efficacy of our proposed approach for oriented object detection in remote sensing images. The visual representation of the detection results on the DOTA dataset is depicted in Figure 8, which illustrates the capability of our method to accurately generate rotated bounding boxes for objects of various scales and orientations in remote sensing images.
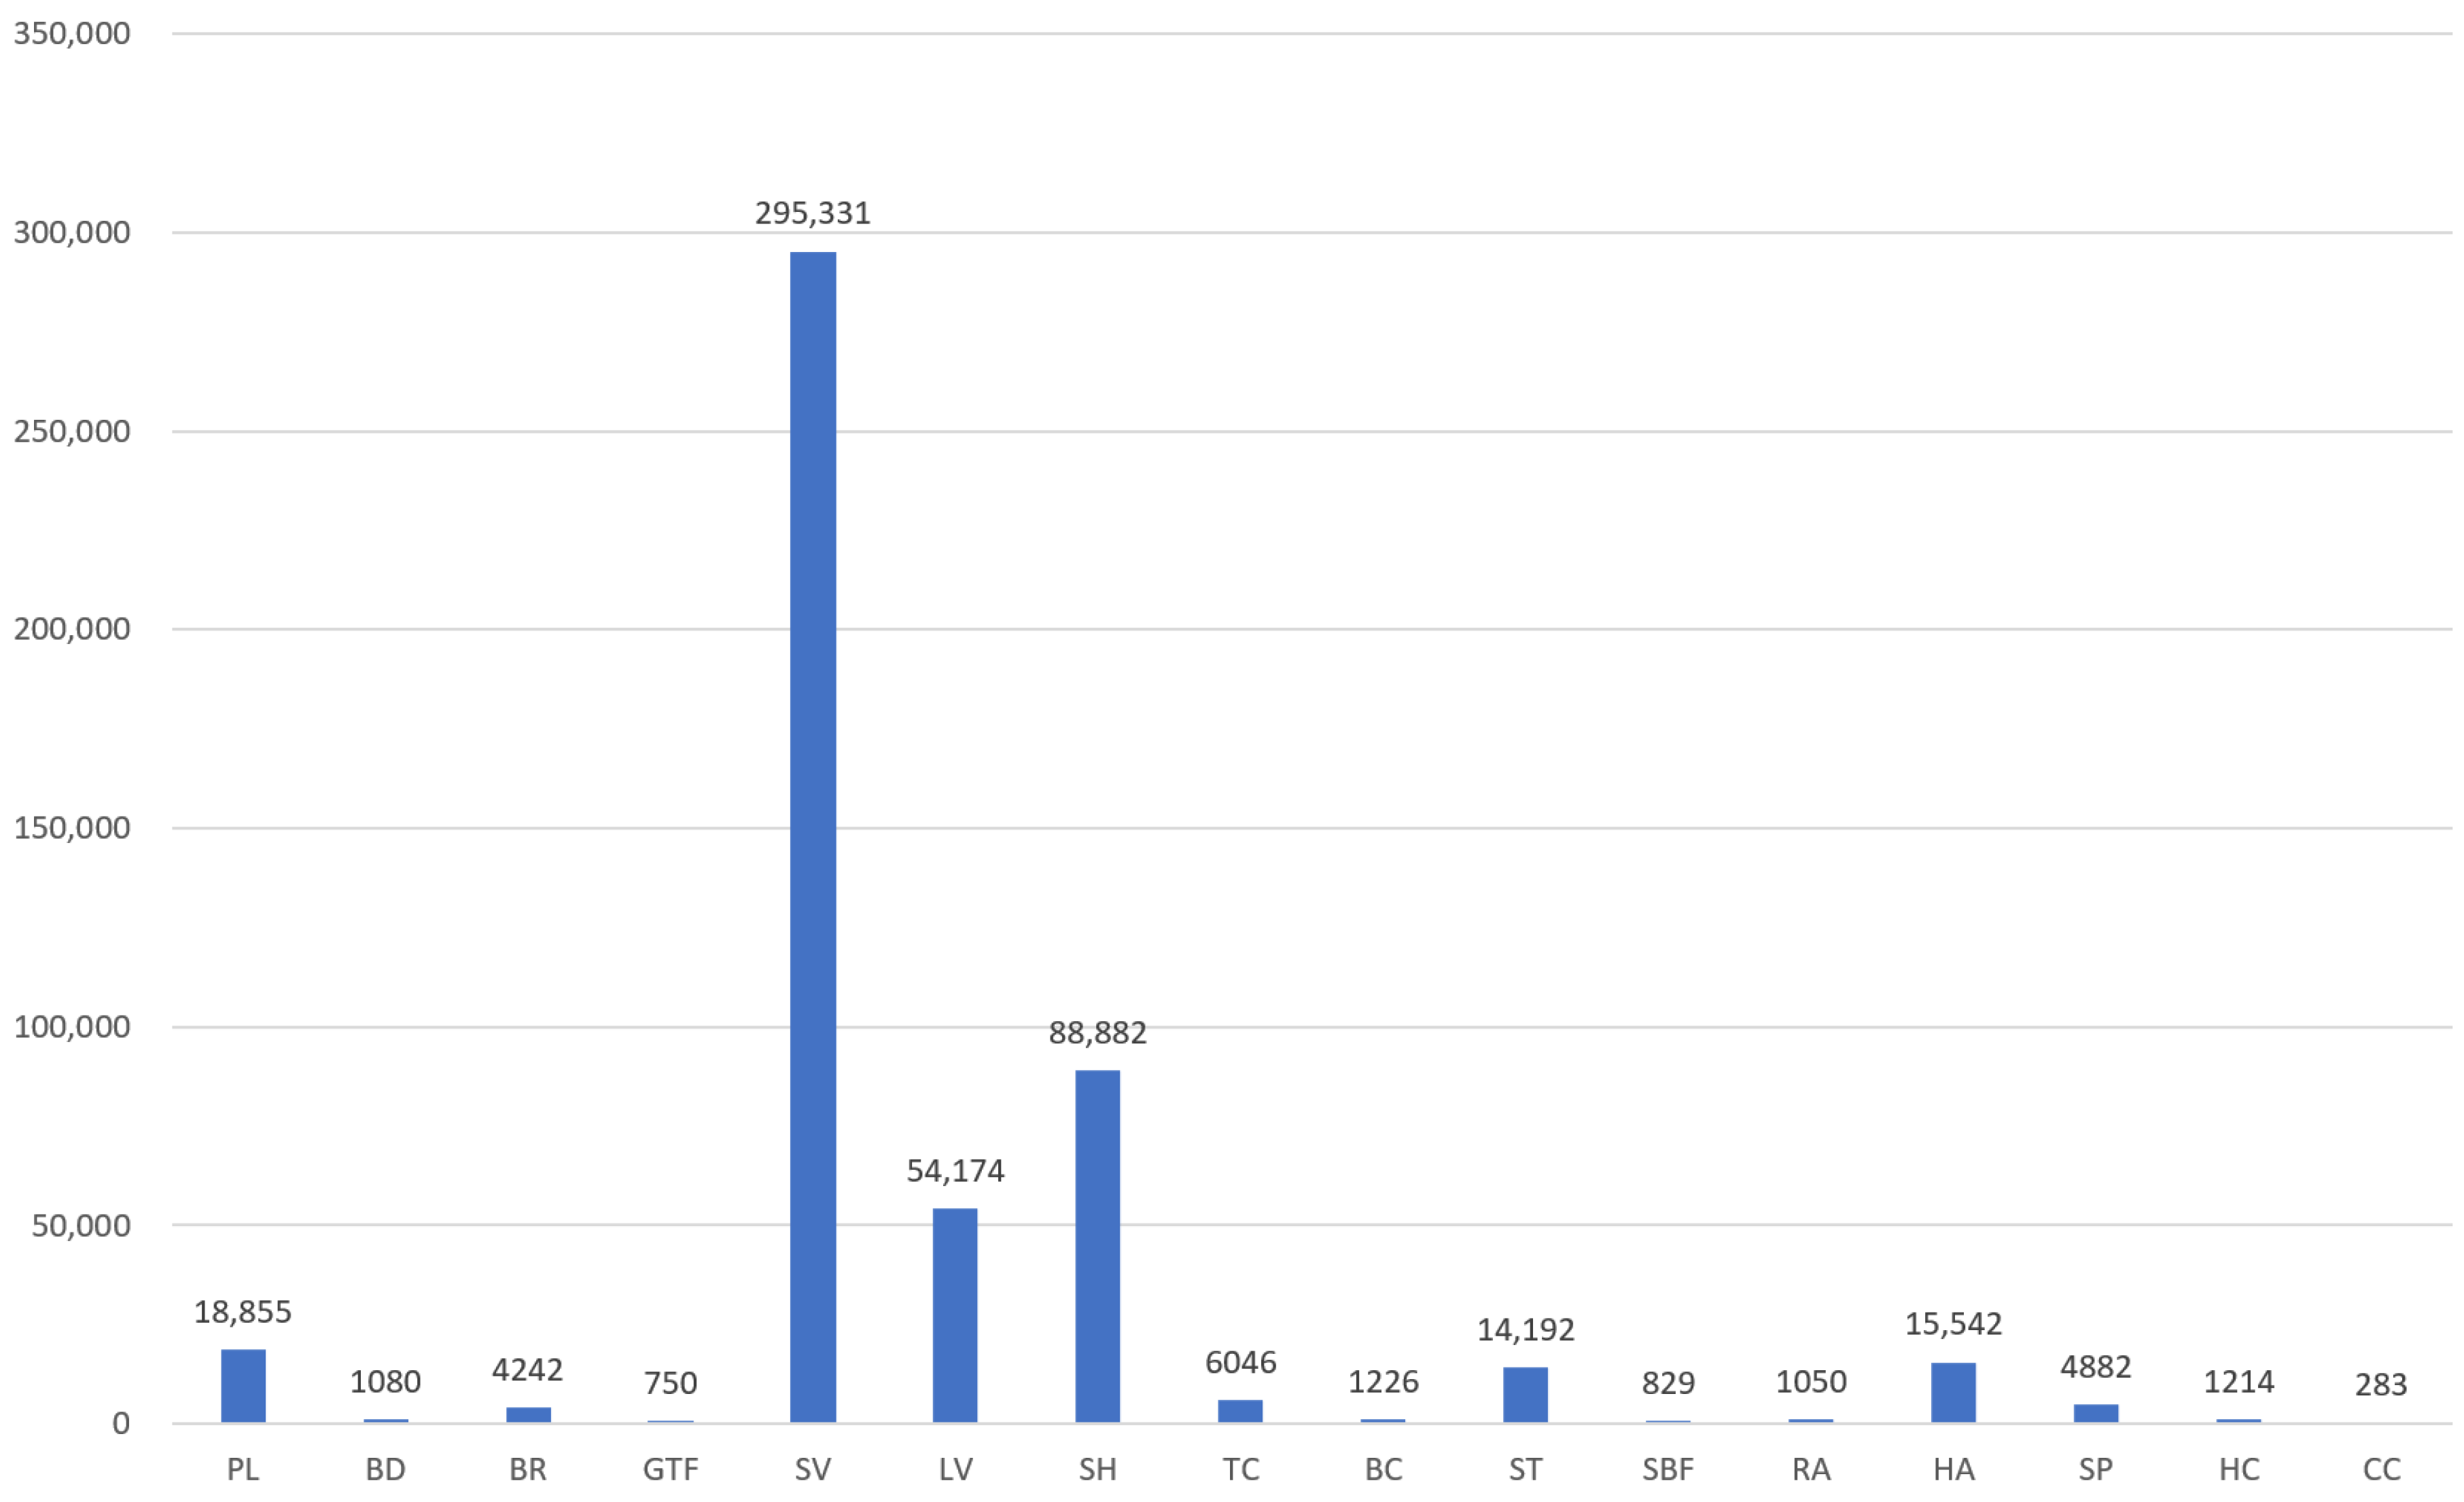
As shown in Table 3, we also conducted comprehensive experiments comparing our OII model against other detectors [61,67,68,70,71], utilziing the the DOTA-v1.5 dataset. Our proposed OII model achieves 68.02 mAP, surpassing ReDet by 1.16 under the single-scale strategy. Furthermore, our method attains a commendable 77.55 mAP in the multi-scale training and testing strategy. However, it is noteworthy to highlight a decline of 0.57 in detection accuracy in comparison to the SOTA detector RTMDet-R-l. This decline is primarily attributed to the category CC, for which the detection accuracy for OII is almost 10 lower than for RTMDet-R-l. We suspect that there are too few samples in the CC category, leading to our model’s insufficient fitting for its features. This idea is confirmed in Figure 9, which demonstrates that the DOTA v1.5 dataset has a long-tailed distribution, with the CC category having the fewest samples. In-depth research into addressing this phenomenon will be a focal point in our future work.
4.3.2. Results on the HRSC2016 Dataset
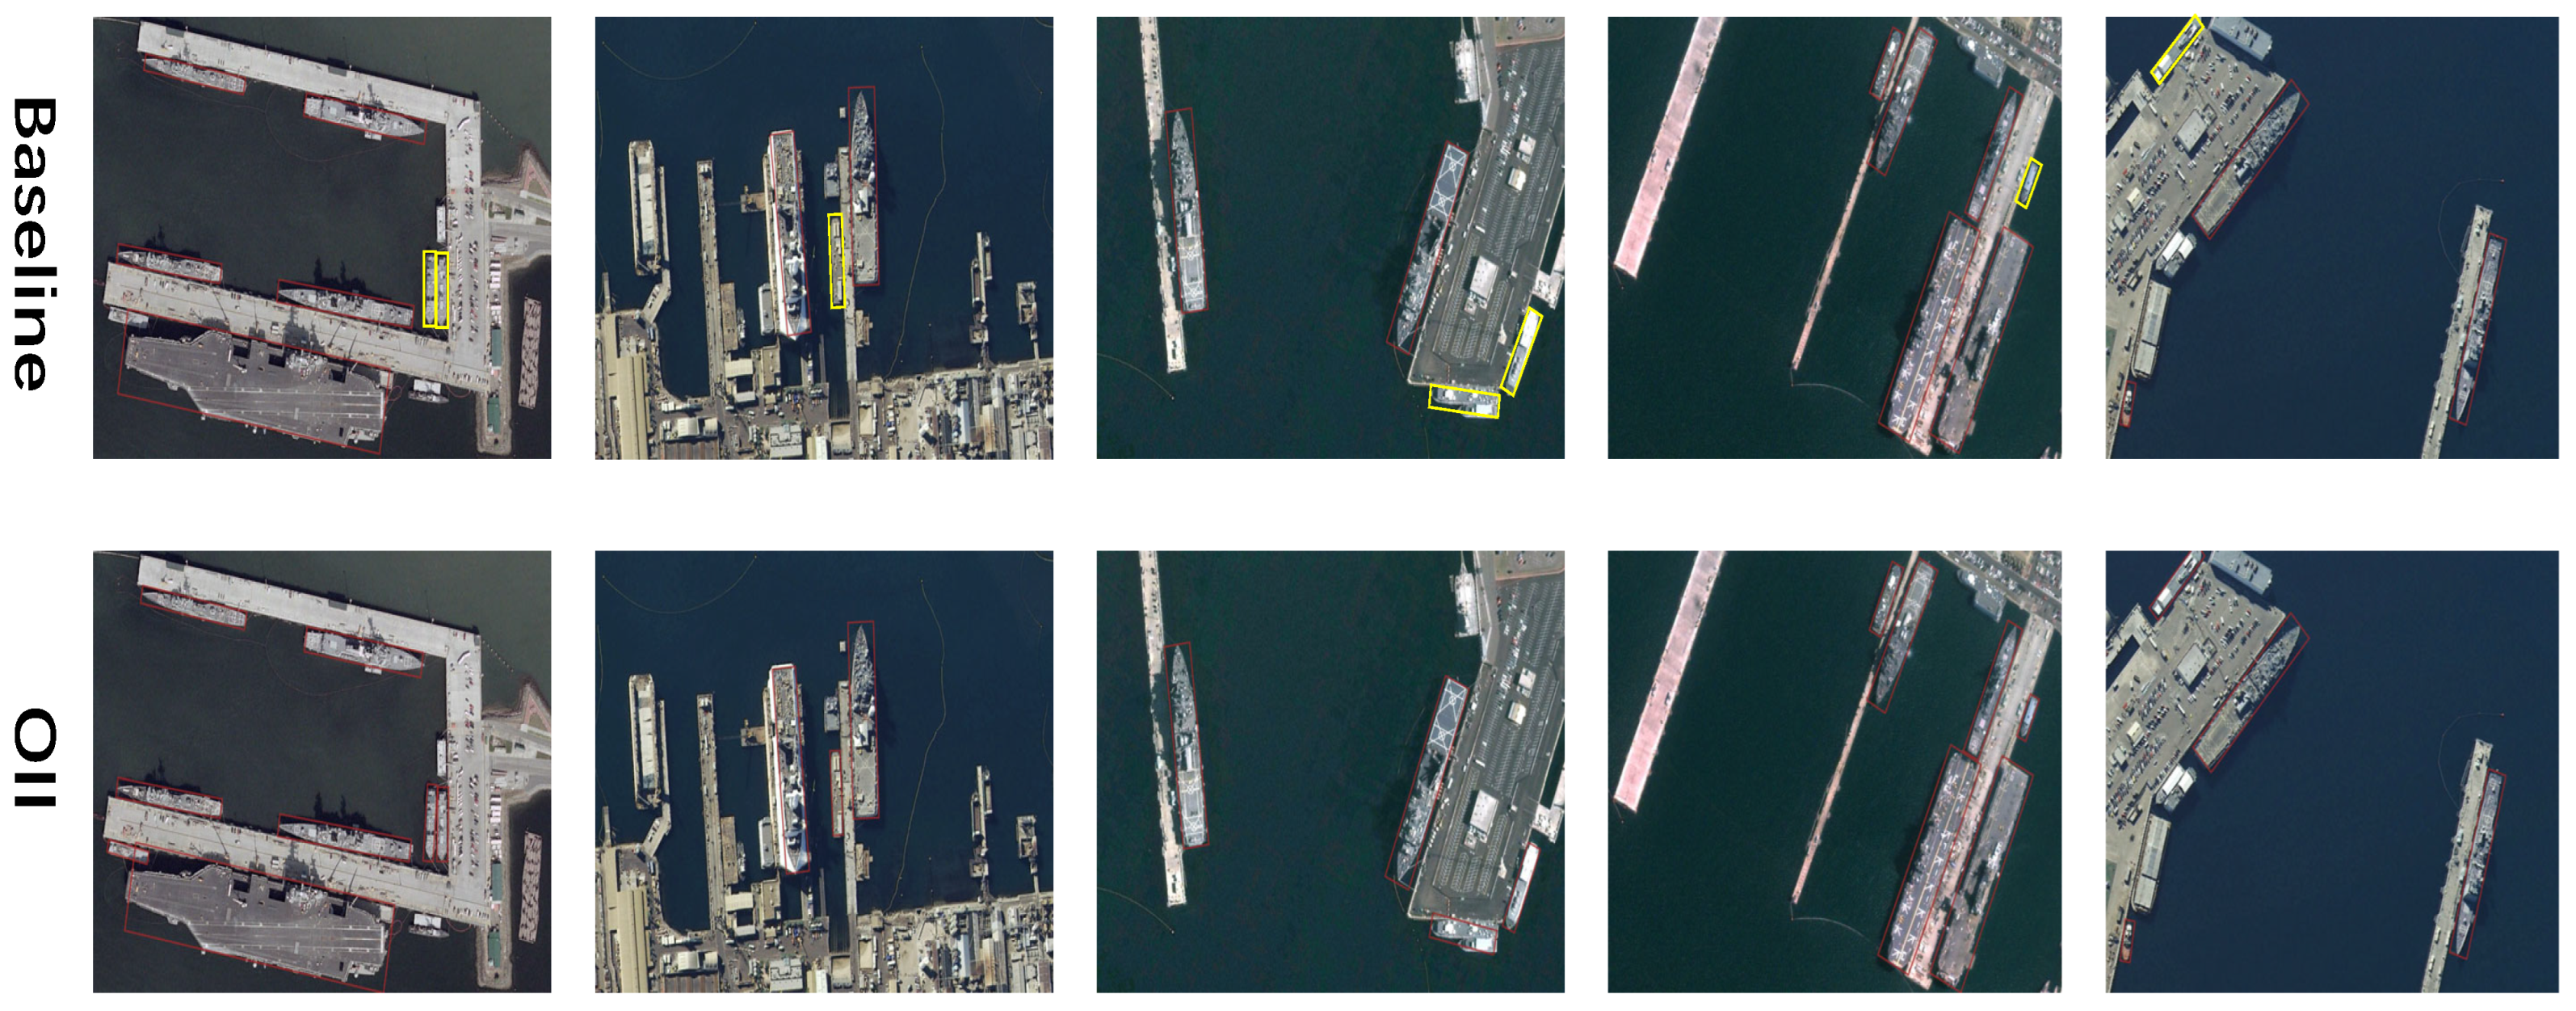
As illustrated in Table 4, we provide an evaluation of our OII model in comparison to the other 14 SOTA approaches on the HRSC2016 dataset. The outcomes indicate that our OII model achieves an outstanding mAP of 90.63 and 98.23 under the VOC 2007 and VOC 2012 metrics, respectively. These quantitative results prove the efficacy of incorporating orientation information in oriented object detection in remote sensing images. For a qualitative result, Figure 10 illustrates a comparison between the baseline method and our OII model. It can be seen that our approach detects more objects and generates more accurate rotated bounding boxes.
5. Discussion
In this section, we perform a set of ablation experiments to validate the effectiveness of each module in our proposed OII model. For simplicity, we adopt ResNet-50 as the backbone for OII in these experiments.
5.1. Analysis of OIH
The methods of orientation extraction play a key role in our OIH model. We have discussed the difference between DWT and DTCWT and provided a quantitative comparison of them on the DOTA-v1.0 and HRSC2016 datasets in single-scale training and testing. Furthermore, we also compare the performance difference that arises from separately extracting orientation information from the image approximation and stage features. The results are listed in Table 5 and Table 6. All results were produced by using the backbone of ResNet-50. It is evident that the performance of DTCWT surpassed DWT when extracting orientation information, whether from the image approximation or the stage features. The results demonstrate that the utilization of DTCWT to extract orientation information from stage features achieves 76.26 mAP on the DOTA-v1.0 dataset and 97.50 mAP(12) on the HRSC2016 dataset, which are both the best performances. This proves the effectiveness of DTCWT in extracting orientation information.
In addition to the method of orientation extraction, we also conducted experiments to verify the effectiveness of the DTCWT Blocks, which play an important role in our OIH module. As illustrated in Table 7, we investigated the impact of the number of DTCWT Blocks on the performance of the network based on ResNet-50. It can be seen that the performance of the model reaches the optimum when the number of DTCWT Blocks is three. The performance of the model will decrease when the number of DTCWT Blocks is not three.
5.2. Analysis of OFF
As mentioned in the previous section, the OFF module consists of two units, CA and MAA. We conducted extensive experiments to evaluate the effectiveness of each unit and their individual contributions to the overall performance of the network.
In order to evaluate the effectiveness of MAA, we compared it to various attention mechanisms, such as channel attention, spatial attention, and CBAM. As illustrated in Table 8, the results indicate that our proposed MAA yields the best performance, surpassing other combinations of attention mechanisms, with little increment in the parameters.
In order to evaluate the importance of the orientation weight in the CA module, we conducted a series of experiments. Initially, we avoided any processing on the output of the MAA and directly took the output as the input of the neck. Then, we incorporated the original self-attention (SA) mechanism to capture global spatial information and enhance feature representation. Finally, we replaced SA with our proposed CA and evaluated the model’s performance in each scenario. As outlined in Table 9, after integrating the SA algorithm, the model achieves an mAP(07) of 90.44 and an mAP(12) of 96.53 on the HRSC2016 dataset, obtaining improvements of 0.13 and 0.29 compared to the original model without any processing. It is notable that our CA module attains the highest mAP(07) of 90.57 and the highest mAP(12) of 97.50, surpassing the model with SA by 0.13 and 0.47. This indicates that our CA module can further leverage orientation information to boost the performance of the network by using the base of the original SA.
5.3. Effectiveness of OII
We have mentioned that our OII model can be regarded as a plug-and-play module that can be seamlessly integrated into existing mainstream networks. Extensive experiments were constructed to verify the effectiveness of the OII model. We selected various existing rotated object detectors to investigate the change in performance arising from the combination of OII on the test set of the DOTA-v1.0 dataset. All experiments were constructed on the mmrotate platform on a single RTX 3090 GPU. As illustrated in Table 10, we compared the number of parameters and computational speeds of the different detectors and the standard OII model. As an auxiliary module, OII inevitably brings a computational and parametric boost, but at the same time, it also brings a notable gain in performance to all models. The results listed in Table 11 demonstrate that our proposed OII model is able to improve the detection performance based on the original model. Whether for single-stage detectors or multi-scale detectors, the combination with our OII model always achieves a better result, which strongly verifies its effectiveness.
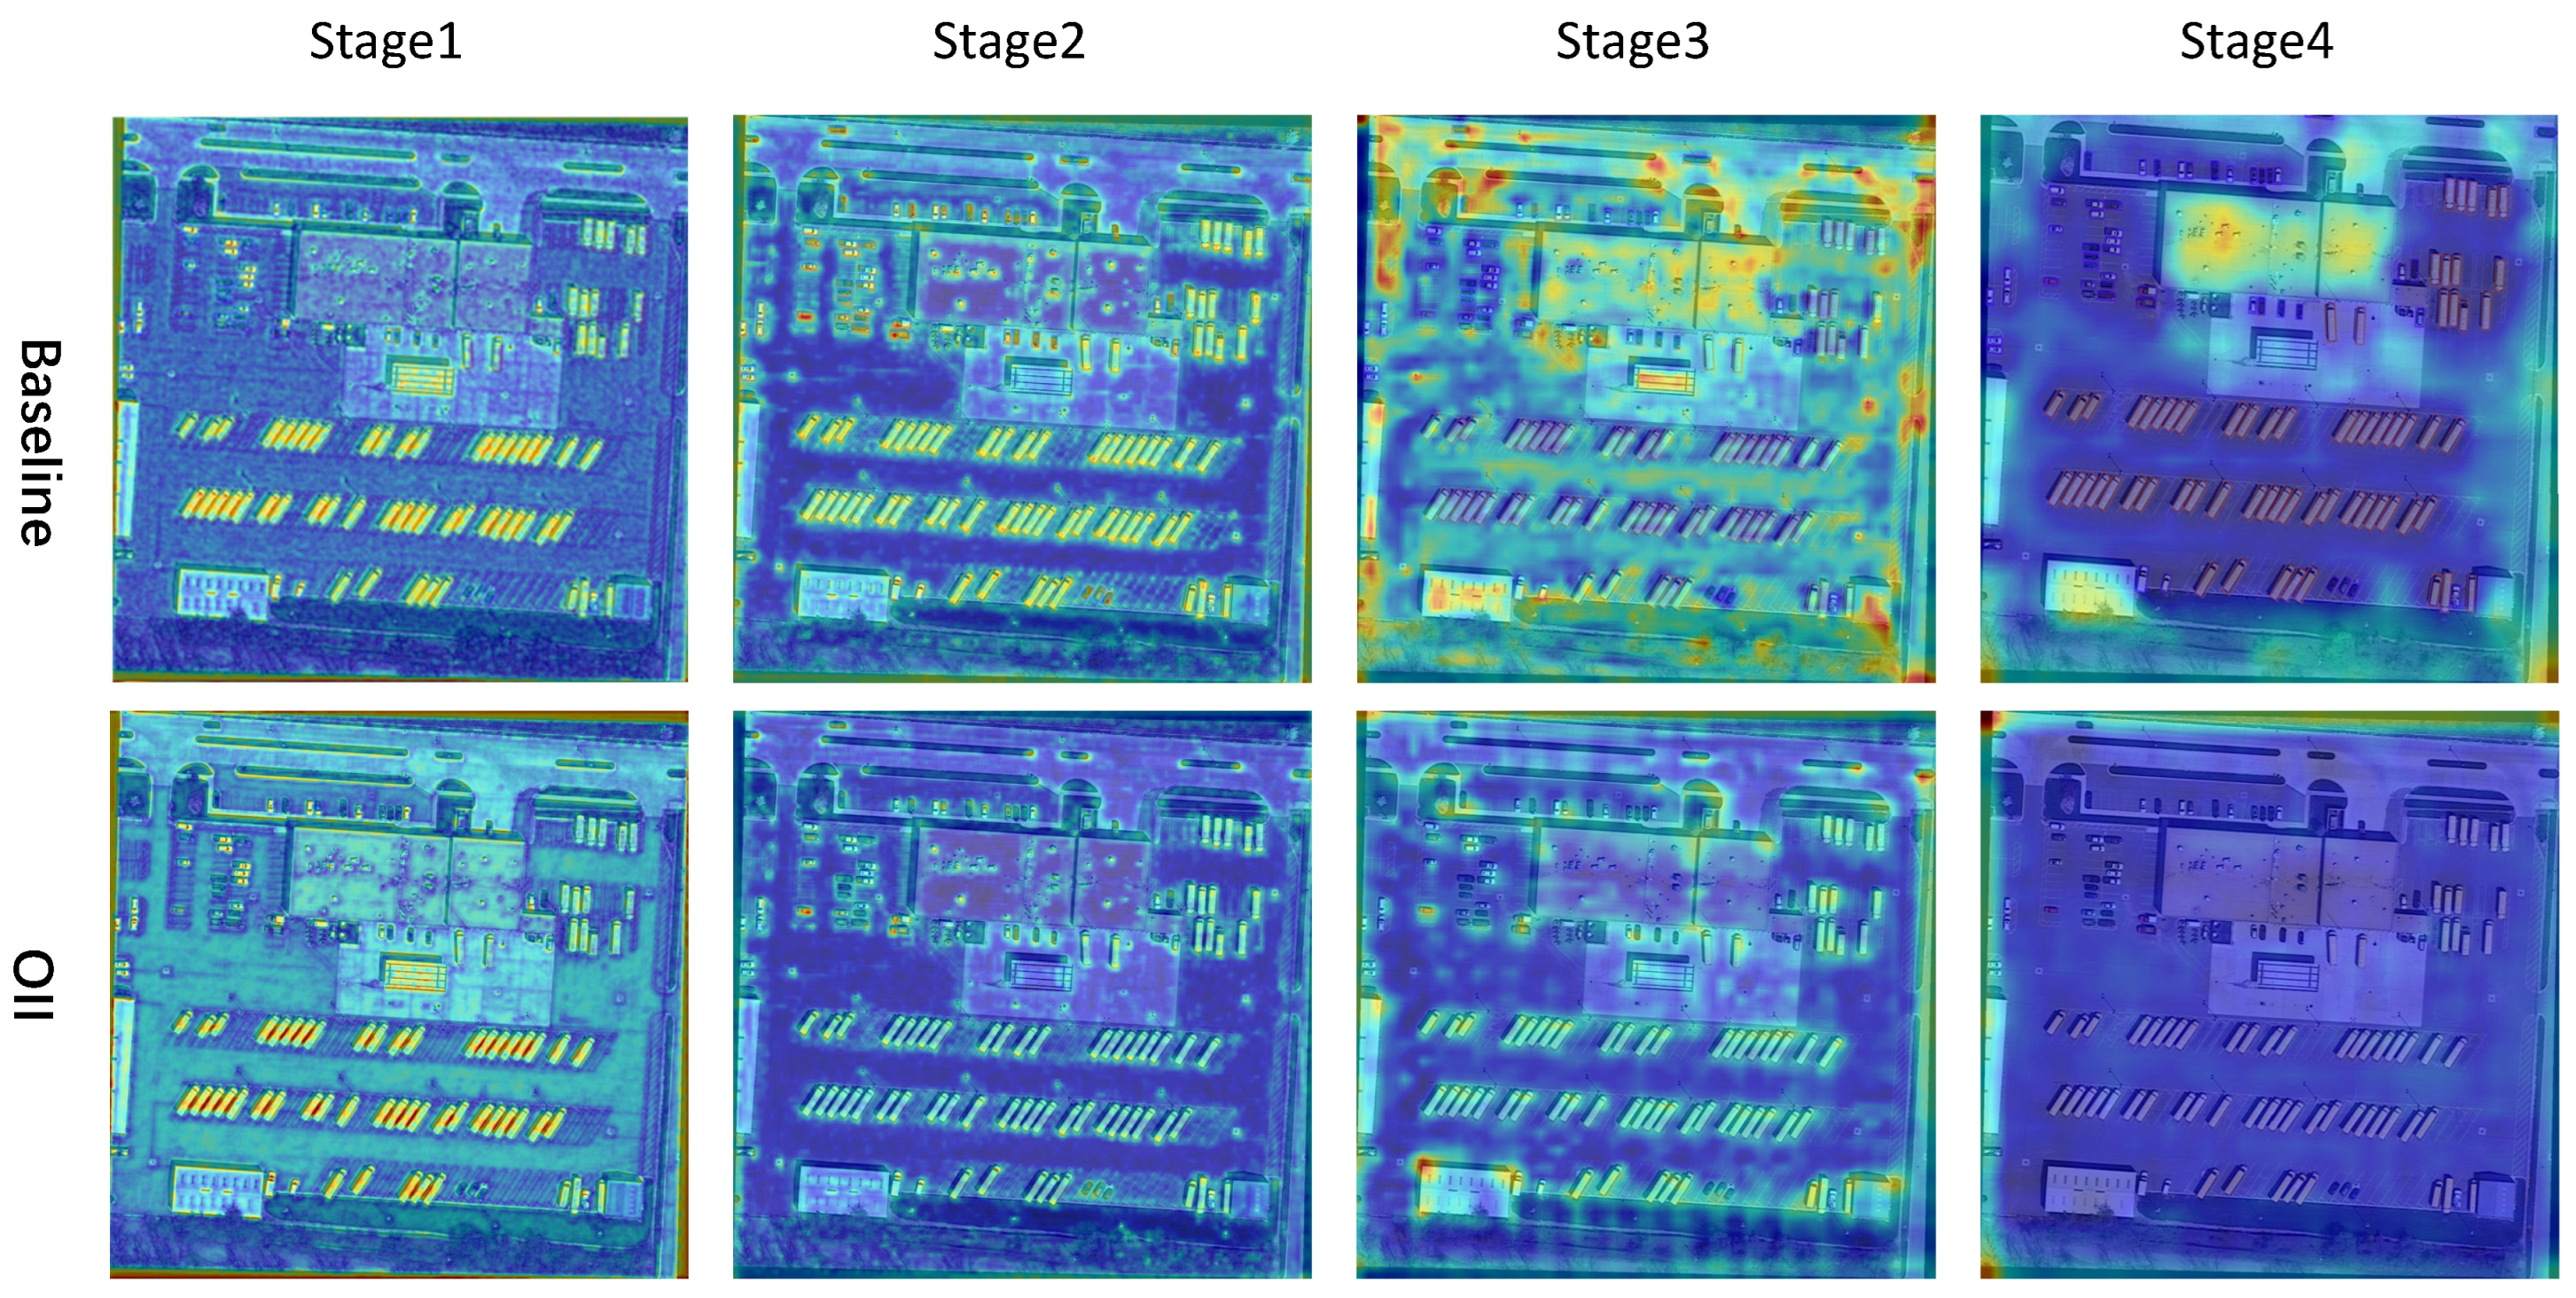
Figure 11 demonstrates the visualization of feature maps over four stages, obtained separately from the baseline and after our OII model. It highlights that the network presents a better detection ability for densely distributed small objects with the help of our OII model. This is highly beneficial for remote sensing object detection. It is worth noting that although our method can effectively utilize orientation information, it needs more parameters and computation, which leads to a decline in inference speed. At the same time, most of the images in the datasets we used were taken under normal, natural conditions, and the detection in the extreme natural scenes has not been explored in depth, which is an important research direction in the field of remote sensing. Our research focus may gradually shift in this direction afterward.
6. Conclusions
In this study, we explore the viability of utilizing orientation information to enhance oriented object detection and propose a novel OII model that is used to specifically detect oriented targets in remote sensing images. The OII model comprises two components: the OIH module and the OFF module. The OIH module efficiently extracts the orientation details through DTCWT, generating coefficients across six distinct angles. Subsequently, the coefficients are restored to the orientation feature through inverse DTCWT. The OFF module is designed to fuse the orientation features and the backbone features, thus enhancing the orientation sensitivity of features. Notably, the OII model maintains consistency between the input dimension and the output dimension, making it a plug-and-play component that is seamlessly integrated into various mainstream detectors.
Experiments on two challenging remote sensing image datasets demonstrate the superiority of our method. We achieved 80.82 mAP on the DOTA dataset and 98.32 mAP(12) on the HRSC2016 dataset, surpassing the previous SOTA methods. In addition, the ablation studies provide a detailed explanation of the working mechanism of our enhancements. The experiments on the effectiveness of the OII model further demonstrate that it can be used as a plug-and-play module and is an effective improvement of the original model in terms of performance. In our future research, we will gradually improve our method to enhance the detection performance in more complex remote sensing scenarios.
Author Contributions
Conceptualization, Y.L. and W.J.; methodology, Y.L. and W.J.; software, Y.L.; validation, Y.L. and W.J.; formal analysis, Y.L.; investigation, Y.L.; resources, W.J.; data curation, Y.L.; writing—original draft preparation, Y.L.; writing—review and editing, Y.L. and W.J.; visualization, Y.L.; supervision, W.J.; project administration, Y.L. and W.J.; funding acquisition, W.J. All authors have read and agreed to the published version of the manuscript.
Funding
This work was funded in part by the High-Resolution Remote Sensing Application Demonstration System for Urban Fine Management under Grant 06-Y30F04-9001-20/22 and, in part, by the National Natural Science Foundation of China under Grant 42371452.
Data Availability Statement
Publicly available datasets were analyzed in this study. The data can be found at https://captain-whu.github.io/DOTA/dataset.html (accessed on 28 November 2017) and https://www.kaggle.com/datasets/guofeng/hrsc2016 (accessed on 27 May 2016).
Conflicts of Interest
The authors declare no conflicts of interest. The funders had no role in the design of the study; in the collection, analyses, or interpretation of data; in the writing of the manuscript; or in the decision to publish the results.
Abbreviations
The following abbreviations are used in this manuscript:
| OII | Orientation information integrating |
| OIH | Orientation information highlighting |
| OFF | Orientation feature fusion |
| DWT | Discrete wavelet transform |
| DTCWT | Dual-tree complex wavelet transform |
| MAA | Multi-dimension aggregation attention |
| CA | Cross-domain attention |
| SA | Self-attention |
| DOTA | Dataset of object detection in aerial images |
| RPN | Region proposal networks |
| RCNN | Region convolutional neural network |
| RoI | Region of interest |
References
- Ding, J.; Xue, N.; Long, Y.; Xia, G.S.; Lu, Q. Learning RoI transformer for oriented object detection in aerial images. In Proceedings of the IEEE/CVF Conference on Computer Vision and Pattern Recognition, Long Beach, CA, USA, 15–20 June 2019; pp. 2849–2858. [Google Scholar]
- Jiang, Y.; Zhu, X.; Wang, X.; Yang, S.; Li, W.; Wang, H.; Fu, P.; Luo, Z. R2CNN: Rotational region CNN for orientation robust scene text detection. arXiv 2017, arXiv:1706.09579. [Google Scholar]
- Yang, X.; Sun, H.; Fu, K.; Yang, J.; Sun, X.; Yan, M.; Guo, Z. Automatic ship detection in remote sensing images from google earth of complex scenes based on multiscale rotation dense feature pyramid networks. Remote Sens. 2018, 10, 132. [Google Scholar] [CrossRef]
- Yang, X.; Yang, J.; Yan, J.; Zhang, Y.; Zhang, T.; Guo, Z.; Sun, X.; Fu, K. Scrdet: Towards more robust detection for small, cluttered and rotated objects. In Proceedings of the IEEE/CVF International Conference on Computer Vision, Long Beach, CA, USA, 15–20 June 2019; pp. 8232–8241. [Google Scholar]
- Qian, W.; Yang, X.; Peng, S.; Yan, J.; Guo, Y. Learning modulated loss for rotated object detection. In Proceedings of the AAAI Conference on Artificial Intelligence, Virtual, 2–9 February 2021; Volume 35, pp. 2458–2466. [Google Scholar]
- Xu, Y.; Fu, M.; Wang, Q.; Wang, Y.; Chen, K.; Xia, G.S.; Bai, X. Gliding vertex on the horizontal bounding box for multi-oriented object detection. IEEE Trans. Pattern Anal. Mach. Intell. 2020, 43, 1452–1459. [Google Scholar] [CrossRef]
- Yang, X.; Yan, J. Arbitrary-oriented object detection with circular smooth label. In Proceedings of the Computer Vision—ECCV 2020: 16th European Conference, Glasgow, UK, 23–28 August 2020; Proceedings, Part VIII 16. Springer: Cham, Switzerland, 2020; pp. 677–694. [Google Scholar]
- Ma, J.; Shao, W.; Ye, H.; Wang, L.; Wang, H.; Zheng, Y.; Xue, X. Arbitrary-oriented scene text detection via rotation proposals. IEEE Trans. Multimed. 2018, 20, 3111–3122. [Google Scholar] [CrossRef]
- Zhang, Z.; Guo, W.; Zhu, S.; Yu, W. Toward arbitrary-oriented ship detection with rotated region proposal and discrimination networks. IEEE Geosci. Remote Sens. Lett. 2018, 15, 1745–1749. [Google Scholar] [CrossRef]
- Xie, X.; Cheng, G.; Wang, J.; Yao, X.; Han, J. Oriented R-CNN for object detection. In Proceedings of the IEEE/CVF International Conference on Computer Vision, Montreal, BC, Canada, 11–17 October 2021; pp. 3520–3529. [Google Scholar]
- Zhang, G.; Lu, S.; Zhang, W. CAD-Net: A context-aware detection network for objects in remote sensing imagery. IEEE Trans. Geosci. Remote Sens. 2019, 57, 10015–10024. [Google Scholar] [CrossRef]
- Wang, P.; Sun, X.; Diao, W.; Fu, K. FMSSD: Feature-merged single-shot detection for multiscale objects in large-scale remote sensing imagery. IEEE Trans. Geosci. Remote Sens. 2019, 58, 3377–3390. [Google Scholar] [CrossRef]
- Ming, Q.; Miao, L.; Zhou, Z.; Dong, Y. CFC-Net: A critical feature capturing network for arbitrary-oriented object detection in remote-sensing images. IEEE Trans. Geosci. Remote Sens. 2021, 60, 5605814. [Google Scholar] [CrossRef]
- Fu, K.; Chang, Z.; Zhang, Y.; Xu, G.; Zhang, K.; Sun, X. Rotation-aware and multi-scale convolutional neural network for object detection in remote sensing images. ISPRS J. Photogramm. Remote Sens. 2020, 161, 294–308. [Google Scholar] [CrossRef]
- Cheng, G.; Yao, Y.; Li, S.; Li, K.; Xie, X.; Wang, J.; Yao, X.; Han, J. Dual-aligned oriented detector. IEEE Trans. Geosci. Remote Sens. 2022, 60, 5618111. [Google Scholar] [CrossRef]
- Redmon, J.; Divvala, S.; Girshick, R.; Farhadi, A. You only look once: Unified, real-time object detection. In Proceedings of the IEEE Conference on Computer Vision and Pattern Recognition, Las Vegas, NV, USA, 27–30 June 2016; pp. 779–788. [Google Scholar]
- Zheng, S.; Wu, Z.; Xu, Y.; Wei, Z.; Plaza, A. Learning orientation information from frequency-domain for oriented object detection in remote sensing images. IEEE Trans. Geosci. Remote Sens. 2022, 60, 5628512. [Google Scholar] [CrossRef]
- Woo, S.; Park, J.; Lee, J.Y.; Kweon, I.S. Cbam: Convolutional block attention module. In Proceedings of the European Conference on Computer Vision (ECCV), Munich, Germany, 8–14 September 2018; pp. 3–19. [Google Scholar]
- Lee, H.; Kim, H.E.; Nam, H. Srm: A style-based recalibration module for convolutional neural networks. In Proceedings of the IEEE/CVF International Conference on Computer Vision, Seoul, Republic of Korea, 27 October–2 November 2019; pp. 1854–1862. [Google Scholar]
- Qilong Wang, B.W.; Pengfei Zhu, P.L.; Wangmeng Zuo, Q.H. ECA-Net: Efficient Channel Attention for Deep Convolutional Neural Networks. In Proceedings of the The IEEE Conference on Computer Vision and Pattern Recognition (CVPR), Seattle, WA, USA, 13–19 June 2020. [Google Scholar]
- Ren, S.; He, K.; Girshick, R.; Sun, J. Faster r-cnn: Towards real-time object detection with region proposal networks. Adv. Neural Inf. Process. Syst. 2015, 28, 1–9. [Google Scholar] [CrossRef] [PubMed]
- Carion, N.; Massa, F.; Synnaeve, G.; Usunier, N.; Kirillov, A.; Zagoruyko, S. End-to-end object detection with transformers. In Proceedings of the European Conference on Computer Vision, Glasgow, UK, 23–28 August 2020; Springer: Cham, Switzerland, 2020; pp. 213–229. [Google Scholar]
- Wang, J.; Yang, W.; Li, H.C.; Zhang, H.; Xia, G.S. Learning center probability map for detecting objects in aerial images. IEEE Trans. Geosci. Remote Sens. 2020, 59, 4307–4323. [Google Scholar] [CrossRef]
- Law, H.; Deng, J. Cornernet: Detecting objects as paired keypoints. In Proceedings of the European Conference on Computer Vision (ECCV), Munich, Germany, 8–14 September 2018; pp. 734–750. [Google Scholar]
- Zhou, X.; Wang, D.; Krähenbühl, P. Objects as points. arXiv 2019, arXiv:1904.07850. [Google Scholar]
- Yang, J.; Liu, Q.; Zhang, K. Stacked hourglass network for robust facial landmark localisation. In Proceedings of the IEEE Conference on Computer Vision and Pattern Recognition Workshops, Honolulu, HI, USA, 21–26 July 2017; pp. 79–87. [Google Scholar]
- Han, J.; Ding, J.; Li, J.; Xia, G.S. Align deep features for oriented object detection. IEEE Trans. Geosci. Remote Sens. 2021, 60, 5602511. [Google Scholar] [CrossRef]
- He, T.; Tian, Z.; Huang, W.; Shen, C.; Qiao, Y.; Sun, C. An end-to-end textspotter with explicit alignment and attention. In Proceedings of the IEEE Conference on Computer Vision and Pattern Recognition, Salt Lake City, UT, USA, 18–23 June 2018; pp. 5020–5029. [Google Scholar]
- Hou, L.; Lu, K.; Xue, J.; Hao, L. Cascade detector with feature fusion for arbitrary-oriented objects in remote sensing images. In Proceedings of the 2020 IEEE International Conference on Multimedia and Expo (ICME), London, UK, 6–10 July 2020; pp. 1–6. [Google Scholar]
- Ming, Q.; Zhou, Z.; Miao, L.; Zhang, H.; Li, L. Dynamic anchor learning for arbitrary-oriented object detection. In Proceedings of the AAAI Conference on Artificial Intelligence, Virtual, 2–9 February 2021; Volume 35, pp. 2355–2363. [Google Scholar]
- Pan, X.; Ren, Y.; Sheng, K.; Dong, W.; Yuan, H.; Guo, X.; Ma, C.; Xu, C. Dynamic refinement network for oriented and densely packed object detection. In Proceedings of the IEEE/CVF Conference on Computer Vision and Pattern Recognition, Seattle, WA, USA, 13–19 June 2020; pp. 11207–11216. [Google Scholar]
- Yang, X.; Yan, J.; Feng, Z.; He, T. R3det: Refined single-stage detector with feature refinement for rotating object. In Proceedings of the AAAI Conference on Artificial Intelligence, Virtual, 2–9 February 2021; Volume 35, pp. 3163–3171. [Google Scholar]
- Yi, J.; Wu, P.; Liu, B.; Huang, Q.; Qu, H.; Metaxas, D. Oriented object detection in aerial images with box boundary-aware vectors. In Proceedings of the IEEE/CVF Winter Conference on Applications of Computer Vision, Virtual, 11–17 October 2021; pp. 2150–2159. [Google Scholar]
- Zhou, X.; Yao, C.; Wen, H.; Wang, Y.; Zhou, S.; He, W.; Liang, J. East: An efficient and accurate scene text detector. In Proceedings of the IEEE Conference on Computer Vision and Pattern Recognition, Honolulu, HI, USA, 21–26 July 2017; pp. 5551–5560. [Google Scholar]
- Li, Z.; Hou, B.; Wu, Z.; Ren, B.; Yang, C. FCOSR: A simple anchor-free rotated detector for aerial object detection. Remote Sens. 2023, 15, 5499. [Google Scholar] [CrossRef]
- Lin, T.Y.; Goyal, P.; Girshick, R.; He, K.; Dollár, P. Focal loss for dense object detection. In Proceedings of the IEEE International Conference on Computer Vision, Venice, Italy, 22–29 October 2017; pp. 2980–2988. [Google Scholar]
- Cheng, G.; Wang, J.; Li, K.; Xie, X.; Lang, C.; Yao, Y.; Han, J. Anchor-free oriented proposal generator for object detection. IEEE Trans. Geosci. Remote Sens. 2022, 60, 5625411. [Google Scholar] [CrossRef]
- Dai, L.; Liu, H.; Tang, H.; Wu, Z.; Song, P. Ao2-detr: Arbitrary-oriented object detection transformer. IEEE Trans. Circuits Syst. Video Technol. 2022, 33, 2342–2356. [Google Scholar] [CrossRef]
- Yang, X.; Yan, J.; Ming, Q.; Wang, W.; Zhang, X.; Tian, Q. Rethinking rotated object detection with gaussian wasserstein distance loss. In Proceedings of the International Conference on Machine Learning (PMLR), Virtual, 18–24 July 2021; pp. 11830–11841. [Google Scholar]
- Hou, L.; Lu, K.; Yang, X.; Li, Y.; Xue, J. G-rep: Gaussian representation for arbitrary-oriented object detection. Remote Sens. 2023, 15, 757. [Google Scholar] [CrossRef]
- Xu, C.; Ding, J.; Wang, J.; Yang, W.; Yu, H.; Yu, L.; Xia, G.S. Dynamic Coarse-to-Fine Learning for Oriented Tiny Object Detection. In Proceedings of the IEEE/CVF Conference on Computer Vision and Pattern Recognition, Vancouver, BC, Canada, 17–24 June 2023; pp. 7318–7328. [Google Scholar]
- Yu, Y.; Da, F. Phase-shifting coder: Predicting accurate orientation in oriented object detection. In Proceedings of the IEEE/CVF Conference on Computer Vision and Pattern Recognition, Vancouver, BC, Canada, 17–24 June 2023; pp. 13354–13363. [Google Scholar]
- Hu, J.; Shen, L.; Sun, G. Squeeze-and-excitation networks. In Proceedings of the IEEE Conference on Computer Vision and Pattern Recognition, Salt Lake City, UT, USA, 18–23 June 2018; pp. 7132–7141. [Google Scholar]
- Cao, Y.; Xu, J.; Lin, S.; Wei, F.; Hu, H. Gcnet: Non-local networks meet squeeze-excitation networks and beyond. In Proceedings of the IEEE/CVF International Conference on Computer Vision Workshops, Seoul, Republic of Korea, 27–28 October 2019. [Google Scholar]
- Hu, J.; Shen, L.; Albanie, S.; Sun, G.; Vedaldi, A. Gather-excite: Exploiting feature context in convolutional neural networks. Adv. Neural Inf. Process. Syst. 2018, 31, 1–11. [Google Scholar]
- Chen, Y.; Dai, X.; Liu, M.; Chen, D.; Yuan, L.; Liu, Z. Dynamic convolution: Attention over convolution kernels. In Proceedings of the IEEE/CVF Conference on Computer Vision and Pattern Recognition, Seattle, WA, USA, 13–19 June 2020; pp. 11030–11039. [Google Scholar]
- Li, X.; Wang, W.; Hu, X.; Yang, J. Selective kernel networks. In Proceedings of the IEEE/CVF Conference on Computer Vision and Pattern Recognition, Long Beach, CA, USA, 15–20 June 2019; pp. 510–519. [Google Scholar]
- Yang, B.; Bender, G.; Le, Q.V.; Ngiam, J. Condconv: Conditionally parameterized convolutions for efficient inference. Adv. Neural Inf. Process. Syst. 2019, 32, 1–12. [Google Scholar]
- Liu, J.J.; Hou, Q.; Cheng, M.M.; Wang, C.; Feng, J. Improving convolutional networks with self-calibrated convolutions. In Proceedings of the IEEE/CVF Conference on Computer Vision and Pattern Recognition, Seattle, WA, USA, 13–19 June 2020; pp. 10096–10105. [Google Scholar]
- Li, Y.; Hou, Q.; Zheng, Z.; Cheng, M.M.; Yang, J.; Li, X. Large Selective Kernel Network for Remote Sensing Object Detection. arXiv 2023, arXiv:2303.09030. [Google Scholar]
- Dosovitskiy, A.; Beyer, L.; Kolesnikov, A.; Weissenborn, D.; Zhai, X.; Unterthiner, T.; Dehghani, M.; Minderer, M.; Heigold, G.; Gelly, S.; et al. An Image is Worth 16x16 Words: Transformers for Image Recognition at Scale. In Proceedings of the ICLR 2021, Virtual, 3–7 May 2021. [Google Scholar]
- Yu, H.; Tian, Y.; Ye, Q.; Liu, Y. Spatial Transform Decoupling for Oriented Object Detection. arXiv 2023, arXiv:2308.10561. [Google Scholar]
- Ehrlich, M.; Davis, L.S. Deep residual learning in the jpeg transform domain. In Proceedings of the IEEE/CVF International Conference on Computer Vision, Long Beach, CA, USA, 15–20 June 2019; pp. 3484–3493. [Google Scholar]
- Wu, X.; Hong, D.; Tian, J.; Chanussot, J.; Li, W.; Tao, R. ORSIm detector: A novel object detection framework in optical remote sensing imagery using spatial-frequency channel features. IEEE Trans. Geosci. Remote Sens. 2019, 57, 5146–5158. [Google Scholar] [CrossRef]
- Rao, Y.; Zhao, W.; Zhu, Z.; Lu, J.; Zhou, J. Global filter networks for image classification. Adv. Neural Inf. Process. Syst. 2021, 34, 980–993. [Google Scholar]
- Chakraborty, T.; Trehan, U. Spectralnet: Exploring spatial-spectral waveletcnn for hyperspectral image classification. arXiv 2021, arXiv:2104.00341. [Google Scholar]
- Yao, T.; Pan, Y.; Li, Y.; Ngo, C.W.; Mei, T. Wave-vit: Unifying wavelet and transformers for visual representation learning. In Proceedings of the European Conference on Computer Vision, Tel Aviv, Israel, 23–27 October 2022; Springer: Cham, Switzerland, 2022; pp. 328–345. [Google Scholar]
- Nguyen, T.; Pham, M.; Nguyen, T.; Nguyen, K.; Osher, S.; Ho, N. Fourierformer: Transformer meets generalized fourier integral theorem. Adv. Neural Inf. Process. Syst. 2022, 35, 29319–29335. [Google Scholar]
- Patro, B.N.; Namboodiri, V.P.; Agneeswaran, V.S. SpectFormer: Frequency and Attention is what you need in a Vision Transformer. arXiv 2023, arXiv:2304.06446. [Google Scholar]
- Selesnick, I.W.; Baraniuk, R.G.; Kingsbury, N.C. The dual-tree complex wavelet transform. IEEE Signal Process. Mag. 2005, 22, 123–151. [Google Scholar] [CrossRef]
- Xia, G.S.; Bai, X.; Ding, J.; Zhu, Z.; Belongie, S.; Luo, J.; Datcu, M.; Pelillo, M.; Zhang, L. DOTA: A large-scale dataset for object detection in aerial images. In Proceedings of the IEEE Conference on Computer Vision and Pattern Recognition, Salt Lake City, UT, USA, 18–23 June 2018; pp. 3974–3983. [Google Scholar]
- Liu, Z.; Wang, H.; Weng, L.; Yang, Y. Ship rotated bounding box space for ship extraction from high-resolution optical satellite images with complex backgrounds. IEEE Geosci. Remote Sens. Lett. 2016, 13, 1074–1078. [Google Scholar] [CrossRef]
- Zhou, Y.; Yang, X.; Zhang, G.; Wang, J.; Liu, Y.; Hou, L.; Jiang, X.; Liu, X.; Yan, J.; Lyu, C.; et al. MMRotate: A Rotated Object Detection Benchmark using PyTorch. In Proceedings of the 30th ACM International Conference on Multimedia, Lisboa, Portugal, 10 October 2022. [Google Scholar]
- Everingham, M.; Van Gool, L.; Williams, C.K.; Winn, J.; Zisserman, A. The pascal visual object classes (voc) challenge. Int. J. Comput. Vis. 2010, 88, 303–338. [Google Scholar] [CrossRef]
- Azimi, S.M.; Vig, E.; Bahmanyar, R.; Körner, M.; Reinartz, P. Towards multi-class object detection in unconstrained remote sensing imagery. In Proceedings of the Asian Conference on Computer Vision, Perth, Australia, 2–6 December 2018; Springer: Cham, Switzerland, 2018; pp. 150–165. [Google Scholar]
- Li, C.; Xu, C.; Cui, Z.; Wang, D.; Zhang, T.; Yang, J. Feature-attentioned object detection in remote sensing imagery. In Proceedings of the 2019 IEEE International Conference on Image Processing (ICIP), Taipei, Taiwan, 22–25 September 2019; pp. 3886–3890. [Google Scholar]
- Han, J.; Ding, J.; Xue, N.; Xia, G.S. Redet: A rotation-equivariant detector for aerial object detection. In Proceedings of the IEEE/CVF Conference on Computer Vision and Pattern Recognition, Nashville, TN, USA, 20–25 June 2021; pp. 2786–2795. [Google Scholar]
- Li, C.; Xu, C.; Cui, Z.; Wang, D.; Jie, Z.; Zhang, T.; Yang, J. Learning object-wise semantic representation for detection in remote sensing imagery. In Proceedings of the IEEE/CVF Conference on Computer Vision and Pattern Recognition Workshops, Long Beach, CA, USA, 15–20 June 2019; pp. 20–27. [Google Scholar]
- Liang, D.; Geng, Q.; Wei, Z.; Vorontsov, D.A.; Kim, E.L.; Wei, M.; Zhou, H. Anchor retouching via model interaction for robust object detection in aerial images. IEEE Trans. Geosci. Remote Sens. 2021, 60, 5619213. [Google Scholar] [CrossRef]
- He, K.; Gkioxari, G.; Dollár, P.; Girshick, R. Mask r-cnn. In Proceedings of the IEEE International Conference on Computer Vision, Venice, Italy, 22–29 October 2017; pp. 2961–2969. [Google Scholar]
- Lyu, C.; Zhang, W.; Huang, H.; Zhou, Y.; Wang, Y.; Liu, Y.; Zhang, S.; Chen, K. Rtmdet: An empirical study of designing real-time object detectors. arXiv 2022, arXiv:2212.07784. [Google Scholar]
- Chen, Z.; Chen, K.; Lin, W.; See, J.; Yu, H.; Ke, Y.; Yang, C. Piou loss: Towards accurate oriented object detection in complex environments. In Proceedings of the Computer Vision—ECCV 2020: 16th European Conference, Glasgow, UK, 23–28 August 2020; Proceedings, Part VIII 16. Springer: Cham, Switzerland, 2020; pp. 195–211. [Google Scholar]
- Yang, Z.; Liu, S.; Hu, H.; Wang, L.; Lin, S. Reppoints: Point set representation for object detection. In Proceedings of the IEEE/CVF International Conference on Computer Vision, Long Beach, CA, USA, 15–20 June 2019; pp. 9657–9666. [Google Scholar]
- Li, W.; Chen, Y.; Hu, K.; Zhu, J. Oriented reppoints for aerial object detection. In Proceedings of the IEEE/CVF Conference on Computer Vision and Pattern Recognition, New Orleans, LA, USA, 18–24 June 2022; pp. 1829–1838. [Google Scholar]
Figure 1.
Extracting orientation information through predefined anchors and transformation.

Figure 2.
Enhancing CNN features through the attention mechanism.

Figure 3.
Illustration of our OII network. denotes the feature extracted by the backbone, denotes the orientation feature extracted by OIH, and represents the enhanced feature, which is fed into the neck.
Figure 3.
Illustration of our OII network. denotes the feature extracted by the backbone, denotes the orientation feature extracted by OIH, and represents the enhanced feature, which is fed into the neck.

Figure 4.
Orientation information extracted by DWT and DTCWT.

Figure 5.
Illustration of our OIH module.

Figure 6.
Overview of the OFF module. ⊗ denotes the matrix multiplication operation, and ⊕ indicates the element-wise addition operation.
Figure 6.
Overview of the OFF module. ⊗ denotes the matrix multiplication operation, and ⊕ indicates the element-wise addition operation.

Figure 7.
Overview of the MAA module. ⊙ denotes element-wise multiplication operation, and ⊕ indicates the element-wise addition operation.
Figure 7.
Overview of the MAA module. ⊙ denotes element-wise multiplication operation, and ⊕ indicates the element-wise addition operation.

Figure 8.
Qualitative detection results of our OII model on the DOTA dataset.

Figure 9.
The number of instances corresponding to each category.

Figure 10.
Illustration of the detection results of the baseline methods and our OII model. The yellow box represents the target that was not detected by the baseline but was detected by OII.
Figure 10.
Illustration of the detection results of the baseline methods and our OII model. The yellow box represents the target that was not detected by the baseline but was detected by OII.

Figure 11.
Visualization of feature map from the baseline and our OII model. The redder the region, the more attention the network pays to.
Figure 11.
Visualization of feature map from the baseline and our OII model. The redder the region, the more attention the network pays to.


Table 1.
The initial training parameters.
| Dataset | Input Size | Batch Size | Learning Rate | Momentum | Weight Decay | NMS Thres | Epoch |
|---|---|---|---|---|---|---|---|
| DOTA | 1024 × 1024 | 2 | 0.05 | 0.9 | 0.0001 | 0.1 | 12 |
| HRSC2016 | 800 × 800 | 2 | 0.005 | 0.9 | 0.0001 | 0.1 | 36 |
Table 2.
Comparison with state-of-the-art methods for the DOTA-v1.0 dataset with single-scale and multi-scale training and testing strategies.
Table 2.
Comparison with state-of-the-art methods for the DOTA-v1.0 dataset with single-scale and multi-scale training and testing strategies.
| Method | Backbone | PL | BD | BR | GTF | SV | LV | SH | TC | BC | ST | SBF | RA | HA | SP | HC | mAP |
|---|---|---|---|---|---|---|---|---|---|---|---|---|---|---|---|---|---|
| Single-scale | |||||||||||||||||
| FR-O [61] | R-101 | 79.42 | 77.13 | 17.70 | 64.05 | 35.30 | 38.02 | 37.16 | 89.41 | 69.64 | 59.28 | 50.30 | 52.91 | 47.89 | 47.40 | 46.30 | 54.13 |
| ICN [65] | R-101 | 81.36 | 74.30 | 47.70 | 70.32 | 64.89 | 67.82 | 69.98 | 90.76 | 79.06 | 78.20 | 53.64 | 62.90 | 67.02 | 64.17 | 50.23 | 68.16 |
| CADNet [11] | R-101 | 87.80 | 82.40 | 49.40 | 73.50 | 71.10 | 63.50 | 76.60 | 90.90 | 79.20 | 73.30 | 48.40 | 60.90 | 62.00 | 67.00 | 62.20 | 69.90 |
| Rol Transformer [1] | R-101 | 88.64 | 78.52 | 43.44 | 75.92 | 68.81 | 73.68 | 83.59 | 90.74 | 77.27 | 81.46 | 58.39 | 53.54 | 62.83 | 58.93 | 47.67 | 69.56 |
| DRN [31] | H-104 | 88.91 | 80.22 | 43.52 | 63.35 | 73.48 | 70.69 | 84.94 | 90.14 | 83.85 | 84.11 | 50.12 | 58.41 | 67.62 | 68.60 | 52.50 | 70.70 |
| CenterMap [23] | R-50 | 88.88 | 81.24 | 53.15 | 60.65 | 78.62 | 66.55 | 78.10 | 88.83 | 77.80 | 83.61 | 49.36 | 66.19 | 72.10 | 72.36 | 58.70 | 71.74 |
| SCRDet [4] | R-101 | 89.98 | 80.65 | 52.09 | 68.36 | 68.36 | 60.32 | 72.41 | 90.85 | 87.94 | 86.86 | 65.02 | 66.68 | 66.25 | 68.24 | 65.21 | 72.61 |
| FAOD [66] | R-101 | 90.21 | 79.58 | 45.49 | 76.41 | 73.18 | 68.27 | 79.56 | 90.83 | 83.40 | 84.68 | 53.40 | 65.42 | 74.17 | 69.69 | 64.86 | 73.28 |
| R3Det [32] | R-152 | 89.49 | 81.17 | 50.53 | 66.10 | 70.92 | 78.66 | 78.21 | 90.81 | 85.26 | 84.23 | 61.81 | 63.77 | 68.16 | 69.83 | 67.17 | 73.74 |
| S2A-Net [27] | R-50 | 89.11 | 82.84 | 48.37 | 71.11 | 78.11 | 78.39 | 87.25 | 90.83 | 84.90 | 85.64 | 60.36 | 62.60 | 65.26 | 69.13 | 57.94 | 74.12 |
| Oriented R-CNN [10] | R-50 | 88.79 | 82.18 | 52.64 | 72.14 | 78.75 | 82.35 | 87.68 | 90.76 | 85.35 | 84.68 | 61.44 | 64.99 | 67.40 | 69.19 | 57.01 | 75.00 |
| Oriented R-CNN [10] | R-101 | 89.08 | 81.38 | 54.06 | 72.71 | 78.62 | 82.28 | 87.72 | 90.80 | 85.68 | 83.86 | 62.63 | 69.00 | 74.81 | 70.32 | 54.08 | 75.80 |
| ReDet [67] | ReR-50 | 88.79 | 82.64 | 53.97 | 74.00 | 78.13 | 84.06 | 88.04 | 90.89 | 87.78 | 85.75 | 61.76 | 60.39 | 75.96 | 68.07 | 63.59 | 76.25 |
| OII (ours) | R-101 | 89.67 | 83.48 | 54.36 | 76.20 | 78.71 | 83.48 | 88.35 | 90.90 | 87.97 | 86.89 | 63.70 | 66.82 | 75.93 | 68.61 | 59.59 | 76.98 |
| Multi-scale | |||||||||||||||||
| FR-O [61] | R-101 | 88.44 | 73.06 | 44.86 | 59.09 | 73.25 | 71.49 | 77.11 | 90.84 | 78.94 | 83.90 | 48.59 | 62.95 | 62.18 | 64.91 | 56.18 | 69.05 |
| Rol Transformer [1] | R-101 | 88.64 | 78.52 | 43.44 | 75.92 | 68.81 | 73.68 | 83.59 | 90.74 | 77.27 | 81.46 | 58.39 | 53.54 | 62.83 | 58.93 | 47.67 | 69.56 |
| DRN [31] | H-104 | 89.71 | 82.34 | 47.22 | 64.10 | 76.22 | 74.43 | 85.84 | 90.57 | 86.18 | 84.89 | 57.65 | 61.93 | 69.30 | 69.63 | 58.48 | 73.23 |
| FAOD [66] | R-101 | 90.21 | 79.58 | 45.49 | 76.41 | 73.18 | 68.27 | 79.56 | 90.83 | 83.40 | 84.68 | 53.40 | 65.42 | 74.17 | 69.69 | 64.86 | 73.28 |
| Gliding Vertex [6] | R-101 | 89.64 | 85.00 | 52.26 | 77.34 | 73.01 | 73.14 | 86.82 | 90.74 | 79.02 | 86.81 | 59.55 | 70.91 | 72.94 | 70.86 | 57.32 | 75.02 |
| CenterMap [23] | R-101 | 89.83 | 84.41 | 54.60 | 70.25 | 77.66 | 78.32 | 87.19 | 90.66 | 84.89 | 85.27 | 56.46 | 69.23 | 74.13 | 71.56 | 66.06 | 76.03 |
| OWSR [68] | R-101 | 90.41 | 85.21 | 55.00 | 78.27 | 76.19 | 72.19 | 82.14 | 90.70 | 87.22 | 86.87 | 66.62 | 68.43 | 75.43 | 72.70 | 57.99 | 76.36 |
| S2A-Net [27] | R-50 | 88.89 | 83.60 | 57.74 | 81.95 | 79.94 | 83.19 | 89.11 | 90.78 | 84.87 | 87.81 | 70.30 | 68.25 | 78.30 | 77.01 | 69.58 | 79.42 |
| ReDet [67] | ReR-50 | 88.81 | 82.48 | 60.83 | 80.82 | 78.34 | 86.06 | 88.31 | 90.87 | 88.77 | 87.03 | 68.65 | 66.90 | 79.26 | 79.71 | 74.67 | 80.10 |
| GWD [39] | R-152 | 89.66 | 84.99 | 59.26 | 82.19 | 78.97 | 84.83 | 87.70 | 90.21 | 86.54 | 86.85 | 73.47 | 67.77 | 76.92 | 79.22 | 74.92 | 80.23 |
| EDA [69] | ReR-50 | 89.92 | 83.84 | 59.65 | 79.88 | 80.11 | 87.96 | 88.17 | 90.31 | 88.93 | 88.46 | 68.93 | 65.94 | 78.04 | 79.69 | 75.78 | 80.37 |
| FDOL [17] | ReR-50 | 88.90 | 84.57 | 60.73 | 80.83 | 78.42 | 85.82 | 88.33 | 90.90 | 88.28 | 86.93 | 71.44 | 67.13 | 79.00 | 80.35 | 74.59 | 80.41 |
| Oriented R-CNN [10] | R-101 | 90.26 | 84.74 | 62.01 | 80.42 | 79.04 | 85.07 | 88.52 | 90.85 | 87.24 | 87.96 | 72.26 | 70.03 | 82.93 | 78.46 | 68.05 | 80.52 |
| OII (ours) | R-101 | 89.52 | 84.97 | 61.71 | 81.11 | 79.63 | 85.59 | 88.67 | 90.88 | 86.82 | 87.94 | 72.27 | 70.06 | 82.58 | 78.14 | 72.42 | 80.82 |
“Single-scale” represents using the single-scale strategy during training and testing. “Multi-scale” denotes using the multi-scale strategy during training and testing.
Table 3.
Comparison with state-of-the-art methods on the DOTA v1.5 dataset. The results of the method were partly obtained from their released code and were reconstructed when needed.
Table 3.
Comparison with state-of-the-art methods on the DOTA v1.5 dataset. The results of the method were partly obtained from their released code and were reconstructed when needed.
| Method | Backbone | PL | BD | BR | GTF | SV | LV | SH | TC | BC | ST | SBF | RA | HA | SP | HC | CC | mAP |
|---|---|---|---|---|---|---|---|---|---|---|---|---|---|---|---|---|---|---|
| Single-scale | ||||||||||||||||||
| RetainaNet-O [36] | R-50 | 71.43 | 77.64 | 42.12 | 64.65 | 44.53 | 56.79 | 73.31 | 90.84 | 76.02 | 59.96 | 46.95 | 69.24 | 59.65 | 64.52 | 48.06 | 0.83 | 59.16 |
| FR-O [61] | R-101 | 71.89 | 74.47 | 44.45 | 59.87 | 51.28 | 69.98 | 79.37 | 90.78 | 77.38 | 67.50 | 47.75 | 69.72 | 61.22 | 65.28 | 60.47 | 1.54 | 62.00 |
| Mask R-CNN [70] | R-101 | 76.84 | 73.51 | 49.90 | 57.80 | 51.31 | 71.34 | 79.75 | 90.46 | 74.21 | 66.07 | 46.21 | 70.61 | 63.07 | 64.46 | 57.81 | 9.42 | 62.67 |
| ReDet [67] | ReR-50 | 79.20 | 82.81 | 51.92 | 71.41 | 52.38 | 75.73 | 80.92 | 90.83 | 75.81 | 68.64 | 49.29 | 72.03 | 73.36 | 70.55 | 63.33 | 11.53 | 66.86 |
| OII (ours) | R-101 | 77.79 | 82.03 | 49.45 | 71.37 | 59.33 | 80.30 | 85.39 | 90.88 | 80.73 | 70.26 | 51.81 | 71.59 | 75.81 | 72.19 | 54.36 | 15.01 | 68.02 |
| Multi-scale | ||||||||||||||||||
| FDOL [17] | ReR-50 | 88.41 | 86.30 | 61.25 | 82.30 | 68.00 | 84.12 | 89.95 | 90.83 | 84.31 | 76.81 | 70.74 | 73.24 | 78.72 | 73.15 | 75.54 | 16.23 | 75.62 |
| OWSR [68] | R-101 | 88.19 | 86.41 | 59.35 | 80.23 | 68.10 | 75.62 | 87.21 | 90.12 | 85.32 | 84.04 | 73.82 | 77.45 | 76.43 | 73.71 | 69.48 | 49.66 | 76.57 |
| RTMDet-R-m [71] | CSPNeXt | 89.07 | 86.71 | 52.57 | 82.47 | 66.13 | 82.55 | 89.77 | 90.88 | 84.39 | 83.34 | 69.51 | 73.03 | 77.82 | 75.98 | 80.21 | 42.00 | 76.65 |
| ReDet [67] | ReR-50 | 88.51 | 86.45 | 61.23 | 81.20 | 67.60 | 83.65 | 90.00 | 90.86 | 84.30 | 75.33 | 71.49 | 72.06 | 78.32 | 74.73 | 76.10 | 46.98 | 76.80 |
| RTMDet-R-l [71] | CSPNeXt | 89.31 | 86.38 | 55.09 | 83.17 | 66.11 | 82.44 | 89.85 | 90.84 | 86.95 | 83.76 | 68.35 | 74.36 | 77.60 | 77.39 | 77.87 | 60.37 | 78.12 |
| OII (ours) | R-101 | 87.52 | 86.22 | 61.09 | 81.19 | 67.31 | 81.47 | 88.87 | 90.48 | 85.93 | 84.65 | 69.53 | 73.26 | 75.93 | 76.98 | 79.73 | 50.48 | 77.55 |
“Single-scale” represents using the single-scale strategy during training and testing. “Muti-scale” denotes using the multi-scale strategy during training and testing.
Table 4.
Comparison with state-of-the-art models on the HRSC2016 dataset.
| Method | Backbone | Pretrained | mAP(07) | mAP(12) |
|---|---|---|---|---|
| RetinaNet-O [36] | R-50 | IN | 73.42 | 77.83 |
| DRN [31] | H-34 | IN | - | 92.70 |
| CenterMap [23] | R-50 | IN | - | 92.80 |
| RoI Transformer [1] | R-101 | IN | 86.20 | - |
| Gliding Vertex [6] | R-101 | IN | 88.20 | - |
| PIoU [72] | DLA-34 | - | 89.20 | - |
| R3Det [32] | R-101 | IN | 89.26 | 96.01 |
| DAL [30] | R-101 | IN | 89.77 | - |
| GWD [39] | R-50 | IN | 89.85 | 97.37 |
| S2ANet [27] | R-101 | IN | 90.17 | 95.01 |
| AOPG [37] | R-50 | IN | 90.34 | 96.22 |
| Oriented R-CNN [10] | R-50 | IN | 90.40 | 96.50 |
| ReDet [67] | ReR-50 | IN | 90.46 | 97.63 |
| Oriented R-CNN [10] | R-101 | IN | 90.50 | 97.60 |
| RTMDet-R [71] | CSPNeXt | COCO | 90.60 | 97.10 |
| OII (ours) | R-101 | IN | 90.63 | 98.23 |
Table 5.
Quantitative comparison of DWT and DTCWT using different positions to extract orientation information from the DOTA-v1.0 dataset.
Table 5.
Quantitative comparison of DWT and DTCWT using different positions to extract orientation information from the DOTA-v1.0 dataset.
| Method | Image Approx | Stage Features | mAP |
|---|---|---|---|
| DWT | ✓ | 75.54 | |
| DWT | ✓ | 75.37 | |
| DTCWT | ✓ | 75.84 | |
| DTCWT | ✓ | 76.26 |
Table 6.
Quantitative comparison of DWT and DTCWT using different positions to extract orientation information from the HRSC2016 dataset.
Table 6.
Quantitative comparison of DWT and DTCWT using different positions to extract orientation information from the HRSC2016 dataset.
| Method | Image Approx | Stage Features | mAP(07) | mAP(12) |
|---|---|---|---|---|
| DWT | ✓ | 89.61 | 95.10 | |
| DWT | ✓ | 90.23 | 95.87 | |
| DTCWT | ✓ | 90.42 | 96.45 | |
| DTCWT | ✓ | 90.57 | 97.50 |
Table 7.
Evaluation of the number of DTCWT Blocks on the network for the DOTA-v1.0 dataset.
| Num | Params (M) | FLOPs (G) | mAP |
|---|---|---|---|
| 0 | 52.30 | 259.90 | 75.43 |
| 1 | 53.97 | 264.43 | 75.72 |
| 2 | 55.65 | 268.96 | 76.04 |
| 3 | 57.33 | 273.49 | 76.26 |
| 4 | 59.01 | 278.02 | 76.24 |
| 5 | 60.69 | 282.55 | 76.13 |
Table 8.
Ablation for combining attention methods on the DOTA-v1.0 dataset.
| Attention Method | Params (M) | FLOPs (G) | mAP |
|---|---|---|---|
| None | 57.32 | 273.44 | 75.79 |
| Channel Attention | 57.32 | 273.44 | 75.88 |
| Spatial Attention | 57.32 | 273.44 | 75.82 |
| Channel Attention + Spatia Attention | 57.32 | 273.46 | 75.94 |
| Channel Attention & Spatial Attention | 57.32 | 273.46 | 75.96 |
| CBAM [18] | 57.32 | 273.46 | 76.05 |
| SRM [19] | 57.32 | 273.44 | 76.18 |
| ECA [20] | 57.32 | 273.44 | 76.23 |
| MAA (ours) | 57.33 | 273.49 | 76.26 |
“+” represents the sequential combination of attention methods. “&” denotes the parallel combination of attention methods.
Table 9.
Effectiveness of our CA on the HRSC2016 dataset.
| Methods | Backbone | mAP(07) | mAP(12) |
|---|---|---|---|
| None | R-50 | 90.31 | 96.24 |
| SA | R-50 | 90.44 | 96.53 |
| CA | R-50 | 90.57 | 97.50 |
Table 10.
The parameters and computational speeds of the detectors and our standard OII model on the DOTA-v1.0 dataset.
Table 10.
The parameters and computational speeds of the detectors and our standard OII model on the DOTA-v1.0 dataset.
| Method | Param (M) | FLOPs (G) | FPS |
|---|---|---|---|
| One-Stage | |||
| Rotated-RepPoints [73] | 36.82 | 184.18 | 46.62 |
| R3Det [32] | 42.12 | 335.32 | 32.32 |
| OrientedRepPoints [74] | 36.61 | 194.32 | 46.79 |
| Two-Stage | |||
| Gliding Vertex [6] | 41.47 | 225.22 | 26.35 |
| Rotated Faster RCNN [21] | 41.73 | 224.95 | 25.91 |
| Oriented RCNN [10] | 41.42 | 225.35 | 20.33 |
| OII (ours) | 57.33 | 273.49 | 20.48 |
Table 11.
The performance of the detectors before and after their combination with the OII model on the DOTA-v1.0 dataset.
Table 11.
The performance of the detectors before and after their combination with the OII model on the DOTA-v1.0 dataset.
| Method | PL | BD | BR | GTF | SV | LV | SH | TC | BC | ST | SBF | RA | HA | SP | HC | mAP |
|---|---|---|---|---|---|---|---|---|---|---|---|---|---|---|---|---|
| One-Stage | ||||||||||||||||
| Rotated-RepPoints [73] | 83.42 | 65.36 | 36.25 | 51.05 | 71.25 | 51.84 | 72.47 | 90.52 | 70.16 | 81.99 | 47.84 | 58.91 | 50.68 | 55.53 | 2.60 | 59.33 |
| Rotated-RepPoints + OII | 85.64 | 67.63 | 37.46 | 51.66 | 72.70 | 52.14 | 72.04 | 91.29 | 70.19 | 80.16 | 48.86 | 58.32 | 51.11 | 56.76 | 3.76 | 60.22 (+0.89) |
| R3Det [32] | 89.02 | 75.65 | 47.33 | 72.03 | 74.58 | 73.71 | 82.76 | 90.82 | 80.12 | 81.32 | 59.45 | 62.87 | 60.79 | 65.21 | 32.59 | 69.82 |
| R3Det + OII | 89.30 | 76.00 | 44.00 | 69.03 | 77.68 | 74.48 | 85.49 | 90.84 | 79.69 | 84.28 | 55.71 | 63.31 | 63.52 | 66.21 | 36.61 | 70.41 (+0.59) |
| OrientedRepPoints [74] | 87.75 | 77.92 | 49.59 | 66.72 | 78.47 | 73.13 | 86.58 | 90.87 | 83.85 | 84.34 | 53.06 | 65.54 | 63.73 | 68.70 | 45.91 | 71.74 |
| OrientedRepPoints + OII | 87.94 | 77.87 | 51.68 | 71.26 | 78.39 | 76.81 | 86.91 | 90.87 | 83.20 | 83.12 | 50.41 | 65.16 | 65.02 | 68.97 | 44.74 | 72.14 (+0.40) |
| Two-Stage | ||||||||||||||||
| Gliding Vertex [6] | 83.27 | 77.41 | 46.55 | 64.17 | 74.66 | 71.25 | 83.90 | 85.24 | 83.11 | 84.55 | 47.32 | 65.14 | 61.59 | 63.81 | 54.19 | 69.74 |
| Gliding Vertex + OII | 84.26 | 79.89 | 48.02 | 64.83 | 75.88 | 71.24 | 83.31 | 84.76 | 82.91 | 84.59 | 50.69 | 62.99 | 60.27 | 66.71 | 53.94 | 70.29 (+0.55) |
| Rotated Faster RCNN [21] | 88.99 | 82.05 | 50.01 | 69.94 | 77.97 | 74.08 | 86.08 | 90.81 | 83.26 | 85.57 | 57.59 | 61.17 | 66.44 | 69.35 | 57.79 | 73.41 |
| Rotated Faster RCNN + OII | 89.43 | 80.97 | 51.56 | 68.78 | 78.46 | 74.43 | 86.40 | 90.86 | 86.29 | 85.26 | 57.58 | 63.73 | 66.58 | 67.25 | 58.21 | 73.85 (+0.44) |
| Oriented R-CNN [10] | 88.79 | 82.18 | 52.64 | 72.14 | 78.75 | 82.35 | 87.68 | 90.76 | 85.35 | 84.68 | 61.44 | 64.99 | 67.40 | 69.19 | 57.01 | 75.00 |
| Oriented R-CNN + OII | 89.29 | 82.50 | 55.19 | 71.43 | 78.69 | 82.61 | 88.17 | 90.83 | 86.58 | 85.04 | 63.38 | 61.13 | 73.39 | 65.09 | 64.27 | 75.84 (+0.84) |
Disclaimer/Publisher’s Note: The statements, opinions and data contained in all publications are solely those of the individual author(s) and contributor(s) and not of MDPI and/or the editor(s). MDPI and/or the editor(s) disclaim responsibility for any injury to people or property resulting from any ideas, methods, instructions or products referred to in the content. |
© 2024 by the authors. Licensee MDPI, Basel, Switzerland. This article is an open access article distributed under the terms and conditions of the Creative Commons Attribution (CC BY) license (https://creativecommons.org/licenses/by/4.0/).
Share and Cite
MDPI and ACS Style
Liu, Y.; Jiang, W. OII: An Orientation Information Integrating Network for Oriented Object Detection in Remote Sensing Images. Remote Sens. 2024, 16, 731. https://doi.org/10.3390/rs16050731
AMA Style
Liu Y, Jiang W. OII: An Orientation Information Integrating Network for Oriented Object Detection in Remote Sensing Images. Remote Sensing. 2024; 16(5):731. https://doi.org/10.3390/rs16050731
Chicago/Turabian StyleLiu, Yangfeixiao, and Wanshou Jiang. 2024. "OII: An Orientation Information Integrating Network for Oriented Object Detection in Remote Sensing Images" Remote Sensing 16, no. 5: 731. https://doi.org/10.3390/rs16050731
Note that from the first issue of 2016, this journal uses article numbers instead of page numbers. See further details here.