
Nighttime Thermal Infrared Image Translation Integrating Visible Images


Institute of Remote Sensing and Geographic Information Systems, Peking University, 5 Summer Palace Road, Beijing 100871, China
*
Author to whom correspondence should be addressed.
Remote Sens. 2024, 16(4), 666; https://doi.org/10.3390/rs16040666
Submission received: 7 December 2023
/
Revised: 30 January 2024
/
Accepted: 8 February 2024
/
Published: 13 February 2024
(This article belongs to the Section Remote Sensing Image Processing)
Abstract
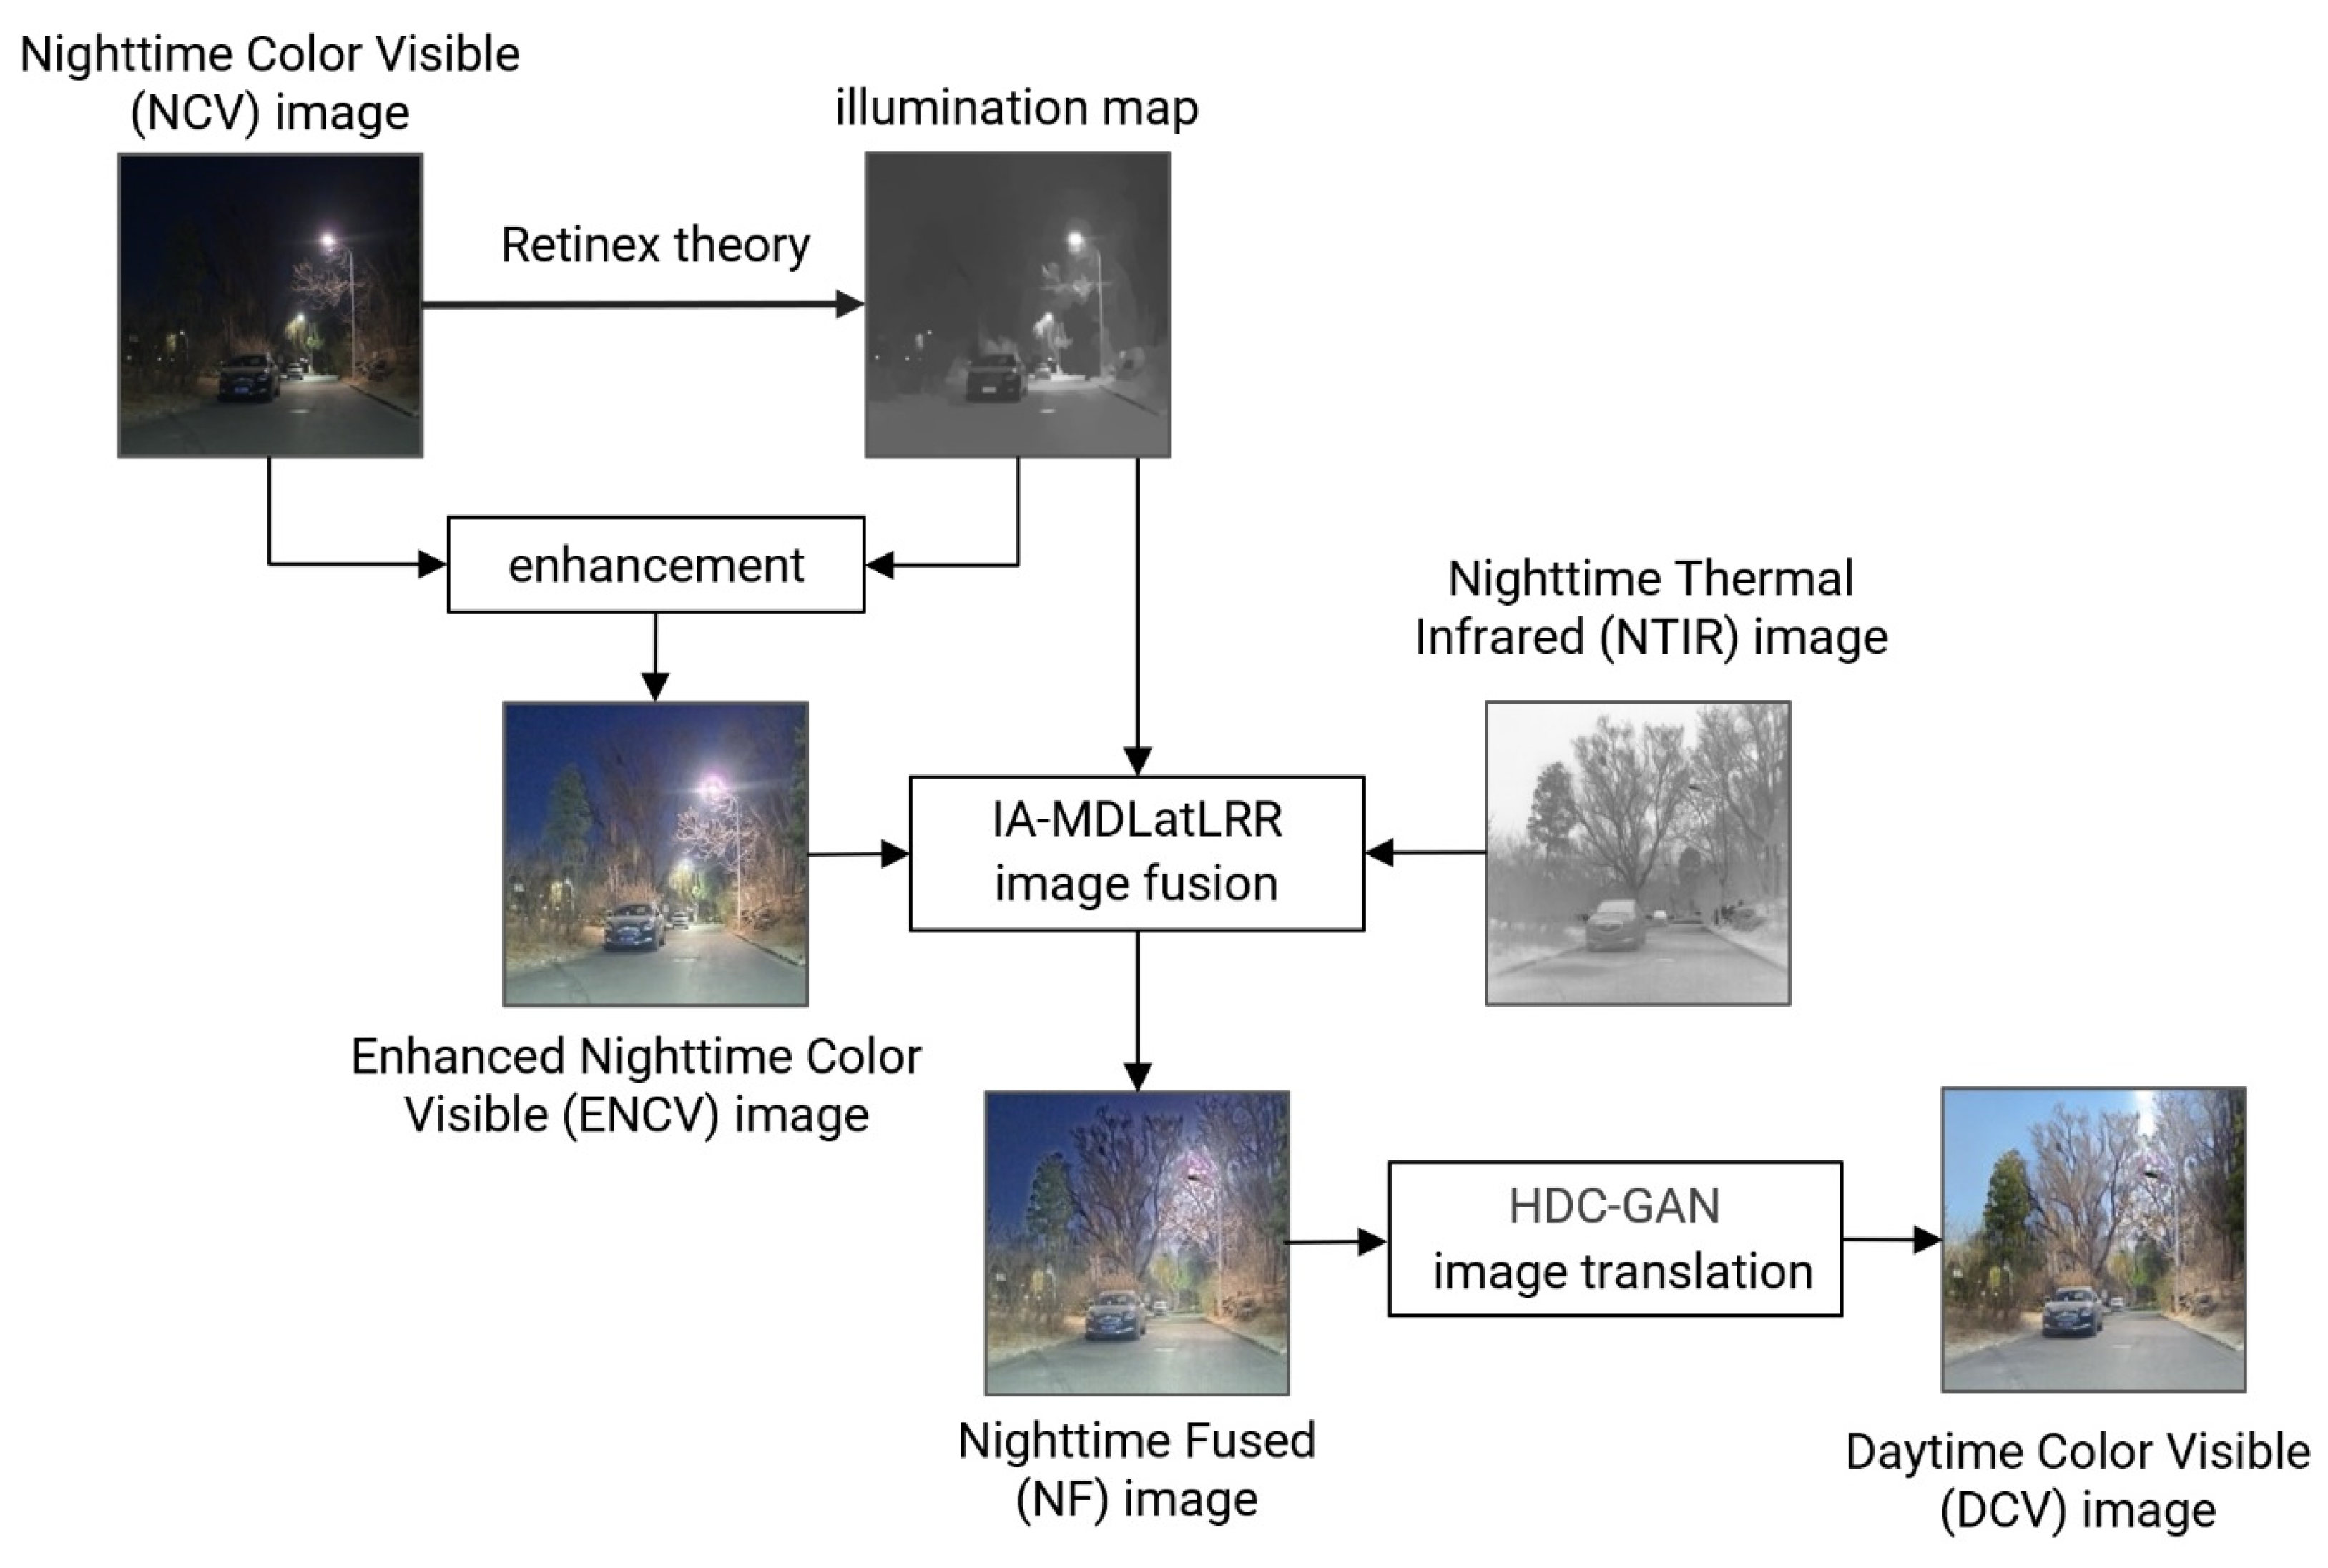
:Nighttime Thermal InfraRed (NTIR) image colorization, also known as the translation of NTIR images into Daytime Color Visible (DCV) images, can facilitate human and intelligent system perception of nighttime scenes under weak lighting conditions. End-to-end neural networks have been used to learn the mapping relationship between temperature and color domains, and translate NTIR images with one channel into DCV images with three channels. However, this mapping relationship is an ill-posed problem with multiple solutions without constraints, resulting in blurred edges, color disorder, and semantic errors. To solve this problem, an NTIR2DCV method that includes two steps is proposed: firstly, fuse Nighttime Color Visible (NCV) images with NTIR images based on an Illumination-Aware, Multilevel Decomposition Latent Low-Rank Representation (IA-MDLatLRR) method, which considers the differences in illumination conditions during image fusion and adjusts the fusion strategy of MDLatLRR accordingly to suppress the adverse effects of nighttime lights; secondly, translate the Nighttime Fused (NF) image to DCV image based on HyperDimensional Computing Generative Adversarial Network (HDC-GAN), which ensures feature-level semantic consistency between the source image (NF image) and the translated image (DCV image) without creating semantic label maps. Extensive comparative experiments and the evaluation metrics values show that the proposed algorithms perform better than other State-Of-The-Art (SOTA) image fusion and translation methods, such as FID and KID, which decreased by 14.1 and 18.9, respectively.
1. Introduction
Thermal InfraRed (TIR) cameras, unlike their visible spectrum counterparts, can capture high-quality images in low-light or pitch-dark conditions, and they exhibit superior performance in rainy or foggy scenarios. As a result, they find extensive use in nighttime scene awareness for automated driving systems, drone platforms, and surveillance systems. However, TIR images possess a single monochromatic band, offering less contrast compared to visible images, and often present blurred target boundaries that impede visual interpretation. Daytime Color Visible (DCV) images, on the other hand, are more compatible with human visual perception and facilitate easier environmental interpretation. Additionally, numerous pre-trained models are available for DCV images, which can be leveraged directly for tasks such as target detection [1], tracking [2], pedestrian identification [3], and semantic segmentation [4]. In contrast, there are fewer pre-trained models for TIR images, and their accuracy falls short compared to models designed for DCV images. Given this context, recent years have seen a surge in scholarly interest in translating Nighttime TIR (NTIR) images into DCV images (abbreviated as NTIR2DCV), leveraging machine learning methodologies.
The translation of NTIR2DCV is a mapping from one to three channels. Since it is difficult to build exact matches of NTIR-DCV dataset, most scholars used Unpaired Image Translation (UIT) based on Generative Adversarial Networks (GANs) [5] to train an end-to-end neural network for translating NTIR images into DCV images [6]. However, as the spectral band ranges of TIR and visible images are different, thus, it is difficult to establish a physical or mathematical model describing the relationship between the temperature and color domain. Due to insufficient constraints and the use of unpaired training datasets, existing UIT algorithms cannot solve the ill-posed problem in the translation from temperature to color domain [7]. For example, the DCV images translated by existing UIT algorithms have insufficient color, edge blurring, and semantic error, such as the car, people, road surface, and plants on the road side, as shown in the results in [8].
We think the best approach to dealing with this ill-posed problem of NTIR image translation is to integrate additional information to compensate for the lack of color information in the NTIR image. Urban environments are well-lit at night; therefore, it is easy to capture Nighttime Color Visible (NCV) images, although their quality is relatively low. Integrating color information from NCV image can facilitate the translation of NTIR2DCV. In addition, most current TIR cameras are integrated with CV cameras so that paired NTIR and NCV images can be used for NTIR translation.
Therefore, we propose an NTIR image translation method that integrates NCV images. The NTIR and NCV images are acquired simultaneously, and the NCV image is enhanced because it was acquired under low light conditions. The Enhanced NCV (ENCV) and NTIR images are fused to add color information to the NTIR images, and the fused images are translated into DCV images using machine learning algorithms.
The remainder of this article is organized as follows: Section 2 is a review of related research. Section 3 describes the research methods. Section 4 presents the dataset, experimental methods, and evaluation metrics. Section 5 provides the results, Section 6 presents the discussion, and Section 7 concludes the paper.
2. Related Works
The literature review focuses on nighttime visible image enhancement, TIR and visible image fusion, and GAN-based image translation.
2.1. Enhancement of Low-light Nighttime Visible Images
In contrast to daylight images, NCV images are acquired under low-light conditions and must be enhanced. Existing low-light image enhancement methods typically increase the brightness to improve scene visibility. These methods include Histogram Equalization (HE), Deep Learning (DL) methods, and approaches based on the Retinex theory.
HE methods achieve image brightness and contrast enhancement by stretching the histograms. The principles of related algorithms are simple and easy to implement; therefore, it is widely used [9,10]. However, it does not consider image texture information, and stretching the histogram amplifies the noise in dark areas, decreasing image quality.
Convolutional neural networks have powerful fitting capabilities and can learn complex mapping functions between images acquired under low-light and normal conditions. Therefore, DL-based low-light image enhancement algorithms have attracted widespread attention in recent years [11,12]. The DL-based algorithm provides images with more realistic illumination and natural color than HE algorithms. However, neural networks training depends on the quality of the dataset, and pairs of low-light and normal-light images must be acquired from the same scene. It is difficult to obtain such datasets for outdoor night scenes. Most existing datasets depict indoor scenes and are acquired by turning the light source on and off to control the illumination conditions. In addition, a network trained with these datasets has low generalization ability and is not suitable for enhancement and translation of outdoor images.
Methods based on the Retinex theory assume that the pixel values are the results of the reflectance of objects in the scene and the illumination by ambient light. The enhanced image (reflectance image) should accurately represent the colors of objects in the scene [13,14]. Enhancing a low-light image consists of creating illumination and reflectance images. Since considering the differences in illumination in the scene, the enhancement algorithm based on the Retinex theory can improve the contrast and brightness of the image and represent image details and true colors. Therefore, we use a method based on the Retinex theory to enhance the NCV images and obtain a better performance.
2.2. Thermal InfraRed and Visible Image Fusion
Many studies have investigated the fusion of TIR and visible images. The methods fall into three categories [15]: (1) methods based on Multiscale Transformation (MST), (2) methods based on DL, and (3) methods based on Representation Learning (RL).
The MST-based method includes multiscale forward transformation, the development of fusion rules, and inverse transformation. The Laplace transform [16] and the discrete wavelet transform [17] are typical MST-based methods. Each of these MST-based methods and fusion strategies has its own advantages and disadvantages. For example, the Laplace transform has straightforward implementation and fast operation. However, it does not retain high-frequency details in the fused image. Discrete wavelet transform can fully fuse the feature information of two input images using transform coefficients; therefore, it can obtain a fused image with high signal-to-noise ratio, but its ability to retain image edge information is weak.
DL-based methods can automatically extract meaningful features and fuse the images without the support of default fusion strategies. However, deep neural networks are time consuming and not suitable for real-time computer applications [18,19]. In addition, these methods can only be applied to images with a similar scene content as the training dataset, and their generalization capabilities are limited by the size of the dataset. In addition, obtaining sufficient image quality requires multiple experiments to determine the optimal parameter combination.
RL-based methods include three steps: learning the image representation, designing fusion rules, and performing inverse transformation. The methods based on Sparse Representation (SR) [20] and the methods based on Latent Low-Rank Representation (LatLRR) [21] are typical RL-based methods. An SR model learns an over-complete dictionary and represents the image as the product of the over-complete dictionary and sparse vectors, at first, the sparse vectors are fused, then inverse transformation of the over-complete dictionary is performed to obtain the fused image. In this method, the over-complete dictionary is used to capture the key features of the image and can obtain high fused image quality. However, the learning of over-complete dictionaries is time consuming and inapplicable to real-time applications.
To achieve faster calculations, Li et al. proposed a fusion method based on LatLRR. This method decomposes the source image into basic (low-rank) and salient parts by learning low-rank coefficients and salient coefficient matrices, which is quicker than learning the over-complete dictionary [21]. Subsequently, Li et al. proposed a fusion algorithm based on Multilevel Decomposition LatLRR (MDLatLRR). They believed that the basic part should be further decomposed, i.e., the source image should be decomposed into the low-rank and multiple salient parts, and different methods should be used for fusing the two parts separately, and finally, the fused image was obtained by inverse transformation [22]. MDLatLRR uses multilevel decomposition to extract rich edge information. However, the fusion strategy has limitations because it utilizes an average fusion strategy for the basic part, which reduces the image contrast.
Although many TIR and visible image fusion algorithms exist, few scholars considered the illumination conditions in the algorithm. However, the NCV images have uneven scene illumination, with areas of high brightness around lights, which are difficult to eliminate in fused images [23]. The progressive image fusion network based on illumination-aware (PIAFusion) proposed by Tang et al. uses an illumination perception module to calculate the illumination probability (i.e., the probability of a daytime or nighttime scene) and facilitate the fusion of target features and texture details using an illumination loss function [24]. However, the illumination probability calculation only considers the global illumination difference but not local illumination differences.
Therefore, we propose an improved MDLatLRR algorithm that uses the NCV illumination map to improve image fusion by incorporating local illumination difference into the fusion of the TIR and NCV images to suppress glare in the NCV image.
2.3. GAN-based Thermal InfraRed Image to Visible Image Translation
GANs have been successfully used for generating high-quality images in many fields. Numerous scholars have used them for image translation, including Paired Image Translation (PIT) [25,26] and UIT [27,28]. Most studies used the UIT algorithm for NTIR to DCV image translation due to the difficulty in obtaining a sufficient number of pixel-level registered NTIR-DCV datasets.
Luo et al. was the first author who used the UIT method for the translation of NTIR2DCV using DlamGAN [6]. Two semantic segmentation modules were added to CycleGAN to extract label maps of the source and generated images. This model constrains the semantic consistency in the translation process using a semantic loss function. However, this method requires accurate semantic segmentation of the real and generated NTIR and DCV images in the training process. If the semantic segmentation error is large, anomalous colors and textures will occur in the translated image.
The PearlGAN model [8] uses a top-down attention module to extract multiscale contextual information from the image and improve the semantic consistency between the source and generated images. It uses an attention loss function to reduce the overall and local semantic ambiguity of the translated image. However, experimental results have shown low performance of the attention module. The generated images have many erroneous semantic translation results, such as street lights translated into the sky or merged buildings and trees. Li et al. used a video streaming dataset and evaluated the spatiotemporal consistency between consecutive image frames to maintain semantic consistency during the translation [29]. However, the experimental results showed low performance and incorrect semantic translated results, such as vehicles being identified as roads.
Therefore, the most significant problem in UIT is the semantic inconsistency of the images before and after translation.
In summary, since existing image fusion and UIT algorithms suffer from various problems, this paper proposes a novel method of NTIR2DCV. A dual-lens camera is used to acquire NTIR and NCV images. The NCV image is enhanced based on the Retinex theory. The MDLatLRR algorithm is improved to optimize the fusion of the TIR and ENCV images. Since Hyperdimensional Computing (HDC) can express the semantic and style information of images and calculate them separately [30], we introduced HDC into UIT and proposed HDC-GAN to translate the fused nighttime image into a daytime image while retaining the semantic information, improving the semantic consistency between the two image types.
3. Research Methods
Figure 1 illustrates our NTIR2DCV method, which consists of three parts: (1) The illumination map of the low-light NCV images is created based on the Retinex theory and is used to enhance the NCV and obtain the ENCV image. (2) The illumination map is used in the illumination-aware MDLatLRR (IA-MDLatLRR) to fuse the ENCV and NTIR images. The IA-MDLatLRR calculates the illumination weight based on the illumination map and creates adaptive fusion rules based on basic and salient parts under different illumination conditions to obtain Nighttime Fused (NF) images unaffected by glare. (3) The HDC-GAN algorithm is proposed to improve semantic consistency during image translation. HDC-based loss functions are incorporated in HDC-GAN to ensure the semantics are consistent. We describe the details of each part below.
3.1. Illumination Map Calculation and NCV Image Enhancement
According to the Retinex theory, the low-light image consists of the illumination-enhanced image and the illumination map [14]. is expressed as follows:
where the operator represents the matrix dot multiplication.
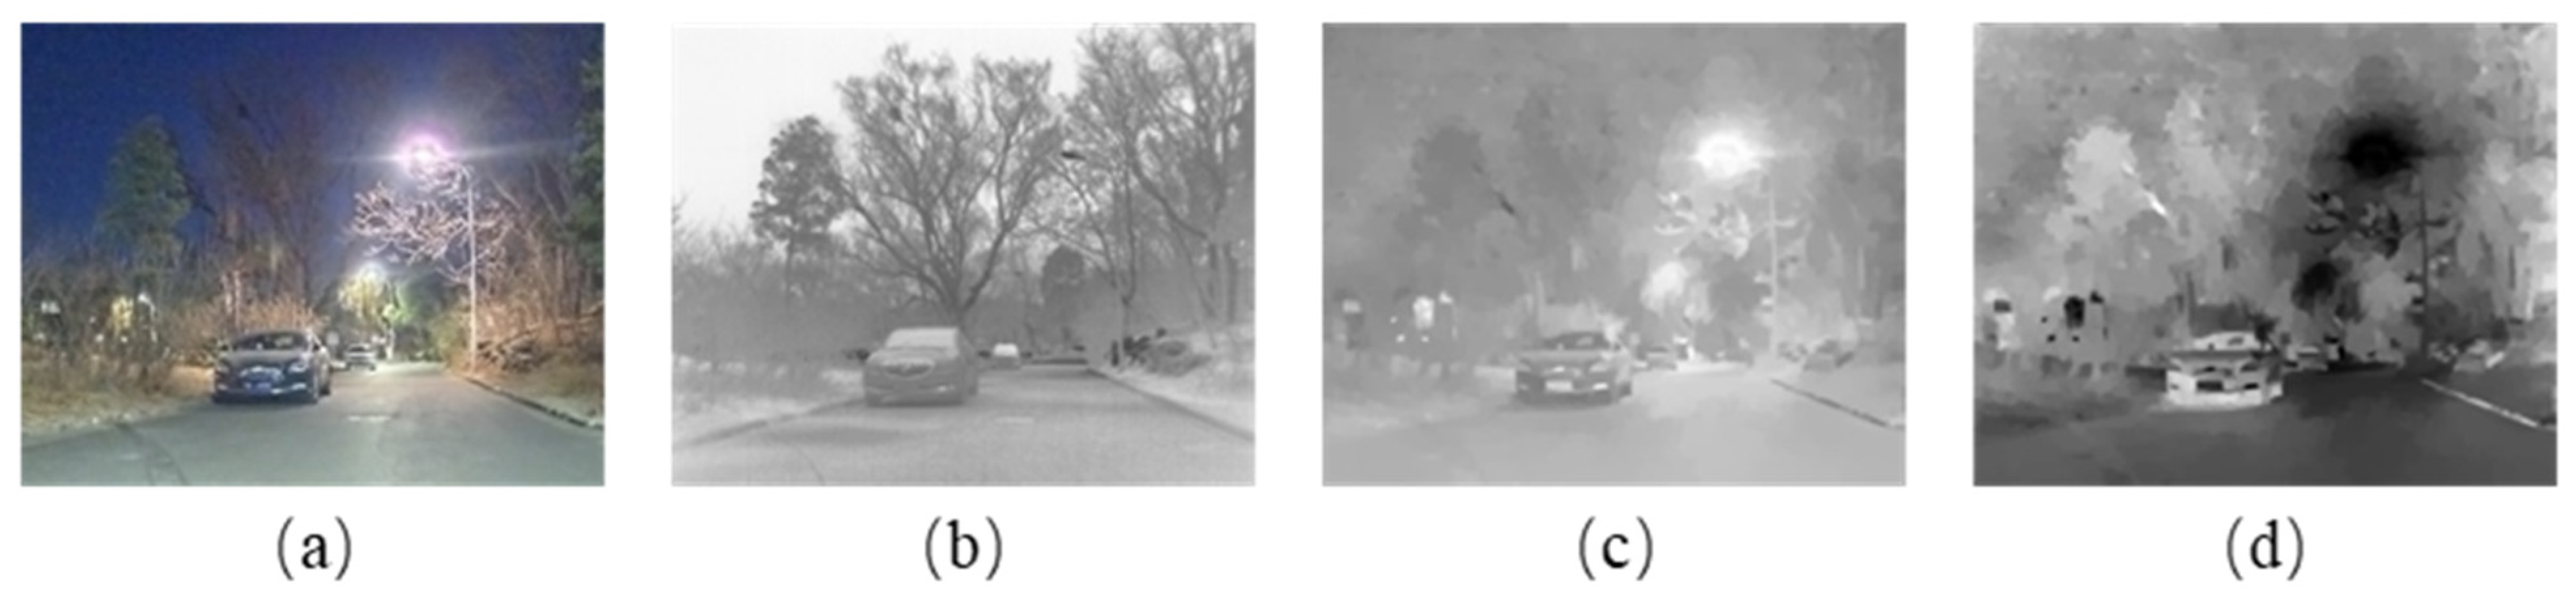
As shown in Figure 2, the original Figure 2a can be expressed as the product of the illumination-enhanced Figure 2b and the illumination map Figure 2c. According to Equation (1), the enhanced image can be obtained by calculating . Therefore, the core step of the image enhancement method based on the Retinex theory is the calculation of the illumination map .
The illumination map represents the scene illumination. The calculation based on the Retinex theory has two steps: (1) estimation of the initial illumination map (Figure 2d) and (2) refinement of the initial illumination map to obtain the final illumination map using the constraint conditions from the initial illumination map. Two constraints are added. The first is image smoothing based on texture details because the illumination in adjacent areas with similar textures is similar. The second is to retain the structure of the initial illumination map. The purpose of the illumination map optimization is to enhance the texture of by smoothing .
We use the Max-RGB method, to estimate the initial illumination map [31]. It is assumed in the Max-RGB method that the three channels of the low-light image have the same illumination conditions in a nighttime image. The initial estimate of the pixel value x of the illumination map is the maximum pixel value of the three channels R, G, and B:
The illumination map optimization algorithm proposed in [14] is simple, efficient, and does not introduce noise. We use this algorithm to optimize the illumination map. This algorithm uses the following objective function to minimize the values of the two constraints of the initial illumination map optimization:
where and are the Frobenius norm and the L1 norm, respectively, and is the coefficient of the balanced two terms. and are the weight matrices in the horizontal and vertical directions, and and are the first-order derivative filters in the horizontal and vertical directions, respectively. In the objective function (3), the smaller the first term, the more similar the structure of the initial illumination map and the final illumination map . The smaller the second term, the smoother the texture and edges of the final illumination map .
The key to optimizing the initial illumination map in the objective function (3) is the design of , i.e., the calculation of the Relative Total Variance (RTV) to calculate , we use the algorithm in [32] as follows:
where is the area centered on pixel ; is the position index in the area; is a very small constant to prevent the denominator from being 0; is a Gaussian kernel function with standard deviation that can be expressed as:
where the function measures the Euclidean distance between locations and .
After obtaining , we can solve the optimization problem described in Equation (3) to obtain the illumination map and the ENCV image according to Equation (1).
3.2. NTIR and NCV Image Fusion Based on IA-MDLatLRR
The MDLatLRR method decomposes the image into basic and salient parts. The salient part contains edge, texture, and other detailed information, and the basic part contains intensity information. In this method, an average fusion strategy is employed for the basic part, which consequently moderates the brightness and contrast of the resultant fused image. We use the illumination maps to improve the fusion strategy of MDLatLRR and propose an NTIR and NCV image fusion algorithm named IA-MDLatLRR, whose diagram is shown in Figure 3.
First, the illumination map of the NCV image is obtained based on the Retinex theory, and the ENCV image is derived using Equation (1). Then, the ENCV image is decomposed into the YCbCr channels, and the Cb and Cr channels containing color information are merged with the grayscale NF image in the last step to obtain the final color NF image. The Y channel and TIR image (denoted as and , respectively) without color information are used as the inputs of the MDLatLRR algorithm. and are decomposed times by MDLatLRR to obtain r pairs of matrices of the salient part (), an image pair of the basic part (), and . The two parts are each fused to obtain fused salient images and a fused basic image . The two are combined to obtain the final fused image.
Comparing Figure 4a,b shows that the ENCV image is affected by high illumination conditions, resulting in glare and other phenomena not conducive to visual interpretation, whereas the TIR image is not. Therefore, the weight of the TIR image is increased during the fusion in areas with glare. The ENCV shows more details and has more realistic colors than the TIR image in areas with better illumination; thus, the weight of the ENCV image is increased in these areas.
We use illumination weights to improve the fusion of the basic part and balance the impact of the illumination conditions using the following fusion expression:
where are the pixel coordinates corresponding to the basic part ( and ) and the fused basic part (). The illumination weight is calculated as follows:
where denotes the normalization operation, and is the illumination map (Figure 4c) of the ENCV image (Figure 4a) derived from Equations (2) and (3). Since a reciprocal operation is performed on the illumination map during the enhancement in Equation (1), we also perform the reciprocal operation in Equation (7) to calculate the illumination weight (Figure 4d).
The salient part retains more structural information and salient features than the basic part. We use the nuclear norm and illumination weight to calculate the fusion weight of the salient part’s matrix and fuse it column by column. The operation is shown in Figure 5.
and are the matrices of the salient part obtained by decomposing the Y channel of the ENCV () and TIR () images for the -th time by MDLatLRR, respectively; and are the column vectors corresponding to the -th column, respectively; is the fusion matric of the final salient part. The calculation formulas of the nuclear norm weights ( and ) corresponding to and are as follows:
where represents the operator that transforms the column vector into image blocks; represents the calculation of the nuclear norm. The nuclear norm calculates the sum of singular values, preserving the two-dimensional information of the source image. The weight of the nuclear norm is larger when an input image patch contains more texture and structural information.
The calculation formulas of the salient part’s illumination weights and corresponding to and are as follows:
where is the averaging operation of the column vector. The calculation formula of the illumination matrix is as follows:
where is an operator that changes the illumination weight into the illumination matrix . This operation has two steps. The first step is a calculation based on a sliding window with a size of and a step of size . The image blocks corresponding to each window are rearranged into a column vector. In the second step, all rearranged column vectors are transformed into a matrix .
After calculating the nuclear norm and illumination weight, the column vector corresponding to the -th column of the fusion matrix is obtained by weighting it as follows:
where is the coefficient to balance the illumination weight and the nuclear norm weight .
After obtaining the salient part’s fusion matrix , it is reconstructed into the salient image :
where is the reconstruction operator that rearranges each column of into image blocks and averages the overlapping pixels between the image blocks.
After obtaining the fused salient images and the basic image , they are combined to obtain the final fused image:
3.3. Nighttime to Daytime Image Translation Based on HDC-GAN
It is assumed that an image from the source domain (nighttime scene) contains a dark blue sky and bright street lights. Without losing generality, we assume that the image feature corresponding to is a hypervector , which can be expressed as the semantic symbols of the sky and street lights and their style symbols:
where and are semantic symbols representing the sky and street lights, respectively, and are style symbols representing the dark blue color of the sky and the brightness of the street lights, respectively; is the HDC binding/unbinding operator [33], representing the relationship between the semantic symbols c and p and their styles and .
Since HDC can express the hypervectors, we use it to express the semantic and style information of the images. Neubert found that the hypervector of the image features could be expressed using a Locality-Sensitive Hash (LSH) table [33].
The goal of image translation is to unbind the semantic symbols (which are expressed as hypervectors in HDC) from the style symbols in the source domain and bind them with the style symbols in the target domain . This process requires training the mapping hypervector between the source domain and the target domain . If the hypervector expressing the image features of the target image is , the mapping relationship between it and the image feature hypervector corresponding to the source image can be expressed as:
where:
Uncorrelated hypervectors in the HDC hyperspace are orthogonal; therefore, the noise generated by binding and unbinding incorrect styles (such as ) in Equation (15) is negligible [34]. Since the binding/unbinding operation is reversible (for example, ), and are unbound from the source domain style symbols and and bound with the target domain style symbols and in Equation (15). This strategy ensures the consistency of the semantic information in the style transfer. It is worth noting that is equivalent to , i.e., a single mapping can be used to perform forward and reverse mapping between the target and source domains: .
We propose the HDC-GAN model to prevent semantic errors during UIT in the translation from the NF to the DCV image, as shown in Figure 6. HDC-GAN has three main network components: a generator , a discriminator , and a mapping network . It has two loss functions: a hypervector adversarial loss (GAN loss for short) and a hypervector cycle consistency loss (HDC loss for short).
HDC-GAN uses unpaired images as input and trains the generator to translate the source image from the source domain to the target domain to obtain the translated image . The discriminator is trained to distinguish whether the hypervectors and corresponding to the target image and the translated image belong to the target domain . We use the pre-trained VGG19 network [35] to extract the features of image , and . Then, we use the LSH method to project these image features to the hypervectors denoted as , , and .
Furthermore, we train the mapping network to learn the hypervector mapping between the source and target domains. Specifically, we input to and train to output , i.e., . The reversible performs two operations simultaneously: unbinding the style of the source domain (or target domain) and binding the style of the target domain (or source domain). We bind to the translated hypervector , and the resulting inverted translated hypervector, which is mapped to the source domain, is denoted as . We bind to the source hypervector , and the resulting hypervector mapped to the target domain is denoted as :
The GAN loss is calculated to train , and to learn different styles of the target and source domains. We input the hypervectors , , and belonging to the target domain to the discriminator to calculate the GAN loss:
Although the adversarial training method can generate images that match the target style, images with semantic errors may correspond to the target style when only the GAN loss is used. Therefore, we need an additional loss to constrain the generator and preserve the semantic information of the source domain while transforming the style. Thus, we propose the HDC loss. When the translated hypervector is mapped back from the target domain to the source domain, it is expected that the obtained hypervector is the same as the original source hypervector:
where is the cosine distance between the hypervectors. We minimize the cosine distance between and to ensure that the inverted translated hypervector has the same semantics and styles as the source hypervector.
The total loss function of the HDC-GAN consists of the GAN loss and the HDC loss and is expressed as:
where λ is a parameter that adjusts the relative proportion of the two loss functions.
4. Experimental Methods and Evaluation Metrics
4.1. Datasets
Since this research focuses on the translation of NTIR images fused with NCV images, it has strict requirements for the dataset for training the neural network. Most of the images in the TIR and CV datasets KAIST and FLIR were acquired during the daytime. The number of visible images taken at night is small and not suitable for this study. Therefore, we used the DJI ZENMUSE XT2 camera to collect a dataset including 268 pairs of NTIR and NCV images in urban scene. The NTIR images were acquired in the black heat mode, which means that the darker the pixels in the NTIR image, the higher the temperature value. All data were used for training and testing in the fusion experiment. In the translation experiment, 80% of the images were selected as the training set. The remaining 20% of the images were used as the test set to calculate quantitative indicators and compare the translated images obtained by different methods.
The visible camera of the XT2 was used to collect about 300 images of daytime scenes. The original resolution of the NCV images and DCV images was 4000 × 3000, and the original resolution of the TIR images was 640 × 512. For the convenience of fusion and translation, we registered the NCV and NTIR images and down sampled NCV to 640 × 512.
4.2. Experimental Methods
The hardware configuration of the desktop computer used in the image fusion experiment was as follows: The CPU was Intel i7-11700, 16 G 3000 MHz memory was used, and the code was written using MATLAB R2022b. The image translation experiment used a Dell PowerEdge T640 tower server with an Intel Xeon Silver 4116 CPU, an Nvidia 1080Ti GPU, and 128 G 3200 MHz memory.
In the image fusion experiment, for IA-MDLatLRR, we set the decomposition number of the source image to 2. We introduced illumination weights to fuse the basic part obtained from image decomposition. The main configuration parameters were the same as in [22]; in the fusion of the salient part, we set the coefficient to 0.5 to balance the illumination weight and the nuclear norm weight.
We conducted three image translation experiments to compare the translations from TIR to DCV, NCV to DCV, and NF to DCV. Before the translation, the input images were scaled from 640 × 512 to 256 × 256. We chose the same generator as the UNSB method in [36] because it is one of state-of-the-art DL methods.
The discriminator and mapping network used fully convolutional networks. The discriminator used a three-layer fully convolutional network with a 1 × 1 convolution filter. Its first layer input dimension (i.e., the hypervector dimension) was 4096, the output dimensions of the first two layers were 1024, and the output dimension of the last layer was 1. The mapping network used a two-layer fully convolutional network, and the input and output dimensions were 4096.
An Adam optimizer was used (, ) [37] with a batch size of 1, a learning rate of the generator and mapping network of 0.0001, and a learning rate of the discriminator of 0.0004. Additionally, was 10 in the total loss function (Equation (20)).
We compared the results of three fusion methods with our proposed image fusion method: MDLatLRR [22], DenseFuse [38], and SwinFusion [39]. Four translation methods were compared with our HDC-GAN: CycleGAN [27], CUT [40], QS-attn [28], and UNSB [36], whose training duration is 6 h, 12 h, 20 h, and 28 h, respectively, while training our HDC-GAN requires 16 h. In addition, the training epoch of all neural networks is set to 200.
4.3. Evaluation Metrics
We used four indicator types to evaluate the quality of the fused images: information entropy, image feature, correlation, and human perception-based indicators. The indicators based on information entropy included ENtropy (EN) [41], Mutual Information (MI) [42], Peak Signal-to-Noise Ratio (PSNR) [43], and an indicator based on edge information () [44]. The indicators based on image features included the Average Gradient (AG) [45] and Standard Deviation (SD) [46]. Indicators based on correlation included the Correlation Coefficient (CC) [47] and the Sum of the Correlation Differences (SCD) [48]. The indicator based on human perception was Visual Information Fidelity (VIF) [49]. The higher the value of the nine image fusion indicators, the better the model performance.
We chose the widely used Frechet Inception Distance (FID) [50] and Kernel Inception Distance (KID) [51] to measure the similarity between the real and generated images and assess image translation performance. The lower the value of the two image translation indicators, the better the model performance.
5. Experimental Results
5.1. Image Fusion Experiment
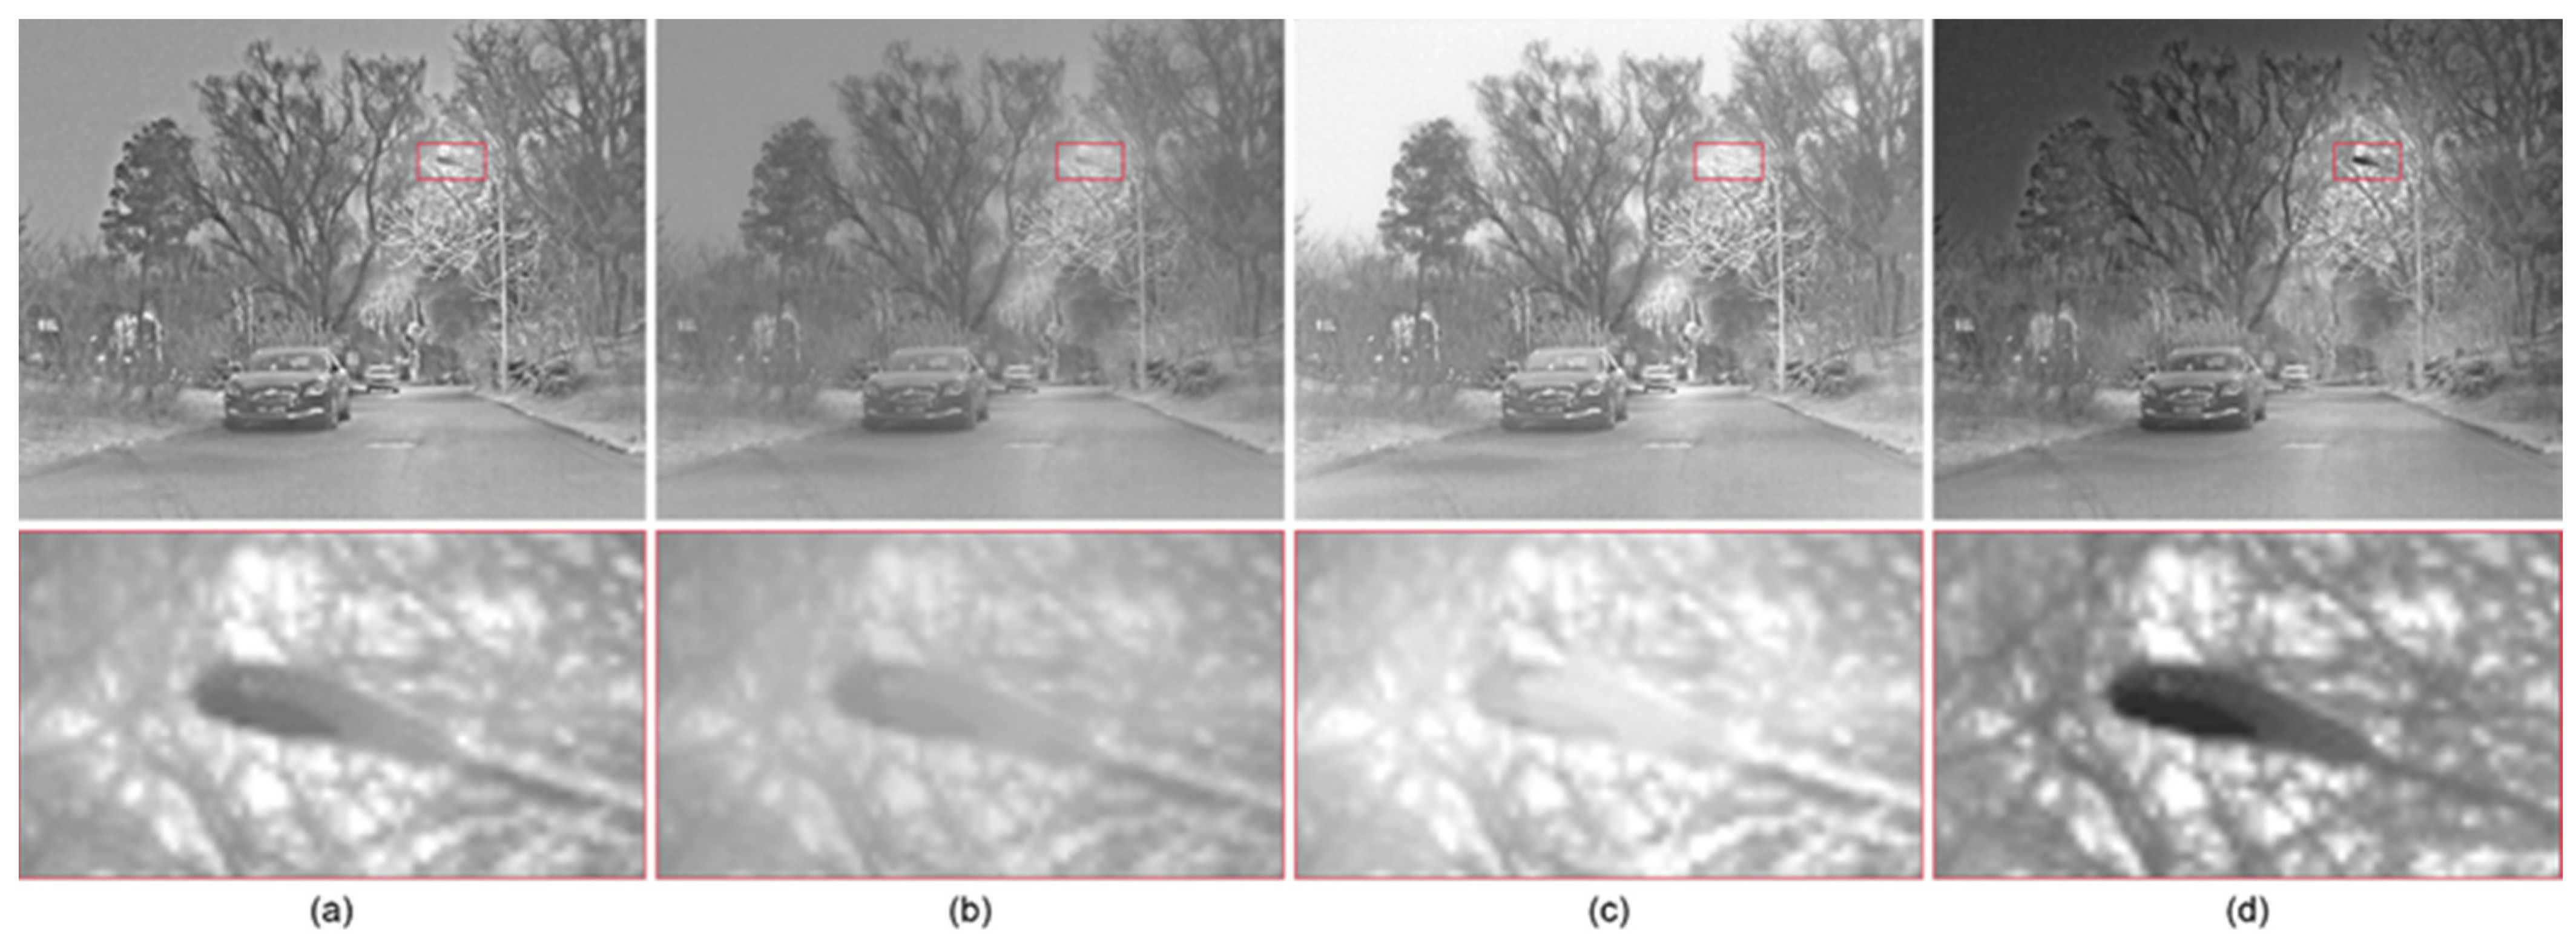
We conducted fusion experiments with four methods, including the proposed method. Due to space limitations, Figure 7 only shows the fusion results of six images. Figure 7a is the NTIR image, Figure 7b is the Y channel of the ENCV image, and Figure 7c–f show the fusion results of MDLatLRR, DenseFuse, SwinFusion, and the proposed IA-MDLatLRR.
The results of the nine evaluation indicators are listed in Table 1. In terms of entropy-based metrics, MDLatLRR surpasses the second-ranked method by margins of 0.14, 0.29, 0.34, and 0.05 for EN, MI, PSNR, and , respectively. This indicates that images fused via the IA-MDLatLRR technique contain a more substantial information. When considering correlation-based measures, MDLatLRR’s CC and SCD values outperform those of its closest competitor by 0.02 and 0.12, respectively. This implies a greater degree of similarity between the source images and those fused by the IA-MDLatLRR method. From a human perception-based standpoint, MDLatLRR’s VIF value exceeds that of the second-best method by 0.07. This suggests that images produced by the IA-MDLatLRR method exhibit better visual fidelity.
Despite its strengths, IA-MDLatLRR exhibits a slightly inferior performance to SwinFusion on image feature-based metrics (AG and SD). This is primarily due to the fact that SwinFusion’s loss function yields more texture information. Thermal InfraRed (TIR) images of nocturnal scenes are rich in gradients and textures. Our proposed method takes into account information from both visible and TIR images, which leads to lower indicator values compared to SwinFusion. However, SwinFusion is a neural network method that requires extensive training time, and its generalization ability is affected by the dataset. It is less convenient than the proposed method for practical applications. Moreover, the VIF and SD metrics for IA-MDLatLRR surpass those of MDLatLRR, indicating that our improvements resulted in better visual performance and higher contrast.
The fused images obtained by the DL-based algorithm (Figure 7d,e) retained most glare in the original visible image (Figure 7b). The results of the proposed method (Figure 7f) were less affected by illumination. For the convenience of comparison, we display the fused images of different algorithms in the fourth row of Figure 7 and Figure 8. The fused image obtained by IA-MDLatLRR with the illumination weight was closer to the TIR image. The texture is richer, and objects can be better distinguished from the background area than in the images derived from the other algorithms.
5.2. Image Translation Experiments
The results of the image translation experiment are listed in Table 2. The NF to DCV translation performed the best, followed by the NTIR to DCV and NCV to DCV translations. The image derived from the NF to DCV translation was more realistic than that from the NTIR to DCV translation, demonstrating the necessity of combining nighttime color information and temperature information. The image derived from the NTIR to DCV translation was more realistic than that from the NCV to DCV translation. The reason is that a thermal sensor captures more texture information than a visible sensor in nighttime scenes. Therefore, the results obtained from the three sets of experiments are consistent with our expectations.
The proposed HDC-GAN outperformed the other algorithms in the three sets of experiments. In Table 2, in NF- > DCV process, the HDC-GAN method demonstrated superior performance with FID and KID scores being 14.1 and 18.9 lower than those of the second-ranked UNSB. In the NTIR- > DCV process, HDC-GAN showed significant improvements, with reductions in FID and KID values by 11.6 and 9.7, respectively when compared with UNSB. Furthermore, in the NCV- > DCV process, HDC-GAN performs much better than UNSB, resulting in FID and KID scores lower than UNSB with a value of 13.6 and 6.1, respectively.
- (a)
- NCV to DCV
Figure 9 shows the results of the NCV to DCV translation. All the UIT algorithms were able to translate unenhanced low-light NCV images into bright daytime images. Figure 10 shows the magnification of some images derived from CycleGAN, UNSB, and HDC-GAN. The other UIT algorithms exhibited many semantic errors, such as numerous irregular spots in the sky, and unrealistic shadows on the road. The buildings, vehicles, and trees were distorted and difficult to recognize. In contrast, the image translated by the HDC-GAN was darker and showed more semantic consistency with the NCV image.
- (b)
- NTIR to DCV
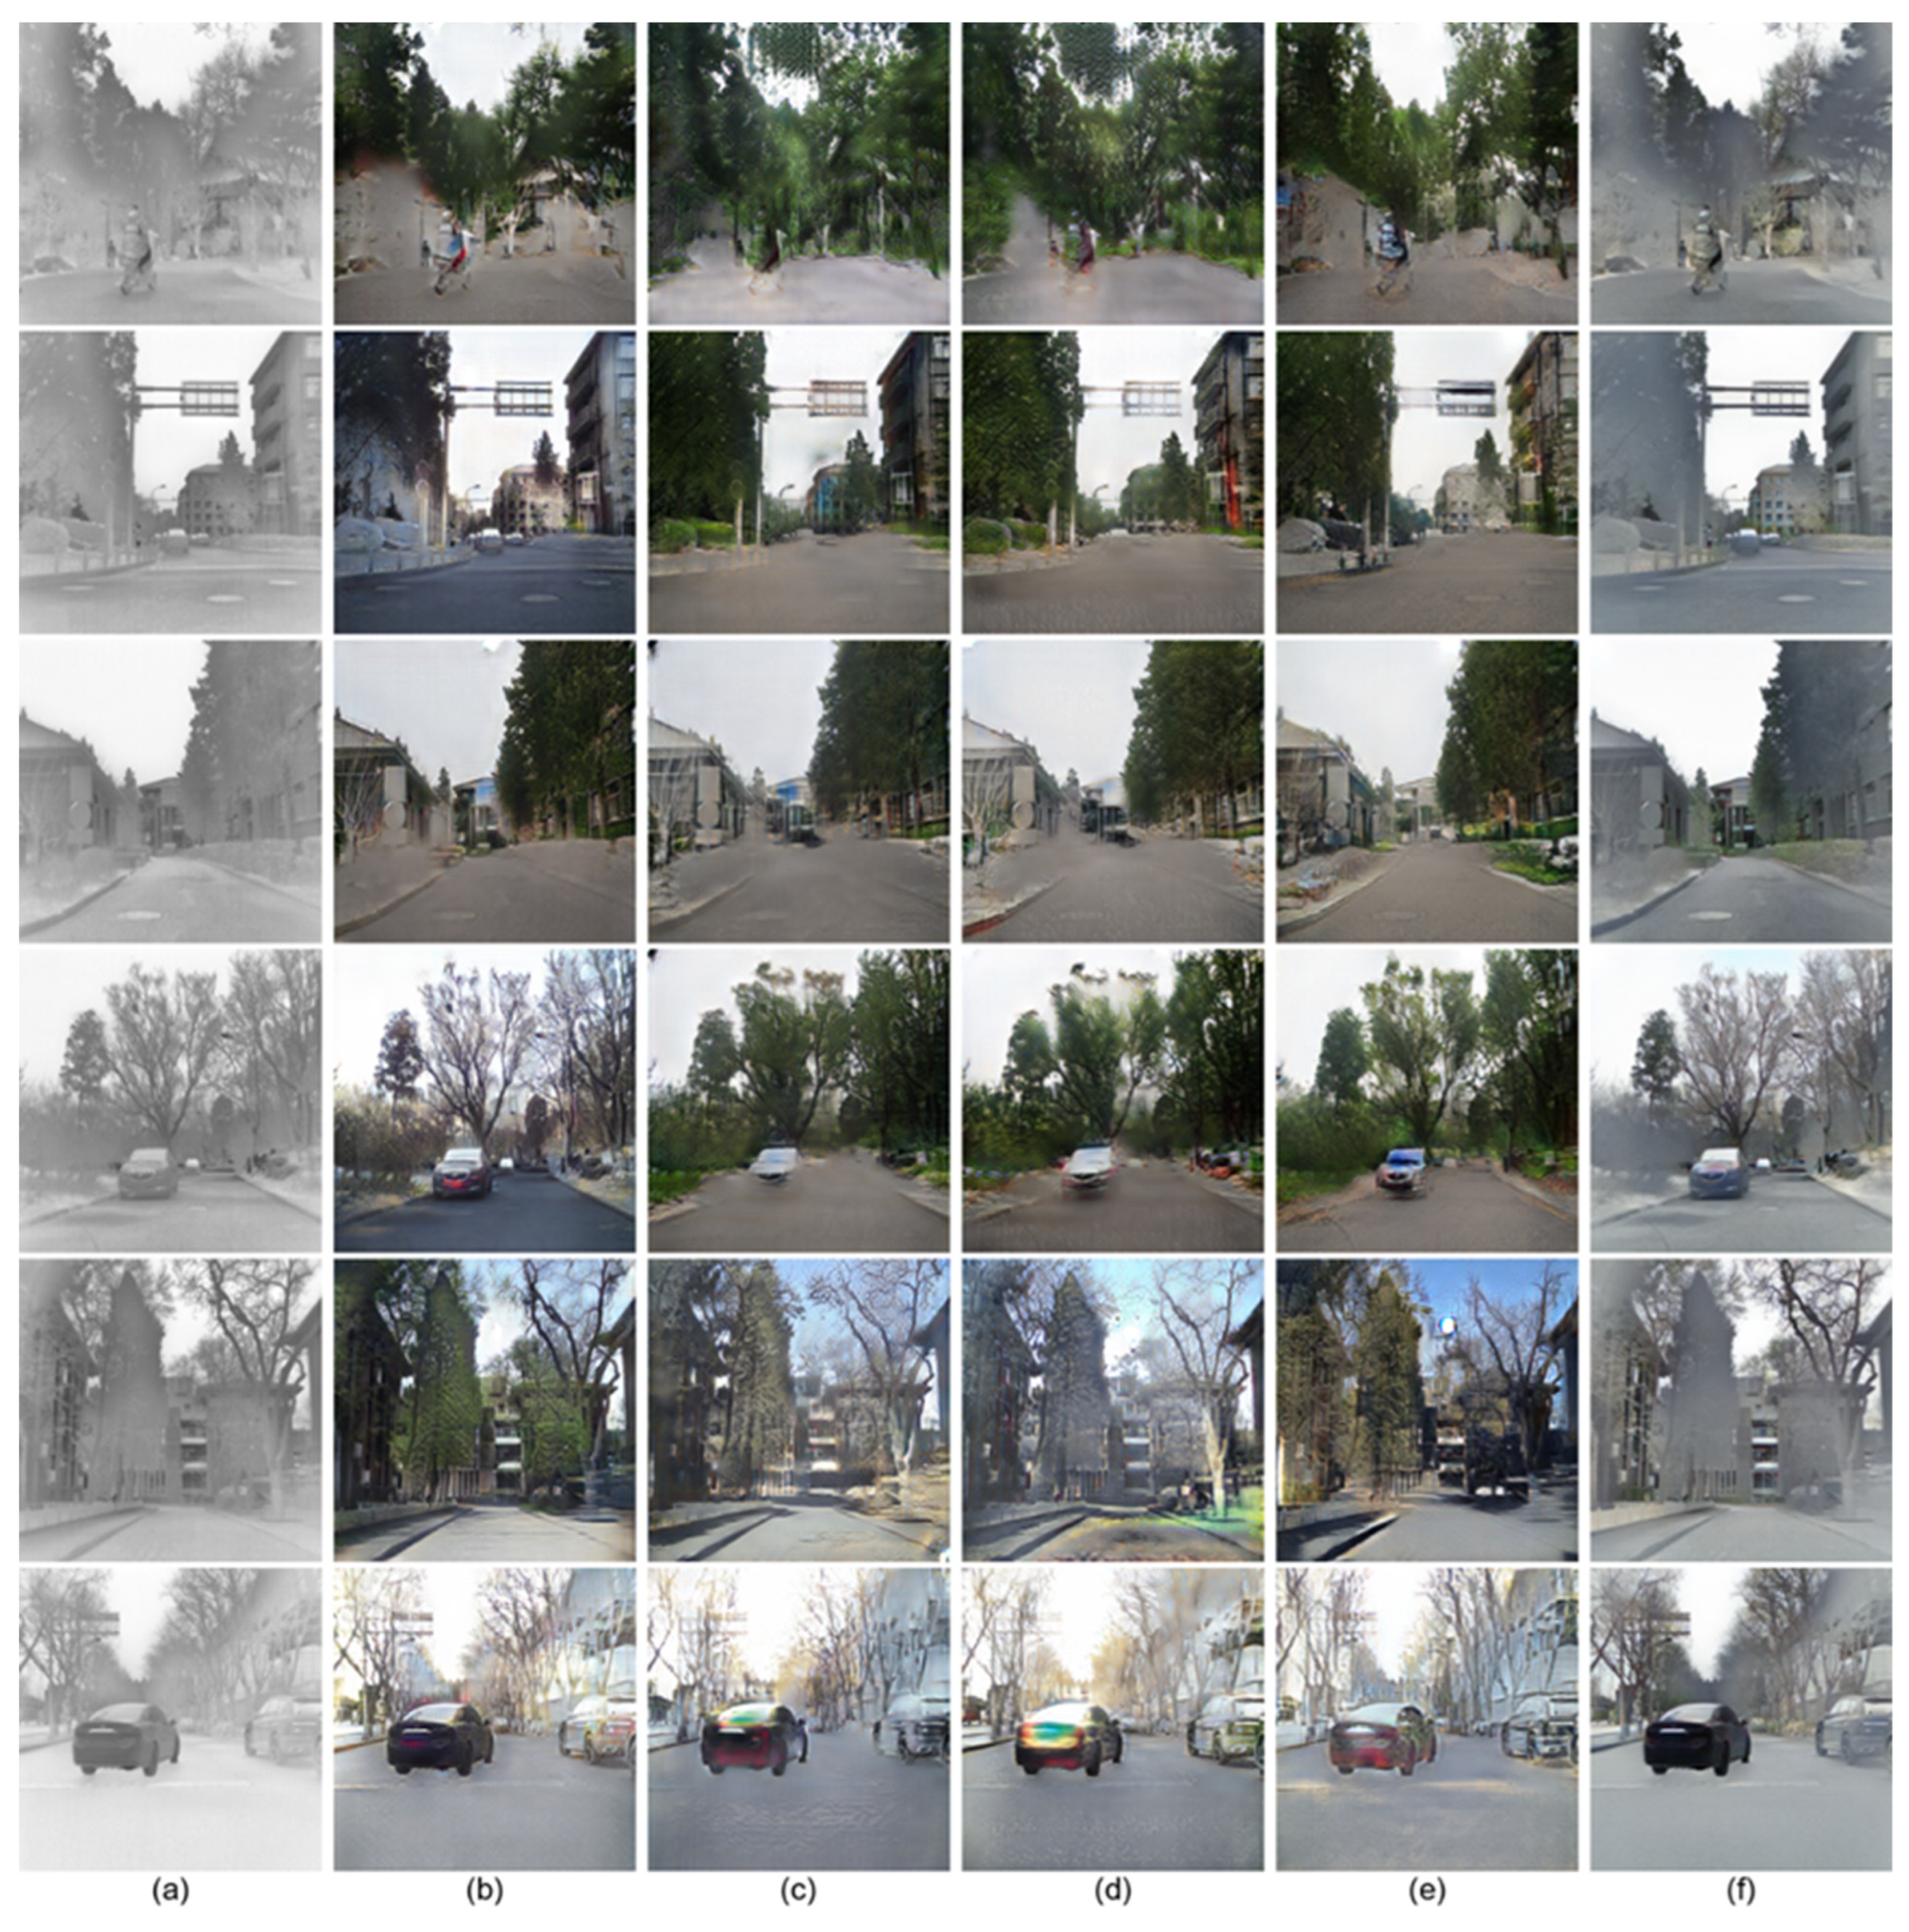
Figure 11 shows the results of the NTIR to DCV translation. The first column in Figure 11a shows the NTIR image. The other algorithms in Figure 11b–e translated the NTIR image into daytime images with good color effects. However, the inconsistency in the semantic information was greater than in the NCV to DCV translation. The main reason is that the UIT algorithms cannot solve the color ambiguity when translating temperature to brightness information due to the lack of color in the temperature domain. The NTIR image was randomly colored, resulting in distortions in the color domain and errors in semantic information. The image translated by the HDC-GAN algorithm (Figure 11f) exhibited good semantic consistency but did not provide the expected color translation. The main reason is that the NTIR image has no color information. Although the target image contains color information, the HDC emphasizes semantic consistency, and it is still difficult to incorporate color information into the learning process.
- (c)
- NF to DCV
Figure 12 shows the results of the NF to DCV translation. The first column of the images shown in Figure 12a is the fused ENCV and NTIR images, i.e., the NF image. Figure 12b–e show the translation results derived from the CycleGAN, CUT, QS-attn, and UNSB algorithms, respectively. Figure 12f is the translation result of HDC-GAN. The HDC-GAN outperformed the other algorithms in terms of color and semantics.
Since the NF image has good color and texture, the images translated by all algorithms are more realistic than those in Figure 9 and Figure 11. Although the semantic ambiguity in the images translated by other UIT methods is less pronounced than that in Figure 9 and Figure 11, these algorithms produce more semantic errors than HDC-GAN.
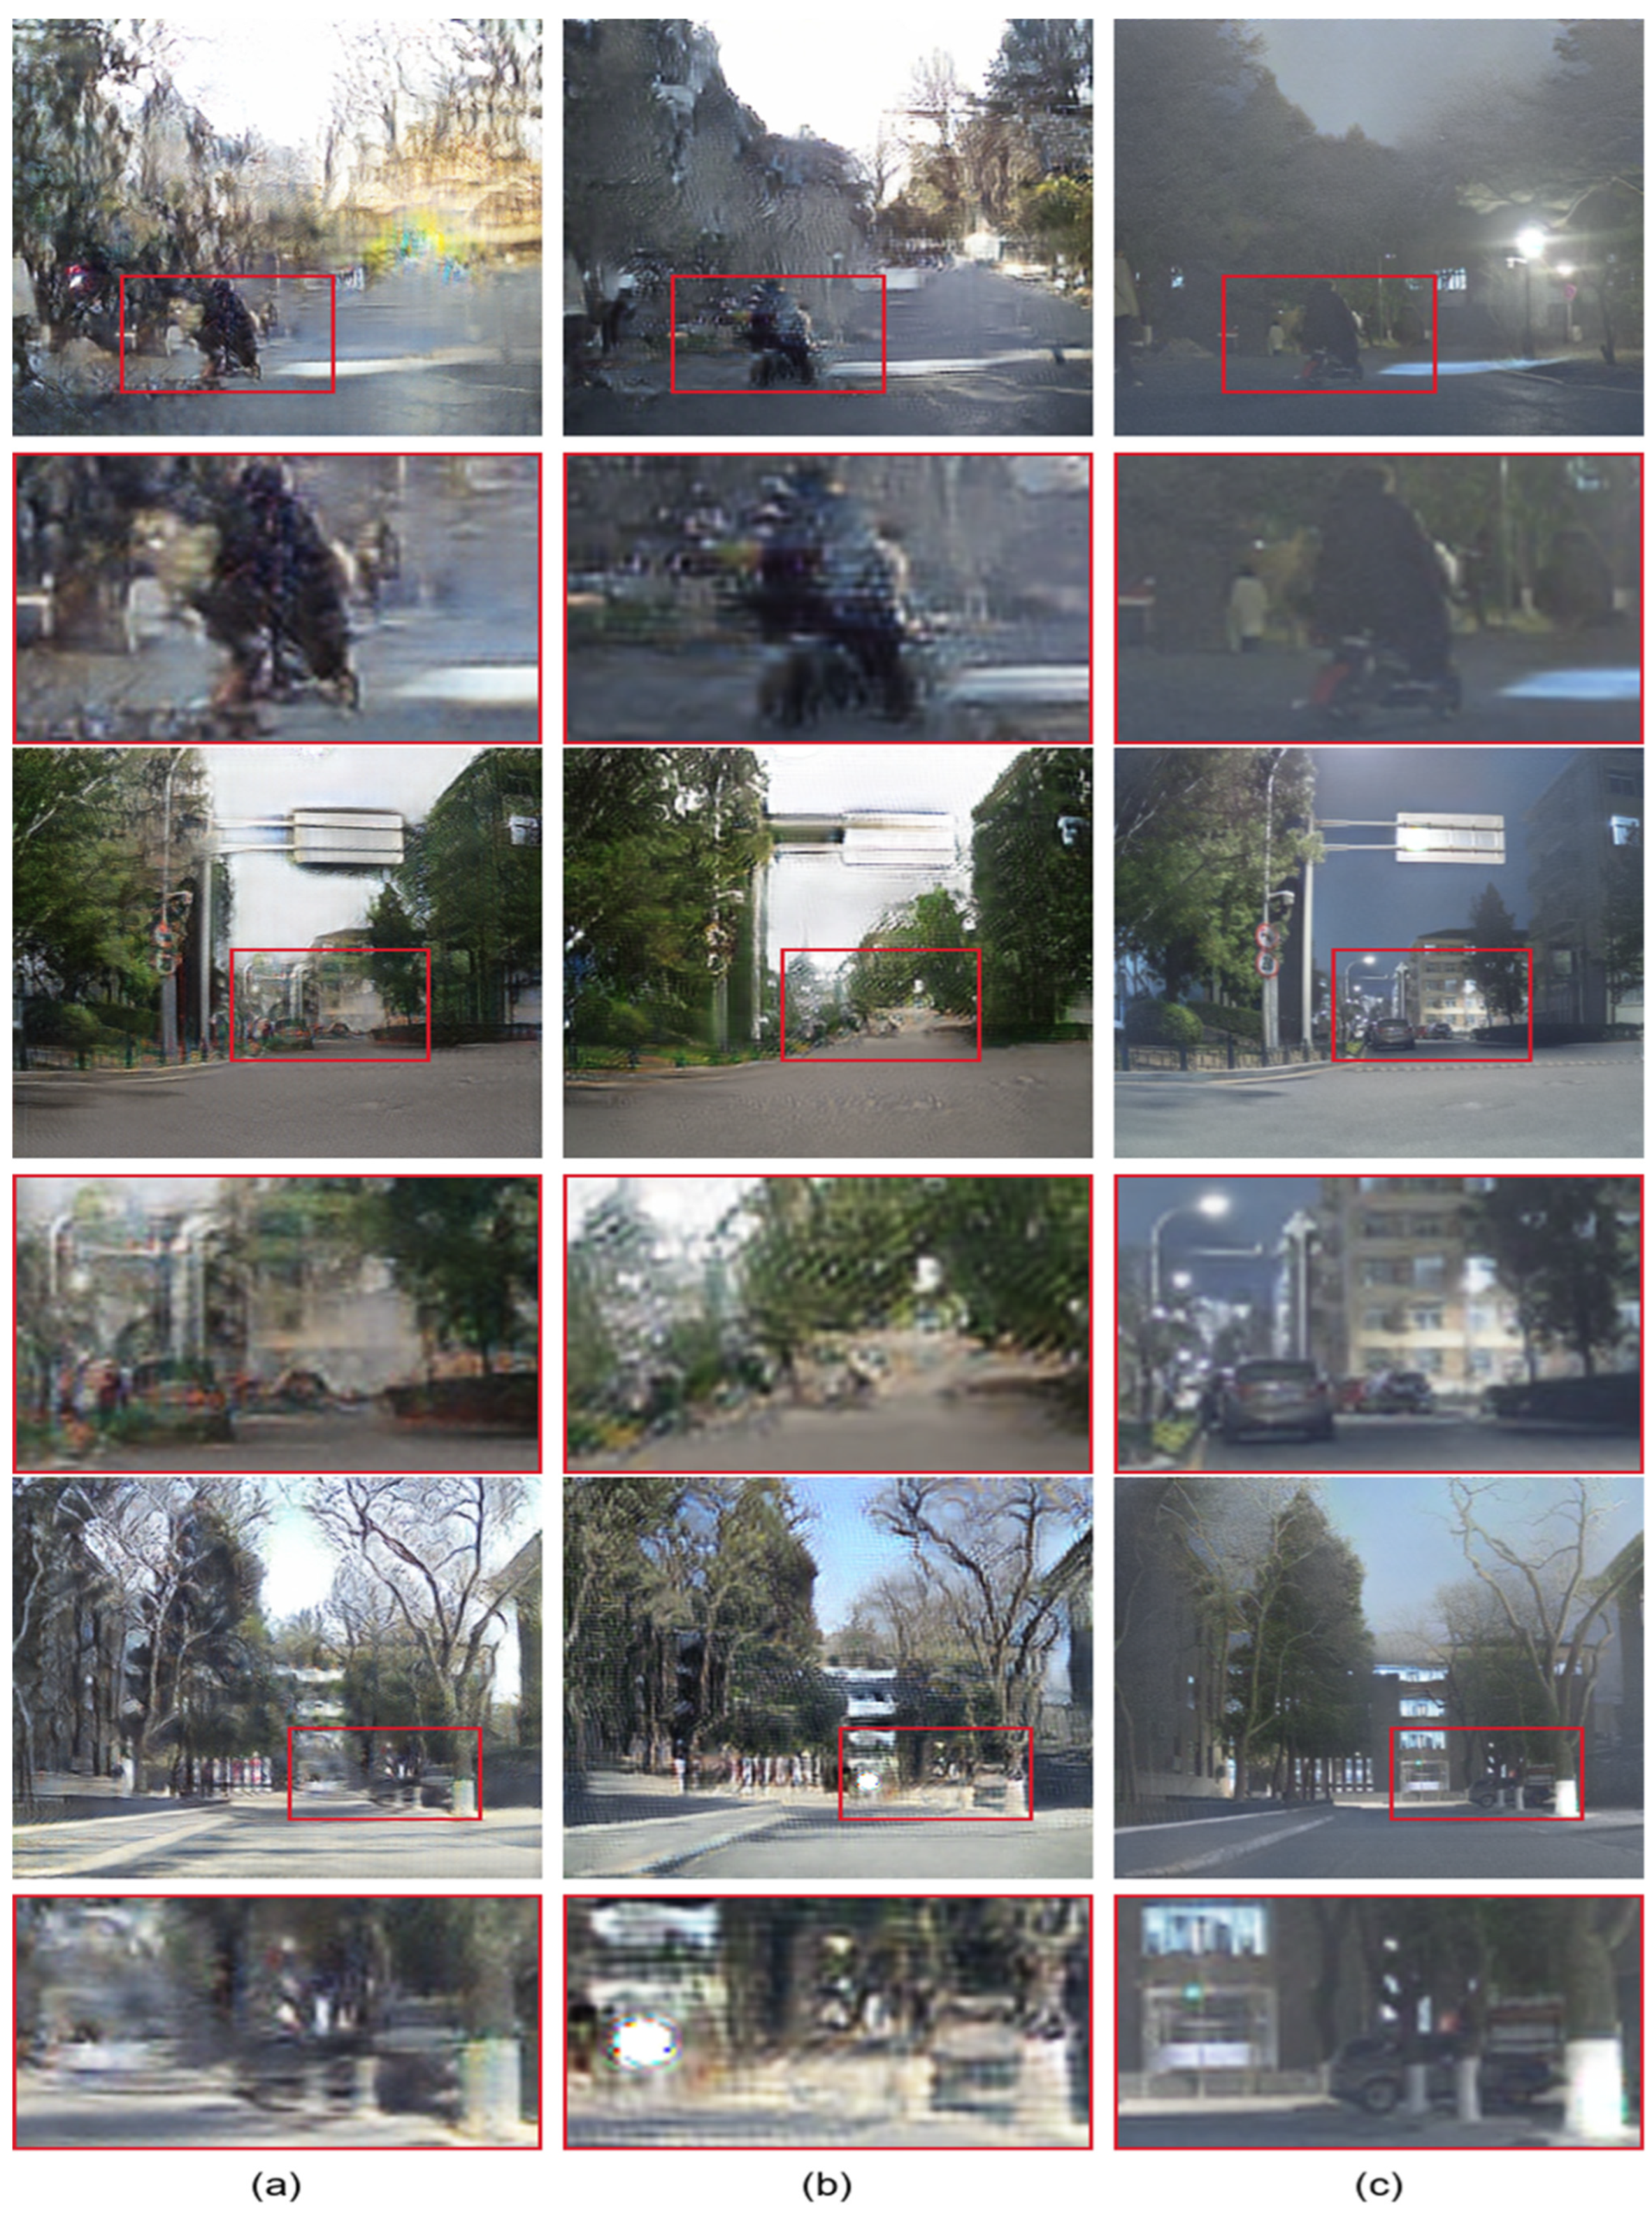
Figure 13 shows the fused images derived from CycleGAN, UNSB, and HDC-GAN in the first, third, and sixth rows of Figure 12. In the first row, the image obtained by HDC-GAN indicates that the trees in the upper left area, the vehicles on the right, and the road below show semantic consistency. However, the images obtained from the other two UIT algorithms exhibit anomalous texture areas in the trees, shadows on the road, and some distorted vehicles. These problems exist in all of the translation results of the CycleGAN and UNSB algorithms.
In the second row, the image obtained by HDC-GAN shows good detail in the background building and accurate semantics. In contrast, the texture in the images obtained by UNSB is blurred, and the image obtained by CycleGAN has noise in the sky and semantic errors in the building, which is darker than in the NF image. The third row shows that in the image obtained by HDC-GAN, the semantics of the speed bump (at the bottom of the picture) and the white line (on the left side of the vehicle on the right side of the picture) remain consistent, whereas the image obtained by UNSB exhibits significant distortions and semantic errors. In the image obtained by CycleGAN, the right side of the speed bump is translated to a road, the texture of the white line is blurred, and its color becomes yellow.
6. Discussion
6.1. Eliminating the Influence of Lights in Nighttime Images
Although integrating NCV images significantly enhanced the translation of NTIR images, the issue of glare from lights persisted during the translation to DCV images. To address this challenge, we employed illumination weights in IA-MDLatLRR and assigned greater weight to NTIR images in areas with strong illumination. This strategy mitigated the impact of glare.
However, using larger weights enhances texture information but does not compensate for the absence of color information in NTIR images. Consequently, in the NF image, the area affected by glare exhibits high brightness and appears white rather than the actual color. In future research, we will consider learning color information from images captured at varying angles, as the illumination in nighttime sequence images (such as video streams) varies depending on the viewing angle.
Additionally, our current method for calculating illumination weights is relatively straightforward. In future research, we plan to implement illumination weights in the neural network similarly to PIAFusion [24] and utilize an illumination-aware loss function for adaptive fusion of target features and texture details. This approach should enhance the fusion results of images affected by glare.
6.2. Integrating NCV to NTIR Translation
The translation results from NCV to DCV shown in Figure 9 seem to be satisfactory without NTIR images. However, NCV images suffer from a lack of texture information, especially in dimly lit areas, making some scenes or targets difficult to identify. In such scenarios, NTIR images provide more texture details that facilitate target recognition. Therefore, by fusing NCV and NTIR images, we can achieve more robust scene and target information, paving the way for further research on target recognition or scene segmentation.
6.3. HDC-GAN Algorithm Used to Process Remote Sensing Images
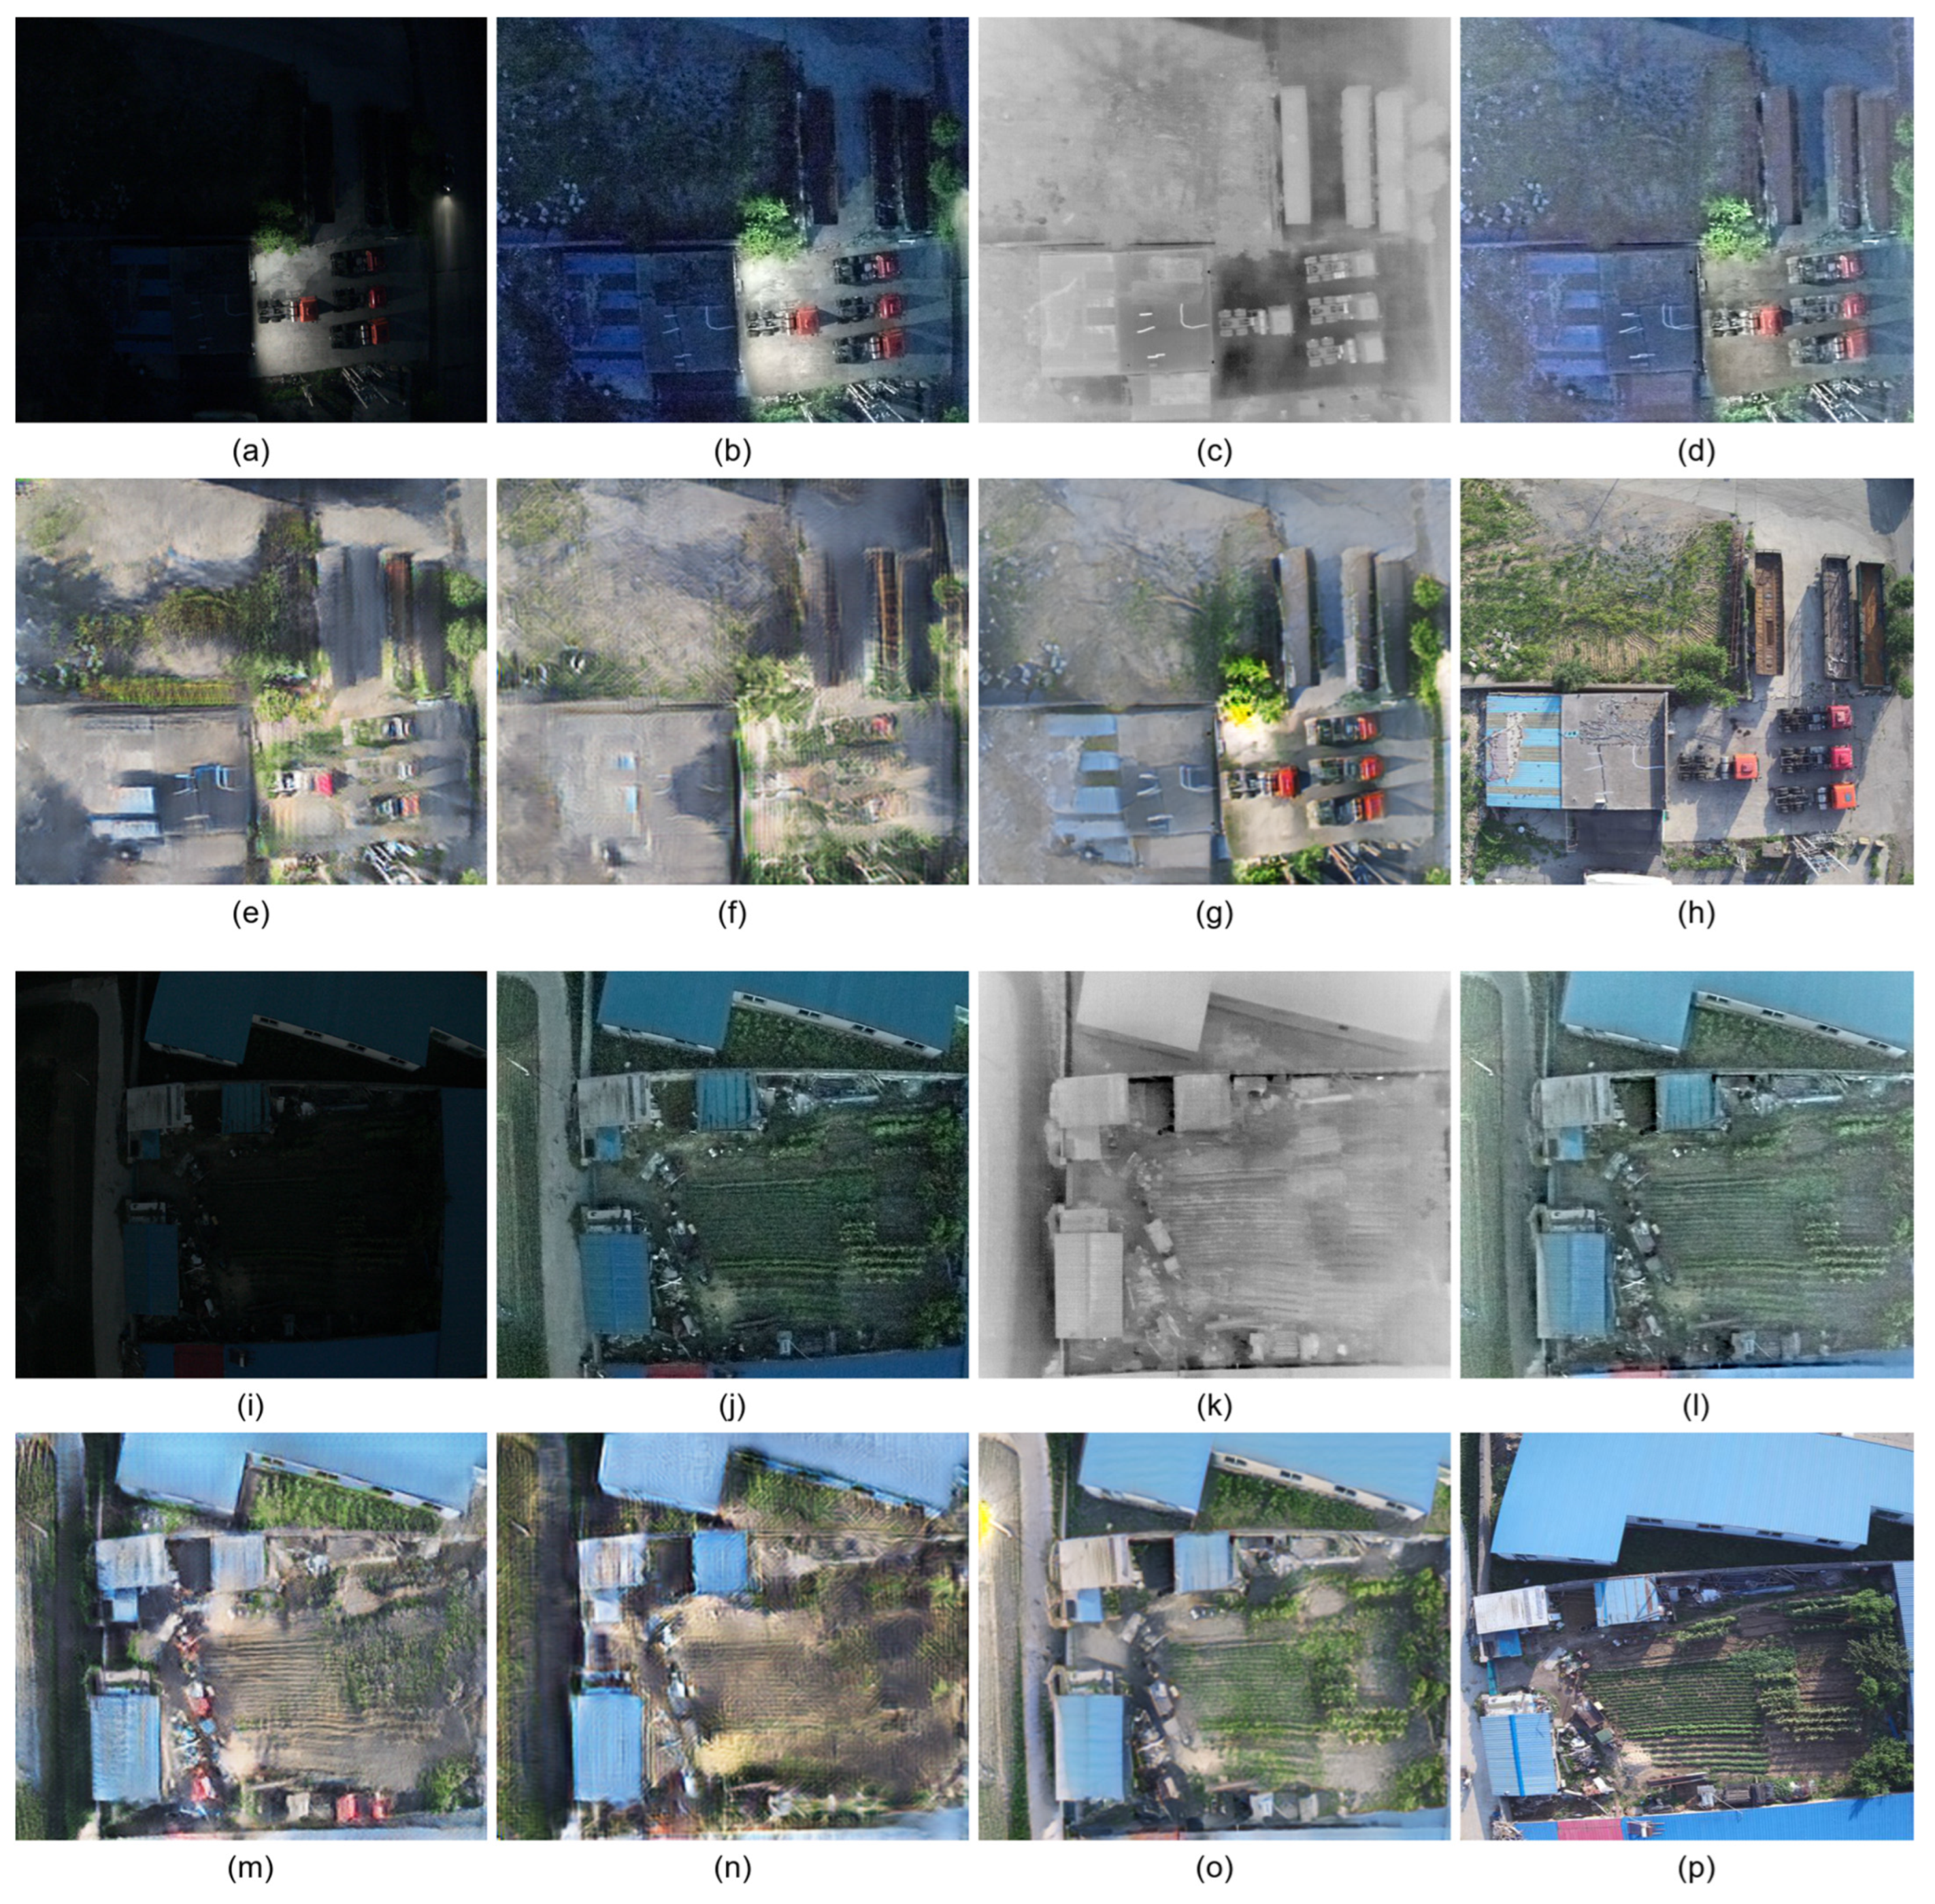
In order to verify the applicability of this method in the field of UAV remote sensing, we used a dataset collected by a DJI M300 drone and a DJI ZENMUSE XT2 camera from 4 pm to 5 pm and from 4 am to 5 am. This dataset contains 300 pairs of NTIR-NCV images and 300 DCV images of the same area. Using HDC-GAN, a translation experiment was performed on this UAV dataset, and Figure 14 shows the results of the translation of two images. Figure 14a,i and Figure 14c,k are the NCV and NTIR images taken by the DJI ZENMUSE XT2 camera, respectively, and Figure 14b,j is the ENCV image obtained by low-light image enhancement of Figure 14a,i. Since there are no nighttime light effects that need to be eliminated in the NCV images collected from the drone’s orthographic perspective, we use the basic MDLatLRR method to fuse ENCV and NTIR to obtain the NF image Figure 14d,l. To compare the performance of different translation algorithms, we used CycleGAN, UNSB, and HDC-GAN to translate NF images into DCV images, of which the results are shown in Figure 14e–g and Figure 14m–o, respectively. To compare the translation results, we also provide a real DCV image of the same scene taken in the afternoon (not registered with NTIR) as shown in Figure 14h,p.
As can be seen from the translation results in Figure 14, compared with CycleGAN and UNSB, the images translated by HDC-GAN maintain better semantic consistency. For example, in the first set of pictures, the four trucks on the lower right have relatively complete shapes, and the truck heads are still red. In the image translated by CycleGAN, the color of some truck heads changes to white, and all truck bodies are no longer complete, and are even confused with vegetation. The UNSB-translated image has a high degree of semantic confusion between trucks and vegetation, which are difficult to distinguish. In the second set of images, the shape and color of the vegetation in the central part of HDC-GAN-translated images are almost same as the real DCV image, while in the images translated by CycleGAN and UNSB, this part is largely translated to bare ground. In addition, the translation results of HDC-GAN maintain good semantic consistency for the blue buildings in the image, while there is a large amount of noise and blur in these buildings among the images translated by CycleGAN and UNSB.
It can be seen from this experiment that the HDC-GAN algorithm can be applied to process remote sensing orthophotos obtained in low-light environments to a certain extent, and can better improve the expression of the real environment. However, due to the extremely high requirements for the consistency of image semantics in the field of remote sensing, HDC-GAN is still difficult to achieve satisfactory results in image analysis (such as ground object classification, vegetation index calculation, etc.) when used for professional remote sensing image processing. There are two problems: firstly, the ground surface information obtained in low-light environments is insufficient, and secondly, NCV information will be further lost during the fusion process with NTIR. Therefore, the current fusion-based translation algorithm still needs further improvement for processing orthophotos of remote sensing.
6.4. Problems with HDC-GAN
Compared with other UIT algorithms, HDC-GAN has effectively minimized the introduction of ambiguous semantic information. Nevertheless, the NTIR-DCV experiment revealed the challenges associated with incorporating color information into gray-scale source images while preserving consistent semantic information. Since these two goals are contradictory, the current limitations of HDC-GAN restrict its application to the translation of NF images. In other words, color information is essential for accurately translating NTIR images.
HDC-GAN can achieve good visual effects in the translation of street scenes or images captured by UAV oblique photography. However, upon careful comparison, you will find that it is difficult to maintain strict semantic consistency in the translation of vegetation. This is prominent in the experiment in Figure 14. In fact, this problem is common to all UIT algorithms. The main reason is that green vegetation (such as leaves and grass, etc.) has strong randomness in images. This randomness is aggravated with the randomness of sample data selection during the neural network learning process, making it difficult for neural network models to handle the semantic consistency of vegetation during the translation process.
7. Conclusions
The translation of NTIR2DCV is an ill-posed problem with multiple solutions when images are translated from the temperature to the color domain. We argue that color information must be incorporated to compensate for the lack of color information in the process of TIR translation. Since visible images are easy to obtain in city environment at night, incorporating color information into NTIR images translation is feasible.
Therefore, we proposed an NCV and NTIR image fusion algorithm called IA-MDLatLRR, which weighs the illumination to improve the fusion strategy of the MDLatLRR method. The evaluation metrics SD, EN, VIF, etc. showed that our IA-MDLatLRR provided better contrast, more information content, and a better visual effect than the other methods. On the basis of ideal fusion result, we proposed the HDC-GAN model to maintain semantic consistency to improve the TIR translation result, which can avoid semantic errors that usually occur in CycleGAN, UNSB, UIT algorithms, etc. The experiment results show better quality than the UIT algorithms.
Our method is expected to be used to fuse images or videos captured by a camera like XT2 with TIR and CV lenses, and translate fusion results into visible images or videos in the daytime, which has a good application prospect in scene analysis, target detection, and other fields.
Author Contributions
Conceptualization, S.Y., M.S. and X.L.; Methodology, S.Y. and M.S.; Validation, D.L.; Resources, D.L.; Data curation, H.Y.; Writing—review & editing, S.Y., M.S., X.L., H.Y. and D.L.; Visualization, H.Y.; Supervision, M.S.; Funding acquisition, M.S. All authors have read and agreed to the published version of the manuscript.
Funding
This research was funded by the National Natural Science Foundation of China, grant number 42171327, and supported by the High-Performance Computing Platform of Peking University.
Data Availability Statement
The data presented in this study are available on request from the corresponding author. The data are not publicly available due to privacy.
Conflicts of Interest
The authors declare no conflict of interest.
References
- Cao, Y.; Guan, D.; Huang, W.; Yang, J.; Cao, Y.; Qiao, Y. Pedestrian Detection with Unsupervised Multispectral Feature Learning Using Deep Neural Networks. Inf. Fusion 2019, 46, 206–217. [Google Scholar] [CrossRef]
- Li, C.; Zhu, C.; Huang, Y.; Tang, J.; Wang, L. Cross-Modal Ranking with Soft Consistency and Noisy Labels for Robust RGB-T Tracking. In Computer Vision—ECCV 2018; Ferrari, V., Hebert, M., Sminchisescu, C., Weiss, Y., Eds.; Lecture Notes in Computer Science; Springer International Publishing: Cham, Switzerland, 2018; Volume 11217, pp. 831–847. ISBN 978-3-030-01260-1. [Google Scholar]
- Lu, Y.; Wu, Y.; Liu, B.; Zhang, T.; Li, B.; Chu, Q.; Yu, N. Cross-Modality Person Re-Identification with Shared-Specific Feature Transfer. In Proceedings of the 2020 IEEE/CVF Conference on Computer Vision and Pattern Recognition (CVPR), Seattle, WA, USA, 13–19 June 2020; pp. 13376–13386. [Google Scholar]
- Ha, Q.; Watanabe, K.; Karasawa, T.; Ushiku, Y.; Harada, T. MFNet: Towards Real-Time Semantic Segmentation for Autonomous Vehicles with Multi-Spectral Scenes. In Proceedings of the 2017 IEEE/RSJ International Conference on Intelligent Robots and Systems (IROS), Vancouver, BC, Canada, 24–28 September 2017; pp. 5108–5115. [Google Scholar]
- Goodfellow, I.J.; Pouget-Abadie, J.; Mirza, M.; Xu, B.; Warde-Farley, D.; Ozair, S.; Courville, A.; Bengio, Y. Generative Adversarial Networks. Commun. ACM 2014, 63, 139–144. [Google Scholar] [CrossRef]
- Luo, F.; Cao, Y.; Li, Y. Nighttime Thermal Infrared Image Colorization with Dynamic Label Mining. In Image and Graphics; Peng, Y., Hu, S.-M., Gabbouj, M., Zhou, K., Elad, M., Xu, K., Eds.; Lecture Notes in Computer Science; Springer International Publishing: Cham, Switzerland, 2021; Volume 12890, pp. 388–399. ISBN 978-3-030-87360-8. [Google Scholar]
- Yang, S.; Sun, M.; Lou, X.; Yang, H.; Zhou, H. An Unpaired Thermal Infrared Image Translation Method Using GMA-CycleGAN. Remote Sens. 2023, 15, 663. [Google Scholar] [CrossRef]
- Luo, F.; Li, Y.; Zeng, G.; Peng, P.; Wang, G.; Li, Y. Thermal Infrared Image Colorization for Nighttime Driving Scenes with Top-Down Guided Attention. IEEE Trans. Intell. Transport. Syst. 2022, 23, 15808–15823. [Google Scholar] [CrossRef]
- Pizer, S.M.; Johnston, R.E.; Ericksen, J.P.; Yankaskas, B.C.; Muller, K.E. Contrast-Limited Adaptive Histogram Equalization: Speed and Effectiveness. In Proceedings of the First Conference on Visualization in Biomedical Computing, Atlanta, GA, USA, 22–25 May 1990; pp. 337–345. [Google Scholar]
- Abdullah-Al-Wadud, M.; Kabir, M.; Akber Dewan, M.; Chae, O. A Dynamic Histogram Equalization for Image Contrast Enhancement. IEEE Trans. Consum. Electron. 2007, 53, 593–600. [Google Scholar] [CrossRef]
- Ma, L.; Ma, T.; Liu, R.; Fan, X.; Luo, Z. Toward Fast, Flexible, and Robust Low-Light Image Enhancement. In Proceedings of the 2022 IEEE/CVF Conference on Computer Vision and Pattern Recognition (CVPR), New Orleans, LA, USA, 19–24 June 2022; pp. 5627–5636. [Google Scholar]
- Jiang, Y.; Gong, X.; Liu, D.; Cheng, Y.; Fang, C.; Shen, X.; Yang, J.; Zhou, P.; Wang, Z. EnlightenGAN: Deep Light Enhancement Without Paired Supervision. IEEE Trans. Image Process. 2021, 30, 2340–2349. [Google Scholar] [CrossRef] [PubMed]
- Li, M.; Liu, J.; Yang, W.; Sun, X.; Guo, Z. Structure-Revealing Low-Light Image Enhancement Via Robust Retinex Model. IEEE Trans. Image Process. 2018, 27, 2828–2841. [Google Scholar] [CrossRef] [PubMed]
- Guo, X.; Li, Y.; Ling, H. LIME: Low-Light Image Enhancement via Illumination Map Estimation. IEEE Trans. Image Process. 2017, 26, 982–993. [Google Scholar] [CrossRef] [PubMed]
- Luo, Y.; Luo, Z. Infrared and Visible Image Fusion: Methods, Datasets, Applications, and Prospects. Appl. Sci. 2023, 13, 10891. [Google Scholar] [CrossRef]
- Burt, P.; Adelson, E. The Laplacian Pyramid as a Compact Image Code. IEEE Trans. Commun. 1983, 31, 532–540. [Google Scholar] [CrossRef]
- Niu, Y.; Xu, S.; Wu, L.; Hu, W. Airborne Infrared and Visible Image Fusion for Target Perception Based on Target Region Segmentation and Discrete Wavelet Transform. Math. Probl. Eng. 2012, 2012, 275138. [Google Scholar] [CrossRef]
- Liu, J.; Zhang, Y.; Li, F. Infrared and Visible Image Fusion with Edge Detail Implantation. Front. Phys. 2023, 11, 1180100. [Google Scholar] [CrossRef]
- Sun, X.; Hu, S.; Ma, X.; Hu, Q.; Xu, S. IMGAN: Infrared and Visible Image Fusion Using a Novel Intensity Masking Generative Adversarial Network. Infrared Phys. Technol. 2022, 125, 104221. [Google Scholar] [CrossRef]
- Liu, Y.; Chen, X.; Ward, R.K.; Jane Wang, Z. Image Fusion with Convolutional Sparse Representation. IEEE Signal Process. Lett. 2016, 23, 1882–1886. [Google Scholar] [CrossRef]
- Li, H.; Wu, X.-J. Infrared and Visible Image Fusion Using Latent Low-Rank Representation. arXiv 2022. [Google Scholar] [CrossRef]
- Li, H.; Wu, X.-J.; Kittler, J. MDLatLRR: A Novel Decomposition Method for Infrared and Visible Image Fusion. IEEE Trans. Image Process. 2020, 29, 4733–4746. [Google Scholar] [CrossRef]
- Tang, L.; Xiang, X.; Zhang, H.; Gong, M.; Ma, J. DIVFusion: Darkness-Free Infrared and Visible Image Fusion. Inf. Fusion 2023, 91, 477–493. [Google Scholar] [CrossRef]
- Tang, L.; Yuan, J.; Zhang, H.; Jiang, X.; Ma, J. PIAFusion: A Progressive Infrared and Visible Image Fusion Network Based on Illumination Aware. Inf. Fusion 2022, 83–84, 79–92. [Google Scholar] [CrossRef]
- Isola, P.; Zhu, J.-Y.; Zhou, T.; Efros, A.A. Image-to-Image Translation with Conditional Adversarial Networks. In Proceedings of the 2017 IEEE Conference on Computer Vision and Pattern Recognition (CVPR), Honolulu, HI, USA, 21–26 July 2017; pp. 5967–5976. [Google Scholar]
- Wang, T.-C.; Liu, M.-Y.; Zhu, J.-Y.; Tao, A.; Kautz, J.; Catanzaro, B. High-Resolution Image Synthesis and Semantic Manipulation with Conditional GANs. In Proceedings of the 2018 IEEE/CVF Conference on Computer Vision and Pattern Recognition, Salt Lake City, UT, USA, 18–22 June 2018; pp. 8798–8807. [Google Scholar]
- Zhu, J.-Y.; Park, T.; Isola, P.; Efros, A.A. Unpaired Image-to-Image Translation Using Cycle-Consistent Adversarial Networks. In Proceedings of the 2017 IEEE International Conference on Computer Vision (ICCV), Venice, Italy, 22–29 October 2017; pp. 2242–2251. [Google Scholar]
- Hu, X.; Zhou, X.; Huang, Q.; Shi, Z.; Sun, L.; Li, Q. QS-Attn: Query-Selected Attention for Contrastive Learning in I2I Translation. In Proceedings of the 2022 IEEE/CVF Conference on Computer Vision and Pattern Recognition (CVPR), New Orleans, LA, USA, 18–24 June 2022; pp. 18270–18279. [Google Scholar]
- Li, S.; Han, B.; Yu, Z.; Liu, C.H.; Chen, K.; Wang, S. I2V-GAN: Unpaired Infrared-to-Visible Video Translation. In Proceedings of the 29th ACM International Conference on Multimedia, Virtual, China, 17 October 2021; pp. 3061–3069. [Google Scholar]
- Kleyko, D.; Rachkovskij, D.; Osipov, E.; Rahimi, A. A Survey on Hyperdimensional Computing Aka Vector Symbolic Architectures, Part II: Applications, Cognitive Models, and Challenges. ACM Comput. Surv. 2023, 55, 1–52. [Google Scholar] [CrossRef]
- Land, E.H. The Retinex Theory of Color Vision. Sci Am. 1977, 237, 108–128. [Google Scholar] [CrossRef]
- Xu, L.; Yan, Q.; Xia, Y.; Jia, J. Structure Extraction from Texture via Relative Total Variation. ACM Trans. Graph. 2012, 31, 1–10. [Google Scholar] [CrossRef]
- Neubert, P. An Introduction to Hyperdimensional Computing for Robotics. Künstliche Intell. 2019, 33, 319–330. [Google Scholar] [CrossRef]
- Kleyko, D.; Rachkovskij, D.A.; Osipov, E.; Rahimi, A. A Survey on Hyperdimensional Computing Aka Vector Symbolic Architectures, Part I: Models and Data Transformations. ACM Comput. Surv. 2023, 55, 1–40. [Google Scholar] [CrossRef]
- Simonyan, K.; Zisserman, A. Very Deep Convolutional Networks for Large-Scale Image Recognition. arXiv 2015. [Google Scholar] [CrossRef]
- Kim, B.; Kwon, G.; Kim, K.; Ye, J.C. Unpaired Image-to-Image Translation via Neural Schrödinger Bridge. arXiv 2023. [Google Scholar] [CrossRef]
- Kingma, D.P.; Ba, J. Adam: A Method for Stochastic Optimization. arXiv 2015. [Google Scholar] [CrossRef]
- Li, H.; Wu, X.-J. DenseFuse: A Fusion Approach to Infrared and Visible Images. IEEE Trans. Image Process. 2019, 28, 2614–2623. [Google Scholar] [CrossRef] [PubMed]
- Ma, J.; Tang, L.; Fan, F.; Huang, J.; Mei, X.; Ma, Y. SwinFusion: Cross-Domain Long-Range Learning for General Image Fusion via Swin Transformer. IEEE/CAA J. Autom. Sin. 2022, 9, 1200–1217. [Google Scholar] [CrossRef]
- Park, T.; Efros, A.A.; Zhang, R.; Zhu, J.-Y. Contrastive Learning for Unpaired Image-to-Image Translation. In Computer Vision—ECCV 2020; Vedaldi, A., Bischof, H., Brox, T., Frahm, J.-M., Eds.; Lecture Notes in Computer Science; Springer International Publishing: Cham, Switzerland, 2020; Volume 12354, pp. 319–345. ISBN 978-3-030-58544-0. [Google Scholar]
- Van Aardt, J. Assessment of Image Fusion Procedures Using Entropy, Image Quality, and Multispectral Classification. J. Appl. Remote Sens 2008, 2, 023522. [Google Scholar] [CrossRef]
- Qu, G.; Zhang, D.; Yan, P. Information Measure for Performance of Image Fusion. Electron. Lett. 2002, 38, 313. [Google Scholar] [CrossRef]
- Jagalingam, P.; Hegde, A.V. A Review of Quality Metrics for Fused Image. Aquat. Procedia 2015, 4, 133–142. [Google Scholar] [CrossRef]
- Xydeas, C.S.; Petrović, V. Objective Image Fusion Performance Measure. Electron. Lett. 2000, 36, 308. [Google Scholar] [CrossRef]
- Cui, G.; Feng, H.; Xu, Z.; Li, Q.; Chen, Y. Detail Preserved Fusion of Visible and Infrared Images Using Regional Saliency Extraction and Multi-Scale Image Decomposition. Opt. Commun. 2015, 341, 199–209. [Google Scholar] [CrossRef]
- Rao, Y.-J. In-Fibre Bragg Grating Sensors. Meas. Sci. Technol. 1997, 8, 355–375. [Google Scholar] [CrossRef]
- Adu, J.; Gan, J.; Wang, Y.; Huang, J. Image Fusion Based on Nonsubsampled Contourlet Transform for Infrared and Visible Light Image. Infrared Phys. Technol. 2013, 61, 94–100. [Google Scholar] [CrossRef]
- Aslantas, V.; Bendes, E. A New Image Quality Metric for Image Fusion: The Sum of the Correlations of Differences. AEU Int. J. Electron. Commun. 2015, 69, 1890–1896. [Google Scholar] [CrossRef]
- Han, Y.; Cai, Y.; Cao, Y.; Xu, X. A New Image Fusion Performance Metric Based on Visual Information Fidelity. Inf. Fusion 2013, 14, 127–135. [Google Scholar] [CrossRef]
- Bynagari, N.B. GANs Trained by a Two Time-Scale Update Rule Converge to a Local Nash Equilibrium. Asian J. Appl. Sci. Eng. 2019, 8, 25–34. [Google Scholar] [CrossRef]
- Chen, R.; Huang, W.; Huang, B.; Sun, F.; Fang, B. Reusing Discriminators for Encoding: Towards Unsupervised Image-to-Image Translation. In Proceedings of the 2020 IEEE/CVF Conference on Computer Vision and Pattern Recognition (CVPR), Seattle, WA, USA, 13–19 June 2020; pp. 8165–8174. [Google Scholar]
Figure 1.
Schematic diagram of the overall process of our NTIR2DCV method, mainly including three steps: (1) The illumination map of the NCV image is created based on the Retinex theory and is used to enhance the NCV and obtain the ENCV image. (2) The illumination map is used in IA-MDLatLRR to fuse the ENCV and NTIR images. (3) The HDC-GAN algorithm is used to translate the NF image to the DCV image.

Figure 2.
Illumination map calculation and image enhancement. (a) Nighttime Color Visible (NCV) image; (b) Enhanced NCV (ENCV) image; (c) illumination map; (d) initial illumination map.
Figure 2.
Illumination map calculation and image enhancement. (a) Nighttime Color Visible (NCV) image; (b) Enhanced NCV (ENCV) image; (c) illumination map; (d) initial illumination map.

Figure 3.
Framework diagram of the NTIR and NCV image fusion method based on IA-MDLatLRR. Illumination map of ENCV is used as weight in fusion of TIR and ENCV.
Figure 3.
Framework diagram of the NTIR and NCV image fusion method based on IA-MDLatLRR. Illumination map of ENCV is used as weight in fusion of TIR and ENCV.

Figure 4.
Illumination weight and basic part fusion. (a) Enhanced Nighttime Color Visible (ENCV) image; (b) Thermal InfraRed (TIR) image; (c) illumination map of ENCV; (d) illumination weight.
Figure 4.
Illumination weight and basic part fusion. (a) Enhanced Nighttime Color Visible (ENCV) image; (b) Thermal InfraRed (TIR) image; (c) illumination map of ENCV; (d) illumination weight.

Figure 5.
Fusion strategy of salient part (take the unit window as an example). Salient parts are obtained by decomposing the Y channel of the ENCV and TIR images by MDLatLRR.
Figure 5.
Fusion strategy of salient part (take the unit window as an example). Salient parts are obtained by decomposing the Y channel of the ENCV and TIR images by MDLatLRR.

Figure 6.
Framework diagram of the HDC-GAN translation method. is the generator, is the discriminator, and is the mapping network. The pre-trained VGG19 network and the LSH method are used to project images to the hypervectors. is trained to distinguish whether the hypervectors belong to the target domain Y and to calculate the GAN loss. is trained to translate hypervectors to another domain and to calculate the HDC loss.

Figure 7.
Image fusion results comparison. (a) Nighttime Thermal InfraRed (NTIR) image; (b) Y channel of Enhanced Nighttime Color Visible (ENCV) image; (c) MDLatLRR [22]; (d) DenseFuse [38]; (e) SwinFusion [39]; (f) IA-MDLatLRR (our method).

Figure 8.
Local amplification of the fourth row of Figure 7. (a) MDLatLRR [22]; (b) DenseFuse [38]; (c) SwinFusion [39]; (d) IA-MDLatLRR (our method). Red boxes are amplification of the area of street light bulbs.

Figure 9.
NCV to DCV translation results comparison. (a) Nighttime Color Visible (NCV) image; (b) CycleGAN [27]; (c) CUT [49]; (d) QS-attn [28]; (e) UNSB [47]; (f) HDC-GAN (our method).

Figure 10.
Local amplification of the first, second, and fifth rows of Figure 9. (a) CycleGAN [27]; (b) UNSB [47]; (c) HDC-GAN(our method). Red boxes are amplification of salient objects (such as people and cars).

Figure 11.
NTIR to DCV translation results comparison. (a) Nighttime Thermal InfraRed (NTIR) image; (b) CycleGAN [27]; (c) CUT [49]; (d) QS-attn [28]; (e) UNSB [47]; (f) HDC-GAN (our method).

Figure 12.
NF to DCV translation results comparison. (a) Nighttime Fusion (NF) image; (b) CycleGAN [27]; (c) CUT [49]; (d) QS-attn [28]; (e) UNSB [47]; (f) HDC-GAN (our method).

Figure 13.
Local amplification of the third, fourth, and sixth rows of Figure 12. (a) CycleGAN [27]; (b) UNSB [47]; (c) HDC-GAN (our method). Red boxes are amplification of salient objects (such as people and cars).

Figure 14.
Fusion and translation results of two UAV orthophotos. (a,i) Nighttime Color Visible (NCV) image; (b,j) Enhanced NCV (ENCV) image; (c,k) Nighttime Thermal InfraRed (NTIR) image; (d,l) Nighttime Fusion (NF) image; (e,m) CycleGAN [27]; (f,n) UNSB [47]; (g,o) HDC-GAN (our method); (h,p) real DCV image.


Table 1.
Objective evaluation results of image fusion comparison experiment. Blue numbers represent the highest-ranking method, and green numbers represent the second-ranked method.
Table 1.
Objective evaluation results of image fusion comparison experiment. Blue numbers represent the highest-ranking method, and green numbers represent the second-ranked method.
| Method | EN | MI | PSNR | AG | SD | CC | SCD | VIF | |
|---|---|---|---|---|---|---|---|---|---|
| DenseFuse [38] | 6.5496 | 2.1373 | 65.3443 | 0.3964 | 2.9437 | 24.8076 | 0.6523 | 1.4365 | 0.6340 |
| SwinFusion [39] | 6.8680 | 2.4085 | 62.8285 | 0.5758 | 5.3090 | 34.4778 | 0.5883 | 1.4347 | 0.6933 |
| MDLatLRR [22] | 6.8430 | 1.8459 | 63.3278 | 0.4907 | 4.2988 | 30.1543 | 0.5215 | 1.1690 | 0.6363 |
| IA-MDLatLRR | 7.0048 | 2.7012 | 65.6855 | 0.6281 | 4.8661 | 34.3022 | 0.6769 | 1.5607 | 0.7619 |
Table 2.
Objective evaluation results of image translation comparison experiment. Blue numbers represent the highest-ranking method, and green numbers represent the second-ranked method.
Table 2.
Objective evaluation results of image translation comparison experiment. Blue numbers represent the highest-ranking method, and green numbers represent the second-ranked method.
| Method | NF- > DCV | NTIR- > DCV | NCV- > DCV | |||
|---|---|---|---|---|---|---|
| FID | FID | FID | KID ( | |||
| CycleGAN [27] | 109.6172 | 38.1537 | 121.8253 | 47.5827 | 130.7170 | 55.6975 |
| CUT [40] | 127.4195 | 58.4600 | 143.4373 | 78.3309 | 180.2604 | 101.1322 |
| QS-attn [28] | 123.4470 | 50.4946 | 132.0227 | 62.0031 | 133.2309 | 59.0322 |
| UNSB [36] | 108.6397 | 36.7278 | 120.5463 | 45.8972 | 125.1293 | 49.5961 |
| HDC-GAN | 94.5200 | 17.8051 | 108.9323 | 36.1451 | 111.5395 | 43.4754 |
Disclaimer/Publisher’s Note: The statements, opinions and data contained in all publications are solely those of the individual author(s) and contributor(s) and not of MDPI and/or the editor(s). MDPI and/or the editor(s) disclaim responsibility for any injury to people or property resulting from any ideas, methods, instructions or products referred to in the content. |
© 2024 by the authors. Licensee MDPI, Basel, Switzerland. This article is an open access article distributed under the terms and conditions of the Creative Commons Attribution (CC BY) license (https://creativecommons.org/licenses/by/4.0/).
Share and Cite
MDPI and ACS Style
Yang, S.; Sun, M.; Lou, X.; Yang, H.; Liu, D. Nighttime Thermal Infrared Image Translation Integrating Visible Images. Remote Sens. 2024, 16, 666. https://doi.org/10.3390/rs16040666
AMA Style
Yang S, Sun M, Lou X, Yang H, Liu D. Nighttime Thermal Infrared Image Translation Integrating Visible Images. Remote Sensing. 2024; 16(4):666. https://doi.org/10.3390/rs16040666
Chicago/Turabian StyleYang, Shihao, Min Sun, Xiayin Lou, Hanjun Yang, and Dong Liu. 2024. "Nighttime Thermal Infrared Image Translation Integrating Visible Images" Remote Sensing 16, no. 4: 666. https://doi.org/10.3390/rs16040666
Note that from the first issue of 2016, this journal uses article numbers instead of page numbers. See further details here.