Article

Intercomparison of Landsat Operational Land Imager and Terra Advanced Spaceborne Thermal Emission and Reflection Radiometer Radiometric Calibrations Using Radiometric Calibration Network Data

1
Science Systems & Applications, Inc., 10210 Greenbelt Road, Lanham, MD 20706, USA
2
NASA Goddard Space Flight Center, 8800 Greenbelt Road, Greenbelt, MD 20771, USA
3
Wyant College of Optical Sciences, University of Arizona, 1630 E University Blvd, Tucson, AZ 85721, USA
*
Author to whom correspondence should be addressed.
Remote Sens. 2024, 16(2), 400; https://doi.org/10.3390/rs16020400
Submission received: 30 October 2023 / Revised: 27 December 2023 / Accepted: 17 January 2024 / Published: 19 January 2024

Abstract

:
This paper presents a comprehensive intercomparison study investigating the radiometric performance of and concurrence among the Advanced Spaceborne Thermal Emission and Reflection Radiometer (ASTER), Landsat 8 Operational Land Imager (L8 OLI), and Landsat 9 OLI (L9 OLI) instruments. This study leverages data sourced from the Radiometric Calibration Network (RadCalNet) and focuses on spectral bands relevant for vegetation analysis and land cover classification, encompassing a thorough assessment of data quality, uncertainties, and underlying influencing factors. This study’s outcomes underscore the efficacy of RadCalNet in evaluating the precision and reliability of remote sensing data, offering valuable insights into the strengths and limitations of ASTER, L8 OLI, and L9 OLI. These insights serve as a foundation for informed decision making in environmental monitoring and resource management, highlighting the pivotal role of RadCalNet in gauging the radiometric performance of remote sensing sensors. Results from RadCalNet sites, namely Railroad Valley Playa and Gobabeb, show their possible suitability for sensors with spatial resolutions down to 15 m. The results indicate that the measurements from both ASTER and OLI closely align with the data from RadCalNet, and the observed agreement falls comfortably within the total range of potential errors associated with the sensors and the test site information.

1. Introduction

Remote sensing is a technology that enables us to gather information about the Earth’s surface and atmosphere without physical contact. It has revolutionized our ability to study and monitor the Earth’s surface, providing scientists, researchers, and decision makers with unprecedented amounts of data and insights into our planet [1].
In this context, three remote sensing platforms come into focus that include the recently launched Landsat 9 satellite and its near-twin, Landsat 8, which capture multispectral images of the Earth, and the Terra satellite, which carries various scientific instruments including the high-resolution imaging instrument known as the Advanced Spaceborne Thermal Emission and Reflection Radiometer (ASTER).
These instruments have been key providers of data used to create a wide variety of data products, including those used for vegetation analysis and land cover classification, which are important for monitoring changes in plant growth, biomass, and water content, and a wide range of environmental and societal applications. The green and red bands are particularly useful for distinguishing between different types of vegetation and for estimating vegetation cover and productivity, while the near-infrared band is sensitive to changes in vegetation water content and can be used to monitor drought conditions, soil moisture, and plant stress. Additionally, the near-infrared band is commonly used in vegetation indices such as the normalized difference vegetation index (NDVI), which can provide a measure of vegetation health and productivity [2].
To advance our understanding of the Earth’s surface and its evolution over time, the availability of data from multiple sensors with different spectral bands and resolutions is indispensable. Comparing the performance of these bands across ASTER, L8 OLI, and L9 OLI provides an opportunity to gauge the agreement among the sensors, offering users a comprehensive view of the Earth’s surface for various applications, including agriculture, forestry, land-use planning, and natural resource management.
However, a challenge arises in ensuring that changes in the radiometric responses of the sensors do not impact efforts to combine data from two sensors. The NIR bands are a good example of this since NDVI is widely used by the vegetation community, and the NDVI derived from ASTER [3] will differ from the OLI values simply because of their spectral differences. Users can correct for such effects, but corrections become far more complicated if there are radiometric calibration differences between various sensors. The fact that NDVI relies on multiple bands, as do almost all applications, requires developing techniques that can evaluate how all of the bands from all of the sensors can be evaluated on an absolute scale as well as relative to each other to help determine possible biases in data products.
This paper addresses this challenge through an intercomparison study, concentrating on the radiometric performance and agreement among ASTER, L8 OLI, and L9 OLI sensors. Leveraging data from the Radiometric Calibration Network (RadCalNet), this work focuses on the spectral bands pivotal for vegetation analysis and land cover classification. It meticulously evaluates data quality, uncertainties, and the key factors influencing these aspects.
It is worth noting that the Terra platform underwent two key orbital changes in 2020 and 2022. The Terra mission maintained a very narrow two-minute range for its equator crossing through the use of orbital inclination maneuvers. The last of the maneuvers took place in the spring of 2020 to conserve fuel for end-of-life maneuvers; since then, the platform’s crossing time has been drifting to times earlier in the day. Fuel is still available to perform debris-avoidance maneuvers, but the crossing time changed for the platform from the original 10:30 to 10:15 in September 2022 and to 10:00 in September 2023. The 10:15 a.m. time reached in 2022 prompted the Terra project team to perform an orbit-lowering maneuver in October 2022 from the 705 km altitude of the Earth Sciences Constellation. The lowering of the altitude reduces possible crossings with other platforms, helping to maintain the safety of other platforms while preserving fuel for Terra’s eventual de-orbit burns. Thus, one goal of this paper is to assess whether ASTER has experienced a discernible impact on its radiometric performance as a result of the orbital changes experienced by the Terra platform.
The approach used in the current work is a vicarious calibration relying on RadCalNet. RadCalNet has been used extensively in recent years for vicarious calibration. SI-traceable intercalibration methodology in the Landsat 8 and 9 OLI instruments using RadCalNet sites has been provided [4]. A combination of RadCalNet sites as a common reference was used for an intercomparison of Landsat OLI and JPSS VIIRS [5]. Vicarious calibration of SuperView-1 satellite sensor using RadCalNet TOA reflectance product has been investigated [6]. A reliable, high-precision radiometric calibration coefficient for the GF-7 satellite sensor has been obtained using RadCalNet’s Baotou site [7]. Calibration techniques used for the DESIS instrument with a special emphasis on vicarious calibration over RadCalNet’s calibration sites have been described elsewhere [8].
The primary requirement of RadCalNet is that the TOA reflectances be SI-traceable with well-documented uncertainties. The automated nature of the data collection means that data will typically be available for any sensor viewing the sites, and the TOA reflectance from RadCalNet is a useful tool for evaluating the absolute radiometric calibration of on-orbit sensors as well as high-flying airborne sensors [9]. An additional benefit of RadCalNet data products with SI traceability is that they allow for different satellite sensors to be compared to each other using RadCalNet sites even when the sensors do not have identical spectral bands. Intercomparisons using RadCalNet sites also do not require coincident (or even near-coincident) imaging. Their SI traceability, with a well-understood and peer-reviewed error budget, allows RadCalNet sites to be used as common references [10].
RadCalNet data offer a unique opportunity to compare the radiometric performance of Landsat OLI to Terra’s ASTER. This work also provides an evaluation of the Railroad Valley and Gobabeb sites of RadCalNet for sensors at a 15 m spatial resolution to help fill the gap between results from past studies with 10 m and 30 m spatial resolutions [4,11,12,13,14,15].
The access to L8 OLI data allows for an additional analysis of the ASTER-to-L9 OLI comparison to determine the impacts of any site-dependent factors. Past comparisons between ASTER and L8 OLI indicate that the two sensors agree to within the absolute uncertainties of RadCalNet and the sensors themselves [16,17]. It is known that L8 OLI and L9 OLI data should agree to better than a few percent based on data collected during an underfly of Landsat 8 by Landsat 9 [18,19]. Thus, the ASTER-to-L9 OLI comparison discussions below benefit from understanding the RadCalNet data through OLI. The key to this multi-sensor approach is that the RadCalNet data do not need to coincide with all three sensors in order for this approach to be successful.
The differences and similarities in the behavior of the calibration of the two sensors are assessed to show whether the Railroad Valley and Gobabeb RadCalNet sites are suitable for sensors with spatial resolutions as small as 15 m while demonstrating that the recent update to the ASTER radiometric calibration provides results that agree with L8 OLI and L9 OLI to well within the absolute radiometric uncertainties of both sensors. It is important to note that we omitted the results obtained from short-wave infrared (SWIR) bands in our study. This decision stemmed from our study’s primary emphasis on the visible and near-infrared (VNIR) bands. In recent years, ASTER sensor data were limited to Bands 1, 2, and 3N, and access to SWIR data for the entire 10-year period we considered was not readily available. Consequently, our analysis was centered on the VNIR bands in which we had sufficient data to conduct a comprehensive assessment.

2. Materials and Methods

In this section, we present a comprehensive overview of the materials and methods utilized in this study. We delve into the technical details of the sensors employed, describe the RadCalNet calibration network, explain the intercomparison methodology and the criteria for selecting clear-sky scenes, and outline the process of converting digital numbers to top-of-atmosphere (TOA) reflectance.

2.1. Sensors

ASTER is a joint project between NASA and the Japanese Ministry of Economy, Trade, and Industry (METI) as part of the Terra platform. ASTER is not continuously imaging and must be tasked to collect data. ASTER has three bands as part of its visible and near-infrared (VNIR) camera: green, red, and near-infrared bands. ASTER VNIR data are available in two versions: Version 3 (v003) and Version 3.1 (v031), which was released in 2016 to make adjustments to radiometric calibration coefficients. Version 3.1 also includes improvements to the atmospheric correction algorithms and updates to the digital elevation model (DEM) product [20].
The Landsat 8 satellite is part of the long-running Landsat program operated by NASA and the United States Geological Survey (USGS) [21]. Landsat 8 collects up to 700 scenes per day, with an orbit that is essentially the same as the Terra platform except that it is eight days out of phase. Landsat 8 carries the Operational Land Imager (L8 OLI) and the Thermal Infrared Sensor (L8 TIRS), which provide multispectral data. The L8 OLI sensor has five VNIR bands: the coastal aerosol, blue, green, red, and VNIR bands.
Landsat 9 upholds the tradition of the Landsat program in collaboration with NASA and the USGS, contributing vital Earth observation data. Similar to its predecessor, Landsat 8, is in an orbit with an eight-day offset for consistent lighting conditions and was in the same orbit as Terra until October 2022, when Terra was lowered. The satellite carries the advanced Operational Land Imager (L9 OLI) and Thermal Infrared Sensor (L9 TIRS), refining the capabilities of Landsat 8’s instruments. L9 OLI’s spectral bands include coastal aerosol, blue, green, red, near infrared, and short-wave infrared. Landsat 9’s mission aligns with its predecessors, providing indispensable multispectral and thermal data for various applications spanning from environmental monitoring to disaster management. The characteristics of the ASTER and OLI sensors are summarized in Table 1. The band names and center wavelength values of OLI and ASTER in the 400 nm to 1000 nm range that are used in this study are listed in Table 2.
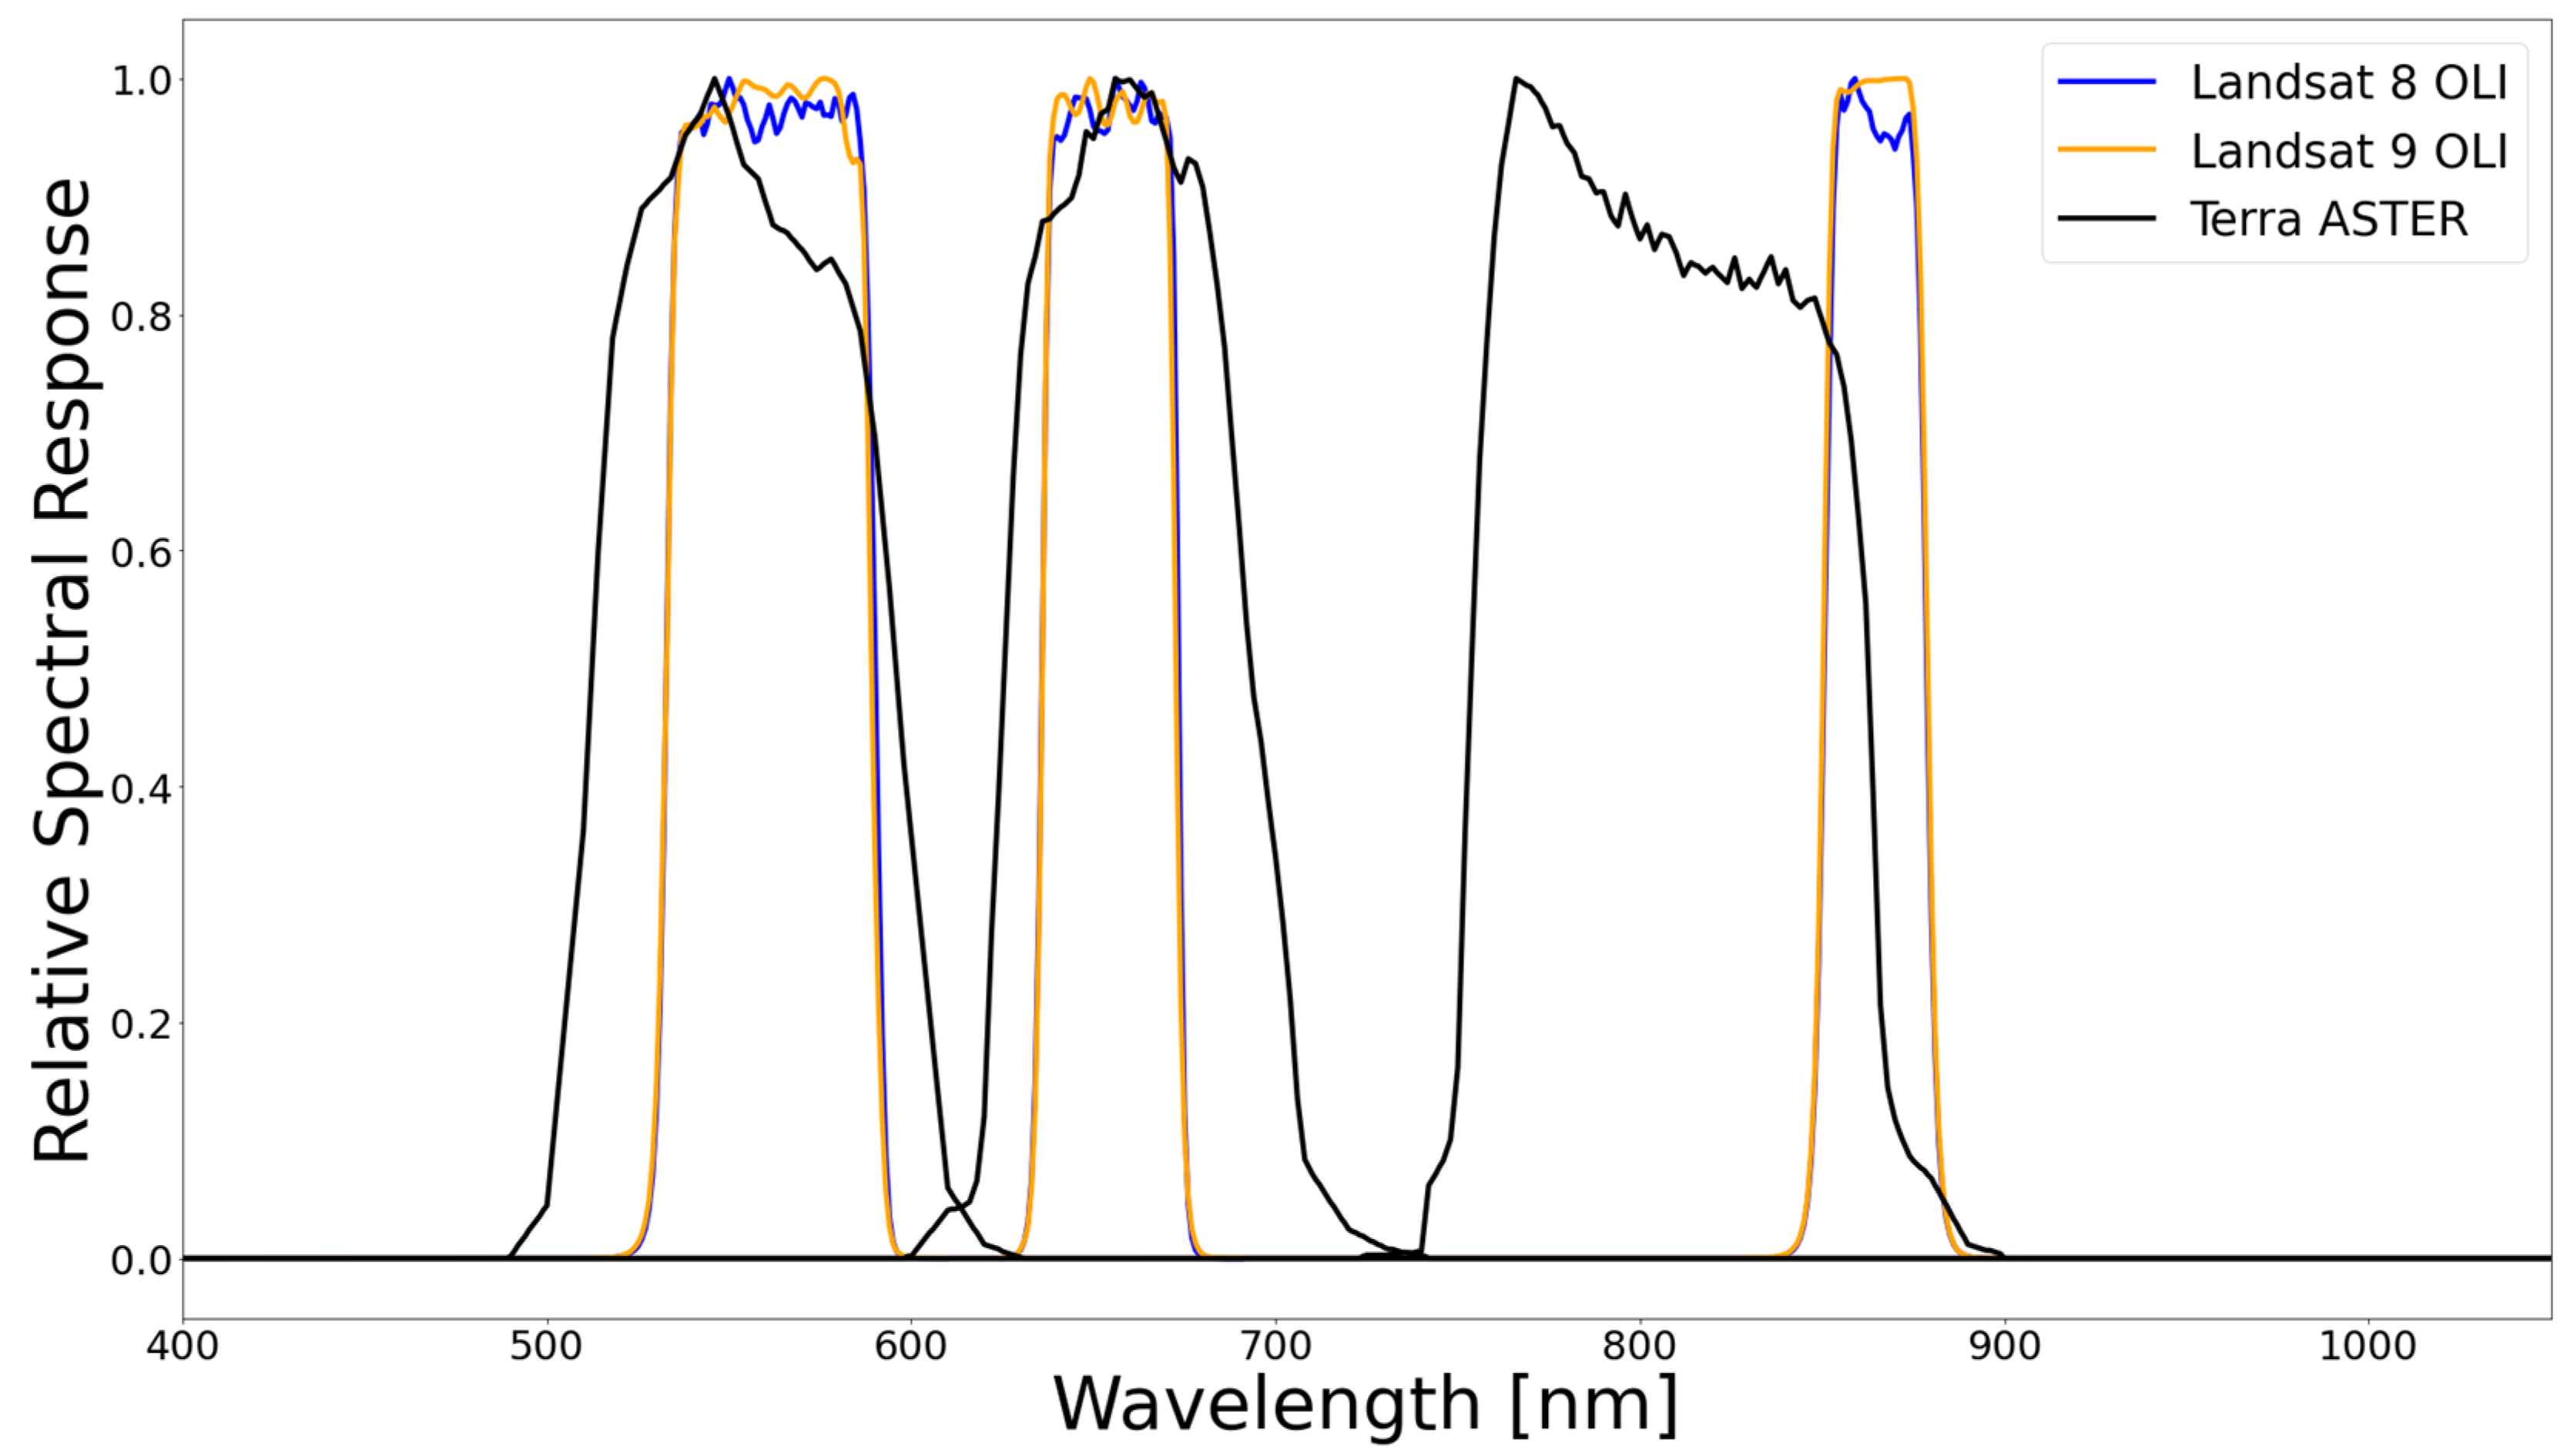
Figure 1 shows the relative spectral responses (RSRs) of the L8 OLI, L9 OLI, and ASTER sensors in the 400 nm to 1000 nm range. The three sensors have similar spectral responses in the shared spectral regions, although there are some differences in the center wavelength and band width. For example, the green band of ASTER is slightly wider than those of L8 OLI and L9 OLI, with a slightly shorter center wavelength. Another example is the near-infrared band of ASTER, which is broader than those of L8 OLI and L9 OLI but at a shorter center wavelength. Such a band shape can be beneficial for monitoring vegetation water content, but the OLI band was able to take advantage of improved sensor technology to allow for a narrower band that was placed to reduce effects caused by an absorption feature from atmospheric water vapor.

2.2. RadCalNet

Absolute radiometric calibration is the key step to ensuring the accuracy of remote sensing data as it corrects for variations in sensor response due to changes in the sensor’s environment or the aging of the sensor’s components. RadCalNet is a network of sites established by the Infrared Visible Optical Sensors (IVOS) Subgroup of the Committee on Earth Observation Satellites (CEOS) Working Group on Calibration and Validation (WGCV) [10]. Its purpose is to provide SI-traceable data suitable for assessing calibration while also providing an opportunity to evaluate the calibration across multiple Earth observation sensors. The network includes multiple sites for the purpose of optical imager radiometric calibration in the visible-to-short-wave infrared (SWIR) spectral range [10]. To ensure minimal uncertainties in the calibration process caused by path radiance, misregistration, spectral differences, temporal variability, view angle differences, aerosols, adjacency effects, and weather conditions, a suitable cross-calibration site must possess specific characteristics, such as high surface reflectance, spatial uniformity, flat spectral reflectance, temporal invariance in surface properties, a near-Lambertian surface, high altitude, large size, arid region, and accessibility [25]. The two sites used here, Railroad Valley Playa and Gobabeb, best match these criteria, and both have a significant amount of available data for ASTER, L8 OLI, and L9 OLI while covering the longest periods. Coordinates and areas for the two sites are presented in Table 3.
The Railroad Valley Playa site in Nevada, USA, with the four-letter name RVUS, has been utilized for reflectance-based vicarious calibration since the mid-1990s [26]. Automated solar transmittance data collection began in 2001, with initial versions of downward-looking radiometers deployed in 2002. The current Radiometric Calibration Test Site (RadCaTS), featuring four ground-viewing radiometers (GVRs), was established in 2011. The RadCaTS’s region of interest (ROI) is approximately 1 km2 (1000 m × 1000 m) and is centered at the coordinates 38.497°N, 115.690°W at an altitude of 1435 m. The site is in a remote, unpopulated area, which minimizes the effects of urbanization and other land-use changes on measurements. The surface reflectance is typical of clay-based playas, with higher values in the NIR and SWIR bands, and stable under dry conditions but varying due to occasional rain and snowfall. The surface behaves approximately Lambertian up to view angles of around 30° such that bidirectional reflectance effects are not the dominant uncertainty source for near-nadir sensor views [27]. The yearly average aerosol optical depth is low, around 0.060 at 550 nm. GVRs are multispectral, with seven bands in the VNIR channel and one SWIR channel. Atmospheric data collection follows the AERONET (Aerosol Robotic Network) network’s acquisition scheme, and GVRs record data every two minutes [28]. Data are transmitted to the University of Arizona via satellite uplink. The RadCaTS data is then processed to derive the site reflectance based on the GVR suite’s average. 
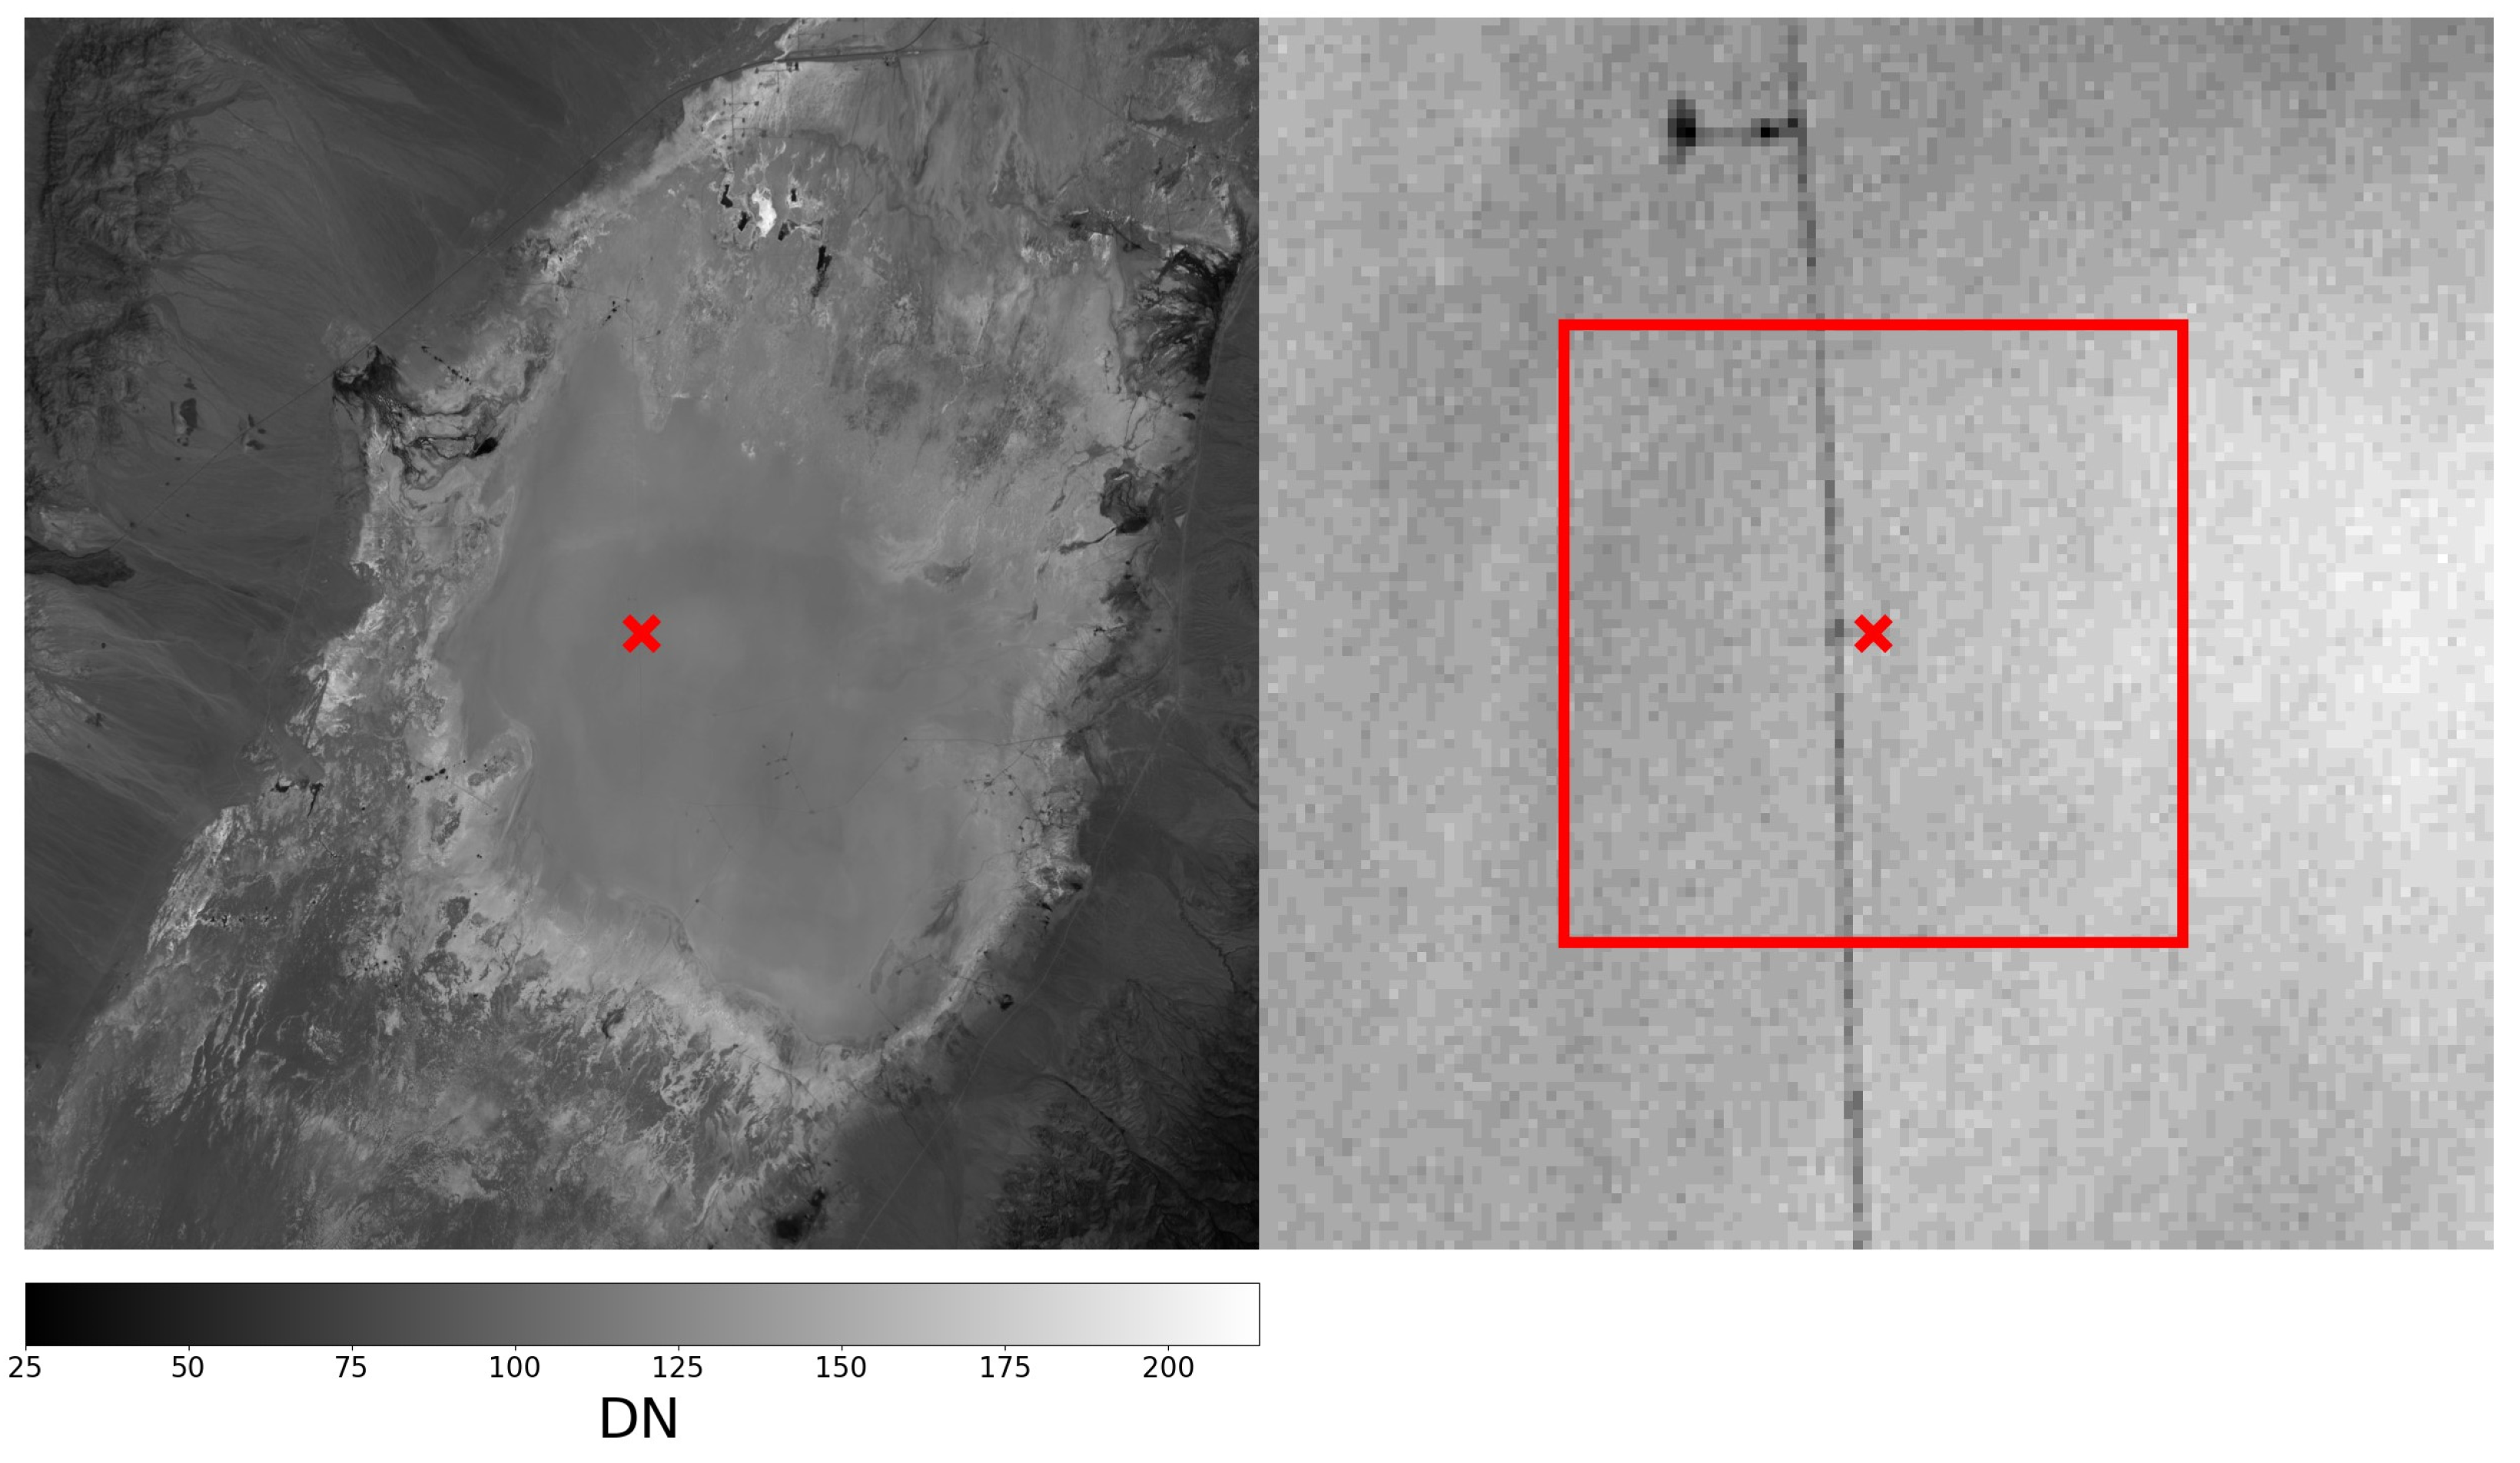
Figure 2 shows an image of the extended region of RVUS as well as the 1 km2 ROI used by the RadCaTS and, thus, RadCalNet.
The Gobabeb site in Namibia, with the four-letter name GONA, was established as part of the RadCalNet prototype phase and has been active since July 2017. It is jointly operated by the European Space Agency (ESA) through subcontracting to the National Physical Laboratory of the United Kingdom (NPL), as well as the Centre National d’Etude Spatiales (CNES) [29,30]. An automated sun photometer that is part of AERONET provides atmospheric data in a fashion similar to that at RVUS. The sun photometer at GONA also retrieves measurements of upwelling surface radiance, allowing for the derivation of the surface bidirectional reflectance distribution function (BRDF). Operational software processes the data, calibrates the photometer, estimates atmosphere properties, and models the site’s BRDF. GONA was chosen through a global search focusing on quantitative evaluations of spectral characteristics, spatial consistency, the likelihood of clear skies, and other site parameters. It is the only site of the original five RadCalNet sites selected via this process. Calibration involves sun measurements, Rayleigh scattering, and external calibration methods. GONA’s role extended to aiding the RadCalNet Working Group in formulating criteria and guidelines for prospective network sites [
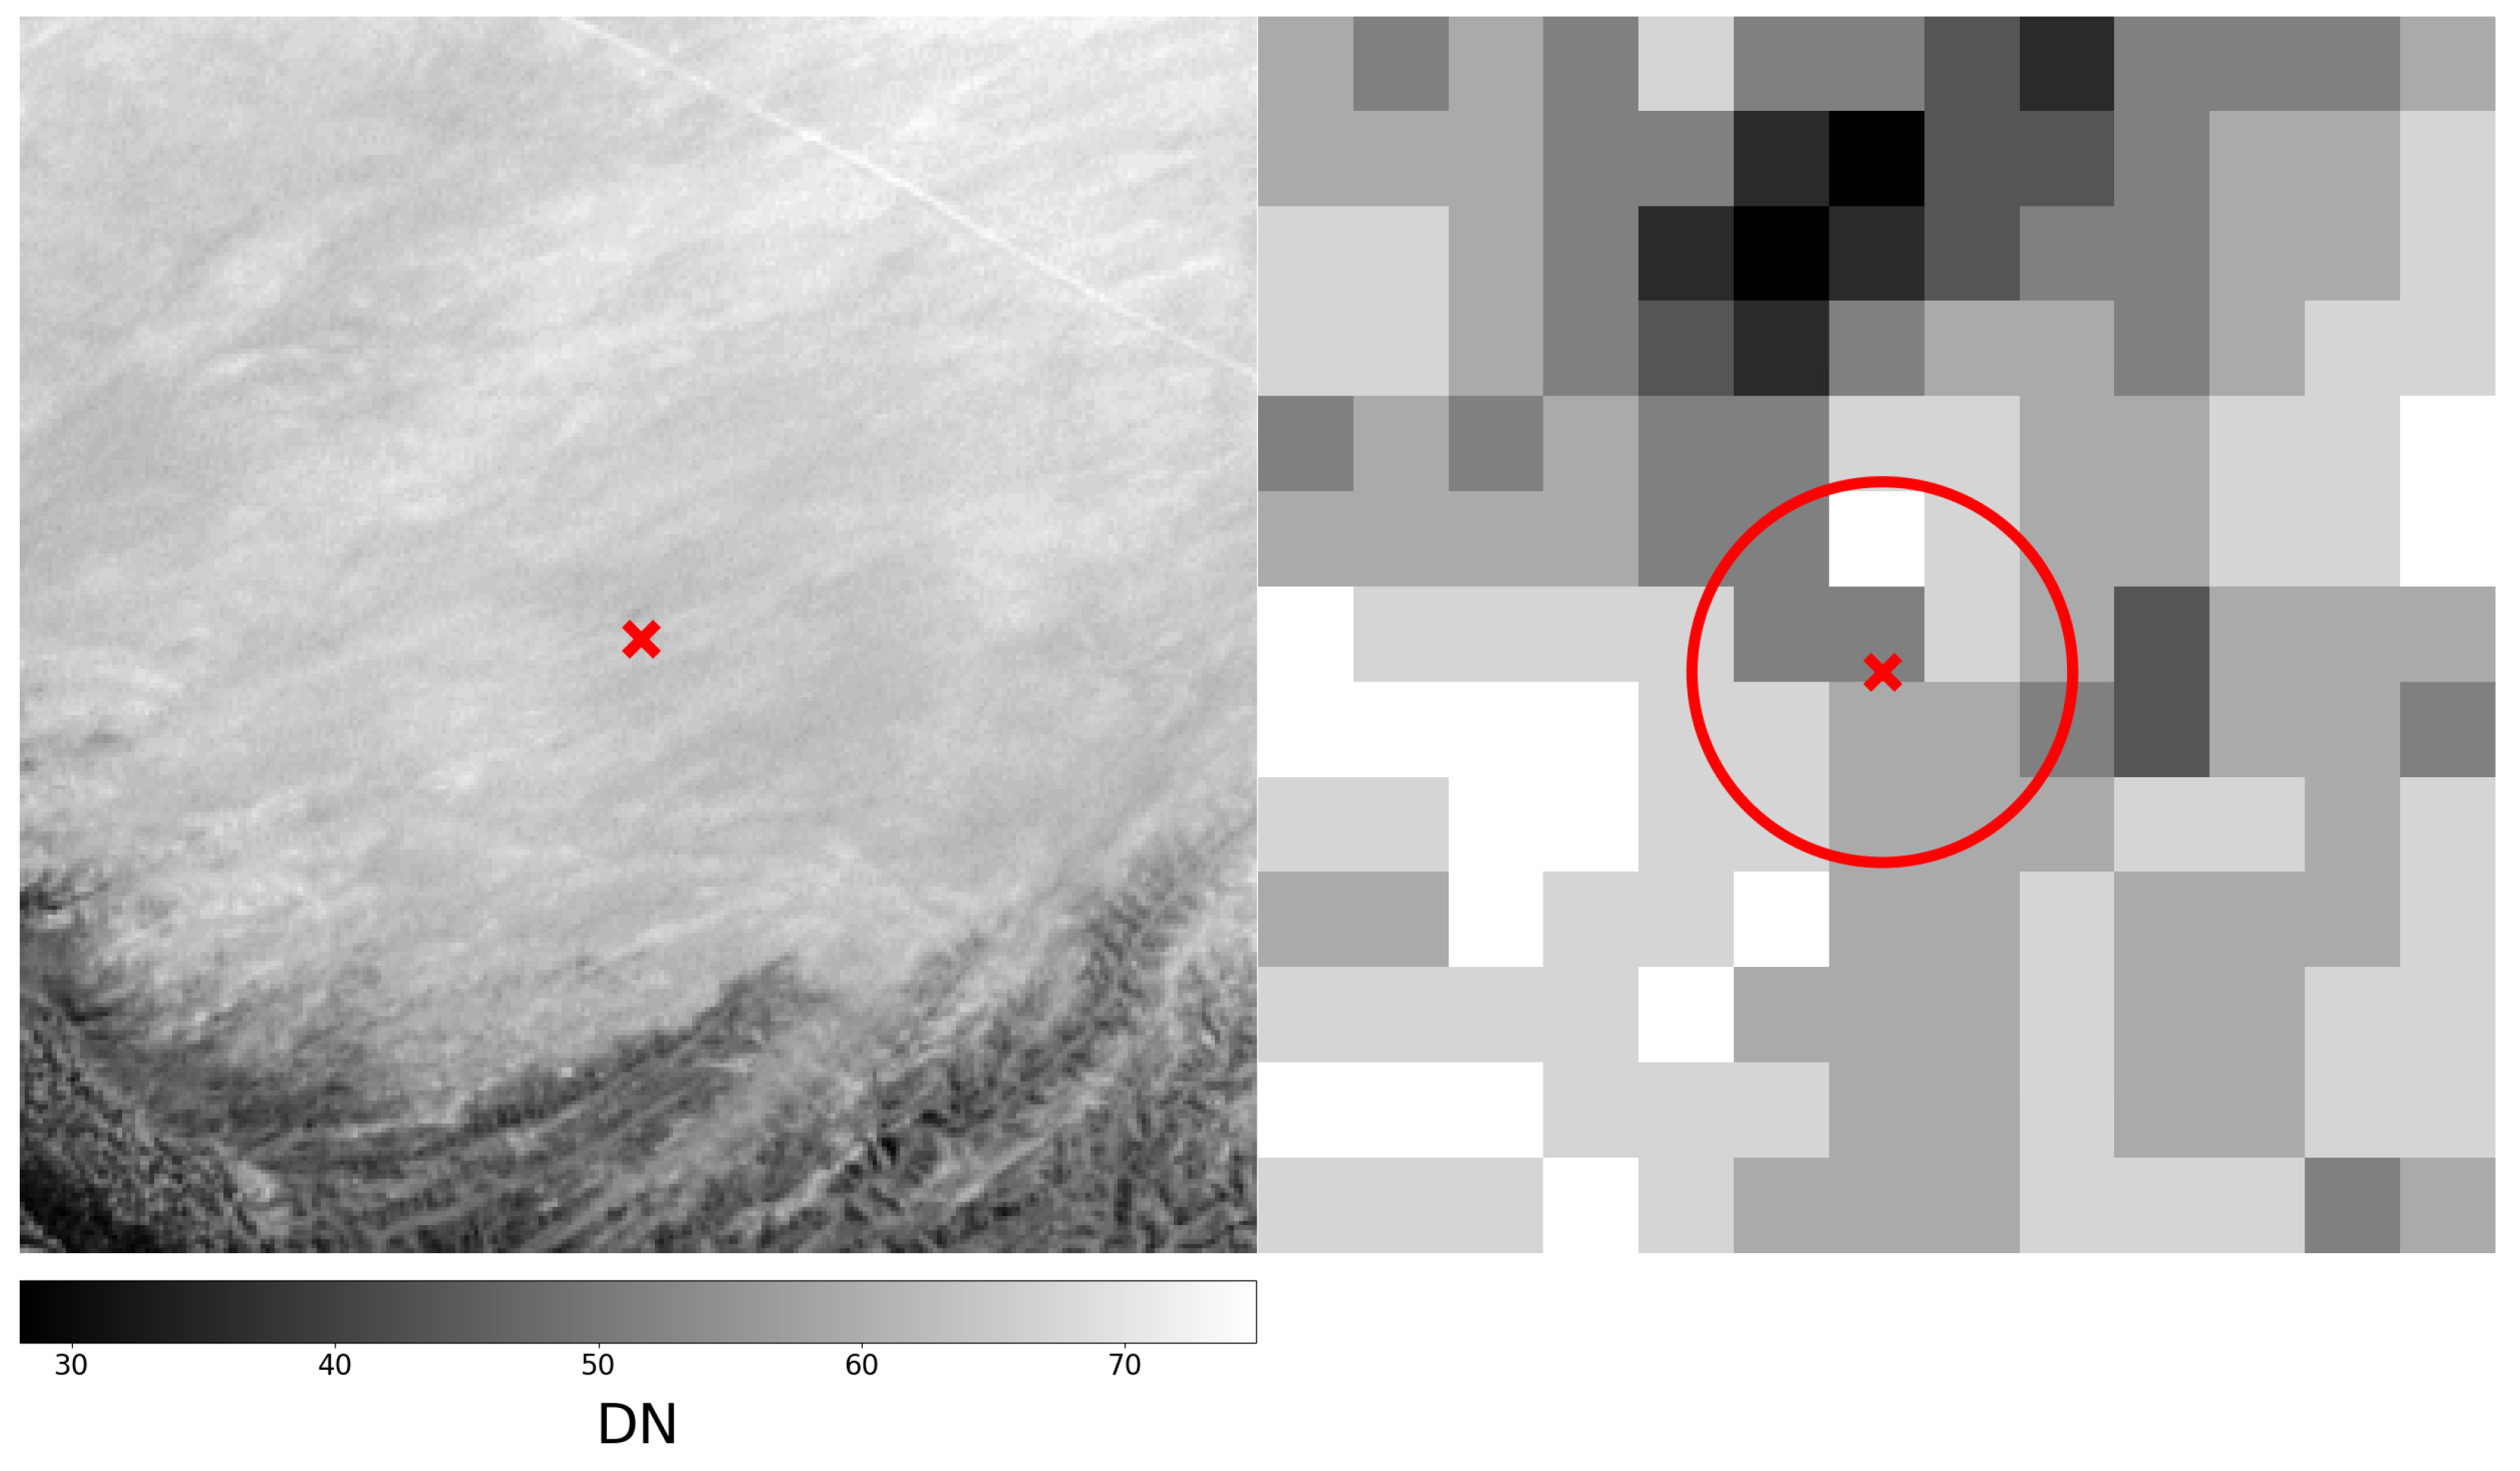
10]. The site is centered at 23.600°S, 15.120°E, and like La Crau, the ROI is a disk with a 30 m radius. Figure 3 shows an overview of GONA as well as the 30 m radius disk ROI used by RadCalNet.
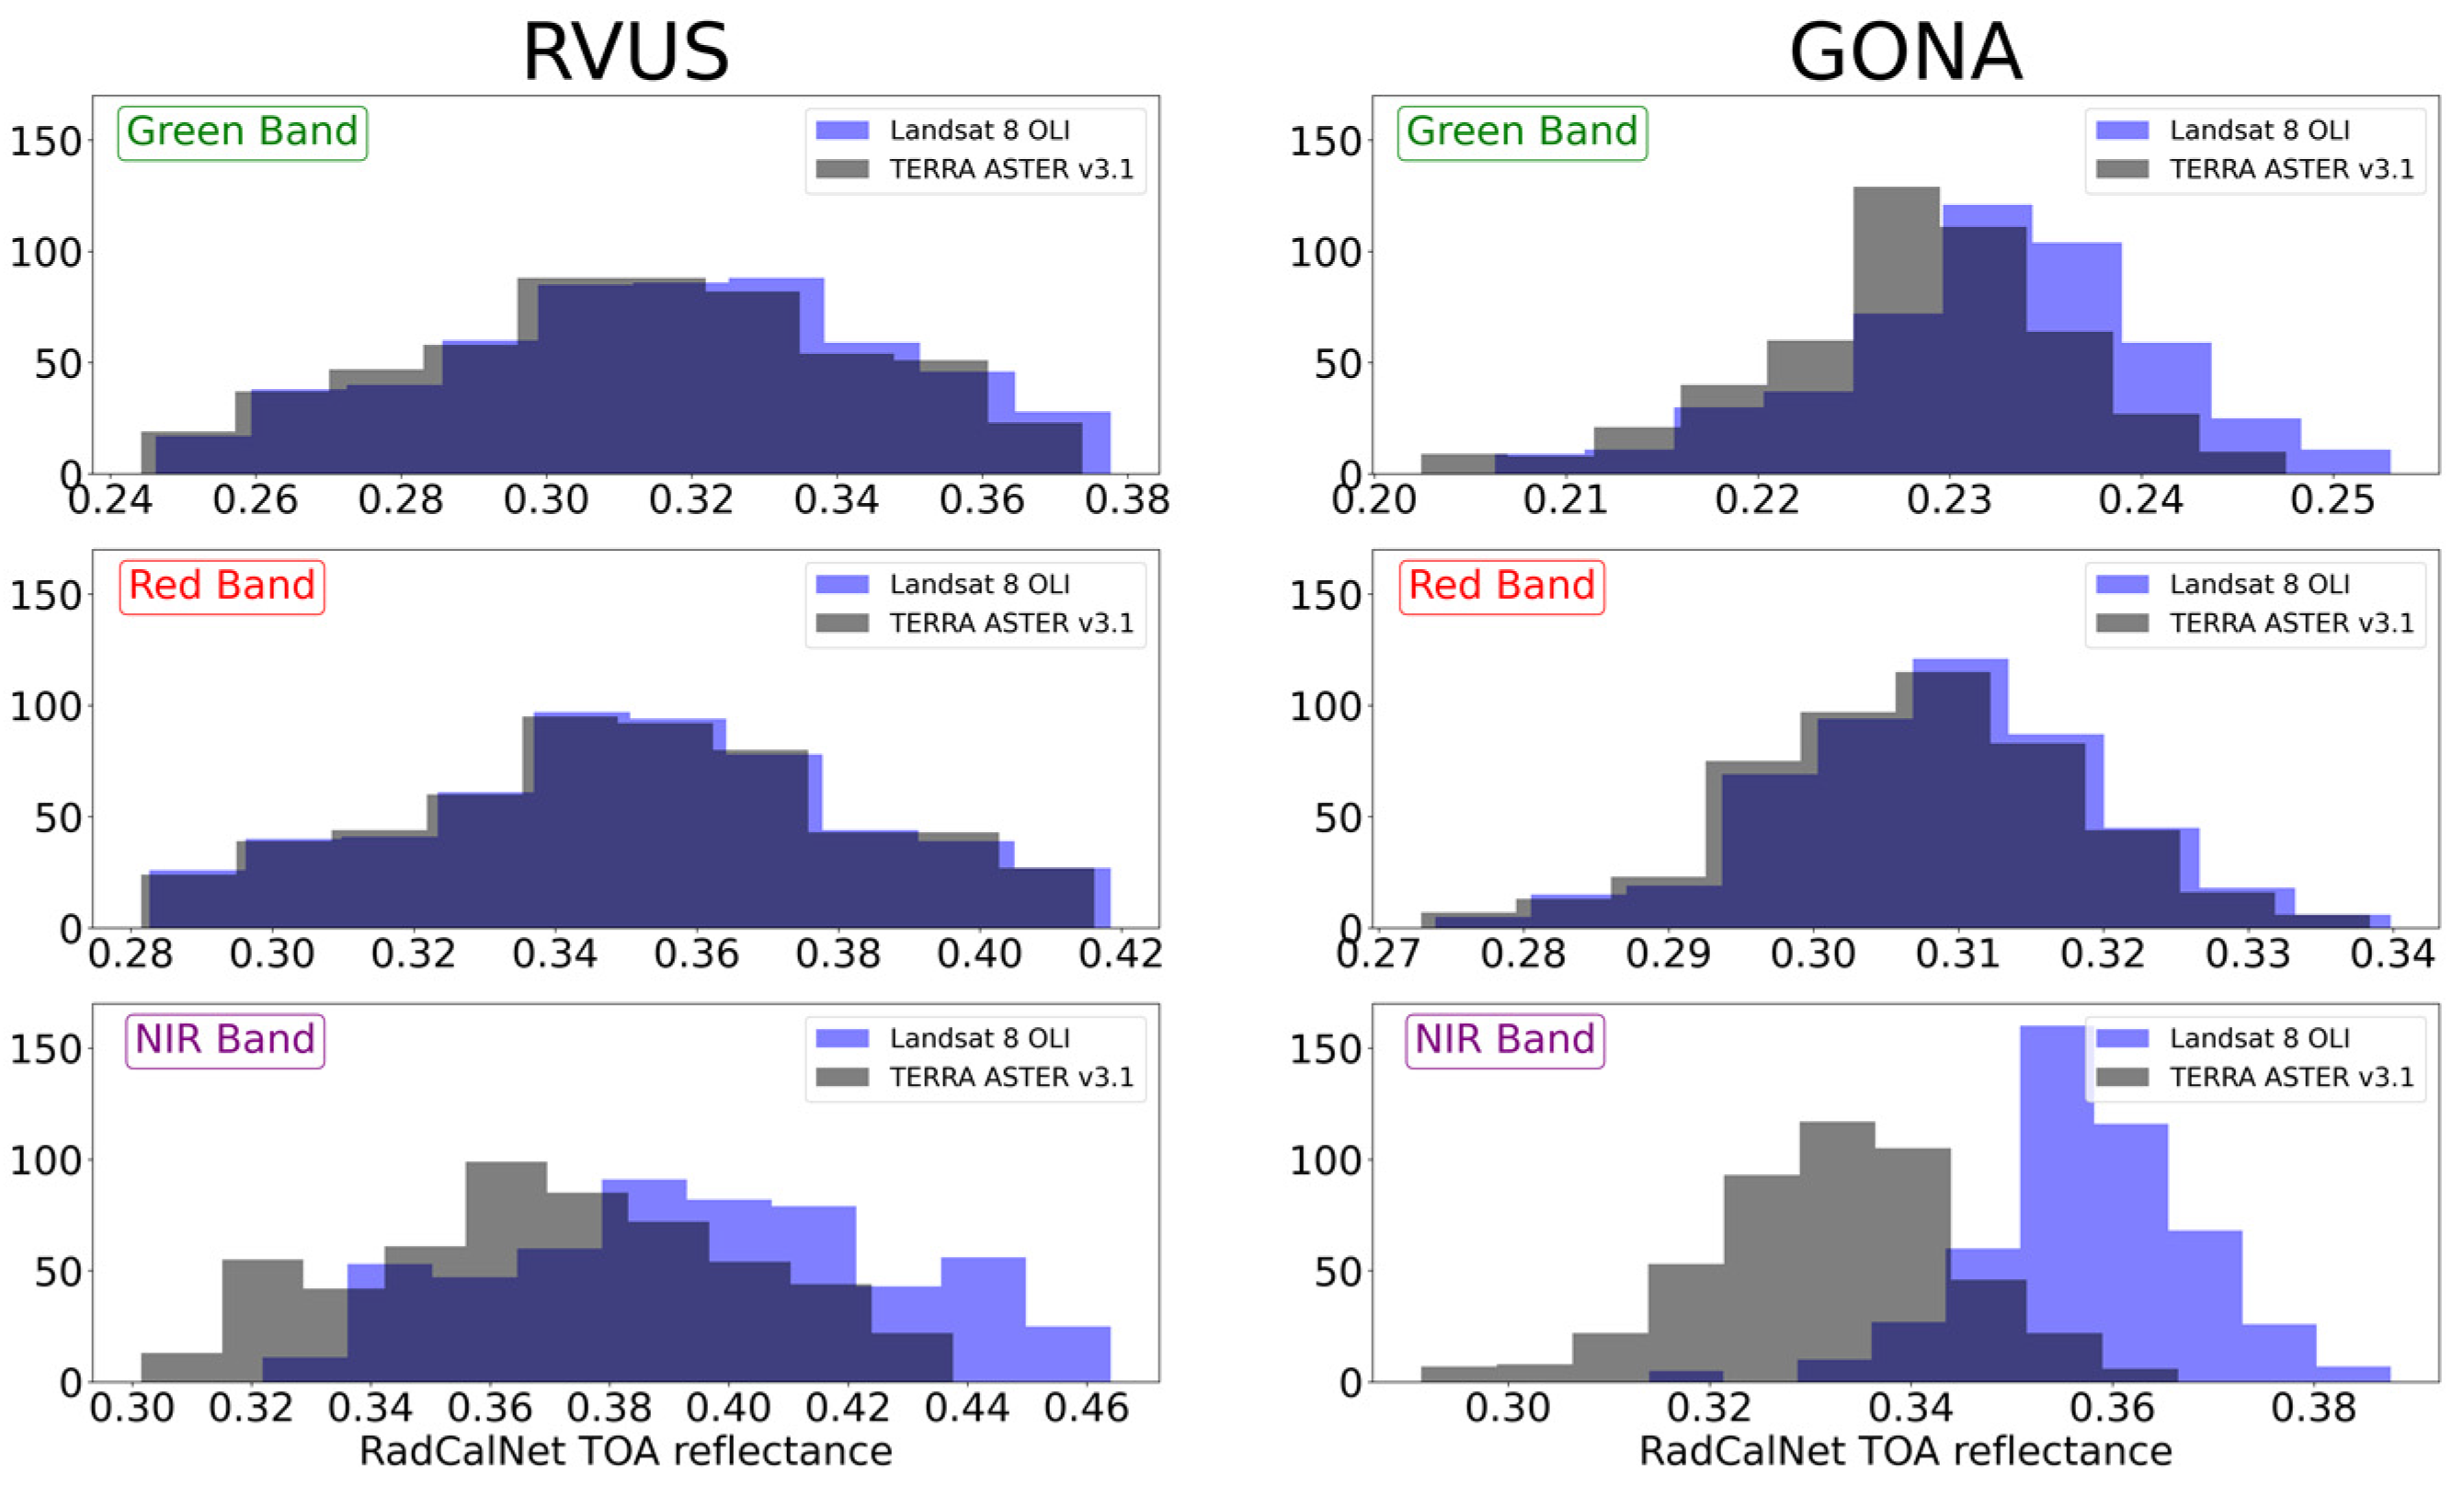
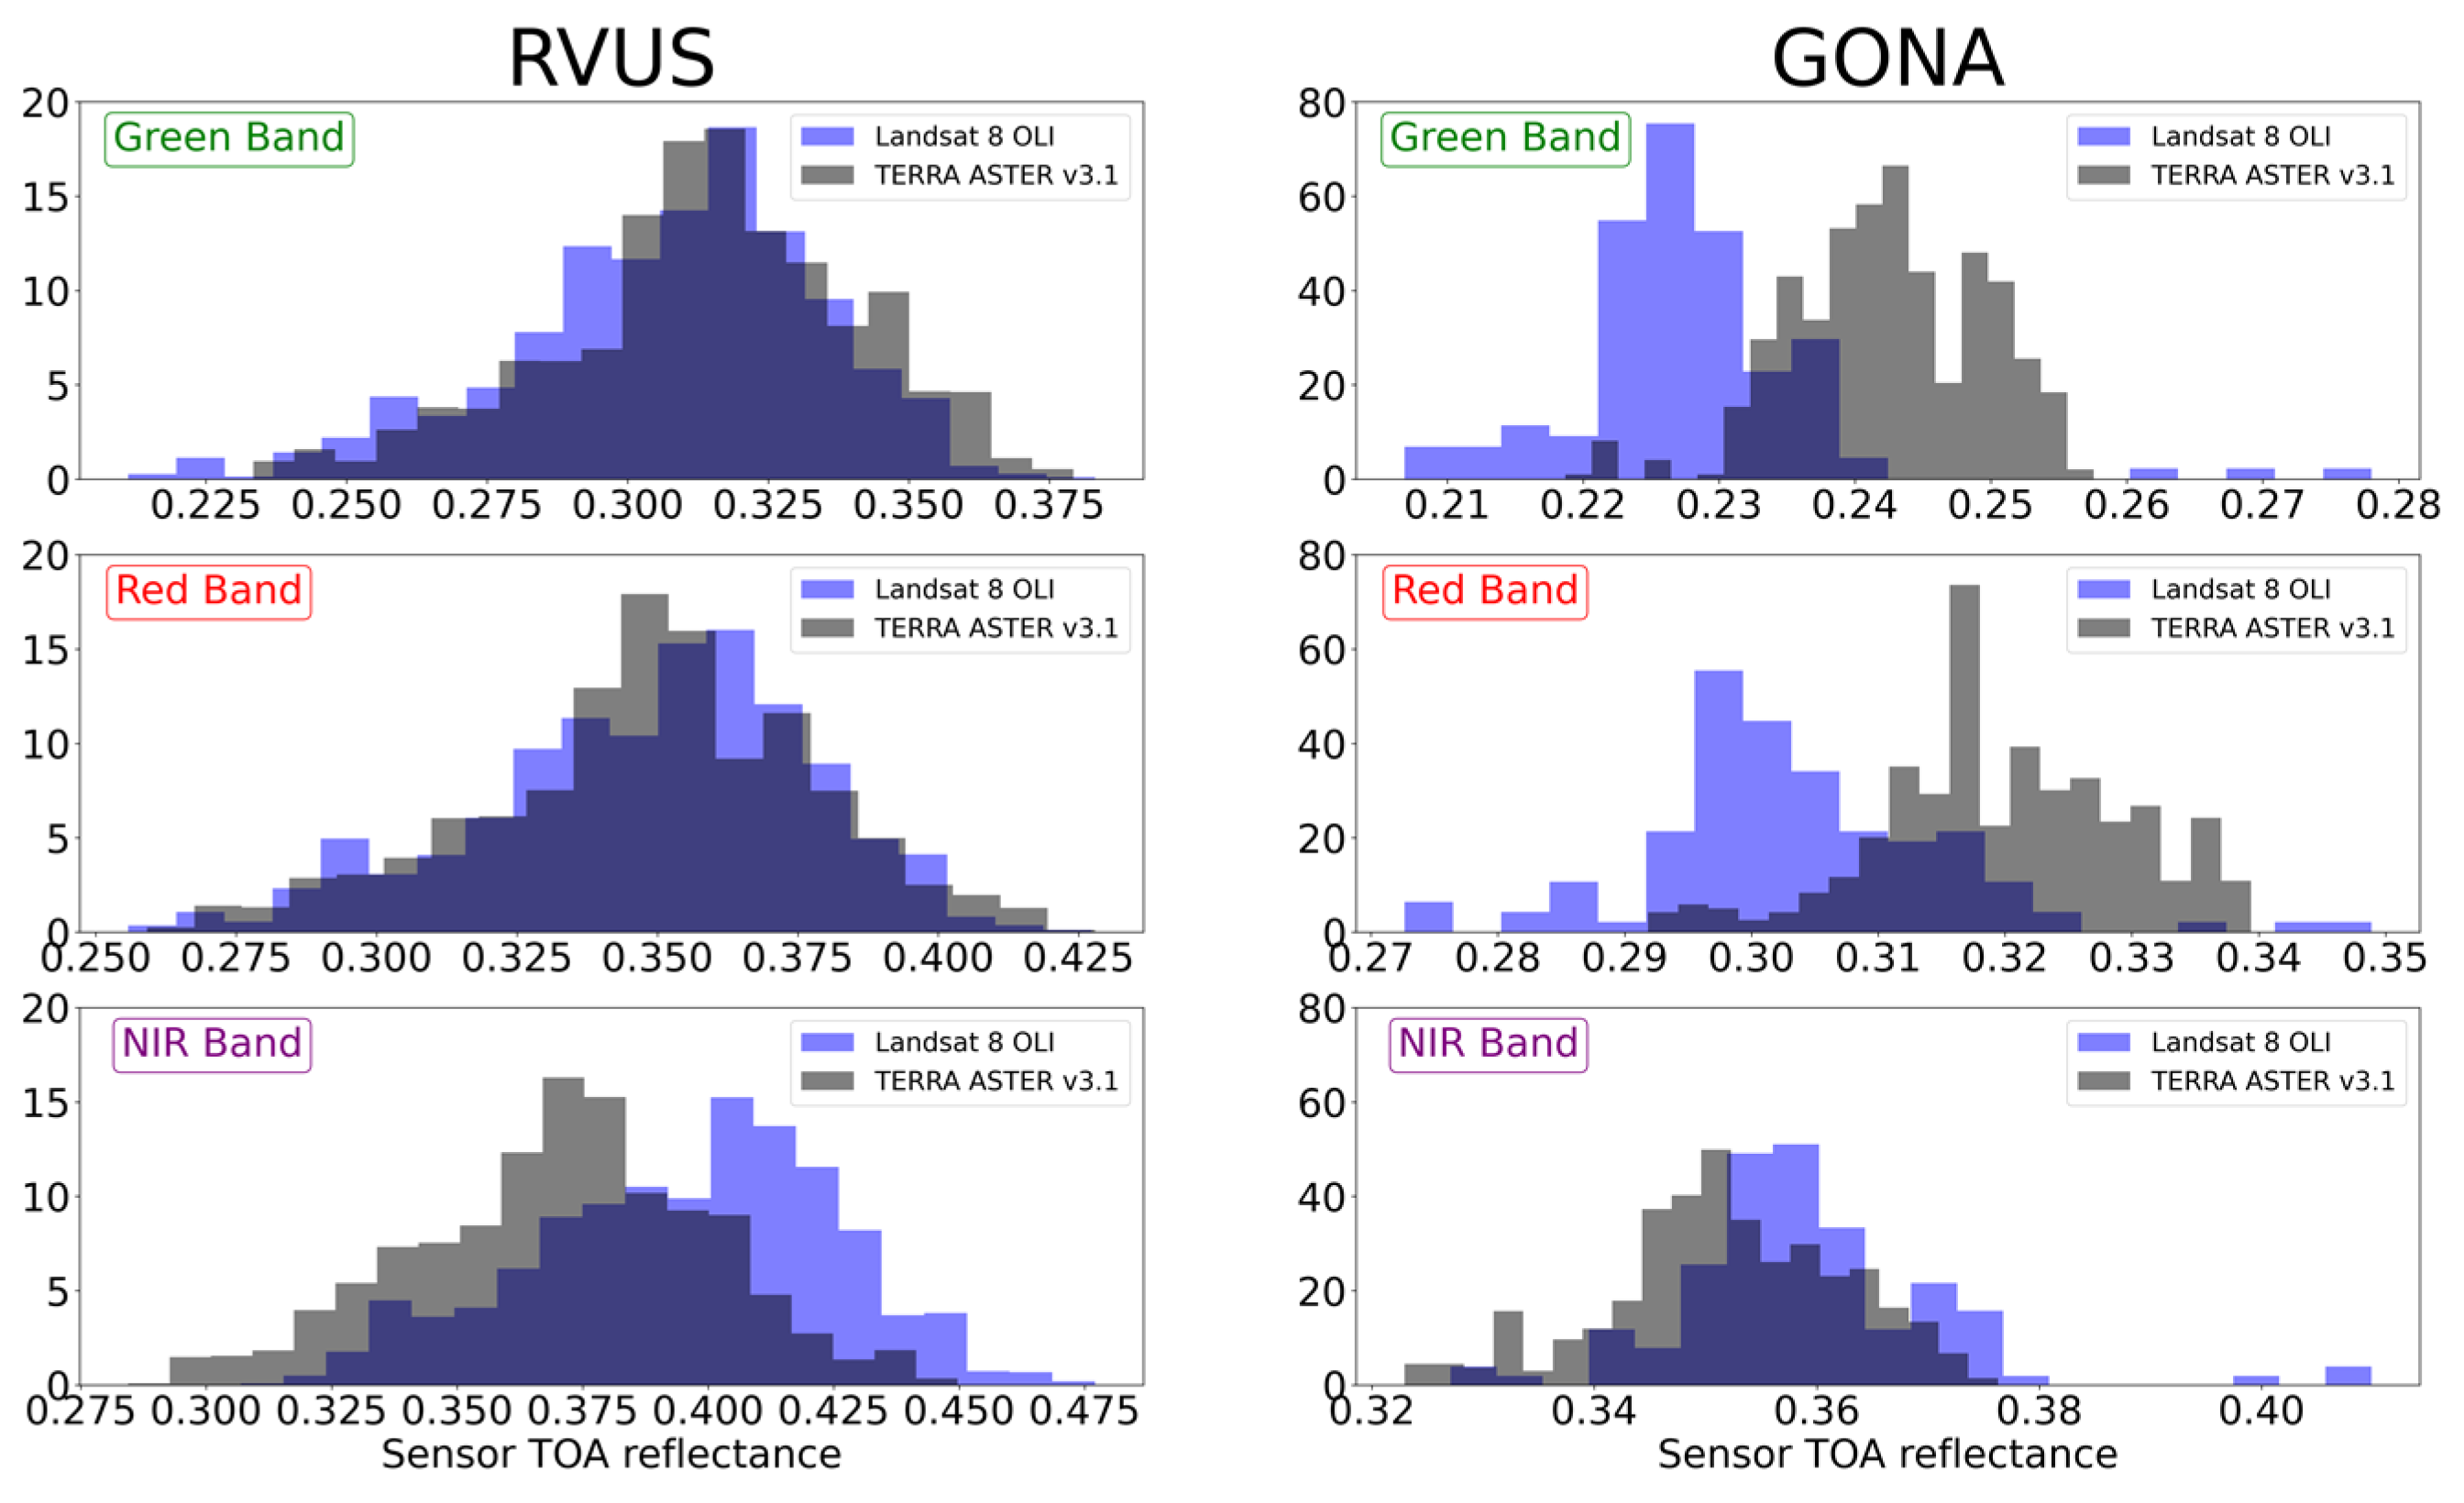
Figure 4 illustrates histograms depicting the band-averaged top-of-atmosphere (TOA) reflectance for both RVUS and GONA based on RadCalNet data from the two sites. The data were derived by band-averaging the RadCalNet values across the L8 OLI and ASTER RSRs for each sensor in the green, red, and NIR spectral bands. The data from RVUS were based on the 17:30 to 19:30 UTC RadCalNet data and the 8:30 to 10:30 UTC measurement from GONA. These specific times were chosen because they coincide closely with the overpasses of the Landsat and Terra satellites over RVUS and GONA. In the figure, the dark blue color represents the overlap between the two histograms for the two sensors.
The histograms reveal that RVUS exhibits a broader range of TOA reflectance values across all three spectral bands compared to GONA. Notably, the histograms for the green and red bands closely resemble each other. As a result of the similarity in spectral response between L8 OLI and ASTER in these bands, the spectral reflectance at both sites is relatively flat over those bands. However, when examining the NIR band, a noticeable difference in the histograms is observed that is consistent at both two sites. The spectral reflectances at RVUS and GONA are also relatively flat in this spectral region, though the width of the ASTER band means that it is affected by the small slope in the surface reflectance. The variations in the histograms can be attributed to ASTER’s NIR spectral response having a wider spectral range and a shorter central wavelength compared to L8 OLI. This difference leads to ASTER sampling atmospheric absorption differently. Importantly, utilizing data from RadCalNet is advantageous because it easily addresses these spectral disparities by averaging the TOA reflectance data across bands.

2.3. Approach for Comparing Sensor Imagery with RadCalNet Measurement Data

RadCalNet utilizes ground-based measurements of surface and atmospheric conditions to predict TOA reflectance using the MODTRAN (moderate resolution atmospheric transmission) radiative transfer code [10]. Uncertainties are provided for each RadCalNet data point that were determined from a look-up table approach [31]. Operators of RadCalNet sites provide nadir-viewing bottom-of-atmosphere (BOA) reflectance data at 10 nm intervals between 400 nm and 2300 nm in 30 min intervals from 09:00 to 15:00 local standard time. Atmospheric parameters such as surface pressure and temperature, water vapor, ozone, aerosol optical depth, and Angstrom coefficient are also provided.
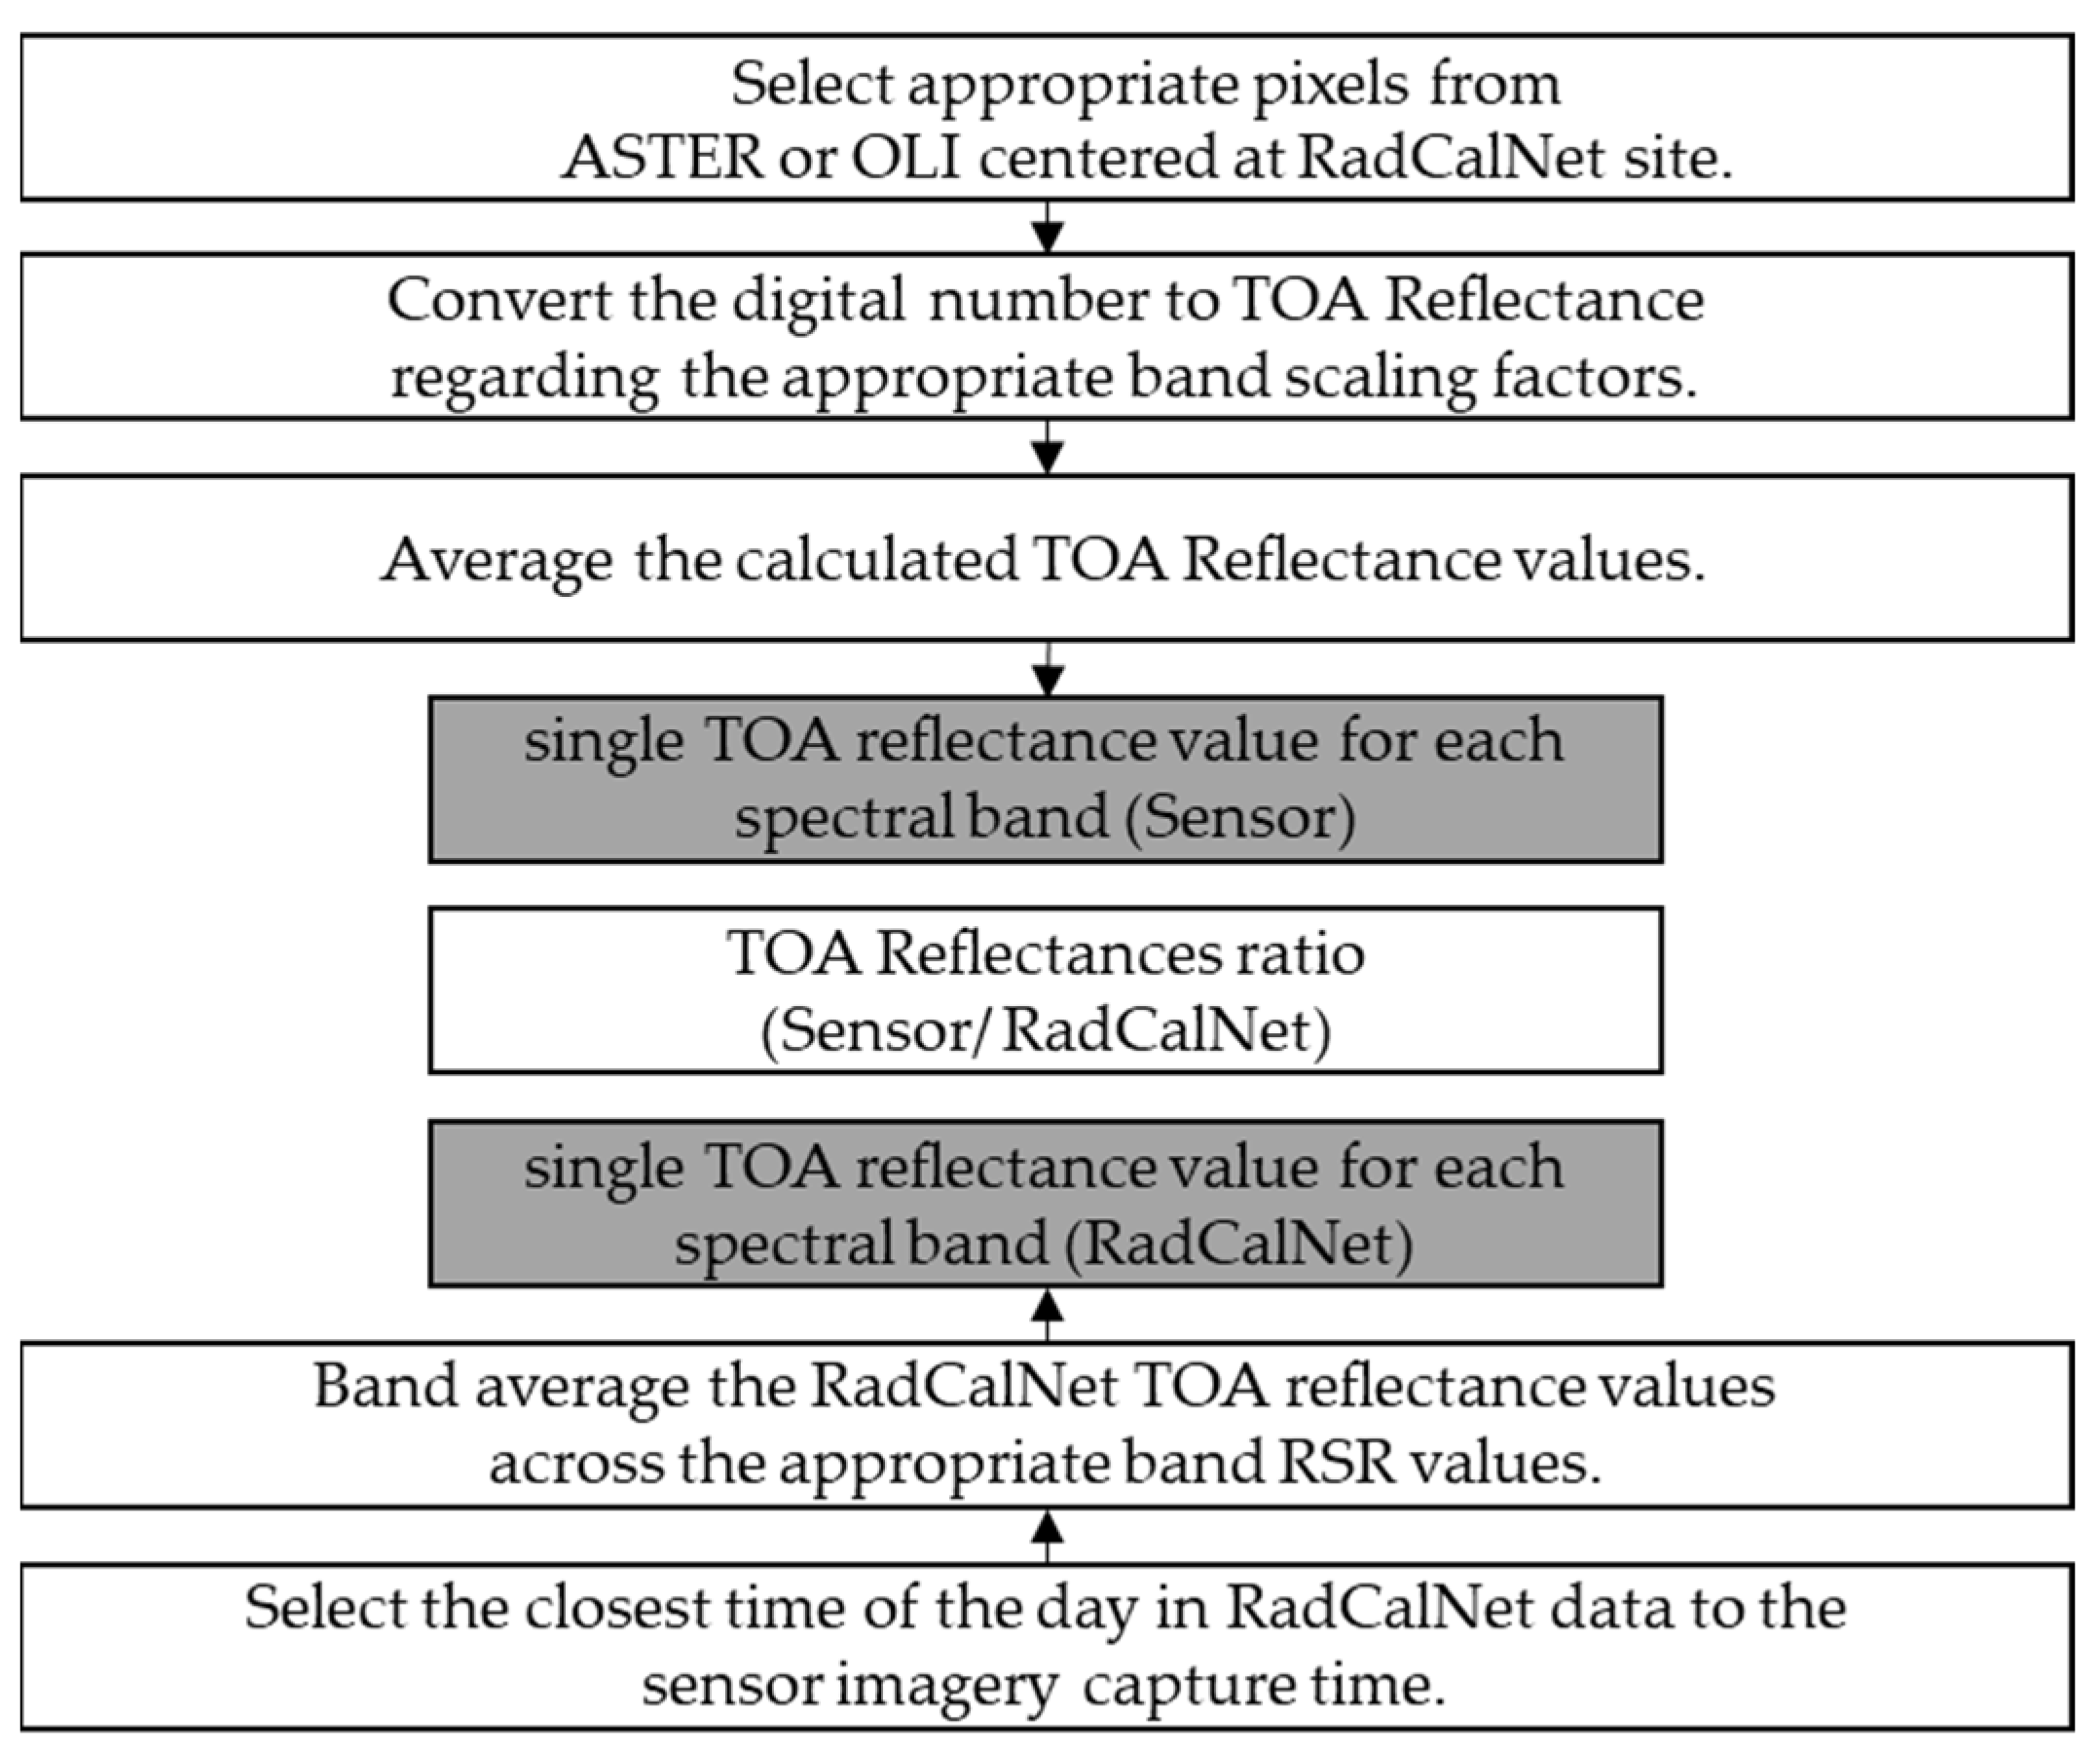
The calibration of a selected sensor is determined by comparing the image data from the sensor collected over the RadCalNet site to the band-averaged TOA reflectance from the RadCalNet processing closest in time to the sensor imagery. This comparison is presented by calculating the ratio of the TOA reflectance of the sensor to the TOA reflectance obtained from RadCalNet measurements.
The sensor pixels corresponding to the RadCalNet site are averaged and processed using conversion factors provided by the sensor team to determine the TOA reflectance for a given spectral band (as explained in Section 2.4). The spatial resolutions of L8 OLI, L9 OLI, and ASTER differ, with L8 OLI and L9 OLI having a pixel size of 30 m for the visible and near-infrared bands and ASTER having a pixel size of 15 m for the same spectral range.
Therefore, to cover the RVUS site, an ROI of 33 × 33 pixels is used for L8 OLI and L9 OLI, and an ROI of 67 × 67 pixels is used for ASTER. The ROIs are centered at the specified RadCalNet site coordinates for RVUS to ensure complete coverage of the site by remote sensing data. In the case of GONA, a selection of pixels located nearest to the central point of the disk is employed for the L8 OLI and L9 OLI and ASTER datasets. The values attributed to these pixels are then averaged, considering their relative proximity to the center of the disk. For Landsat data, typically, 9 pixels situated closest to the central point of the disk are taken into account when performing the averaging operation. However, for ASTER data, a larger set of 16 pixels, also located in close proximity to the center of the disk, is factored into the averaging process. The process generates a single TOA value for each spectral band which is compared to the corresponding RadCalNet TOA reflectance value.
By band averaging the RadCalNet TOA reflectance values across the RSR values shown in Figure 1 for both OLI and ASTER sensors at each data point, we account for spectral response variations between the two sensors as well as potential changes in the spectral characteristics of the test sites over time. Figure 5 shows the logic flowchart for comparing image data from the sensor collected over the RadCalNet site to the band-averaged TOA reflectance from the RadCalNet data.

2.4. Conversion of Digital Numbers to TOA Reflectance

Each pixel in an L8 OLI, L9 OLI, or ASTER image is represented by a digital number (DN) that must be converted to a TOA reflectance value based on formulations provided by the OLI and ASTER calibration teams. There is a two-step process for converting ASTER data into TOA reflectance. Step 1 converts DN values into TOA radiance using the following:
T O A R a d i a n c e = D N × M u l t i p l i c a t i v e S c a l i n g F a c t o r + A d d i t i v e S c a l i n g F a c t o r
The multiplicative scaling factor is a unitless number that converts raw DN values into radiance units, and the additive scaling factor is a bias correction factor. Radiance values are converted into TOA reflectance values using the following:
T O A R e f l e c t a n c e = ( π × T O A R a d i a n c e × d 2 ) / ( E S U N × c o s θ )
where d is the sun–earth distance, ESUN is the mean solar exoatmospheric irradiance for a given ASTER band, and θₛ is the solar zenith angle provided in the metadata. The values of ESUN(λ) are taken from WRC-based results recommended by the ASTER team and used in the determination of the ASTER surface reflectance data product [32].
The process for OLI data is more straightforward since the imagery DN is directly related to reflectance and the TOA reflectance is found using a single step:
T O A R e f l e c t a n c e = ( ( M × D N ) + L ) / c o s θ
where Mᵨ is the reflectance multiplicative scaling factor for the spectral band, and Lᵨ is the reflectance additive scaling factor for the spectral band.

2.5. Clear-Sky Scene Selection

Table 4 and Table 5 provide a detailed comparison of available matchups between clear-sky sensor images and RadCalNet data for the two test sites. Clear-sky conditions were determined based on the cloud percentage scores provided in the sensor metadata. The table shows the number of available data for Terra ASTER, Landsat 8 OLI, and Landsat 9 OLI. L8 OLI and L9 OLI data are obtained from the USGS Earth Explorer data portal, and this study uses the Collection 2 Level 1 precision terrain-corrected imagery (L1TP). The “Available” column shows the total number of available clear-sky matchups for each sensor. To clarify, “matchup” refers to the comparison of radiometric measurements obtained by L8 OLI, L9 OLI, and ASTER with those from RadCalNet when both sources have data available for the test site on the same day. The values in the tables are based on RVUS data dating back to 2013, when the RadCaTS became fully operational in its current configuration. Thus, there are no RadCalNet data available for ASTER between 1999 and 2013.
Notably, L8 OLI has the highest number of available matchups at 75 for RVUS and 49 for GONA, while ASTER has 50 and 43 for these respective sites. The lower number of available matchups for ASTER compared to L8 OLI is partly due to the fact that ASTER must be tasked to collect data for specific areas or targets, while L8 OLI is continuously acquiring data over the US. This means that L8 OLI has more opportunities to capture data over a wider range of targets and therefore has more matchups available for intercomparison with other sensors. The matchups for L9 OLI are far fewer due to its recent September 2021 launch.
One interesting point to consider is that the maximum number of points that would be available at either site would be approximately 26 matchups per year. Thus, the L8 OLI matchups indicate a success rate of approximately 30%. The reasons for which data may not have a matchup range from poor site conditions to anomalies in ground-based instrumentation, poor atmospheric conditions, or a lack of data from the on-orbit sensor. The success rate here is an excellent example as to the motivation of automated data at such sites as well as the networking of data from multiple sites.
To ensure higher accuracy, the difference in collection time from RadCalNet to the sensor being calibrated is as small as possible to reduce effects from surface and atmospheric conditions. Recall that RadCalNet data are provided at 30-min intervals; thus, the ideal situation is that an ASTER, L8 OLI, or L9 OLI collection should have less than a 15-min difference in time for cases in which the RadCalNet instrumentation is operational and atmospheric conditions are suitable for a calibration. The work here has expanded that limit to 30 min in order to include additional dates for which there is no full complement of RadCalNet TOA reflectance. This approach trades between the larger time difference introducing different atmospheric conditions and effects from changes in surface reflectance leading to higher uncertainties in the radiometric calibrations to having a greater number of data sets.
Once a matchup has been found between the sensor and RadCalNet, the sensor and RadCalNet data are evaluated to determine the quality of the data and whether to include the data set in the calibration work. The four right-hand columns of Table 3 and Table 4 show the outcomes of this quality assessment to filter the matchups based on various factors that can affect the accuracy of radiometric intercomparison. The “site mismatch” column indicates the number of cases in which the sensor imagery could not readily be matched with a RadCalNet test site. For ASTER, there are 7 such cases (~15% of available matchups) in RVUS, while neither L8 OLI nor L9 OLI have this issue. All seven ASTER instances corresponded to cases in which the ASTER VNIR camera was pointed at a large off-nadir angle. There are far fewer occurrences of site mismatches for GONA, with only one instance for ASTER and none for L8 OLI and L9 OLI.
The “anomalous condition” column indicates the count of matchups in which the atmospheric conditions at RadCalNet sites were flagged as anomalous by the site owners or when an anomaly in surface conditions occurred. An anomaly in surface conditions could result in the site owner not deriving and providing BOA surface data as they may not meet the processing quality assurance metric. These anomalies could be related to atmospheric parameters such as pressure, temperature, water vapor, ozone, aerosol optical depth, and the aerosol Angstrom coefficient or are flagged by the RVUS site operator based on their assessment of the surface conditions during the matchup. For ASTER, L8 OLI, and L9 OLI, 20%, 20%, and 13% of available matchups were affected by an anomalous atmosphere, respectively, at RVUS. These numbers are significantly lower at GONA, reflecting the differences in quality assessments (QAs) at the sites.
Finally, the “Good” column shows the number of data sets available after applying the filters that are used here and for which it is expected that there should be suitable absolute uncertainties for the absolute radiometric evaluation of ASTER, L8 OLI, and L9 OLI. RVUS has 33 (66% of available matchups), 60 (80% of available matchups), and 7 (87% of available matchups) data sets that were considered “good” for ASTER L8 OLI, and L9 OLI, respectively. The values for GONA for ASTER, L8 OLI, and L9 OLI, are 93%, 94%, and 100%, respectively.

3. Results

We use the good data selected by the above scene selection criteria to compare the TOA reflectances of satellite images and TOA reflectances of ground site measurements. The results are shown separately for the two sites, for all three sensors, and for RadCalNet data that are available from RVUS and GONA.

3.1. Railroad Valley Playa Site

Figure 6 shows the ratio of the TOA reflectance of the sensor to the RadCalNet TOA reflectance for the two versions of ASTER radiometric data products and the L8 OLI and L9 OLI TOA reflectance products for RVUS. In the figure, the top graph displays the results for the green band, while the middle and bottom graphs show the results for the red and near-infrared bands, respectively. A ratio of unity corresponds to a case in which the reported TOA reflectance from the imagery agrees with the predicted values from RadCalNet.
To better understand the consistency of the TOA reflectance ratios across the spectral bands and for the two sensors, the temporal average and standard deviation values are calculated for the ratios. The temporal average and standard deviation provide a quantitative way to compare the results from the two sensors to evaluate their radiometric consistency and stability. Figure 7 presents the results for the two versions of ASTER data and the L8 OLI and L9 OLI products over RVUS. The data used for the averages and standard deviations are based on the ratios provided in Figure 6. Figure 7a shows the results between ASTER and L8 OLI. Figure 7b shows the intercomparison results between ASTER and L9 OLI for the ratios retrieved after November 2021.
Knowledge of the absolute radiometric uncertainties for both the RadCalNet and the ASTER and OLI sensor data allows for a combined uncertainty to be determined for the sensor-to-RadCalNet ratio. The absolute radiometric uncertainty (k = 1) values for the ASTER and OLI data are ~3% for the VNIR bands [33]. The absolute radiometric uncertainty of the RadCalNet TOA reflectance is reported at each wavelength for each RadCalNet data point. Assuming that the RadCalNet and sensor uncertainties are uncorrelated allows for the combined uncertainty, u(y) to be calculated as follows [34]:
u ( y ) = ( u / s ) 2 + ( u / r ) 2 × y
where uₛ is the absolute standard uncertainty of the sensors, uᵣ is the absolute standard uncertainty of the TOA reflectance results of RadCalNet, and y is the TOA reflectance ratio.
A technique called “double ratios” can be used to mitigate possible biases in the intercomparison results between sensors [35]. The method in this case involves dividing the average ratios shown in Figure 7 to reduce the impact of systematic effects from using the RadCalNet data sets as a reference. Figure 8 shows the double-ratio results for the ASTER to OLI pairs. Figure 8a shows a comparison between ASTER and L8 OLI, and Figure 7b shows the ASTER to L9 OLI case. The results are shown for the average wavelengths of the ASTER and OLI bands used in the double ratio. The combined standard uncertainty for the double ratio is computed in a similar fashion as Equation (4). A double ratio of one implies agreement between the two sensors being compared.

3.2. Gobabeb Site

Figure 9 illustrates the ratio between the sensor’s TOA reflectance and the RadCalNet TOA reflectance values for ASTER v3.1, L8 OLI, and L9 OLI at the GONA site. We have omitted the results for ASTER version 3.0 as the differences resulting from the upgrade in the ASTER products are nearly identical to the results shown above in the RVUS site analysis. The upper graph in Figure 9 presents the findings for the green band, while the middle and lower graphs depict the outcomes for the red and near-infrared bands, respectively.
Figure 10a shows the intercomparison results between ASTER and L8 OLI for GONA, which are similar to those shown in Figure 7a for RVUS. The intercomparison results between ASTER and L8 OLI are for the ratios retrieved after April 2019. Figure 10b shows the same intercomparison between ASTER and L9 OLI for the ratios retrieved from November 2021 to August 2023.

4. Discussion

In this section, we analyze the results obtained from Railroad Valley Playa and Gobabeb. Our discussion focuses on the temporal behavior of the ratios, temporal averages, and the double ratios provided.

4.1. Railroad Valley Playa

The first item of note is that the agreement between ASTER and L8 OLI is qualitatively quite good. Both ASTER and L8 OLI show similar temporal behaviors, indicating a likely site-dependent effect on the TOA ratio which, though well within the absolute uncertainties of the retrievals, is clearly evident in all three of the sensors shown. There are challenges in comparing ASTER and L9 OLI because of the lack of ASTER data points at RVUS. More disappointing is the fact that there is only one ASTER data set during the first nine months of L9 OLI data when the orbits of ASTER and L9 OLI were coincident (though with a difference in crossing time). There are expected to be additional data points available from ASTER after October 2022 from both RVUS and GONA once the ASTER team completes the reprocessing of data that account for changes in orbital altitude due to the orbit-lowering maneuver.
In Figure 6, the difference between the two ASTER versions is particularly noticeable for the red band, in which version 3.1 produces higher TOA reflectance values, resulting in higher ratios compared to version 3. This indicates that the upgrade from version 3 to version 3.1 only affects the red band and that it is in the interest of users to rely on the Version 3.1 products.
As mentioned above, Figure 6 shows that for RVUS, none of the sensors indicate a large difference in the comparison of their radiometric responses to the RadCalNet results. The figure does indicate that there are multiple changes similar to those described above in which the ratio versus time shows consistent behavior across the sensors, indicating a possible RadCalNet-related effect on the retrieved ratios. For example, the ASTER, L8 OLI, and L9 OLI TOA reflectances show ratios >1 in August and September of 2018 and <1 in September and October of 2020. The effect is also consistent across all three spectral band regions, suggesting that environmental factors at the RVUS test site such as wildfire smoke or land-cover alterations may be affecting the model predictions for the RadCalNet TOA reflectance during these time periods. Further investigation is underway to assess possible causes. Additionally, it should be noted that for both sensors, there are instances in which the TOA reflectance values from the sensors differ from the ground measurements by more than 4%, which is a typical k = 1 absolute uncertainty reported by RadCalNet for the RVUS site [31].
Figure 7 shows that the reflectance ratios for the green and near-infrared bands are similar between ASTER v3.0 and ASTER v3.1, while the ratio for the red band is higher for ASTER v3.1. This suggests that the upgrade from version 3 to 3.1 had a larger impact on the red band than the green or near-infrared bands in this portion of the ASTER data record, resulting in higher predicted TOA reflectances in this band for the newer version.
Another feature shown in Figure 7 is the difference in center wavelengths between ASTER and the two OLI sensors. One advantage to the RadCalNet-based comparison is that the evaluation can maintain the sensor band information rather than simply comparing green bands, red bands, and NIR bands. Furthermore, it even becomes possible to compare across the bands within and across sensors. The overall conclusion is that all bands of all sensors agree with each other to well within the combined absolute uncertainties of the sensors and RadCalNet.
The results shown in Figure 7 indicate that the reflectance ratios are comparable within their standard deviations. Moreover, the average ratios in all cases for the two sensors are within 4% of unity, and this is well within the combined RadCalNet and sensor absolute radiometric uncertainties. A key result is that the ASTER (both v3.0 and v3.1) and L8 OLI TOA data products, based on their absolute radiometric calibrations, agree with each other in comparable bands to within the combined uncertainties. The agreement is also true for comparisons with bands across the full spectral region. That is, one can conclude that all the matching L8 OLI spectral bands are consistent with all the ASTER spectral bands. Such a result is critical for applications that would use a combination of ASTER and L8 OLI spectral data.
Figure 7b shows the L9 OLI and ASTER results, in which similar outcomes were obtained. The reflectance ratios within the examined spectral bands demonstrate a remarkable similarity, maintaining alignment within standard deviations. Notably, the mean ratio values for both L9 OLI and ASTER sensors exhibit minimal deviation from unity, with differences contained well within the comprehensive realm of combined radiometric uncertainties. Thise outcome is consistent across the entirety of spectral bands explored, thereby reinforcing the robustness of the observations. This congruence in spectral consistency bears profound implications for applications necessitating the harmonious integration of ASTER and L9 OLI spectral data, providing a reliable foundation for cross-sensor analyses.
In Figure 8, it is evident that the double-ratio intercomparison results exhibit a high degree of agreement. The agreement observed within Figure 8 is robust as it falls comfortably within the combined standard uncertainties of this intercomparison. This level of concordance among the data points reinforces the reliability and consistency of the double-ratio intercomparison results, thereby enhancing the overall confidence in the findings presented in this study.
To assess the impact of the ASTER orbit-lowering maneuver, the dataset presented in Figure 6 was restricted to data collected after October 2022. In Figure 11, a comparison is made between the performances of ASTER, L8 OLI, and L9 OLI during this specific timeframe. The findings indicate that the radiometric calibration of the ASTER sensor has remained consistent despite the orbit-lowering maneuver conducted in October 2022.

4.2. Gobabeb Site

In Figure 9, we observe significant site-based effects at GONA. These effects are evident in the ratios produced by all three sensors, which exhibit similar trends over time. Fortunately, our results demonstrate a high level of agreement among the three sensors, considering the combined uncertainties stemming from sensor calibration and RadCalNet-associated uncertainties.
Figure 9 also highlights a consistent pattern in the ratio-versus-time trends specifically between the ASTER and OLI sensors within the GONA region. Notably, for most recorded dates, the ASTER sensor consistently yields higher ratio values when compared to the OLI sensor. This pattern holds true across all three spectral bands we examine, with the difference being particularly pronounced in the green band.
In Figure 9, we present the ratios calculated using top-of-atmosphere (TOA) reflectance values obtained from RadCalNet. These reflectance values, which serve as the denominator for the ratios displayed in Figure 9, are also separately illustrated in Figure 12. Figure 12 specifically focuses on the period from 2019 to 2023, during which there was a modification in the tasking of the ASTER sensor to capture more frequent images of the GONA site.
The TOA reflectance values derived from RadCalNet for the green and red bands demonstrate a reasonable level of consistency between the ASTER and L8 OLI matchup dates. Specifically, the average reflectance values, as depicted in Figure 12, are 0.23 for the red band and 0.31 for the green band, and these values are consistent for both sensors.
However, an interesting observation emerges when we consider the NIR (near-infrared) band. Notably, the RadCalNet-derived TOA reflectances for the L8 OLI matchup dates consistently exceed those of the ASTER matchup dates in this band. This observation aligns with what we see in Figure 4, in which the difference in reflectance is attributed to a combination of spectrally varying atmospheric and surface effects. These effects are compounded by the spectral differences between the sensors, with ASTER having a broader spectral response and a shorter central wavelength. The root cause of these differences is under investigation.
In Figure 13, we present the numerator values used to calculate the ratios displayed in Figure 9. These numerator values are extracted from the sensor imagery and correspond to the matchup dates of ASTER-GONA and L8 OLI-GONA.
Figure 13 illustrates a consistent trend in which ASTER imagery consistently yields higher TOA reflectance values than those obtained from L8 OLI, particularly in the red and green bands. Specifically, the average TOA reflectance for the green band is 0.23 for L8 OLI, while it is slightly higher at 0.24 for ASTER.
The findings in Figure 12 and Figure 13 corroborate the observations made in Figure 9, providing further evidence of the effects we have discussed.
Figure 14 presents histogram distributions based on the data from Figure 13, including a similar histogram generated for the RVUS site. Notably, the reflectance histograms for the green and red bands of both L8 OLI and ASTER display a remarkable degree of similarity. Furthermore, the NIR histogram exhibits a pattern akin to that in Figure 4, as one would expect given the dominance of surface reflectance effects over TOA reflectance, particularly for sites as bright as GONA and RVUS.
However, a striking contrast emerges in the green and red bands of the GONA site, where ASTER consistently records higher reflectance values compared to L8 OLI. This divergence in GONA contradicts the reflectance histograms obtained from RadCalNet, as illustrated in Figure 4 for GONA. The underlying cause of this intriguing spectral behavior between the OLI sensors and ASTER at GONA, which differs from the RVUS site, remains unclear. Ongoing investigations are focused on unraveling this effect through a combination of data from other sensors and a deeper exploration of atmospheric distinctions between the two sites. For instance, it is noteworthy that the GONA site is situated near sea level, while the RVUS site is at an elevation of 1435 m, which may provide valuable insights into these observations.
Figure 10a reveals that when using GONA as a common reference, the reflectance ratios between L8 OLI and ASTER are comparable within a standard deviation for the red and NIR bands but differ in the green band by more than one standard deviation. In addition, the NIR band of L8 OLI does not agree within one standard deviation with the green and red bands of ASTER. Figure 10b shows similar results between the L9 OLI and ASTER data except that the smaller deviation in the L9 OLI results at GONA leads to a more substantial difference. L9 OLI’s mean ratio values exhibit minimal deviation from unity, while those for ASTER deviate from unity by approximately 2% to 6%. This highlights a noticeable disagreement in absolute radiometric calibrations between the Landsat 9 OLI and Terra ASTER sensors when employing GONA as the common reference, but it is still within the combined uncertainties at a 95% confidence interval.

5. Conclusions and Future Work

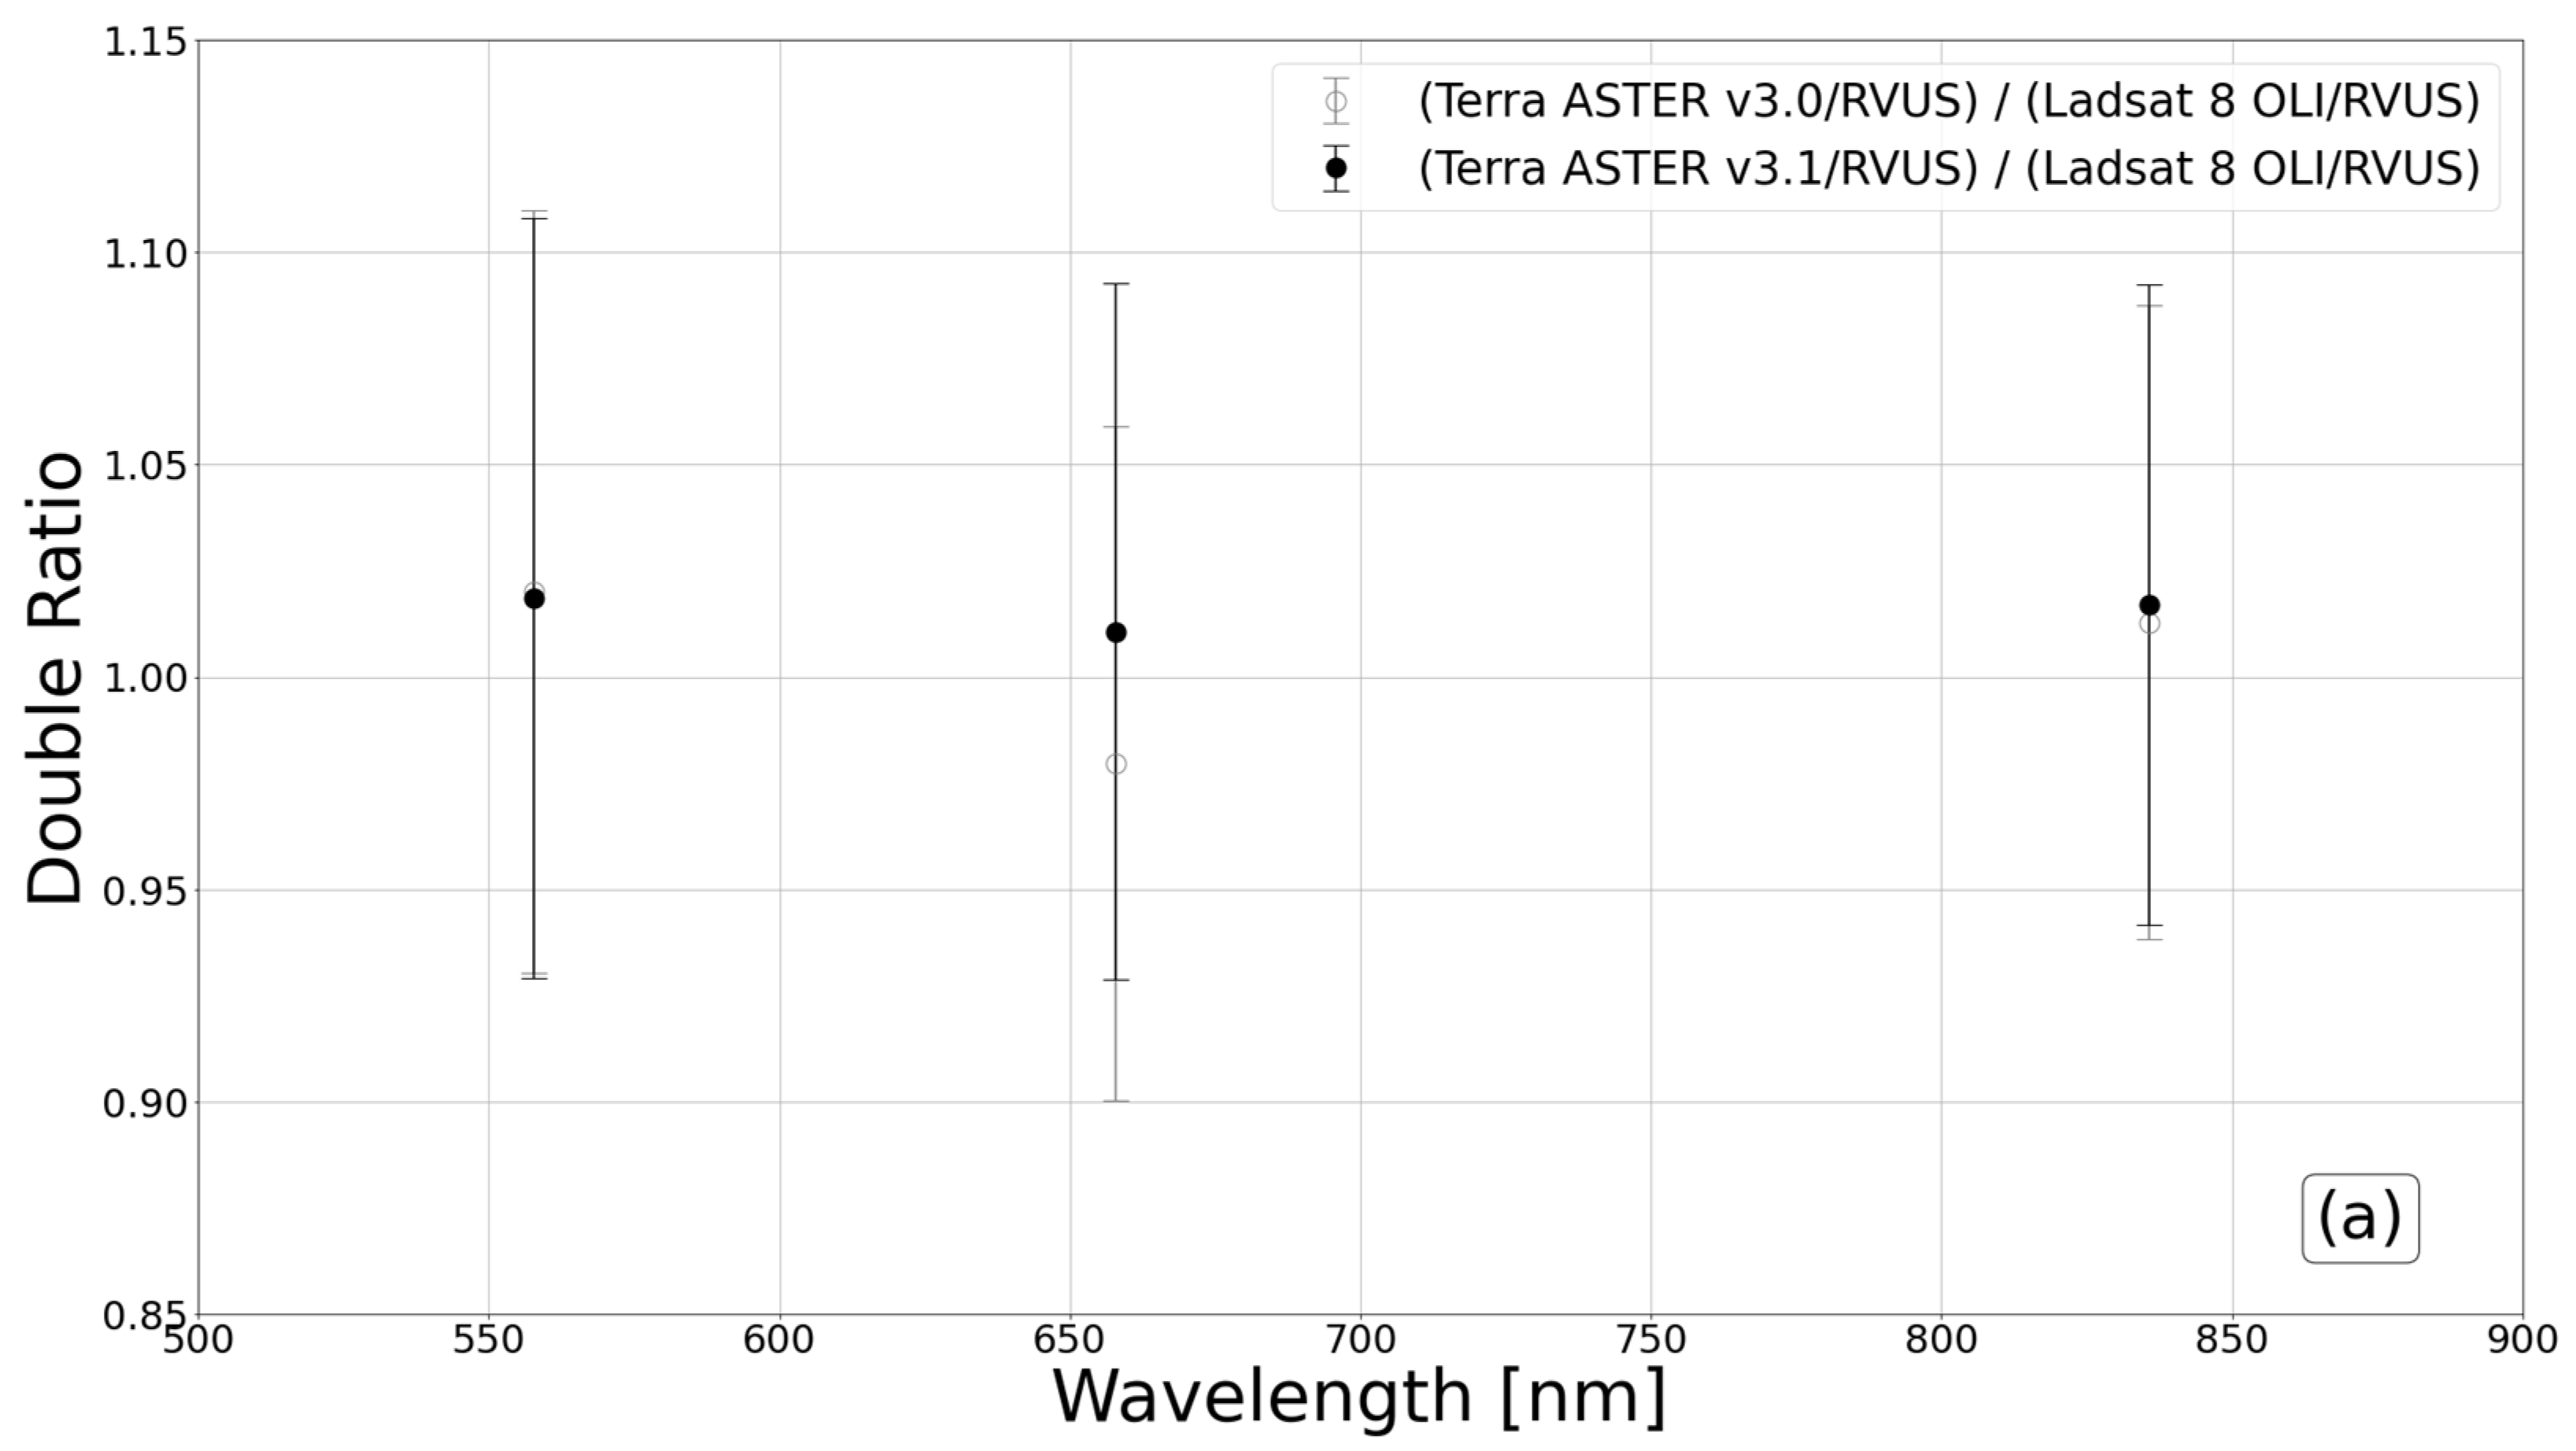
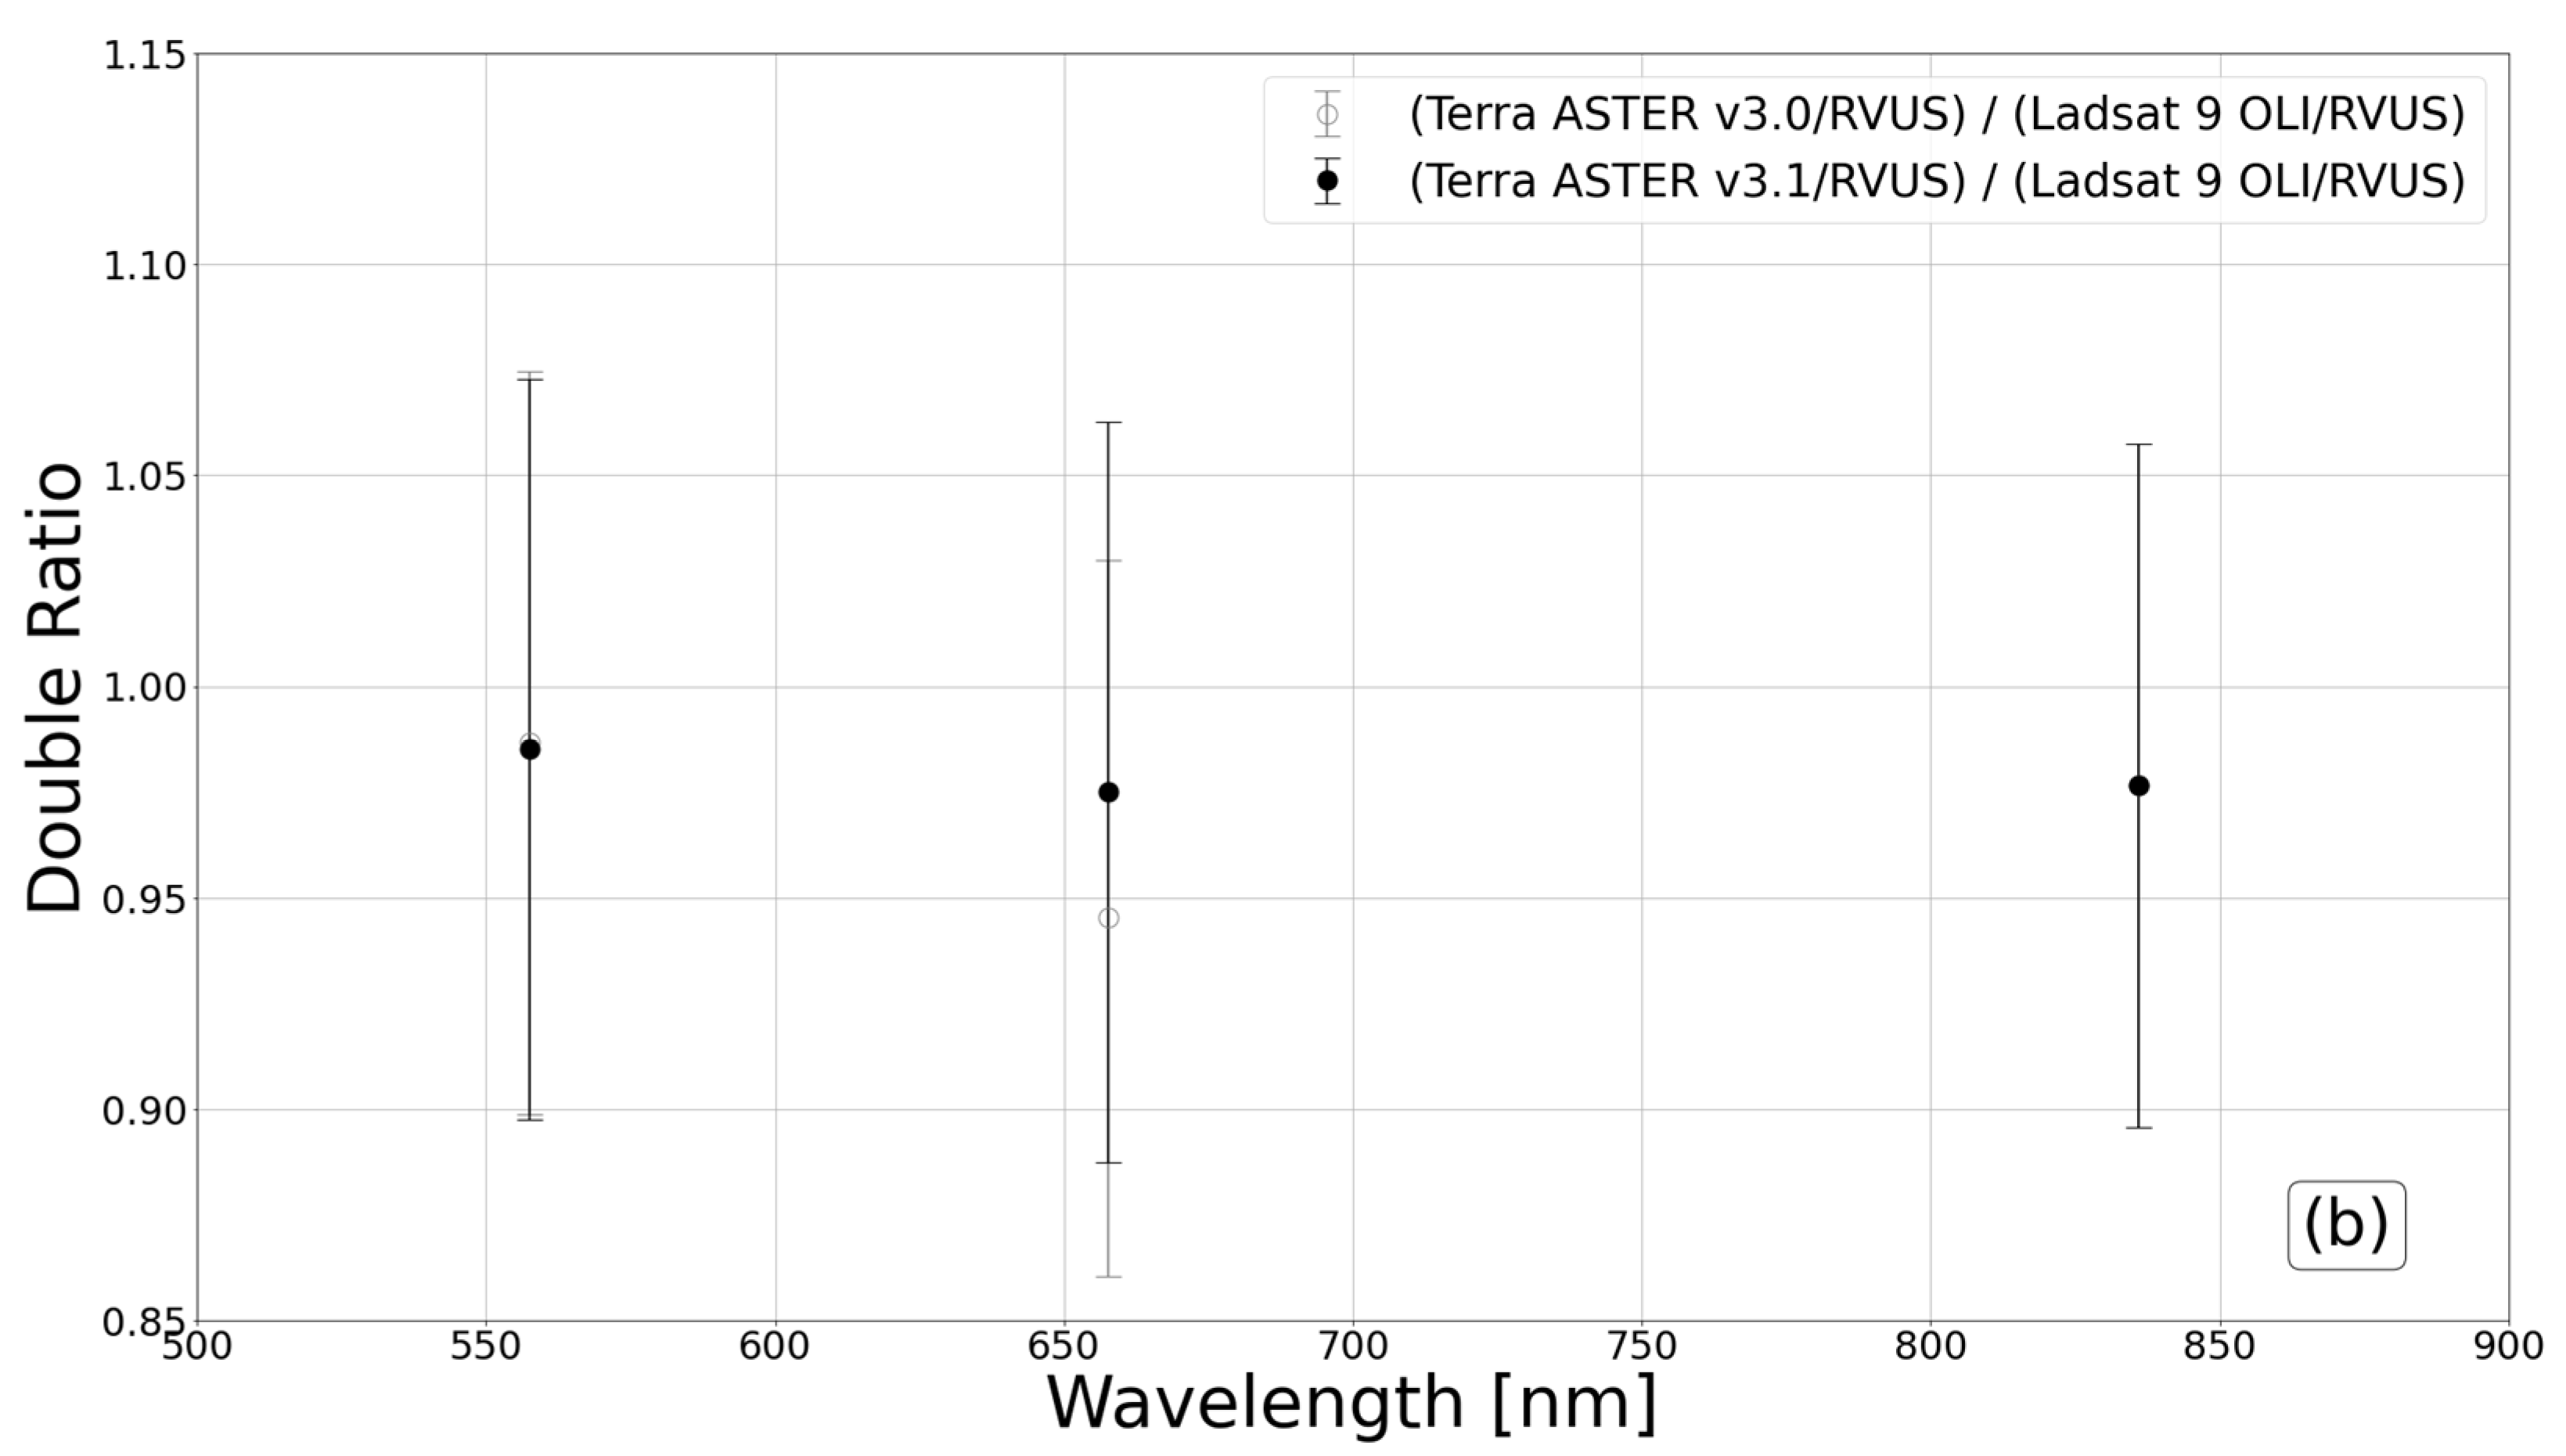
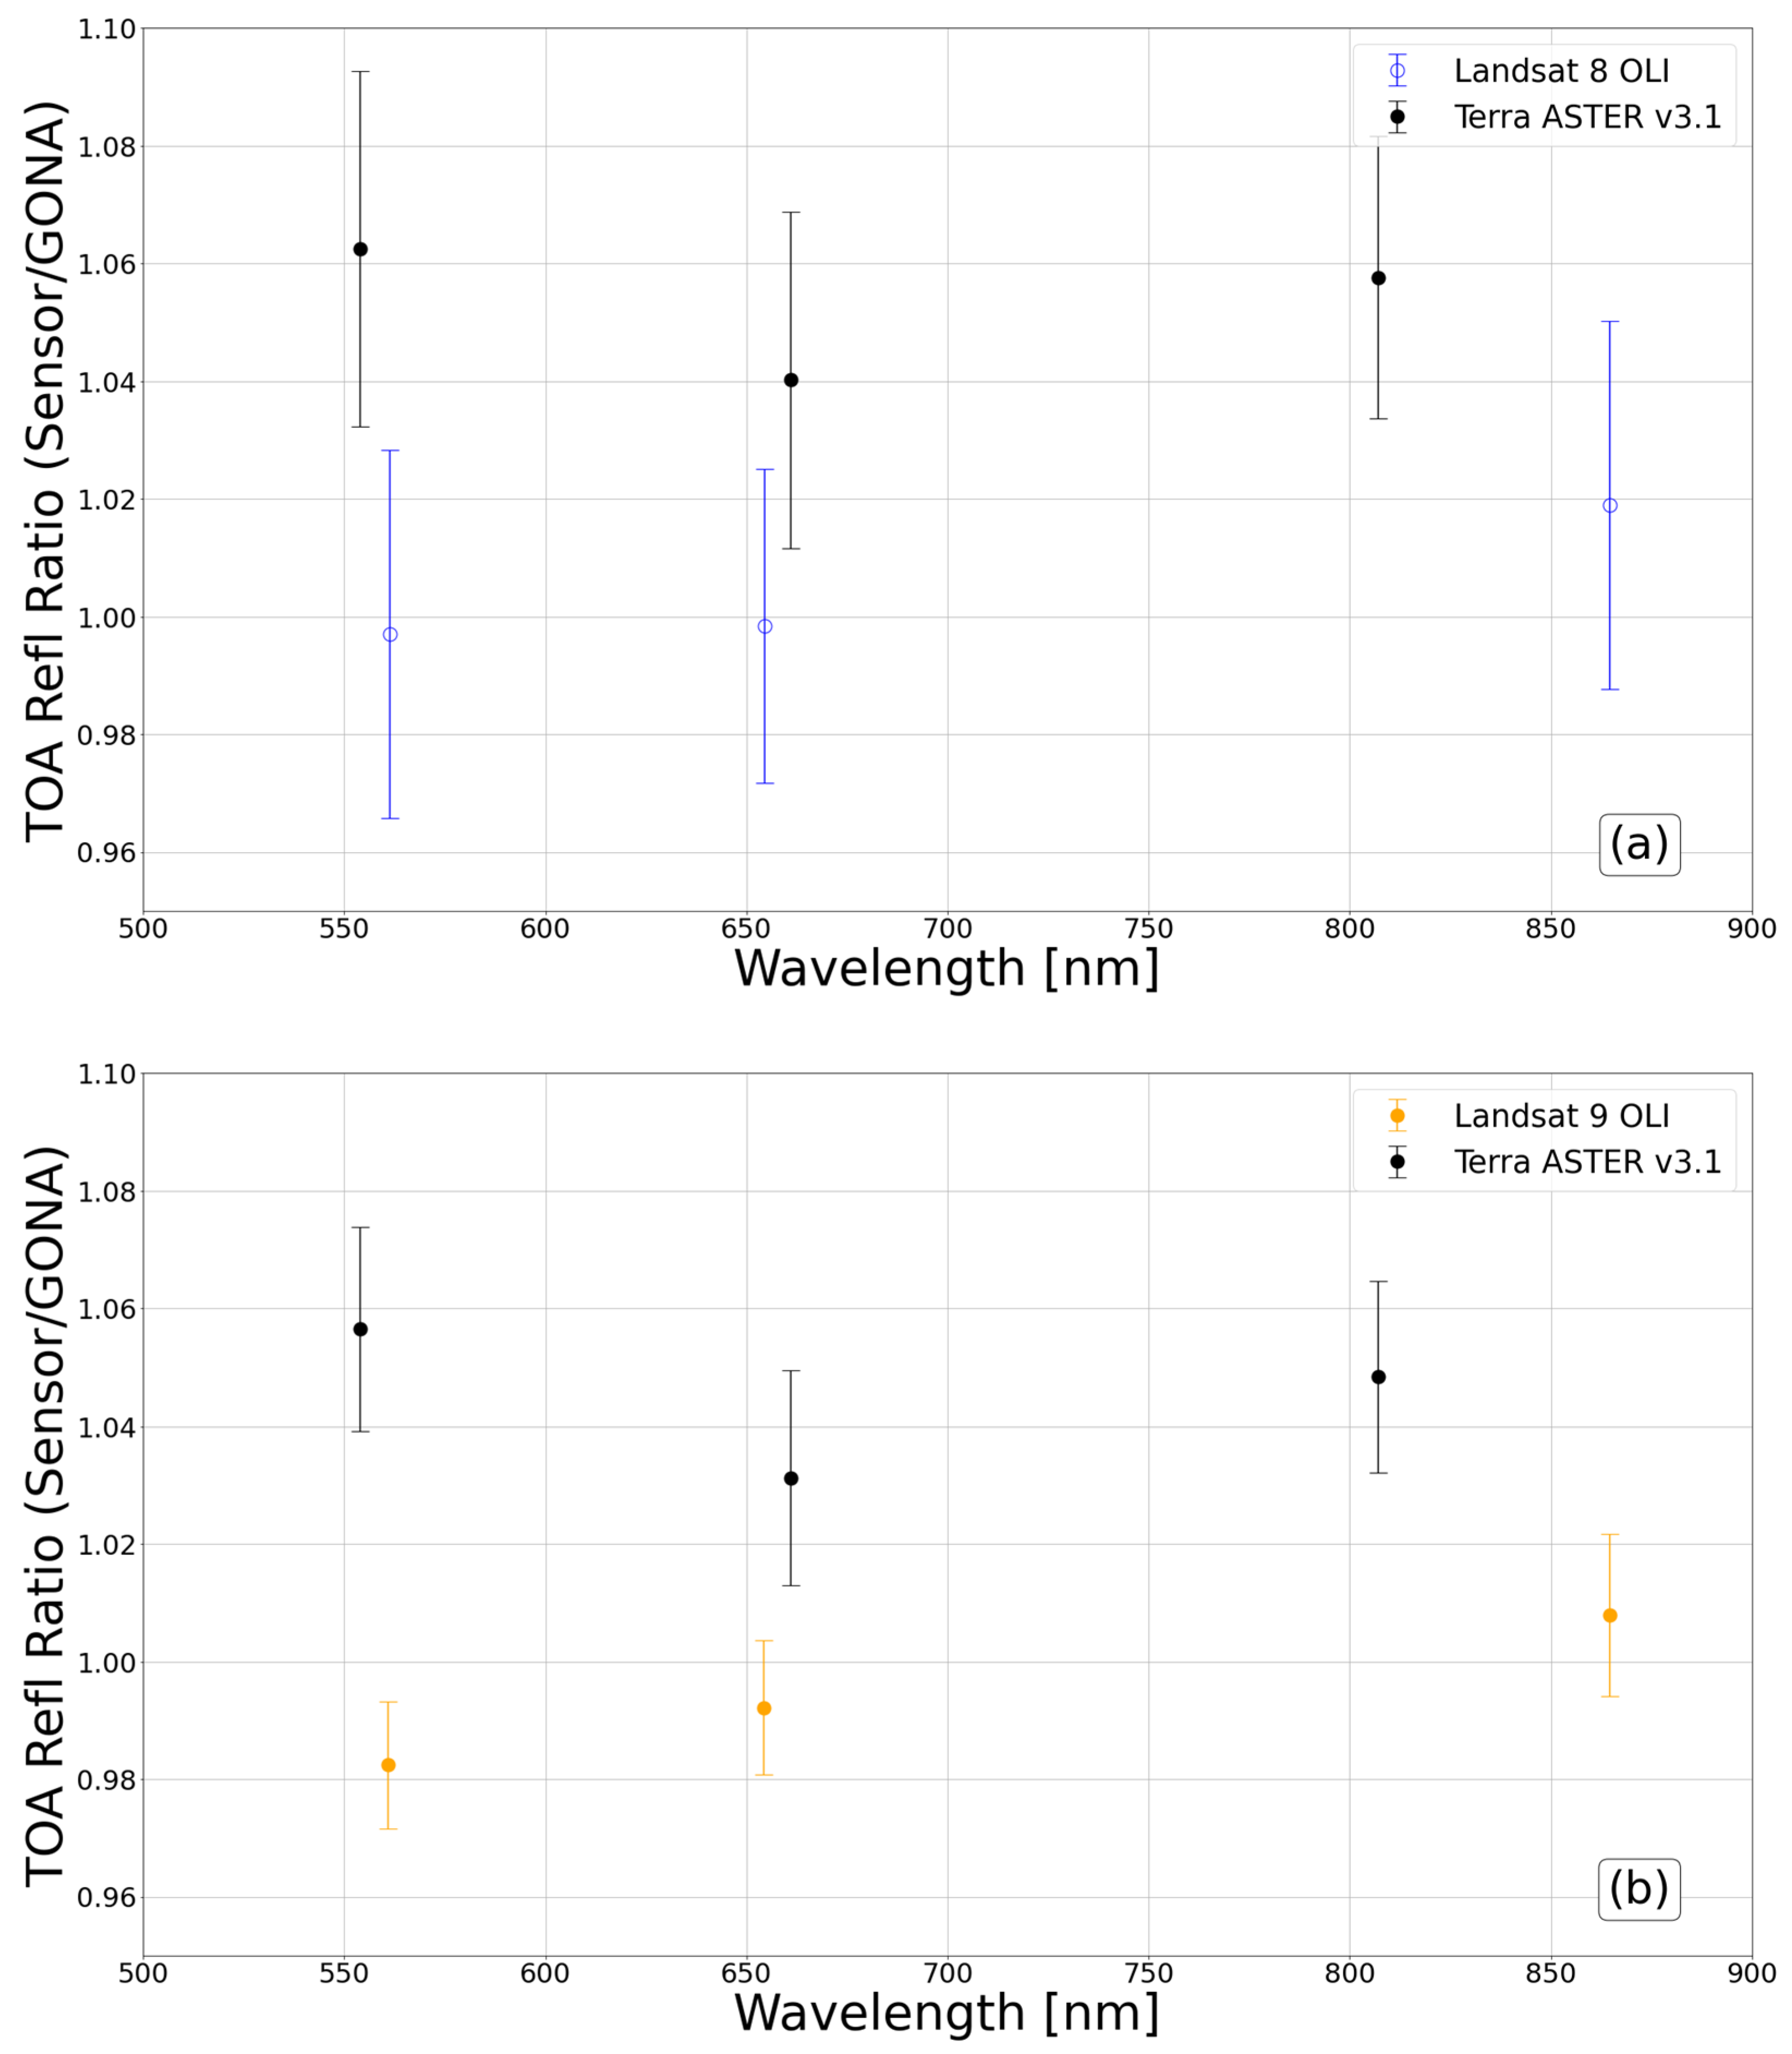
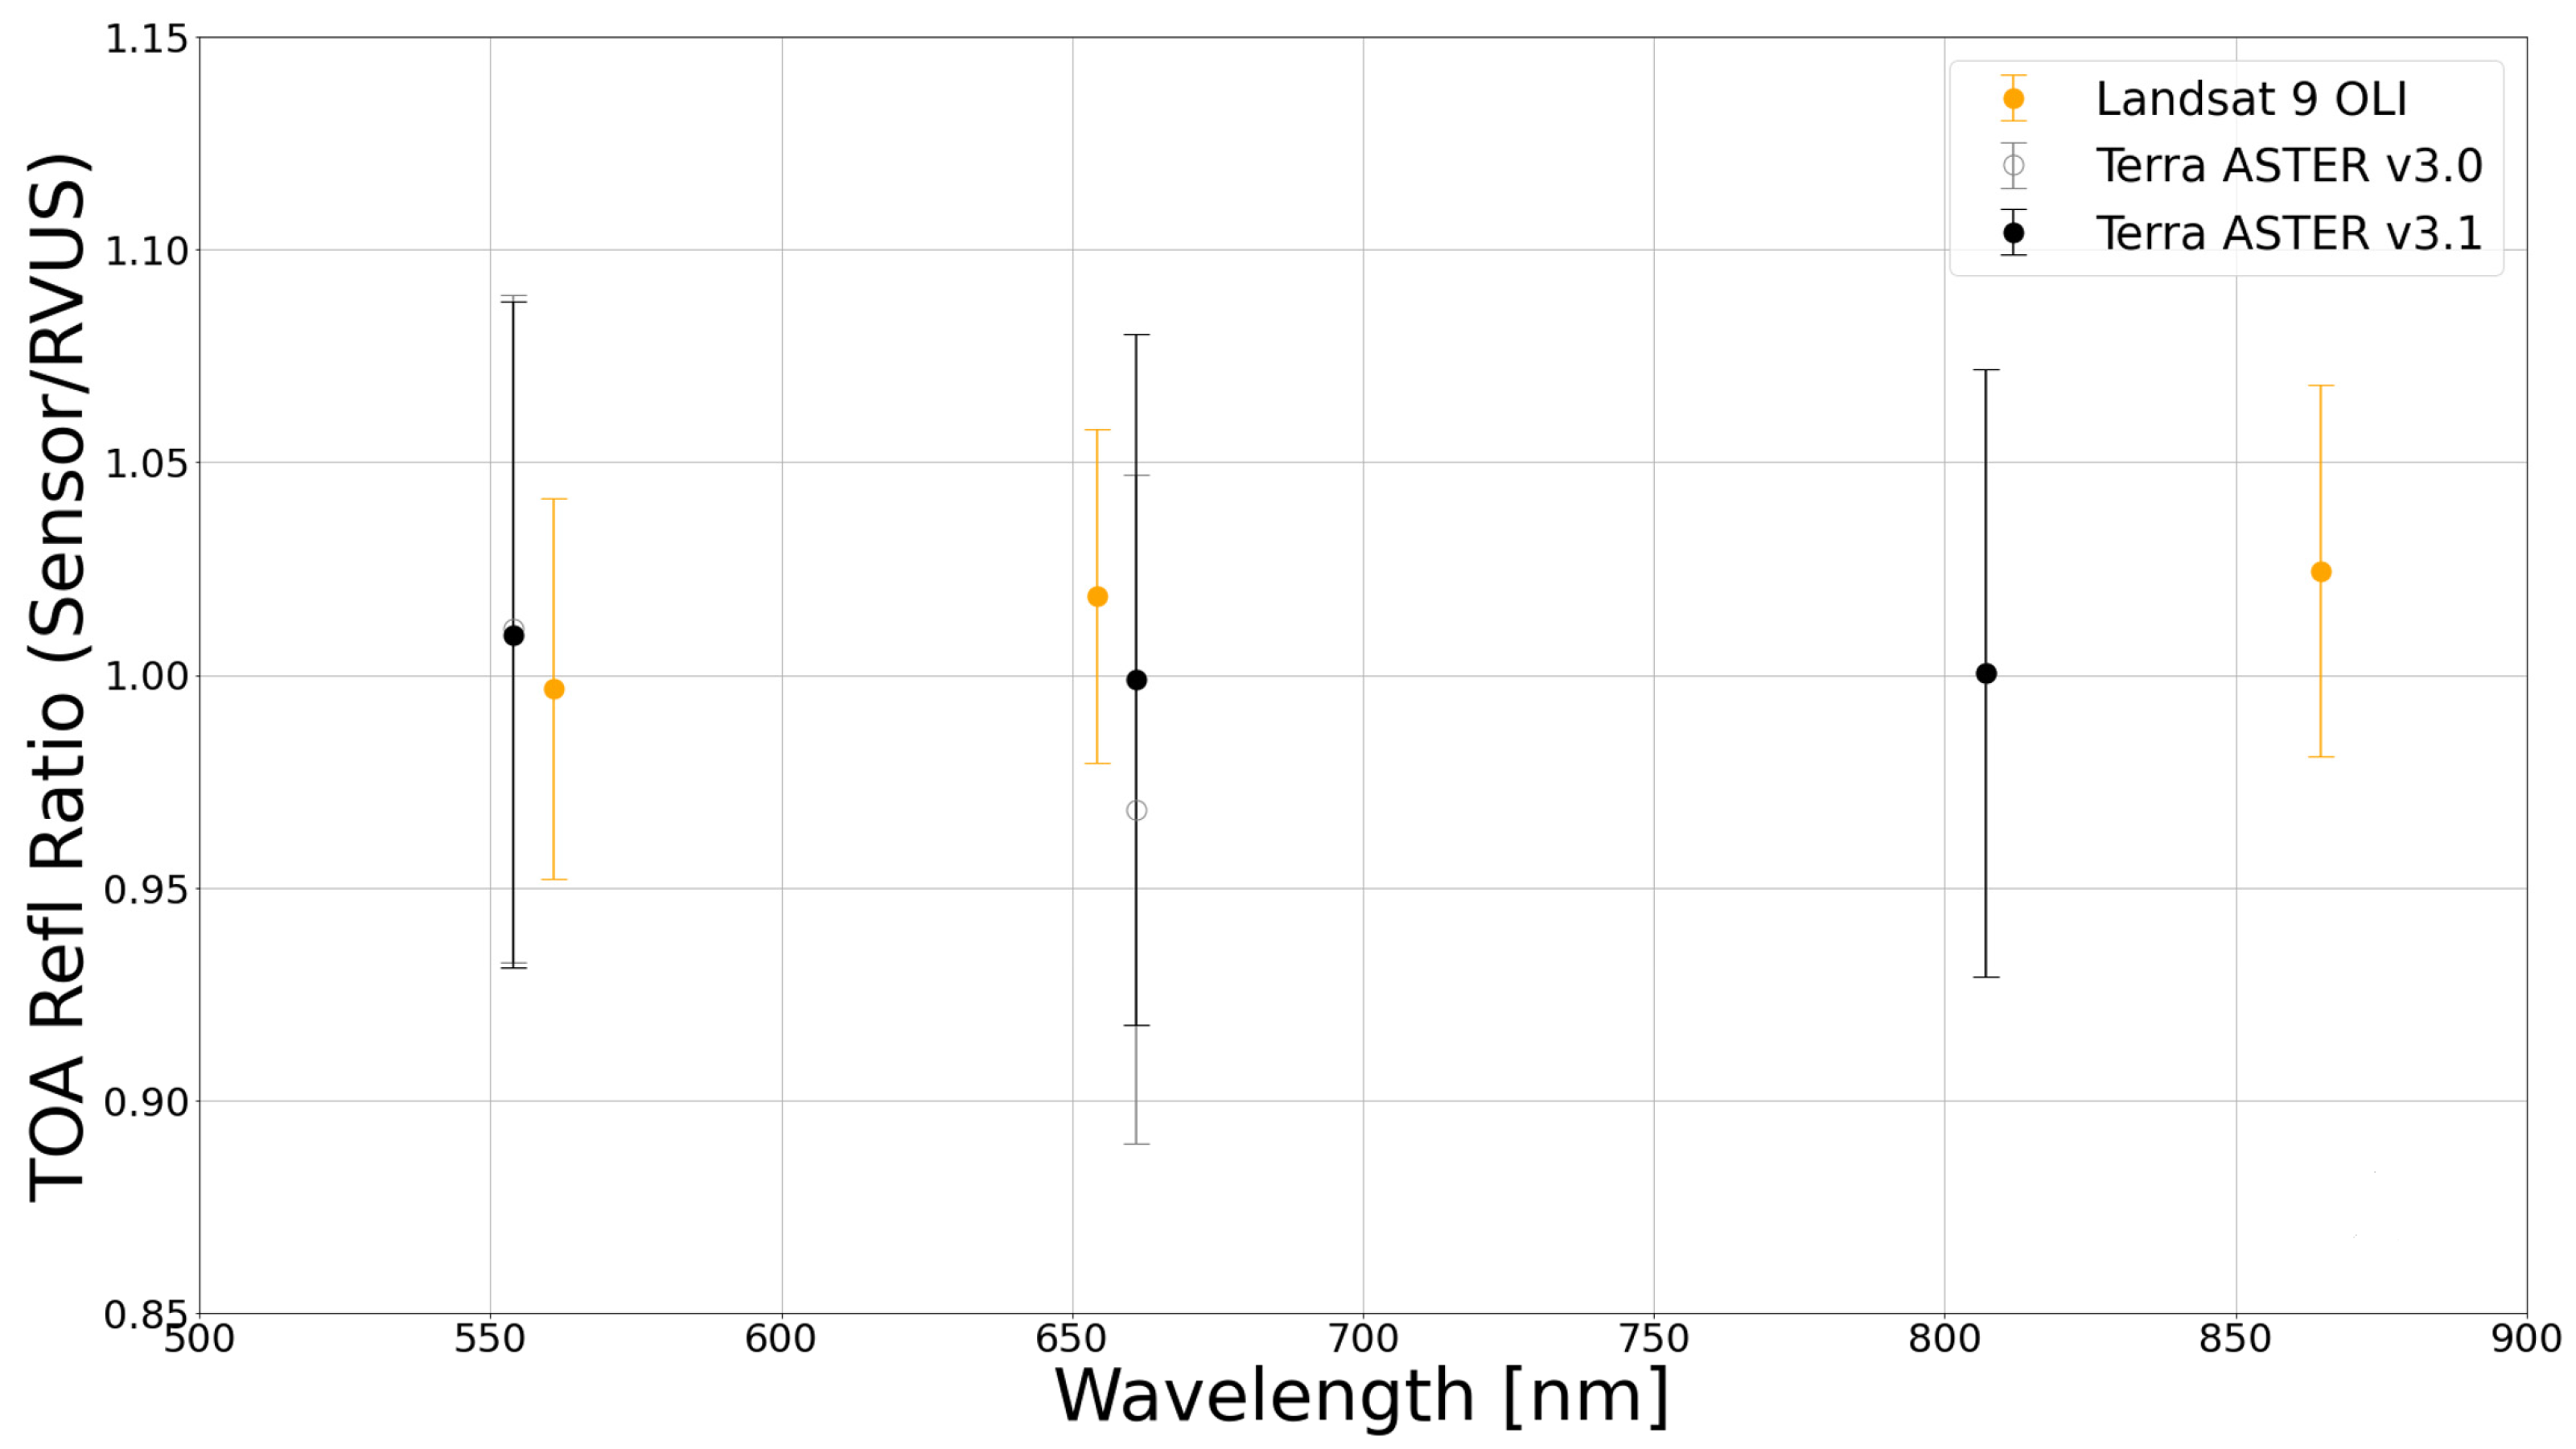
The SI-traceable uncertainties of RadCalNet data products allow the TOA reflectances computed by ASTER and L9 OLI to be compared to a standardized and traceable calibration reference. The intercomparison results show that both ASTER and OLI agree with RadCalNet to well within the combined absolute uncertainties of the sensor and the test site data. One important additional result is that this work confirms that the Railroad Valley Playa and Gobabeb RadCalNet sites are suitable for use with sensors with a spatial resolution as small as 15 m. Further work is underway to understand the different behaviors of the ASTER sensor between the GONA and RVUS sites.
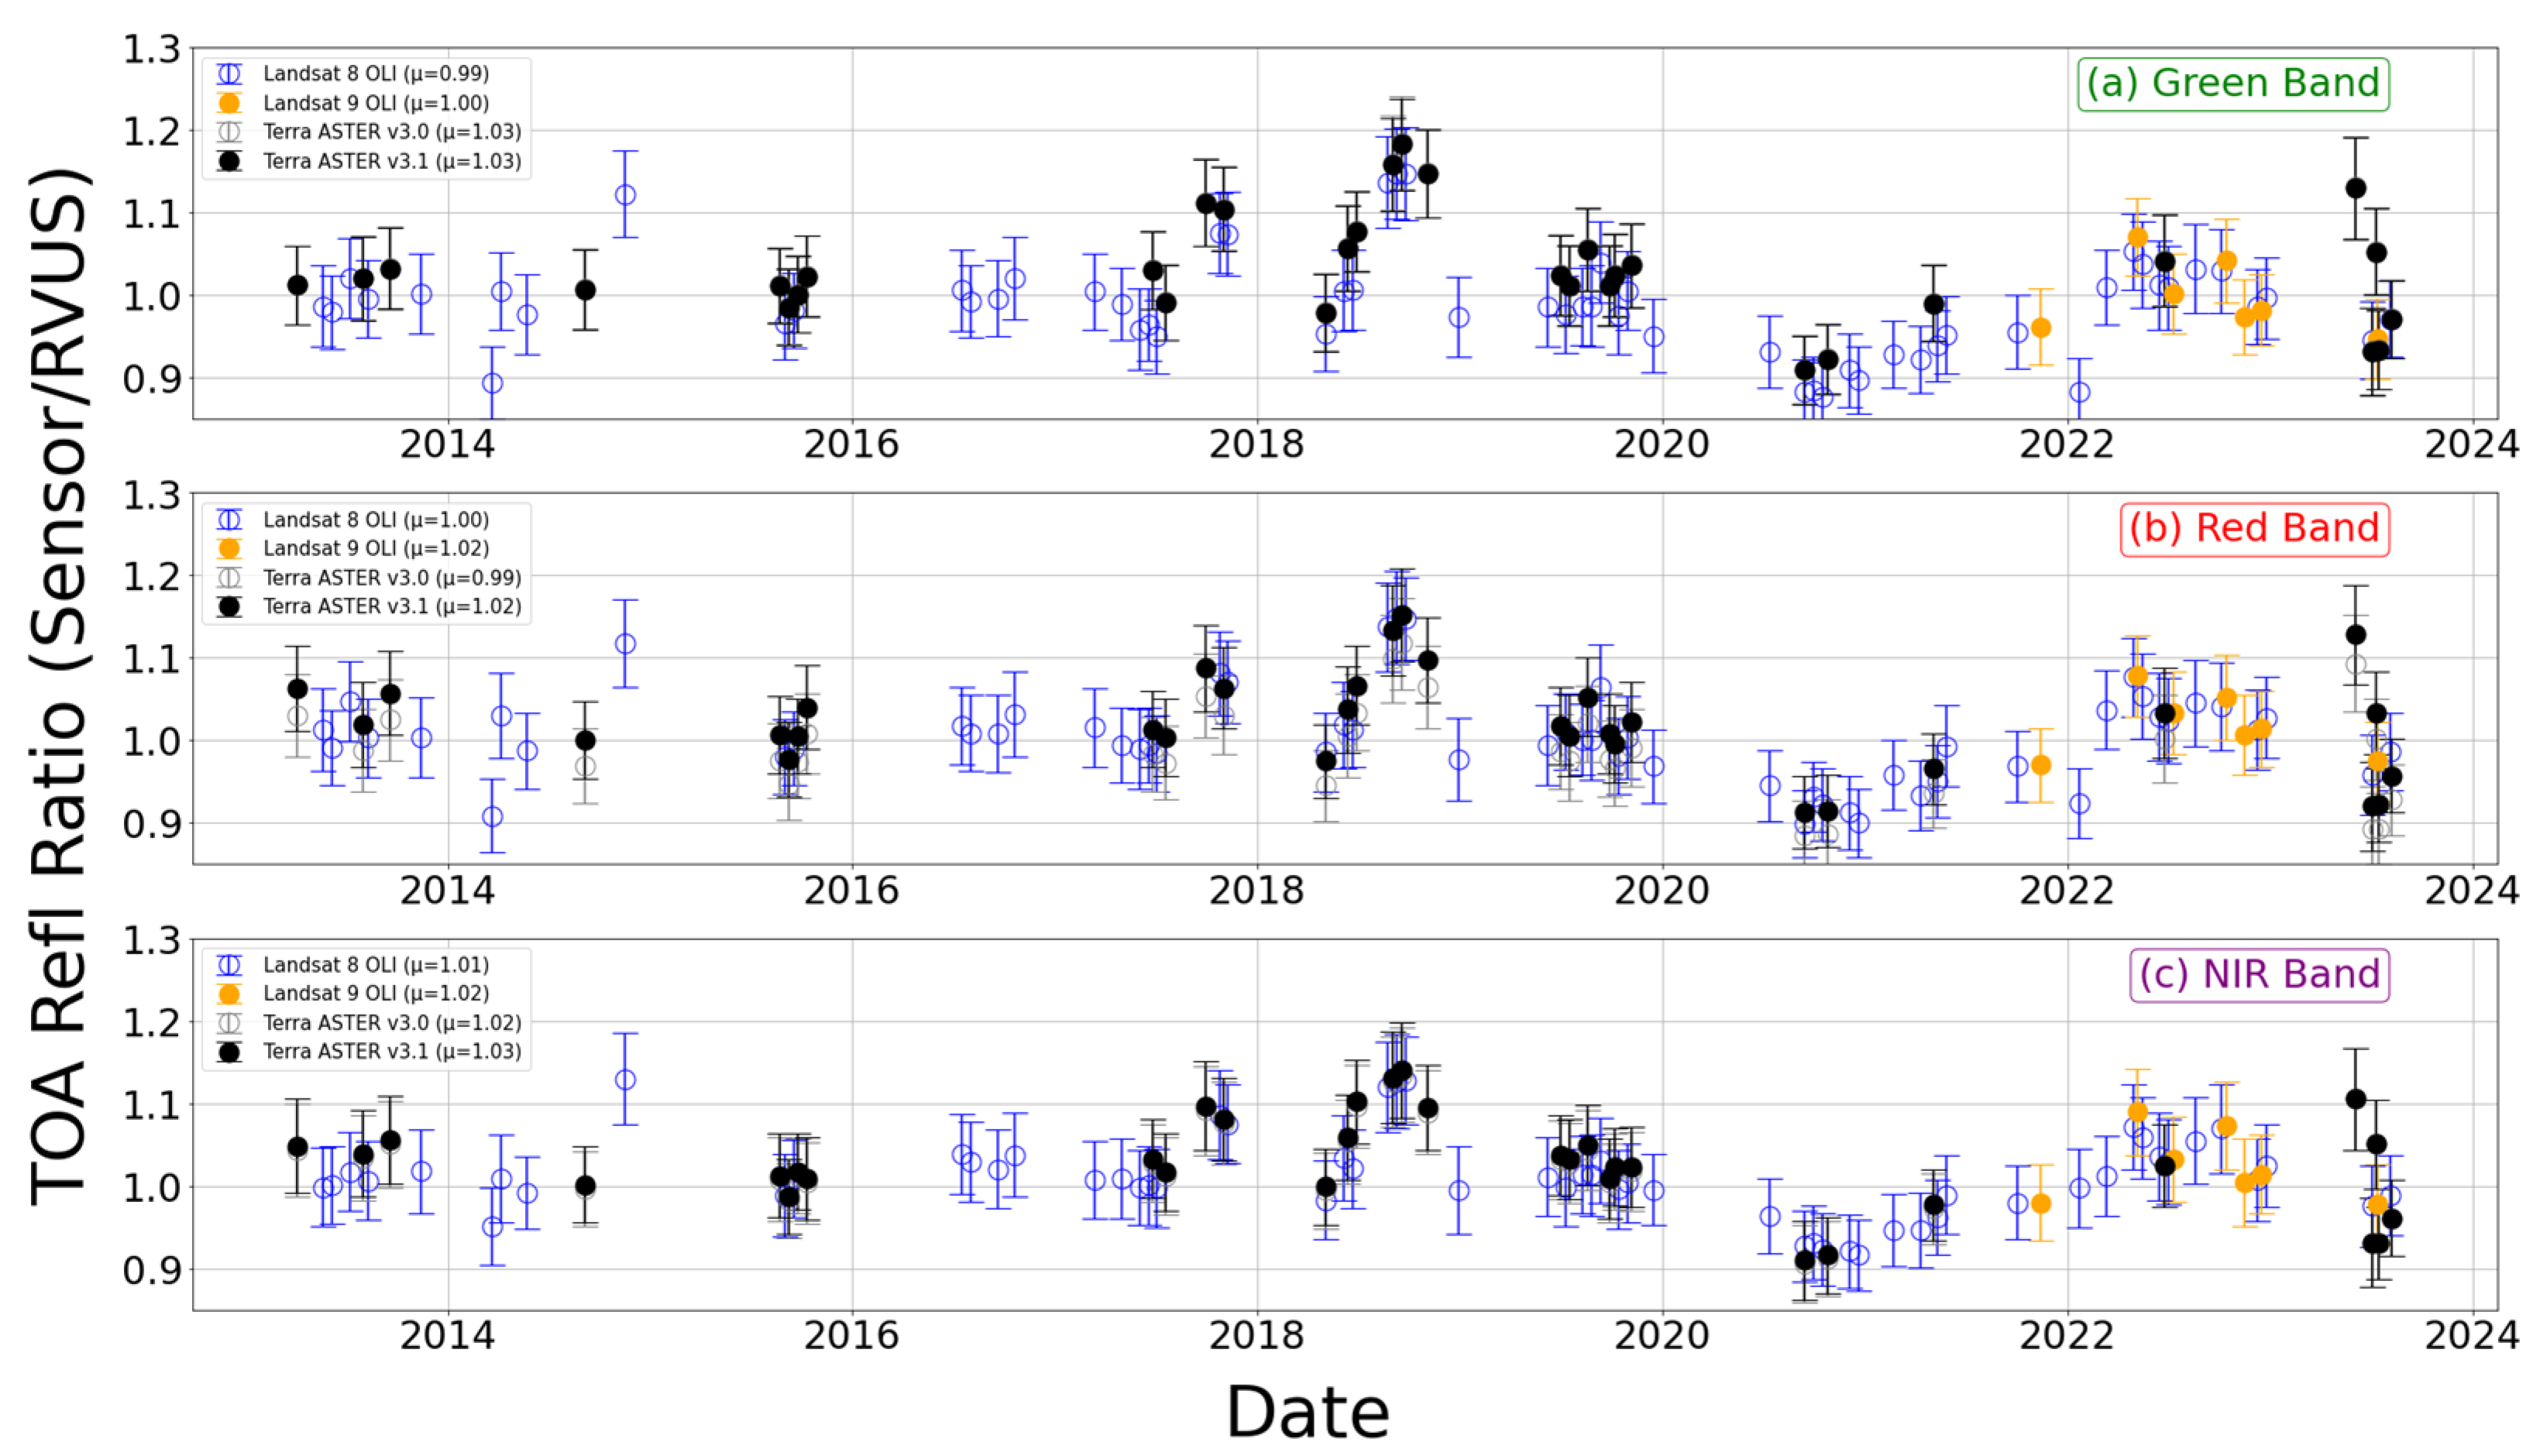
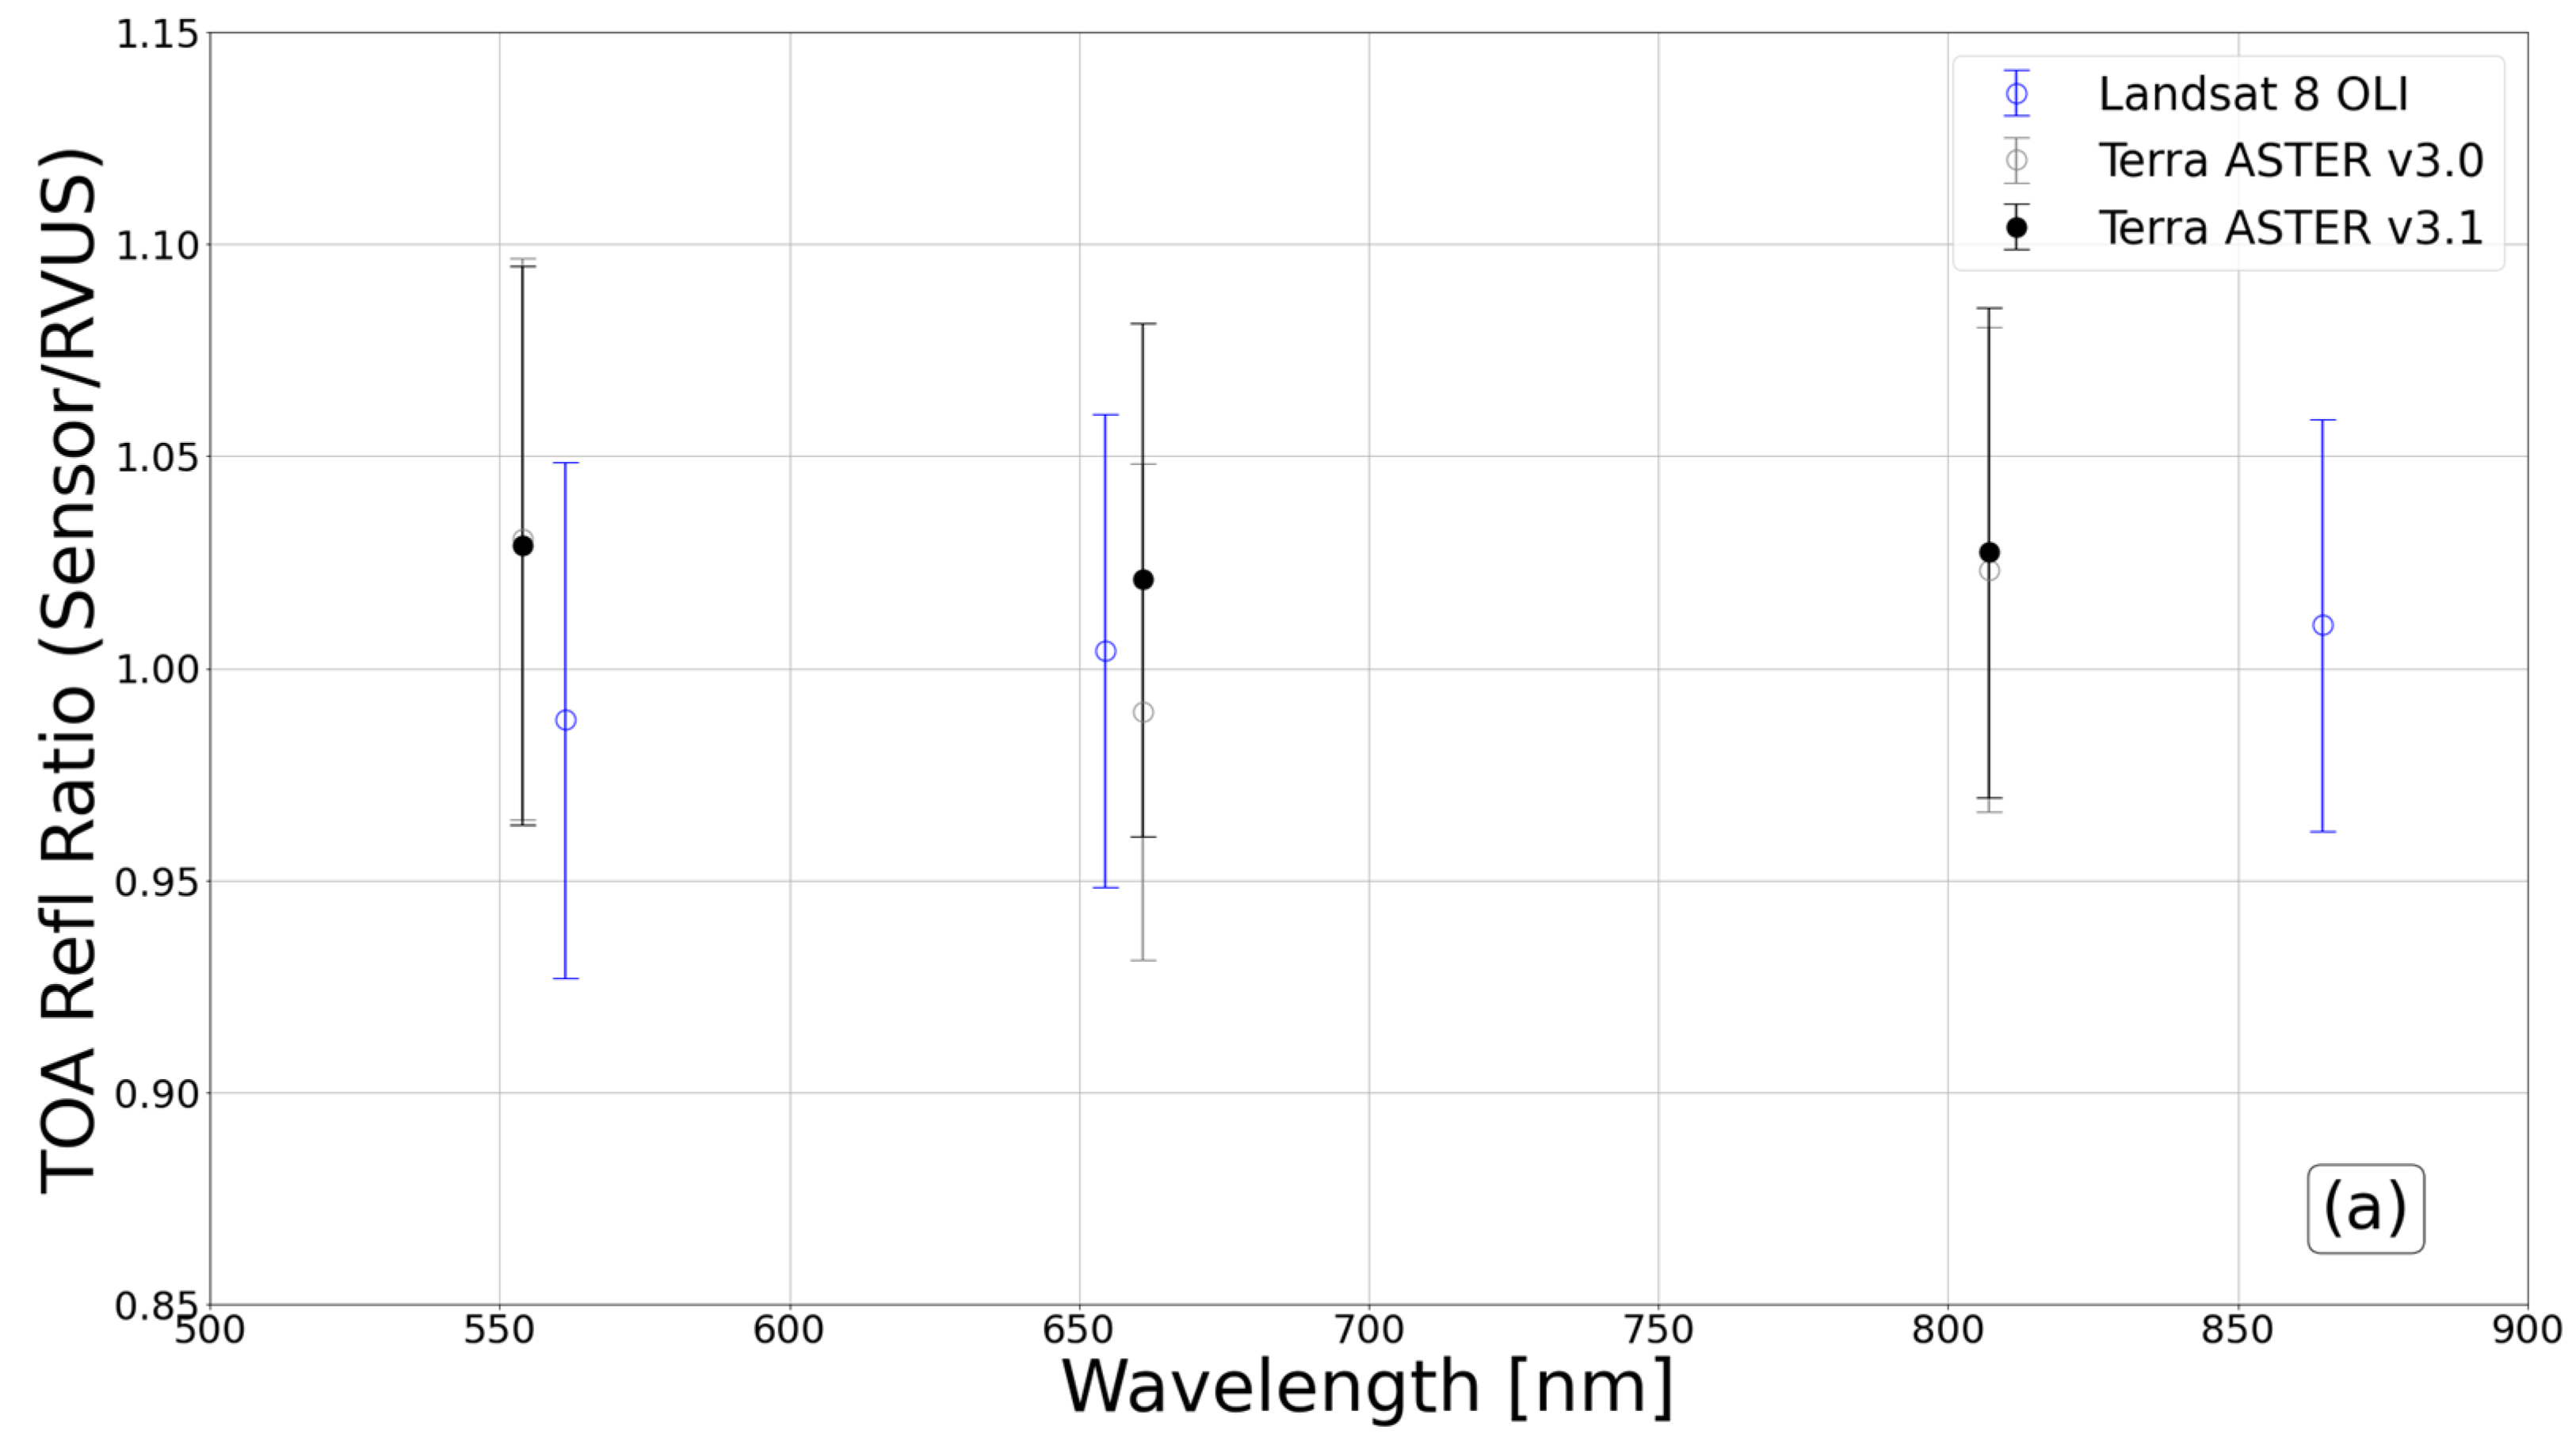
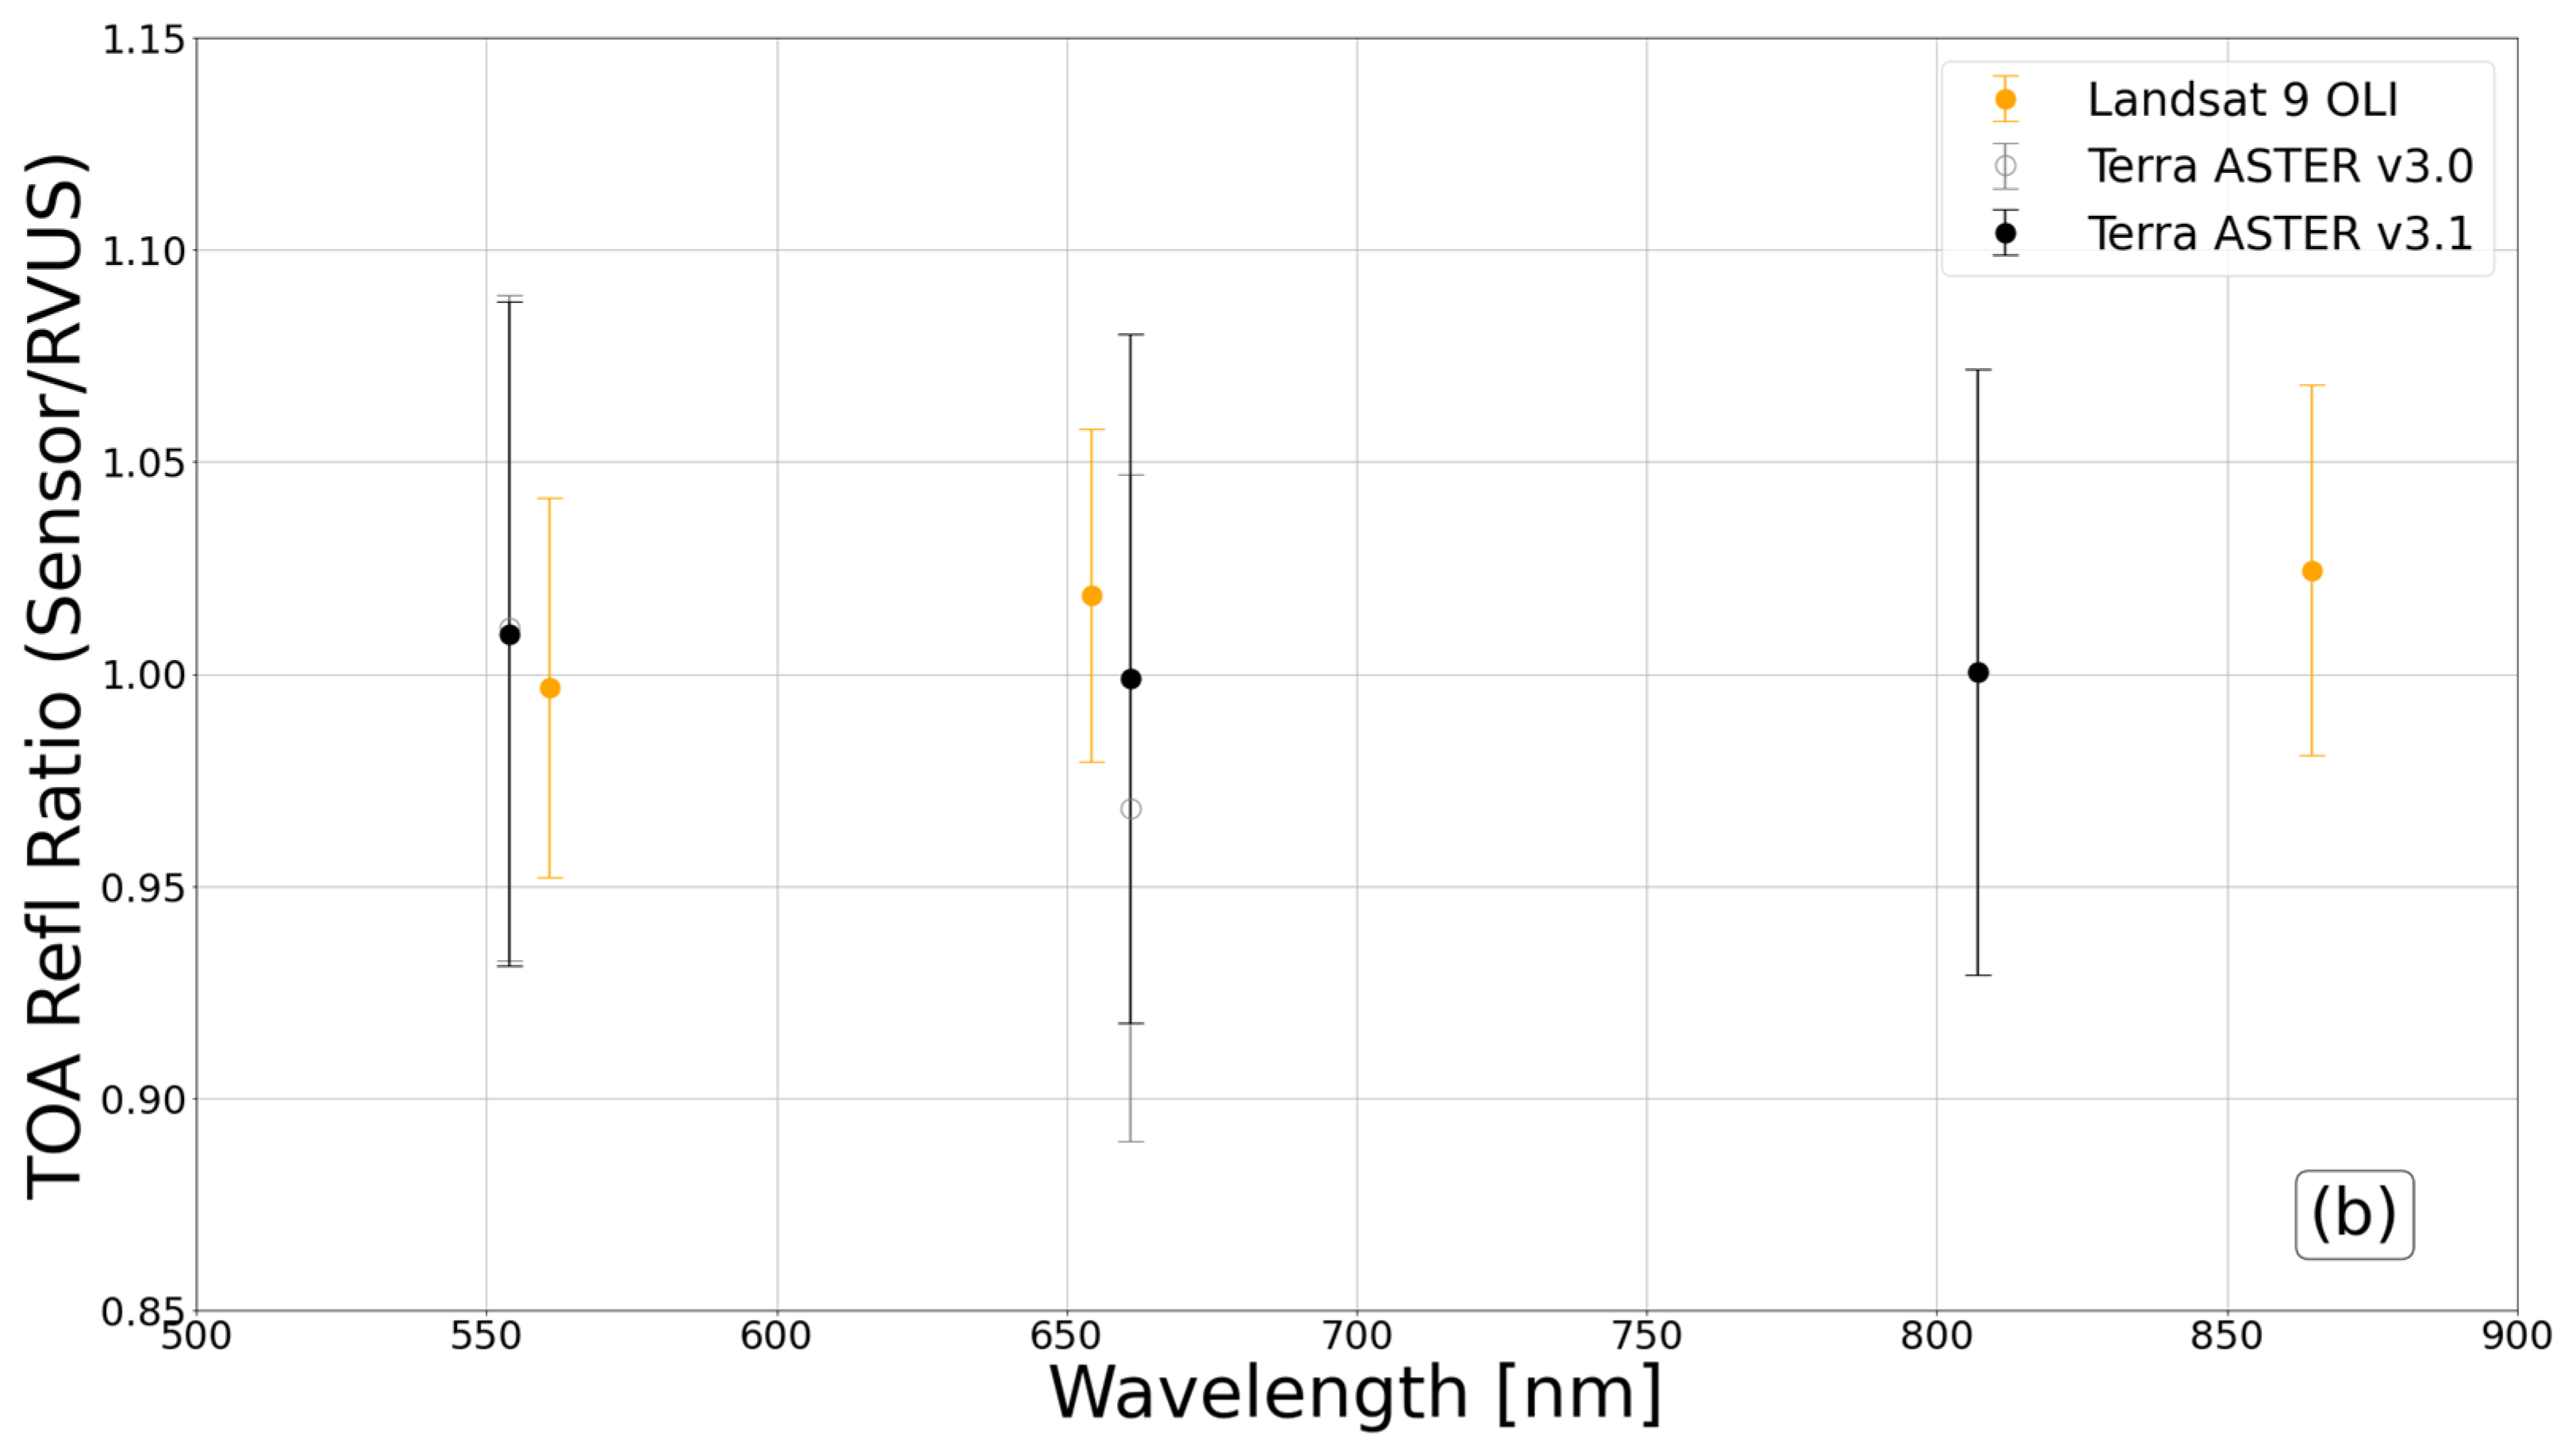
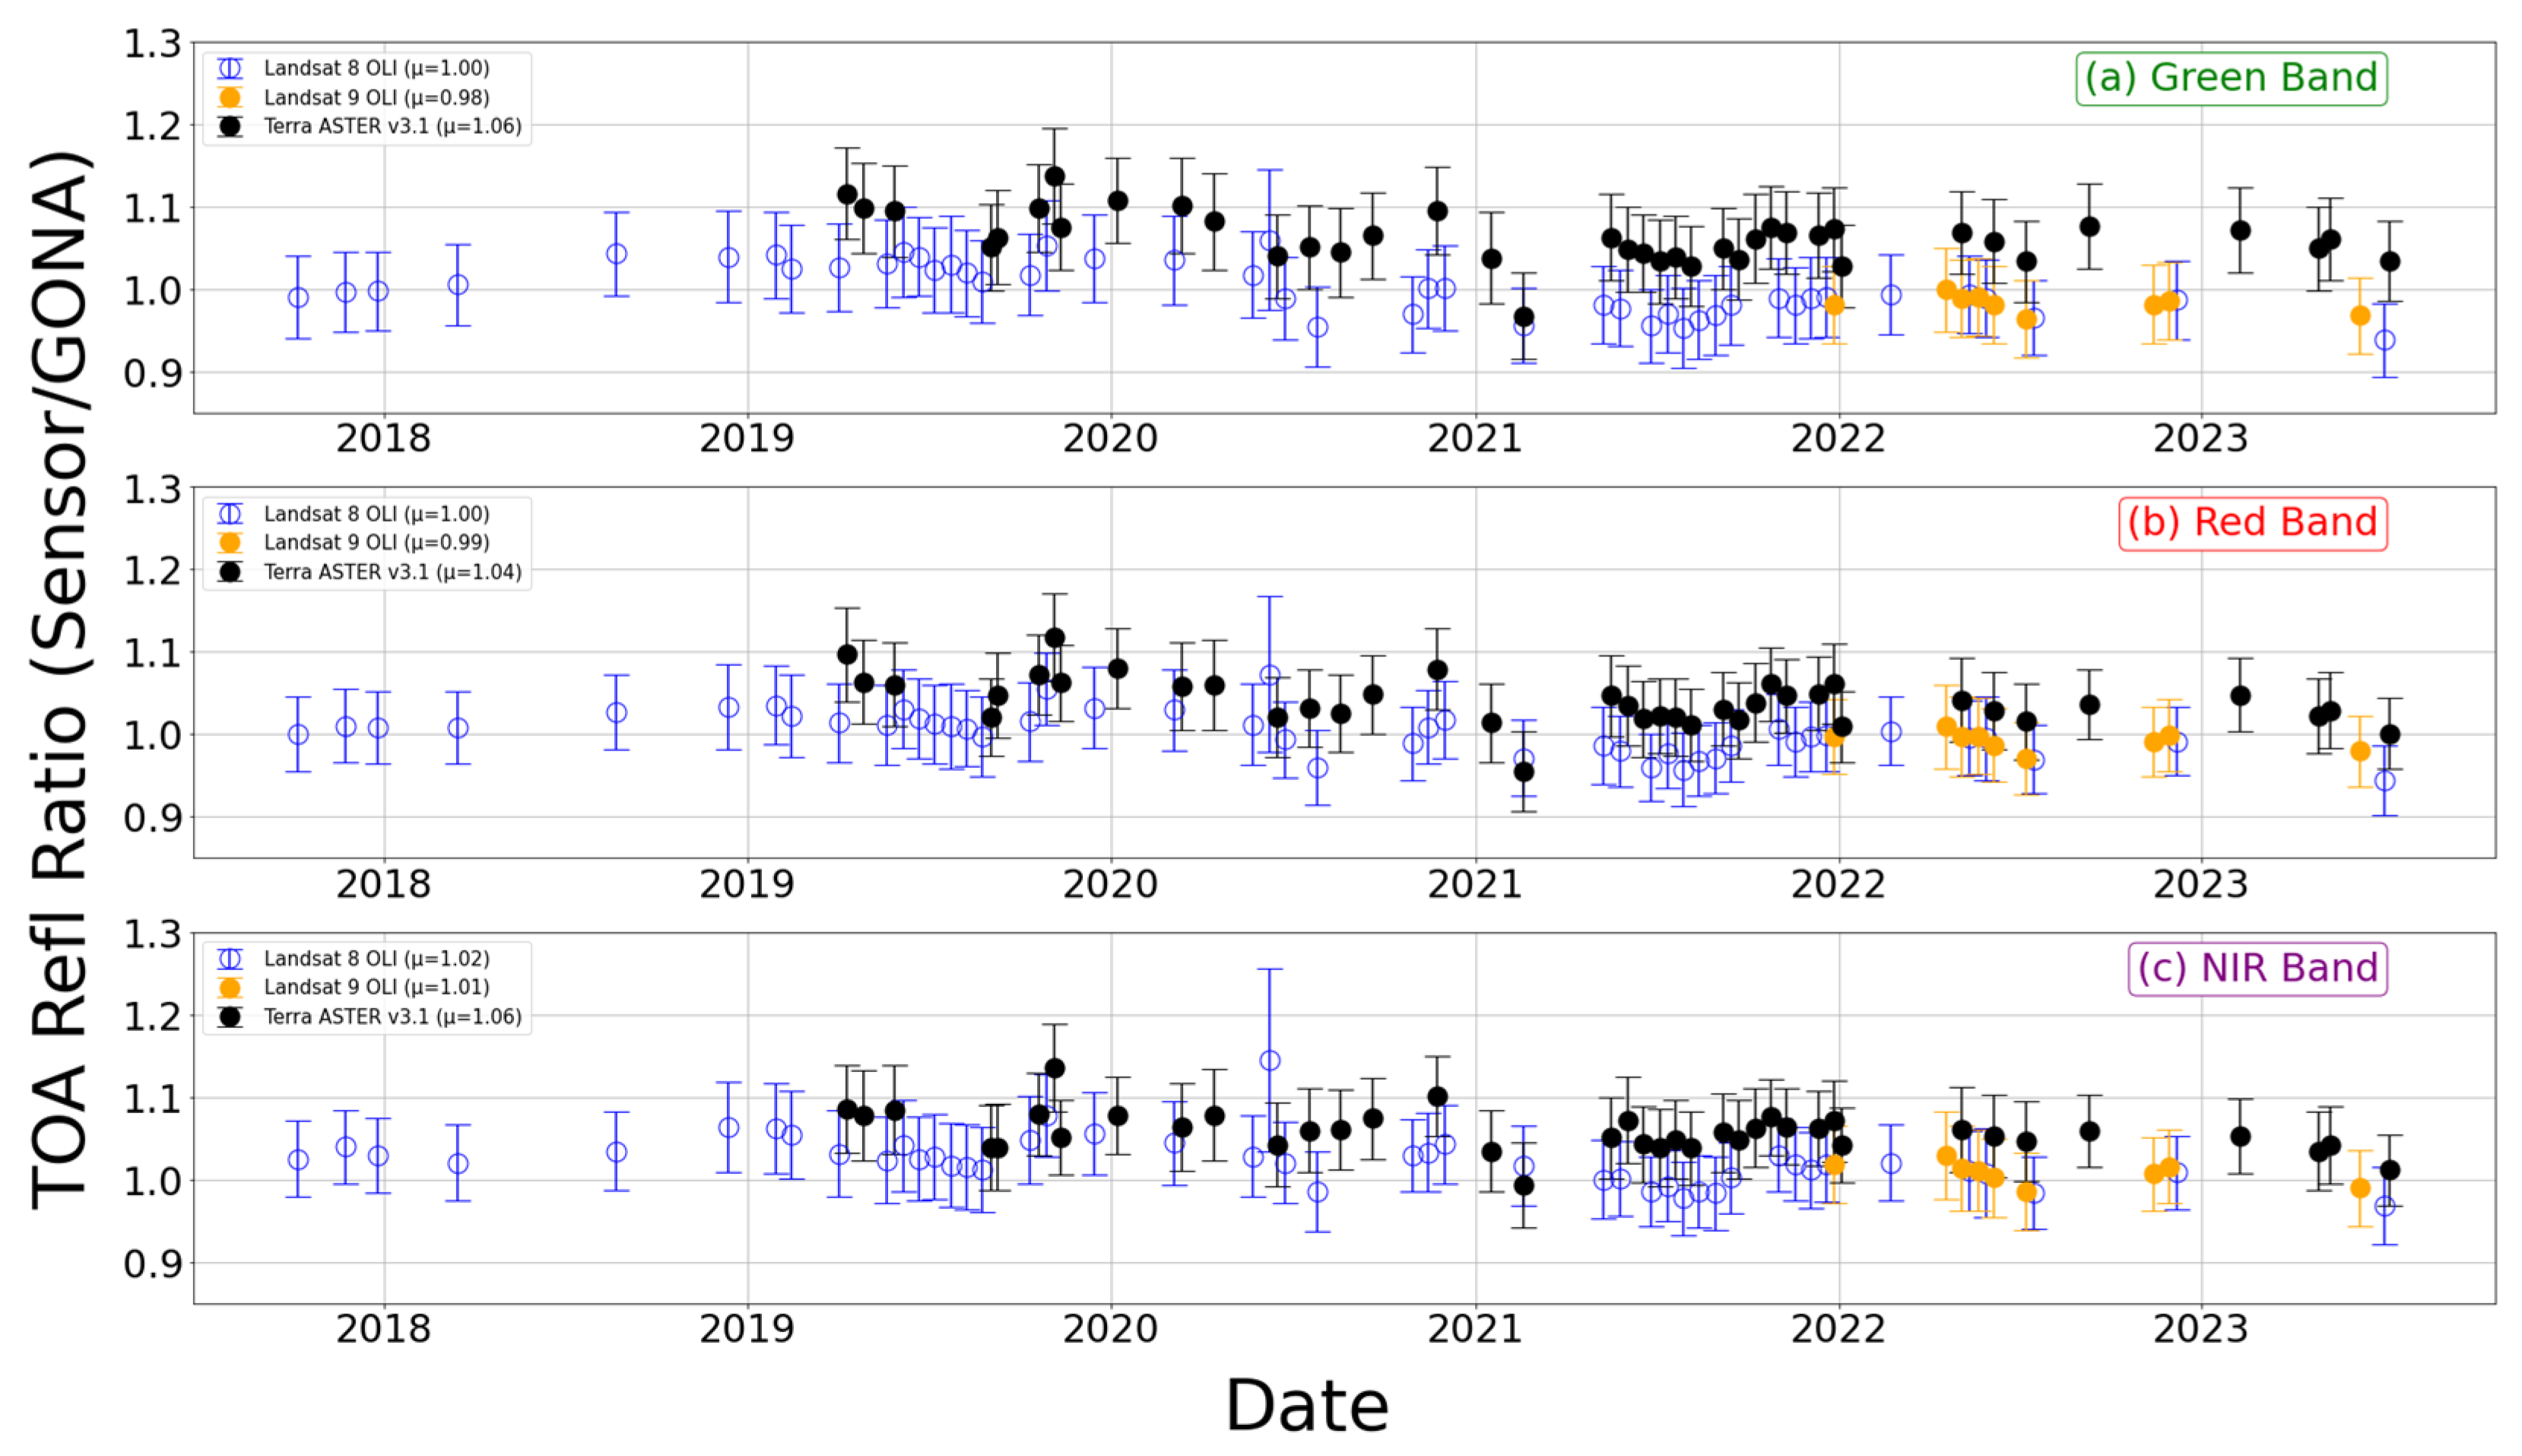
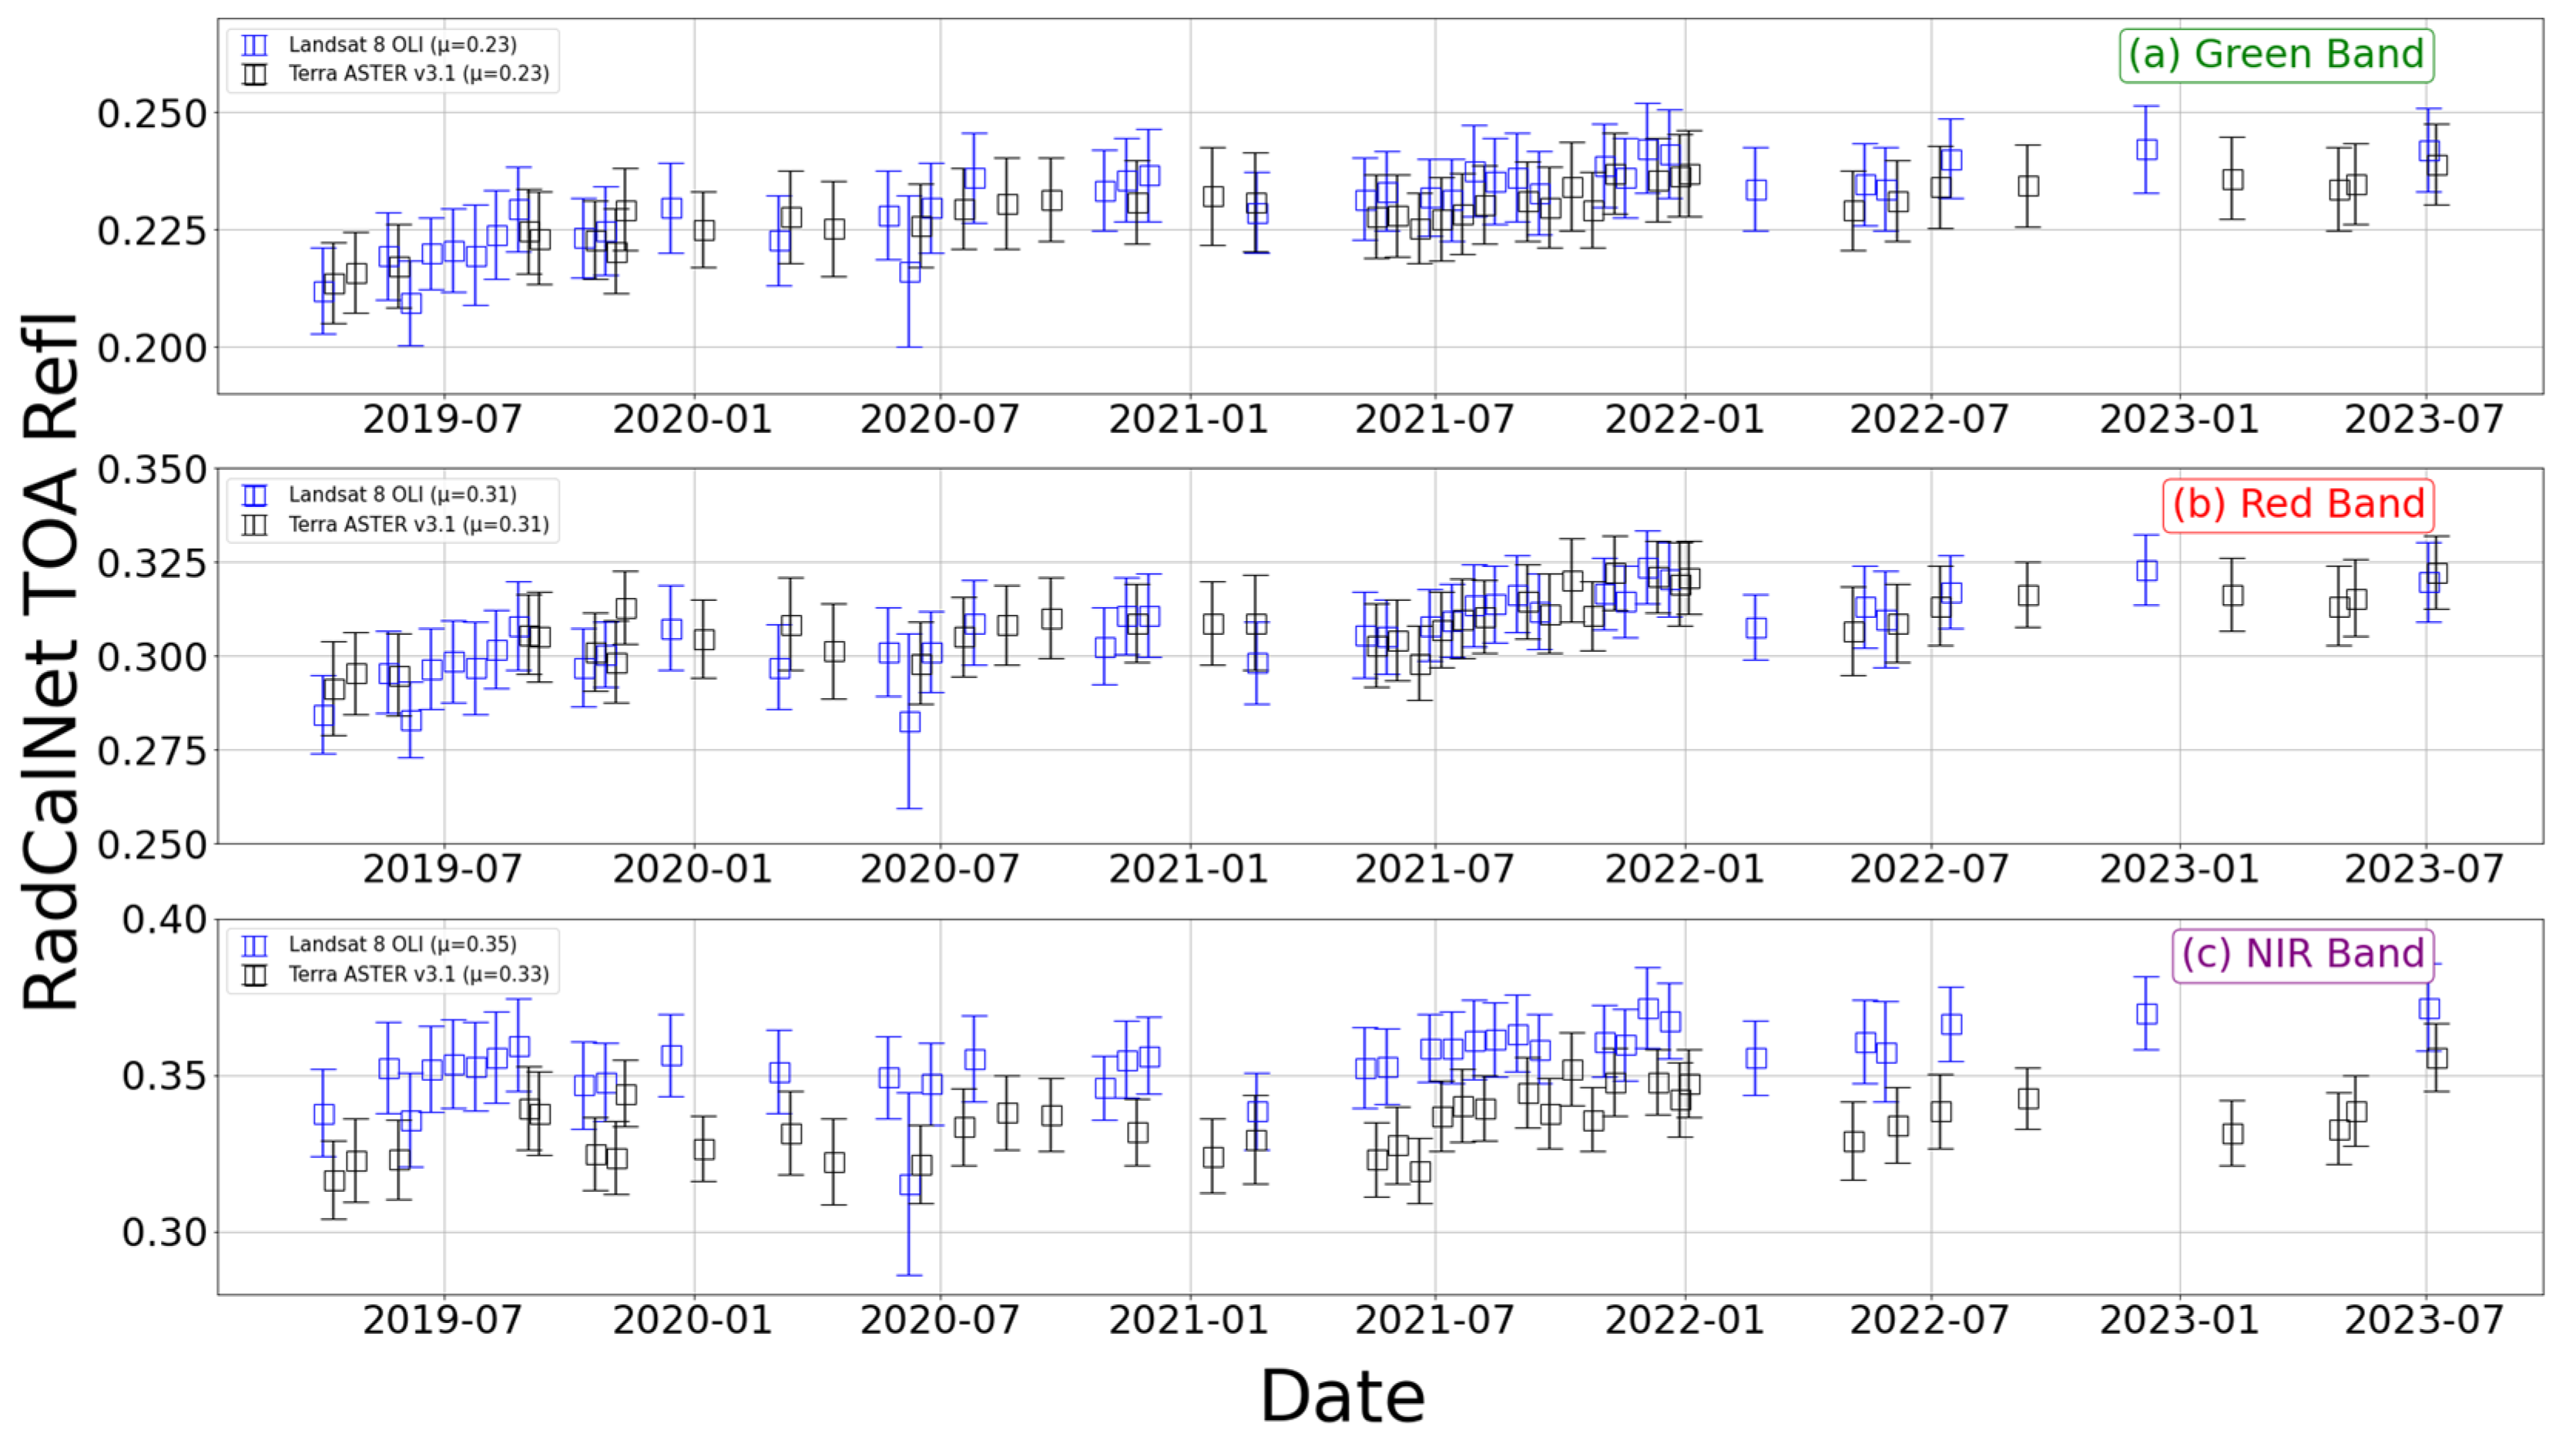
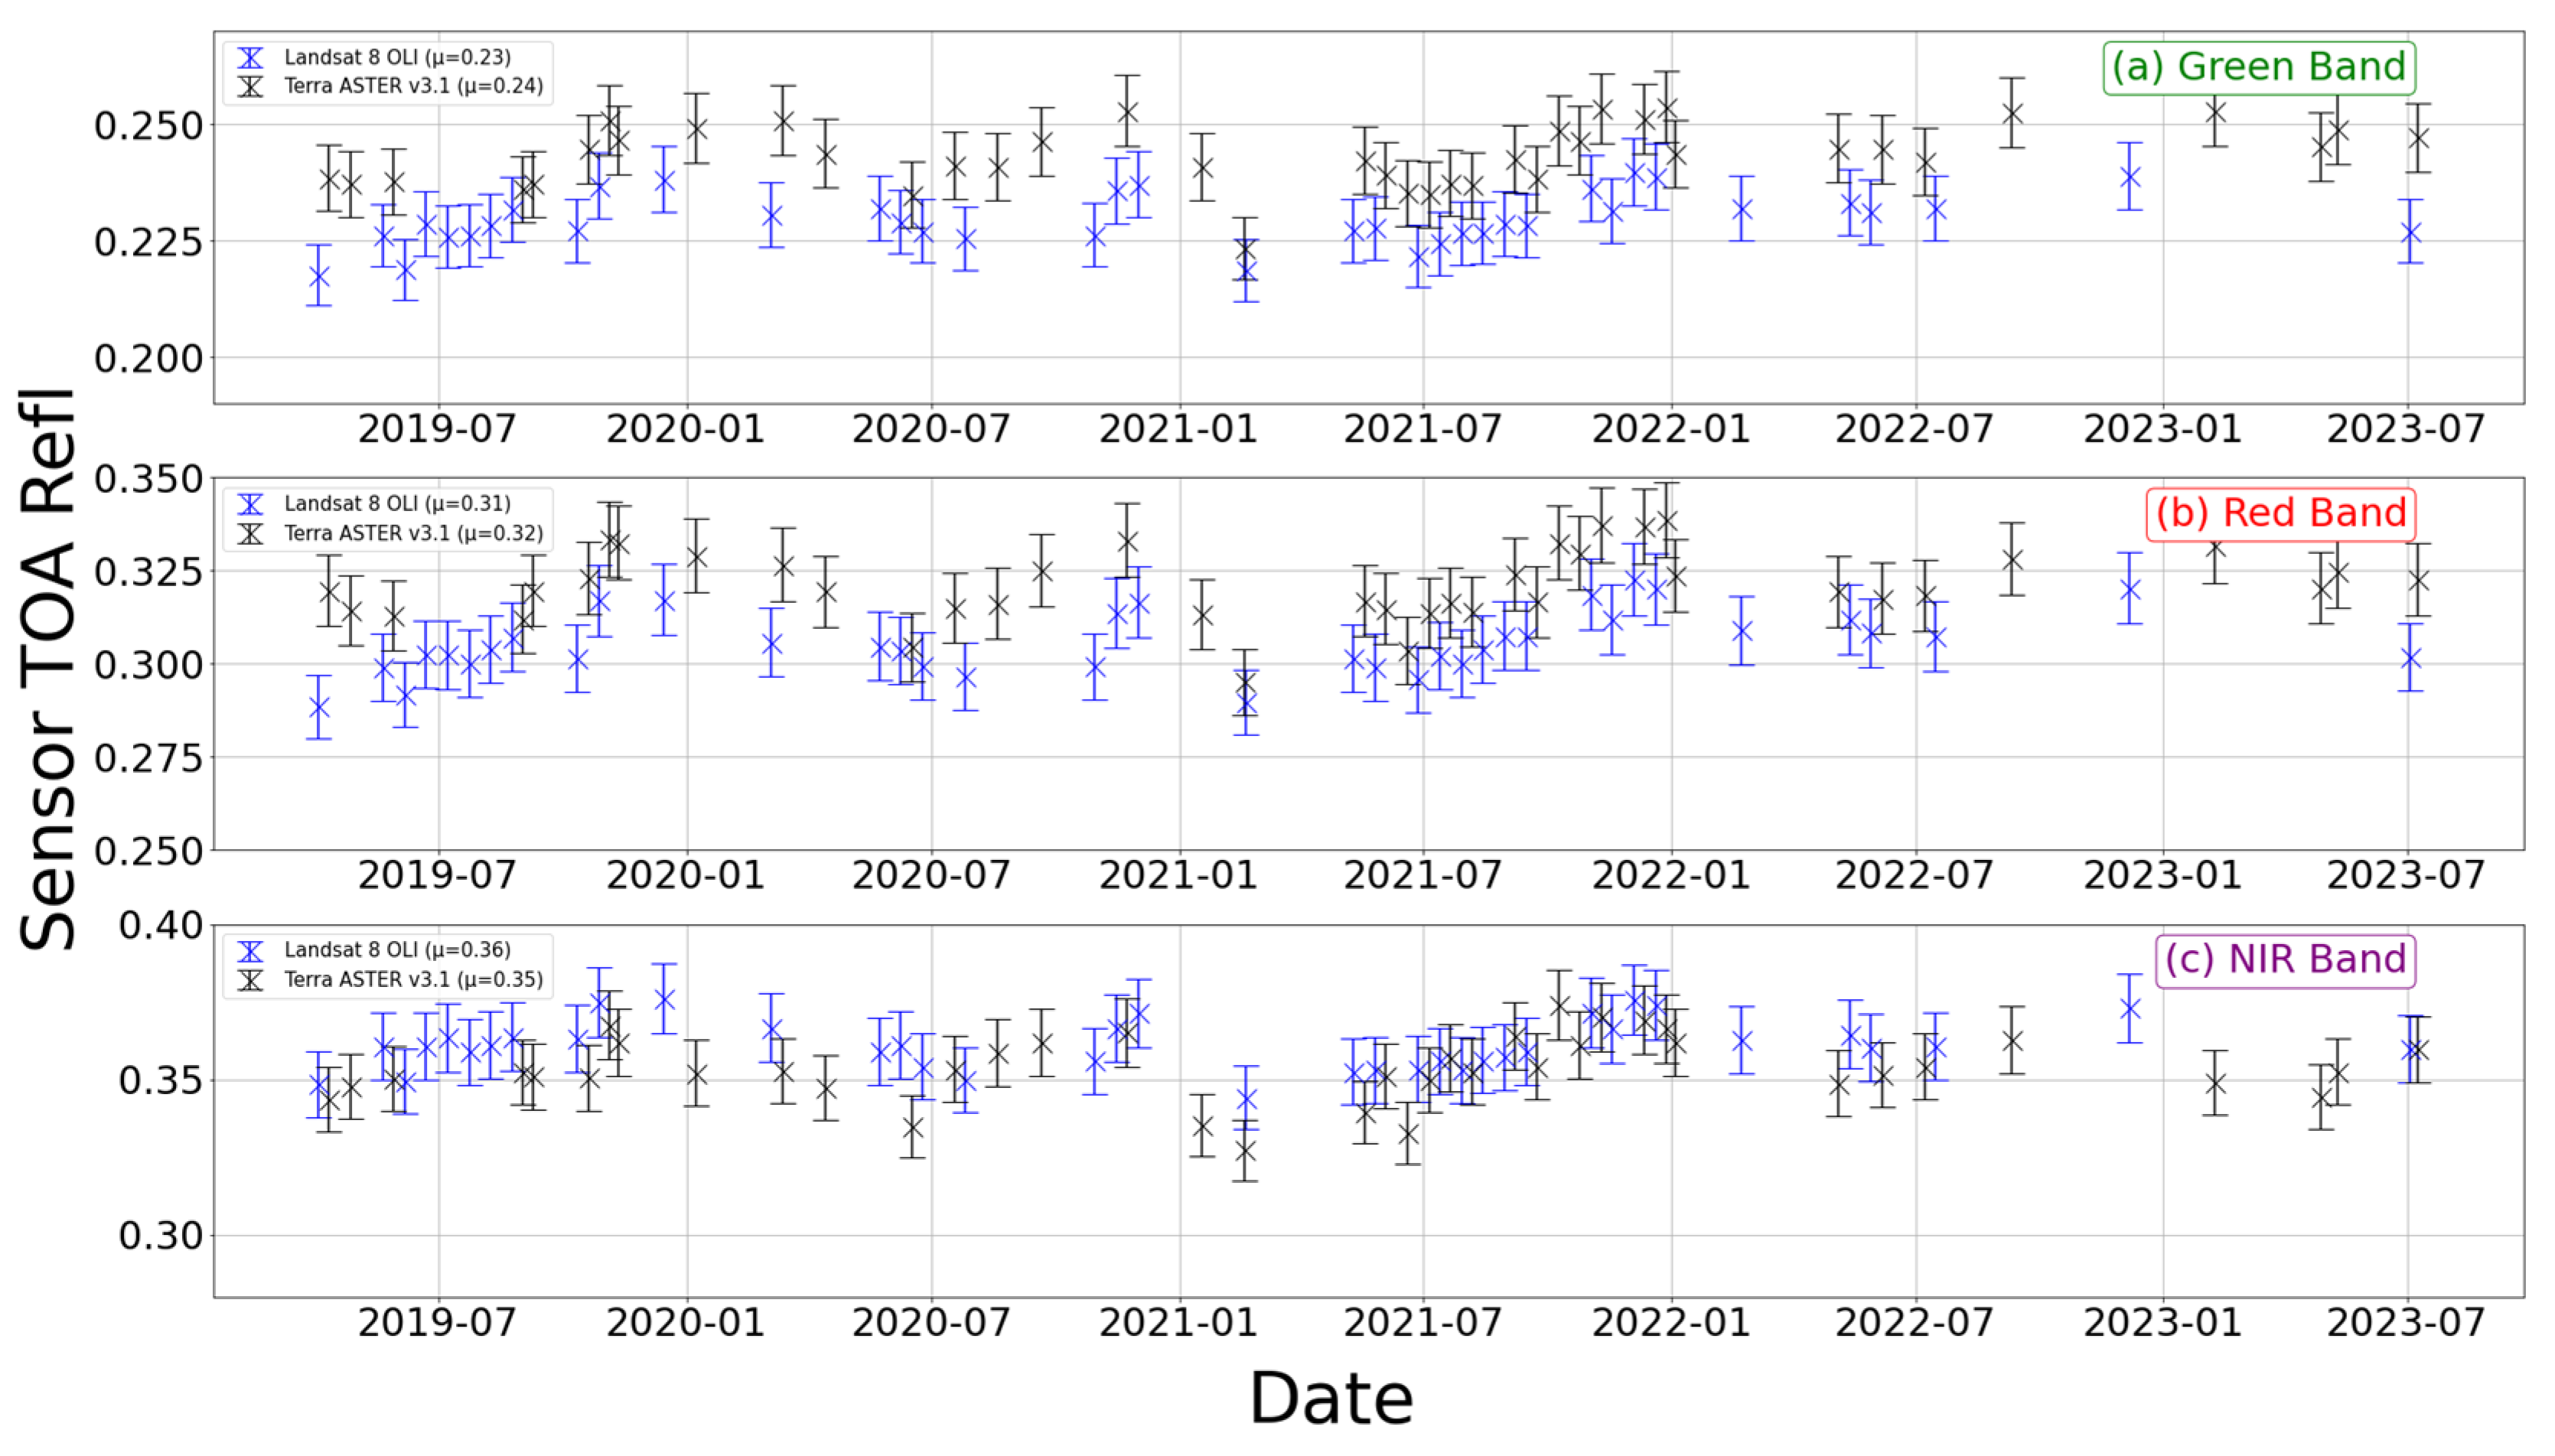
A benefit of this study is that it shows that the ASTER sensor’s radiometric calibration remained stable across the orbit-lowering maneuver that took place in October 2022. The results also show that both the v3.0 and the updated v3.1 ASTER data agree with the RadCalNet results, and it is recommended that users rely on the v3.1 since it provides an improved consistency in the red band with the other two ASTER bands. The temporal results from the RadCalNet comparisons show that neither the ASTER nor the L8 OLI or L9 OLI data products are changing in time in a systematic fashion, which indicates that the radiometric calibration of both sensors is well understood by their respective instrument teams. Comparisons of the 10-year averages of the ratio to RVUS RadCalNet indicate that OLI and ASTER agree to within 7% in all spectral bands and 4% in the closely matched green, red, and near-infrared bands. Similar results are obtained with the much shorter time history of L9 OLI, indicating that a sufficient number of data sets can be obtained within 18 months to develop a reliable comparison between multiple sensors using RadCalNet data. In summary, RadCalNet has been shown to play a crucial role in the intercomparison, calibration, and validation of remote sensing sensors, and users can be confident that applications relying on ASTER, L8 OLI, and L9 OLI will not be affected by absolute radiometric calibration differences between sensors.

Author Contributions

Conceptualization, M.Y., K.T., B.N.W. and J.C.-M.; data curation, M.Y.; formal analysis, M.Y.; funding acquisition, K.T.; investigation, M.Y.; methodology, M.Y., K.T. and B.N.W.; project administration, K.T. and B.N.W.; resources, K.T.; software, M.Y.; supervision, K.T. and B.N.W.; validation, B.N.W., N.V., M.T. and S.E.; visualization, M.Y.; writing—original draft, M.Y.; writing—review and editing, M.Y., K.T., B.N.W., J.C.-M. and S.E. All authors have read and agreed to the published version of the manuscript.

Funding

This research was funded by the National Aeronautics and Space Administration (NASA).

Data Availability Statement

The data used in this study are openly available: The ASTER data presented in this study are available at https://earthdata.nasa.gov/, (accessed on 15 September 2023); the Landsat-8 data and Landsat-9 data presented in this study are available at https://earthexplorer.usgs.gov/, (accessed on 15 September 2023); and the RadCalNet data presented in this study are openly available at https://www.radcalnet.org/, (accessed on 15 September 2023).

Acknowledgments

The authors acknowledge the Goddard Space Flight Center’s Committee on Earth Observation Satellites.

Conflicts of Interest

Author Mehran Yarahmadi, Brian N. Wenny, Norvik Voskanian, Mohammad Tahersima and Sarah Eftekharzadeh were employed by the Science Systems & Applications, Inc. The remaining authors declare that the research was conducted in the absence of any commercial or financial relationships that could be construed as a potential conflict of interest.

References

  1. Lillesand, T.; Kiefer, R.W.; Chipman, J. Remote Sensing and Image Interpretation; John Wiley & Sons: Hoboken, NJ, USA, 2015. [Google Scholar]
  2. Gutman, G.; Skakun, S.; Gitelson, A. Revisiting the use of red and near-infrared reflectances in vegetation studies and numerical climate models. Sci. Remote Sens. 2021, 4, 100025. [Google Scholar] [CrossRef]
  3. Tahsin, S.; Medeiros, S.C.; Singh, A. Consistent Long-Term Monthly Coastal Wetland Vegetation Monitoring Using a Virtual Satellite Constellation. Remote Sens. 2021, 13, 438. [Google Scholar] [CrossRef]
  4. Voskanian, N.; Thome, K.; Wenny, B.N.; Tahersima, M.H.; Yarahmadi, M. Inter-calibration of Landsat 8 and 9 operational land imagers. Remote Sens. 2023, 15, 5752. [Google Scholar] [CrossRef]
  5. Tahersima, M.H.; Wenny, K.T.B.N.; Voskanian, N.; Yarahmadi, M. Intercomparison of Landsat OLI and JPSS VIIRS Using a Combination of RadCalNet Sites as a Common Reference. Remote Sens. 2023, 15, 5562. [Google Scholar] [CrossRef]
  6. Zhao, Y.; Ma, L.; Li, W.; He, H.; Long, X.; Wang, N.; Liu, Z. Vicarious Radiometric Calibration of Superview-1 Sensor Using RadCalNet TOA Reflectance Product. In Proceedings of the IGARSS 2021—2021 IEEE International Geoscience and Remote Sensing Symposium, Brussels, Belgium, 11–16 July 2021; pp. 8130–8133. [Google Scholar]
  7. Tang, H.; Tang, X.; Xie, J.; Chen, W.; Qian, Y. On-orbit radiometric calibration and Validation of GF-7 satellite based on RadCalNet Baotou site. Remote Sens. Bull. 2023, 27, 1194–1204. [Google Scholar] [CrossRef]
  8. Carmona, E.; Alonso, K.; Bachmann, M.; Burch, K.; Cerra, D.; Lopez, R.D.L.R.; Heiden, U.; Knodt, U.; Krutz, D.; Marshall, D.; et al. Vicarious Calibration of the DESIS Imaging Spectrometer. In Proceedings of the IEEE International Geoscience and Remote Sensing Symposium, Brussels, Belgium, 11–16 July 2021; pp. 1611–1614. [Google Scholar]
  9. Wenny, B.N.; Thome, K.; Czapla-Myers, J. Evaluation of vicarious calibration for airborne sensors using RadCalNet. Appl. Rem. Sens. 2021, 15, 034501. [Google Scholar] [CrossRef]
  10. Bouvet, M.; Thome, K.; Berthelot, B.; Bialek, A.; Czapla-Myers, J.; Fox, N.P.; Goryl, P.; Henry, P.; Ma, L.; Marcq, S.; et al. RadCalNet: A radiometric calibration network for Earth observing imagers operating in the visible to shortwave infrared spectral range. Remote Sens. 2019, 11, 2401. [Google Scholar] [CrossRef]
  11. Wolters, E.; Toté, C.; Sterckx, S.; Adriaensen, S.; Henocq, C.; Bruniquel, J.; Scifoni, S.; Dransfeld, S. iCOR Atmospheric Correction on Sentinel-3/OLCI over Land: Intercomparison with AERONET, RadCalNet, and SYN Level-2. Remote Sens. 2021, 13, 654. [Google Scholar] [CrossRef]
  12. Huang, D.; Li, X.; Zheng, X.; Wei, W.; Guo, F.; Zhang, Q. Cross-calibration method based on an automated observation site. Optics Express. 2023, 31, 12756–12777. [Google Scholar] [CrossRef]
  13. Yamamoto, H.; Obata, K.; Tsuchida, S.; Kerr, G.; Bachmann, M. Cross-sensor calibration and validation between DESIS and HISUI Hyperspectral Imager on the International Space Station (ISS). In Proceedings of the IGARSS 2016—2016 IEEE International Geoscience and Remote Sensing Symposium, Beijing, China, 10–15 July 2016; pp. 1928–1930. [Google Scholar]
  14. Alhammoud, B.; Jackson, J.; Clerc, S.; Arias, M.; Bouzinac, C.; Gascon, F.; Cadau, E.G.; Iannone, R.Q.; Bocci, V. Sentinel-2 Level-1 Radiometry Assessment Using Vicarious Methods from DIMITRI Toolbox and Field Measurements From RadCalNet Database. IEEE J. Sel. Top. Appl. Earth Obs. Remote Sens. 2019, 12, 3470–3479. [Google Scholar] [CrossRef]
  15. Banks, A.C.; Hunt, S.E.; Gorroño, J.; Scanlon, T.; Woolliams, E.R.; Fox, N.P. A comparison of validation and vicarious calibration of high and medium resolution satellite-borne sensors using RadCalNet. In Proceedings of the SPIE 10423, Sensors, Systems, and Next-Generation Satellites XXI, Warsaw, Poland, 29 September 2017. [Google Scholar]
  16. Bentahar, I.; Raji, M. Comparison of Landsat OLI, ASTER, and Sentinel 2A data in lithological mapping: A Case study of Rich area (Central High Atlas, Morocco). Adv. Space Res. 2021, 67, 945–963. [Google Scholar] [CrossRef]
  17. Adiri, Z.; Harti, A.E.; Jellouli, A.; Lhissou, R.; Maacha, L.; Azmi, M.; Zouhair, M.; Bachaoui, E.M. Comparison of Landsat-8, ASTER and Sentinel 1 satellite remote sensing data in automatic lineaments extraction: A case study of Sidi Flah-Bouskour inlier, Moroccan Anti Atlas. Adv. Space Res. 2017, 60, 2355–2367. [Google Scholar] [CrossRef]
  18. Gross, G.; Helder, D.; Leigh, L. Extended Cross-Calibration Analysis Using Data from the Landsat 8 and 9 Underfly Event. Remote Sens. 2023, 15, 1788. [Google Scholar] [CrossRef]
  19. Kabir, S.; Pahlevan, N.; O’Shea, R.E.; Barnes, B.B. Leveraging Landsat-8/-9 underfly observations to evaluate consistency in reflectance products over aquatic environments. Remote Sens. Environ. 2023, 296, 113755. [Google Scholar] [CrossRef]
  20. Yamamoto, H.; Czapla-Myers, J.; Tsuchida, S. Validation of Aster VNIR Radiometric Performance Using the Reflectance-Based Vicarious Calibration Experiments and RadCaTS Data. In Proceedings of the IGARSS 2022—2022 IEEE International Geoscience and Remote Sensing Symposium, Kuala Lumpur, Malaysia, 17–22 July 2022; pp. 4316–4319. [Google Scholar]
  21. Roy, D.; Wulder, M.; Loveland, T.; Woodcock, C.; Allen, R.; Anderson, M.; Helder, D.; Irons, J.; Johnson, D.; Kennedy, R.; et al. Landsat-8: Science and product vision for terrestrial global change research. Remote Sens. Environ. 2014, 145, 154–172. [Google Scholar] [CrossRef]
  22. Abrams, M.; Hook, S.; Ramachandran, B. ASTER Users Handbook, Version 2; Jet Propulsion Laboratory: Pasadena, CA, USA, 2002. [Google Scholar]
  23. Ihlen, V.; Zanter, K. Landsat 8 (L8) Data Users Handbook, Version 5.0; Department of the Interior, U.S. Geological Survey: Reston, VA, USA, 2019. [Google Scholar]
  24. Sayler, K.; Glynn, T. Landsat 9 Data Users Handbook, Version 1.0; Department of the Interior, U.S. Geological Survey: Reston, VA, USA, 2022. [Google Scholar]
  25. Scott, K.P.; Thome, K.J.; Brownlee, M.R. Evaluation of Railroad Valley Playa for use in vicarious calibration. In Proceedings of the SPIE Proceedings, Boston, FL, USA, 4 November 1996. [Google Scholar]
  26. Vermote, E.F.; Santer, R.; Deschamps, P.-Y.; Herman, M. In-flight calibration of large field of view sensors at short wavelengths using Rayleigh scattering. Int. J. Remote Sens. 1992, 13, 3409–3429. [Google Scholar] [CrossRef]
  27. Thome, K.J.; Nandy, P. Accuracy of ground-reference calibration of imaging spectroradiometers at large sensor view angles. J. Remote Sens. Soc. Jpn. 2000; 20, 602–614. [Google Scholar]
  28. Giles, D.M.; Sinyuk, A.; Sorokin, M.G.; Schafer, J.S.; Smirnov, A.; Slutsker, I.; Eck, T.F.; Holben, B.N.; Lewis, J.R.; Campbell, J.R.; et al. Advancements in the Aerosol Robotic Network (AERONET) Version 3 database—Automated near-real-time quality control algorithm with improved cloud screening for Sun photometer aerosol optical depth (AOD) measurements. Atmos. Meas. Tech. 2019, 12, 169–209. [Google Scholar] [CrossRef]
  29. Bialek, A.; Greenwell, C.; Lamare, M.; Meygret, A.; Marcq, S.; Lachérade, S.; Woolliams, E.; Berthelot, B.; Bouvet, M.; King, M.; et al. New radiometric calibration site located at Gobabeb, Namib desert. In Proceedings of the IEEE International Geoscience and Remote Sensing Symposium (IGARSS), Beijing, China, 10–15 July 2016. [Google Scholar]
  30. Marcq, S.; Meygret, A.; Bouvet, M.; Fox, N.; Greenwell, C.; Scott, B.; Berthelot, B.; Besson, B.; Guilleminot, N.; Damiri, B. New Radcalnet Site at Gobabeb, Namibia: Installation of the Instrumentation and First Satellite Calibration Results. In Proceedings of the IGARSS 2018—2018 IEEE International Geoscience and Remote Sensing Symposium, Valencia, Spain, 22–27 July 2018. [Google Scholar]
  31. Wenny, B.N.; Thome, K. Look-up table approach for uncertainty determination for operational vicarious calibration of Earth imaging sensors. Appl. Opt. 2022, 61, 1357–1368. [Google Scholar] [CrossRef]
  32. Thome, K.J.; Biggar, S.F.; Slater, P.N. Effects of assumed solar spectral irradiance on intercomparisons of Earth-observing sensors. In Sensors, Systems, and Next-Generation Satellites V; SPIE: San Diego, CA, USA, 2001. [Google Scholar]
  33. Masek, J.; Wulder, M.; Markham, B.; McCorkel, J.; Crawford, C.; Storey, J.; Jenstrom, D. Landsat 9: Empowering Open Science and Applications through Continuity. Remote Sens. 2020, 248, 111968. [Google Scholar] [CrossRef]
  34. Jcgm, J.C.G.M. Evaluation of measurement data—Guide to the expression of uncertainty in measuremen. Int. Organ. Stand. Geneva ISBN 2008, 50, 134. [Google Scholar]
  35. Revela, C.; Lonjoua, V.; Marcqa, S.; Desjardinsa, C.; Fougniea, B.; Lucheb, C.C.-D.; Guilleminotb, N.; Lacampb, A.-S.; Lourmea, E.; Miquelc, C.; et al. Sentinel-2A and 2B absolute calibration monitoring. Eur. J. Remote Sens. 2019, 52, 122–137. [Google Scholar] [CrossRef]
Figure 1. Relative spectral response (RSR) curves for Landsat 8 OLI, Landsat 9 OLI, and Terra ASTER.
Remotesensing 16 00400 g001
Figure 2. ASTER image of RVUS (left) and 1 km2 ROI (right), using the ASTER green band. The red box outlines the 1000 m × 1000 m RadCalNet ROI. The x shows the center of the ROI.
Remotesensing 16 00400 g002
Figure 3. ASTER image of GONA (left) and 30 m radius disk ROI (right), using the ASTER green band. The red circle outlines the 30 m radius disk of the RadCalNet ROI. The x shows the center of the ROI.
Remotesensing 16 00400 g003
Figure 4. Comparison of TOA reflectance histograms for green, red, and NIR bands at the RVUS and GONA sites, averaged using the RSRs of the OLI and ASTER sensors.
Remotesensing 16 00400 g004
Figure 5. Flowchart for the method of comparing image data from the sensor collected over the RadCalNet site to the band-averaged TOA reflectance from the RadCalNet data.
Remotesensing 16 00400 g005
Figure 6. TOA reflectance ratios for Terra ASTER v3.0, Terra ASTER v3.1, Landsat 8 OLI, and Landsat 9 OLI compared to RVUS RadCalNet over the period from April 2013 to July 2023 for selected spectral bands. The ratios are shown for the (a) green band, (b) red band, and (c) near-infrared bands. The temporal mean ratio ( μ ) values for each band combination over the entire period are provided in the figure legend.
Remotesensing 16 00400 g006
Figure 7. (a) Temporal average of TOA reflectance ratios for (a) two versions of Terra ASTER and Landsat 8 OLI over RVUS from April 2013 to August 2023 and (b) two versions of Terra ASTER and Landsat 9 OLI over RVUS from November 2021 to August 2023, with symbols representing average ratios and error bars showing standard deviations.
Remotesensing 16 00400 g007aRemotesensing 16 00400 g007b
Figure 8. Double ratios for (a) Terra ASTER/Landsat 8 OLI for two versions of ASTER over RVUS from April 2013 to August 2023; (b) Terra ASTER/Landsat 9 OLI for two versions of ASTER over RVUS from November 2021 to August 2023, with symbols representing average ratios and error bars showing the uncertainty.
Remotesensing 16 00400 g008aRemotesensing 16 00400 g008b
Figure 9. TOA reflectance ratios for Terra ASTER v3.1, Landsat 8 OLI, and Landsat 9 OLI compared to GONA RadCalNet over the period of October 2017 to August 2023 for selected spectral bands. The ratios are shown for (a) green band, (b) red band, and (c) near-infrared bands. The temporal mean ratio ( μ ) values for each band combination over the entire period are provided in the figure legend.
Remotesensing 16 00400 g009
Figure 10. (a) Temporal average of TOA reflectance ratios for (a) Terra ASTER v3.1 and Landsat 8 OLI over GONA from April 2019 to August 2023 and (b) Terra ASTER v3.1 and Landsat 9 OLI over RVUS from November 2021 to August 2023, with symbols representing average ratios and error bars showing standard deviations.
Remotesensing 16 00400 g010
Figure 11. Temporal averages of TOA reflectance ratios for two versions of Terra ASTER and Landsat 8 OLI, and Landsat 9 OLI over RVUS from October 2022 to August 2023, with symbols representing average ratios and error bars showing standard deviations.
Remotesensing 16 00400 g011
Figure 12. TOA reflectance values derived from RadCalNet for the matchup dates of Terra ASTER v3.1 and Landsat 8 OLI with GONA measurements.
Remotesensing 16 00400 g012
Figure 13. TOA reflectance values obtained from Terra ASTER v3.1 and Landsat 8 OLI imagery for the matchup dates with GONA measurements.
Remotesensing 16 00400 g013
Figure 14. TOA reflectance histograms obtained from Terra ASTER v3.1 and Landsat 8 OLI imagery of the two sites of RVUS and GONA at three bands: green, red, and NIR.
Remotesensing 16 00400 g014
Table 1. Characteristics of Terra ASTER, Landsat 8 OLI, and Landsat 9 OLI.
SensorLaunch YearOrbit TypeSwath WidthSpatial ResolutionEquator Crossing Time
Terra ASTER [22]1999Sun-synchronous60 km15 m10:30 a.m.
Landsat 8 OLI [23]2013Sun-synchronous185 km30 m10:00 a.m.
Landsat 9 OLI [24]2021Sun-synchronous185 km30 m10:00 a.m.
Table 2. Band names and center wavelength values (nm), for the ASTER, L8 OLI, and L9 OLI sensors used in this intercomparison.
Band Centers (nm)
ASTER Band NamesTerra
ASTER
Landsat 8
OLI
Landsat 9
OLI
OLI Band Names
B1 (Green)554561561B3 (Green)
B2 (Red)661655655B4 (Red)
B3N (NIR)807865865B5 (NIR)
Table 3. RadCalNet sites with their coordinates and surface footprints.
SiteFour-Letter NameLat/LonArea (m2)
Railroad Valley PlayaRVUS(38.497, −115.690)1000 × 1000
GobabebGONA(−23.600, 15.120)π × 30 × 30
Table 4. Matchup statistics between clear-sky sensor images and RadCalNet data for Terra ASTER, Landsat 8 OLI, and Landsat 9 OLI over RVUS. The Landsat 8 OLI and Terra ASTER statistics are for dates from April 2013 to August 2023, while the Landsat 9 OLI statistics are for dates from November 2021 to August 2023.
SensorLaunchAvailableSite MismatchAnomalous ConditionGood
Terra ASTER1999507 (~14%)10 (~20%)33 (~66%)
Landsat 8 OLI2013750 (0%)15 (~20%)60 (~80%)
Landsat 9 OLI202180 (0%)1 (~13%)7 (~87%)
Table 5. Matchup statistics between clear-sky sensor images and RadCalNet data for Terra ASTER, Landsat 8 OLI, and Landsat 9 OLI over GONA. The Landsat 8 OLI statistics are for dates from October 2017 to August 2023, the Landsat 9 OLI statistics are for November 2021 to August 2023, and for the statistics Terra ASTER are for April 2019 to August 2023.
SensorLaunchAvailableSite MismatchAnomalous ConditionGood
Terra ASTER1999431 (~2%)2 (~5%)40 (~93%)
Landsat 8 OLI2013490 (0%)3 (~6%)46 (~94%)
Landsat 9 OLI202190 (0%)0 (0%)9 (100%)
Disclaimer/Publisher’s Note: The statements, opinions and data contained in all publications are solely those of the individual author(s) and contributor(s) and not of MDPI and/or the editor(s). MDPI and/or the editor(s) disclaim responsibility for any injury to people or property resulting from any ideas, methods, instructions or products referred to in the content.

