
Equal Emphasis on Data and Network: A Two-Stage 3D Point Cloud Object Detection Algorithm with Feature Alignment

1
The State Key Laboratory of High-Performance Computing, College of Computer Science and Technology, National University of Defense Technology, Changsha 410073, China
2
Beijing Institute for Advanced Study, National University of Defense Technology, Beijing 100020, China
3
College of Advanced Interdisciplinary Studies, National University of Defense Technology, Changsha 410073, China
4
College of Electronic Science, National University of Defense Technology, Changsha 410073, China
*
Author to whom correspondence should be addressed.
Remote Sens. 2024, 16(2), 249; https://doi.org/10.3390/rs16020249
Submission received: 2 November 2023
/
Revised: 22 December 2023
/
Accepted: 5 January 2024
/
Published: 8 January 2024
(This article belongs to the Section AI Remote Sensing)
Abstract
:Three-dimensional object detection is a pivotal research topic in computer vision, aiming to identify and locate objects in three-dimensional space. It has wide applications in various fields such as geoscience, autonomous driving, and drone navigation. The rapid development of deep learning techniques has led to significant advancements in 3D object detection. However, with the increasing complexity of applications, 3D object detection faces a series of challenges such as data imbalance and the effectiveness of network models. Specifically, in an experiment, our investigation revealed a notable discrepancy in the LiDAR reflection intensity within a point cloud scene, with stronger intensities observed in proximity and weaker intensities observed at a distance. Furthermore, we have also noted a substantial disparity in the number of foreground points compared to the number of background points. Especially in 3D object detection, the foreground point is more important than the background point, but it is usually downsampled without discrimination in the subsequent processing. With the objective of tackling these challenges, we work from both data and network perspectives, designing a feature alignment filtering algorithm and a two-stage 3D object detection network. Firstly, in order to achieve feature alignment, we introduce a correction equation to decouple the relationship between distance and intensity and eliminate the attenuation effect of intensity caused by distance. Then, a background point filtering algorithm is designed by using the aligned data to alleviate the problem of data imbalance. At the same time, we take into consideration the fact that the accuracy of semantic segmentation plays a crucial role in 3D object detection. Therefore, we propose a two-stage deep learning network that integrates spatial and spectral information, in which a feature fusion branch is designed and embedded in the semantic segmentation backbone. Through a series of experiments on the KITTI dataset, it is proven that the proposed method achieves the following average precision (AP_R40) values for easy, moderate, and hard difficulties, respectively: car (Iou 0.7)—89.23%, 80.14%, and 77.89%; pedestrian (Iou 0.5)—52.32%, 45.47%, and 38.78%; and cyclist (Iou 0.5)—76.41%, 61.92%, and 56.39%. By emphasizing both data quality optimization and efficient network architecture, the performance of the proposed method is made comparable to other state-of-the-art methods.
1. Introduction
LiDAR, also known as Light Detection and Ranging, is a remote sensing technology that employs laser beams to measure distances and intensities, thereby creating detailed 3D representations of the surrounding environment. In 3D object detection tasks, the most commonly used sensor is LiDAR, which is used to collect a 3D point cloud to capture 3D structure information of the scene [1,2,3,4,5,6]. Owing to its capacity to accurately capture spatial information and generate precise point cloud data, it has garnered significant attention and importance in the field of 3D object detection. With the rise of applications in various fields such as terrain surveying [7,8,9], environmental studies [10,11,12], and more recently, autonomous driving [13,14,15], there has been an increasing demand for robust and accurate 3D object detection systems. LiDAR technology plays a crucial role in meeting this requirement by providing high-resolution point cloud data that can be utilized for object detection, localization, and mapping purposes. One significant advantage of LiDAR in 3D object detection is its ability to capture fine-grained details of objects, such as their shape, size, spatial position, and corresponding intensity information. These detailed pieces of information enable precise identification and tracking of objects, even in challenging scenarios characterized by complex environments [16,17,18,19,20,21,22,23,24]. Furthermore, LiDAR point cloud data are typically less affected by environmental conditions such as lighting variations, making them highly reliable for 3D object detection tasks. It can operate effectively in both day and night conditions, providing consistent and accurate data regardless of the lighting conditions. However, due to the unordered, sparse, and non-uniform distribution of point clouds, as well as the challenges posed by the generation of massive data, the processing and interpretation of point clouds has brought severe challenges. Efficient algorithms and techniques are needed to extract meaningful features from point clouds and achieve precise detection and classification of 3D objects.
In recent years, deep learning has made remarkable progress in computer vision tasks, including fields such as object detection [25,26,27,28,29] and semantic segmentation [30,31,32,33]. Three-dimensional object detection plays an important role in many real-world applications, such as autonomous driving and environmental exploration. However, using deep learning to complete point cloud detection of 3D objects still faces difficult challenges from irregular data of 3D points and the processing of massive amounts of data. Therefore, researchers have conducted in-depth and systematic research in this field.
Based on the different processing methods for point clouds, 3D object detection methods can be divided into three categories: voxel-based methods [34,35,36], point-based methods [37,38,39], and multi-modal methods [40,41,42].
For voxel-based methods, early work typically involved converting the original point cloud into an intermediate regular representation due to the unstructured and unordered nature of 3D point clouds. This was achieved by projecting the 3D point cloud onto 2D image from Bird’s Eye View (BEV) [43] or by transforming it into the dense 3D voxel grids [44]. Then, the mature 2D detection methods can be applied to the 3D object detection task. However, the processing efficiency of voxels is one of the main limitations of this kind of method, since the computational burden grows exponentially with the input. In this regard, Zhou et al. introduced VoxelNet [45], which employs a fully convolutional network architecture for the processing of point cloud data. The method involves partitioning the 3D space into uniform voxels and associating each point with its respective voxel. Subsequently, each voxel is characterized by a fixed-length feature vector encapsulating information pertaining to the existence of objects within the voxel. Ultimately, the approach realizes an end-to-end-trainable deep network framework tailored for 3D object detection. After that, Yan et al. proposed an efficient architecture known as SECOND [46]. This method significantly enhances computational and storage efficiency by reducing the computation load of empty voxels and also overcomes computational barriers inherent in voxel-based networks through the utilization of sparse convolution. In addition, the PointPillars [47] algorithm is also proposed to further simplify voxels into pillar bodies to improve processing efficiency. It shows how all the calculations on the pillars can be formed into a dense 2D convolution, achieving faster performance than other methods. In general, voxel-based approaches can achieve satisfactory detection performance under favorable point-to-voxel conditions. Nevertheless, voxelization inherently results in point loss. Additionally, determining the optimal voxelization presents practical challenges due to the intricate geometry and diverse object types. Consequently, point-based methodologies have emerged as a focal point of recent research efforts.
Different from voxel-based methods, point-based methods directly extract features from unstructured point cloud data to further generate specific proposals for 3D objects. For an unordered 3D point cloud, these methods usually use PointNet++ [39] or another series of methods [48,49,50] to extract semantic features from the point cloud. For instance, Shi et al. proposed PointRCNN [51], a two-stage 3D region proposal framework for 3D object detection. This approach initially utilizes segmented foreground points to generate object proposals, followed by employment of semantic features and local spatial information for the regression of high-quality 3D bounding boxes, achieving state-of-the-art performance on the KITTI dataset. Shi et al. proposed a graph neural network to detect objects from LiDAR point clouds, called Point-GNN [52]. This method efficiently encodes a point cloud in a fixed-radius nearest-neighbor graph, and a box merging and scoring operation was also designed to accurately combine detections from multiple vertices. It is a new point cloud 3D object detection method based on a graph neural network and it has achieved excellent performance on the KITTI dataset. Zhang et al. proposed an efficient single-stage point-based 3D detector called IA-SSD [53]. The key of this method is the use of two learnable instance-aware downsampling strategies to hierarchically select the foreground points of the object. At the same time, a contextual centroid perception module is embedded to further estimate the precise instance centers. It mainly proposes an efficient point cloud 3D object detection method for the sampling problem of the point-based method and has achieved excellent performance on the KITTI dataset. Point-based methods can operate directly on the raw point cloud without any additional preprocessing. However, the primary bottlenecks of point-based methods lie in the challenges posed by massive point cloud, data imbalance, and insufficient network learning capabilities [54,55,56]. Therefore, multimodal approaches have been proposed to enhance the accuracy of 3D object detection by employing joint strategies for matching and feature extraction of 3D point clouds and camera images.
Furthermore, multi-modal approaches match and extract features from 3D point clouds and camera images using a joint strategy. For example, PV-RCNN [57] can extract features from a voxel abstraction network to improve proposals generated from a 3D point cloud backbone network. Its main contribution is the further improvement of the performance of 3D object detection by fusing a voxel-based method and a point-based method in point cloud feature extraction. Jiang et al. proposed a new single-stage voxelized information compensation network with lossless capability, called VIC-Net [58]. The entire framework consists of a point for the branches of geometry detail extraction and efficient scheme generation. It employs PointNet++ [39] to efficiently encode geometric structure feature point clouds from raw data. Then, based on the encoded point features, a point and voxel feature fusion is proposed to achieve 3D object detection. The main contribution is the proposal of a 3D object detection method based on voxelization and information compensation, which improves the accuracy and robustness of the detection. Zhang et al. proposed a two-stage network called FusionPillars [59] to fuse 3D object detection methods from point clouds and camera images. It includes three branches: a point-based branch, a voxel-based branch, and an image-based branch. The modules are designed to enhance the voxel features in the pseudo-image: the set abstraction self-fusion module and the pseudo-view cross-fusion module. The pseudo-images and RGB images at different scales are cross-fused to improve the detection effect of 3D objects. The multi-modal methods enhance the precision of 3D object detection by integrating data from multiple modalities, but they also have some drawbacks. For instance, these methods exhibit high computational complexity and face challenges in acquiring different types of data. Therefore, this paper aims to rely solely on point-based methods, emphasizing the optimization of data quality and network structure to enhance the accuracy of 3D object detection.
This paper is based on practical problems and faces the challenge of 3D object detection with data imbalance and network model validity. For the case of data imbalance, we found that the LiDAR reflection intensity is strong near and weak far in a point cloud scene, and the number of foreground points is significantly smaller than the number of background points. Especially in 3D object detection, the foreground point is more important than the background point, but it is usually downsampled without discrimination in the subsequent processing. To address these challenges, we design a feature alignment filtering algorithm and a two-stage 3D object detection network from both data and network perspectives. The spatial information and intensity information are combined to align the data features, and then the aligned data are used to design a background point filtering algorithm to alleviate the problem of data imbalance. At the same time, a two-stage deep learning network that fuses spatial and spectral information is proposed to further improve the accuracy of 3D object detection.
To summarize, the contributions of this study are as follows:
- For data imbalance, the LiDAR intensity is strong near and weak far in a point cloud scene. The correction equation is introduced to decouple the relationship between distance and intensity, thereby eliminating the intensity attenuation effect caused by distance.
- Further, before network training, it is necessary to achieve a balance between foreground and background points in the data. To address this, a feature alignment filtering algorithm is proposed to preliminarily differentiate between foreground and background points.
- For the network structure, a feature fusion branch module was designed and integrated into the backbone. This branch encodes and integrates the spatial and spectral information of k-nearest neighbors, thereby enhancing the representation ability of local features.
- Through the optimization of data quality and efficient improvements in network architecture as outlined above, the proposed method achieved state-of-the-art performance on the KITTI dataset among point-based methods.
2. Materials and Methods
In this section, the relevant analysis and findings concerning the presence of imbalance in the experimental dataset are initially introduced. Subsequently, the feature alignment filtering algorithm, designed to mitigate the issue of dataset imbalance, is presented. Finally, the proposed two-stage 3D object detection framework for identifying cars, pedestrians, and cyclists solely based on point cloud input is demonstrated.
2.1. The KITTI Dataset
It is noteworthy that many public datasets for 3D object detection have been published in recent years [60,61,62,63,64], which greatly promotes the rapid development of 3D object detection methods. Among them, the KITTI dataset [46] plays an important role in 3D object detection algorithms, providing diverse samples containing images from a camera and corresponding point clouds from LiDAR. Moreover, most outstanding 3D object detection methods use the KITTI dataset for evaluation, so we can easily compare the proposed method with the mainstream methods.
The KITTI dataset is a widely utilized open-source resource for 3D object detection. It encompasses a substantial amount of real-world data collected in complex environments, such as roadways, pedestrians, and vehicles. The evaluation tasks within KITTI are categorized into three levels of difficulty—easy, moderate, and hard—primarily based on factors including object size, occlusion, and truncation. KITTI’s validation predominantly employs average precision (AP) and frames per second (FPS) as the evaluation metrics for 3D object detection. In summary, the KITTI dataset offers a highly practical platform, providing researchers with rich and authentic data for the study, evaluation, and comparison of various algorithms related to 3D object detection. Therefore, this paper also utilizes the KITTI dataset for experiments and validation.
2.2. Analysis of Data
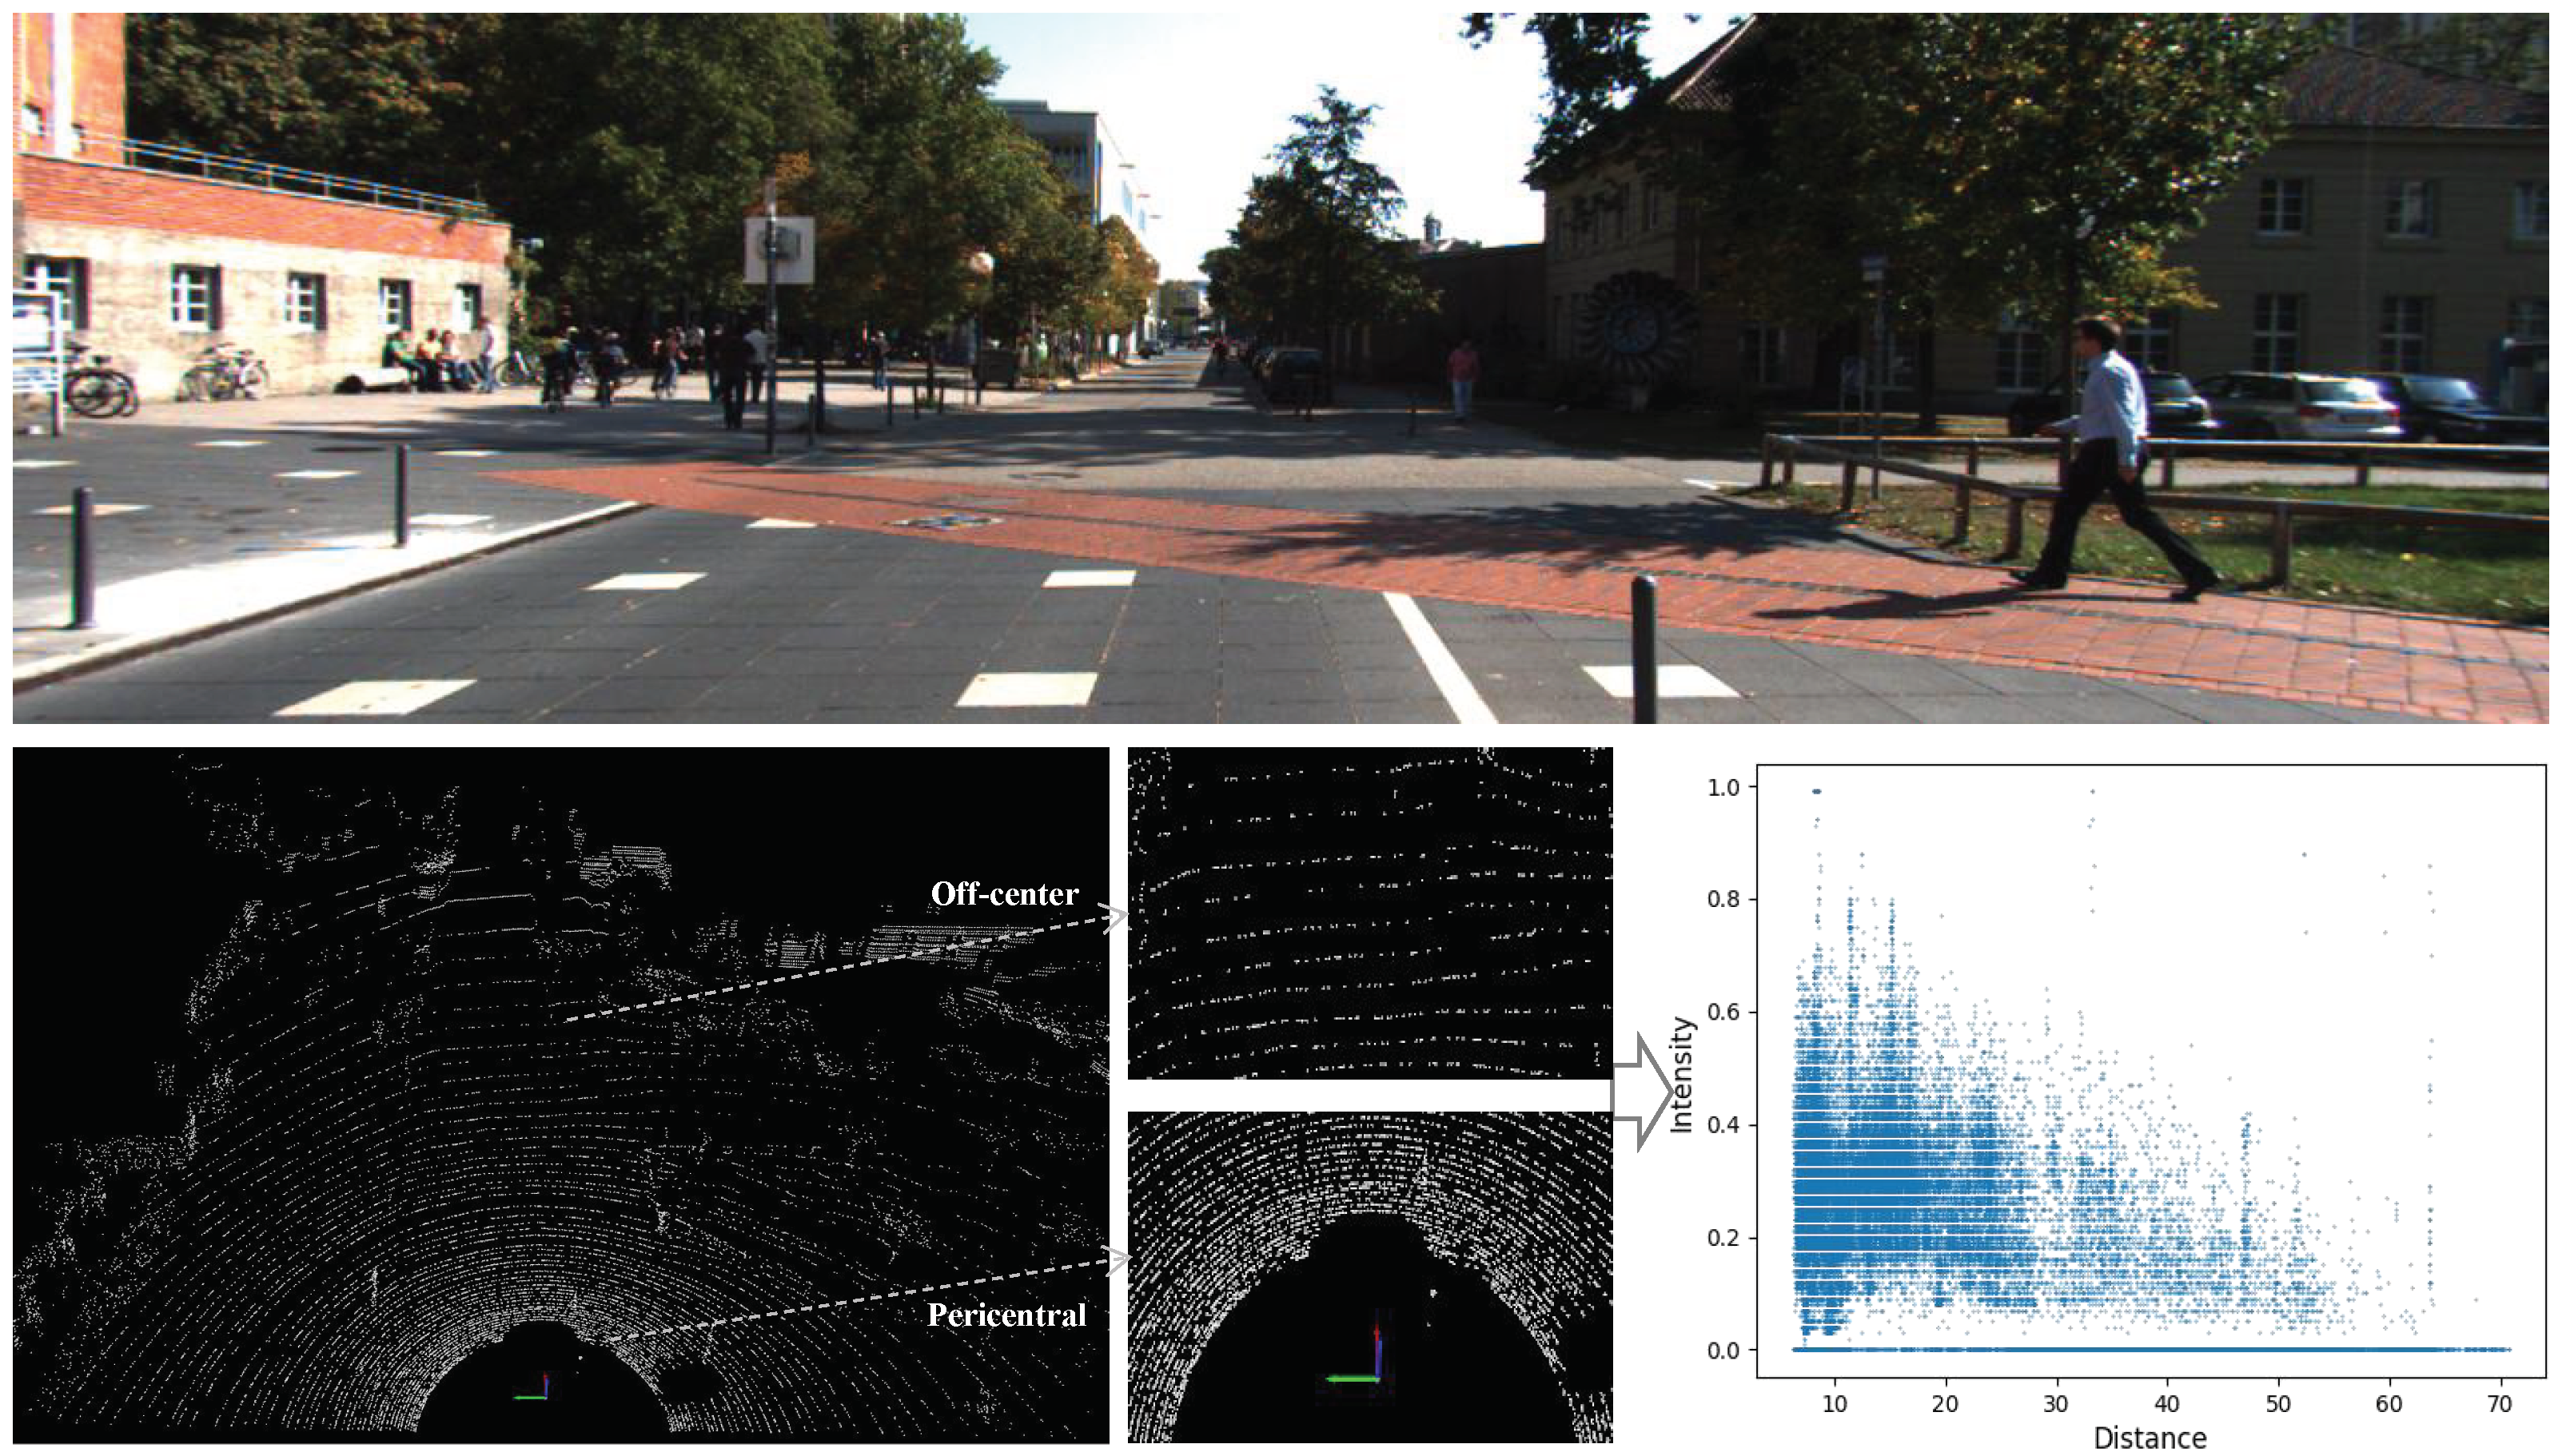
Data quality is crucial in network training. Quality data can reflect the real input information more accurately so as to improve the training effect of the model. If the data contain a lot of noise or errors, then the model may be misled, resulting in a poorly trained model. Obviously, there is also the problem of data imbalance in the field of 3D object detection [53]. Three-dimensional object detection primarily operates on point cloud data, which represent the environment using 3D coordinates of individual points. Each point typically contains additional information such as intensity or color. Three-dimensional object detection algorithms leverage various features to identify and localize objects in a point cloud. In addition to localization, 3D object detection aims to classify objects into different categories such as cars, pedestrians, cyclists, etc. However, in the process of scanning and collecting points centered on LiDAR, there will inevitably be the problem of data imbalance, which may affect the accuracy of the subsequent detector results if ignored. Specifically, in the KITTI dataset adopted in the experiments, we found that the distributions of point clouds are dense near the center and sparse far away from the center, while the collected reflection intensity values are also strong near and weak far away. Furthermore, we also calculated the distribution of reflection intensity in the collected point cloud scene. It can be seen that in the space with the collection center as the origin, with an increase in distance, the intensity value of the point cloud roughly shows an attenuation distribution. In other words, the intensity characteristic of the point cloud presents a phenomenon that is strong near the center and weak away from the center, as shown in Figure 1.
As observed, the point cloud scene captured by LiDAR exhibits a fan-shaped pattern, emanating outward from the light source. Additionally, with an increase in detection distance, the radiation intensity of LiDAR diminishes, resulting in a distribution of the entire point cloud scene that is more densely distributed near and sparser far away, characterized by higher reflection intensity values at the close position and lower at the far position. The point cloud acquisition LiDAR for the KITTI dataset is the Velodyne HDL-64E [46] with a scan rate of 10 Hz and a maximum measurement distance of 100 m. The device uses a rotational scanning mode to acquire 3D point cloud data of the surrounding environment through a laser transmitter and receiver. According to the principle of laser reflection [47], as shown in Equation (1), the intensity of laser reflection is inversely proportional to the square of the reflected distance of the object.
where R is the distance, is the reflectance, is the incidence angle, and is the attenuation coefficient. From this, it can be assured that there is an attenuation in the intensity value with an increase in the reflection distance. The data analysis above reveals the existence of data imbalance in the LiDAR point cloud scene. Specifically, in point cloud 3D object detection, the attenuation of LIDAR radiation intensity with distance introduces an imbalance. For the same target, different positions from the acquisition center will lead to different intensity values, which will inevitably lead to inconsistent features of subsequent network feature extraction and ultimately affect the detection results. Therefore, it is necessary to design a feature alignment filtering algorithm as a priority to mitigate this data imbalance issue.
2.3. Data Feature Alignment
The KITTI dataset is a popular benchmark for autonomous driving and object detection tasks. This dataset was collected in urban environments, rural areas, and highways and provides sequences of images and LiDAR data where certain objects (like cars, pedestrians, and cyclists) are annotated with bounding boxes. In particular, on the KITTI dataset in our experiment, we found that the distribution of the point cloud is dense near the center and sparse far away from the center, and the collected reflection intensity values also show strong near/weak far characteristics. However, in the subsequent network training, the point-based pipeline usually adopts indiscriminate random sampling or farthest point sampling to gradually downsample and extract features from the input point cloud, although not all points are equally important for the object detection task. Inspired by this, we propose a feature alignment filtering algorithm to complete the preliminary distinction between the foreground and background points. The specific idea and operation steps are as follows.
For a collected point cloud, each point contains the spatial position information (x, y, z) and the intensity value of the reflection. Based on the aforementioned finding, as the reflection intensity decays with increasing distance in point cloud object detection, the same target exhibits different intensity features due to its varying position relative to the acquisition center. As Equation (1) indicates, the raw intensity value is inversely proportional to the square of the distance. With this in mind, we can calculate the spatial distance between each point based on its coordinates. To eliminate the attenuation effect caused by distance and achieve feature alignment, we introduce a correction calculation that decouples the relationship between distance and intensity, as shown in Equation (2).
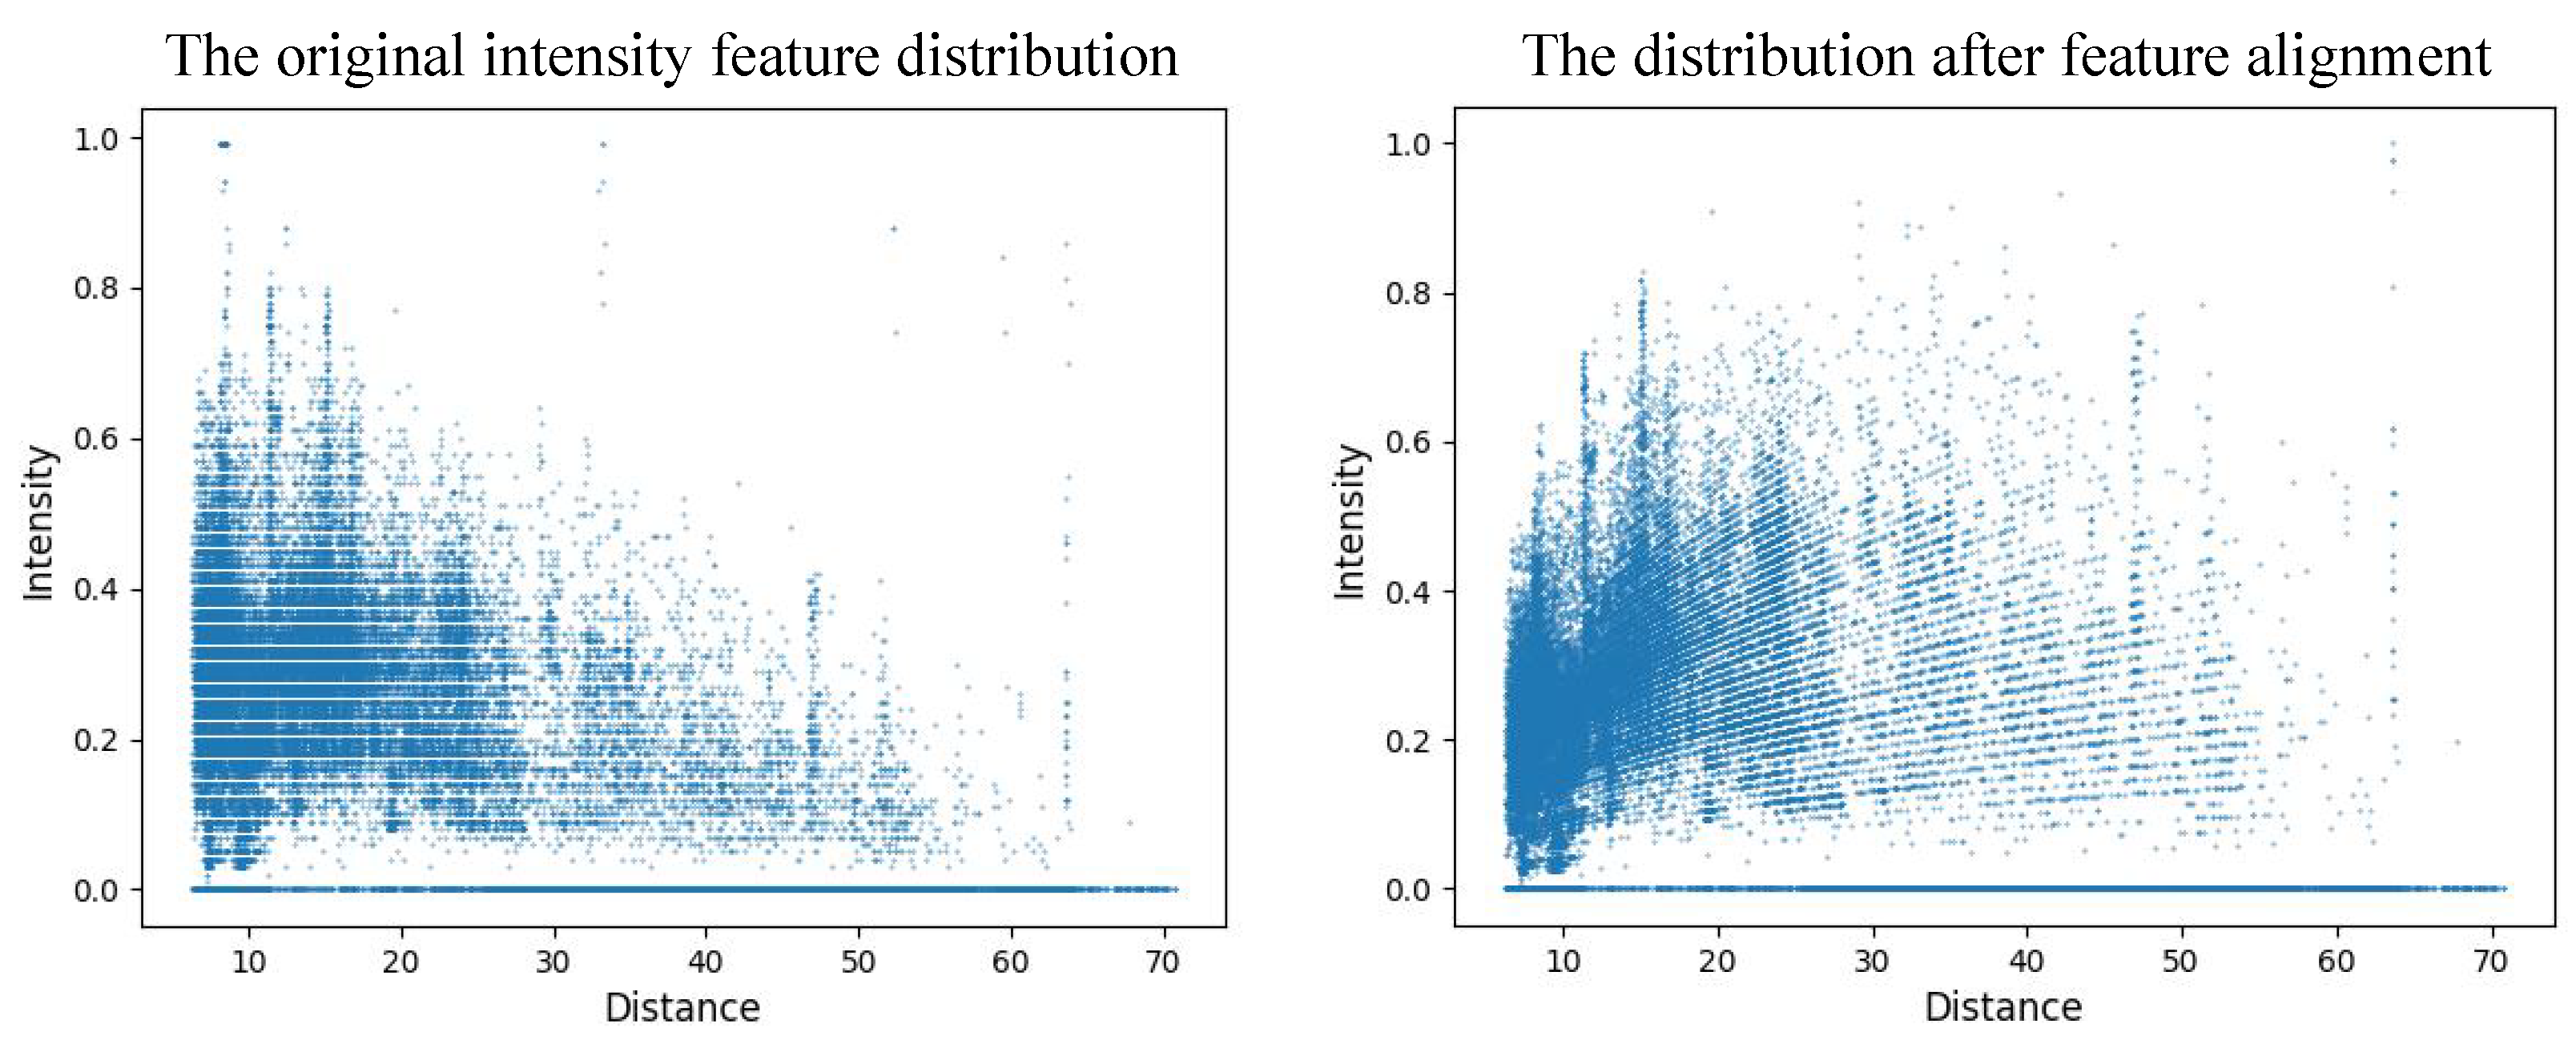
where Ic is the corrected intensity feature, Io is the original intensity feature, i represents traversing each point, and is the impact factor used for conditioning. In the specific implementation, the alignment of input points is initially performed according to Equation (2) to eliminate the influence of distance attenuation. This process is based on the principle that the original intensity values of the point cloud are inversely proportional to the square of the distance. Initially, the spatial distance for each point is computed, followed by the multiplication of the intensity with the influence factor to obtain the corrected intensity value. As shown in Figure 2, it illustrates the comparison of point intensity features before and after alignment.
By comparing the distribution of point intensity features in Figure 2, it can be seen that the trend of intensity attenuation with increasing distance has been addressed after the feature alignment process.
After feature alignment is completed, it is worth noting that feature extraction is a very crucial step in the subsequent network training process for 3D object detection. However, during the feature extraction, the point-based pipeline usually adopts indiscriminate random sampling or farthest-point sampling to gradually downsample and extract features from the input point cloud, although not all points are equally important for the object detection task. Moreover, the number of foreground points is often less than the number of background points, but they are downsampled and filtered without discrimination. On this basis, a classification filtering algorithm is proposed to preliminarily distinguish the foreground points and background points. The redundancy can be removed and the data balance can be improved by retaining the foreground points and filtering certain background points. Next, we will introduce the proposed classification filtering algorithm.
2.4. Feature Alignment Filtering Algorithm
In the actual 3D object detection scene, the points of interest are usually a small number of points in some local regions. Three-dimensional object detection focuses on the few but critical foreground points (i.e., instances of interest, including cars, pedestrians, and cyclists in the scene). In fact, not all points are equally important for 3D object detection. However, existing point-based detectors usually employ indiscriminate downsampling methods in their framework, such as random sampling or farthest point sampling. That is, foreground and background points are sampled and filtered out indiscriminately, which may result in missing key points for subsequent feature extraction [53]. Therefore, it is necessary to achieve data balance between foreground and background points before feature extraction. To this end, we propose a feature alignment filtering algorithm to initially distinguish foreground points from background points. Then, data balance is achieved by filtering out some background points. The specific principles and steps are described below.
Firstly, the alignment intensity features of input points were obtained by alignment operation using the feature alignment equation mentioned above. Subsequently, we employ the aligned intensity information as input features for classification. Here, we learn from the Kmeans++ classification method [65] to roughly classify the input points into two types of points with small and large intensity values. Through the above presentation and analysis of Figure 2, we can see that some points with weak intensity values are still tiny after feature alignment, which cannot provide valuable information for feature extraction. Therefore, these points need to be filtered out appropriately. Here are the steps:
- Initialize: Here, we consider that if all initial clustering centers are randomly chosen, this may lead the algorithm to converge to a locally optimal solution. Therefore, we adopt a heuristic approach, which first randomly selects a point as the first clustering center. Then, for each point in the dataset, the weight of the remaining points to be selected as the next clustering center is calculated, and the point with the highest weight is chosen as the next centroid. This method ensures that the initially chosen centroids are closer to the global optimal solution. Here, we use aligned intensity features as the measure of clustering for binary classification. The calculation of the probability of selecting the cluster center is shown in Equation (3).where Pi is the probability that each point is chosen as the cluster center, I(x0) is the strength eigenvalue of the initial centroid, and N is the total number of points. For each point xi, the probability that each point is selected as the cluster center can be calculated, where the point with the largest value is the next cluster center.
- Assign points to clusters: For each point in the dataset, calculate its feature distance to each cluster center, and assign it to the cluster with the nearest cluster center.
- Update cluster centers: For each cluster, calculate the mean value of all points in the cluster, and update the cluster center to this mean value.
- Repeat steps 2 and 3 until the cluster centers no longer change.
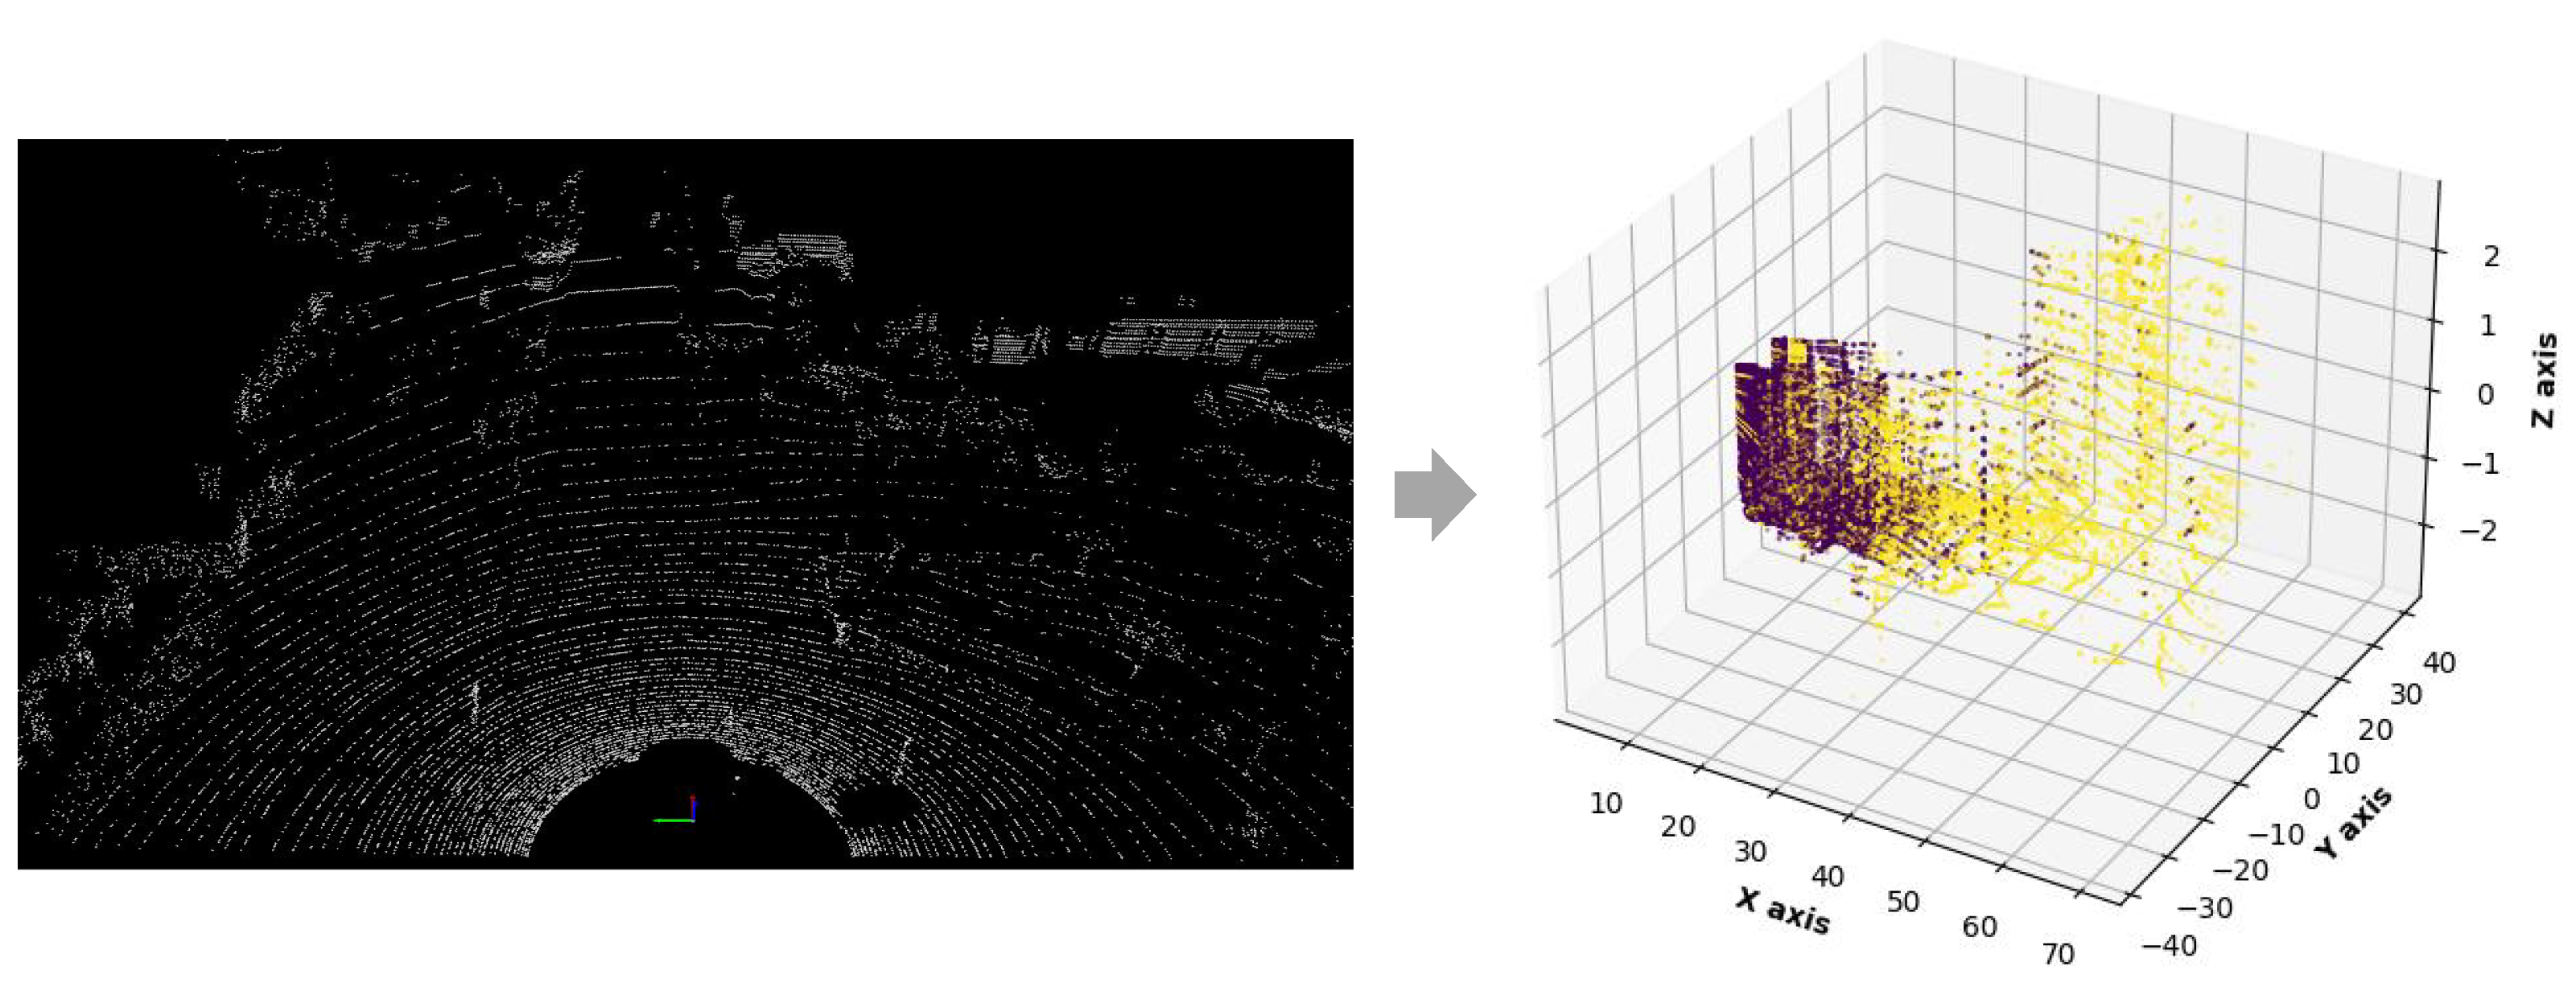
Through the above classification methods, we divided the input points into two categories, among which a group of point cloud classification results are shown in Figure 3.
Shown in the figure is a group of input point cloud classification results. Here, we use the alignment intensity feature as the clustering measure of binary classification. In this point cloud scene, the classification points of the two categories are 40,179 and 8973, which are roughly divided into foreground and background points. In 3D object detection, the targets we are interested in are often composed of a small number of points in a small region. Thus, foreground points are roughly contained in the smaller class of points. The background points are included in the large number of categories. Consider that in subsequent network training, the point-based pipeline uses indiscriminate farthest-point sampling to progressively downsample and extract features from the input point cloud, although not all points are equally important to the target detection task. While foreground points tend to be fewer in number than background points, they are still indiscriminately downsampled and filtered. Based on this, we utilized the classification filtering algorithm to preliminarily distinguish foreground points from background points. Finally, the foreground points are preserved and some background points are filtered to improve the data balance. After completing the enhancement of data quality, we propose a two-stage deep learning network that further improves the accuracy of 3D object detection by fusing spatial and spectral information.
2.5. Framework of Two-Stage Detection Network
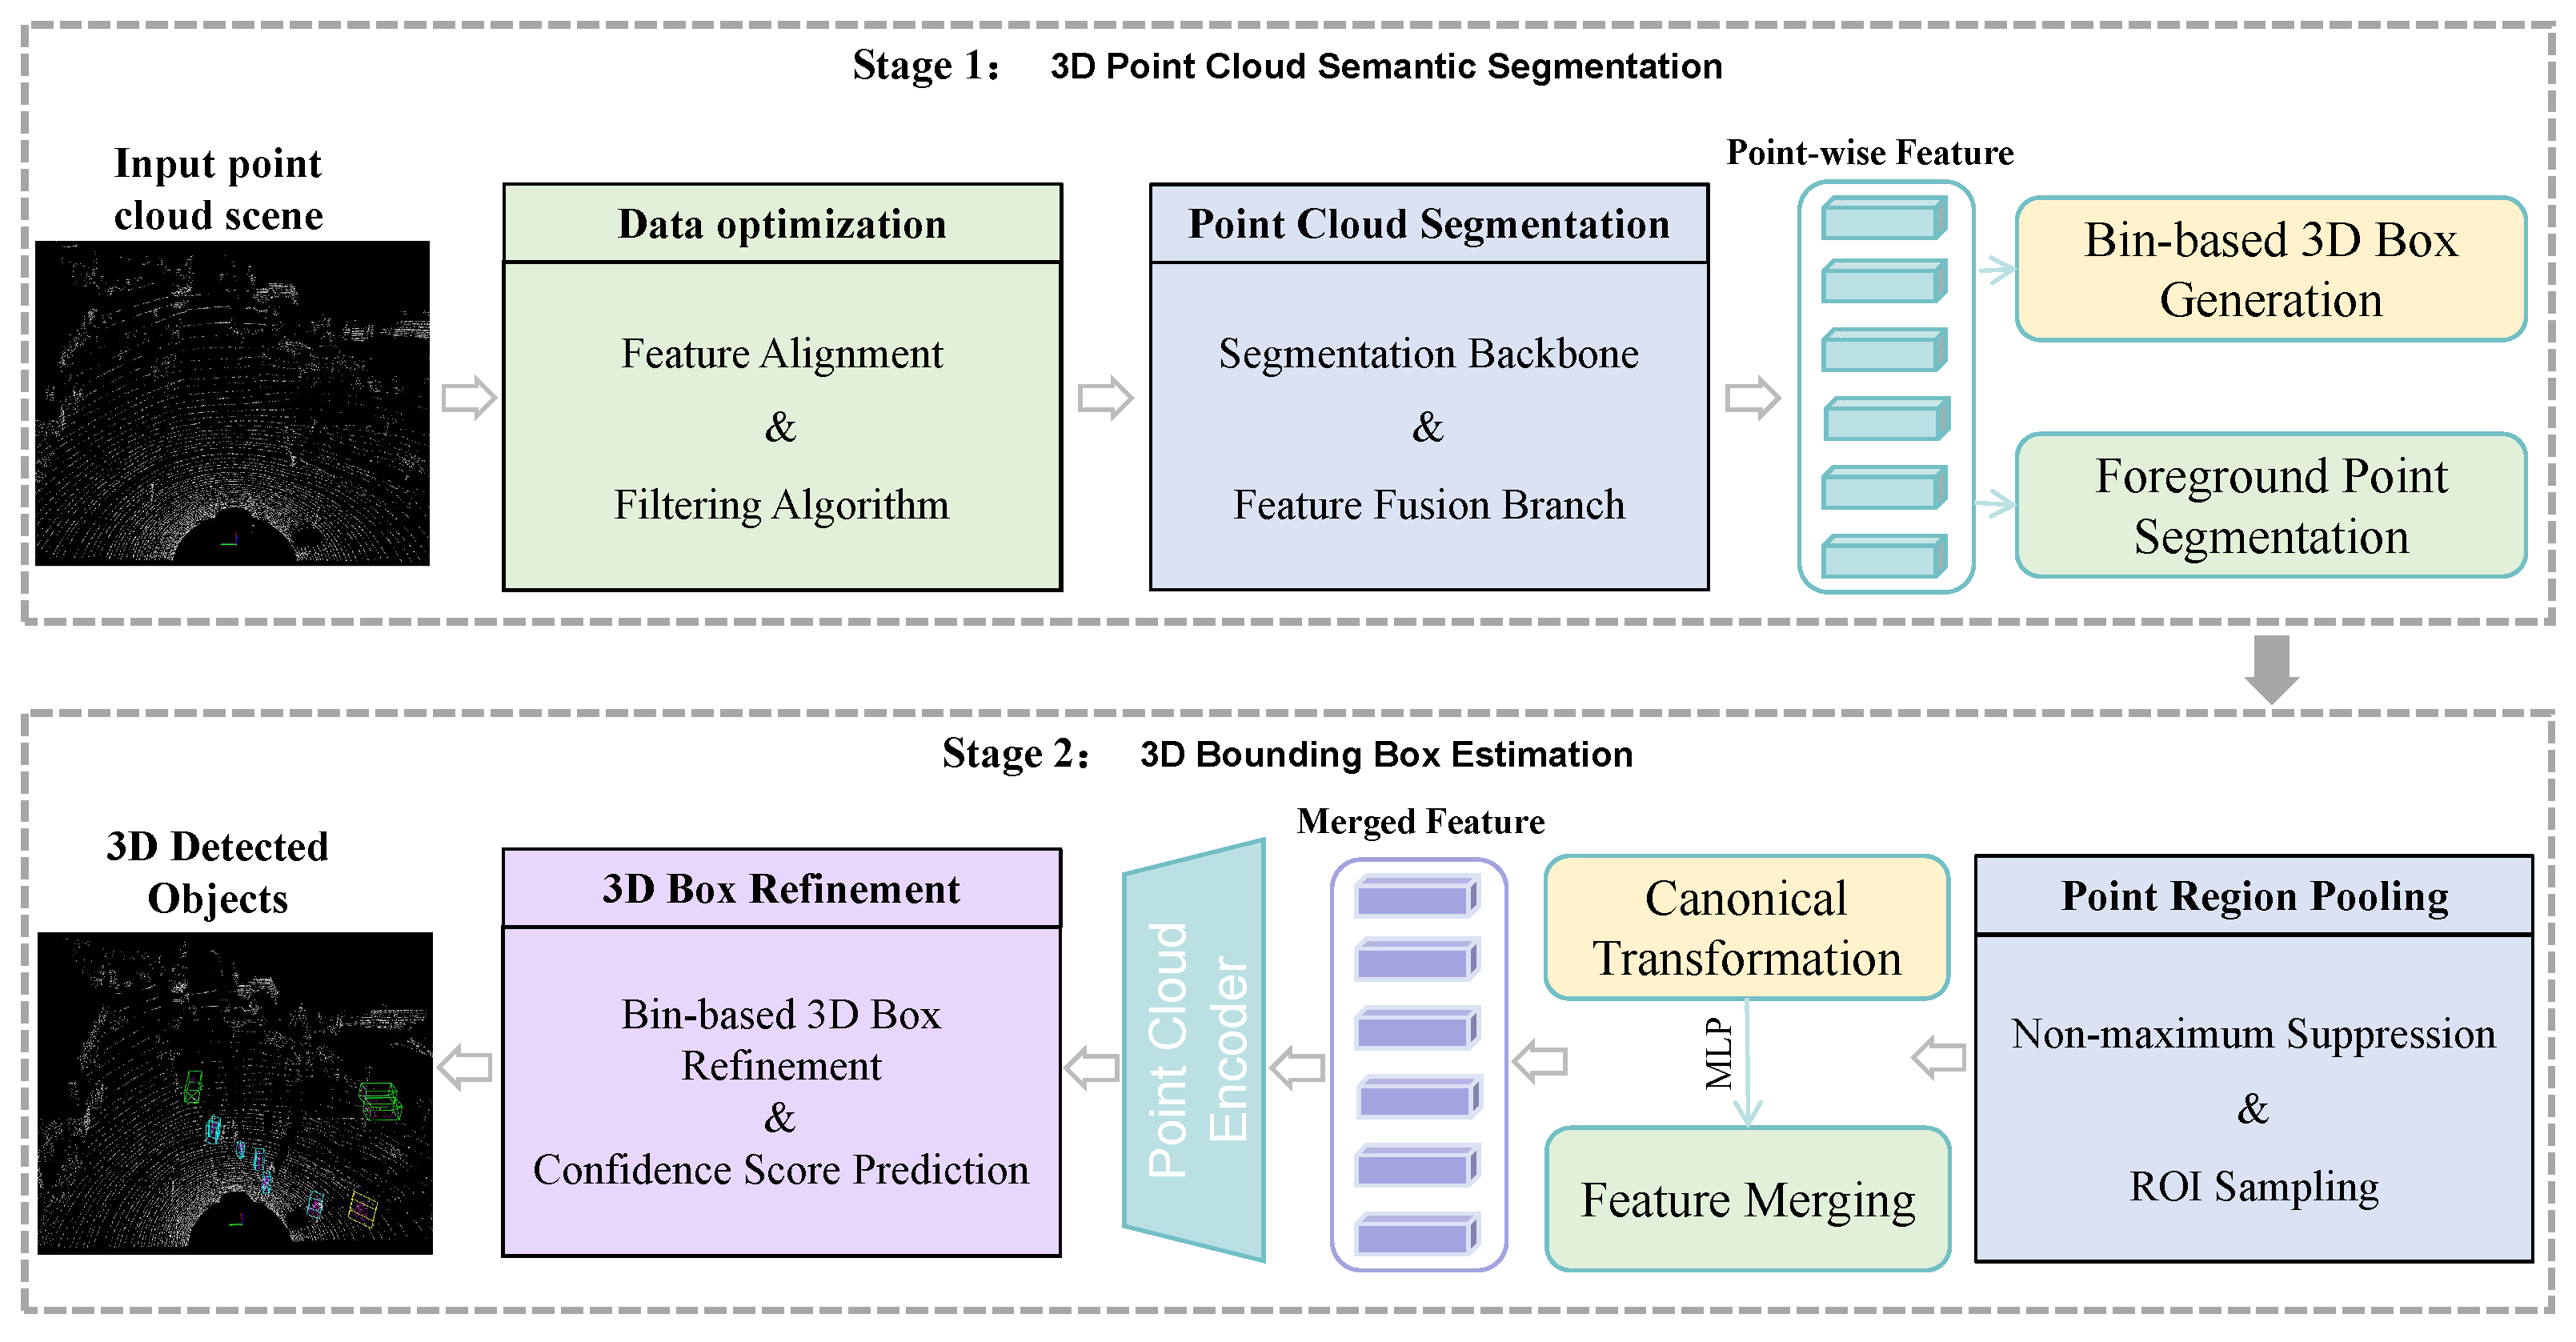
Two-stage 3D object detection is a type of detection approach where two stages are employed to achieve more accurate object localization and classification. In this paper, we adopt the backbone architecture of a two-stage network called PointRCNN [34] and fuse spatial and aligned spectral information to achieve 3D object detection. It consists of two main stages: a 3D point cloud segmentation stage and a 3D bounding box estimation stage, as shown in Figure 4.
Specifically, the first stage is data optimization and point cloud semantic segmentation (Stage 1): The first is the feature alignment filter algorithm to complete the optimization of the data. Then, PointNet++ [39] is used as the backbone for semantic segmentation of the input point cloud, and a prediction label is obtained for each point. Meanwhile, we implement a module based on spatial and spectral information fusion in the semantic segmentation backbone to improve the accuracy of point segmentation, thus helping to generate high-quality 3D proposals for objects. For example, label = 1 is assigned to all points judged to be cars (called foreground points), and label = 0 is assigned to other points (called background points). Then, all foreground points are used to generate bounding boxes, one foreground point corresponds to one bounding box, and then non-maximum suppression (NMS) is applied to remove overlapping proposals.
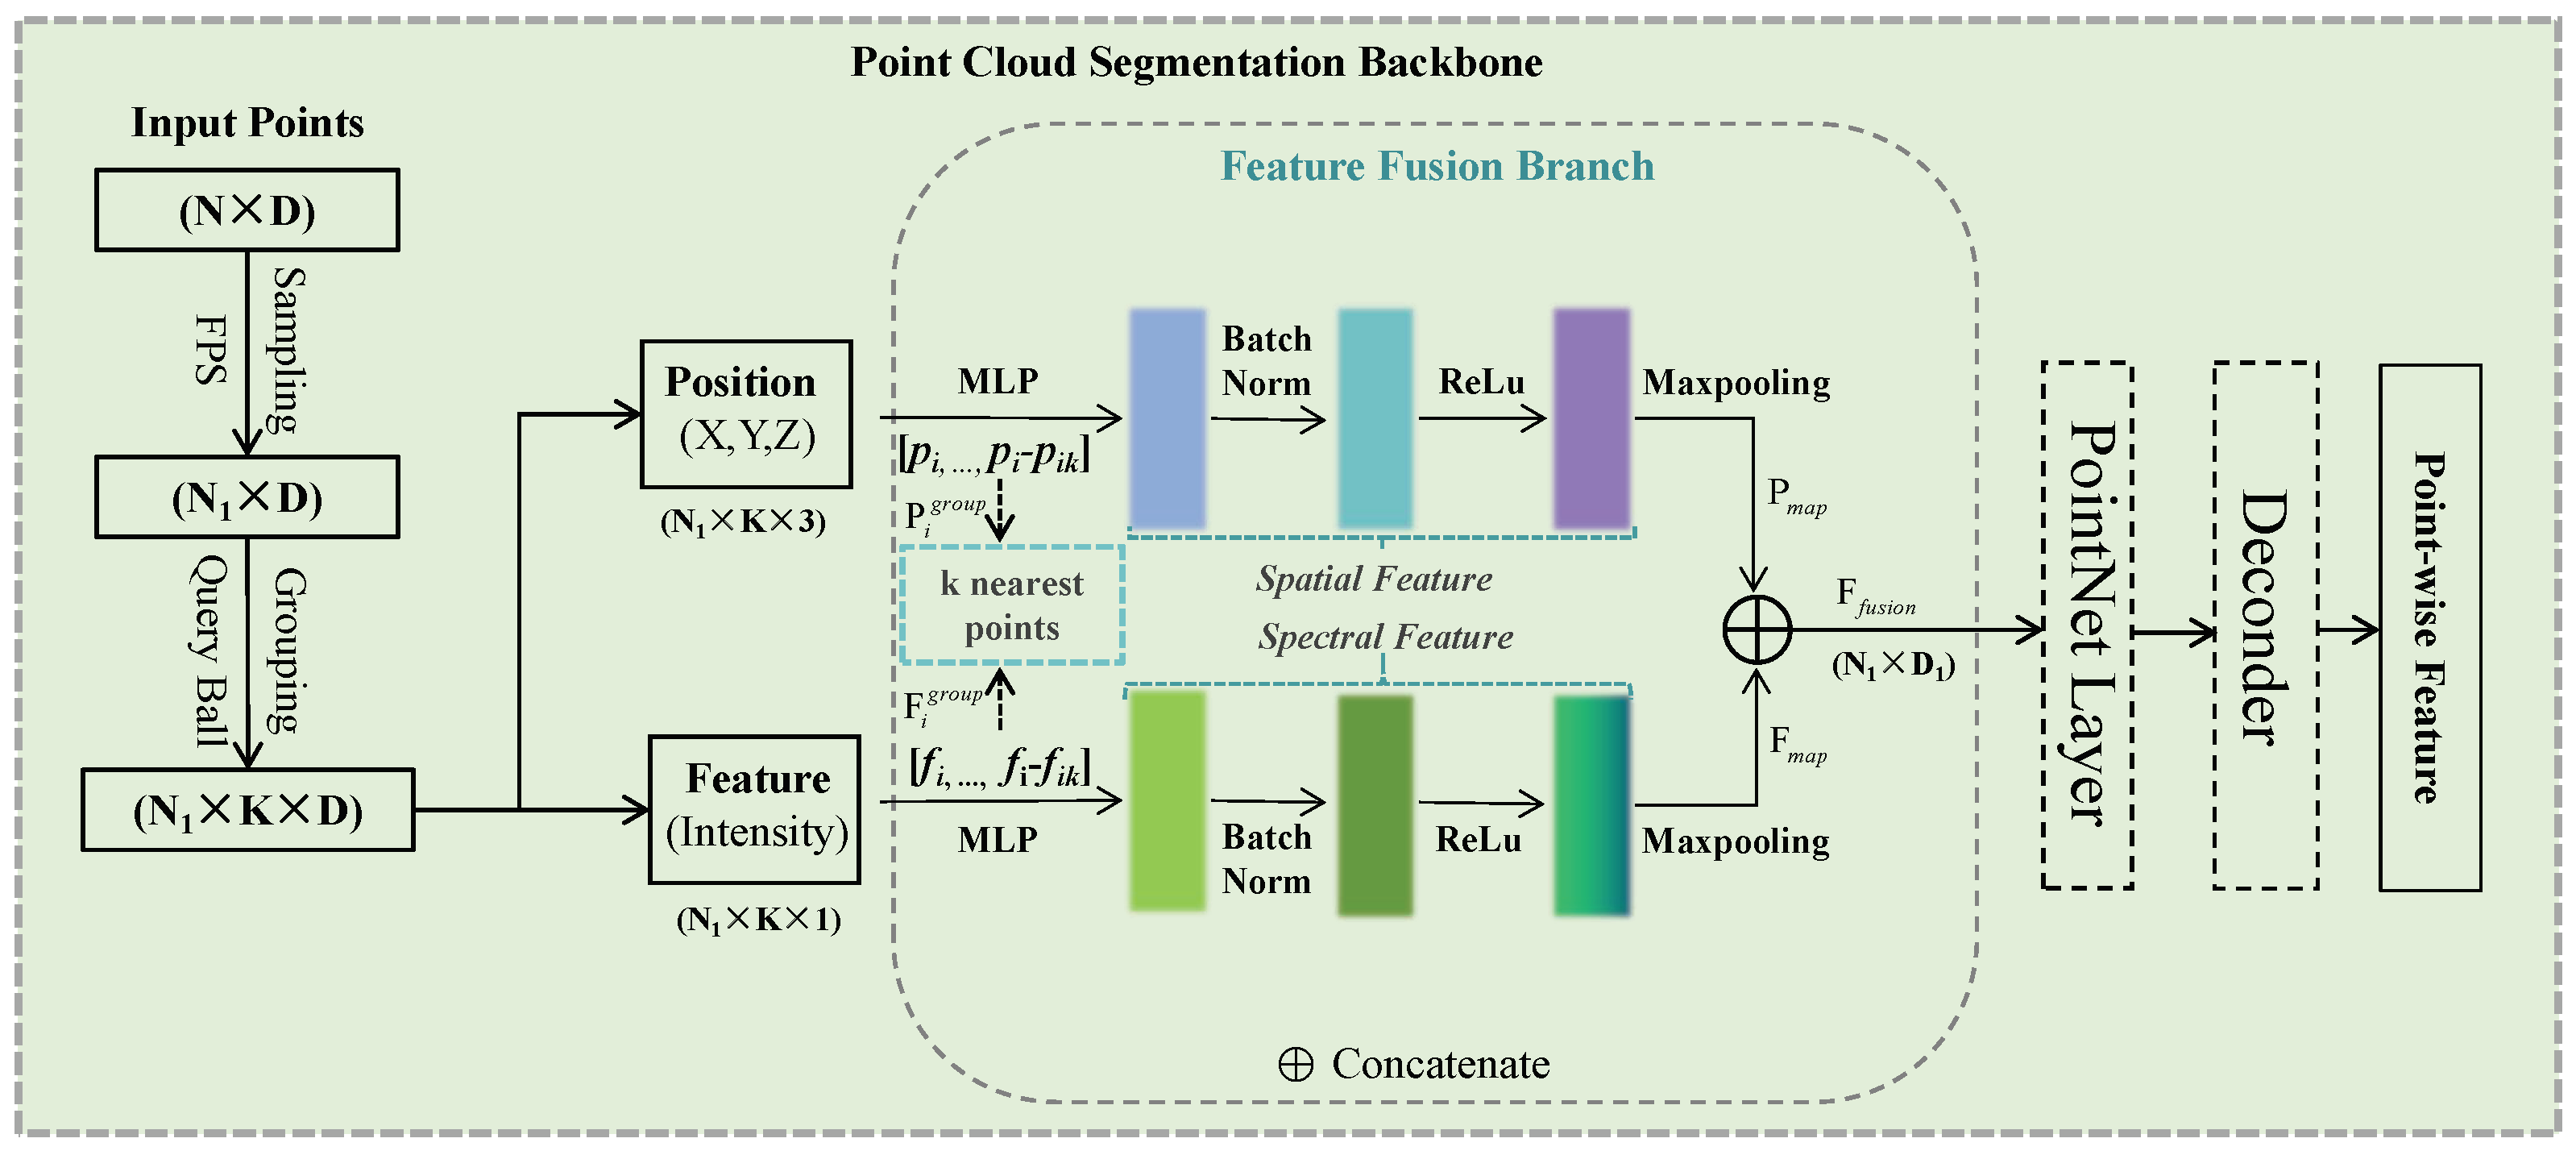
The second stage is 3D bounding box estimation (Stage 2): First, RoI pooling is applied to extract the features of each 3D proposal, and the network is used to predict 3D bounding box parameters, including position, size, and orientation. Meanwhile, the generated bounding boxes are rotated and translated, and these bounding boxes are converted to canonical coordinates. Finally, correction of the bounding box and calculation of the confidence score are performed to obtain the final bounding box. In the process described above, the accuracy of semantic segmentation in the first stage plays a crucial role, as its accuracy affects the accuracy of subsequent 3D object detection. Therefore, improving the accuracy of semantic segmentation in the first stage is also a key focus of this paper. When performing semantic segmentation on the input point cloud to extract features, we further improve the segmentation accuracy by fusing the spatial and spectral information. To this end, we design and add the feature fusion branch module in the semantic segmentation network, as shown in Figure 5. The point cloud semantic segmentation backbone network design focused on feature fusion, and the main effort is to incorporate a feature fusion branch that is able to encode and fuse the spatial and spectral information of k nearby points to improve the representation of local features.
From Figure 5, it can be seen that the design of the feature fusion branch is based on the encoded fusion of spatial and spectral features. Specifically, after completing the sampling and grouping, N1 points and their adjacent k points are obtained. We encode the spatial and spectral feature correlation of these points separately and then concatenate them together to provide certain sequential information. The following are the operational steps of this process mainly conducted in the spatial and spectral branches.
Firstly, the local feature group is established. For each point N1 obtained through grouping, its local feature group is established with the point itself as the center, including its own feature and the difference information between itself and adjacent points, as shown in the following equations:
Here, the input point cloud features consist of two parts: the geometric space, which has three channels, and the spectrum, which has one channel and each point has k nearest neighbor points. pi and fi are the spatial and spectral features of the center point, respectively, and and are the features of the neighboring points.
In the second step, an encoding operation is performed on the local feature group, and then the features are obtained by max pooling to represent the overall local features, as shown in the following equation.
We perform a Multi-Layer Perceptron (MLP) + BatchNorm (BN) + ReLu operation on the local feature group and then obtain the encoded features with max pooling. After performing the above operations on the spatial and spectral branches, the obtained feature maps are concatenated to form the final encoded features, as shown in the equation below.
Then, the encoded features are transmitted to the next PointNet Layer [51] and Decoder for further point-wise feature extraction and 3D bounding box estimation [66]. By incorporating the aforementioned modifications to the network architecture, it is possible to effectively integrate the semantic information of local regions within point clouds. This facilitates the enhancement of the network model’s first step in achieving point-wise segmentation accuracy.
In the second stage, the 3D bounding box estimation process remains consistent with the original PointRCNN’s [51] processing approach. That is, after completing point-wise feature extraction and generating 3D proposals, point cloud region pooling is applied to pool the learned point representations from stage 1. The pooled 3D points are transformed into canonical coordinates and combined with the pooled point features and stage 1 segmentation masks to achieve coordinate optimization. This strategy fully utilizes the information provided by the segmentation in stage 1 to complete the 3D box refinement and the final detection. Subsequently, we conducted experiments on the KITTI dataset to validate the proposed method.
3. Experiments and Results
In this section, we validate the proposed 3D object detection method on the challenging open-source benchmark KITTI dataset. This dataset consists of three main categories, namely, car, pedestrian, and cyclist. Firstly, we present the experimental setup details. Subsequently, we compare our method with state-of-the-art 3D detection methods. Finally, ablation studies are performed to analyze the effectiveness of the components in the proposed method. In addition, the proposed method is modified from the open-source PointRCNN (https://github.com/open-mmlab/OpenPCDet (accessed on 4 January 2024)). To ensure a fair comparison, the main experimental settings in this paper remain consistent with the original model, with modifications made only to the relevant components associated with the proposed innovative model.
3.1. Experiment Implementation Details
For each 3D point cloud scene in the training set, a batch consists of 16,384 points as input. In the stage 1 sub-network, we adhere to the designed network structure with the feature fusion branch. This involves using four set abstraction layers with multi-scale grouping to downsample the point cloud into groups of sizes 4096, 1024, 256, and 64. Subsequently, four feature propagation layers are employed to obtain point-wise features used for segmentation and proposal generation.
The benchmark for 3D object detection in the KITTI dataset consists of 7481 training samples and 7518 testing samples. We followed the commonly applied training split, where the training samples were divided into a training set (3712 samples) and a validation set (3769 samples). All method models were trained on the training set and evaluated on the testing and validation sets. To maintain consistency, the proposed method also utilizes the same loss function as PointRCNN. The proposed two-stage 3D object detection algorithm utilizes focal loss in the first stage to differentiate between foreground and background points, while the complete bin-based loss is used for generating 3D box proposals. For the stage 2 sub-network, a combination of cross-entropy loss and smooth L1 loss is employed to achieve accurate localization results. Additionally, the Adam optimizer is utilized to expedite model convergence and enhance performance. During training, the network was subjected to 80 epochs of training with a batch size of 3 and a learning rate set at 0.001, incorporating a learning rate decay strategy. In addition, the experimental machine is equipped with an Intel Core i7-11700 @2.5GHz CPU and NVIDIA GeForce RTX3060 GPU.
3.2. Three-Dimensional Object Detection on the KITTI Dataset
In this study, all experiments are conducted based on the KITTI dataset. The KITTI dataset provides LiDAR point cloud and corresponding image samples, encompassing 7481 training samples and 7518 testing samples. The training samples are divided into two subsets: a training set consisting of 3712 samples and a validation set comprising 3769 samples. The dataset comprises three categories: car, pedestrian, and cyclist. Moreover, the dataset’s detection is stratified into three difficulty levels based on the size, occlusion level, and truncation of each category: easy, moderate, and hard. Furthermore, to ensure an objective comparison, we adopt average precision (AP) with recall 40 positions as a comprehensive evaluation criterion [67].
where R is the total number of recall points, and ρ (r) is the precision at recall r. When calculating the average precision (AP), each recall point is traversed. The maximum precision value among all recall points that are greater than or equal to the current recall point is selected and summed. Finally, this sum is divided by the number of recall points to obtain the final AP value. The value of the AP ranges from 0 to 1, with a higher value indicating better performance.
Firstly, we trained and tested the proposed method on the KITTI dataset and the detection results obtained on the test set are shown in Table 1, which contains the detailed detection results with three difficulty levels on the three categories.
It can be seen that, overall, our network has a positive detection effect on the three categories. In the typical focus on 3D benchmark, our experimental results demonstrate that the proposed method achieves the following average precision (AP_R40) values for easy, moderate, and hard difficulties, respectively: car (Iou 0.7)—89.23%, 80.14%, and 77.89%; pedestrian (Iou 0.5)—52.32%, 45.47%, and 38.78%; and cyclist (Iou 0.5)—76.41%, 61.92%, and 56.39%. Compared with the baseline method PointRCNN, each metric has been improved to varying degrees. Further, we validated our method on the KITTI 3D object detection benchmark and compared it with results achieved by state-of-the-art models, as presented in Table 2.
We report the results of different methods on the test set of the KITTI dataset in Table 2. These methods include voxel-based, point-based, and multi-modal approaches. It can be seen that: (1) The proposed method achieves the best car (at hard level, 77.89%) detection performance, even outperforming three multimodal detectors. This is mainly attributed to the proposed feature alignment filtering algorithm, which effectively preserves foreground points and enables accurate detection of small objects. Moreover, the fusion branch of the network enhances the accuracy of foreground point segmentation. (2) Compared to other point-based detectors, our approach also achieves nearly optimal car detection performance, surpassing the benchmark PointRCNN by 2.27%, 4.5%, 2.25% respectively. (3) In terms of pedestrian and cyclist detection performance, our method shows a commendable performance even though it cannot achieve all-around results. (4) In terms of real-time performance, compared with the FPS index of the baseline method PointRCNN, the proposed method also improves FPS by 53%.
For 3D detection results, our method achieves better results than the previous LIDAR-only method for monocular detection, but its performance is generally slightly worse than that of the method with multi-modes. A possible reason is that our method only uses a sparse point cloud as input, and the image combined with the point cloud can capture more detail to aid in 3D detection. As can be seen, although most advanced methods have achieved excellent results by utilizing both camera RGB images and point clouds as inputs, our approach solely utilizes a point cloud as the input and achieves comparable performance through both emphases on data quality optimization and an efficient architecture. Compared to the baseline PointRCNN, our approach achieved average accuracy improvements of at least 1.45% (pedestrian at hard level) and up to 7.19% (car at hard level) at different difficulty levels. In addition, through the optimization of data quality, the index of detection efficiency FPS is also improved by 53%. Particularly, the proposed method demonstrates obvious improvements in the classification of cars, pedestrians, and cyclists, which means that our network has achieved satisfactory results in detecting small object points. It is worth mentioning that the 3D detection results have achieved noteworthy performances for the most important car category, reaching 89.23%, 80.14%, and 77.89%, for easy, medium, and hard difficulties, respectively. Furthermore, in the most challenging situations, the detection performances of the car, pedestrian, and cyclist categories at the hard level reached 77.89%, 38.78%, and 56.39%, respectively.
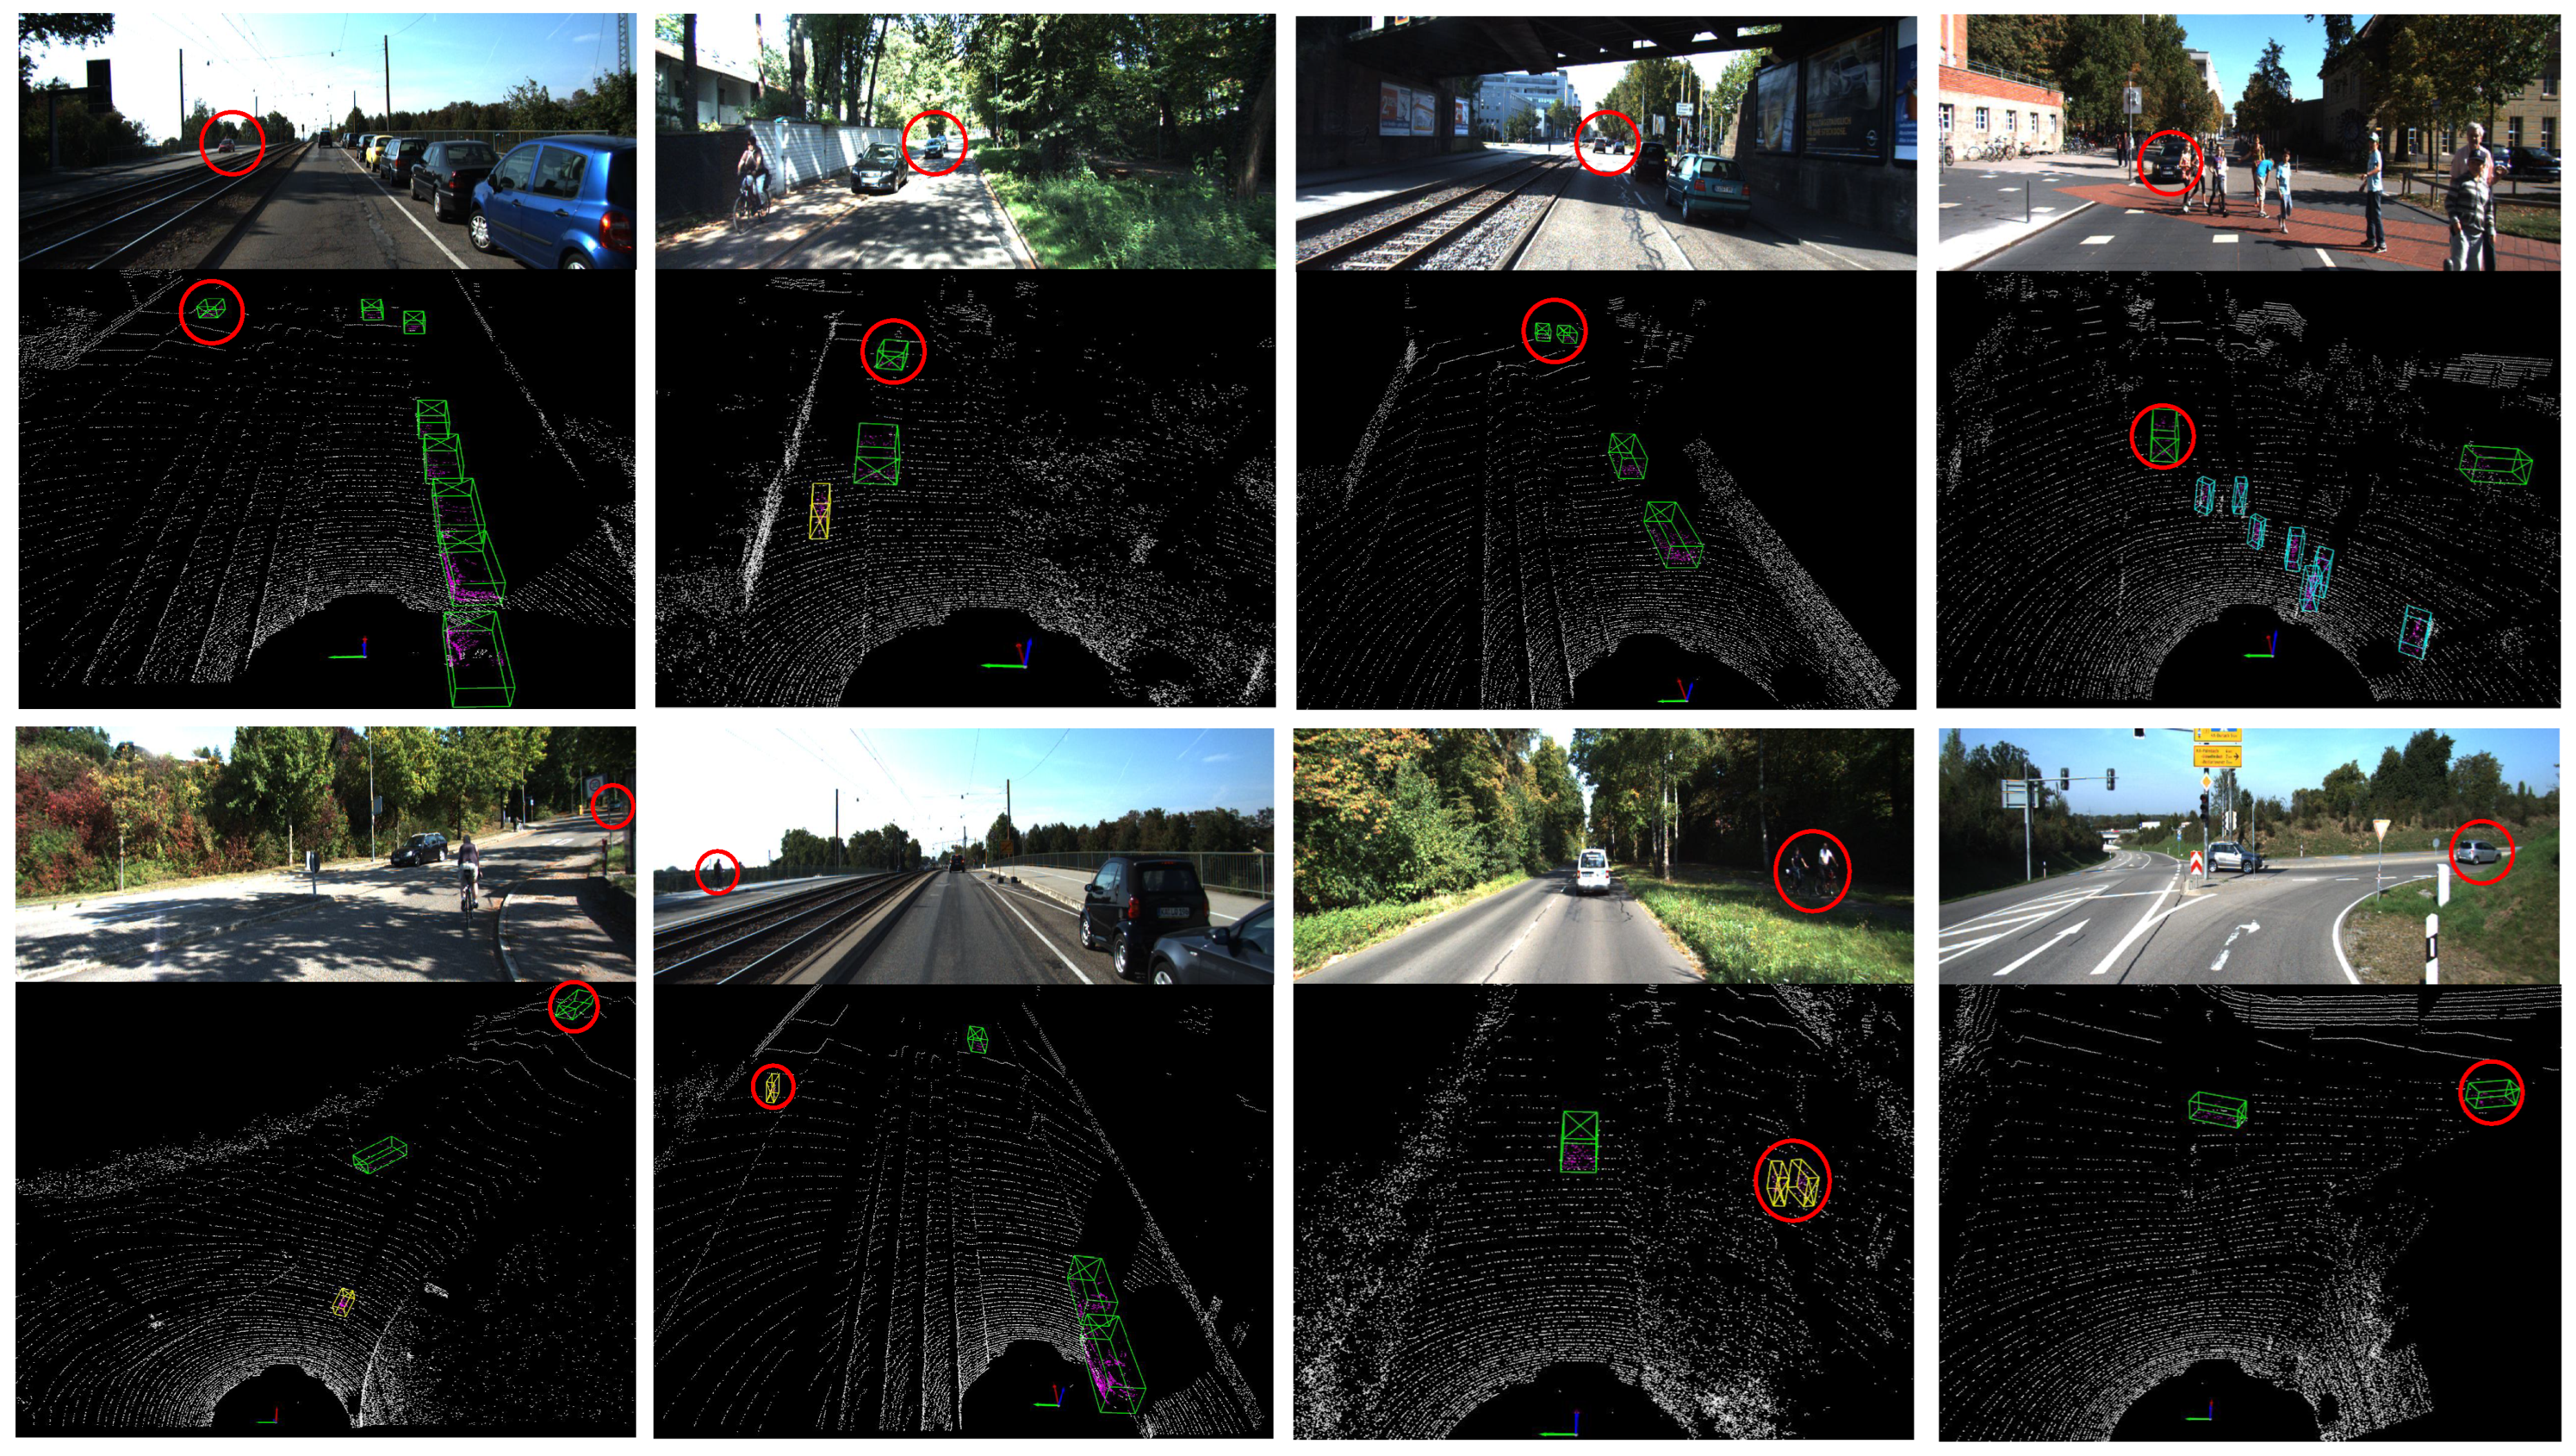
Next, we show some visualization results of the proposed method on the test of KITTI dataset, as shown in Figure 6. Please note that the images are only for a better comparative presentation of results, and our method only takes a point cloud as input to complete 3D detection results.
By comparing the detection results of point clouds with the real image, it can be seen that the targets in the point cloud scene are accurately detected, and different categories are also correctly distinguished. Through more detailed observations, as marked by the red circle in Figure 6, tiny objects such as cars and cyclists at the edges and faraway regions of the point cloud scene can also be effectively detected. This can be attributed to the designed feature alignment filtering algorithm, which addresses the issues of distance attenuation in LiDAR intensity values and data imbalance. Additionally, the designed feature fusion branch network structure effectively enhances foreground point segmentation capability. Ultimately, by emphasizing both data quality and network design, the performance of 3D object detection is improved. Next, we conducted an ablation experiment to independently evaluate the performance of the designed feature alignment filtering algorithm and feature fusion branch network structure on 3D object detection.
3.3. Ablation Study
We independently evaluate the performance of the designed feature alignment filtering algorithm and feature fusion branch network structure on the 3D detection benchmark through ablation experiments. The results of the ablation experiments are shown in Table 3.
From Table 3, it can be observed that in the 3D benchmark, our optimization strategies for both the data and network have effectively improved the AP for the three categories of 3D detection. Compared to the baseline, the feature alignment filtering algorithm has boosted the AP for cars by up to 2.98% (hard), pedestrians by up to 5.18% (moderate), and cyclists by up to 4.28% (moderate). Furthermore, in the optimization of the network architecture, we have designed a feature fusion branch that further enhances the detection capability for foreground points. As a result, the AP for cars, pedestrians, and cyclists increased by up to 5.2% (hard), 4.2% (moderate), and 3.26% (moderate), respectively. When combining the data and network structure optimizations, all detection results showed further improvement compared to the baseline. Specifically, the minimum improvement in car detection AP was 2.7% (easy), while the detection AP for pedestrians and cyclists increased by at least 2% (hard) and 2.59% (easy), respectively. Finally, our approach achieved the highest AP for the three types of 3D detection, reaching 89.23%, 52.32%, and 76.41%. This is mainly attributed to the simultaneous optimization of the data and network structure. Firstly, our feature alignment filtering algorithm effectively preserves the foreground points and achieves accurate detection of objects with a small number of points. In addition, the fusion branch of the network further enhances the accuracy of foreground point segmentation, which provides a fundamental guarantee for subsequent detection.
4. Conclusions
In this study, an effective two-stage point-based 3D object detection method is introduced. This method enhances 3D object detection performance by simultaneously optimizing data quality and network structure. Specifically, regarding the data quality in our experiment, we found that the distribution of the point cloud is dense near the center and sparse far away from the center, and the collected reflection intensity values also show strong near/weak far characteristics. However, in the subsequent network training, the point-based pipeline usually adopts indiscriminate random sampling or farthest point sampling to gradually downsample and extract features from the input point cloud, although not all points are equally important for the object detection task. Inspired by this, firstly, in order to achieve feature alignment, we introduce a correction equation to decouple the relationship between distance and intensity and eliminate the intensity attenuation effect caused by distance. Then, we propose a feature alignment filtering algorithm to complete the preliminary distinction between the foreground and background points, the foreground points are preserved, and some background points are filtered to improve the data balance. In the optimization of the network structure, we have taken into consideration the crucial role of the accuracy of semantic segmentation in the first stage for 3D object detection results. Therefore, improving the accuracy of semantic segmentation in the first stage is also a key point. When performing semantic segmentation on the input point cloud to extract features, we integrate spatial and spectral information to further enhance the segmentation accuracy. To achieve this, we design and incorporate a feature fusion branch module in the semantic segmentation network. By emphasizing feature fusion in the design of the point cloud semantic segmentation backbone network and introducing a feature fusion branch, this branch is capable of encoding and fusing spatial and spectral information of the k-nearest neighboring points to enhance the representation ability of local features.
Furthermore, we conduct a series of experiments on the challenging open-source benchmark KITTI dataset to validate our method. We introduced the details of the experimental setup and reported the experimental results of the proposed method. Subsequently, we compared our method with state-of-the-art 3D detection methods and conducted ablation studies to analyze the effectiveness of the components in the proposed method. For 3D detection results, our method achieved better results than previous monocular detection methods that only used LiDAR point, but its performance was slightly worse than multi-modal methods. Although most advanced methods have achieved excellent results by utilizing camera RGB images and point clouds as inputs, our method only utilizes points as input and achieves comparable performance by emphasizing data quality optimization and efficient architecture. Finally, through a series of experiments on the KITTI dataset, it has been proven that the proposed method achieves the following average precision (AP_R40) values for easy, moderate, and hard difficulties, respectively: car (Iou 0.7)—89.23%, 80.14%, and 77.89%; pedestrian (Iou 0.5)—52.32%, 45.47%, and 38.78%; and cyclist (Iou 0.5)—76.41%, 61.92%, and 56.39%. The proposed method also achieves a state-of-the-art performance among point-based methods. In terms of real-time performance, compared with the FPS index of the baseline method PointRCNN, the proposed method also improves FPS by 53%.
Over the years, researchers have faced the great challenge of effectively extracting features and accurately recognizing data collected in complex environments. Therefore, in subsequent work, our research focus will still lie in exploring the quality optimization of the data itself, including geometric and spectral features of the data, handling data imbalance, etc. Additionally, we will also pay attention to design optimization of the network to achieve a better framework and improve the accuracy of 3D object detection.
Author Contributions
Methodology, K.X.; validation, K.X. and T.L.; writing—original draft preparation, K.X., T.L. and J.L.; writing—review and editing, K.X., T.L. and J.L.; resources, D.H. and Y.P. All authors have read and agreed to the published version of the manuscript.
Funding
This research was partially supported by the National Natural Science Foundation of China (grant numbers 91948303-1 and 61803375) and the Postgraduate Scientific Research Innovation Project of Hunan Province (grant number QL20210018).
Data Availability Statement
Data underlying the results presented in this paper are not publicly available at this time but may be obtained from the authors upon reasonable request.
Acknowledgments
The authors acknowledge the State Key Laboratory of High-Performance Computing, College of Computer, National University of Defense Technology, China.
Conflicts of Interest
The authors declare no conflicts of interest.
Abbreviations
The following abbreviations are used in this manuscript:
| LiDAR | Light Detection and Ranging |
| AP | Average Precision |
| IoU | Intersection over Union |
| FPS | Farthest Point Sampling |
| KMEANS++ | KMEANS++ Clustering Algorithm |
| NMS | Non-Maximum Suppression |
| MLP | Multi-Layer Perceptron |
| BN | BatchNorm |
| ReLU | Rectified Linear Unit |
References
- Arnold, E.; Al-Jarrah, O.Y.; Dianati, M.; Fallah, S.; Oxtoby, D.; Mouzakitis, A. A survey on 3D object detection methods for autonomous driving applications. IEEE Trans. Intell. Transp. Syst. 2019, 20, 3782–3795. [Google Scholar] [CrossRef]
- Yu, R.; Wang, Q.; Dai, G.; Chen, X.; Ren, C.; Liu, J.; Li, D.; Wang, X.; Cao, H.; Qin, S.; et al. The Design and Performance Evaluation of a 1550 nm All-Fiber Dual-Polarization Coherent Doppler Lidar for Atmospheric Aerosol Measurements. Remote Sens. 2023, 15, 5336. [Google Scholar] [CrossRef]
- Melichová, Z.; Pekár, S.; Surový, P. Benchmark for Automatic Clear-Cut Morphology Detection Methods Derived from Airborne Lidar Data. Forests 2023, 14, 2408. [Google Scholar] [CrossRef]
- Wang, P.; Zhou, R.; Dai, C.; Wang, H.; Jiang, W.; Zhang, Y. Simulation-Based Self-Supervised Line Extraction for LiDAR Odometry in Urban Road Scenes. Remote Sens. 2023, 15, 5322. [Google Scholar] [CrossRef]
- Mahima, K.T.Y.; Perera, A.; Anavatti, S.; Garratt, M. Exploring Adversarial Robustness of LiDAR Semantic Segmentation in Autonomous Driving. Sensors 2023, 23, 9579. [Google Scholar] [CrossRef]
- Ravi, N.; El-Sharkawy, M. Addressing the Gaps of IoU Loss in 3D Object Detection with IoU. Future Internet 2023, 15, 399. [Google Scholar] [CrossRef]
- Wang, C.; Morgan, G.R.; Morris, J.T. Drone Lidar Deep Learning for Fine-Scale Bare Earth Surface and 3D Marsh Mapping in Intertidal Estuaries. Sustainability 2023, 15, 15823. [Google Scholar] [CrossRef]
- Jiang, Y.; Peng, P.; Wang, L.; Wang, J.; Wu, J.; Liu, Y. LiDAR-based local path planning method for reactive navigation in underground mines. Remote Sens. 2023, 15, 309. [Google Scholar] [CrossRef]
- Liu, J.; Quan, Y.; Wang, B.; Shi, J.; Ming, L.; Li, M. Estimation of Forest Stock Volume Combining Airborne LiDAR Sampling Approaches with Multi-Sensor Imagery. Forests 2023, 14, 2453. [Google Scholar] [CrossRef]
- Parra, A.; Simard, M. Evaluation of Tree-Growth Rate in the Laurentides Wildlife Reserve Using GEDI and Airborne-LiDAR Data. Remote Sens. 2023, 15, 5352. [Google Scholar] [CrossRef]
- Olayemi, K.B.; Van, M.; McLoone, S.; McIlvanna, S.; Sun, Y.; Close, J.; Nguyen, N.M. The Impact of LiDAR Configuration on Goal-Based Navigation within a Deep Reinforcement Learning Framework. Sensors 2023, 23, 9732. [Google Scholar] [CrossRef] [PubMed]
- Ohradzansky, M.T.; Humbert, J.S. Lidar-Based Navigation of Subterranean Environments Using Bio-Inspired Wide-Field Integration of Nearness. Sensors 2022, 22, 849. [Google Scholar] [CrossRef]
- Mozaffari, S.; AI-Jarrah, O.Y.; Dianati, M.; Jennings, P.; Mouzakitis, A. Deep learning-based vehicle behavior prediction for autonomous driving applications: A review. IEEE Trans. Intell. Transp. Syst. 2022, 23, 33–47. [Google Scholar] [CrossRef]
- Huch, S.; Lienkamp, M. Towards Minimizing the LiDAR Sim-to-Real Domain Shift: Object-Level Local Domain Adaptation for 3D Point Clouds of Autonomous Vehicles. Sensors 2023, 23, 9913. [Google Scholar] [CrossRef] [PubMed]
- Sun, X.; Song, S.; Miao, Z.; Tang, P.; Ai, L. LiDAR Point Clouds Semantic Segmentation in Autonomous Driving Based on Asymmetrical Convolution. Electronics 2023, 12, 4926. [Google Scholar] [CrossRef]
- Rastiveis, H.; Shams, A.; Sarasua, W.A.; Li, J. Automated extraction of lane markings from mobile LiDAR point clouds based on fuzzy inference. ISPRS J. Photogramm. Remote Sens. 2019, 160, 149–166. [Google Scholar] [CrossRef]
- Soilán, M.; González-Aguilera, D.; del-Campo-Sánchez, A.; Hernández-López, D.; Del Pozo, S. Road Marking Degradation Analysis Using 3D Point Cloud Data Acquired with a Low-Cost Mobile Mapping System. Autom. Constr. 2022, 141, 104446. [Google Scholar] [CrossRef]
- Yadav, M.; Lohani, B. Identification of trees and their trunks from mobile laser scanning data of roadway scenes. Int. J. Remote Sens. 2019, 41, 1233–1258. [Google Scholar] [CrossRef]
- Kolendo, Ł.; Kozniewski, M.; Ksepko, M.; Chmur, S.; Neroj, B. Parameterization of the Individual Tree Detection Method Using Large Dataset from Ground Sample Plots and Airborne Laser Scanning for Stands Inventory in Coniferous Forest. Remote Sens. 2021, 13, 2753. [Google Scholar] [CrossRef]
- Briñón-Arranz, L.; Rakotovao, T.; Creuzet, T.; Karaoguz, C.; El-Hamzaoui, O. A methodology for analyzing the impact of crosstalk on LiDAR measurements. In Proceedings of the 2021 IEEE Sensors, Sydney, Australia, 31 October–3 November 2021; pp. 1–4. [Google Scholar]
- Fan, X.; Chen, Z.; Liu, P.; Pan, W. Simultaneous Vehicle Localization and Roadside Tree Inventory Using Integrated LiDAR-Inertial-GNSS System. Remote Sens. 2023, 15, 5057. [Google Scholar] [CrossRef]
- Theurl, F.; Schmied, C.; Reitbauer, E.; Wieser, M. Automated Route Planning from LiDAR Point Clouds for Agricultural Applications. Eng. Proc. 2023, 54, 54. [Google Scholar]
- Yu, Y.; Fan, S.; Li, L.; Wang, T.; Li, L. Automatic Targetless Monocular Camera and LiDAR External Parameter Calibration Method for Mobile Robots. Remote Sens. 2023, 15, 5560. [Google Scholar] [CrossRef]
- Wang, S.; Chen, M. A LiDAR Multi-Object Detection Algorithm for Autonomous Driving. Appl. Sci. 2023, 13, 12747. [Google Scholar] [CrossRef]
- Yang, Z.; Sun, Y.; Liu, S.; Shen, X.; Jia, J. STD: Sparse-to-dense 3D Object Detector for Point Cloud. In Proceedings of the IEEE/CVF International Conference on Computer Vision (ICCV), Seoul, Republic of Korea, 27 October–2 November 2019; pp. 1951–1960. [Google Scholar]
- Wang, Z.; Jia, K. Frustum ConvNet: Sliding Frustums to Aggregate Local Point-wise Features for Amodal 3D Object Detection. In Proceedings of the IEEE/RSJ International Conference on Intelligent Robots and Systems (IROS), Macau, China, 4–8 November 2019; pp. 1742–1749. [Google Scholar]
- Li, Z.; Gao, Y.; Hong, Q.; Du, Y.; Serikawa, S.; Zhang, L. Keypoint3D: Keypoint-Based and Anchor-Free 3D Object Detection for Autonomous Driving with Monocular Vision. Remote Sens. 2023, 15, 1210. [Google Scholar] [CrossRef]
- Jeong, S.; Ko, M.; Kim, J. LiDAR Localization by Removing Moveable Objects. Electronics 2023, 12, 4659. [Google Scholar] [CrossRef]
- Qi, L.; Huang, L.; Zhang, Y.; Chen, Y.; Wang, J.; Zhang, X. A Real-Time Vessel Detection and Tracking System Based on LiDAR. Sensors 2023, 23, 9027. [Google Scholar] [CrossRef]
- Wang, J.; Li, H.; Xu, Z.; Xie, X. Semantic Segmentation of Urban Airborne LiDAR Point Clouds Based on Fusion Attention Mechanism and Multi-Scale Features. Remote Sens. 2023, 15, 5248. [Google Scholar] [CrossRef]
- Thomas, H.; Qi, C.R.; Deschaud, J.E.; Marcotegui, B.; Goulette, F.; Guibas, L.J. KPConv: Flexible and Deformable Convolution for Point Clouds. In Proceedings of the IEEE/CVF International Conference on Computer Vision (ICCV), Seoul, Republic of Korea, 29 October 2019; pp. 6410–6419. [Google Scholar]
- Zhang, Z.; Li, T.; Tang, X.; Lei, X.; Peng, Y. Introducing Improved Transformer to Land Cover Classification Using Multispectral LiDAR Point Clouds. Remote Sens. 2022, 14, 3808. [Google Scholar] [CrossRef]
- Lin, L.; Huang, P.; Fu, C.-W.; Xu, K.; Zhang, H.; Huang, H. On Learning the Right Attention Point for Feature Enhancement. Sci. China Inf. Sci. 2022, 7, 1674–1686. [Google Scholar] [CrossRef]
- Ibrahim, M.; Akhtar, N.; Ullah, K.; Mian, A. Exploiting Structured CNNs for Semantic Segmentation of Unstructured Point Clouds from LiDAR Sensor. Remote Sens. 2021, 13, 3621. [Google Scholar] [CrossRef]
- Engelcke, M.; Rao, D.; Wang, D.Z.; Tong, C.H.; Posner, I. Vote3deep: Fast object detection in 3d point clouds using efficient convolutional neural networks. In Proceedings of the 2017 IEEE International Conference on Robotics and Automation (ICRA), Singapore, 29 May–3 June 2017; pp. 1355–1361. [Google Scholar]
- Wang, Y.; Sun, Y.; Liu, Z.; Sarma, S.E.; Bronstein, M.M.; Solomon, J.M. Dynamic graph cnn for learning on point clouds. ACM Trans. Graph. 2019, 38, 1–12. [Google Scholar] [CrossRef]
- Wang, Y.; Chao, W.L.; Garg, D.; Hariharan, B.; Campbell, M.; Weinberger, K.Q. Pseudo-lidar from visual depth estimation: Bridging the gap in 3d object detection for autonomous driving. In Proceedings of the IEEE/CVF Conference on Computer Vision and Pattern Recognition, Long Beach, CA, USA, 15–20 June 2019; pp. 8445–8453. [Google Scholar]
- Qi, C.R.; Su, H.; Mo, K.; Guibas, L.J. PointNet: Deep learning on point sets for 3d classification and segmentation. In Proceedings of the IEEE Conference on Computer Vision and Pattern Recognition, Honolulu, HI, USA, 21–26 July 2017; pp. 652–660. [Google Scholar]
- Qi, C.R.; Yi, L.; Su, H.; Guibas, L.J. PointNet++: Deep hierarchical feature learning on point sets in a metric space. Adv. Neural Inf. Process. Syst. 2017, 30, 4–7. [Google Scholar]
- Deng, J.; Zhou, W.; Zhang, Y.; Li, H. From multi-view to hollow-3D: Hallucinated hollow-3D R-CNN for 3D object detection. IEEE Trans. Circuits Syst. Video Technol. 2021, 31, 4722–4734. [Google Scholar] [CrossRef]
- Sugimura, D.; Yamazaki, T.; Hamamoto, T. Three-dimensional point cloud object detection using scene appearance consistency among multi-view projection directions. IEEE Trans. Circuits Syst. Video Technol. 2019, 30, 3345–3357. [Google Scholar] [CrossRef]
- Liang, M.; Yang, B.; Chen, Y.; Hu, R.; Urtasun, R. Multi-task multi-sensor fusion for 3d object detection. In Proceedings of the IEEE/CVF Conference on Computer Vision and Pattern Recognition, Long Beach, CA, USA, 15–20 June 2019; pp. 7345–7353. [Google Scholar]
- Ku, J.; Mozifian, M.; Lee, J.; Harakeh, A.; Waslander, S.L. Joint 3D Proposal Generation and Object Detection from View Aggregation. In Proceedings of the 2018 IEEE/RSJ International Conference on Intelligent Robots and Systems (IROS), Madrid, Spain, 1–5 October 2018; pp. 7345–7353. [Google Scholar]
- Rethage, D.; Wald, J.; Sturm, J.; Navab, N.; Tombari, F. Fully-Convolutional Point Networks for Large-Scale Point Clouds. In Proceedings of the European Conference on Computer Vision (ECCV), Munich, Germany, 8–14 September 2018; pp. 235–242. [Google Scholar]
- Zhou, Y.; Tuzel, O. Voxelnet: End-to-end learning for point cloud based 3d object detection. In Proceedings of the IEEE Conference on Computer Vision and Pattern Recognition, Salt Lake City, UT, USA, 18–22 June 2018; pp. 4490–4499. [Google Scholar]
- Yan, Y.; Mao, Y.; Li, B. Second: Sparsely embedded convolutional detection. Sensors 2018, 18, 3337. [Google Scholar] [CrossRef] [PubMed]
- Lang, A.H.; Vora, S.; Caesar, H.; Zhou, L.; Yang, J.; Beijbom, O. Pointpillars: Fast encoders for object detection from point clouds. In Proceedings of the IEEE/CVF Conference on Computer Vision and Pattern Recognition, Long Beach, CA, USA, 15–20 June 2019; pp. 12697–12705. [Google Scholar]
- Chen, Y.; Liu, G.; Xu, Y.; Pan, P.; Xing, Y. PointNet++ Network Architecture with Individual Point Level and Global Features on Centroid for ALS Point Cloud Classification. Remote Sens. 2021, 13, 472. [Google Scholar] [CrossRef]
- Jing, Z.; Guan, H.; Zhao, P.; Li, D.; Yu, Y.; Zang, Y.; Wang, H.; Li, J. Multispectral LiDAR Point Cloud Classification Using SE-PointNet++. Remote Sens. 2021, 13, 2516. [Google Scholar] [CrossRef]
- Xie, Y.; Tian, J.; Zhu, X.X. Linking Points with Labels in 3D: A Review of Point Cloud Semantic Segmentation. Geosci. Remote Sens. 2020, 8, 38–59. [Google Scholar] [CrossRef]
- Shi, S.; Wang, X.; Li, H. Pointrcnn: 3D object proposal generation and detection from point cloud. In Proceedings of the IEEE/CVF Conference on Computer Vision and Pattern Recognition, Long Beach, CA, USA, 15–20 June 2019; pp. 770–779. [Google Scholar]
- Shi, W.; Rajkumar, R. Point-gnn: Graph neural network for 3d object detection in a point cloud. In Proceedings of the IEEE/CVF Conference on Computer Vision and Pattern Recognition, Seattle, WA, USA, 13–19 June 2020; pp. 1711–1719. [Google Scholar]
- Zhang, Y.; Hu, Q.; Xu, G.; Ma, Y.; Wan, J.; Guo, Y. Not All Points Are Equal: Learning Highly Efficient Point-based Detectors for 3D LiDAR Point Clouds. In Proceedings of the IEEE/CVF Conference on Computer Vision and Pattern Recognition, New Orleans, LA, USA, 21–23 June 2022; pp. 1711–1719. [Google Scholar]
- Matikainen, L.; Karila, K.; Hyyppä, J.; Litkey, P.; Puttonen, E.; Ahokas, E. Object-based analysis of multispectral airborne laser scanner data for land cover classification and map updating. ISPRS J. Photogramm. Remote Sens. 2020, 128, 298–313. [Google Scholar] [CrossRef]
- Zhao, J.; Zhao, X.; Liang, S.; Zhou, T.; Du, X.; Xu, P.; Wu, D. Assessing the thermal contributions of urban land cover types. Landsc. Urban Plan. 2020, 204, 103927. [Google Scholar] [CrossRef]
- Guo, Y.; Wang, H.; Hu, Q.; Liu, H.; Liu, L.; Bennamoun, M. Deep Learning for 3D Point Clouds: A Survey. IEEE Trans. Pattern Anal. Mach. Intell. 2021, 23, 4338. [Google Scholar] [CrossRef] [PubMed]
- Shi, S.; Guo, C.; Jiang, L.; Wang, Z.; Shi, J.; Wang, X.; Li, H. Pv-rcnn: Point-voxel feature set abstraction for 3d object detection. In Proceedings of the IEEE/CVF Conference on Computer Vision and Pattern Recognition, Seattle, WA, USA, 13–19 June 2020; pp. 10529–10538. [Google Scholar]
- Jiang, T.; Song, N.; Liu, H.; Yin, R.; Gong, Y.; Yao, J. VIC-Net: Voxelization Information Compensation Network for Point Cloud 3D Object Detection. In Proceedings of the IEEE International Conference on Robotics and Automation (ICRA), Xi’an, China, 30 May 2021; pp. 13408–13414. [Google Scholar]
- Zhang, J.; Xu, D.; Li, Y.; Zhao, L.; Su, R. FusionPillars: A 3D Object Detection Network with Cross-Fusion and Self-Fusion. Remote Sens. 2023, 15, 2692. [Google Scholar] [CrossRef]
- Caesar, H.; Bankiti, V.; Lang, A.H.; Vora, S.; Liong, V.E.; Xu, Q.; Krishnan, A.; Pan, Y.; Baldan, G.; Beijbom, O. nuScenes: A Multimodal Dataset for Autonomous Driving. In Proceedings of the IEEE/CVF Conference on Computer Vision and Pattern Recognition (CVPR), Seattle, WA, USA, 14–19 June 2020; pp. 11618–11628. [Google Scholar]
- Patil, A.; Malla, S.; Gang, H.; Chen, Y. The H3D Dataset for Full-Surround 3D Multi-Object Detection and Tracking in Crowded Urban Scenes. In Proceedings of the International Conference on Robotics and Automation (ICRA), Montreal, QC, Canada, 20–24 May 2019; pp. 9552–9557. [Google Scholar]
- Sun, P.; Kretzschmar, H.; Dotiwalla, X.; Chouard, A.; Patnaik, V.; Tsui, P.; Guo, J.; Zhou, Y.; Chai, Y.; Caine, B.; et al. Scalability in Perception for Autonomous Driving: Waymo Open Dataset. In Proceedings of the IEEE/CVF Conference on Computer Vision and Pattern Recognition (CVPR), Seattle, WA, USA, 14–19 June 2020; pp. 2446–2454. [Google Scholar]
- Geiger, A.; Lenz, P.; Urtasun, R. Are we ready for autonomous driving? The KITTI vision benchmark suite. In Proceedings of the 2012 IEEE Conference on Computer Vision and Pattern Recognition, Providence, RI, USA, 16–21 June 2012; pp. 3354–3361. [Google Scholar]
- Rabin, S.; Porat, B.; Friedman, G. Light Detection and Ranging (LiDAR) for advanced driver assistance systems: State-of-the-art and future trends. Opt. Eng. 2019, 3, 1–19. [Google Scholar]
- Arthur, D.; Vassilvitskii, S. K-Means++: The Advantages of Careful Seeding. In Proceedings of the Eighteenth Annual ACM-SIAM Symposium on Discrete Algorithms, New Orleans, LA, USA, 7–9 January 2007. [Google Scholar]
- Lin, T.Y.; Goyal, P.; Girshick, R.; He, K.; Dollár, P. Focal Loss for Dense Object Detection. In Proceedings of the IEEE International Conference on Computer Vision (ICCV), Venice, Italy, 22–29 October 2017; pp. 2999–3007. [Google Scholar]
- Simonelli, A.; Bulo, S.R.; Porzi, L.; Lopez-Antequera, M.; Kontschieder, P. Disentangling Monocular 3D Object Detection. In Proceedings of the 2019 IEEE/CVF International Conference on Computer Vision (ICCV), Seoul, Republic of Korea, 29 October 2019; pp. 1991–1999. [Google Scholar]
Figure 1.
The visualization of acquisition results from the KITTI dataset. The top portion of the figure presents RGB images captured by the camera, while the bottom section depicts the original point cloud data acquired by the LiDAR along with the distribution of reflectance intensity within the scene.

Figure 2.
The distribution of point cloud intensity before and after feature alignment.

Figure 3.
A set of input point cloud classification results.

Figure 4.
The backbone architecture of the adopted two-stage network.

Figure 5.
The point cloud semantic segmentation backbone design with emphasis on feature fusion branch.
Figure 5.
The point cloud semantic segmentation backbone design with emphasis on feature fusion branch.

Figure 6.
The visualization results of our method on the KITTI test set. The top displays the reference real image, and the bottom displays the corresponding detection results. Tiny objects are marked with red circles. Detected objects are represented by green 3D bounding boxes for cars, blue 3D bounding boxes for pedestrians, and yellow 3D bounding boxes for cyclists.


Table 1.
The experimental results of the proposed method and the baseline on KITTI. All results are evaluated using average precision (AP) with 40 recall positions.
Table 1.
The experimental results of the proposed method and the baseline on KITTI. All results are evaluated using average precision (AP) with 40 recall positions.
| Metrics | Methods | Car (IoU = 0.7) | Pedestrian (IoU = 0.5) | Cyclist (IoU = 0.5) | ||||||
|---|---|---|---|---|---|---|---|---|---|---|
| Easy | Mod. | Hard | Easy | Mod. | Hard | Easy | Mod. | Hard | ||
| BBOX | Baseline | 96.19 | 92.56 | 90.28 | 63.45 | 56.52 | 50.04 | 78.41 | 66.11 | 65.06 |
| Ours | 96.26 | 92.58 | 90.31 | 63.94 | 57.21 | 50.64 | 79.24 | 67.98 | 65.95 | |
| BEV | Baseline | 92.78 | 88.54 | 85.33 | 50.37 | 42.54 | 40.54 | 77.28 | 64.20 | 56.76 |
| Ours | 92.82 | 88.61 | 86.60 | 55.71 | 48.64 | 41.85 | 77.45 | 64.23 | 57.95 | |
| 3D | Baseline | 86.96 | 75.64 | 70.70 | 47.98 | 39.37 | 36.01 | 74.96 | 58.82 | 52.53 |
| Ours | 89.23 | 80.14 | 77.89 | 52.32 | 45.47 | 38.78 | 76.41 | 61.92 | 56.39 | |
| AOS | Baseline | 96.17 | 92.42 | 90.08 | 58.81 | 52.63 | 46.20 | 78.33 | 67.35 | 64.33 |
| Ours | 96.23 | 92.47 | 90.11 | 59.50 | 52.67 | 46.28 | 79.15 | 67.54 | 65.47 | |
Table 2.
The 3D detection results on the KITTI test set are reported using different methods. All results are evaluated using average precision (AP) with 40 recall positions. The frames per second (FPS) are also shown. The best results of point-only method and multimodal method are bold.
Table 2.
The 3D detection results on the KITTI test set are reported using different methods. All results are evaluated using average precision (AP) with 40 recall positions. The frames per second (FPS) are also shown. The best results of point-only method and multimodal method are bold.
| Method | Car (IoU = 0.7) | Pedestrian (IoU = 0.5) | Cyclist (IoU = 0.5) | FPS | |||||||
|---|---|---|---|---|---|---|---|---|---|---|---|
| Easy | Mod. | Hard | Easy | Mod. | Hard | Easy | Mod. | Hard | |||
| VoxelNet [28] | Voxel | 77.47 | 65.11 | 57.73 | 39.48 | 33.69 | 31.50 | 61.22 | 48.36 | 44.37 | 4.5 |
| SECOND [29] | Voxel | 84.65 | 75.96 | 68.71 | 45.31 | 35.52 | 33.14 | 75.83 | 60.82 | 53.67 | 20 |
| PointPillars [30] | Voxel | 82.58 | 74.31 | 68.99 | 51.45 | 41.92 | 38.89 | 77.10 | 58.65 | 51.92 | 42.4 |
| PointRCNN [34] | Point | 86.96 | 75.64 | 70.70 | 47.98 | 39.37 | 36.01 | 74.96 | 58.82 | 52.53 | 10 |
| Point-GNN [35] | Point | 88.33 | 79.47 | 72.29 | 51.92 | 43.77 | 40.14 | 78.60 | 63.48 | 57.08 | 1.6 |
| IA-SSD [36] | Point | 88.87 | 80.32 | 75.10 | 49.01 | 41.20 | 38.03 | 80.78 | 66.01 | 58.12 | 85 |
| PV-RCNN [40] | Multi | 90.25 | 81.43 | 76.82 | 52.17 | 43.29 | 40.29 | 78.60 | 63.71 | 57.65 | 12.5 |
| VIC-Net [41] | Multi | 88.25 | 80.61 | 75.83 | 43.82 | 37.18 | 35.35 | 78.29 | 63.65 | 57.27 | 17 |
| FusionPillars [42] | Multi | 86.96 | 75.74 | 73.03 | 55.87 | 48.42 | 45.42 | 80.62 | 59.43 | 55.76 | 12.5 |
| Ours | Point | 89.23 | 80.14 | 77.89 | 52.32 | 45.47 | 38.78 | 76.41 | 61.92 | 56.39 | 15.3 |
Table 3.
The results of ablation experiments on data and network structure optimization. The results are evaluated using average precision (AP) with 40 recall positions.
Table 3.
The results of ablation experiments on data and network structure optimization. The results are evaluated using average precision (AP) with 40 recall positions.
| Opt Strategy | Car (IoU = 0.7) | Pedestrian (IoU = 0.5) | Cyclist (IoU = 0.5) | ||||||
|---|---|---|---|---|---|---|---|---|---|
| Easy | Mod. | Hard | Easy | Mod. | Hard | Easy | Mod. | Hard | |
| Baseline | 86.53 | 75.12 | 69.79 | 46.21 | 38.63 | 36.78 | 73.82 | 56.29 | 52.29 |
| Data | 88.15 | 75.26 | 72.77 | 50.42 | 43.81 | 38.19 | 72.62 | 60.57 | 56.04 |
| Network | 88.62 | 77.62 | 74.99 | 48.87 | 42.83 | 37.10 | 75.82 | 59.55 | 55.02 |
| United | 89.23 | 80.14 | 77.89 | 52.32 | 45.47 | 38.78 | 76.41 | 61.92 | 56.39 |
Disclaimer/Publisher’s Note: The statements, opinions and data contained in all publications are solely those of the individual author(s) and contributor(s) and not of MDPI and/or the editor(s). MDPI and/or the editor(s) disclaim responsibility for any injury to people or property resulting from any ideas, methods, instructions or products referred to in the content. |
© 2024 by the authors. Licensee MDPI, Basel, Switzerland. This article is an open access article distributed under the terms and conditions of the Creative Commons Attribution (CC BY) license (https://creativecommons.org/licenses/by/4.0/).
Share and Cite
MDPI and ACS Style
Xiao, K.; Li, T.; Li, J.; Huang, D.; Peng, Y. Equal Emphasis on Data and Network: A Two-Stage 3D Point Cloud Object Detection Algorithm with Feature Alignment. Remote Sens. 2024, 16, 249. https://doi.org/10.3390/rs16020249
AMA Style
Xiao K, Li T, Li J, Huang D, Peng Y. Equal Emphasis on Data and Network: A Two-Stage 3D Point Cloud Object Detection Algorithm with Feature Alignment. Remote Sensing. 2024; 16(2):249. https://doi.org/10.3390/rs16020249
Chicago/Turabian StyleXiao, Kai, Teng Li, Jun Li, Da Huang, and Yuanxi Peng. 2024. "Equal Emphasis on Data and Network: A Two-Stage 3D Point Cloud Object Detection Algorithm with Feature Alignment" Remote Sensing 16, no. 2: 249. https://doi.org/10.3390/rs16020249
Note that from the first issue of 2016, this journal uses article numbers instead of page numbers. See further details here.