
Assessing the Impacts of Groundwater Depletion and Aquifer Degradation on Land Subsidence in Lahore, Pakistan: A PS-InSAR Approach for Sustainable Urban Development
 , ,
, ,  and
and 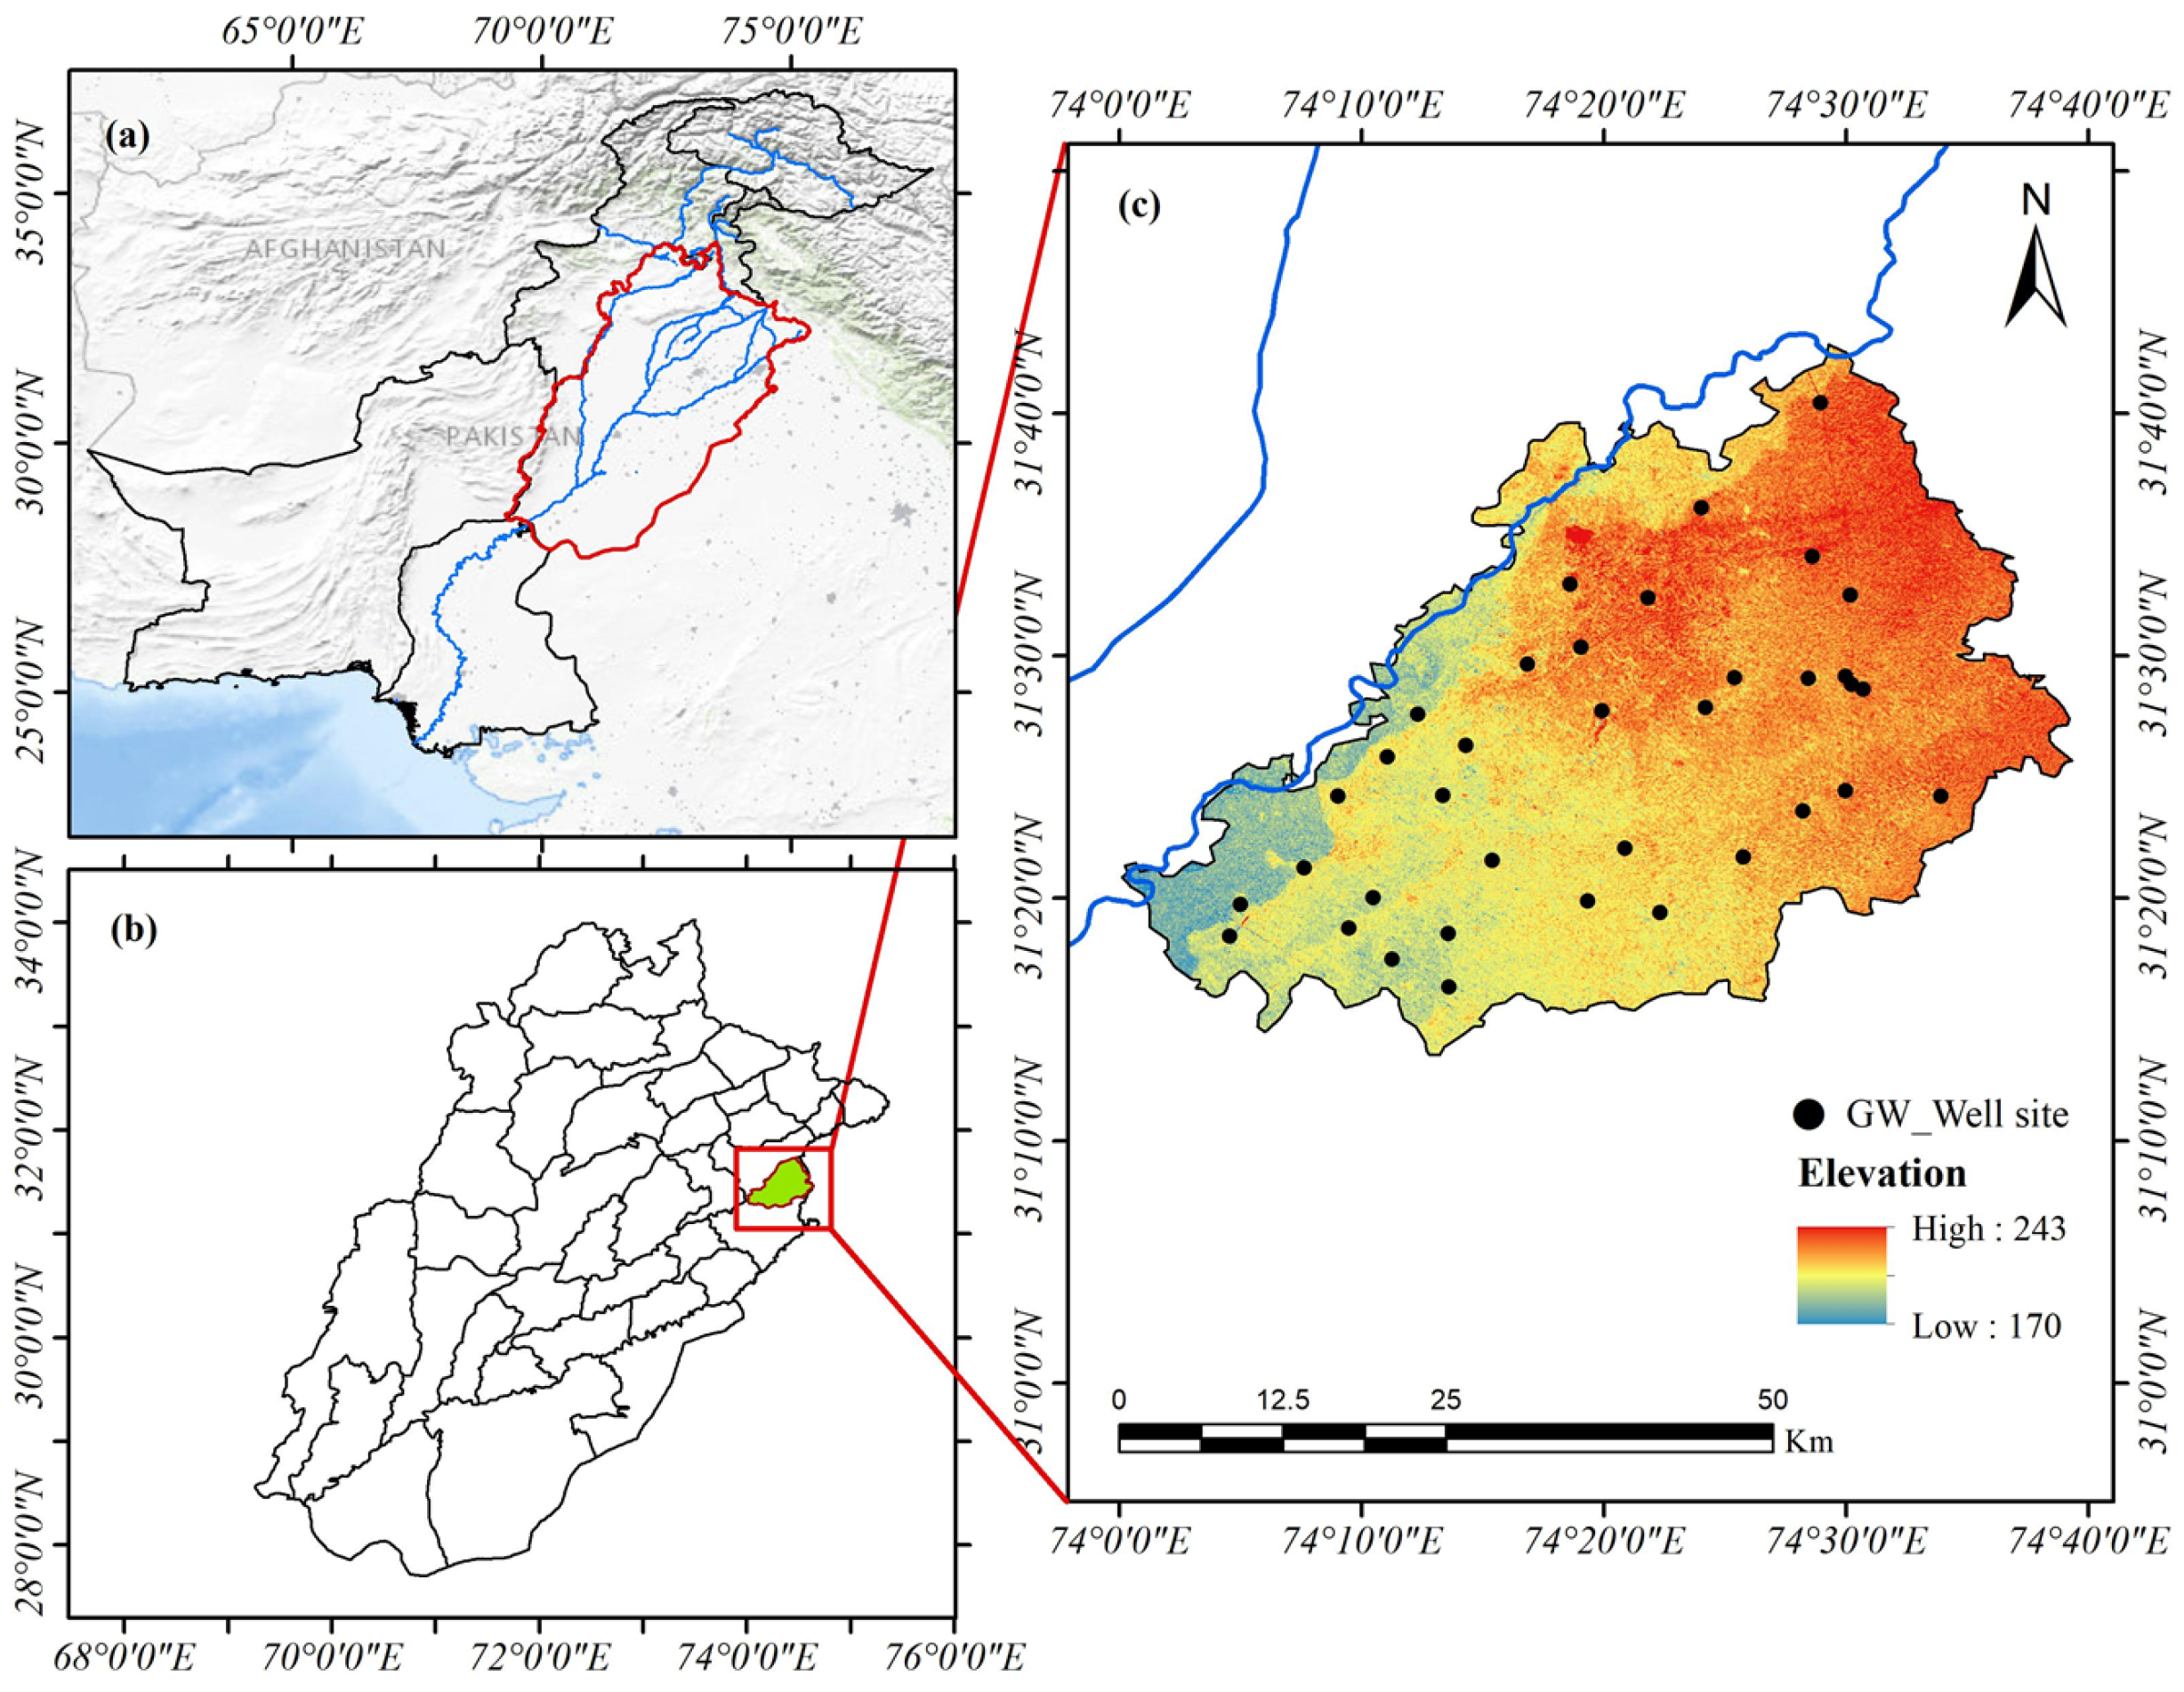
Abstract
:1. Introduction
2. Study Area
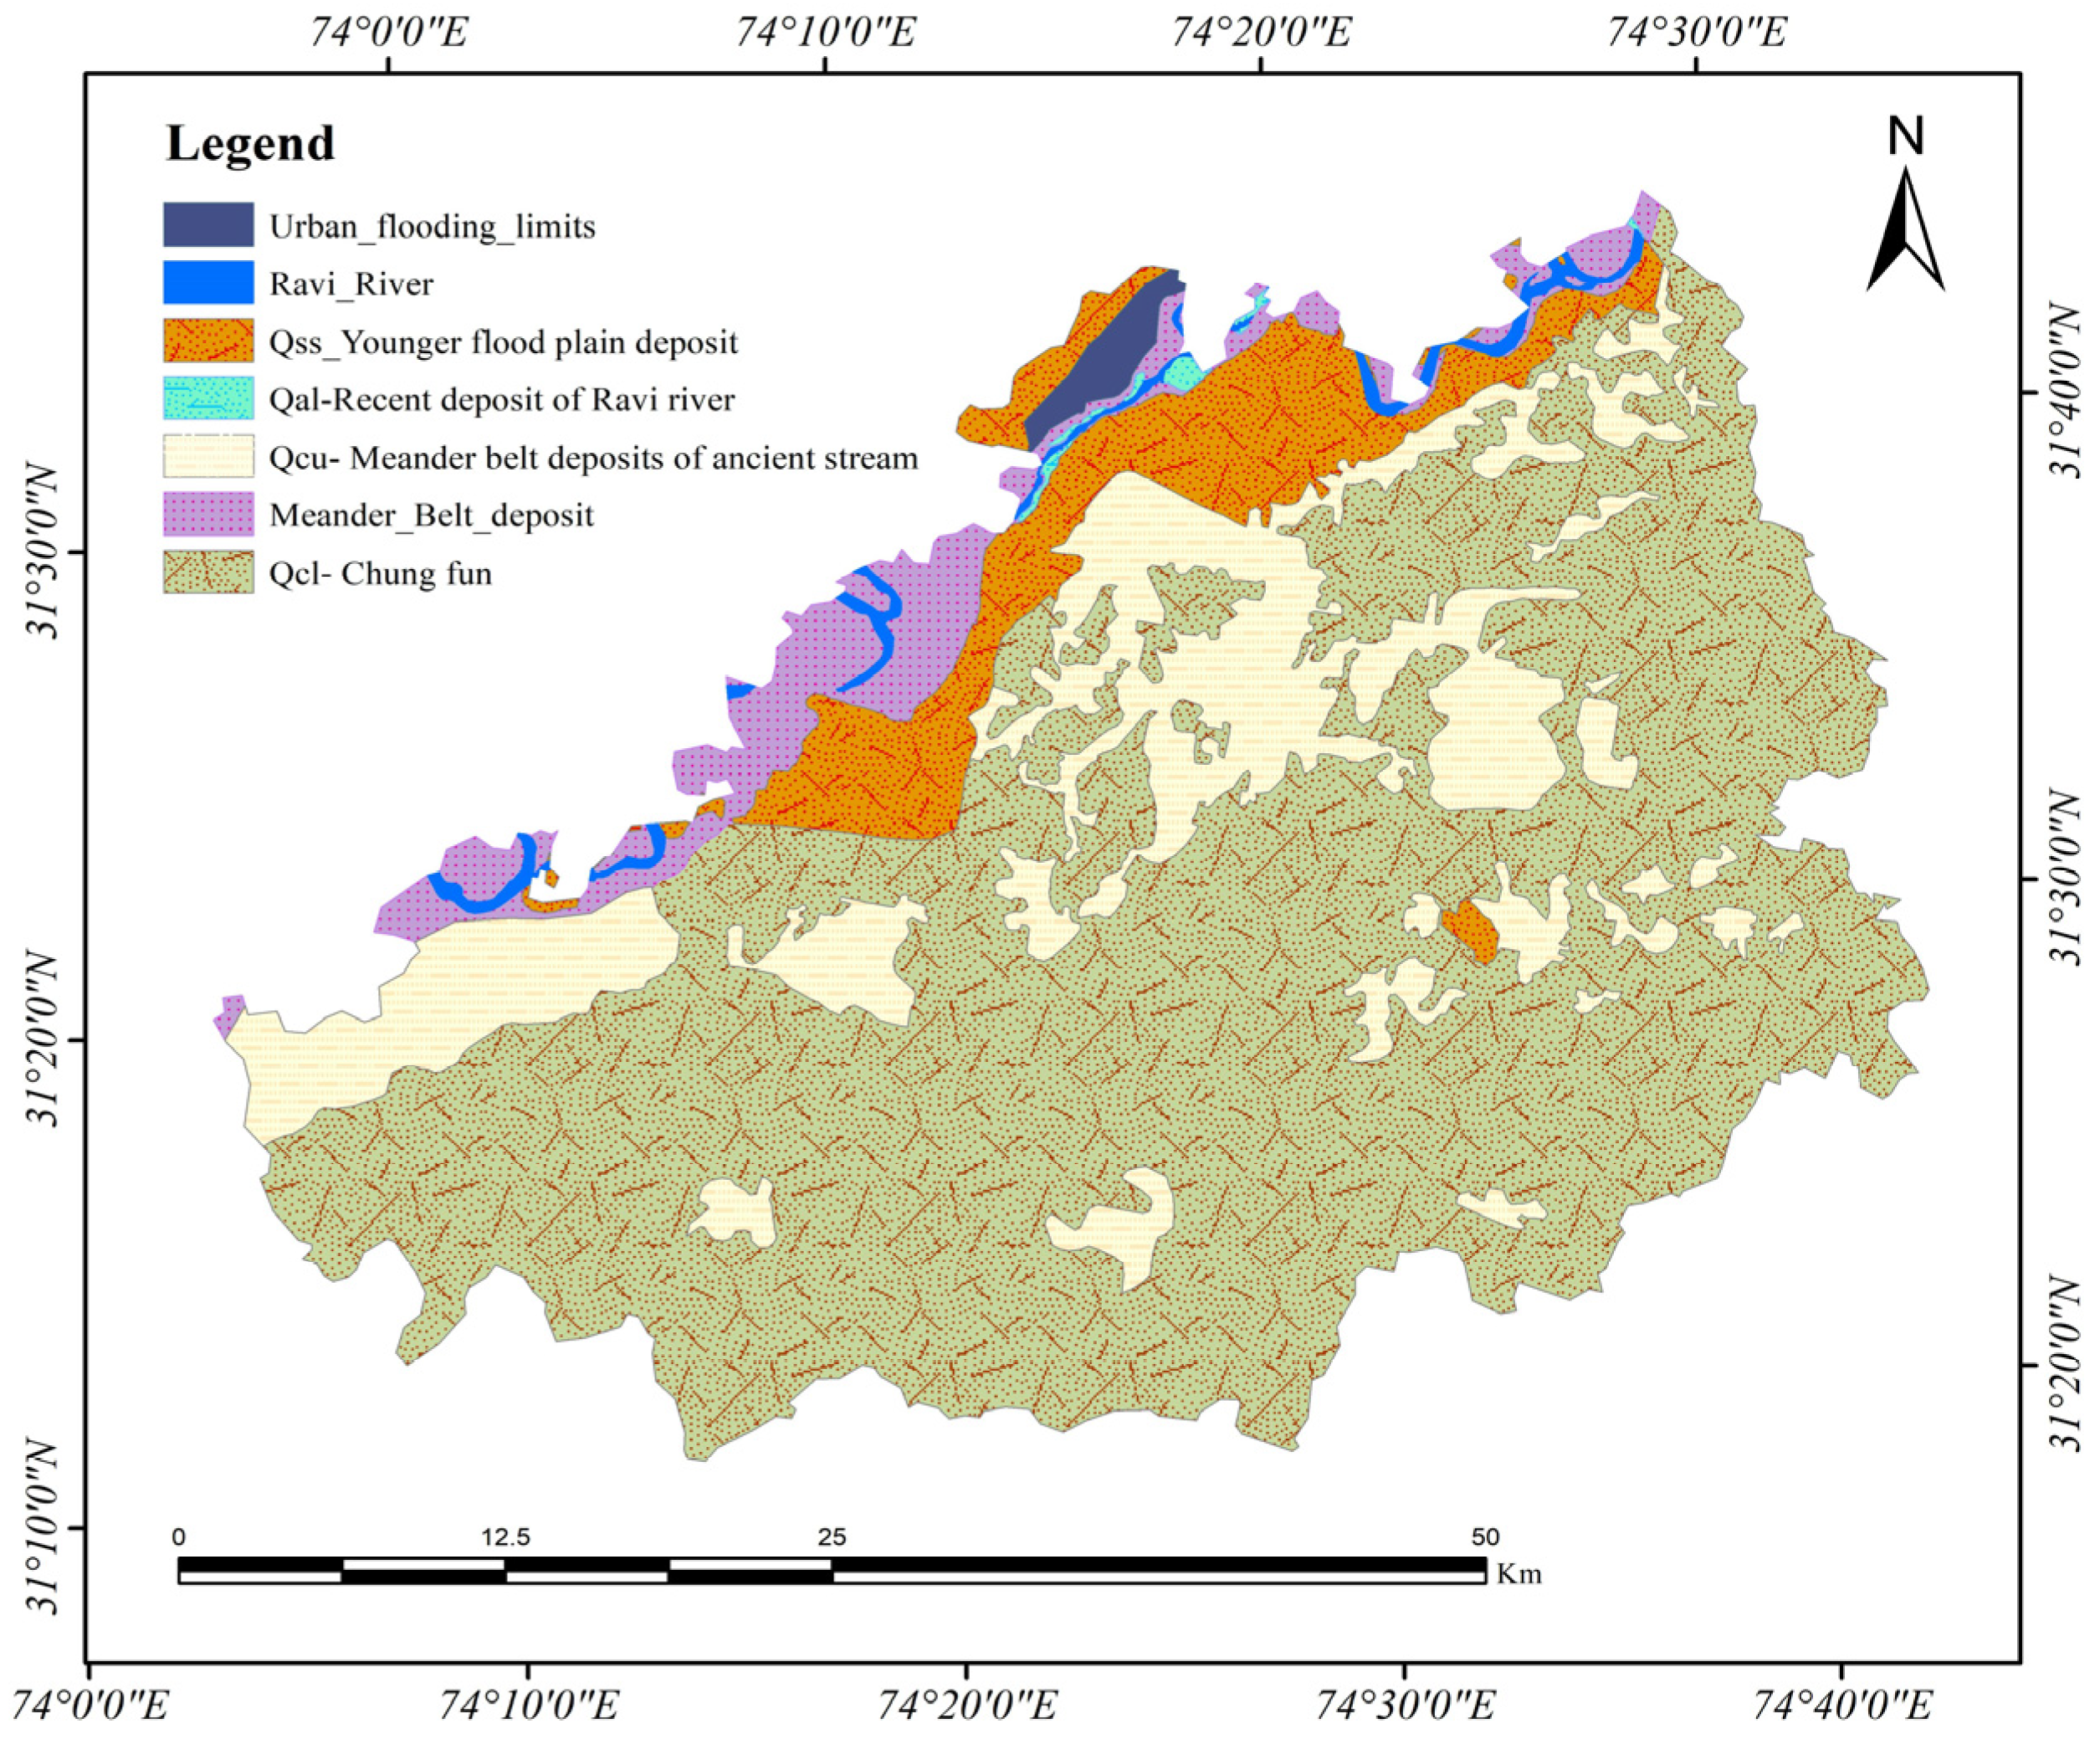
Geological Conditions
3. Materials and Methods
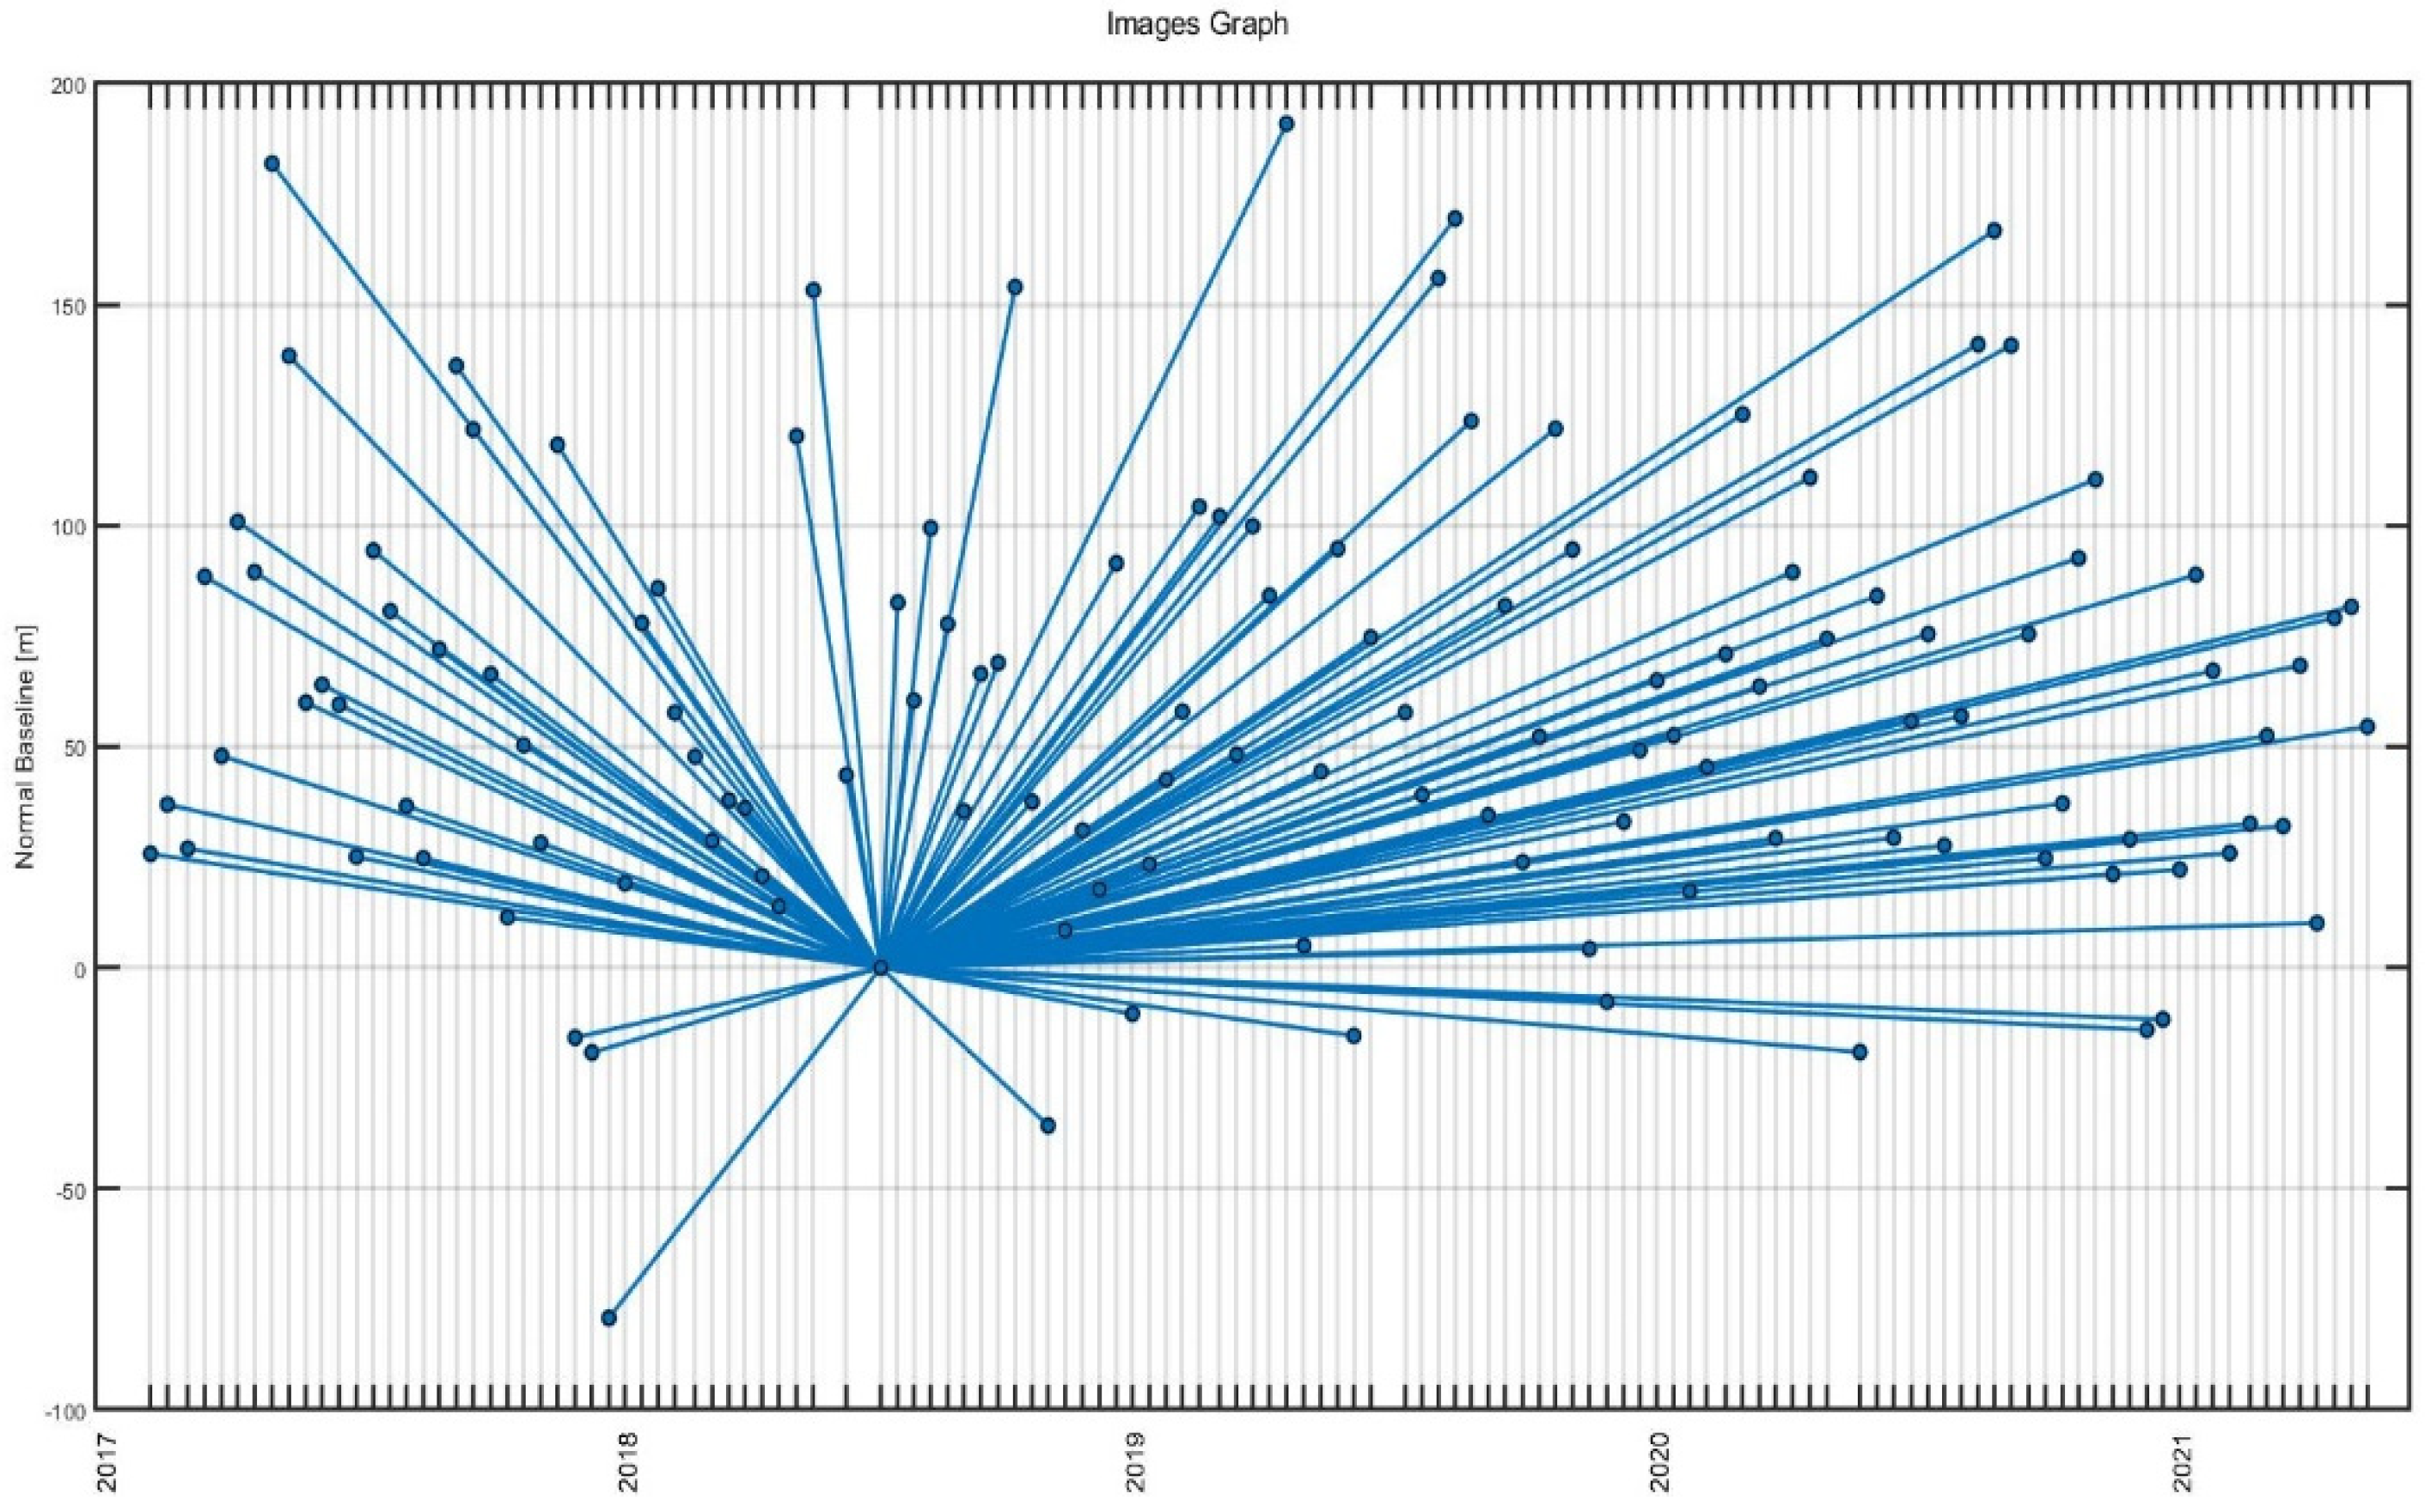
3.1. Remote Sensing SAR Dataset
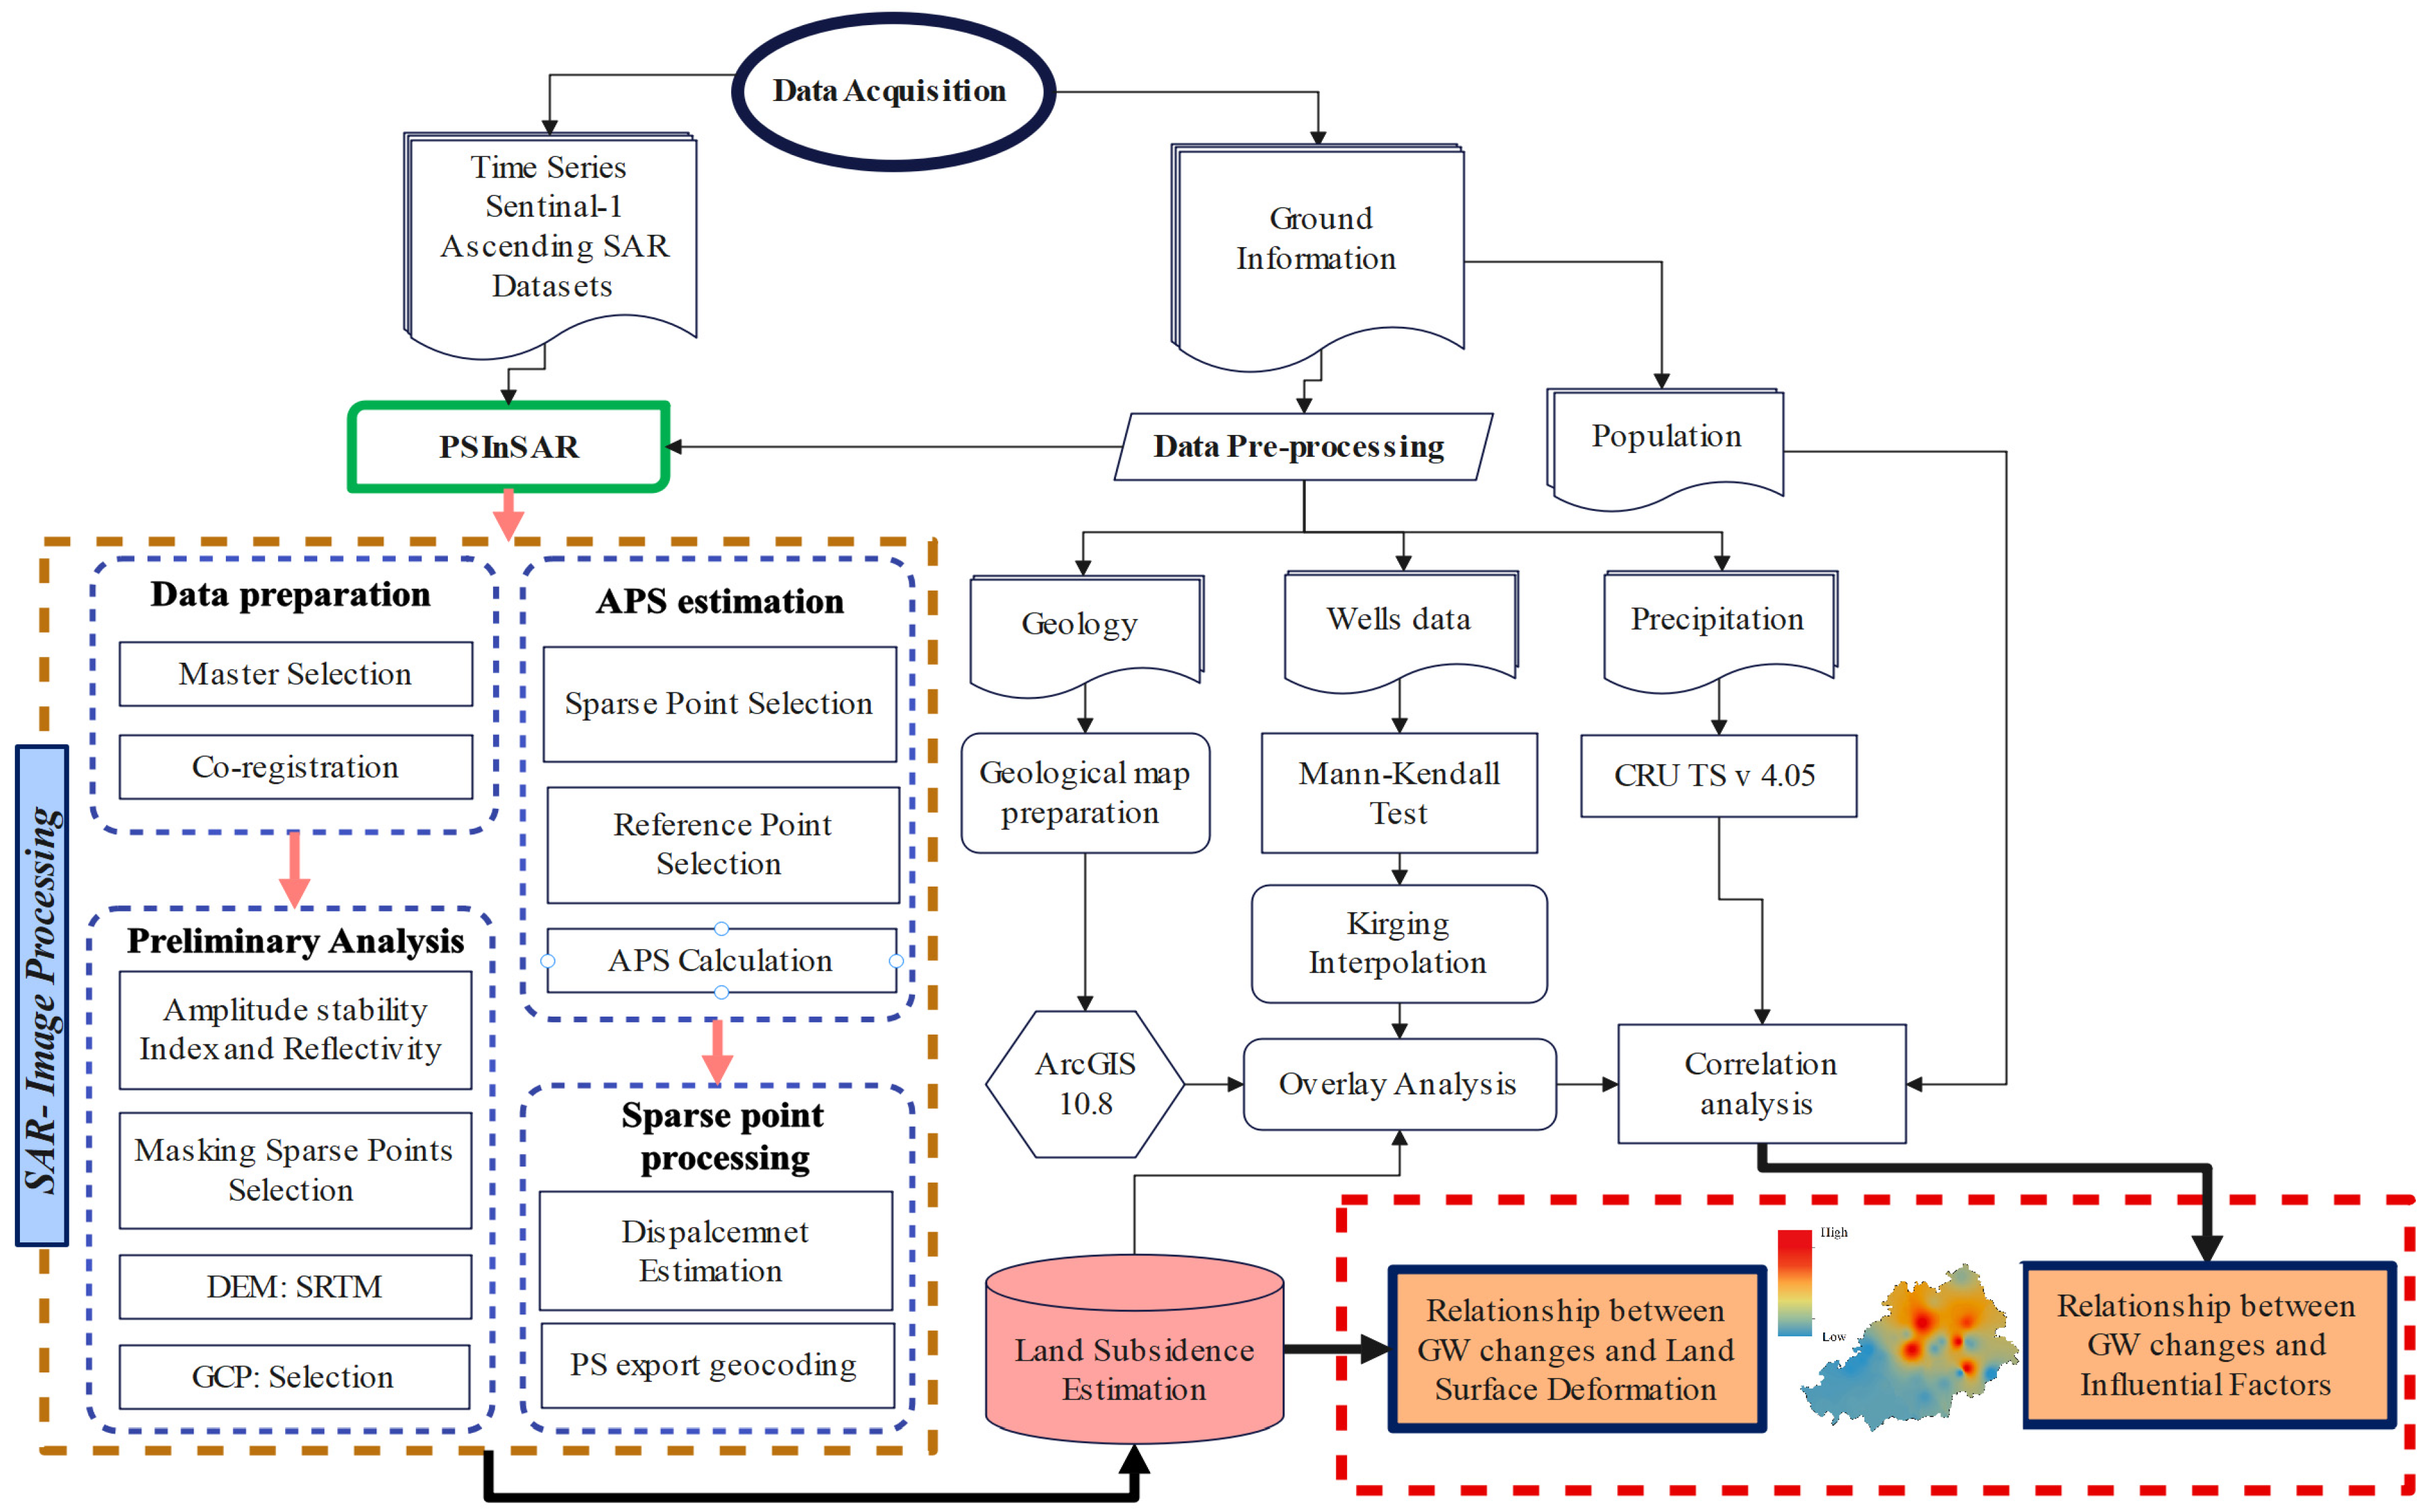
3.2. Research Methodology
Data Preparation
3.3. Groundwater and PS-InSAR
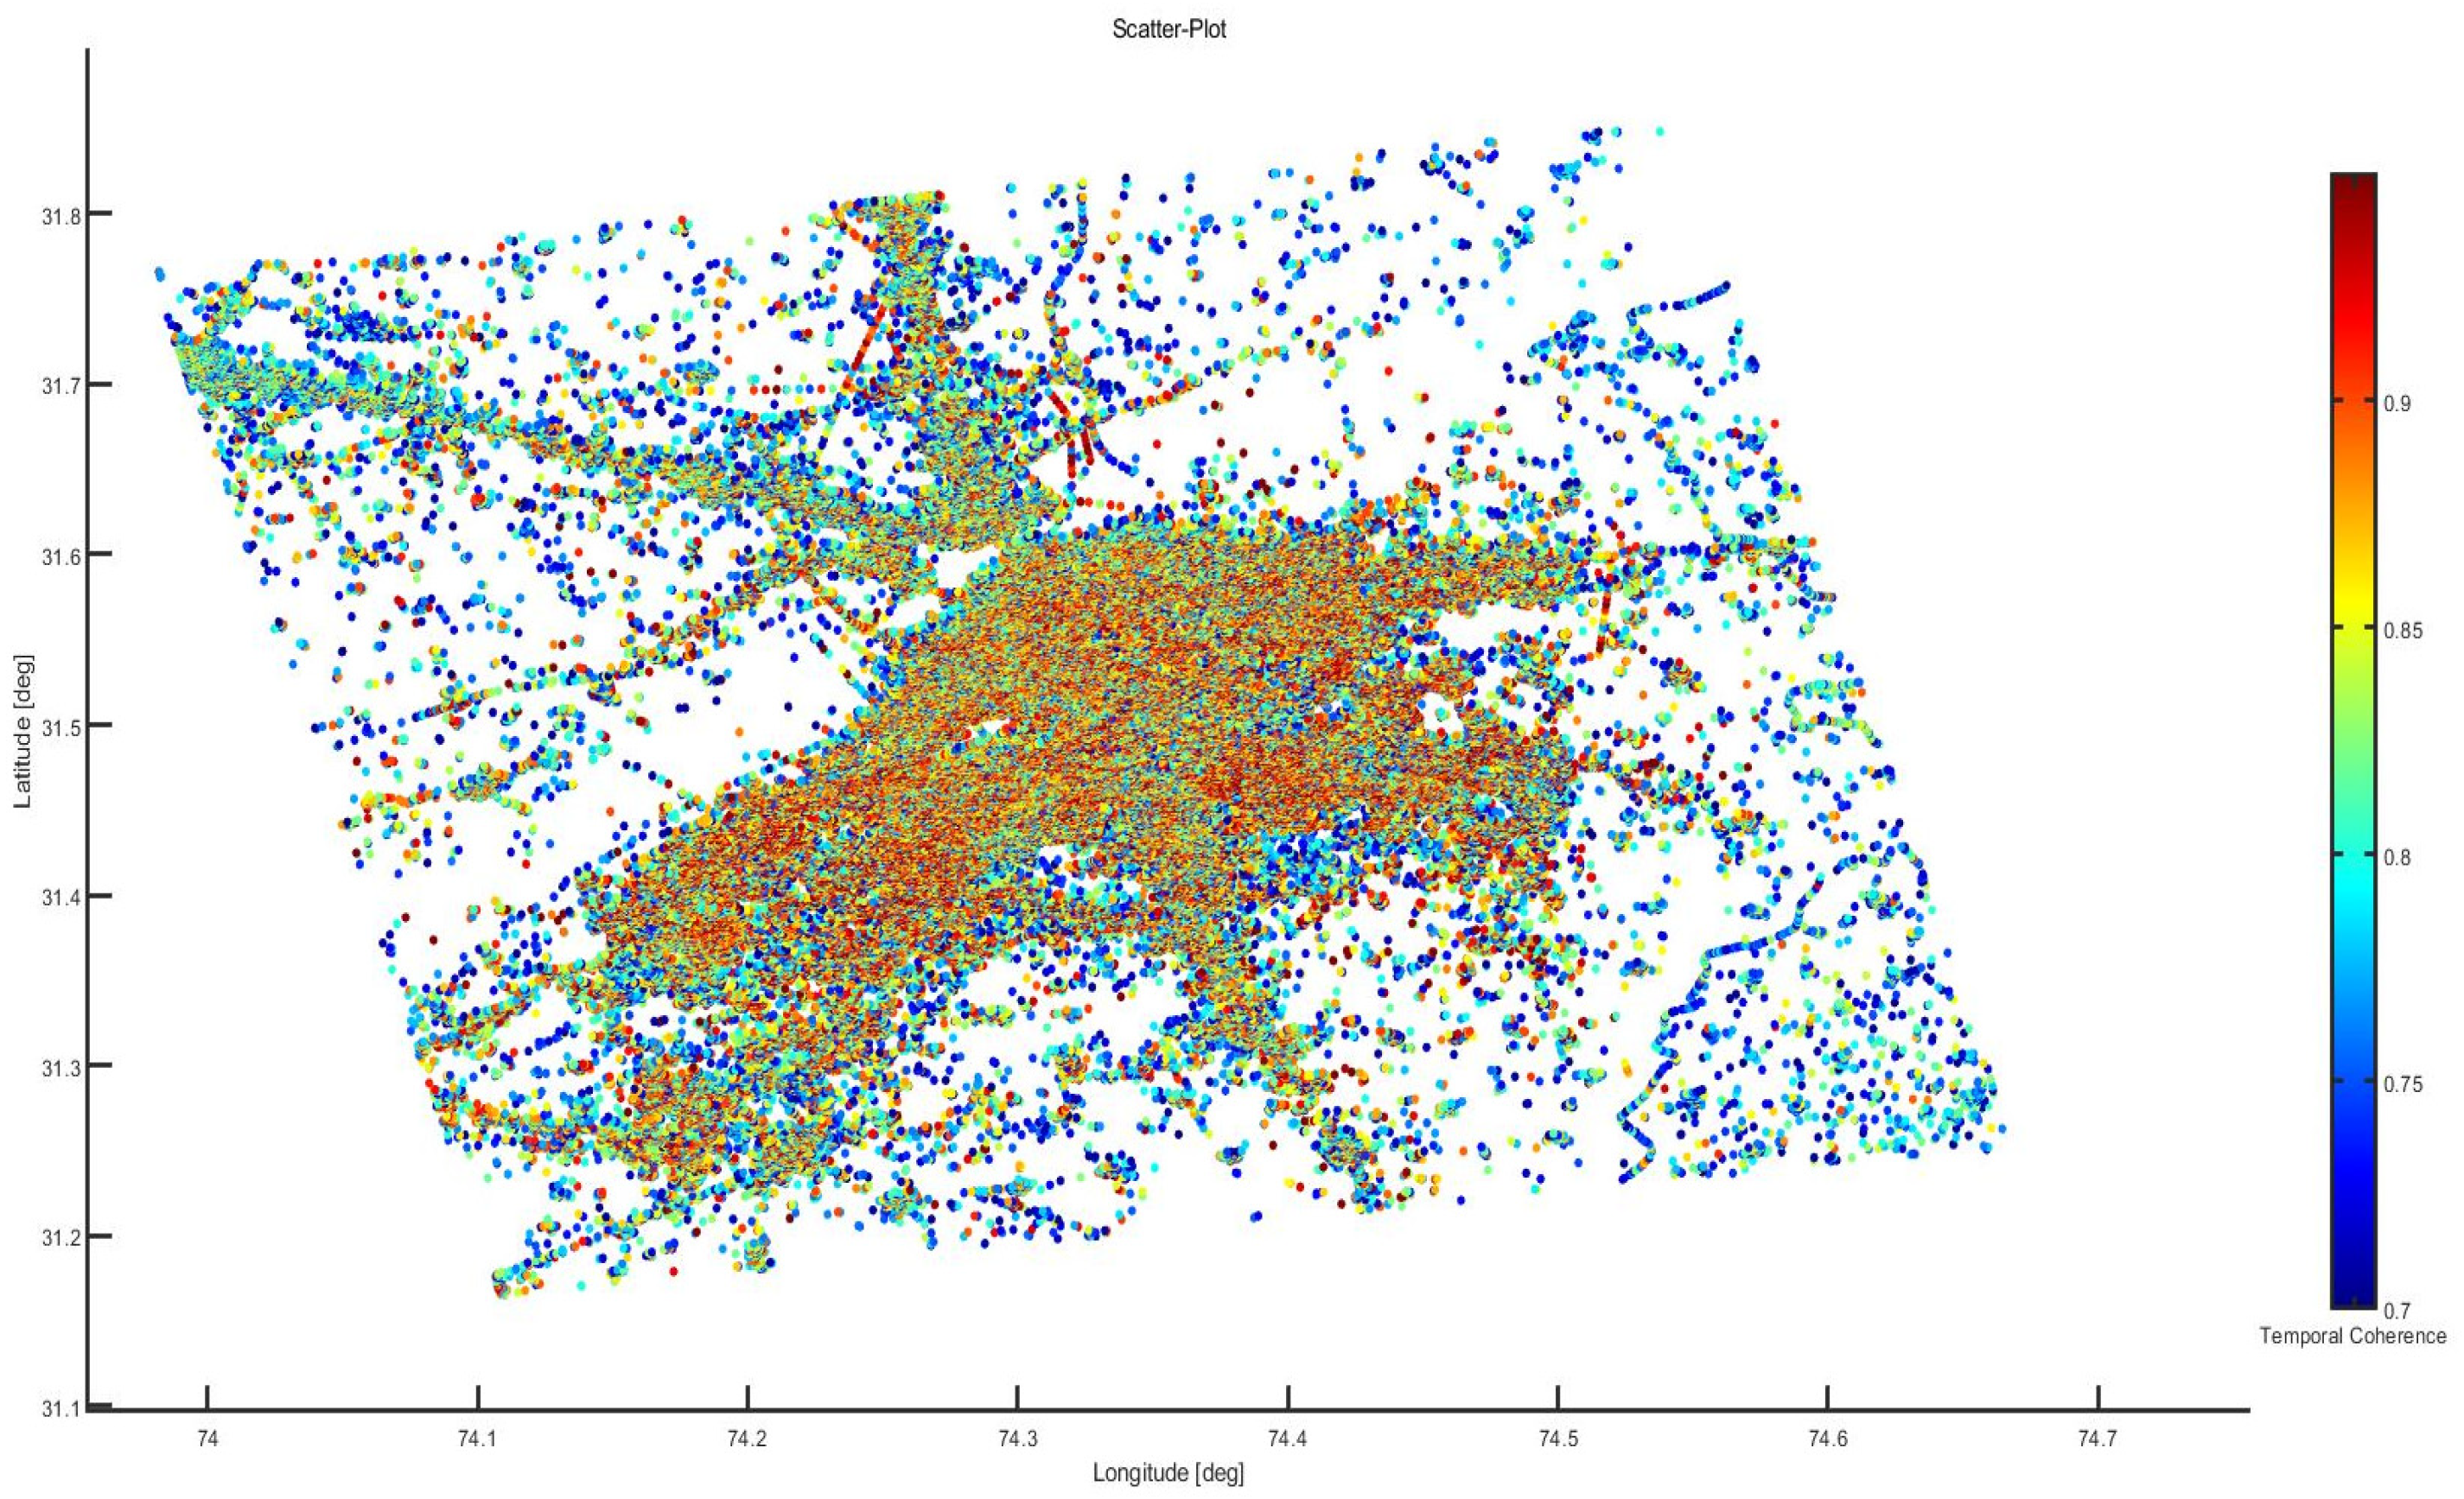
3.3.1. PS-InSAR Data Analysis
3.3.2. Preliminary Analysis
3.3.3. Atmosphere Phase Screen (APS) Estimation
3.3.4. Groundwater Level
3.3.5. Spatial Interpolation
3.4. Trend Analysis
3.5. Correlation Analysis
4. Results
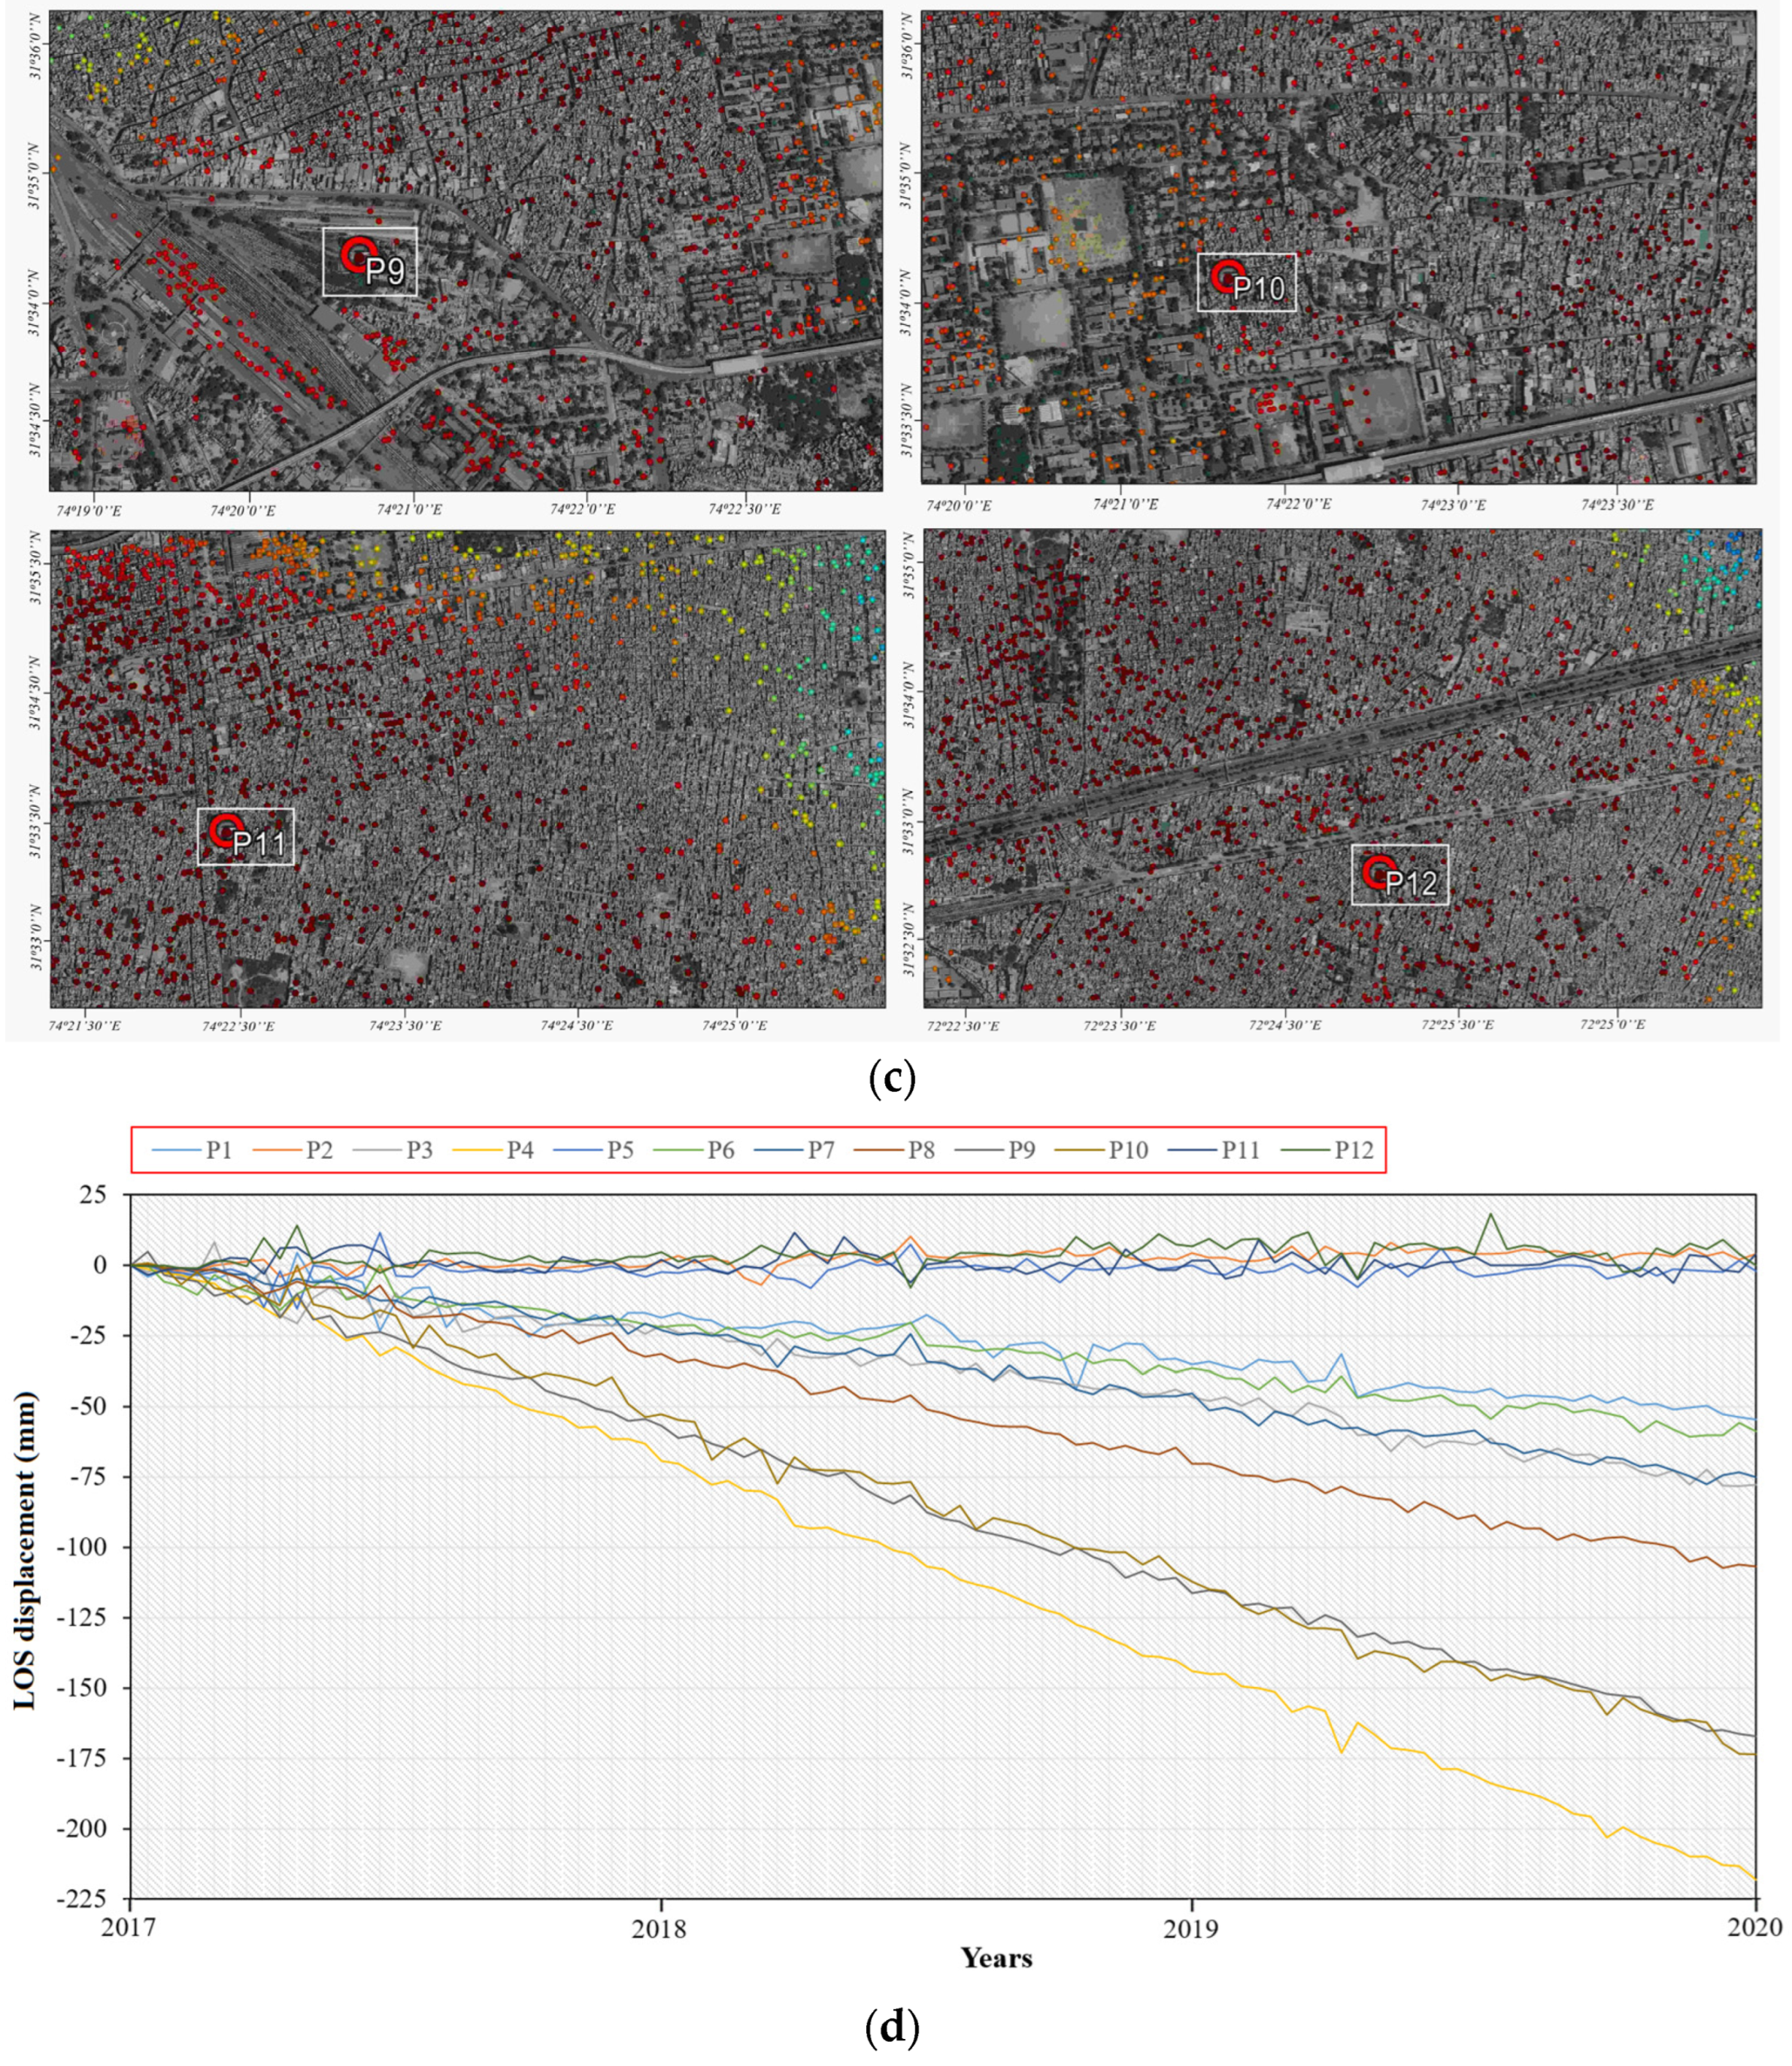
4.1. Spatio-Temporal Variations in Land Subsidence
4.1.1. Land Surface Subsidence Scenario
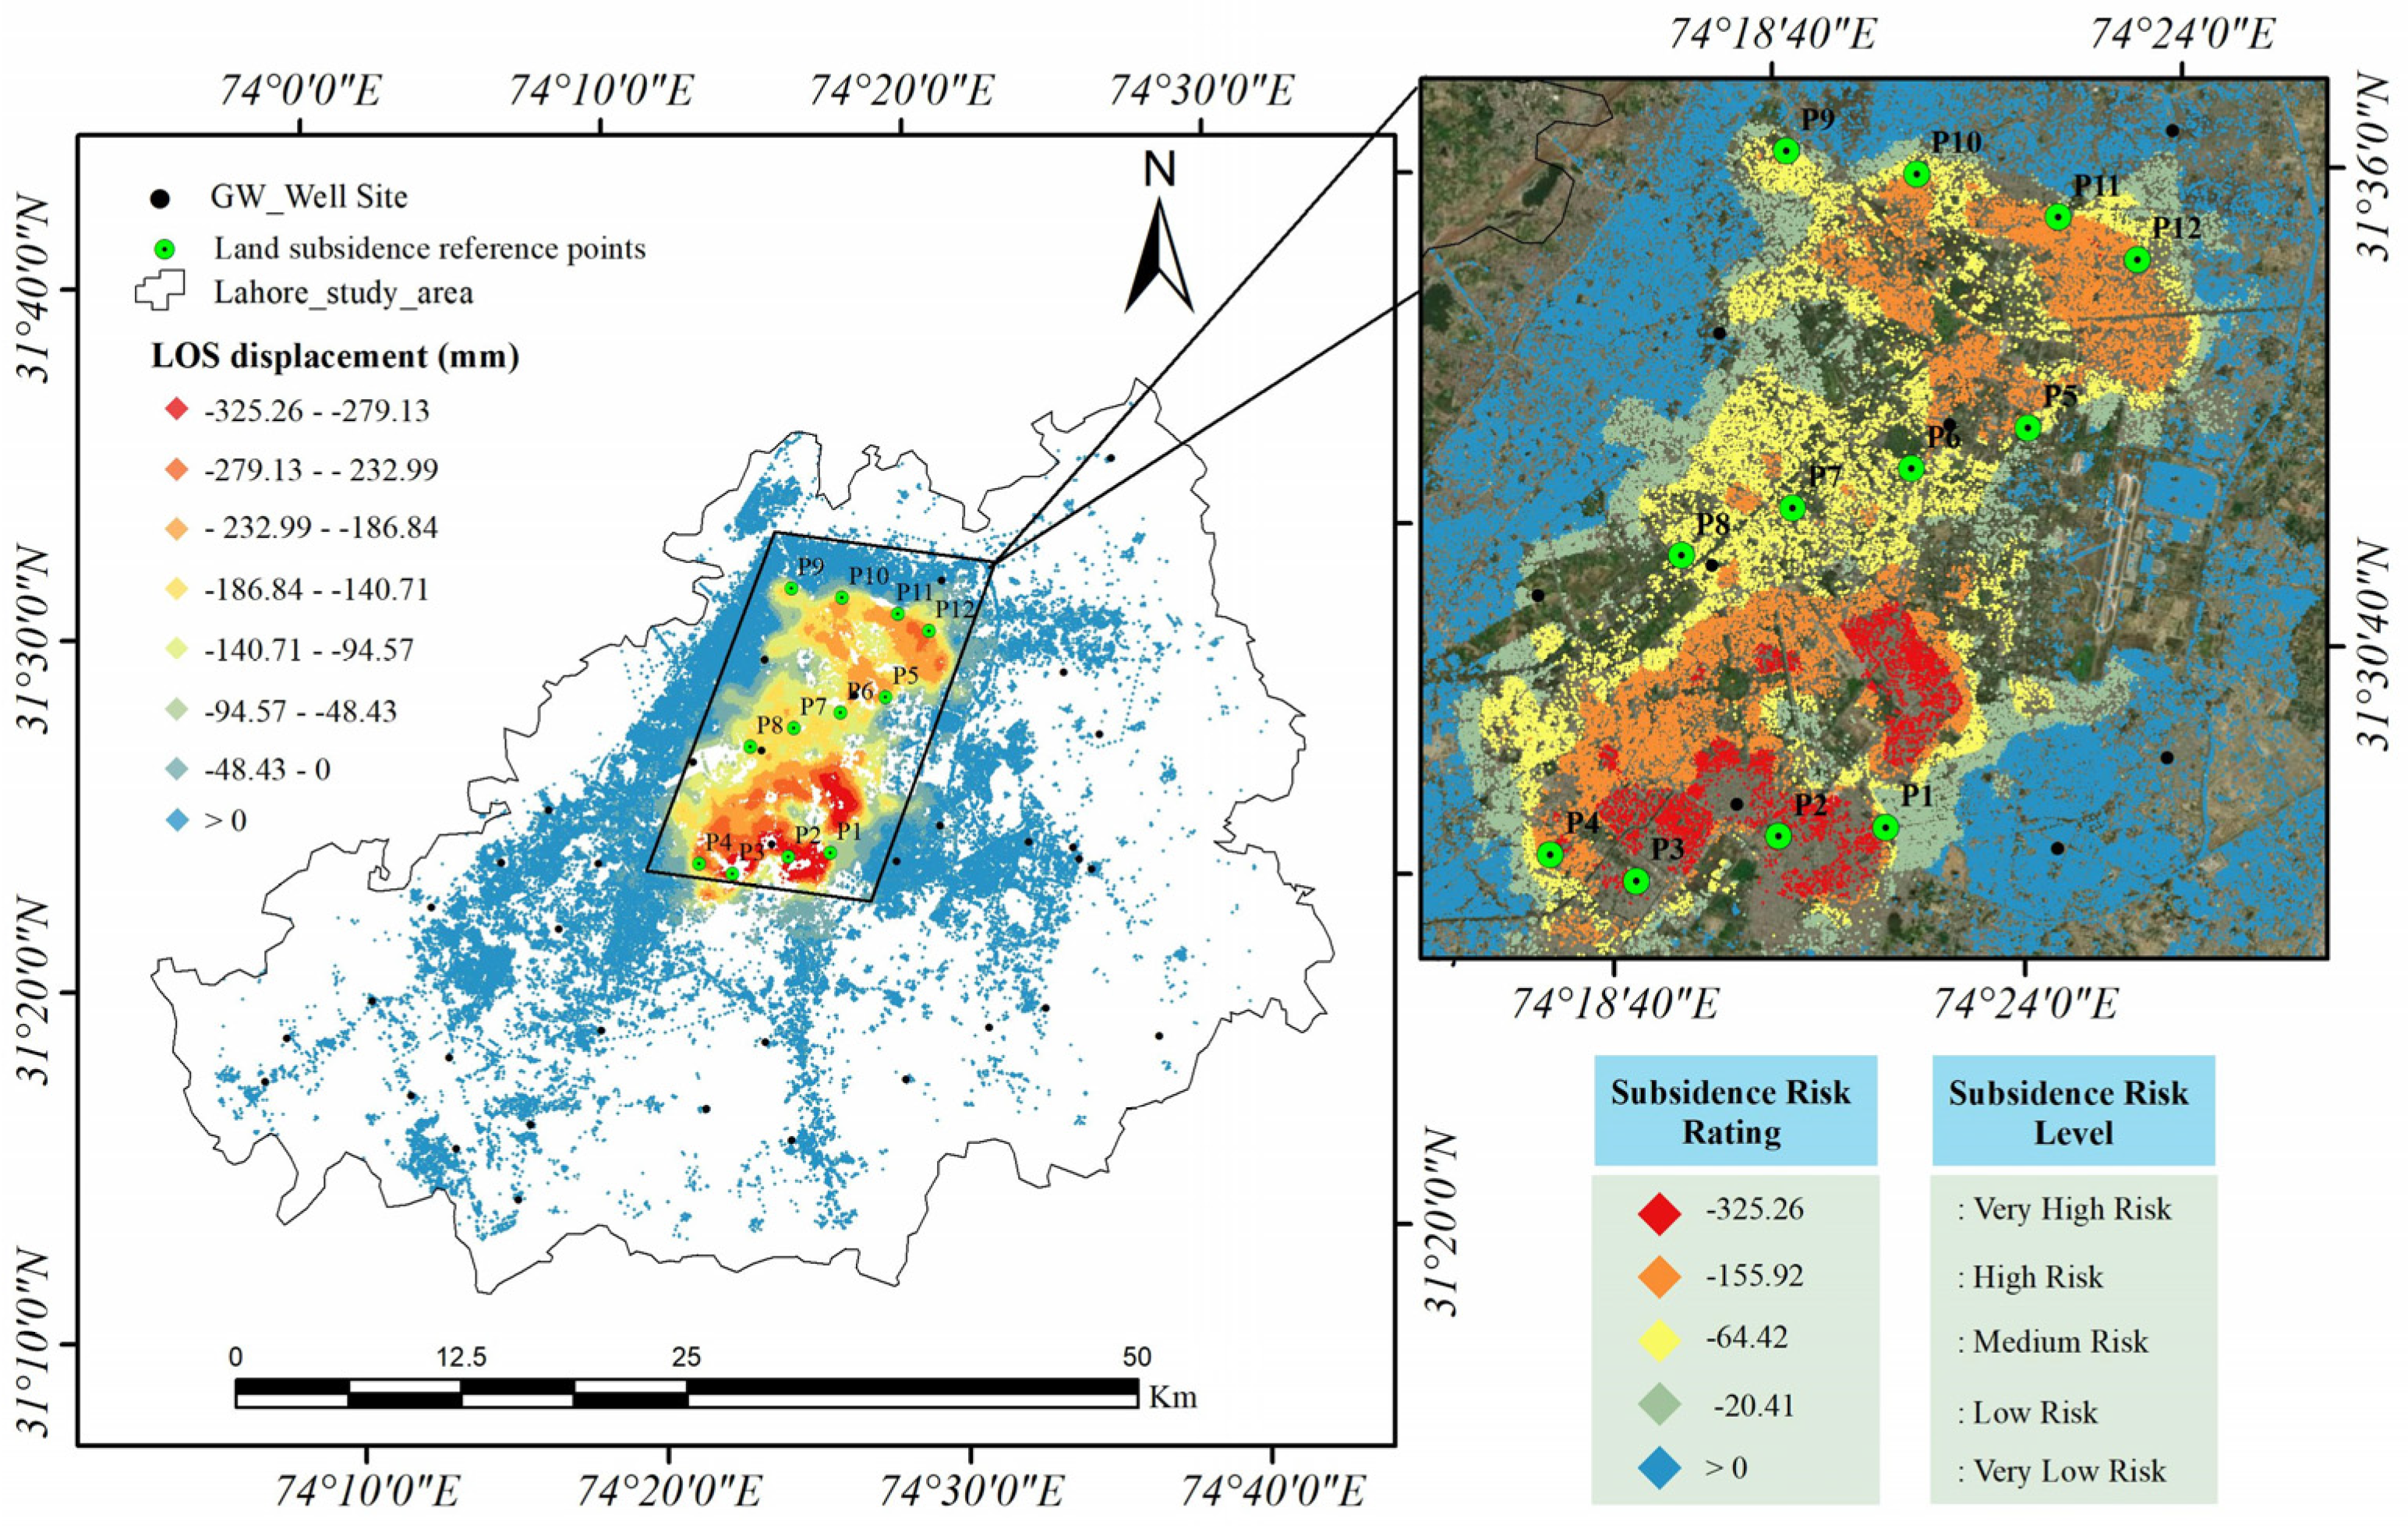
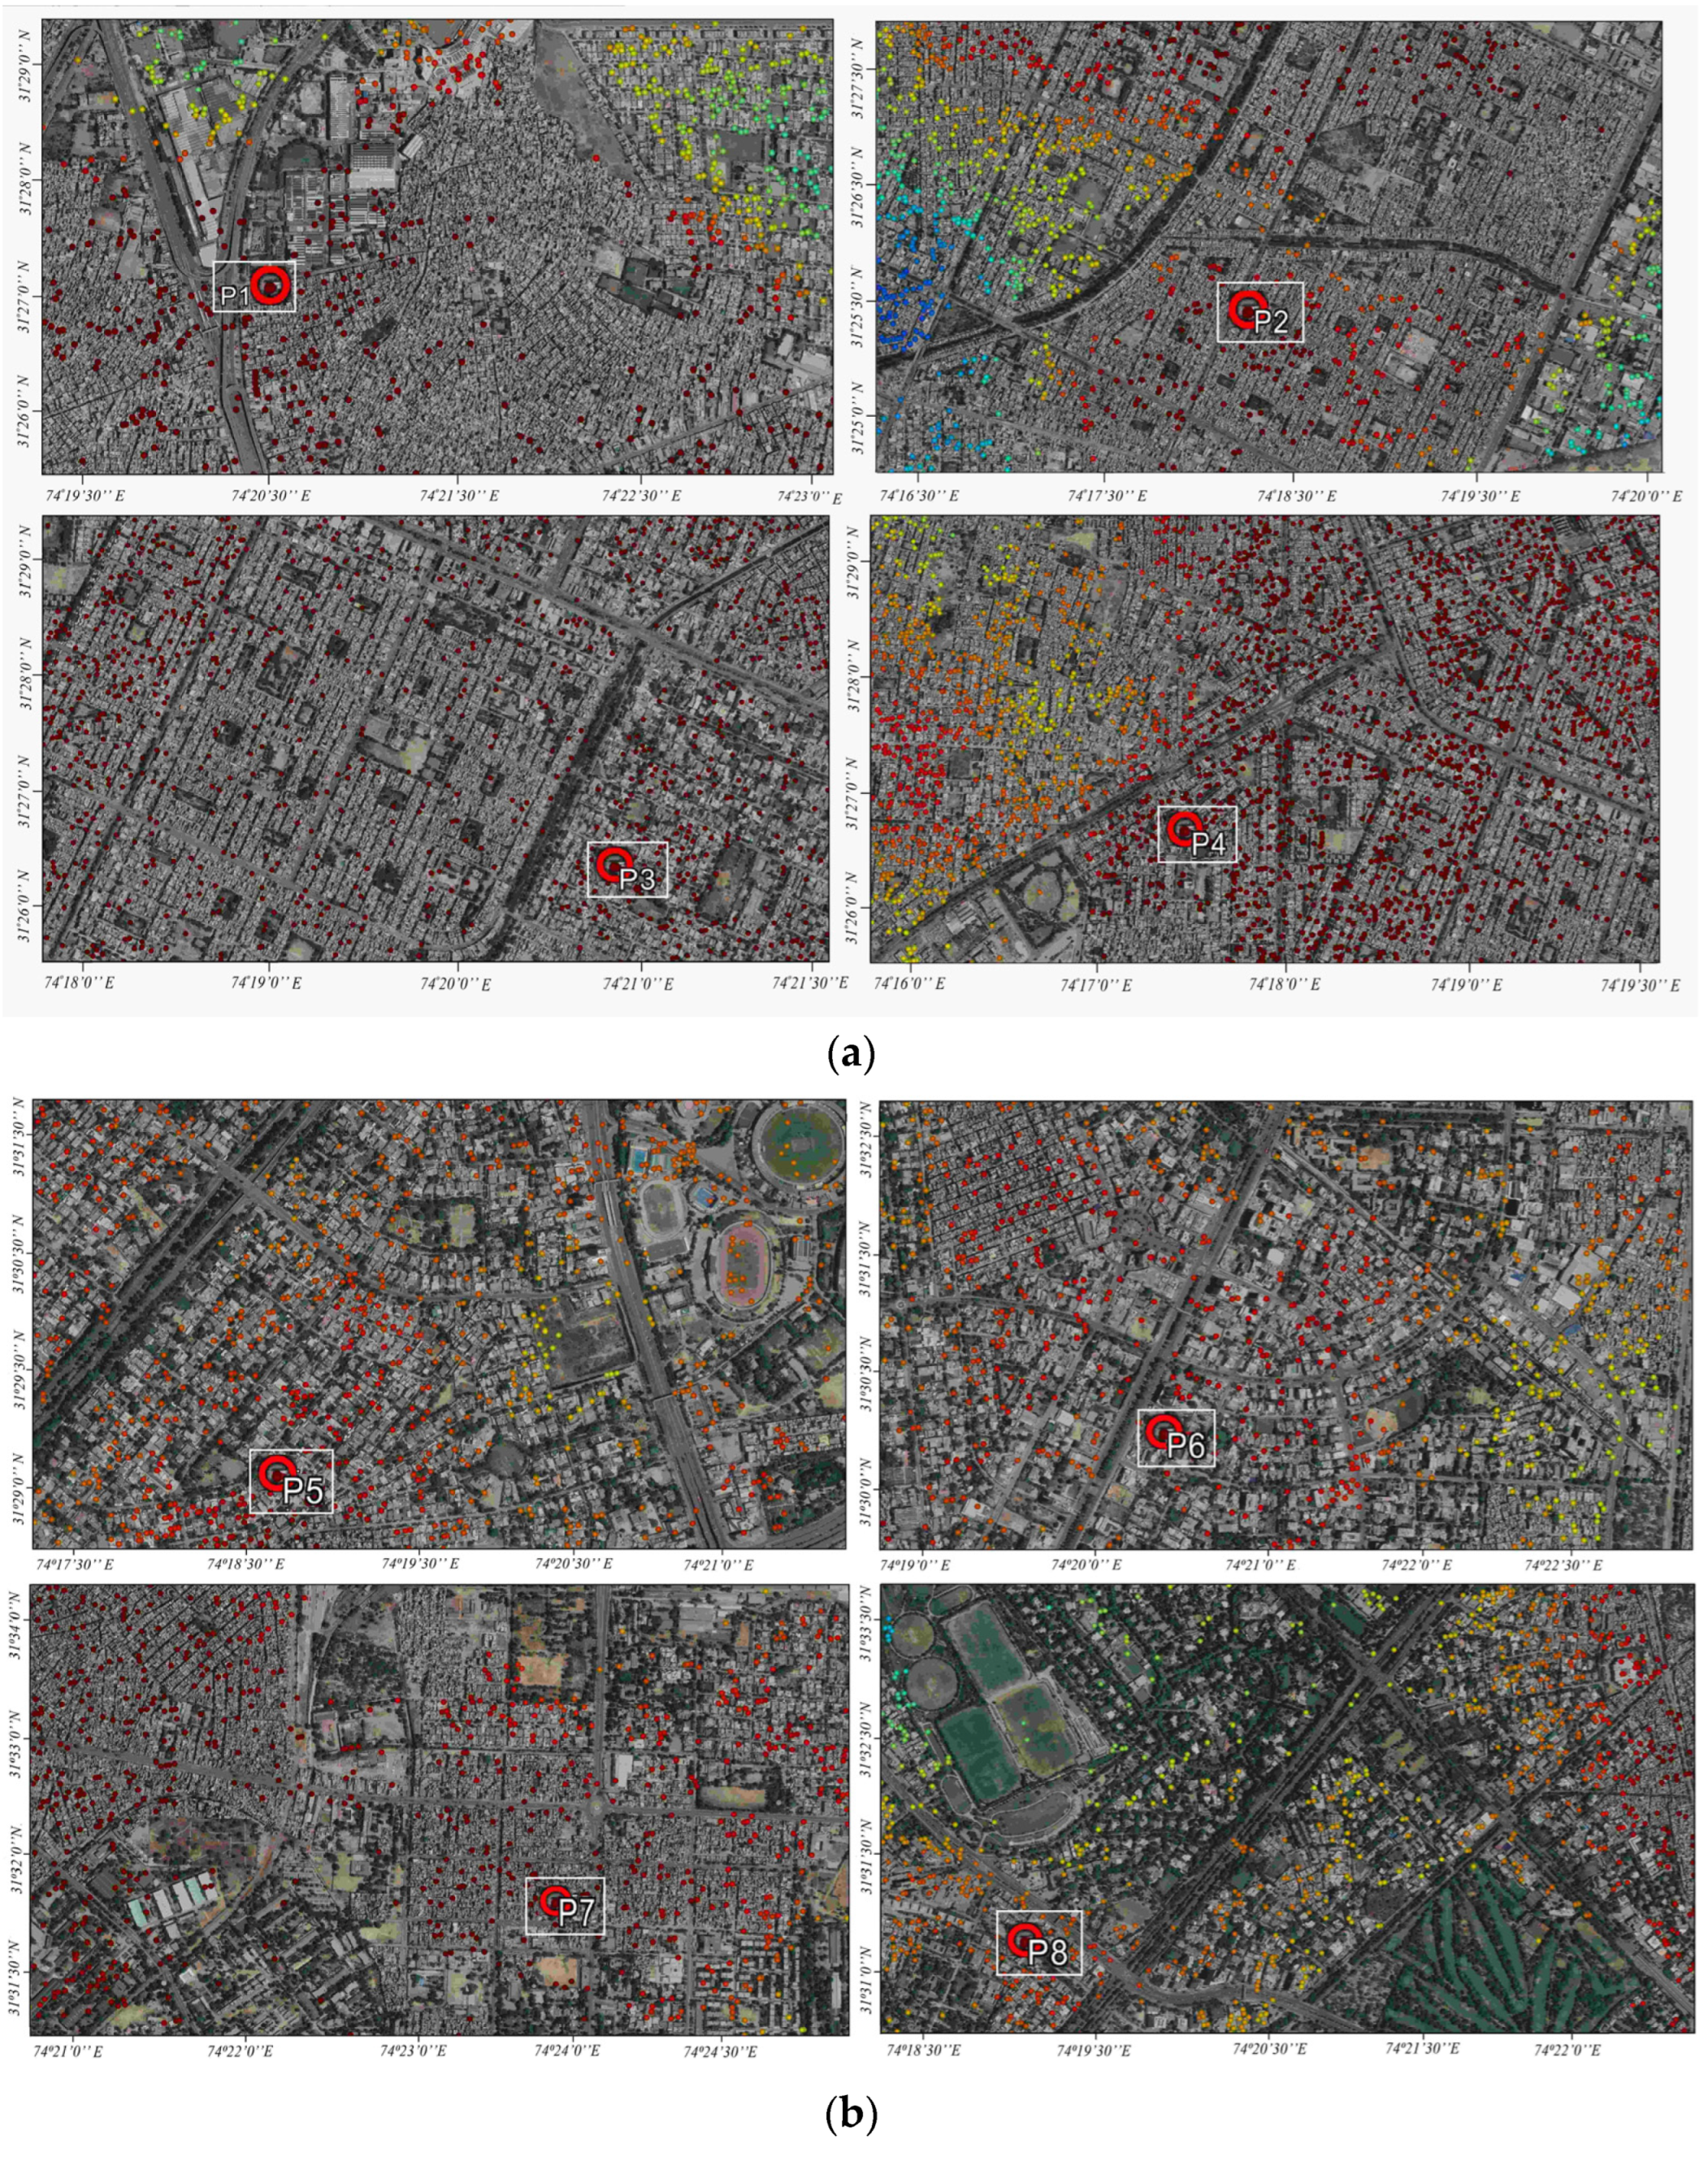
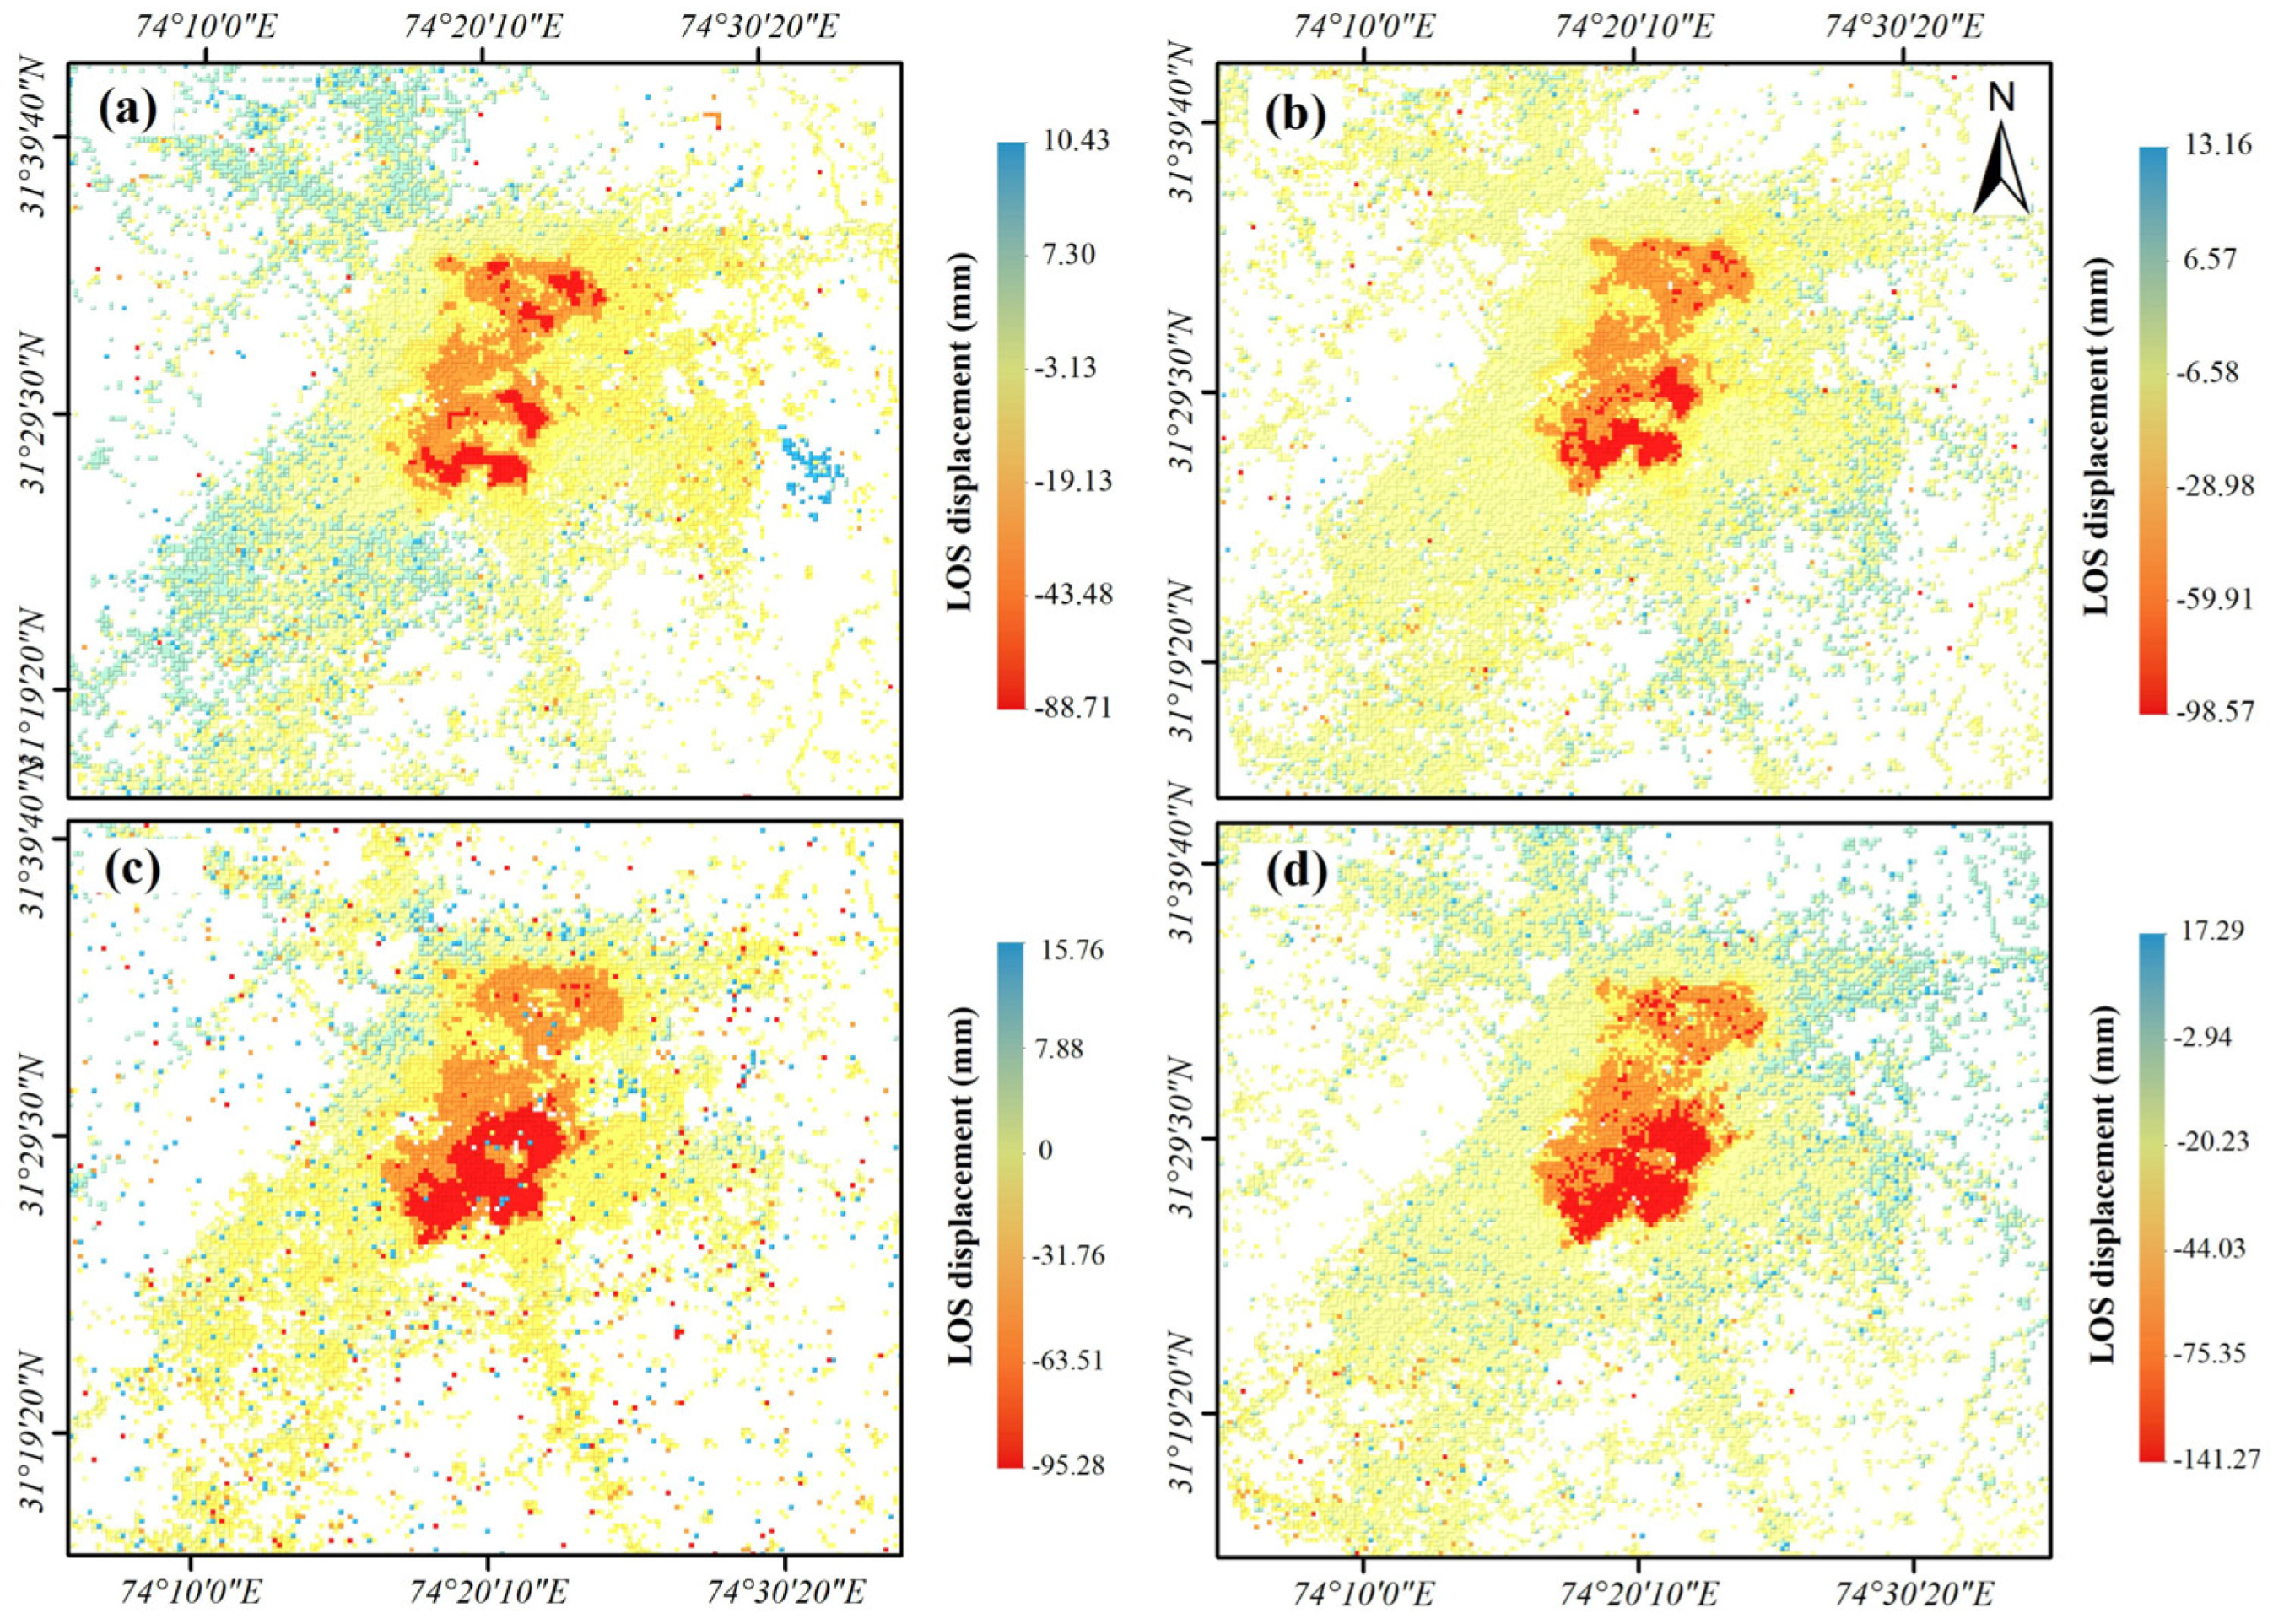
4.1.2. Spatial Pattern of Land Surface LOS Displacement
4.1.3. Mean Annual Spatial Pattern in Land Subsidence
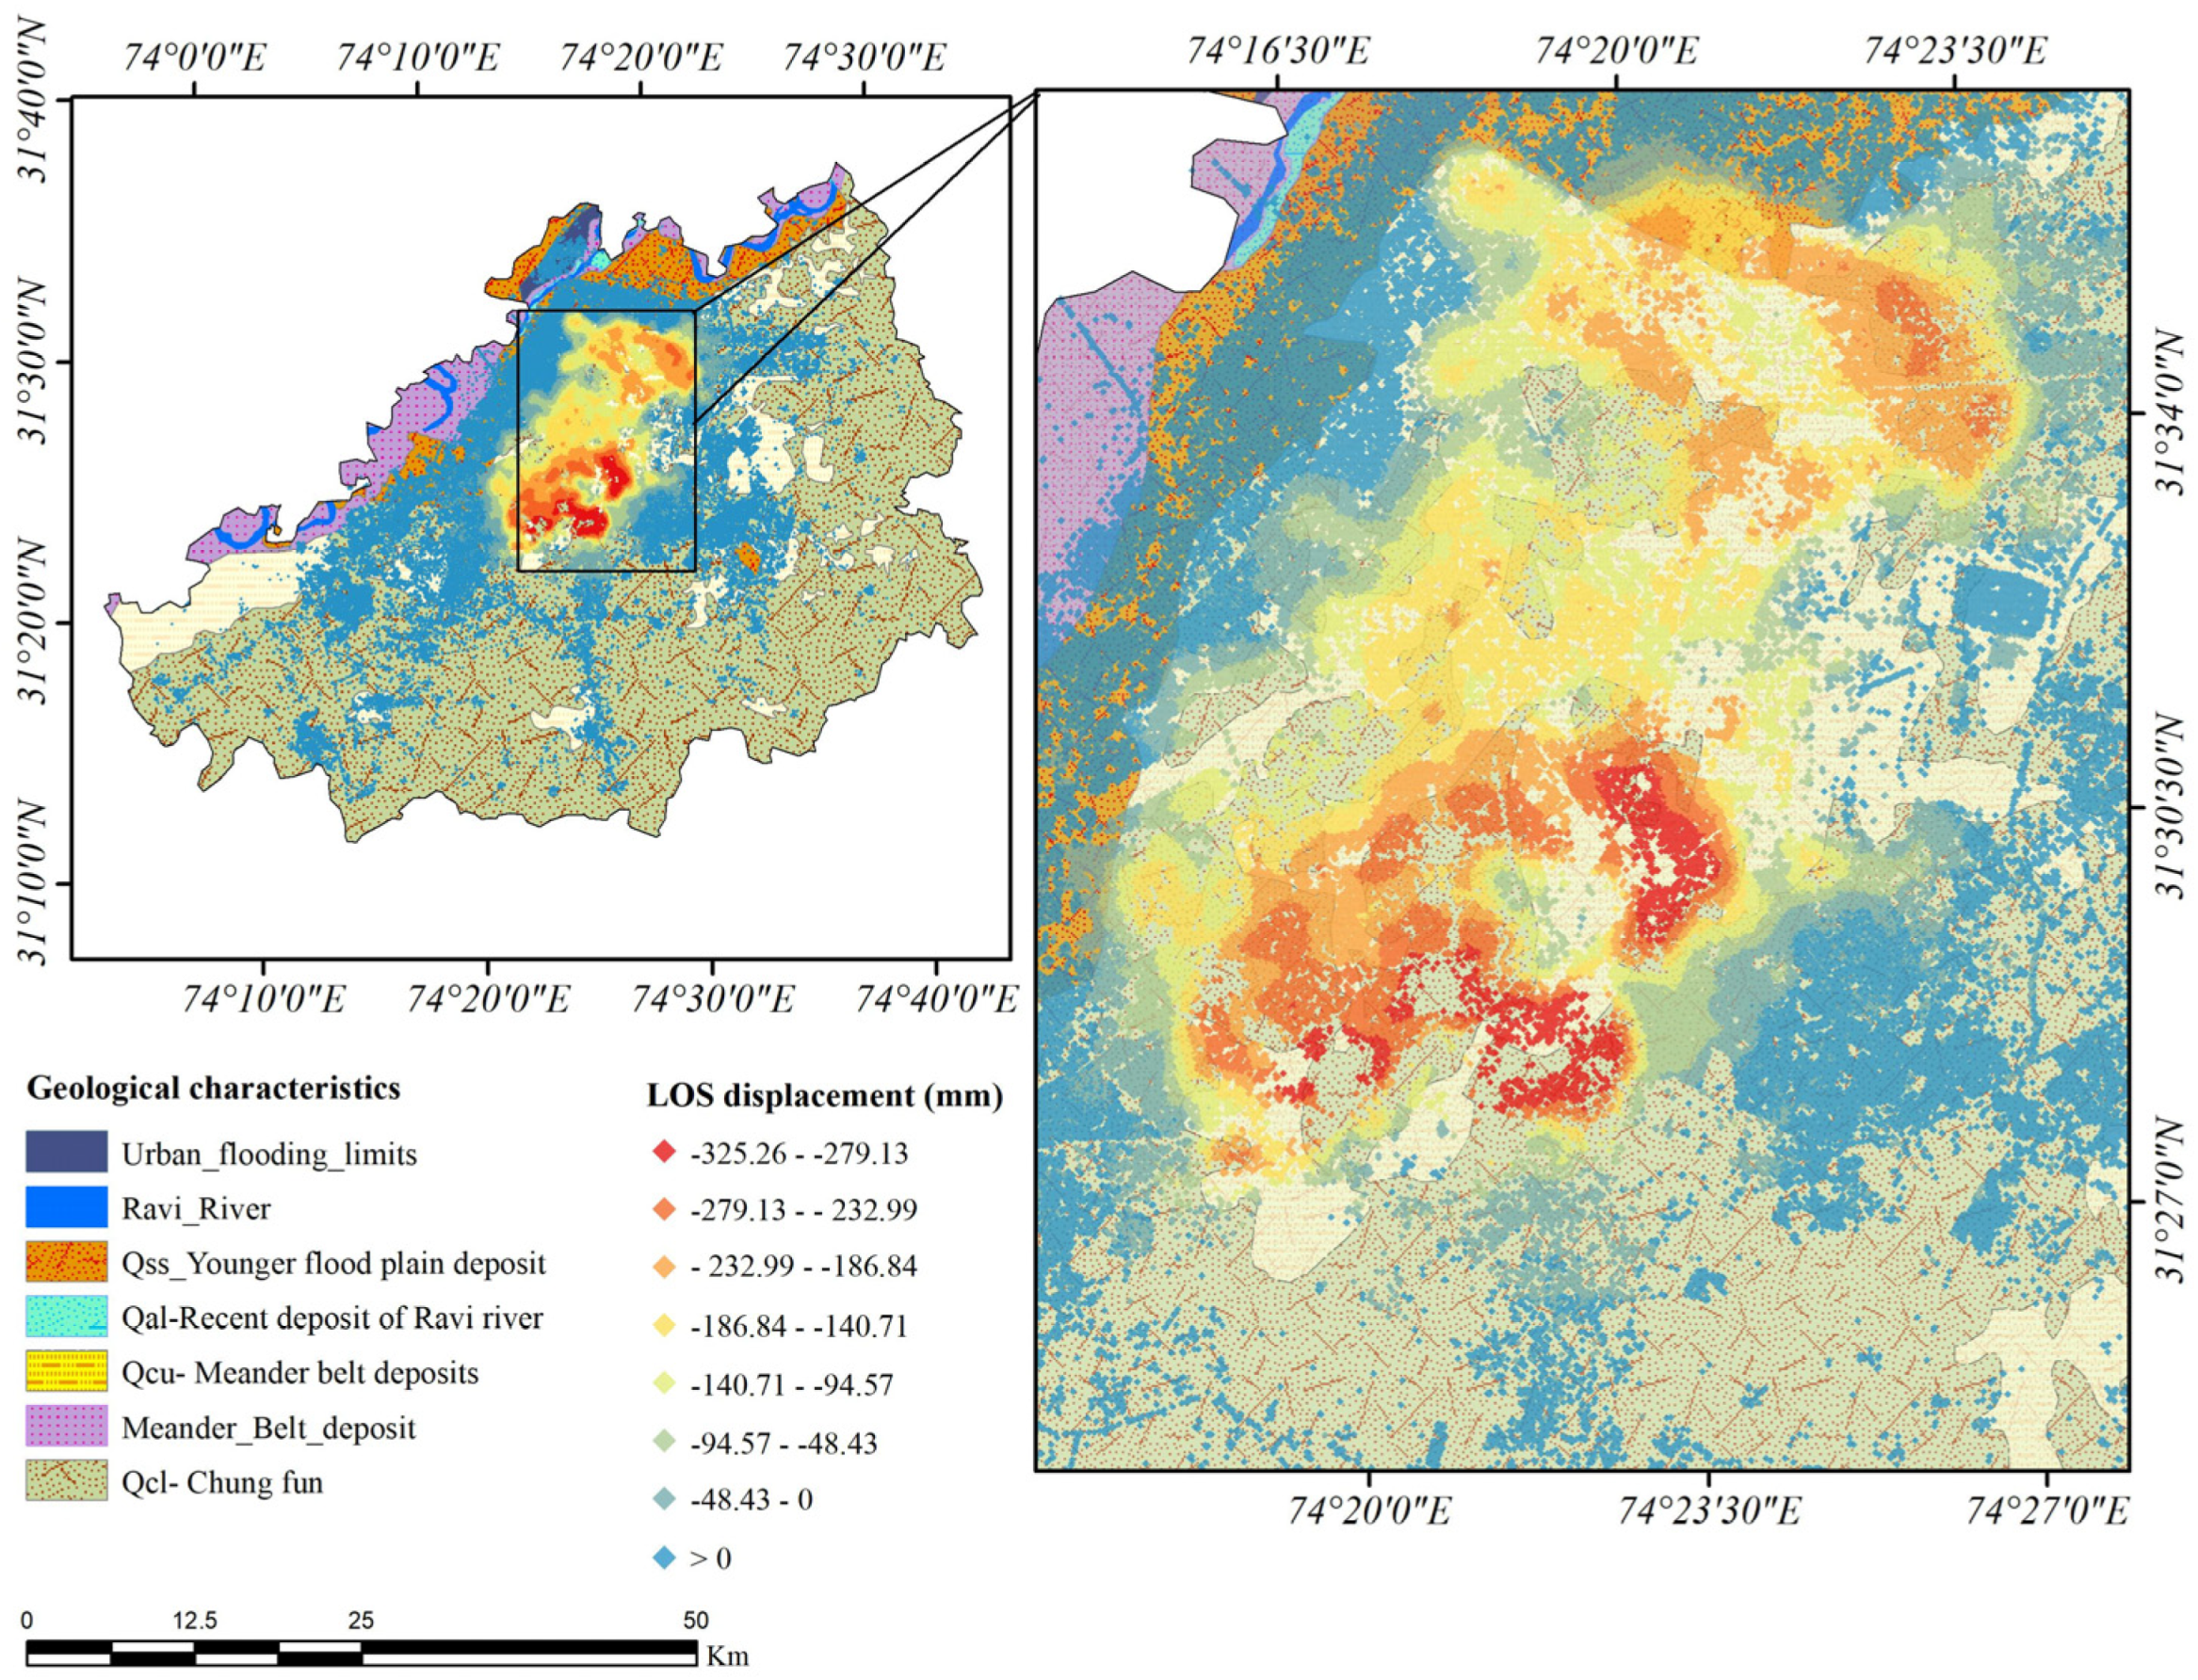
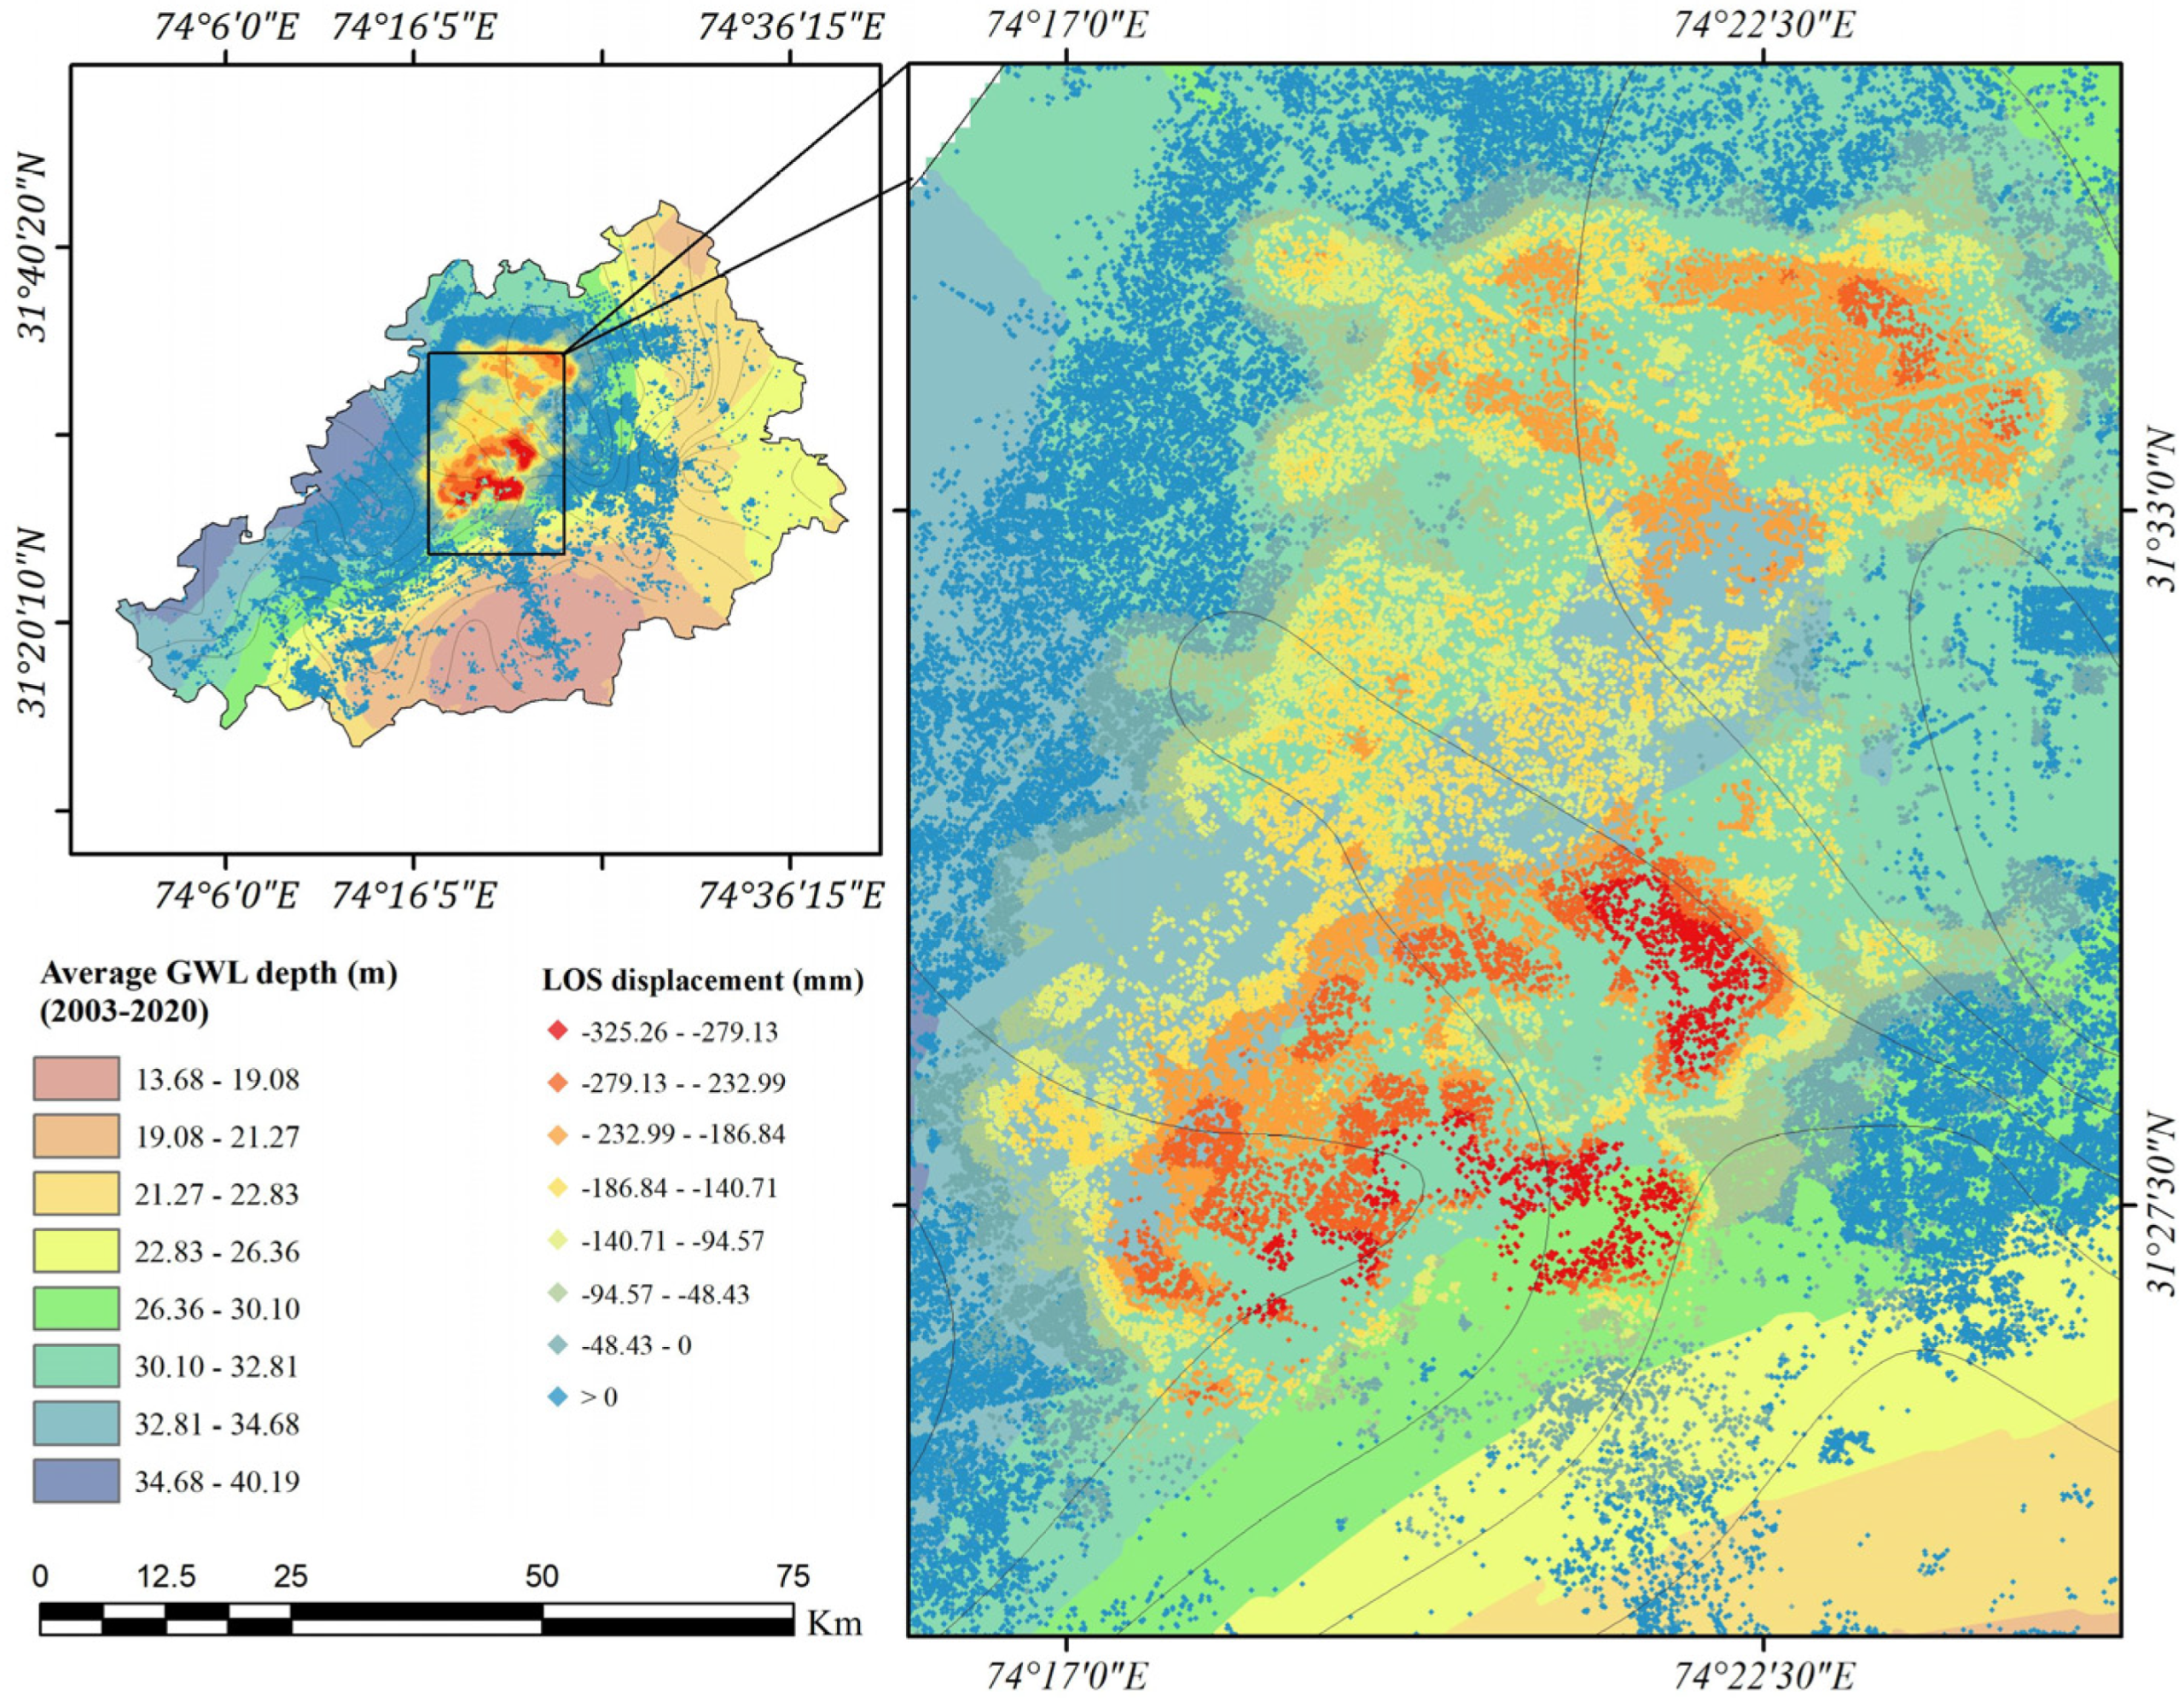
4.2. Land Subsidence in Relationship with Subsurface Geology
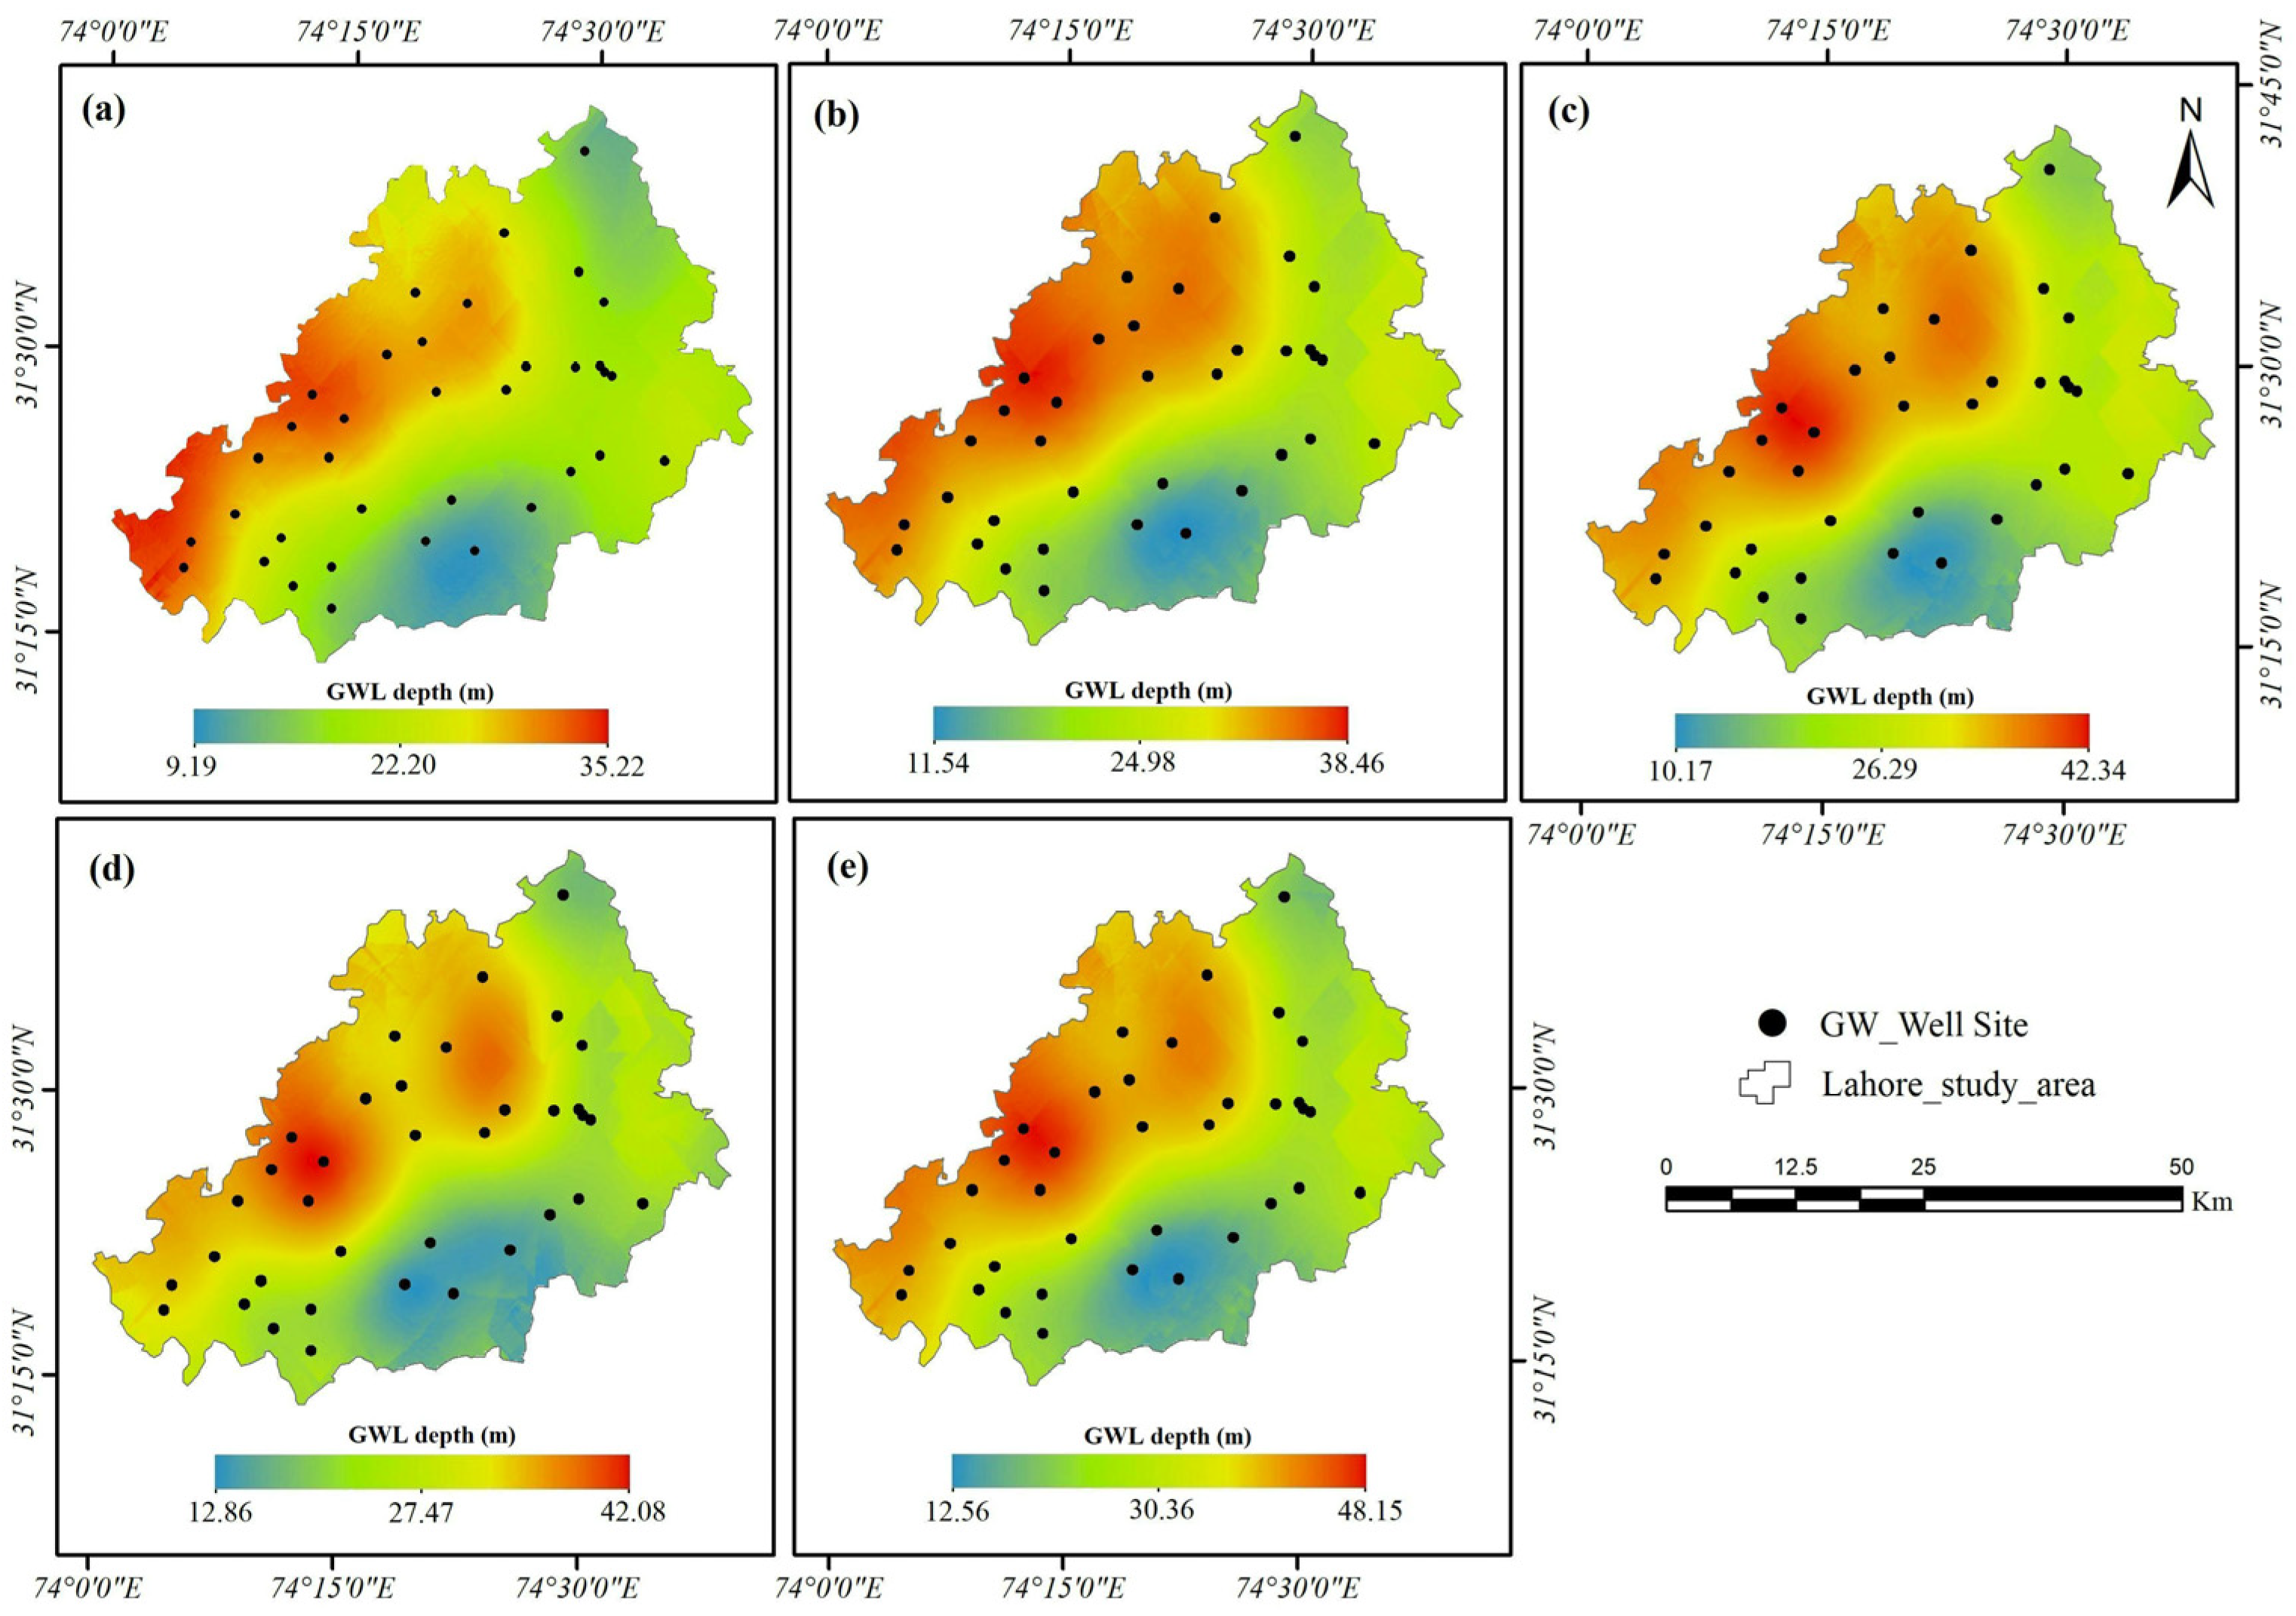
4.3. Spatio-Temporal Variations in Groundwater Level
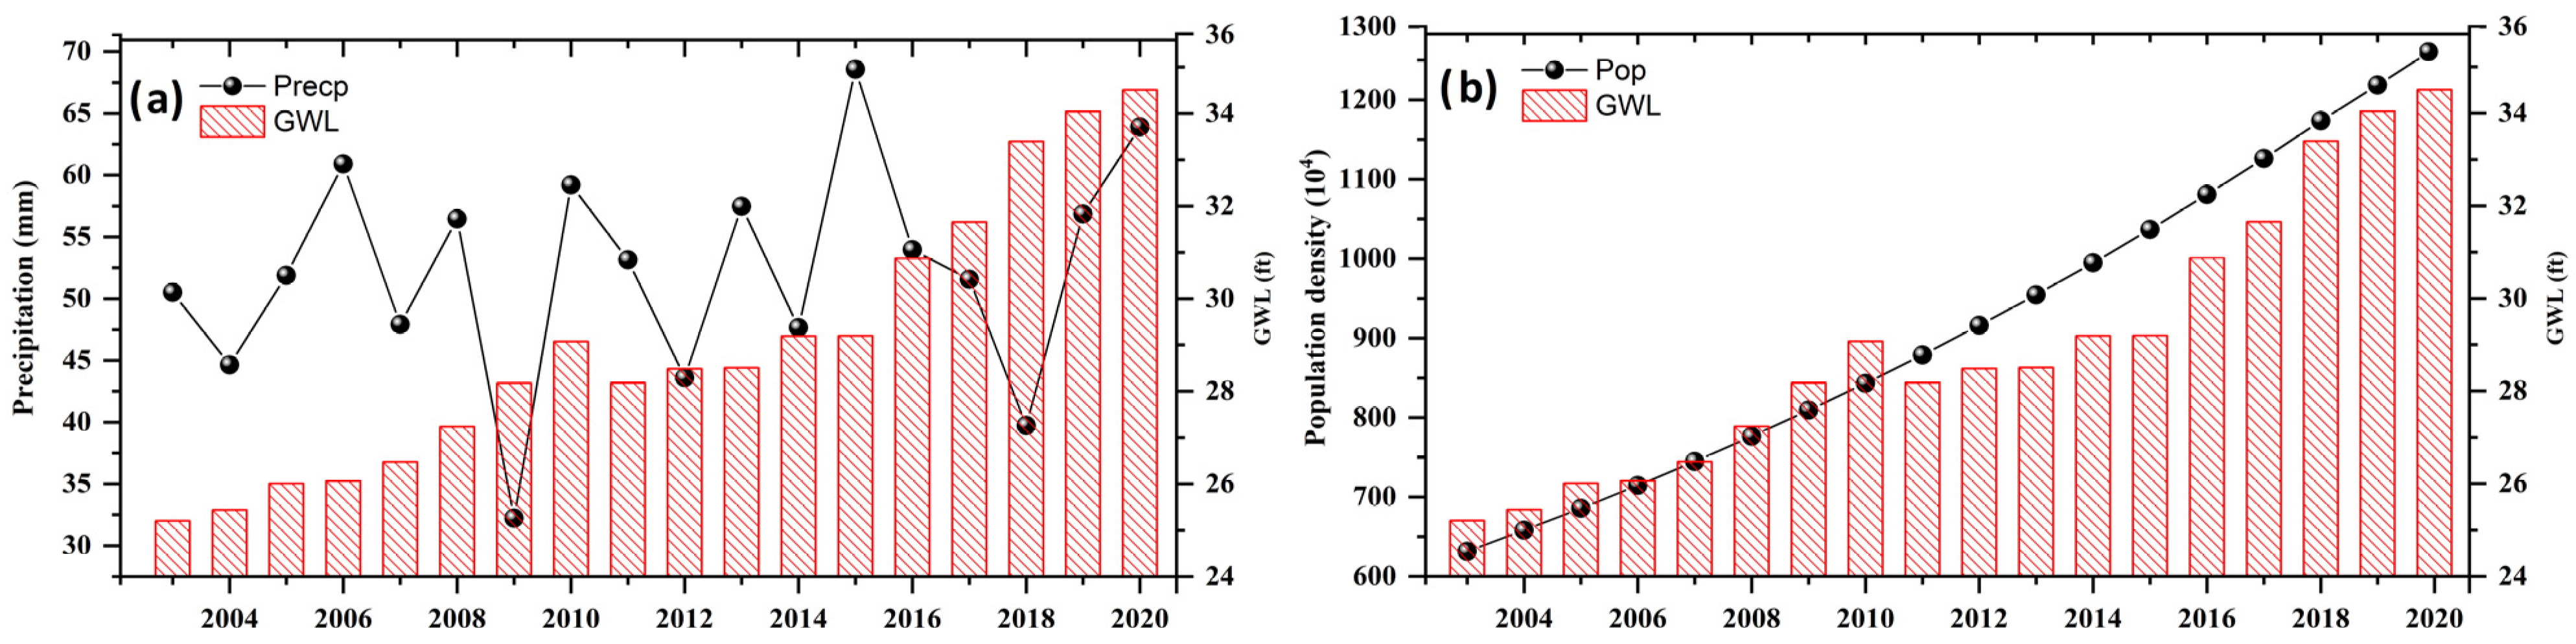
4.4. Exploring Groundwater Depletion and Its Influential Factors
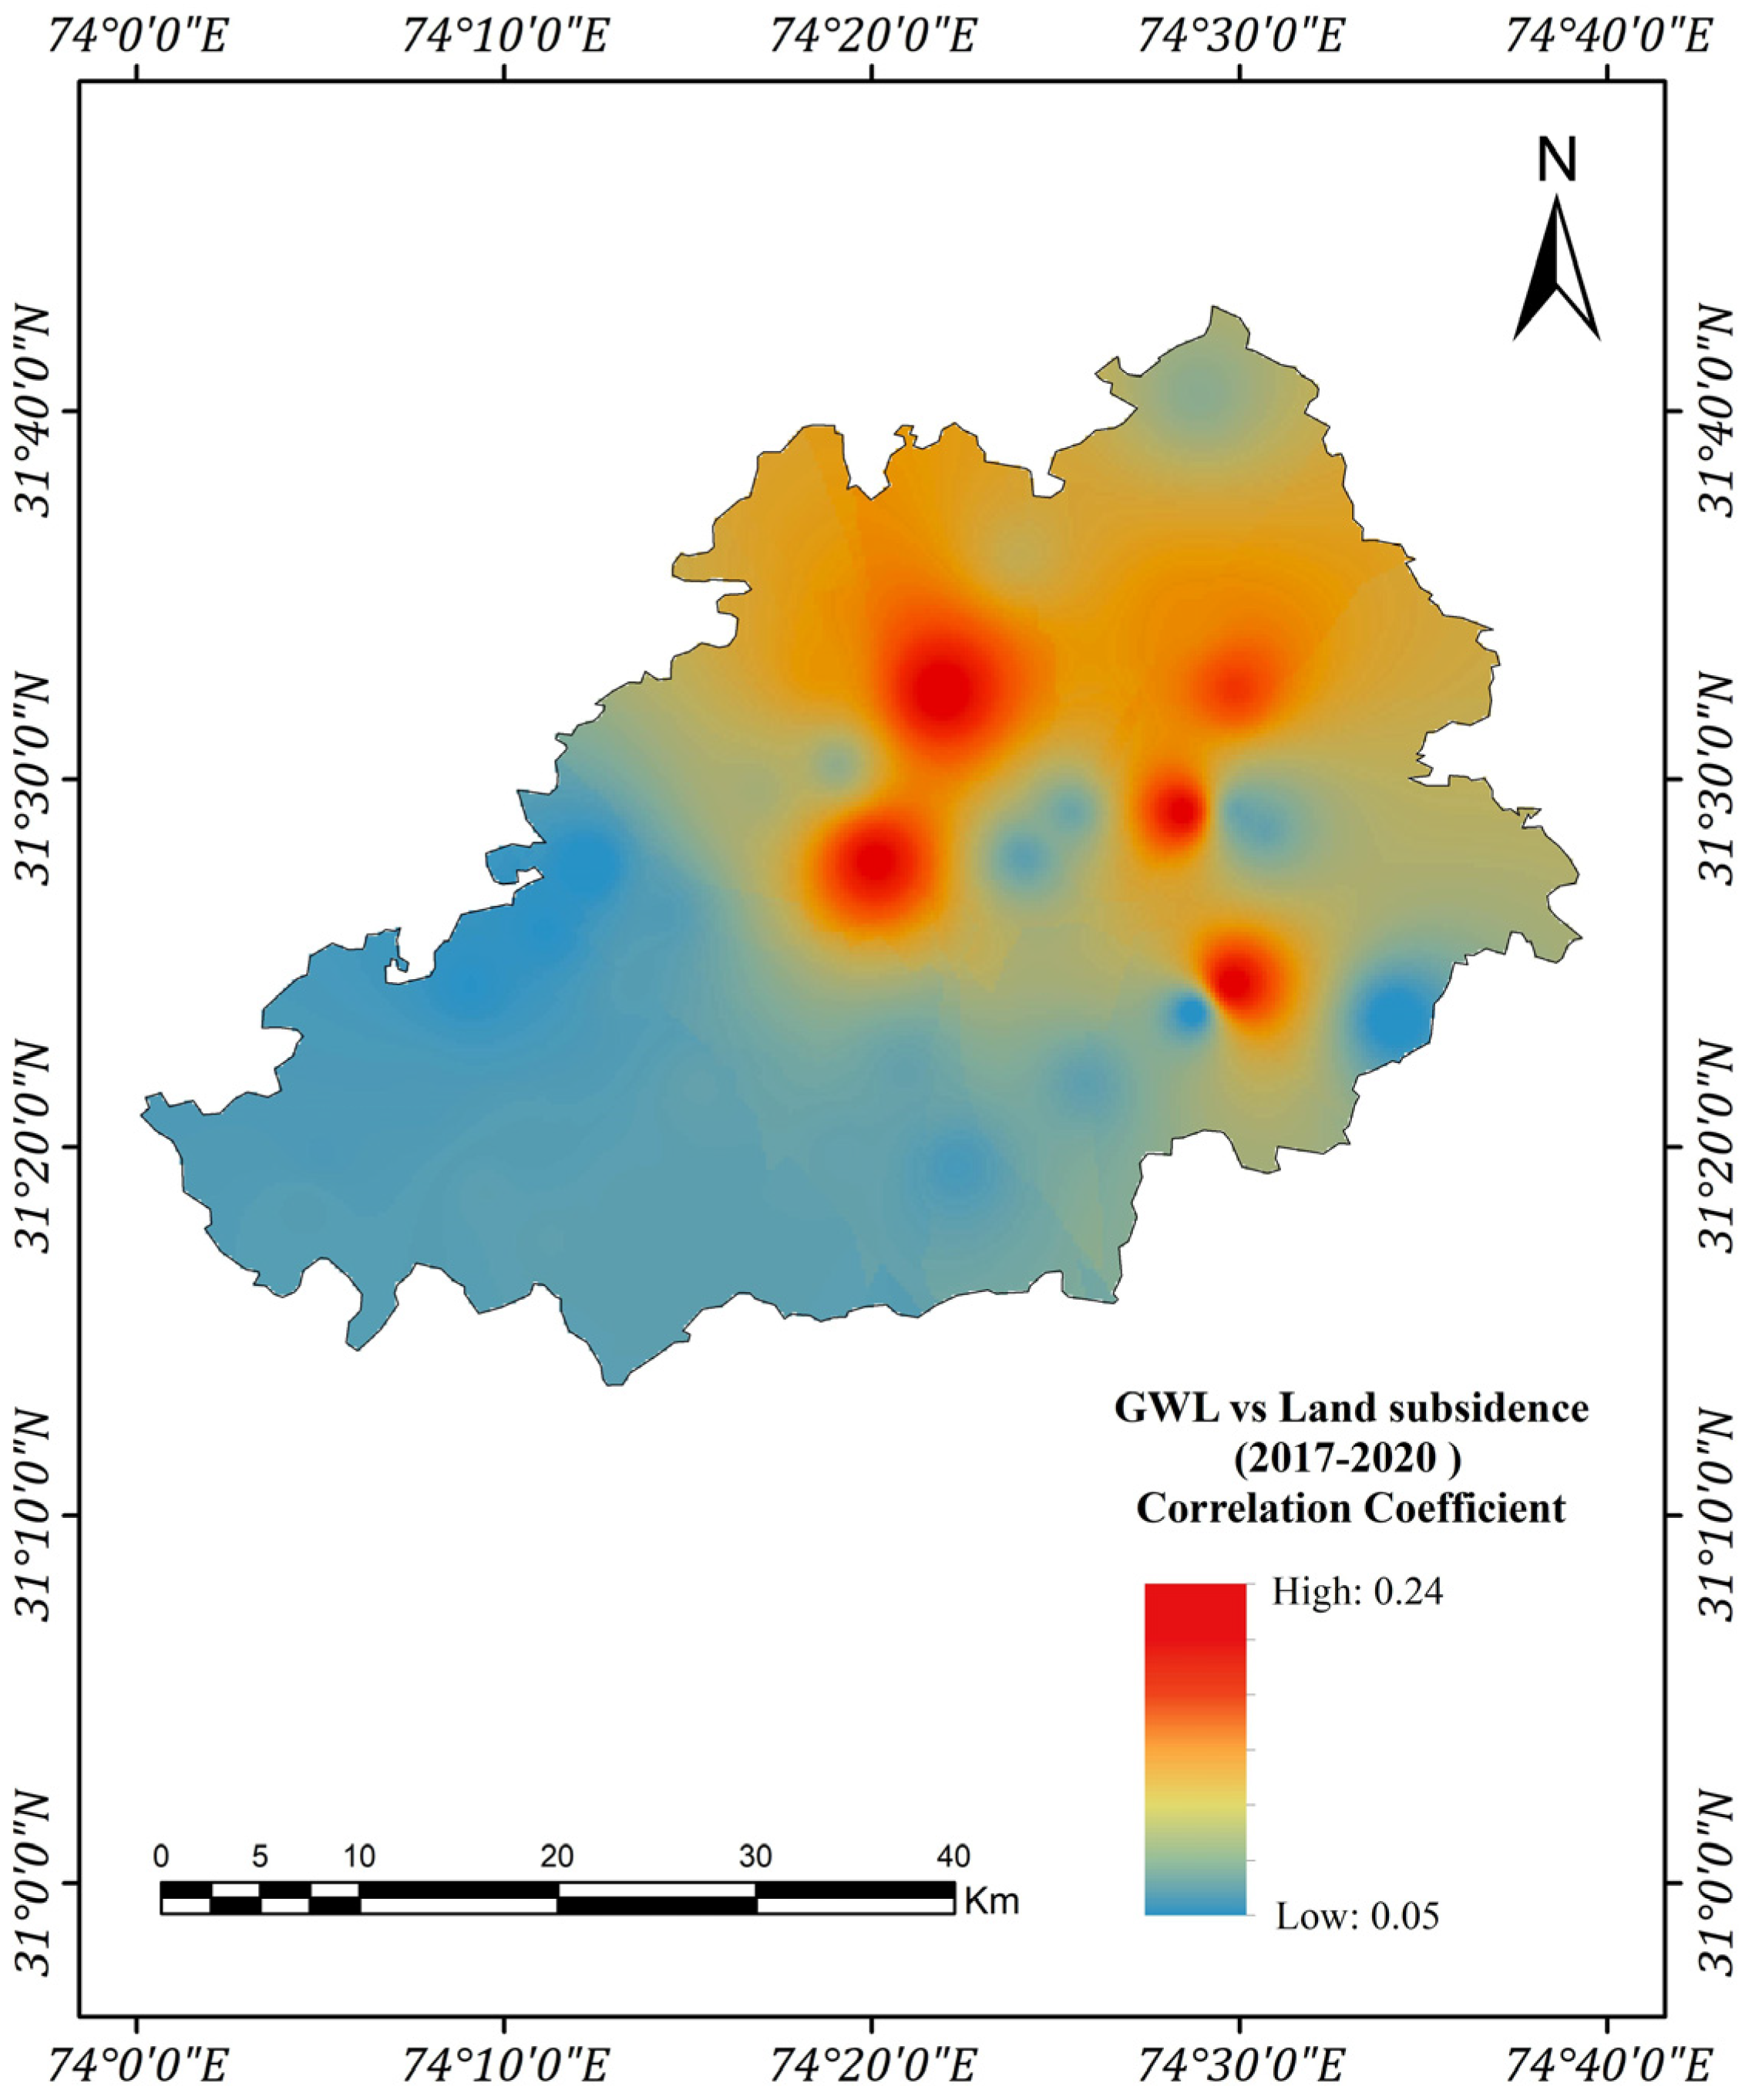
4.5. Correlation Analysis between Land Subsidence and GWL
5. Discussion
5.1. The Relationship between Groundwater and Land Subsidence
5.2. Main Contribution of This Study
5.3. Uncertainties and Limitations
6. Conclusions
Author Contributions
Funding
Data Availability Statement
Conflicts of Interest
References
- Singh, R.; Kumar, A.; Chakarvarti, S.K. Remote Sensing and GIS Approach for Groundwater Potential Mapping in Mewat District, Haryana, India. Int. J. Innov. Res. Adv. Eng. 2014, 1, 106–109. [Google Scholar]
- Panwar, S.; Chakrapani, G.J. Climate change and its influence on groundwater resources. Curr. Sci. 2013, 105, 37–46. [Google Scholar]
- Van Ty, T.; Minh, H.V.T.; Avtar, R.; Kumar, P.; Van Hiep, H.; Kurasaki, M. Spatiotemporal variations in groundwater levels and the impact on land subsidence in CanTho, Vietnam. Groundw. Sustain. Dev. 2021, 15, 100680. [Google Scholar] [CrossRef]
- Sajjad, M.M.; Wang, J.; Abbas, H.; Ullah, I.; Khan, R.; Ali, F. Impact of Climate and Land-Use Change on Groundwater Resources, Study of Faisalabad District, Pakistan. Atmosphere 2022, 13, 1097. [Google Scholar] [CrossRef]
- Galloway, D.L.; Burbey, T.J. Review: Regional land subsidence accompanying groundwater extraction. Hydrogeol. J. 2011, 19, 1459–1486. [Google Scholar] [CrossRef]
- Gleeson, T.; Befus, K.M.; Jasechko, S.; Luijendijk, E.; Cardenas, M.B. The global volume and distribution of modern groundwater. Nat. Geosci. 2016, 9, 161–164. [Google Scholar] [CrossRef]
- Earman, S.; Dettinger, M. Potential impacts of climate change on groundwater resources—A global review. J. Water Clim. Chang. 2011, 2, 213–229. [Google Scholar] [CrossRef]
- Ye, Y. Marine Geo-Hazards in China; Elsevier: Amsterdam, The Netherlands, 2017. [Google Scholar]
- Guzy, A.; Malinowska, A.A. State of the art and recent advancements in the modelling of land subsidence induced by groundwater withdrawal. Water 2020, 12, 2051. [Google Scholar] [CrossRef]
- Tatas; Chu, H.J.; Burbey, T.J.; Lin, C.W. Mapping regional subsidence rate from electricity consumption-based groundwater extraction. J. Hydrol. Reg. Stud. 2023, 45, 101289. [Google Scholar] [CrossRef]
- Albano, M.; Polcari, M.; Bignami, C.; Moro, M.; Saroli, M.; Stramondo, S. An innovative procedure for monitoring the change in soil seismic response by InSAR data: Application to the Mexico City subsidence. Int. J. Appl. Earth Obs. Geoinf. 2016, 53, 146–158. [Google Scholar] [CrossRef]
- Gezgin, C. The influence of groundwater levels on land subsidence in Karaman (Turkey) using the PS-InSAR technique. Adv. Sp. Res. 2022, 70, 3568–3581. [Google Scholar] [CrossRef]
- Osmano, B.; Dixon, T.H.; Wdowinski, S.; Cabral-Cano, E.; Jiang, Y. Mexico City subsidence observed with persistent scatterer InSAR. Int. J. Appl. Earth Obs. Geoinf. 2011, 13, 1–12. [Google Scholar] [CrossRef]
- Qureshi, A.S. Groundwater Governance in Pakistan: From Colossal Development to Neglected Management. Water 2020, 12, 3017. [Google Scholar] [CrossRef]
- Goverment of Paksitan. National Water Policy; Ministry of Water Resources: Islamabad, Pakistan, 2018.
- Iqbal, J.; Su, C.; Rashid, A.; Yang, N.; Baloch, M.Y.J.; Talpur, S.A.; Ullah, Z.; Rahman, G.; Rahman, N.U.; Earjh, E.; et al. Hydrogeochemical Assessment of Groundwater and Suitability Analysis for Domestic and Agricultural Utility in Southern Punjab, Pakistan. Water 2021, 13, 3589. [Google Scholar] [CrossRef]
- Tosi, L.; Teatini, P.; Carbognin, L.; Brancolini, G. Using high resolution data to reveal depth-dependent mechanisms that drive land subsidence: The Venice coast, Italy. Tectonophysics 2009, 474, 271–284. [Google Scholar] [CrossRef]
- Ha, D.; Zheng, G.; Loáiciga, H.A.; Guo, W.; Zhou, H.; Chai, J. Long-term groundwater level changes and land subsidence in Tianjin, China. Acta Geotech. 2021, 16, 1303–1314. [Google Scholar] [CrossRef]
- Kanwal, S.; Gabriel, H.F.; Mahmood, K.; Ali, R.; Haidar, A.; Tehseen, T. Lahore’s Groundwater Depletion—A Review. Univ. Eng. Technol. Taxila Tech. J. 2015, 20, 26–38. [Google Scholar]
- Chen, B.; Gong, H.; Li, X.; Lei, K.; Gao, M.; Zhou, C.; Ke, Y. Spatial–temporal evolution patterns of land subsidence with different situation of space utilization. Nat. Hazards 2015, 77, 1765–1783. [Google Scholar] [CrossRef]
- Burgmann, R.; Rosen, P.A.; Fielding, E.J. Synthetic aperture radar interferometry to measure earth’s surface topography and its deformation. Annu. Rev. Earth Planet Sci. 2000, 28, 169–209. [Google Scholar] [CrossRef]
- Bassols, J.B.I.; Declercq, P.Y.; Vàzquez-Suñé, E.; Gerard, P. PS-InSAR data, key to understanding and quantifying the hydromechanical processes underlying the compaction of aquifer systems. Case of West- and East-Flanders, Belgium. J. Hydrol. 2023, 624, 129980. [Google Scholar] [CrossRef]
- Manconi, A.; Kourkouli, P.; Caduff, R.; Strozzi, T.; Loew, S. Monitoring Surface Deformation over a Failing Rock Slope with the ESA Sentinels: Insights from Moosfluh Instability, Swiss Alps. Remote Sens. 2018, 10, 672. [Google Scholar] [CrossRef]
- Galve, J.P.; Castañeda, C.; Gutiérrez, F.; Herrera, G. Assessing sinkhole activity in the Ebro Valley mantled evaporite karst using advanced DInSAR. Geomorphology 2015, 229, 30–44. Available online: https://www.academia.edu/11513654/Assessing_sinkhole_activity_in_the_Ebro_Valley_mantled_evaporite_karst_using_advanced_DInSAR (accessed on 19 May 2023). [CrossRef]
- Khan, R.; Li, H.; Basir, M.; Chen, Y.L.; Sajjad, M.M.; Haq, I.U.; Ullah, B.; Arif, M.; Hassan, W. Monitoring land use land cover changes and its impacts on land surface temperature over Mardan and Charsadda Districts, Khyber Pakhtunkhwa (KP), Pakistan. Environ. Monit. Assess. 2022, 194, 409. [Google Scholar] [CrossRef] [PubMed]
- Hussain, M.A.; Chen, Z.; Zheng, Y.; Shoaib, M.; Ma, J.; Ahmad, I.; Asghar, A.; Khan, J. PS-InSAR Based Monitoring of Land Subsidence by Groundwater Extraction for Lahore Metropolitan City, Pakistan. Remote Sens. 2022, 14, 3950. [Google Scholar] [CrossRef]
- Rana, I.A.; Bhatti, S.S. Lahore, Pakistan—Urbanization challenges and opportunities. Cities 2018, 72, 348–355. [Google Scholar] [CrossRef]
- Kanwal, S.; Ali, S.R. Lahore’s Groundwater Depletion—A Review of the Aquifer Susceptibility to Degradation and its Consequences Climate Change Impacts View project Study of Ground Displacement, Coastal Erosion and Sea Level Rise along Karachi Coast, Pakistan View project. Univ. Eng. Technol. Taxila Tech. J. 2015, 20, 26. Available online: https://www.researchgate.net/publication/274433847 (accessed on 19 May 2023).
- Asian Development Bank. Initial Environmental Examination Prepared by the Lahore Electric Supply Company for the Asian Development Bank. I Draft Initial Environmental Examination (IEE) Report Islamic Republic of Pakistan: Power Distribution Enhancement Investment Program (Multi-); Asian Development Bank: Mandaluyong, Philippines, 2012. [Google Scholar]
- Xia, J.; Wu, X.; Zhan, C.; Qiao, Y.; Hong, S.; Yang, P.; Zou, L. Evaluating the dynamics of groundwater depletion for an arid land in the Tarim Basin, China. Water 2019, 11, 186. [Google Scholar] [CrossRef]
- Bhatti, S.A. Analysis of Aquifer Characteristics and Probable Lowering of Water Levels in Bari Doab; Wasid Publication: Hauppauge, NY, USA, 1969; Volume 63. [Google Scholar]
- Akhtar, M.M.; Mohamadi, B.; Ehsan, M. Analysis of geological structure and anthropological factors affecting arsenic distribution in the Lahore aquifer Sustainable Water Sources Management View project Seismology View project. Artic. Hydrogeol. J. 2016, 24, 1891–1904. [Google Scholar] [CrossRef]
- Basharat, M. Groundwater Environment in Lahore, Pakistan. In Groundwater Environment in Asian Cities Concepts, Methods and Case Studies; Butterworth-Heinemann: Oxford, UK, 2016; pp. 147–184. [Google Scholar] [CrossRef]
- Naeem, M.; Khan, K.; Rehman, S.; Iqbal, J. Environmental Assessment of Ground Water Quality of Lahore Area, Punjab, Pakistan. J. Appl. Sci. 2007, 7, 41–46. [Google Scholar] [CrossRef]
- Ng, A.H.-M.; Wang, H.; Dai, Y.; Pagli, C.; Chen, W.; Ge, L.; Du, Z.; Zhang, K. InSAR reveals land deformation at Guangzhou and Foshan, China between 2011 and 2017 with COSMO-SkyMed data. Remote Sens. 2018, 10, 813. [Google Scholar] [CrossRef]
- Zhou, C.; Gong, H.; Chen, B.; Li, J.; Gao, M.; Zhu, F.; Chen, W.; Liang, Y. InSAR time-series analysis of land subsidence under different land use types in the eastern Beijing plain, China. Remote Sens. 2017, 9, 380. [Google Scholar] [CrossRef]
- Wang, H.; Feng, G.; Xu, B.; Yu, Y.; Li, Z.; Du, Y.; Zhu, J. Deriving spatio-temporal development of ground subsidence due to subway construction and operation in Delta regions with PS-InSAR data: A case study in Guangzhou, China. Remote Sens. 2017, 9, 1004. [Google Scholar] [CrossRef]
- Chen, Y.; Tan, K.; Yan, S.; Zhang, K.; Liu, X.; Li, H.; Sun, Y. Monitoring Land Surface Displacement over Xuzhou (China) in 2015–2018 through PCA-Based Correction Applied to SAR Interferometry. Remote Sens. 2019, 11, 1494. [Google Scholar] [CrossRef]
- Stramondo, S.; Bozzano, F.; Marra, F.; Wegmuller, U.; Cinti, F.R.; Moro, M.; Saroli, M. Subsidence induced by urbanisation in the city of Rome detected by advanced InSAR technique and geotechnical investigations. Remote Sens. Environ. 2008, 112, 3160–3172. [Google Scholar] [CrossRef]
- Fan, H.; Gao, X.; Yang, J.; Deng, K.; Yu, Y. Monitoring mining subsidence using a combination of phase-stacking and offset-tracking methods. Remote Sens. 2015, 7, 9166–9183. [Google Scholar] [CrossRef]
- Chen, Y.; Remy, D.; Froger, J.-L.; Peltier, A.; Villeneuve, N.; Darrozes, J.; Perfettini, H.; Bonvalot, S. Long-term ground displacement observations using InSAR and GNSS at Piton de la Fournaise volcano between 2009 and 2014. Remote Sens. Environ. 2017, 194, 230–247. [Google Scholar] [CrossRef]
- Chaussard, E.; Wdowinski, S.; Cabral-Cano, E.; Amelung, F. Land subsidence in central Mexico detected by ALOS InSAR time-series. Remote Sens. Environ. 2014, 140, 94–106. [Google Scholar] [CrossRef]
- Gao, M.; Gong, H.; Chen, B.; Zhou, C.; Chen, W.; Liang, Y.; Shi, M.; Si, Y. InSAR time-series investigation of long-term ground displacement at Beijing Capital International Airport, China. Tectonophysics 2016, 691, 271–281. [Google Scholar] [CrossRef]
- Thapa, S.; Chatterjee, R.S.; Singh, K.B.; Kumar, D. Land Subsidence Monitoring Using PS-InSAR Technique for L-band SAR Data. Int. Arch. Photogramm. Remote Sens. Spat. Inf. Sci. 2016, XLI-B7, 995–997. [Google Scholar] [CrossRef]
- Hussain, S.; Hongxing, S.; Ali, M.; Sajjad, M.M.; Ali, M.; Afzal, Z.; Ali, S. Optimized landslide susceptibility mapping and modelling using PS-InSAR technique: A case study of Chitral valley, Northern Pakistan. Geocarto Int. 2022, 37, 5227–5248. [Google Scholar] [CrossRef]
- Hu, J.; Li, Z.W.; Ding, X.L.; Zhu, J.J.; Zhang, L.; Sun, Q. Resolving three-dimensional surface displacements from InSAR measurements: A review. Earth-Sci. Rev. 2014, 133, 1–17. [Google Scholar] [CrossRef]
- Zou, W.; Li, Z.; Ding, X. Effects of the intervals of tie points used in co-registration on the accuracy of digital elevation models generated by INSAR. Photogramm. Rec. 2006, 21, 232–254. [Google Scholar] [CrossRef]
- Zou, W.; Li, Z.; Ding, X. Determination of optimum window size for SAR image co-registration with decomposition of auto-correlation. Photogramm. Rec. 2007, 22, 238–256. [Google Scholar] [CrossRef]
- Fárová, K.; Jelének, J.; Kopačková-Strnadová, V.; Kycl, P. Comparing DInSAR and PSI techniques employed to Sentinel-1 data to monitor highway stability: A case study of a massive Dobkovičky landslide, Czech Republic. Remote Sens. 2019, 11, 2670. [Google Scholar] [CrossRef]
- Danklmayer, A.; Doring, B.R.J.; Schwerdt, M.; Chandra, M. Assessment of atmospheric propagation effects in SAR images. IEEE Trans. Geosci. Remote Sens. 2009, 47, 3507–3518. [Google Scholar] [CrossRef]
- Hu, Z.; Mallorquí, J.J. An accurate method to correct atmospheric phase delay for InSAR with the ERA5 global atmospheric model. Remote Sens. 2019, 11, 1969. [Google Scholar] [CrossRef]
- Kumar, V.; Remadevi. Kriging of Groundwater Levels—A Case Study. J. Spat. Hydrol. 2006, 6, 12. [Google Scholar]
- Varouchakis, E.A.; Hristopulos, D.T. Comparison of stochastic and deterministic methods for mapping groundwater level spatial variability in sparsely monitored basins. Environ. Monit. Assess. 2013, 185, 1–19. [Google Scholar] [CrossRef]
- Piri, I.; Khanamani, A.; Shojaei, S.; Fathizad, H. Determination of the best geostatistical method for climatic zoning in Iran. Appl. Ecol. Environ. Res. 2017, 15, 93–103. [Google Scholar] [CrossRef]
- Nistor, M.M.; Rahardjo, H.; Satyanaga, A.; Hao, K.Z.; Xiaosheng, Q.; Sham, A.W.L. Investigation of groundwater table distribution using borehole piezometer data interpolation: Case study of Singapore. Eng. Geol. 2020, 271, 105590. [Google Scholar] [CrossRef]
- Reuter, H.I.; Nelson, A.; Jarvis, A. An evaluation of void-filling interpolation methods for SRTM data. Int. J. Geogr. Inf. Sci. 2007, 21, 983–1008. [Google Scholar] [CrossRef]
- Omran, E.-S.E. Improving the Prediction Accuracy of Soil Mapping through Geostatistics. Int. J. Geosci. 2012, 3, 574–590. [Google Scholar] [CrossRef]
- Harris, I.; Osborn, T.J.; Jones, P.; Lister, D. Version 4 of the CRU TS monthly high-resolution gridded multivariate climate dataset. Sci. Data 2020, 7, 109. [Google Scholar] [CrossRef] [PubMed]
- Aslam, R.A.; Shrestha, S.; Usman, M.N.; Khan, S.N.; Ali, S.; Sharif, M.S.; Sarwar, M.W.; Saddique, N.; Sarwar, A.; Ali, M.U.; et al. Integrated SWAT-MODFLOW Modeling-Based Groundwater Adaptation Policy Guidelines for Lahore, Pakistan under Projected Climate Change, and Human Development Scenarios. Atmosphere 2022, 13, 2001. [Google Scholar] [CrossRef]
- Jalees, M.I.; Farooq, M.U.; Anis, M.; Hussain, G.; Iqbal, A.; Saleem, S. Hydrochemistry modelling: Evaluation of groundwater quality deterioration due to anthropogenic activities in Lahore, Pakistan. Environ. Dev. Sustain. 2021, 23, 3062–3076. [Google Scholar] [CrossRef]
- Mahmood, K.; Rana, A.D.; Tariq, S.; Kanwal, S.; Ali, R.; Haidar, A. Groundwater Levels Susceptibility To Degradation in Lahore Metropolitan. Depression 2000, 25, 123–126. Available online: https://www.researchgate.net/publication/257317564 (accessed on 1 June 2023).
- Gabriel, H.; Khan, S. Policy Options for Sustainable Urban Water Cycle Management for Lahore, Pakistan. 2006. Available online: https://publications.csiro.au/rpr/pub?list=BRO&pid=procite:bbc359ef-6f24-4a40-8423-283001e9761f (accessed on 1 June 2023).
- Basharat, M.; Rizvi, S.A. Groundwater Extraction and Waste Water Disposal Regulation. Is Lahore Aquifer at Stake with as Usualapproach; World Water Day; Pakistan Engineering Congress: Lahore, Pakistan, 2011. [Google Scholar]
- Blasco, J.M.D.; Foumelis, M.; Stewart, C.; Hooper, A. Measuring urban subsidence in the Rome Metropolitan Area (Italy) with Sentinel-1 SNAP-StaMPS Persistent Scatterer Interferometry. Remote Sens. 2019, 11, 129. [Google Scholar] [CrossRef]
- Wang, X.; Zhang, Q.; Zhao, C.; Qu, F.; Zhang, J. A Novel Method of Generating Deformation Time-Series Using Interferometric Synthetic Aperture Radar and Its Application in Mexico City. Remote Sens. 2018, 10, 1741. [Google Scholar] [CrossRef]
- Phien-wej, N.; Giao, P.H.; Nutalaya, P. Land subsidence in Bangkok, Thailand. Eng. Geol. 2006, 82, 187–201. [Google Scholar] [CrossRef]
- Amin, G.; Shahzad, M.I.; Jaweria, S.; Zia, I. Measuring land deformation in a mega city Karachi-Pakistan with sentinel SAR interferometry. Geocarto Int. 2022, 37, 4974–4993. [Google Scholar] [CrossRef]
- Liu, L.; Zhou, W.; Gutierrez, M. Mapping Tunneling-Induced Uneven Ground Subsidence Using Sentinel-1 SAR Interferometry: A Twin-Tunnel Case Study of Downtown Los Angeles, USA. Remote Sens. 2023, 15, 202. [Google Scholar] [CrossRef]
- Ahmad, A.; Sultan, M.; Falak, A. Urban subsidence monitoring by PSInSAR and its causes in Lahore, Pakistan. In Proceedings of the 2021 SAR Big Data Era, BIGSARDATA 2021—Proceedings, Nanjing, China, 22–24 September 2021. [Google Scholar] [CrossRef]
- Chaussard, E.; Havazli, E.; Fattahi, H.; Cabral-Cano, E.; Solano-Rojas, D. Over a Century of Sinking in Mexico City: No Hope for Significant Elevation and Storage Capacity Recovery. J. Geophys. Res. Solid Earth 2021, 126, e2020JB020648. [Google Scholar] [CrossRef]


Disclaimer/Publisher’s Note: The statements, opinions and data contained in all publications are solely those of the individual author(s) and contributor(s) and not of MDPI and/or the editor(s). MDPI and/or the editor(s) disclaim responsibility for any injury to people or property resulting from any ideas, methods, instructions or products referred to in the content. |
© 2023 by the authors. Licensee MDPI, Basel, Switzerland. This article is an open access article distributed under the terms and conditions of the Creative Commons Attribution (CC BY) license (https://creativecommons.org/licenses/by/4.0/).
Share and Cite
Sajjad, M.M.; Wang, J.; Afzal, Z.; Hussain, S.; Siddique, A.; Khan, R.; Ali, M.; Iqbal, J. Assessing the Impacts of Groundwater Depletion and Aquifer Degradation on Land Subsidence in Lahore, Pakistan: A PS-InSAR Approach for Sustainable Urban Development. Remote Sens. 2023, 15, 5418. https://doi.org/10.3390/rs15225418
Sajjad MM, Wang J, Afzal Z, Hussain S, Siddique A, Khan R, Ali M, Iqbal J. Assessing the Impacts of Groundwater Depletion and Aquifer Degradation on Land Subsidence in Lahore, Pakistan: A PS-InSAR Approach for Sustainable Urban Development. Remote Sensing. 2023; 15(22):5418. https://doi.org/10.3390/rs15225418
Chicago/Turabian StyleSajjad, Meer Muhammad, Juanle Wang, Zeeshan Afzal, Sajid Hussain, Aboubakar Siddique, Rehan Khan, Muhammad Ali, and Javed Iqbal. 2023. "Assessing the Impacts of Groundwater Depletion and Aquifer Degradation on Land Subsidence in Lahore, Pakistan: A PS-InSAR Approach for Sustainable Urban Development" Remote Sensing 15, no. 22: 5418. https://doi.org/10.3390/rs15225418