
Altered Trends in Light Use Efficiency of Grassland Ecosystem in Northern China

College of Grassland Agriculture, Northwest A&F University, Xianyang 712100, China
*
Author to whom correspondence should be addressed.
†
These authors contributed equally to this work.
Remote Sens. 2023, 15(22), 5275; https://doi.org/10.3390/rs15225275
Submission received: 12 July 2023
/
Revised: 4 November 2023
/
Accepted: 6 November 2023
/
Published: 7 November 2023
Abstract
:Light use efficiency (LUE) is a crucial indicator used to reflect the ability of terrestrial ecosystems to transform light energy. Understanding the long-term trends in LUE and its influencing factors are essential for determining the future carbon sink and carbon sequestration potential of terrestrial ecosystems. However, the long-term interannual variability of LUE in grasslands in northern China at the ecosystem scale is poorly understood due to the limitations of the year length and the coverage of the site data. In this study, we assessed the long-term LUE trends in the grasslands of northern China from 1982 to 2018 and then revealed the relationships between interannual variability in LUE and climate factors. Our study showed a substantial rising trend for LUE from 1982 to 2018 in the grasslands of northern China (3.42 × 10⁻³ g C/MJ/yr). Regarding the different grassland types, alpine meadow had the highest growth rate (4.85 × 10⁻³ g C/MJ/yr), while temperate steppe had the lowest growth rate (1.58 × 10⁻³ g C/MJ/yr). The climate factors driving LUE dynamics were spatially heterogeneous in grasslands. Increasing precipitation accelerated the interannual growth rate of LUE in temperate steppe, and increasing temperature accelerated the interannual growth rate of LUE in other types. In addition, the temporal dynamic of LUE showed different trends in relation to time scales, and the growth trend slowed down after 1998. Our results should be considered in developing future grassland management measures and predicting carbon cycle–climate interactions.
1. Introduction
Grasslands play a crucial role in food security and ecological functions [1]. China has an abundance of grassland resources, accounting for 41% of its terrestrial surface and covering about 400 million ha [2]. Climate changes and a series of ecological protection and restoration projects have considerably increased the carbon sink function of grassland ecosystems in China [3]. At present, grassland ecosystems play a large part in the terrestrial carbon sink function [4]. The productivity of grassland ecosystems will undergo drastic changes as global drought expands and intensifies [5,6]. There is great uncertainty about whether the carbon sink capacity of vegetation will continue to rise in the future. Light use efficiency (LUE) is the underlying basis for estimating carbon sink capacity in many existing up-scaled models [7,8]. LUE can be used to describe changes in the function traits and physiological processes of plants, and reflect the carbon sink capacity of grasslands [8,9,10]. Therefore, revealing the interannual dynamic of LUE and its climatic drivers is critical for accurately evaluating and predicting the future carbon sink capacity and potential of grassland ecosystems.
LUE is an attribute parameter that measures the ability of vegetation to transform organic matter using radiant energy, CO2, water, and soil nutrients [11]. Long-term LUE patterns may reflect the process of ecosystem function in response to climate change [11,12]. The LUE calculation methods are often diverse [13]. LUE is generally defined as the ratio of carbon flux (such as Gross Primary Production (GPP) and Net Primary Production (NPP), etc.) to light energy (such as Incoming Shortwave Radiation (SW), Photosynthetically Active Radiation (PAR), Absorbed Photosynthetically Active Radiation (APAR), etc.). LUE can indicate the ability of plants to use PAR absorbed by vegetation during photosynthesis and define the efficiency of carbon sequestration at the ecosystem level. As a key parameter regulating the absorption of carbon from the atmosphere into the biosphere [9,12], revealing the interannual dynamics of LUE and its driving factors is crucial [8,14]. Previous studies on LUE concentrated on the estimation model of productivity at the leaf and canopy scales, based on a limited amount of site data. Nevertheless, in these studies, little attention is devoted to the interannual variability and long-term trends of LUE.
On different time scales, LUE has exhibited diverse trends (significant increase, significant decrease, and no significance) in various terrestrial ecosystems around the world. For instance, the LUE trend in the central African forest varied between 2% and 5% every decade from 1982 to 2010, whereas the LUE trend in the African northern savannahs stayed consistent [15]. LUE demonstrated significant year-to-year variation in a peatland pasture in Canada during 2014–2015 [16]. LUE increased and decreased in the opposite direction on two different grassland types in Inner Mongolia, China [17]. Temperature, precipitation, radiation, soil moisture, and nutrients are key factors limiting the photosynthetic processes of grassland ecosystems in different regions [14,15,17,18,19,20]. According to global studies, temperature and light are the major limits to LUE in alpine regions, whereas water stress is the main factor affecting the interannual dynamics of LUE in arid and semi-arid regions. In the Tibetan Plateau, Inner Mongolia, and Loess Plateau grasslands in northern China, temperature, light conditions, precipitation, and soil nutrients are limiting variables for plant growth [21,22,23,24]. However, while most studies on spatial and temporal variation in LUE have focused on seasonal variation at the station scale [8,17,25], there have been relatively few studies on long-term and large-scale LUE and its influencing factors.
Our study sought to develop a dataset of LUE for grasslands in northern China from 1982 to 2018 based on Global Land Surface Satellite (GLASS) products GPP data, GLASS Fraction of Photosynthetically Active Radiation (FPAR) data, and Climate Research Unit (CRU) SW data. The study’s main objectives were to (1) clarify the interannual dynamics of LUE in grasslands and different grassland types in northern China; (2) reveal the contributions of different climate factors to the interannual LUE variability in grasslands in northern China; and (3) clarify the main driving factors of the interannual dynamics of LUE in grasslands in northern China.
2. Materials and Methods
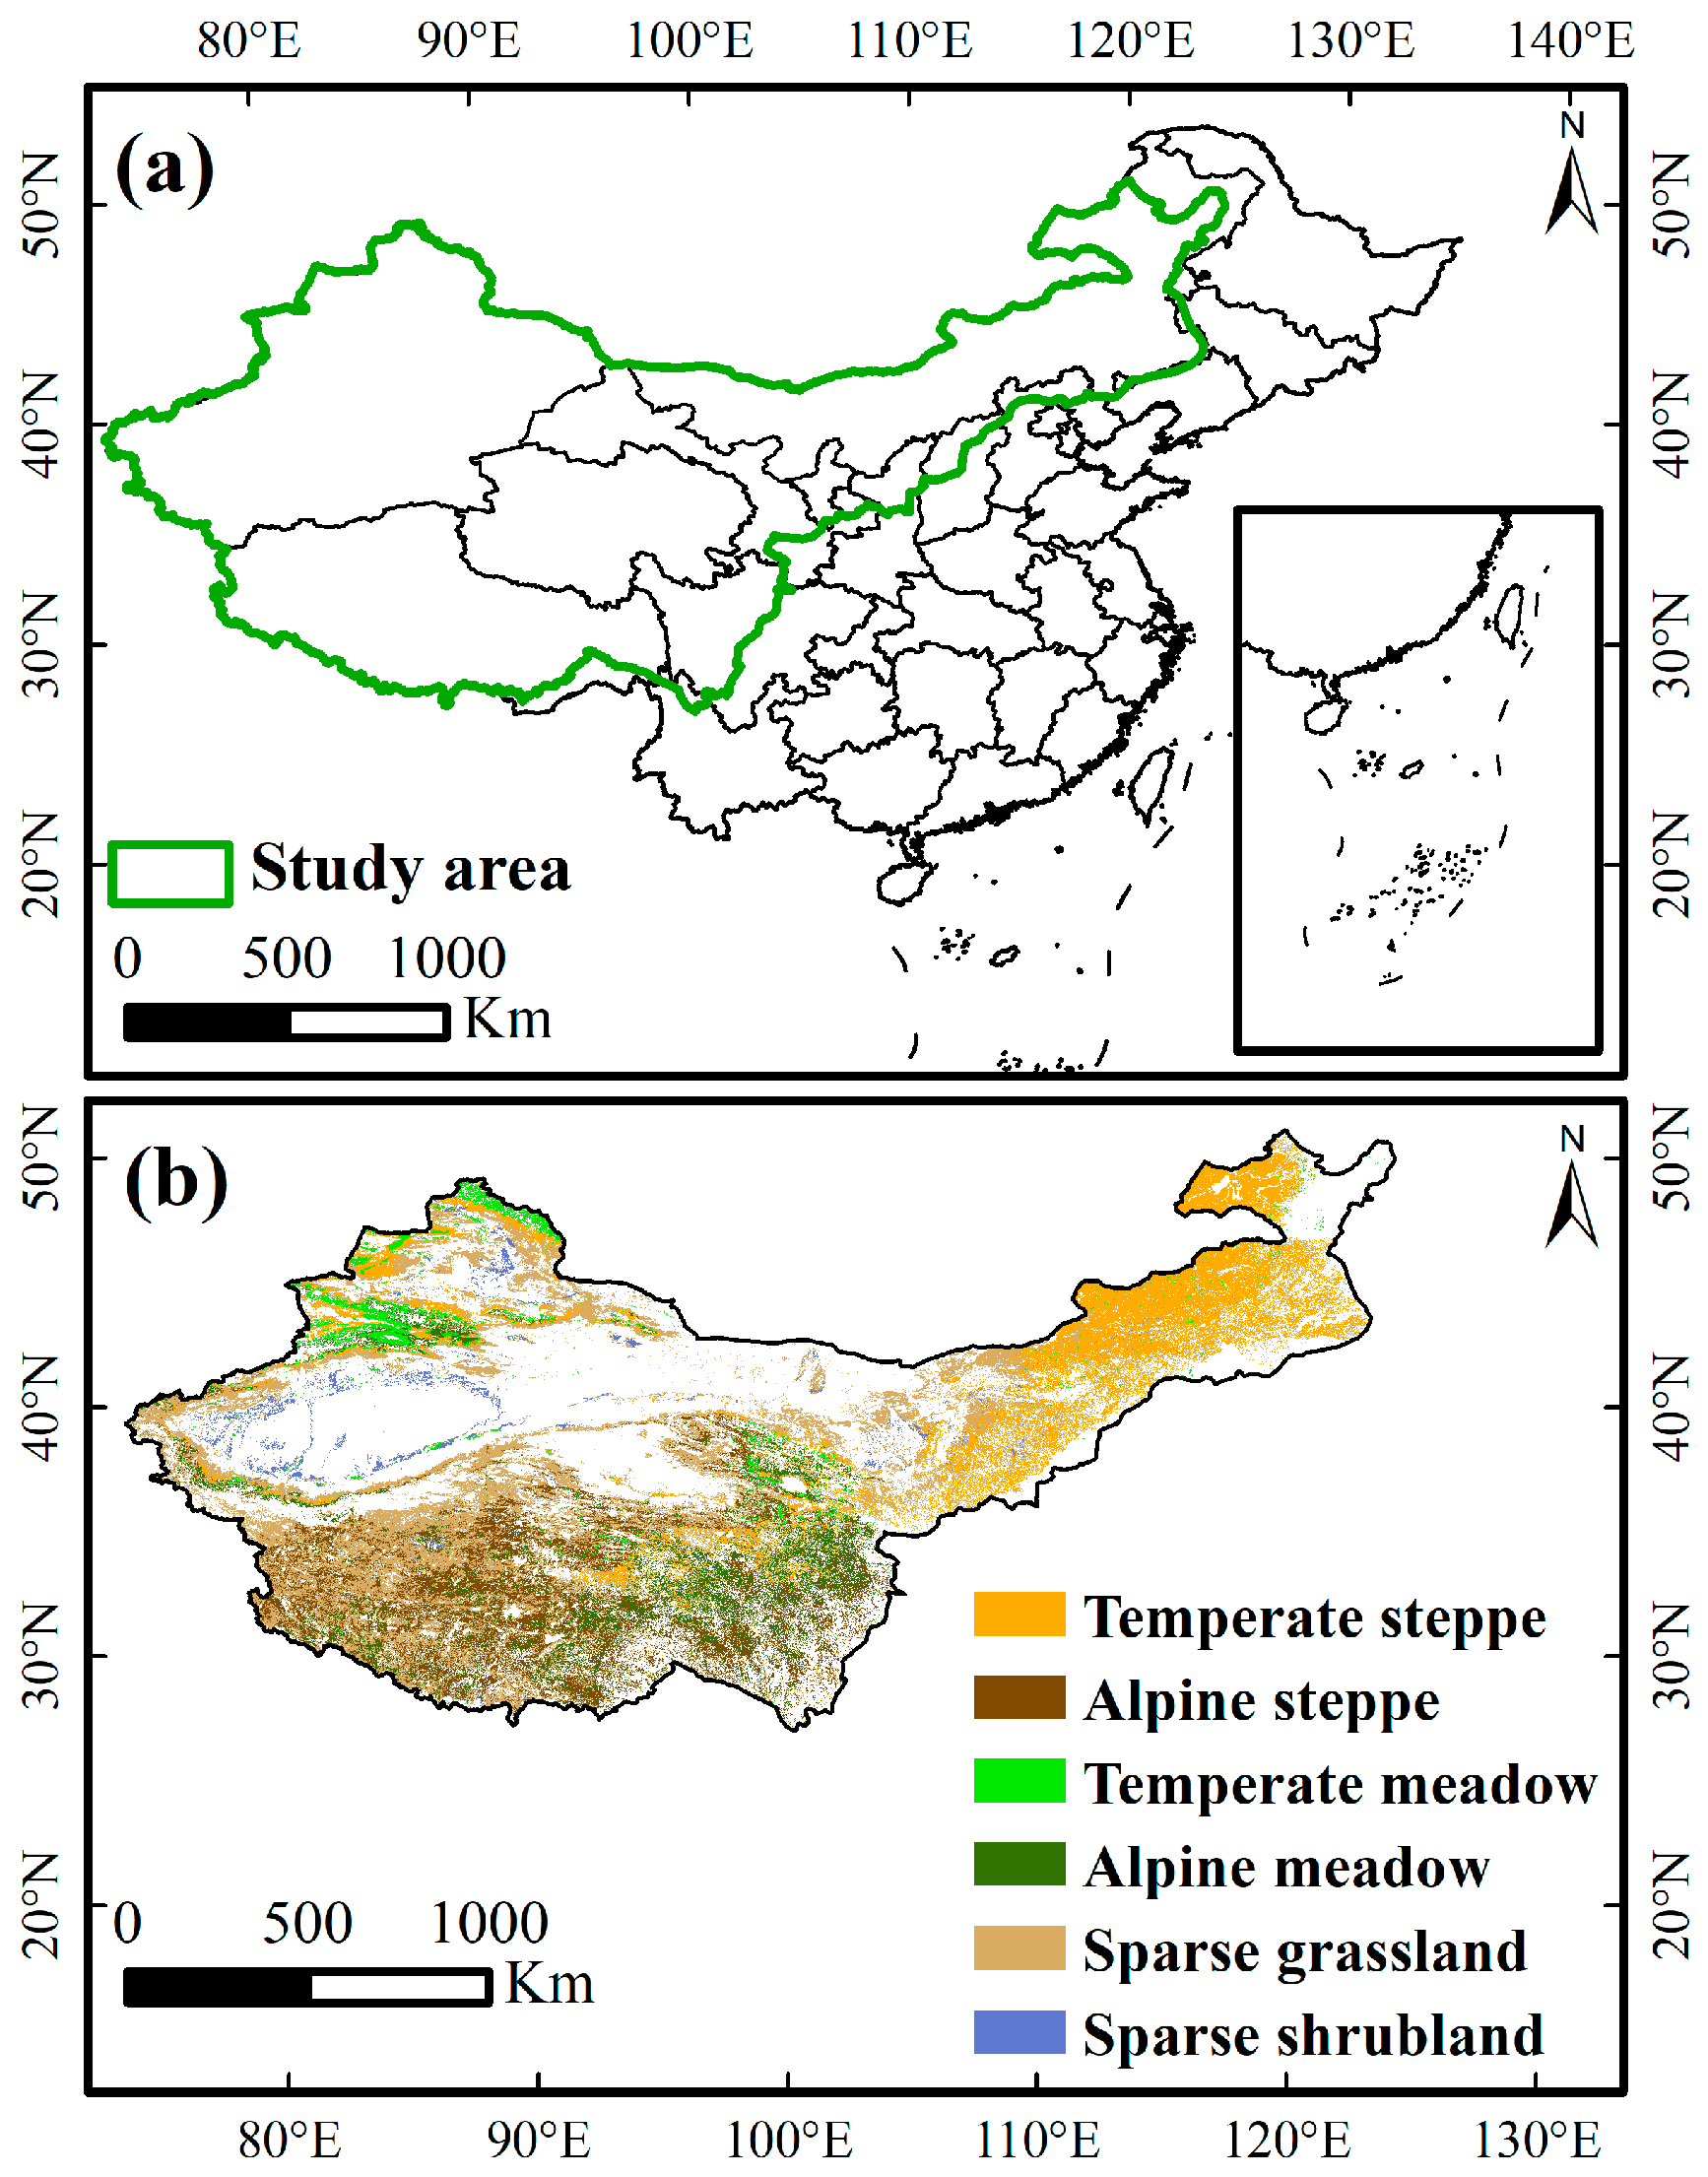
2.1. Study Area
Grasslands span a longitudinal range of 73.48°E to 124.34°E and a latitudinal range of 26.99°N to 51.10°N in northern China, covering alpine meadow (AM), alpine steppe (AS), temperate meadow (TM), temperate steppe (TS), sparse grassland (SG), and sparse shrubland (SS) (Figure 1). The mean annual temperature (MAT) ranges from −3.1 to 8.9 °C, while the mean annual precipitation (MAP) ranges between 62.7 mm and 694 mm [26,27]. AM and AS are most common in the Tibetan Plateau at altitudes above 3200 m. The dominant species in AM are primarily neutral perennials such as Kobresia pygmaea, Festuca ovina, and Deschampsia cespitosa, whereas AS is dominated by cold-resistant Stipa purpurea and Carex moorcroftii. TS is distributed throughout the Inner Mongolia Plateau, and the dominant species include Stipa baicalensis, Leymus chinensi and Cleistogenes squarrosa. TM is concentrated in the mountains of northern Xinjiang, where Agropyron cristatum, Artemisia frigida, and Bromus inermis grow. SG is the transition zone from grassland to desert, found in the arid zone between the TS and the Qinghai–Tibet Plateau (QTP). Stipa tianschanica, Caragana stenophylla, and Artemisia frigida are among the most prominent species [2,28].
2.2. Datasets
2.2.1. GLASS GPP and FPAR
GPP is defined as the total amount of CO2 fixed by vegetation through photosynthesis over a period, which determines the initial chemical energy and the total amounts of chemicals entering the terrestrial ecosystem. As a crucial parameter of vegetation photosynthesis, it plays a vital role in maintaining carbon balance, reducing CO2 concentration, and mitigating global climate change [29]. The GPP and FPAR data are derived from GLASS products, and they are available online at http://www.glass.umd.edu/, accessed on 5 December 2021. GLASS GPP used the latest version of the Eddy Covariance–Light Use Efficiency model, which combines the effects of various environmental factors, including carbon dioxide, radiation components and vapor pressure deficit (VPD) [30,31,32]. In this study, yearly 0.05° GPP data based on Advanced Very-High-Resolution Radiometer (AVHRR) with a temporal resolution of 8 days, and a period of 1982–2018 were used. This approach has been proven to reveal spatial variation, interannual variability, and long-term trends [33].
The FPAR parameter describes the proportion of sunlight absorbed by vegetation during the canopy’s radiative transmission process. GLASS FPAR is a 0.05° global-scale data set with a temporal resolution of 8 days and a period of 1982–2018. GLASS FPAR was calculated from GLASS Leaf Area Index (LAI) data, using a lookup table method to estimate a relationship model from LAI to FPAR [34], with a long-term series and high precision (RMSE = 0.13, R2 = 0.80) [35].
2.2.2. Meteorological Data
Temperature, precipitation, actual vapor pressure, and solar radiation (Incoming Shortwave Radiation) statistics are available from 1982 to 2018. All meteorological data are available online at https://vesg.ipsl.upmc.fr/thredds/catalog/work/p529viov/cruncep/V9_1901_2020/catalog.html, accessed on 1 December 2021.
2.3. Data Analysis
2.3.1. The Calculation of LUE
We calculated LUE via the ratio of AGPP to APAR in this study [12,14]:
where AGPP is Annual Gross Primary Production (g C/m2), APAR is Absorbed Photosynthetically Active Radiation (MJ/m2), FPAR is Fraction of Photosynthetically Active Radiation, SW is Incoming Shortwave Radiation (MJ/m2). SW × 0.45 is a suitable substitute for PAR [12,37].
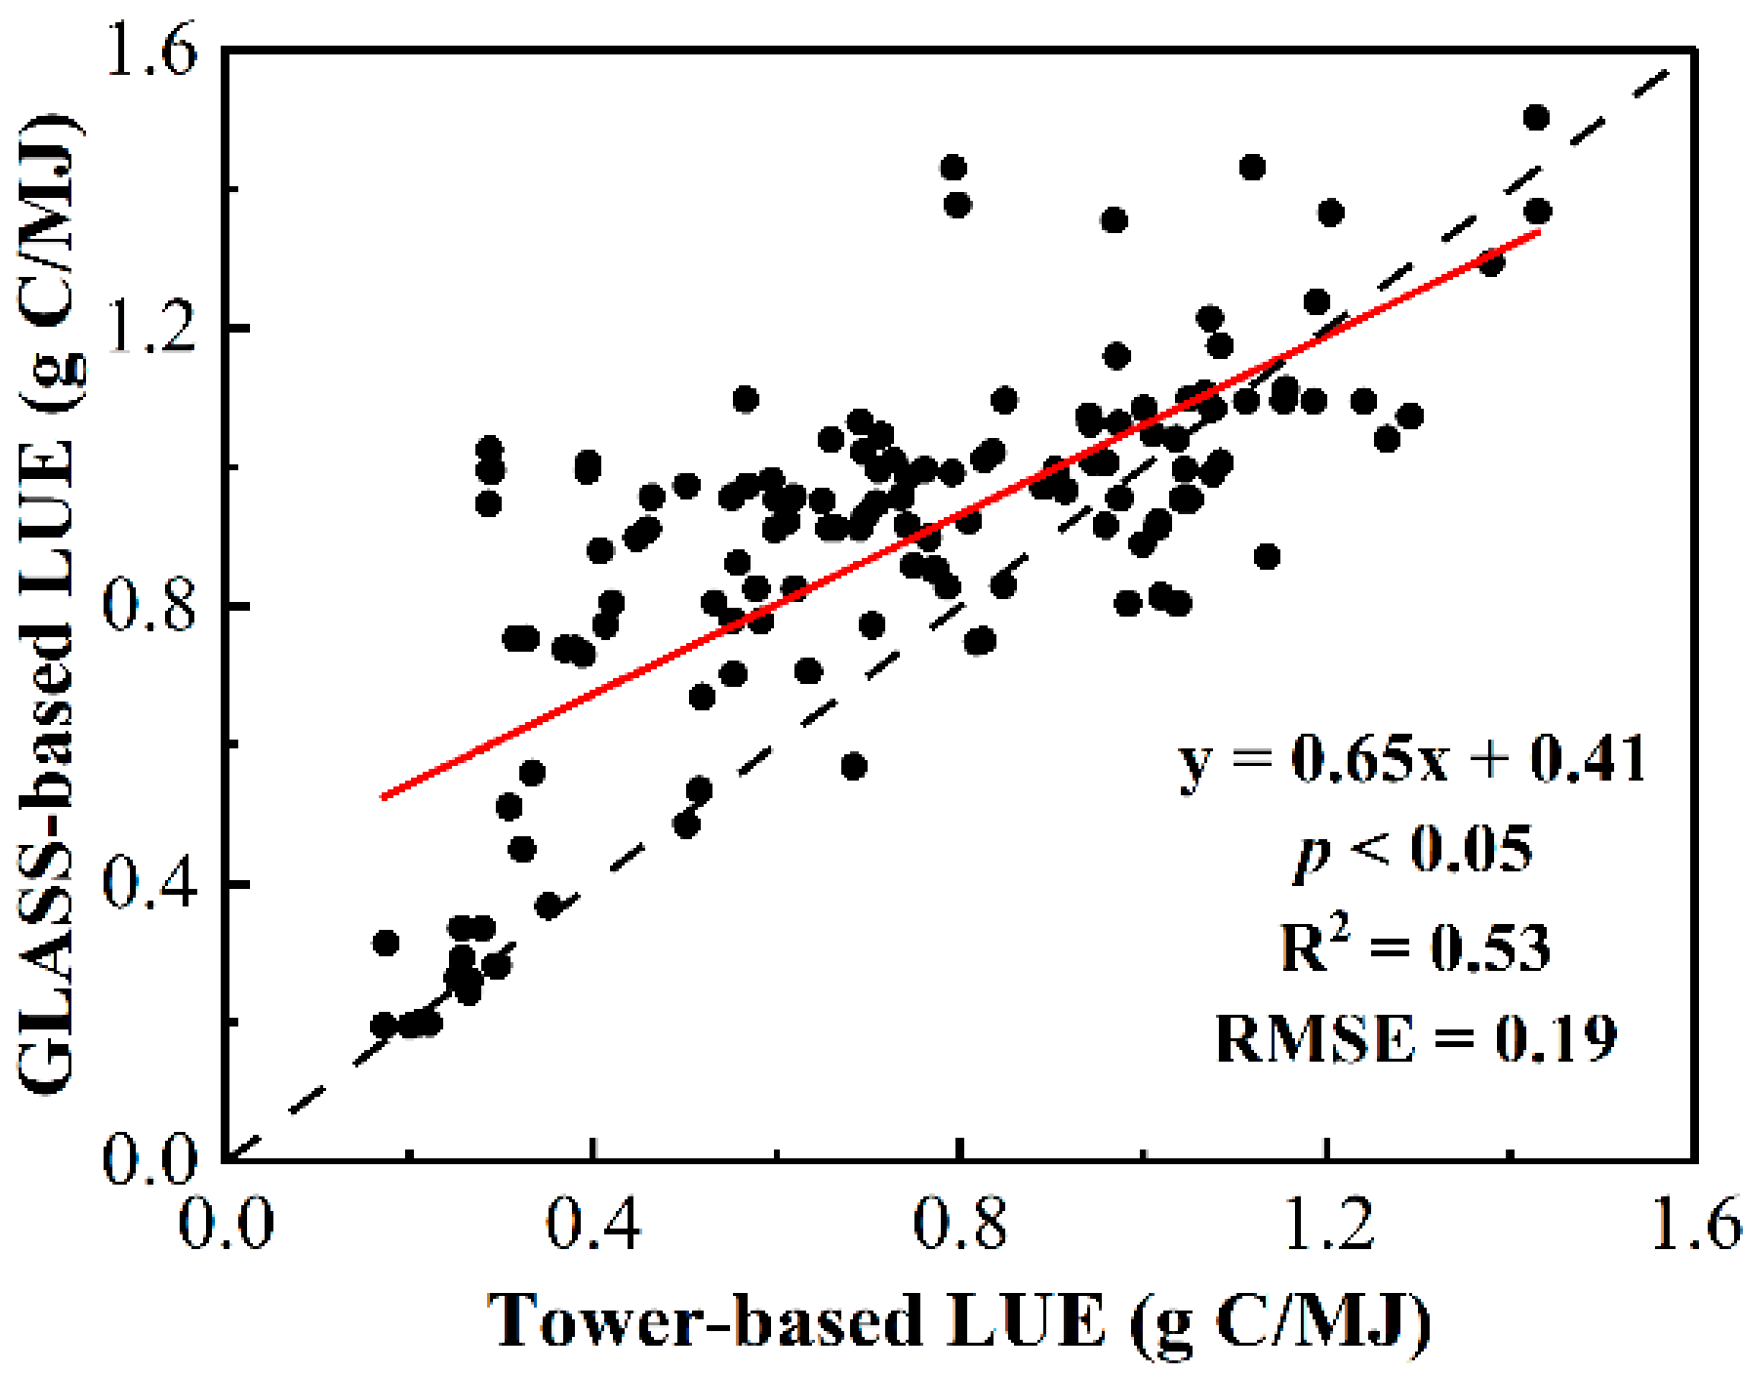
We estimated 136 tower-based LUE readings using tower-based AGPP, tower-based PAR and the GLASS FPAR. Tower-based AGPP and tower-based PAR data were acquired from Chen et al. [38] (http://www.cnern.org.cn, accessed on 1 December 2022). The LUE data set’s accuracy verification was verified through the linear fitting of GLASS-based LUE and tower-based LUE. RMSE (Root Mean Squared Error) and R2 (R-squared) are used as the accuracy evaluation indices. Figure S1 illustrates the linear relationship between the GLASS-based LUE and the tower-based LUE. The results show that the data were highly reliable (R2 = 0.53, RMSE = 0.19) (Figure 2).
2.3.2. Trend Analysis
In this study, the trends of LUE and climate factors from 1982 to 2018 are described by the slope of a simple linear regression model [39],
where Y is the time series of LUE (or climate factors), X is the time series, α is the intercept term, ε is the residual term, and β is the slope, which is calculated as:
where n is the gross length of the LUE (or climate factors) series, Yj denotes LUE (or climate factors) for the jth year, β > 0 signifies the LUE (or climate factors) series with an increasing trend on the examined grasslands, and β < 0 signifies those with a decreasing trend. The significance of β was determined using the t-statistic test with a significance level of 0.05.
We also used the Mann-Kendall test (a nonparametric trend test technique), which does not require a specific sample distribution and is free from the interference of outliers [40], to evaluate trends in annual average LUE at the pixel level during the period of 1982–2018. The Mann–Kendall trend test was performed using the function “zyp.trend.vector” with the Yue–Pilon prewhitening method provided by the R package “zyp” [40]. Trends with p < 0.05 are considered to be statistically significant in this study.
2.3.3. The Partial Correlation Analysis
In this study, partial correlation analysis was used to examine the relationships between annual LUE and four climate factors, including MAT, MAP, annual solar radiation, and VPD [39]. Using the first-order partial correlation coefficient as an example, the partial correlation coefficient was calculated as:
where is the partial correlation coefficient between Y and X under the premise of controlling the influence of Z. Similarly, and are the correlation coefficients between the two related variables indicated by the subscripts, and the calculation of the n-order partial correlation coefficient is done in a similar way. The significance of the partial correlation coefficient was determined using the t-statistic test with a significance level of 0.05.
3. Results
3.1. Interannual Dynamic Characteristics of LUE
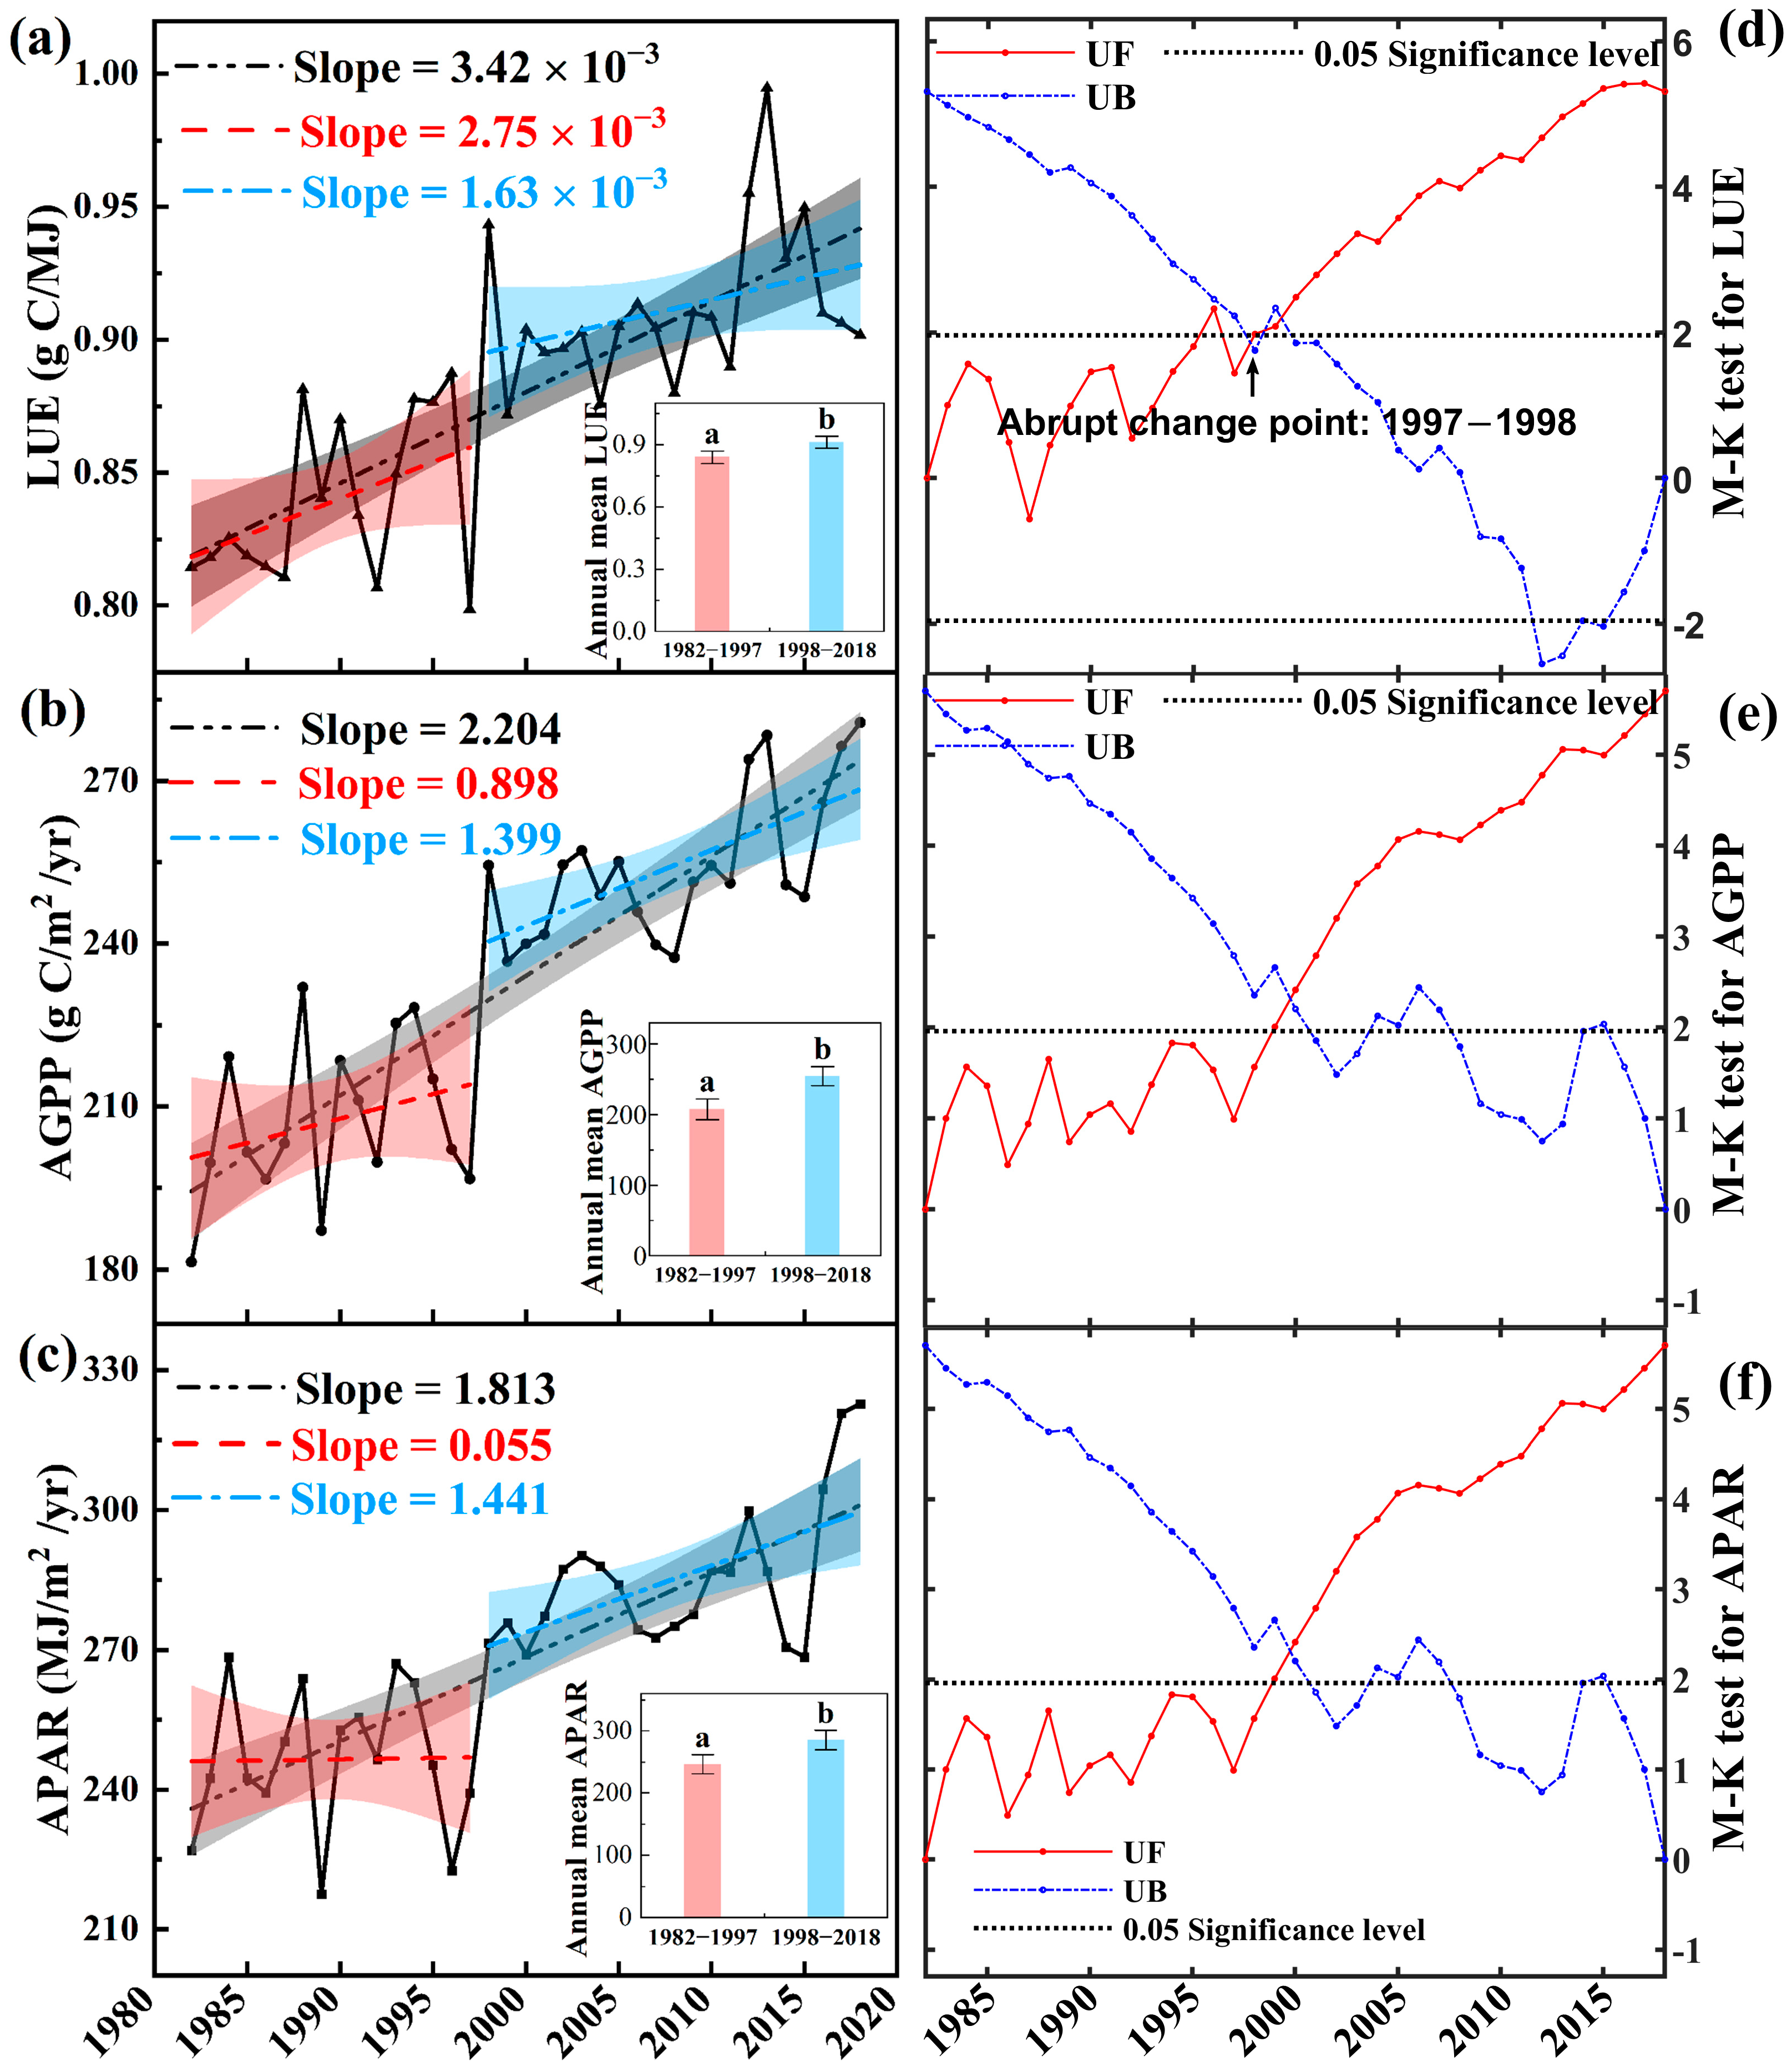
The interannual LUE variability in the grasslands in northern China increased (3.42 × 10⁻³ g C/MJ/yr) during 1982–2018, and the multi-year mean LUE was 0.88 ± 0.047 g C/MJ (Figure 3a). Around 1998, the LUE’s multi-year mean and trends altered. After 1998, the upward trend in LUE slowed and the mean LUE significantly increased (Figure 3a). The Mann–Kendall test was used to further determine the abrupt change point to verify the accuracy of the changes in LUE trends (Figure 3d). The results show that the period from 1997 to 1998 saw significant changes in LUE (Figure 3d). During 1982–1997, the mean LUE was 0.84 ± 0.030 g C/MJ, and the annual rate of increase in LUE was 2.75 × 10⁻³ g C/MJ/yr. From 1998 to 2018, the mean LUE was 0.91 ± 0.029 g C/MJ, and the yearly rate of increase in LUE was 1.63 × 10⁻³ g C/MJ/yr (Figure 3a).
In the past 40 years or so, the growth rate of AGPP has been greater than that of APAR (Figure 3b,c). Compared with 1982–1997, the average AGPP and APAR values for 1998 to 2018 increased significantly, and the growth rate of AGPP and APAR also increased during 1998–2018. It is noteworthy that the change in the growth rate of APAR is much greater than that for AGPP (Figure 3b,c).
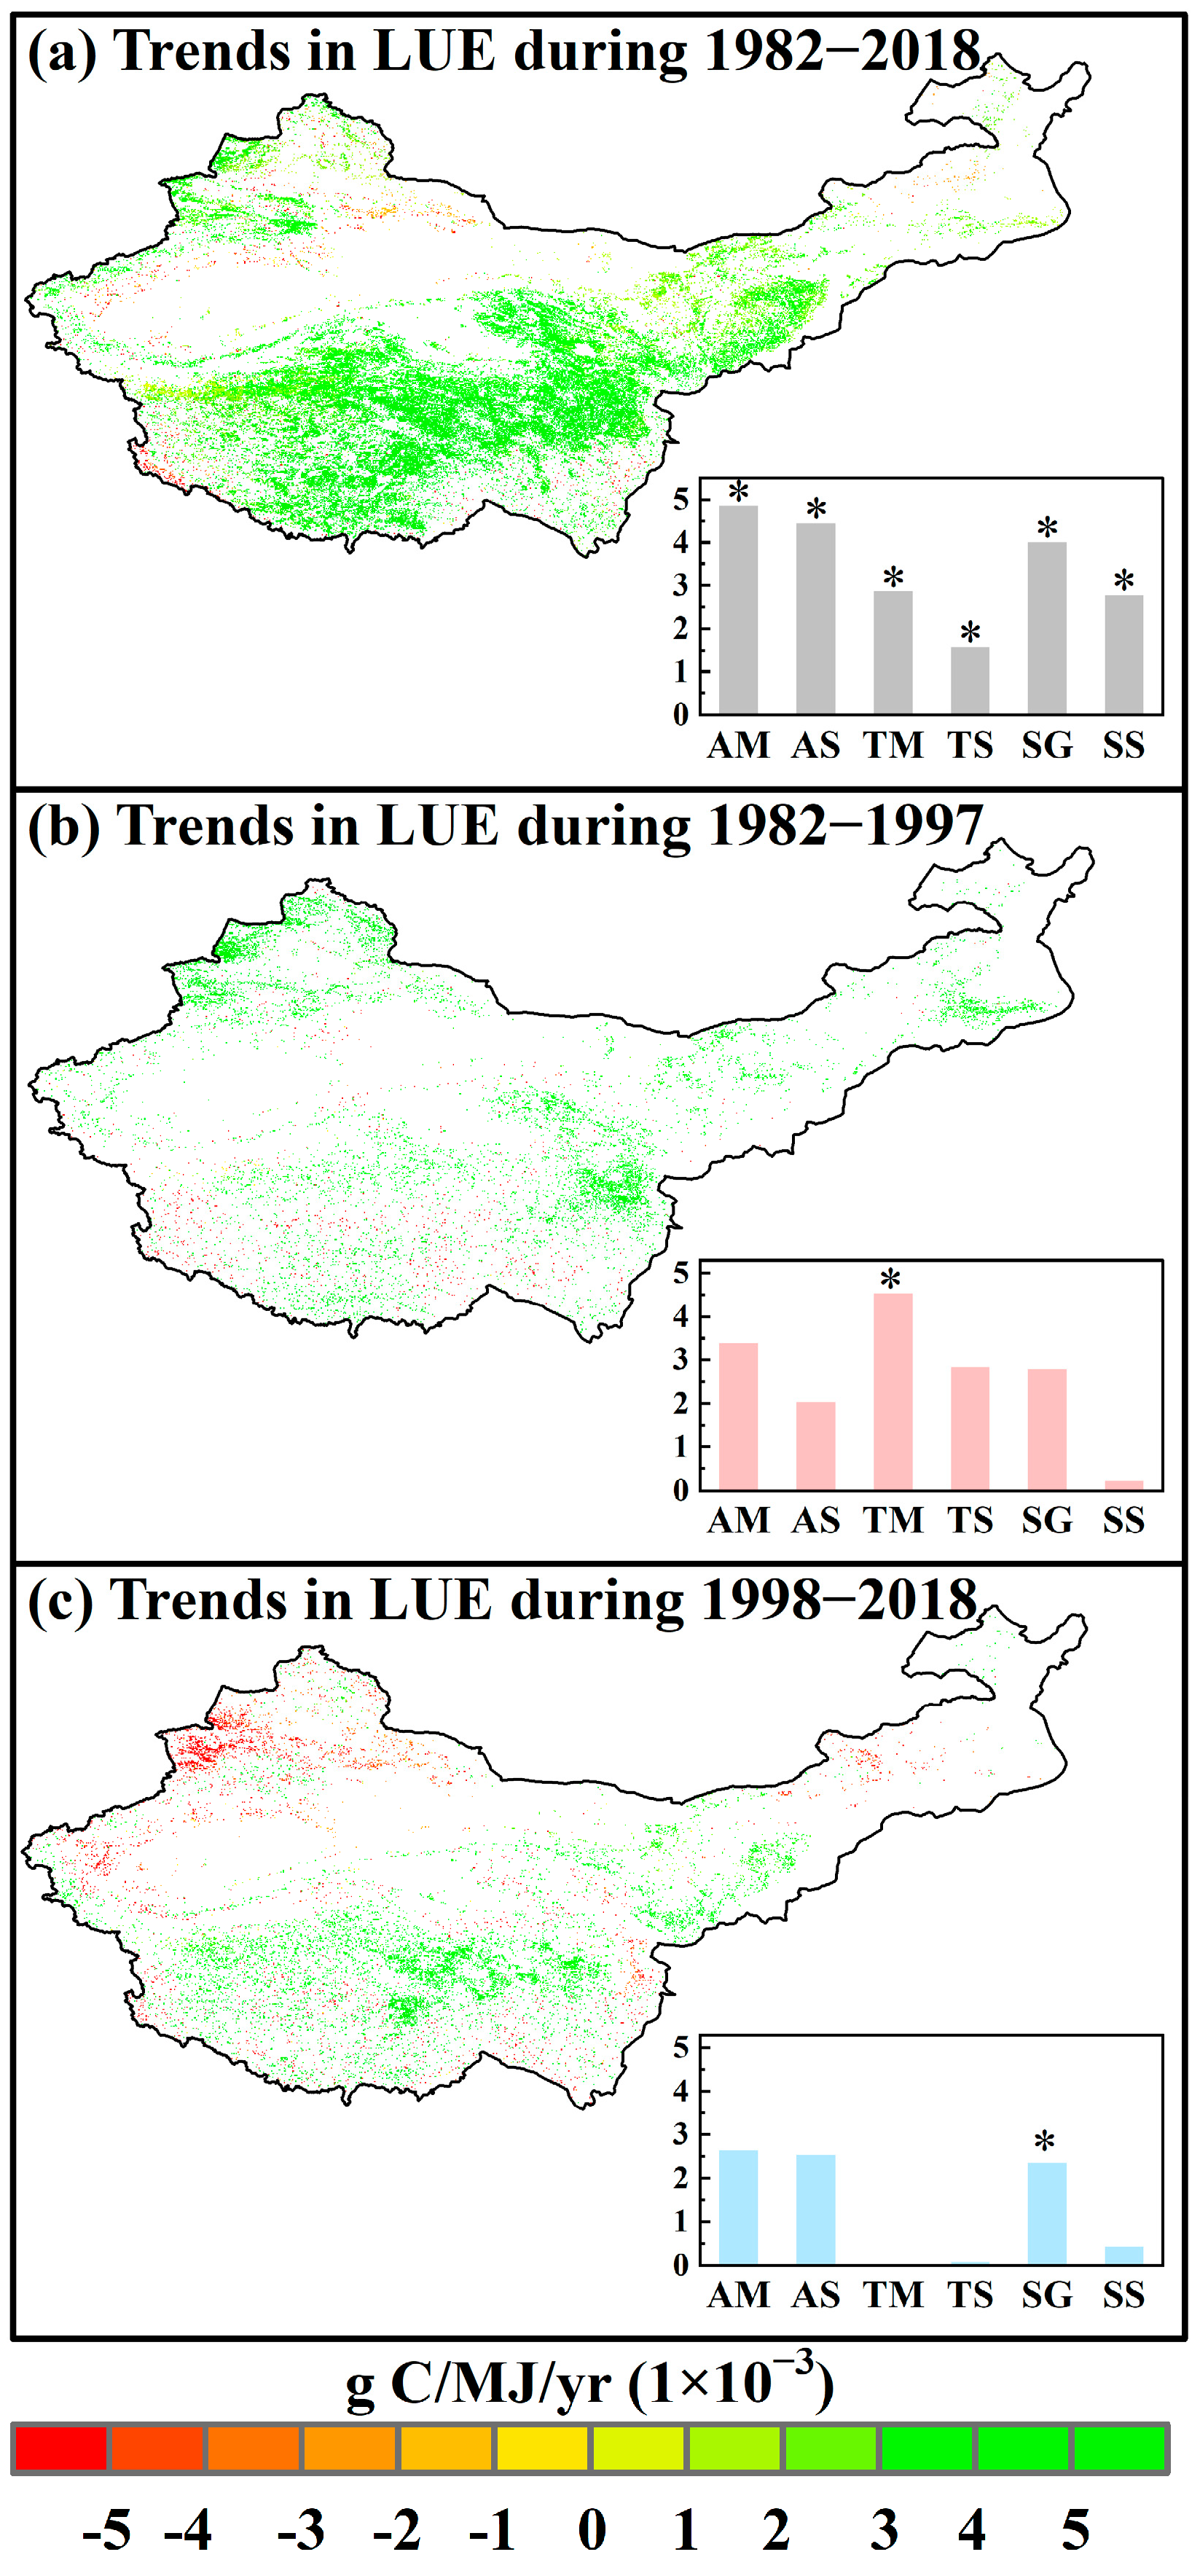
We found that 42.16% of grassland areas in northern China experienced significant (p < 0.05) changes in LUE between 1982 and 2018, of which 40.43% showed an upward trend, and 1.73% a downward trend (Figure 4a). The interannual variability in the LUE of all grassland types presented significantly increasing trends (Figure 4a and Figure S1). AM showed the fastest rate of LUE growth, increasing at a rate of 4.85 × 10⁻³ g C/MJ/yr (p < 0.05) (Figure S1a). TS had the slowest upward trends of LUE, with a rate of 1.58 × 10⁻³ g C/MJ/yr (p < 0.05) (Figure S1e). TM’s LUE presented a significantly increasing trend from 1982 to 1997 (p < 0.05), but the growth trends of other grassland types were not significant (Figure 4b). Contrarily, from 1998 to 2018, the interannual LUE of all grassland types tended to be stable, except for SG (p < 0.05) (Figure 4c). Additionally, all grassland types’ average LUE increased significantly after 1998 (p < 0.05), except for TS (Figure S2).
3.2. Interannual Dynamic Characteristics of Climate Factors
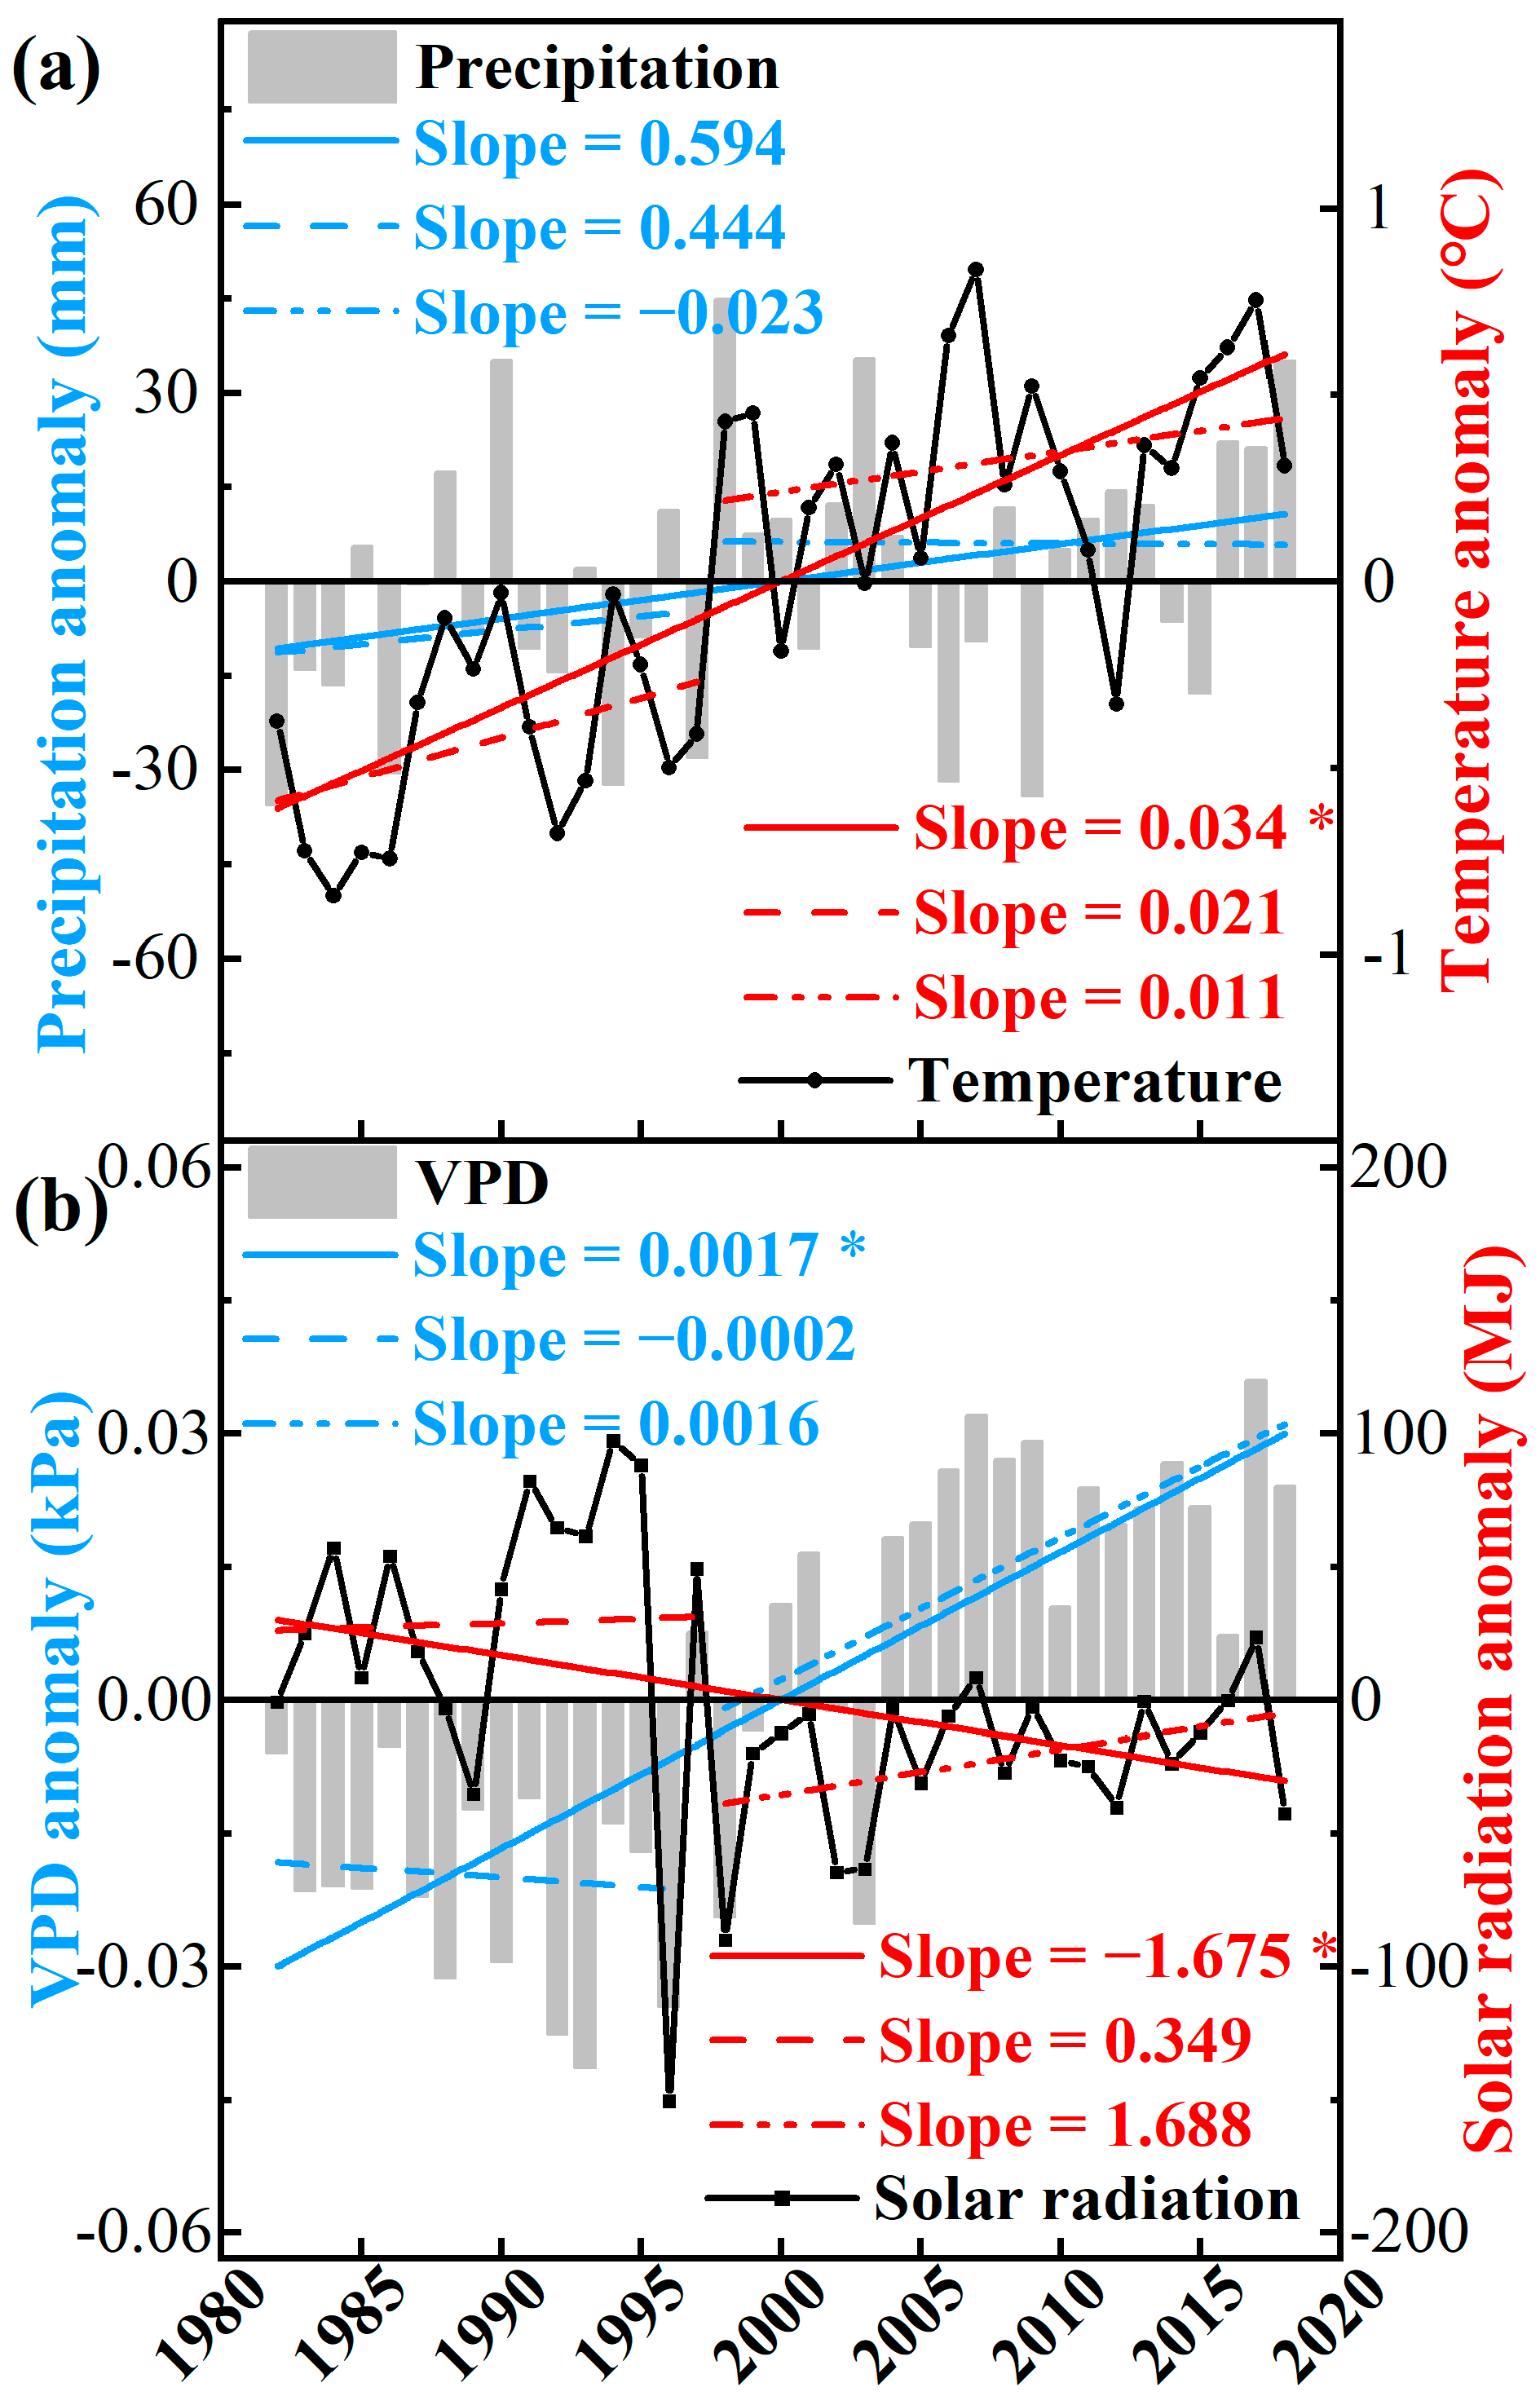
In the grasslands of northern China, precipitation, temperature, and VPD have all increased over the past 40 years at rates of 0.594 mm/yr (p > 0.05), 0.034 °C/yr (p < 0.05), and 1.7 Pa/yr (p < 0.05), respectively (Figure 5a,b). Solar radiation has been trending downward (−1.675 MJ/yr, p < 0.05) (Figure 5b). Climate factors have shown varying degrees of change during the two time periods of 1982–1997 and 1998–2018. The precipitation trend has shifted from increasing to decreasing, and the trend for VPD is the opposite. The temperature’s trend of increasing has slowed down, while the increasing trend of radiation has sped up (Figure 5a,b).
The interannual trends of climate factors in grasslands show spatial heterogeneity over time. AM, SG, and SS have shown significant increasing trends in terms of precipitation, temperature, and VPD from 1982 to 2018, while SG showed a decreasing trend in solar radiation. The temperature, precipitation and solar radiation of all grassland types showed no significant change from 1982 to 1997, while VPD in AM and AS exhibited a markedly declining trend (p < 0.05). In contrast, there were no discernible trends in precipitation and temperature in all grassland types from 1998 to 2018. Solar radiation increased significantly in TM, TS, and SS, while VPD increased notably in AM, AS, TS, and SG (Table 1).
3.3. Impact of Climate Factors on the Interannual Dynamic of LUE
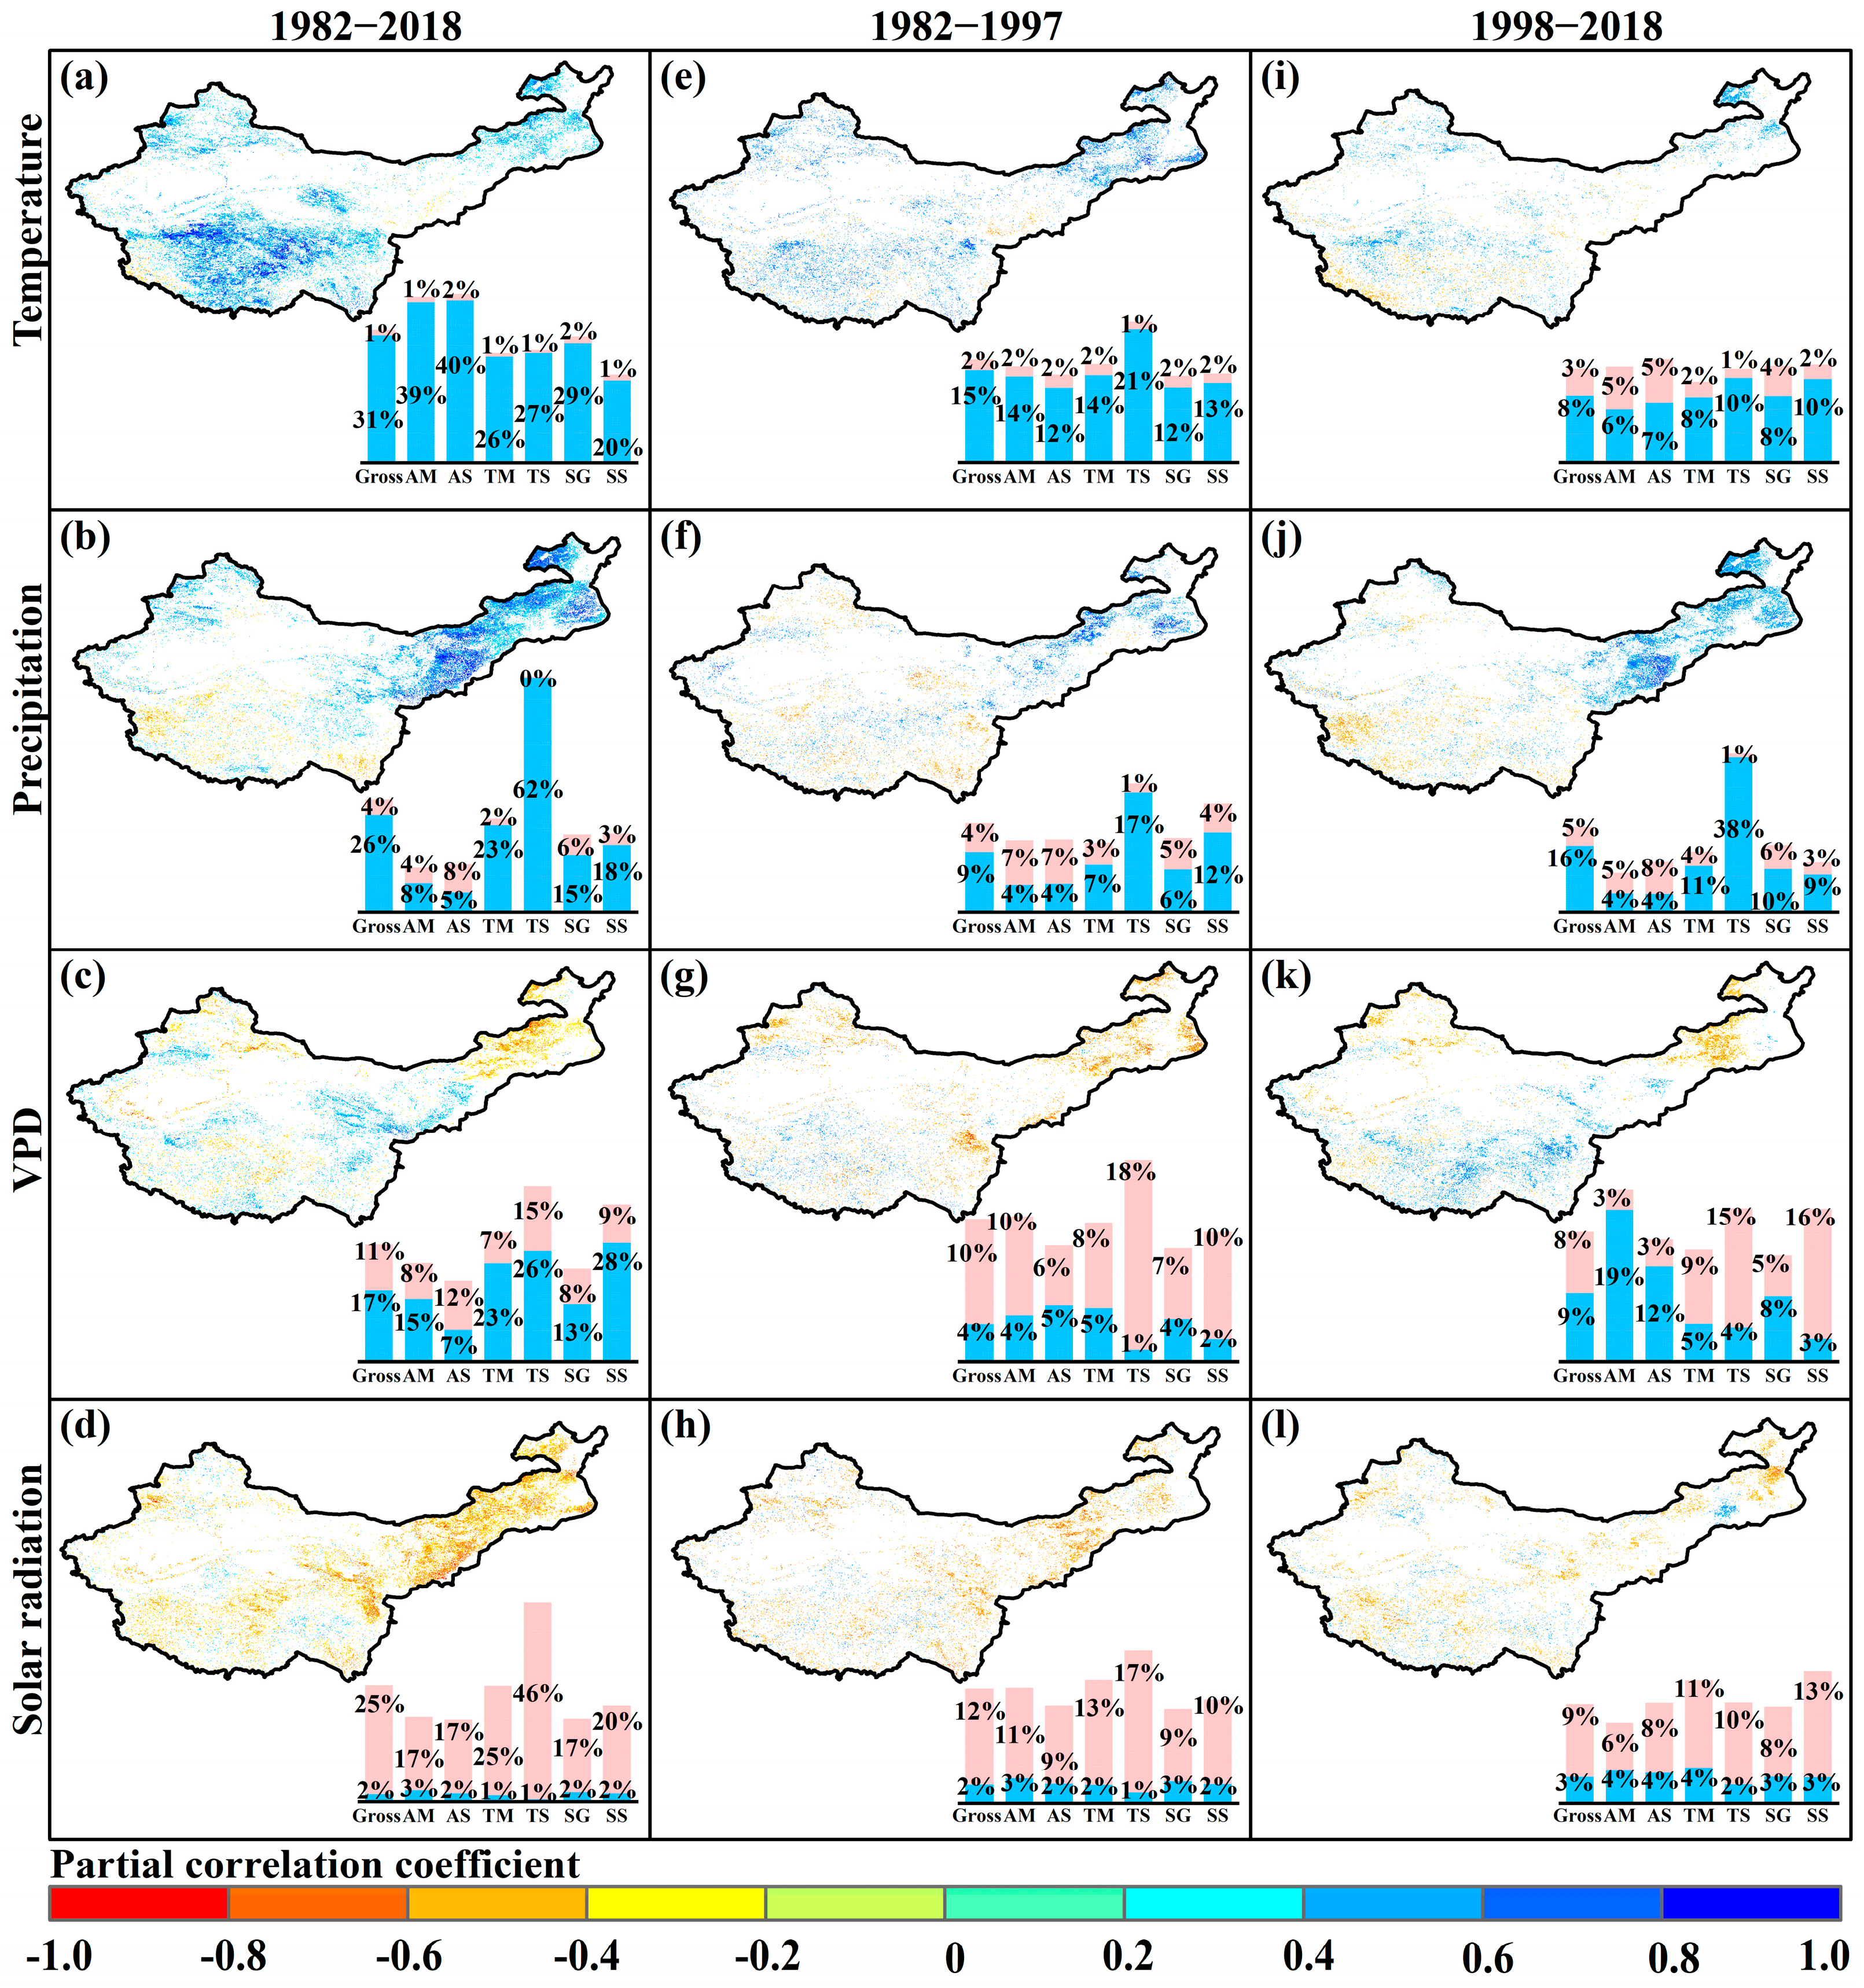
The results of partial correlation analyses between LUE and the four climate factors show the following: From 1982 to 2018, the positive correlation between temperature and LUE accounted for 31%, and the negative correlation accounted for 1% of the grassland area in northern China, while AS and AM were the most representative. The positive correlation between precipitation and LUE accounted for 26%, and the negative correlation accounted for 4% of the grassland area in northern China. TS’s LUE was greatly affected by precipitation, and the positive correlation area accounted for 62% of TS. The correlation between VPD and solar radiation and LUE was weak, except for in TS which had a large area of negative correlation with solar radiation (Figure 6).
From 1982 to 1997, the LUE in most grassland areas of northern China was positively correlated with temperature and precipitation, while it was negatively correlated with VPD and solar radiation. Of all grassland types, TS and SS were greatly affected by climate factors. For 1998 to 2018, the results of the partial correlation analysis between LUE and climate factors in the grasslands of northern China was relatively complex. LUE in the eastern study area, where TS was distributed, was positively correlated with precipitation and negatively correlated with VPD. The southwestern study area was shown to be negatively correlated with VPD. Furthermore, our results show that temperature and solar radiation had a weak correlation with LUE from 1998 to 2018 (Figure 6).
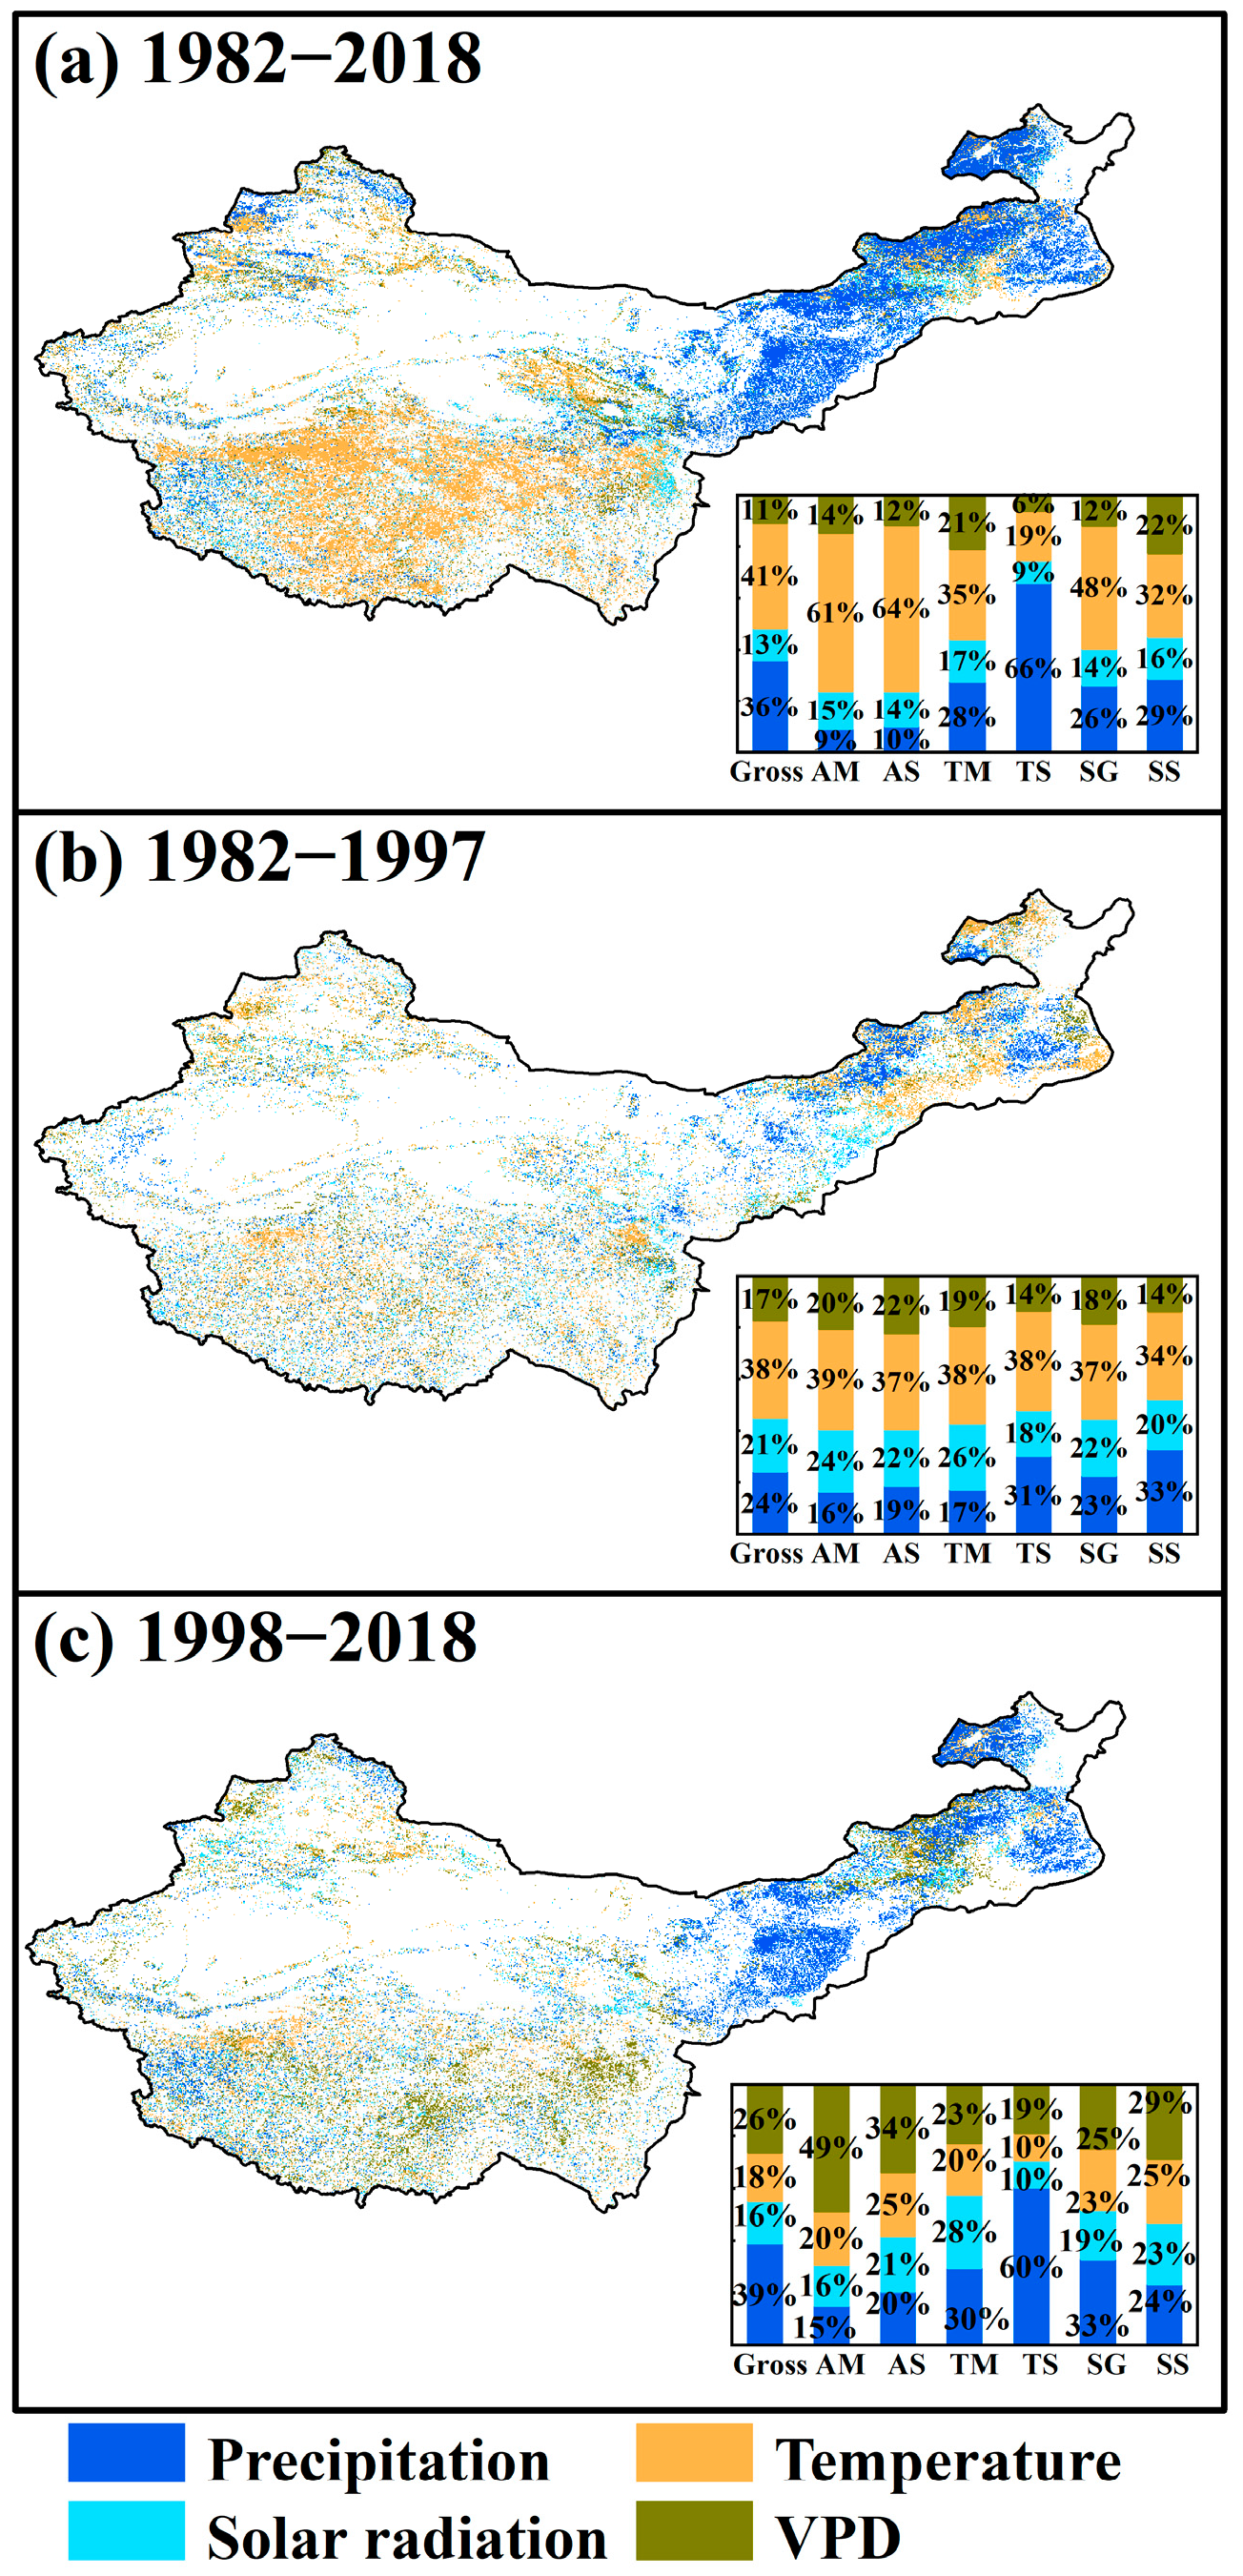
We further demonstrate the relative contributions of different driving factors to interannual dynamic changes in LUE in the grasslands of northern China. As shown in Figure 7a, temperature changes had the greatest impact on interannual LUE variability in the past 40 years, accounting for 41% of the study area, followed by precipitation (36%), VPD (13%), and solar radiation (11%). The main climate factors driving LUE dynamics in the grasslands of northern China are spatially heterogeneous. The interannual dynamics of LUE in the western study area are mainly driven by temperature, while the eastern study area is mainly affected by precipitation (Figure 7a). Additionally, this study found that most of the significant trends in LUE between 1982 and 1997 were predominantly caused by temperature (38%) (Figure 7b). However, the driving factor of interannual LUE variability changed to precipitation (39%) and VPD (26%) after 1998 (Figure 7c).
4. Discussion
4.1. Altered Temporal Trends in LUE
In this study, we found that the multiyear mean LUE in grasslands of northern China was 0.88 ± 0.047 g C/MJ, which is comparable with the findings of previous similar studies [12,14,41], indicating that the assessed LUE in grasslands of northern China is reliable. From 1982 to 2018, the LUE in the grasslands of northern China increased at an annual rate of 3.42 × 10⁻³ g C/MJ. Additionally, there was a difference between two stages (Figure 3a,d), 1982–1997 and 1998–2018, in terms of the mean values and trends of increase in LUE. In accordance with earlier research, the LUE in the northern African savannahs stabilized between 1982 and 2010 as a result of simultaneous and roughly similar increases in both APAR and AGPP [15]. In the grasslands of northern China, however, the rate of increase in AGPP was higher than the increase rate of APAR (Figure 3b,c), leading to imbalances in the growth of AGPP and APAR and a sharp rise in LUE. Chen et al. [42] and Zheng et al. [24] showed that climate change and frequent human activities are important reasons for the rapid growth in AGPP and APAR. Our study has confirmed the above, as we found that 1998 represents an abrupt change point (Figure 3d). The slowdown in the growth rate of the interannual LUE variability after 1998 might be related to the ecological protection and restoration initiatives promoted by the Chinese government. The substantial increase in the annual growth rate of APAR after 1998 statistically explains the differences in the interannual LUE variability, judging from the parameters of the LUE estimation model. And the increase in LAI caused by ecological protection and restoration initiatives might be the reason for the substantial increase in APAR growth rate—the mean annual rate of increase in LAI since the implementation of the ecological protection and restoration initiatives is nearly 8 times the former rate [39]. Therefore, in the past 40 years or so, the variability in LUE has generally shown a significant increasing trend due to the influence of climate change and human activities in the grasslands of northern China.
Our results also show that the interannual dynamics of LUE in all grassland ecosystem types have undergone a significant increasing trend over the past 40 years. The highest rate of increase was in AM (4.85 × 10⁻³ g C/MJ/yr), and the lowest increase rate was in TS (1.58 × 10⁻³ g C/MJ/yr). QTP grassland is one of the most sensitive ecosystems to global climate change [43]. Changes in temperature and precipitation have been suggested as a dominant driver of change in QTP grasslands [44]. QTP grasslands respond strongly to warming, and are also limited by precipitation [45]. AM is mainly distributed in the eastern region of QTP, and is affected by climate factors. Over the past 40 years, the temperature and precipitation in AM regions have increased significantly (Table 1), which is responsible for the highest LUE growth rate being seen in AM. In the case of TS, water availability was identified as the primary limiting factor of LUE. TS is mainly distributed in China’s arid and semi-arid climate zones, where moisture is the most basic and important resource for vegetation growth [46]. Grasslands in semi-arid climate zones are mainly limited by water resources [17,22,33]. The lack of water will inhibit the photosynthesis and respiration processes of the grassland ecosystem [47], thereby affecting their ecological functions. Therefore, water availability is critical to the LUE of TS. In addition, the increased temperature has indirectly reduced the carbon sink capacity by weakening the soil nutrient status in TS [48,49]. According to Table 1, the lowest rate of precipitation increase and the significant increase in temperature in TS are the main reasons why the slowest LUE growth rate was recorded here. Notably, TM’s LUE presented a discernible rising trend between 1982 and 1997 (Figure 4b and Figure S1b). In contrast, the interannual variation of TM tended to be stable, and even exhibited a decreasing trend, in the northern Tianshan Mountains in Xinjiang from 1998 to 2018 (Figure 4c). It is therefore consistent with the changes in LUE over this time period that the vegetative greenness on Tianshan Mountain exhibited a significant increase before 1998, and a reversal of this trend after 1998, when vegetation browning began [50]. Li et al. [50] further showed that moisture deficit played a great role in the recent browning of vegetation on Tianshan Mountain. As shown in Table 1, there was no significant change in precipitation in TM. As a result, we have concluded that the climate factors driving LUE dynamics are spatially heterogeneous in the grasslands of northern China.
4.2. Driving Factors of Interannual Dynamics of LUE
This study found a strong relationship between the interannual dynamics of LUE and climate factors. LUE is positively correlated with precipitation, temperature and VPD, and negatively correlated with solar radiation (Figure 6). These results agree with those of previously published studies [8,9,14]. In the middle and high Northern Hemisphere, the interannual LUE variability was found to be positively influenced by temperature in a recent study [14]. As temperature increased, vegetation photosynthesis and water use efficiency were improved. The effects of precipitation on LUE might be driven by grassland plants’ physiological changes. Changes in precipitation have a direct impact on the availability of water, which controls plant water uptake [6]. More precipitation will result in larger plant leaves [51]. Indirect mechanisms such as changing atmospheric water demand that may control stomatal conductance may also have an impact on LUE [52]. These would have an impact on evapotranspiration and photosynthesis. As a primary catalyst for plant photosynthesis, solar radiation is also not negligible [53]. With high solar radiation levels, vegetation may be light-saturated, and photosynthesis may even be suppressed by excessive light, resulting in low LUE [14,54]. Fei et al. [8] showed that there is a negative correlation between savanna LUE and VPD in Yunnan Province, China. Tang et al. [14] also showed that LUE was negatively correlated with VPD in global grasslands. Our results are inconsistent with the former, whereby LUE is positively correlated with VPD in all grassland types, except for AS. We speculate that the inconsistent results may be related to the threshold of regional VPD [41].
According to this study, temperature and precipitation are the dominant factors affecting the interannual LUE variability in the grasslands of northern China in the past 40 years. The interannual dynamics of LUE in the western study area are mainly driven by temperature, while the eastern study area is mainly affected by precipitation (Figure 7a). AM, AS, SG, SS and TM are distributed the western region. This area is generally higher in altitude and more sensitive to temperature than in the east. Previous studies on the QTP and areas surrounding it found that the temperature sensitivity index increases significantly along an elevational gradient [55,56]. Accelerated warming at high elevations could stimulate vegetation growth by alleviating the restriction of the vegetation growth rate [57]. In addition, subfreezing temperatures can halt photosynthesis, and freezing can directly harm leaves or the hydraulic system that supplies them with water and nutrients [9,58]. The eastern study area is a typical arid and semi-arid climate area, where TS is mainly distributed. Carbon sink capacity in arid and semi-arid grasslands is water-limited and sensitive to precipitation change [59]. Precipitation can affect grasslands’ carbon sink capacity not only through effects on soil moisture and temperature, but also through the regulation of species composition, soil nutrient availability, and plant biomass [60,61,62]. Therefore, the LUE of TS was mainly driven by precipitation, and other grassland types were mainly affected by temperature in northern China (Figure 7a).
Additionally, the relative contribution of drivers changes over time (Figure 7b,c), which may be related to global climate change. The sensitivity of vegetation to temperature change weakened in the Northern Hemisphere, and there was a significant decline in the strength of the relationship between interannual NDVI variability and temperature during the growing season from 1982 to 2011 [63]. Meanwhile, persistent warming may increase evaporation, thus leading to drought [50]. Consequently, we predict that the impact of changes in water status variables on interannual LUE variability will gradually became larger as temperatures continue to increase.
4.3. Limitations and Future Work
Based on GLASS GPP, GLASS FPAR, and CRU SW, this study simulated and analyzed the interannual LUE variability characteristics in the grasslands of northern China from 1982 to 2018. Finally, it was concluded that the annual LUE of grasslands in northern China increased year-to-year, and climate change was the dominant factor affecting the interannual LUE variability. However, many studies in recent years have shown that human activities and animal disturbance can also cause changes in vegetation LUE [64]. In addition, across a long time scale, using climatic variability alone is not adequate to fully explain vegetation variability, because of the lag effects of climatic factors [20,65]. Tang et al. [66] quantified the lagged effects of climate factors on vegetation growth in 32 major cities of China. We did not adequately consider time lags and human activities due to data limitations. This will be the focus of future ecological research. However, our research would be valuable for maintaining the ecological balance and sustainable utilization of grassland ecosystems, as well as addressing important issues such as climate change.
5. Conclusions
From 1982 to 2018, the interannual LUE variability in the grasslands of northern China increased at a rate of 3.42 × 10⁻³ g C/MJ/yr, with the largest upward rate for AM (4.85 × 10⁻³ g C/MJ/yr) and the smallest upward rate for TS (1.58 × 10⁻³ g C/MJ/yr). We found that temperature and precipitation were the dominant factors affecting the interannual LUE variability in the grasslands of northern China. Increasing precipitation accelerated the interannual growth rate of LUE in TS. Increasing temperature accelerated the interannual growth rate of LUE in AM, AS, SG, SS and TM. An interesting finding was that 1998 represents an abrupt change point in the dynamics of the interannual rate of change in LUE. After 1998, the growth rate of LUE slowed down, which may be related to the large-scale ecological protection and restoration initiatives implemented by the Chinese government in the 1990s. However, this could not be effectively verified due to the limited data. Thus, by combining data on human activity factors related to vegetation restoration, we can better understand the interannual dynamic process of LUE. Nonetheless, our results provide a reference for forming better responses to climate changes, as well as predicting future carbon cycle–climate interactions in grasslands.
Supplementary Materials
The following supporting information can be downloaded at: https://www.mdpi.com/article/10.3390/rs15225275/s1, Figure S1: Interannual dynamics of LUE in six grassland types; Figure S2: The multi-year mean LUE in six grassland types.
Author Contributions
Conceptualization, Z.W., T.Z. and L.Y.; Methodology, T.Z. and Z.W.; Data curation, L.Y. and H.Y.; Formal analysis, L.Y.; Funding acquisition, T.Z.; Writing—original draft, L.Y. and T.Z.; Writing—review & editing, T.Z., C.Z. and Z.W. All authors have read and agreed to the published version of the manuscript.
Funding
This research was funded by National Natural Science Foundation of China grant number 32201344, 41977077 and Startup Research Program of Northwest A&F University grant number 2452021105.
Data Availability Statement
The data presented in this study are available on request from the corresponding author.
Acknowledgments
The authors are grateful to Loess Plateau SubCenter, National Earth System Science Data Center, National Science & Technology Infrastructure of China (http://loess.geodata.cn) for their help in database.
Conflicts of Interest
The authors declare no conflict of interest.
References
- Bengtsson, J.; Bullock, J.M.; Egoh, B.; Everson, C.; Everson, T.; O’Connor, T.; O’Farrell, P.J.; Smith, H.G.; Lindborg, R. Grasslands—More important for ecosystem services than you might think. Ecosphere 2019, 10, e2582. [Google Scholar] [CrossRef]
- Liu, Z.; Zhou, Q.; Ma, Q.; Kuang, W.; Daryanto, S.; Wang, L.; Wu, J.; Liu, B.; Zhu, J.; Cao, C.; et al. Scale effect of climate factors on soil organic carbon stock in natural grasslands of northern China. Ecol. Indic. 2023, 146, 109757. [Google Scholar] [CrossRef]
- Lu, F.; Hu, H.; Sun, W.; Zhu, J.; Liu, G.; Zhou, W.; Zhang, Q.; Shi, P.; Liu, X.; Wu, X.; et al. Effects of national ecological restoration projects on carbon sequestration in China from 2001 to 2010. Proc. Natl. Acad. Sci. USA 2018, 115, 4039–4044. [Google Scholar] [CrossRef]
- Zhang, Z.; Zhou, Y.; Ju, W.; Chen, J.; Xiao, J. Accumulated soil moisture deficit better indicates the effect of soil water stress on light use efficiency of grasslands during drought years. Agric. For. Meteorol. 2023, 329, 109276. [Google Scholar] [CrossRef]
- Gao, D.; Wang, S.; Wang, L.; Li, Z.; Pan, N.; Liu, Y.; Fu, B. Enhanced coupling of light use efficiency and water use efficiency in arid and semi-arid environments. Ecohydrology 2022, 15, e2391. [Google Scholar] [CrossRef]
- Stocker, B.D.; Zscheischler, J.; Keenan, T.F.; Prentice, I.C.; Peñuelas, J.; Seneviratne, S.I. Quantifying soil moisture impacts on light use efficiency across biomes. New Phytol. 2018, 218, 1430–1449. [Google Scholar] [CrossRef]
- Pei, Y.Y.; Dong, J.W.; Zhang, Y.; Yuan, W.P.; Doughty, R.; Yang, J.L.; Zhou, D.C.; Zhang, L.X.; Xiao, X.M. Evolution of light use efficiency models: Improvement, uncertainties, and implications. Agric. For. Meteorol. 2022, 317, 108905. [Google Scholar] [CrossRef]
- Fei, X.; Song, Q.; Zhang, Y.; Yu, G.; Zhang, L.; Sha, L.; Liu, Y.; Xu, K.; Chen, H.; Wu, C.; et al. Patterns and Controls of Light Use Efficiency in Four Contrasting Forest Ecosystems in Yunnan, Southwest China. J. Geophys. Res. Biogeosci. 2019, 124, 293–311. [Google Scholar] [CrossRef]
- Balzarolo, M.; Valdameri, N.; Fu, Y.H.; Schepers, L.; Janssens, I.A.; Campioli, M. Different determinants of radiation use efficiency in cold and temperate forests. Glob. Ecol. Biogeogr. 2019, 28, 1649–1667. [Google Scholar] [CrossRef]
- Monteith, J.L.; Moss, C.J.; Cooke, G.W.; Pirie, N.W.; Bell, G.D.H. Climate and the efficiency of crop production in Britain. Philos. Trans. R. Soc. B Biol. Sci. 1997, 281, 277–294. [Google Scholar]
- Monteith, J.L. Solar Radiation and Productivity in Tropical Ecosystems. J. Appl. Ecol. 1972, 9, 747–766. [Google Scholar] [CrossRef]
- He, M.; Chen, S.; Lian, X.; Wang, X.; Peñuelas, J.; Piao, S. Global Spectrum of Vegetation Light-Use Efficiency. Geophys. Res. Lett. 2022, 49, e2022G–e99550G. [Google Scholar] [CrossRef]
- Gitelson, A.A.; Gamon, J.A. The need for a common basis for defining light-use efficiency: Implications for productivity estimation. Remote Sens. Environ. 2015, 156, 196–201. [Google Scholar] [CrossRef]
- Tang, S.C.; Wang, X.H.; He, M.Z.; Huang, L.; Zhang, Y.; Yang, H.; Piao, S.L. Global Patterns and Climate Controls of Terrestrial Ecosystem Light Use Efficiency. J. Geophys. Res.-Biogeosci. 2020, 125, e2020JG005908. [Google Scholar] [CrossRef]
- Traore, A.K.; Ciais, P.; Vuichard, N.; MacBean, N.; Dardel, C.; Poulter, B.; Piao, S.L.; Fisher, J.B.; Viovy, N.; Jung, M.; et al. 1982–2010 Trends of Light Use Efficiency and Inherent Water Use Efficiency in African vegetation: Sensitivity to Climate and Atmospheric CO2 Concentrations. Remote Sens. 2014, 6, 8923–8944. [Google Scholar] [CrossRef]
- Wu, J.; Gillani, S.S.M.; Wang, M. The Difference in Light use Efficiency between an Abandoned Peatland Pasture and an Adjacent Boreal Bog in Western Newfoundland, Canada. Wetlands 2020, 40, 733–743. [Google Scholar] [CrossRef]
- Wang, Y.; Zhou, G.S. Light Use Efficiency over Two Temperate Steppes in Inner Mongolia, China. PLoS ONE 2012, 7, e43614. [Google Scholar] [CrossRef]
- Ye, C.C.; Sun, J.; Liu, M.; Xiong, J.N.; Zong, N.; Hu, J.; Huang, Y.; Duan, X.W.; Tsunekawa, A. Concurrent and Lagged Effects of Extreme Drought Induce Net Reduction in Vegetation Carbon Uptake on Tibetan Plateau. Remote Sens. 2020, 12, 2347. [Google Scholar] [CrossRef]
- Lara, C.; Saldías, G.S.; Cazelles, B.; Rivadeneira, M.M.; Muñoz, R.; Galán, A.; Paredes, A.L.; Fierro, P.; Broitman, B.R. Climatic Regulation of Vegetation Phenology in Protected Areas along Western South America. Remote Sens. 2021, 13, 2590. [Google Scholar] [CrossRef]
- Wang, S.; Liu, X.; Wu, Y. Considering Climatic Factors, Time Lag, and Cumulative Effects of Climate Change and Human Activities on Vegetation NDVI in Yinshanbeilu, China. Plants 2023, 12, 3312. [Google Scholar] [CrossRef]
- Liu, W.; Mo, X.; Liu, S.; Lin, Z.; Lv, C. Attributing the changes of grass growth, water consumed and water use efficiency over the Tibetan Plateau. J. Hydrol. 2021, 598, 126464. [Google Scholar] [CrossRef]
- Ren, T.; He, N.; Liu, Z.; Li, M.; Zhang, J.; Li, A.; Wei, C.; Lü, X.; Han, X. Environmental filtering rather than phylogeny determines plant leaf size in three floristically distinctive plateaus. Ecol. Indic. 2021, 130, 108049. [Google Scholar] [CrossRef]
- Zhang, R.; Zhao, X.; Zuo, X.; Degen, A.A.; Li, Y.; Liu, X.; Luo, Y.; Qu, H.; Lian, J.; Wang, R. Drought-induced shift from a carbon sink to a carbon source in the grasslands of Inner Mongolia, China. CATENA 2020, 195, 104845. [Google Scholar] [CrossRef]
- Zheng, K.; Wei, J.; Pei, J.; Cheng, H.; Zhang, X.; Huang, F.; Li, F.; Ye, J. Impacts of climate change and human activities on grassland vegetation variation in the Chinese Loess Plateau. Sci. Total Environ. 2019, 660, 236–244. [Google Scholar] [CrossRef] [PubMed]
- Zhu, X.; Yu, G.; Wang, Q.; Gao, Y.; He, H.; Zheng, H.; Chen, Z.; Shi, P.; Zhao, L.; Li, Y.; et al. Approaches of climate factors affecting the spatial variation of annual gross primary productivity among terrestrial ecosystems in China. Ecol. Indic. 2016, 62, 174–181. [Google Scholar] [CrossRef]
- Jia, W.; Liu, M.; Wang, D.; He, H.; Shi, P.; Li, Y.; Wang, Y. Uncertainty in simulating regional gross primary productivity from satellite-based models over northern China grassland. Ecol. Indic. 2018, 88, 134–143. [Google Scholar] [CrossRef]
- Wang, X.; Pan, S.; Pan, N.; Pan, P. Grassland productivity response to droughts in northern China monitored by satellite-based solar-induced chlorophyll fluorescence. Sci. Total Environ. 2022, 830, 154550. [Google Scholar] [CrossRef]
- Ma, Q.; Kuang, W.; Liu, Z.; Hu, F.; Qian, J.; Liu, B.; Zhu, J.; Cao, C.; Wu, J.; Li, X.; et al. Spatial pattern of different component carbon in varied grasslands of northern China. Geoderma 2017, 303, 27–36. [Google Scholar] [CrossRef]
- Yuan, W.; Lin, S.; Wang, X. Progress of studies on satellite-based terrestrial vegetation production models in China. Prog. Phys. Geogr. Earth Environ. 2022, 46, 889–908. [Google Scholar] [CrossRef]
- Yuan, W.P.; Liu, S.G.; Yu, G.R.; Bonnefond, J.M.; Chen, J.Q.; Davis, K.; Desai, A.R.; Goldstein, A.H.; Gianelle, D.; Rossi, F.; et al. Global estimates of evapotranspiration and gross primary production based on MODIS and global meteorology data. Remote Sens. Environ. 2010, 114, 1416–1431. [Google Scholar] [CrossRef]
- Yuan, W.P.; Zheng, Y.; Piao, S.L.; Ciais, P.; Lombardozzi, D.; Wang, Y.P.; Ryu, Y.; Chen, G.X.; Dong, W.J.; Hu, Z.M.; et al. Increased atmospheric vapor pressure deficit reduces global vegetation growth. Sci. Adv. 2019, 5, eaax1396. [Google Scholar] [CrossRef]
- Zheng, Y.; Shen, R.; Wang, Y.; Li, X.; Liu, S.; Liang, S.; Chen, J.M.; Ju, W.; Zhang, L.; Yuan, W. Improved estimate of global gross primary production for reproducing its long-term variation, 1982–2017. Earth Syst. Sci. Data 2020, 12, 2725–2746. [Google Scholar] [CrossRef]
- Bai, Y.; Li, S.; Liu, M.; Guo, Q. Assessment of vegetation change on the Mongolian Plateau over three decades using different remote sensing products. J. Environ. Manag. 2022, 317, 115509. [Google Scholar] [CrossRef] [PubMed]
- Xiao, Z.; Liang, S.; Sun, R.; Wang, J.; Jiang, B. Estimating the fraction of absorbed photosynthetically active radiation from the MODIS data based GLASS leaf area index product. Remote Sens. Environ. 2015, 171, 105–117. [Google Scholar] [CrossRef]
- Xiao, Z.; Liang, S.; Sun, R. Evaluation of Three Long Time Series for Global Fraction of Absorbed Photosynthetically Active Radiation (FAPAR) Products. IEEE Trans. Geosci. Remote Sens. 2018, 56, 5509–5524. [Google Scholar] [CrossRef]
- Zhang, T.; Chen, Z.; Zhang, W.; Jiao, C.; Yang, M.; Wang, Q.; Han, L.; Fu, Z.; Sun, Z.; Li, W.; et al. Long-term trend and interannual variability of precipitation-use efficiency in Eurasian grasslands. Ecol. Indic. 2021, 130, 108091. [Google Scholar] [CrossRef]
- Zhang, Y.; Song, C.; Sun, G.; Band, L.E.; Noormets, A.; Zhang, Q. Understanding moisture stress on light use efficiency across terrestrial ecosystems based on global flux and remote-sensing data. J. Geophys. Res. Biogeosci. 2015, 120, 2053–2066. [Google Scholar] [CrossRef]
- Chen, Z.; Yu, G.R.; Zhu, X.J.; Zhang, L.M.; Wang, Q.F.; Jiao, C.C. A dataset of primary production, respiration and net production in Chinese typical terrestrial ecosystems based on literature integration. Sci. Data Bank 2019, 4, 50–58. [Google Scholar]
- Zheng, H.; Miao, C.; Li, X.; Kong, D.; Gou, J.; Wu, J.; Zhang, S. Effects of Vegetation Changes and Multiple Environmental Factors on Evapotranspiration Across China Over the Past 34 Years. Earth’s Future 2022, 10, e2021E–e2564E. [Google Scholar] [CrossRef]
- Wei, F.; Wang, S.; Fu, B.; Wang, L.; Zhang, W.; Wang, L.; Pan, N.; Fensholt, R. Divergent trends of ecosystem-scale photosynthetic efficiency between arid and humid lands across the globe. Glob. Ecol. Biogeogr. 2022, 31, 1824–1837. [Google Scholar] [CrossRef]
- Garbulsky, M.F.; Penuelas, J.; Papale, D.; Ardo, J.; Goulden, M.L.; Kiely, G.; Richardson, A.D.; Rotenberg, E.; Veenendaal, E.M.; Filella, I. Patterns and controls of the variability of radiation use efficiency and primary productivity across terrestrial ecosystems. Glob. Ecol. Biogeogr. 2010, 19, 253–267. [Google Scholar] [CrossRef]
- Chen, Y.; Feng, X.; Tian, H.; Wu, X.; Gao, Z.; Feng, Y.; Piao, S.; Lv, N.; Pan, N.; Fu, B. Accelerated increase in vegetation carbon sequestration in China after 2010: A turning point resulting from climate and human interaction. Glob. Chang. Biol. 2021, 27, 5848–5864. [Google Scholar] [CrossRef] [PubMed]
- Sun, H.; Zheng, D.; Yao, T.; Zhang, Y. Protection and construction of the national ecological security shelter zone on Tibetan Plateau. Acta Geogr. Sin. 2012, 67, 3–12. [Google Scholar]
- Liu, F.; Song, Q.; Zhao, J.; Mao, L.; Bu, H.; Hu, Y.; Zhu, X. Canopy occupation volume as an indicator of canopy photosynthetic capacity. New Phytol. 2021, 232, 941–956. [Google Scholar] [CrossRef]
- Li, L.; Zhang, Y.; Liu, L.; Wu, J.; Wang, Z.; Li, S.; Zhang, H.; Zu, J.; Ding, M.; Paudel, B. Spatiotemporal Patterns of Vegetation Greenness Change and Associated Climatic and Anthropogenic Drivers on the Tibetan Plateau during 2000–2015. Remote Sens. 2018, 10, 1525. [Google Scholar] [CrossRef]
- Fang, J.; Piao, S.; Zhou, L.; He, J.; Wei, F.; Myneni, R.B.; Tucker, C.J.; Tan, K. Precipitation patterns alter growth of temperate vegetation. Geophys. Res. Lett. 2005, 32, L21411. [Google Scholar] [CrossRef]
- Fu, Z.; Ciais, P.; Prentice, I.C.; Gentine, P.; Makowski, D.; Bastos, A.; Luo, X.; Green, J.K.; Stoy, P.C.; Yang, H.; et al. Atmospheric dryness reduces photosynthesis along a large range of soil water deficits. Nat. Commun. 2022, 13, 989. [Google Scholar] [CrossRef]
- Wang, G.; Luo, Z.; Huang, Y.; Sun, W.; Wei, Y.; Xiao, L.; Deng, X.; Zhu, J.; Li, T.; Zhang, W. Simulating the spatiotemporal variations in aboveground biomass in Inner Mongolian grasslands under environmental changes. Atmos. Chem. Phys. 2021, 21, 3059–3071. [Google Scholar] [CrossRef]
- Wu, W.; Sun, R.; Liu, L.; Liu, X.; Yu, H.; Ma, Q.; Qi, M.; Li, L.; Li, Y.; Zhou, G.; et al. Precipitation consistently promotes, but temperature inversely drives, biomass production in temperate vs. alpine grasslands. Agric. For. Meteorol. 2023, 329, 109277. [Google Scholar] [CrossRef]
- Li, Y.; Chen, Y.; Sun, F.; Li, Z. Recent vegetation browning and its drivers on Tianshan Mountain, Central Asia. Ecol. Indic. 2021, 129, 107912. [Google Scholar] [CrossRef]
- Wang, Y.; Lv, W.; Xue, K.; Wang, S.; Zhang, L.; Hu, R.; Zeng, H.; Xu, X.; Li, Y.; Jiang, L.; et al. Grassland changes and adaptive management on the Qinghai–Tibetan Plateau. Nat. Rev. Earth Environ. 2022, 3, 668–683. [Google Scholar] [CrossRef]
- Waring, R.; Landsberg, J.; Linder, S. Tamm Review: Insights gained from light use and leaf growth efficiency indices. For. Ecol. Manag. 2016, 379, 232–242. [Google Scholar] [CrossRef]
- Shi, H.; Li, L.; Eamus, D.; Cleverly, J.; Huete, A.; Beringer, J.; Yu, Q.; van Gorsel, E.; Hutley, L. Intrinsic climate dependency of ecosystem light and water-use-efficiencies across Australian biomes. Environ. Res. Lett. 2014, 9, 104002. [Google Scholar] [CrossRef]
- Garbulsky, M.F.; Filella, I.; Verger, A.; Peñuelas, J. Photosynthetic light use efficiency from satellite sensors: From global to Mediterranean vegetation. Environ. Exp. Bot. 2014, 103, 3–11. [Google Scholar] [CrossRef]
- Li, D.; Wu, S.; Liu, L.; Zhang, Y.; Li, S. Vulnerability of the global terrestrial ecosystems to climate change. Glob. Chang. Biol. 2018, 24, 4095–4106. [Google Scholar] [CrossRef] [PubMed]
- Li, L.; Zhang, Y.; Wu, J.; Li, S.; Zhang, B.; Zu, J.; Zhang, H.; Ding, M.; Paudel, B. Increasing sensitivity of alpine grasslands to climate variability along an elevational gradient on the Qinghai-Tibet Plateau. Sci. Total Environ. 2019, 678, 21–29. [Google Scholar] [CrossRef] [PubMed]
- Wang, H.; Liu, H.; Cao, G.; Ma, Z.; Li, Y.; Zhang, F.; Zhao, X.; Zhao, X.; Jiang, L.; Sanders, N.J.; et al. Alpine grassland plants grow earlier and faster but biomass remains unchanged over 35 years of climate change. Ecol. Lett. 2020, 23, 701–710. [Google Scholar] [CrossRef]
- Jackson, R.B.; Sperry, J.S.; Dawson, T.E. Root water uptake and transport: Using physiological processes in global predictions. Trends Plant Sci. 2000, 5, 482–488. [Google Scholar] [CrossRef]
- Niu, S.; Wu, M.; Han, Y.; Xia, J.; Li, L.; Wan, S. Water-mediated responses of ecosystem carbon fluxes to climatic change in a temperate steppe. New Phytol. 2008, 177, 209–219. [Google Scholar] [CrossRef]
- Knapp, A.K.; Beier, C.; Briske, D.D.; Classen, A.T.; Luo, Y.; Reichstein, M.; Smith, M.D.; Smith, S.D.; Bell, J.E.; Fay, P.A.; et al. Consequences of More Extreme Precipitation Regimes for Terrestrial Ecosystems. Bioscience 2008, 58, 811–821. [Google Scholar] [CrossRef]
- Guo, N.; Wang, A.; Allan Degen, A.; Deng, B.; Shang, Z.; Ding, L.; Long, R. Grazing exclusion increases soil CO2 emission during the growing season in alpine meadows on the Tibetan Plateau. Atmos. Environ. 2018, 174, 92–98. [Google Scholar] [CrossRef]
- Didiano, T.J.; Johnson, M.T.J.; Duval, T.P. Disentangling the Effects of Precipitation Amount and Frequency on the Performance of 14 Grassland Species. PLoS ONE 2016, 11, e162310. [Google Scholar] [CrossRef] [PubMed]
- Piao, S.L.; Nan, H.J.; Huntingford, C.; Ciais, P.; Friedlingstein, P.; Sitch, S.; Peng, S.; Ahlström, A.; Canadell, J.G.; Cong, N.; et al. Evidence for a weakening relationship between interannual temperature variability and northern vegetation activity. Nat. Commun. 2014, 5, 5018. [Google Scholar] [CrossRef] [PubMed]
- Yuan, W.; Cai, W.; Xia, J.; Chen, J.; Liu, S.; Dong, W.; Merbold, L.; Law, B.; Arain, A.; Beringer, J.; et al. Global comparison of light use efficiency models for simulating terrestrial vegetation gross primary production based on the LaThuile database. Agric. For. Meteorol. 2014, 192–193, 108–120. [Google Scholar] [CrossRef]
- Barford, C.C.; Wofsy, S.C.; Goulden, M.L.; Munger, J.W.; Pyle, E.H.; Urbanski, S.P.; Hutyra, L.; Saleska, S.R.; Fitzjarrald, D.; Moore, K. Factors Controlling Long- and Short-Term Sequestration of Atmospheric CO2 in a Mid-latitude Forest. Science 2001, 294, 1688–1691. [Google Scholar] [CrossRef] [PubMed]
- Tang, W.; Liu, S.; Kang, P.; Peng, X.; Li, Y.; Guo, R.; Jia, J.; Liu, M.; Zhu, L. Quantifying the lagged effects of climate factors on vegetation growth in 32 major cities of China. Ecol. Indic. 2021, 132, 108290. [Google Scholar] [CrossRef]
Figure 1.
Location of study area (a) and spatial distribution of grassland types (b).

Figure 2.
Relationship between tower-based LUE and GLASS-based LUE. The dashed black line represented the 1:1 line (y = x), while the solid red line was derived from the linear regression between GLASS-based LUE and Tower-based LUE.
Figure 2.
Relationship between tower-based LUE and GLASS-based LUE. The dashed black line represented the 1:1 line (y = x), while the solid red line was derived from the linear regression between GLASS-based LUE and Tower-based LUE.

Figure 3.
Interannual dynamics of LUE (a), AGPP (b), APAR (c) and the results of the Mann–Kendall test for LUE (d), AGPP (e), APAR (f) in northern China grassland from 1982 to 2018. The dashed lines and shaded areas indicate the trends and 95% confidence intervals obtained by the simple linear regression model, respectively, where black dashed lines indicate the trends during 1982–2018, and red and blue indicate the trends during 1982–1997 and 1998–2018, respectively. The multi-year means from 1982 to 1997 and 1998 to 2018 are shown in insets. The letters in the insets indicate the results of non-parametric test interval differences. Data with the same letter are not significantly different (p > 0.05). UF depicts the positive sequence statistics; UB depicts the inverse sequence statistics.

Figure 4.
The spatial patterns of significant (p < 0.05) changes in LUE during 1982–2018 (a), 1982–1997 (b) and 1998–2018 (c). The insets depict the interannual variation trends of the six grassland types, * indicates a significant trend (p < 0.05). AM, alpine meadow; AS, alpine steppe; TM, temperate meadow; TS, temperate steppe; SG, sparse grassland; SS, sparse shrubland.

Figure 5.
Anomalies of mean annual precipitation and mean annual temperature (a), annual solar radiation and mean annual VPD (b) in grasslands of northern China from 1982 to 2018. “*” indicates a significant trend (p < 0.05).
Figure 5.
Anomalies of mean annual precipitation and mean annual temperature (a), annual solar radiation and mean annual VPD (b) in grasslands of northern China from 1982 to 2018. “*” indicates a significant trend (p < 0.05).

Figure 6.
Partial correlation coefficients between LUE and climate factors. Partial correlation coefficients between LUE and temperature (a,e,i), precipitation (b,f,j), VPD (c,g,k), and solar radiation (d,h,l) during 1982–2018 (first column), 1982–1997 (second column), and 1998–2018 (third column). The insets represent the percentages of significantly correlated (p < 0.05) areas in the grasslands of northern China and the six grassland types, while blue and pink represent positive and negative correlations, respectively. Gross, grasslands of northern China; AM, alpine meadow; AS, alpine steppe; TM, temperate meadow; TS, temperate steppe; SG, sparse grassland; SS, sparse shrubland.

Figure 7.
The driving factor that contributes the most to an increase (or decrease) in LUE indicated for each grid cell in 1982–2018 (a), 1982–1997 (b) and 1998–2018 (c). The insets show the area fractions of land dominated by each factor in different grassland types. Gross, grasslands of northern China; AM, alpine meadow; AS, alpine steppe; TM, temperate meadow; TS, temperate steppe; SG, sparse grassland; SS, sparse shrubland.


Table 1.
Interannual climate dynamics in different grassland types over time.
| AM | AS | TM | TS | SG | SS | ||
|---|---|---|---|---|---|---|---|
| 1982–2018 | Precipitation | 0.990 * | 1.006 | 0.629 | 0.065 | 0.669 * | 0.515 * |
| Solar radiation | −1.111 | −1.777 * | 0.072 | −2.159 * | −1.736 * | −0.581 | |
| Temperature | 0.029 * | 0.032 * | 0.033 * | 0.034 * | 0.036 * | 0.039 * | |
| VPD (1 × 10⁻³) | 0.536 * | 0.111 | 1.630 * | 3.370 * | 1.330 * | 4.020 * | |
| 1982–1997 | Precipitation | −0.229 | 0.549 | 0.208 | 0.557 | 0.516 | 0.612 |
| Solar radiation | −0.922 | −0.027 | −1.750 | 0.568 | 0.961 | 0.934 | |
| Temperature | −0.006 | −0.0003 | 0.041 | 0.043 | 0.020 | 0.036 | |
| VPD (1 × 10⁻³) | −1.190 * | −1.010 * | −0.302 | 0.543 | −0.178 | 0.979 | |
| 1998–2018 | Precipitation | −0.464 | −1.552 | 0.123 | 1.336 | −0.198 | 0.464 |
| Solar radiation | 0.327 | −0.431 | 4.372 * | 4.335 * | 0.558 | 2.766 * | |
| Temperature | 0.015 | 0.015 | 0.005 | 0.009 | 0.011 | 0.004 | |
| VPD (1 × 10⁻³) | 1.290 * | 0.925 * | 1.630 | 2.500 * | 1.290 * | 2.480 |
“*” indicates a significant trend (p < 0.05). AM, alpine meadow; AS, alpine steppe; TM, temperate meadow; TS, temperate steppe; SG, sparse grassland; SS, sparse shrubland.
Disclaimer/Publisher’s Note: The statements, opinions and data contained in all publications are solely those of the individual author(s) and contributor(s) and not of MDPI and/or the editor(s). MDPI and/or the editor(s) disclaim responsibility for any injury to people or property resulting from any ideas, methods, instructions or products referred to in the content. |
© 2023 by the authors. Licensee MDPI, Basel, Switzerland. This article is an open access article distributed under the terms and conditions of the Creative Commons Attribution (CC BY) license (https://creativecommons.org/licenses/by/4.0/).
Share and Cite
MDPI and ACS Style
Yuan, L.; Zhang, T.; Yao, H.; Zheng, C.; Wen, Z. Altered Trends in Light Use Efficiency of Grassland Ecosystem in Northern China. Remote Sens. 2023, 15, 5275. https://doi.org/10.3390/rs15225275
AMA Style
Yuan L, Zhang T, Yao H, Zheng C, Wen Z. Altered Trends in Light Use Efficiency of Grassland Ecosystem in Northern China. Remote Sensing. 2023; 15(22):5275. https://doi.org/10.3390/rs15225275
Chicago/Turabian StyleYuan, Liuhuan, Tianyou Zhang, Hongbin Yao, Cheng Zheng, and Zhongming Wen. 2023. "Altered Trends in Light Use Efficiency of Grassland Ecosystem in Northern China" Remote Sensing 15, no. 22: 5275. https://doi.org/10.3390/rs15225275
Note that from the first issue of 2016, this journal uses article numbers instead of page numbers. See further details here.