
ConCs-Fusion: A Context Clustering-Based Radar and Camera Fusion for Three-Dimensional Object Detection


1
School of Electronics and Communication Engineering, Shenzhen Campus of Sun Yat-sen University, Shenzhen 518107, China
2
School of Electronics and Communication Engineering, Sun Yat-sen University, Guangzhou 510275, China
3
Guangdong Laboratory of Artificial Intelligence and Digital Economy (SZ), Shenzhen 518107, China
*
Author to whom correspondence should be addressed.
Remote Sens. 2023, 15(21), 5130; https://doi.org/10.3390/rs15215130
Submission received: 19 September 2023
/
Revised: 21 October 2023
/
Accepted: 23 October 2023
/
Published: 26 October 2023
Abstract
:Multi-modality three-dimensional (3D) object detection is a crucial technology for the safe and effective operation of environment perception systems in autonomous driving. In this study, we propose a method called context clustering-based radar and camera fusion for 3D object detection (ConCs-Fusion) that combines radar and camera sensors at the intermediate fusion level to achieve 3D object detection. We extract features from heterogeneous sensors and input them as feature point sets into the fusion module. Within the fusion module, we utilize context cluster blocks to learn multi-scale features of radar point clouds and images, followed by upsampling and fusion of the feature maps. Then, we leverage a multi-layer perceptron to nonlinearly represent the fused features, reducing the feature dimensionality to improve model inference speed. Within the context cluster block, we aggregate feature points of the same object from different sensors into one cluster based on their similarity. All feature points within the same cluster are then fused into a radar–camera feature fusion point, which is self-adaptively reassigned to the originally extracted feature points from a simplex sensor. Compared to previous methods that only utilize radar as an auxiliary sensor to camera, or vice versa, the ConCs-Fusion method achieves a bidirectional cross-modal fusion between radar and camera. Finally, our extensive experiments on the nuScenes dataset demonstrate that ConCs-Fusion outperforms other methods in terms of 3D object detection performance.
1. Introduction
Just as the environment perception system is of great importance in autonomous driving, so three-dimensional (3D) object detection technology is in this system, because it plays such a crucial role in ensuring the safety of autonomous driving. Three-dimensional object detection encompasses two-dimensional (2D) object detection and additionally provides depth information in the world coordinate system, based on the coordinates and size regression of 2D object detection. Moreover, 2D object detection does not involve orientation-related parameters [1]. Although 2D object detection is well-established, the literature [2,3] has demonstrated that methods achieving excellent results in 2D object detection tasks can experience a drastic drop in performance in 3D object detection. The real-world scenarios for autonomous driving technology involve a 3D environment; thus, 3D object detection is a topic worth exploring in depth. In recent years, deep learning-based visual object detection techniques, such as SSD [4], DETR [5], and Faster R-CNN [6], have been extensively researched and have shown good performance in ideal scenarios. However, in real life, the driving environment is often complex and diverse. Simplex sensors may have insufficient environmental perception capabilities, resulting in poor detection performance and safety risks. In extreme environments, single-modal object detection methods may fail entirely. Therefore, it is necessary to adopt a 3D object detection technology combining information from different types of sensors.
Currently, in environmental perception systems, commonly used sensors include camera, light detection and ranging (LiDAR) [7], and radar [8]. Camera can perceive texture information of the object being detected, making them widely utilized in autonomous driving. However, they are susceptible to environmental factors such as darkness and rainy weather, which can lead to decreased perception capability. In addition, cameras lack the ability to estimate both the velocity and the range of the object. LiDAR can obtain the distance to the object and analyze information from the object’s surface, such as the amount of the reflection energy and amplitude, frequencies, and phases of the reflected spectrum, thereby presenting the 3D structural information of the target. However, LiDAR is expensive and its performance is easily affected by weather conditions. Radar, on the other hand, can adapt to various complex weather conditions and still work properly. The characteristics of these sensors are shown in Table 1 [1,7,8].
In real-world scenarios, a simplex sensor cannot provide sufficient information, which is why there is a growing interest in multi-modal fusion methods for object detection. In particular, the combination of radar and camera in a environment perception system has become a topic of interest. This is because it offers not only an affordable solution, but also enhances our understanding of various scenes by leveraging the complementary strengths of radar and camera. Additionally, when one sensor fails, the other can continue to work, thereby improving the robustness and safety of autonomous driving.
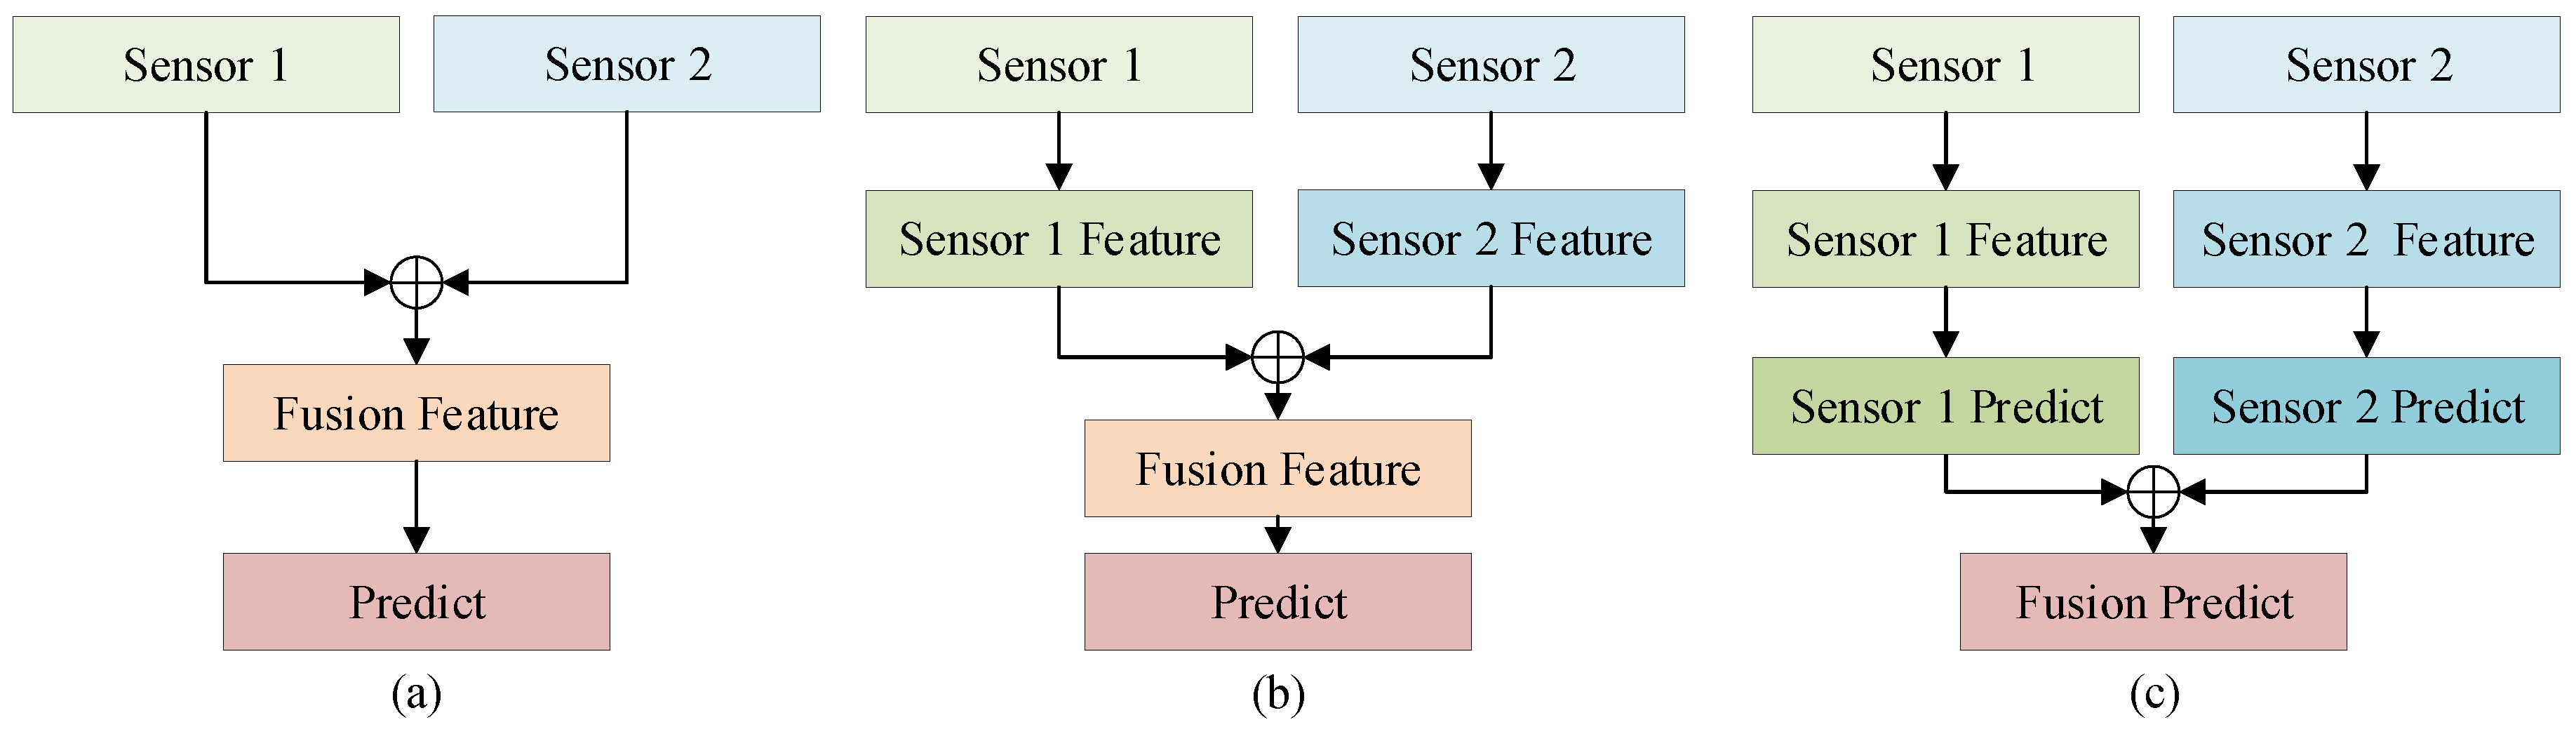
Currently, there are three main approaches for multi-modal fusion: early fusion (data-level) methods [9], intermediate fusion (feature-level) methods [10,11,12,13], and late fusion (decision-level) methods [14,15], as shown in Figure 1.
The early fusion-based method maximally preserves the original information but has high computational complexity, low fault tolerance, and difficulty in fusion. The late fusion-based method adopts different decision methods in different application scenarios, providing higher flexibility. However, the late fusion-based method loses a large amount of raw data information and requires establishing mapping relationships between detection results of the object from different sensors. When there are significant differences in the detection results, the fusion result will be greatly affected. The intermediate fusion-based method, which combines maximum preservation of primary information with reduced computational complexity, will be used in this study, along with the deep learning method [16], to achieve better 3D object detection.
Integrating radar and camera in 3D object detection can enhance the ability to perceive the surrounding environment of the vehicle. However, there are often challenges in processing features from different modalities.
In the literature on CenterNet [17], a framework was introduced for anchor-free 3D object detection based on monocular camera. In this framework, the object is equated to the center of the bounding box and its other properties, such as object size, dimension, 3D extent, and so on, can be regressed from image features at the center location. The object detection then becomes a standard keypoint estimation problem. The CenterNet object detector uses a fully convolutional network to obtain a heatmap of the camera image, with the peak of this heatmap being the center of the object. In general, it has the advantage of being simple and end-to-end differentiable. In reference [12], CenterFusion was introduced as an intermediate-fusion method for 3D object detection using radar and camera data. This method addresses the height information gap in radar by pillar expansion and associates radar point clouds with image data detection results through frustum association to generate radar feature maps. Finally, the image and radar features are concatenated for 3D object detection. Both of these methods lack mutual assistance between the radar and camera, and the fused features lack the contextual relationship between the images and radar point clouds.
To address the above-mentioned issues, the ConCs-Fusion network is proposed for 3D object detection in this study. The deep layer aggregation (DLA) [17,18] is used to extract feature maps from the images. The radar feature extractor employs a frustum-association method [12] to obtain radar features. Subsequently, the features from both modalities are fused together by the fusion module. The fusion module consists of multiple context cluster blocks, which are responsible for facilitating the mutual assistance and fusion of radar and camera features, aiming to achieve a more robust fusion feature representation.
In conclusion, here are the main findings and contributions in this article:
- (1)
- We propose a ConCs-Fusion network that leverages a fusion module to aggregate and redistribute features, enabling mutual assistance between the radar and camera.
- (2)
- In the fusion module, we employ transposed convolution to learn different scale features from context cluster blocks, and fuse the output features through concatenation. We then utilize the nonlinear representation capability of multi-layer perceptron (MLP) to reduce the dimensionality of fused features, thereby improving the computational efficiency of the model.
- (3)
- Extensive experiments are conducted on the nuScenes dataset and the mini_nuScenes dataset. The results on the nuScenes dataset show that our method relatively improves the nuScenes detection score (NDS) [19] by 16.97%, 26.39%, and 1.34%, compared to CenterNet, QD_3DT [20], and CenterFusion, respectively. It also relatively reduces the mean average orientation error (mAOE) by 25.29%, 3.56%, and 12.94%, compared to these methods, respectively. The experimental results demonstrate that the proposed method effectively integrates multi-modal data at the intermediate level and improves 3D object detection performance.
2. Related Works
Three-dimensional object detection refers to the task of detecting and recognizing objects in a 3D scene and estimating their relevant parameters. This information is crucial for applications such as autonomous driving and intelligent robots [21,22]. In Section 2.1, we will discuss the 3D object detection methods using camera, LiDAR, and radar separately. In Section 2.2, we will focus on multi-modal 3D object detection methods, including camera–LiDAR fusion, radar–LiDAR fusion, and radar–camera fusion.
2.1. Single-Modality 3D Object Detection Methods
2.1.1. Methods Based on Camera
Camera-based 3D object detection typically involves performing two-dimensional object detection on images and then extending the results to 3D using techniques [23]. FCOS3D [24] has been designed as a fully convolutional single-stage 3D detection method that does not require prior two-dimensional information. Firstly, it transforms commonly used seven-degree-of-freedom 3D objects into the image domain, decoupling them into two-dimensional and 3D attributes to adapt to the 3D setting. Then, the objects are assigned to different feature layers based on their two-dimensional scales, and are further assigned based on the projected 3D centers. The paper SMOKE [25] developed the idea of keypoints in CenterNet and it believes that the existence of the two-dimensional detection module will only add unnecessary noise. Therefore, it just keeps the 3D detection module. Since the two-dimensional detection module is discarded, this method does not rely on two-dimensional proposals to estimate 3D information. Instead, it proposes a new method that combines single keypoint estimation with regression of 3D variables to predict the three-dimensional bounding boxes of each detected object. Additionally, to improve the convergence of the model and the accuracy of object detection during training, SMOKE utilizes a method called multi-step disentanglement. Keypoint3D [26] proposed an anchor-free, keypoint-based 3D object detector, which projects the geometric center point of the 3D object onto a two-dimensional plane and treats the projected point as a keypoint. It also employs an adaptive ellipse Gaussian filter on the heatmap to accurately locate the keypoints. Currently, one of its disadvantages is that camera images lack precise depth information of the objects, often requiring passive recovery of the object depth information from two-dimensional images. Moreover, the passive imaging nature of cameras limits the applicability of image-based methods due to sensitivity to lighting and weather conditions.
2.1.2. Methods Based on LiDAR
The 3D object detection based on LiDAR relies on emitting laser beams onto objects and estimating the relevant parameters by receiving the reflected laser beams. In the literature, PointNet [27] and PointNet++ [28] were proposed, using 3D point cloud data as input with invariant input order. Building upon the research of PointNet++, PointRCNN [29] introduced a two-stage 3D object detection network. The first stage, bottom-up 3D proposal generation, performs semantic segmentation on the raw point cloud in the scene and generates 3D proposals. The second stage, canonical 3D box refinement, focuses on optimizing and refining the 3D bounding boxes to produce more accurate 3D object detection results. Meanwhile, InfoFocus [30] extracts feature maps from the raw point clouds using the pillar feature network and deep convolution neural network. It mainly consists of point-of-interest pooling, the visibility attentive module, and the adaptive pointwise attention. The LiDAR scanning speed is slower. Therefore, during the scanning process, the movement of the objects can pose challenges in data association. Additionally, LiDAR is susceptible to weather interference and is expensive.
2.1.3. Methods Based on Radar
The working principle of radar is to transmit signals and receive and process the signals reflected back from the target, in order to estimate parameters such as distance and velocity of the target [31]. We commonly use millimeter-wave radar, which is cheaper compared to LiDAR; can work in harsh weather conditions, such as rain, snow, dust, and fog; and is not sensitive to lighting conditions. However, radar has a high false alarm probability and the echo signals contain a lot of noise, making it difficult to achieve 3D object detection using sparse two-dimensional radar point cloud data. Radar-PointGNN [32] has been proposed as a feasible method based on graph neural networks, claiming to be the first to use radar point clouds for object detection in the nuScenes dataset. As for the method in the literature [33], it abandoned the use of radar point cloud data and used instead the raw radar tensor data to accomplish 3D object detection through graph neural network. Since radar can hardly provide texture and height information of the targets, it is usually necessary to put it in collaboration with other sensors to obtain better 3D object detection results.
2.2. Multi-Modality 3D Object Detection Methods
2.2.1. Methods Based on the Fusion of Radar and LiDAR
RadarNet [34] has been introduced as a voxel-based early fusion and attention-based late fusion method, which improves performance by utilizing both the geometric data and dynamic information of radar. By performing voxel-based early fusion, RadarNet combines radar and lidar data to take advantage of radar’s long sensing range. Then, through attention-based late fusion, radar data are further integrated for the use of their velocity readings. Sparse-PointNet [35] improves long-range object detection in 3D object detection by utilizing sparse radar point clouds. Furthermore, MVDNet [36] proposed a self-attention mechanism for the fusion of radar and LiDAR in 3D object detection, which enhances vehicle detection performance in foggy conditions by combining complementary information from both sensors. ST-MVDNet [37] had considered the situation of sensor failure. Therefore, it introduced a self-training framework on top of MVDNet for strong data augmentation of radar and LiDAR, which in return and ultimately enables ST-MVDNet to provide detection results, even when a sensor is unavailable or missing.
2.2.2. Methods Based on the Fusion of LiDAR and Camera
Camera can provide direct visual information and rich semantic features, while LiDAR provides rich 3D structural information. MV3D [38] has been presented as a multi-view 3D object detection network for 3D object detection in autonomous driving. It extracts features from the bird’s eye view (BEV) of LiDAR, the front view of LiDAR, and the RGB image from the camera using the VGG [39] network. Next, it generates 3D object proposals from the BEV and then projects them back onto those previous three views (LiDAR bird’s eye view, LiDAR front view, and RGB image). After that, MV3D fuses the region-wise features obtained from RoI pooling of each view to predict the detection results. The network structure of AVOD [40] is similar to that of MV3D, but the former only takes BEV and RGB images as input into the network. AVOD utilizes an improved FPN [41] to extract high-resolution feature maps from BEV and the image, and then uses a region proposal network on these feature maps to obtain high-recall region proposals. The optimal proposals are projected back onto the feature maps of those two branches, which are subsequently fused to obtain the final 3D object detection result. Incidentally, the expensive price of LiDAR limits its application in engineering projects.
2.2.3. Methods Based on the Fusion of Radar and Camera
Radar and camera have strong complementarity, which can effectively enhance the perception ability of vehicles in complex scenarios. Camera can provide appearance information of targets, whereas radar can provide parameters such as distance and velocity of targets, and is less affected by extreme weather conditions. RADIANT [2] is a 3D object detection method based on the FCOS3D framework, which addresses the problem of radar–camera association. It can predict the 3D offset between radar data and the center point of the real object. These offsets are then associated with the image detector to enhance the accuracy of object’s depth estimation. In the literature [42], the authors propose to use range and Doppler point cloud data as additional input, which is then processed by ResNet for feature extraction. Afterwards, these features are fused with the RGB image from the camera via concatenation. The authors of this paper established their own dataset and automatically labeled it by combining detections from multiple monocular cameras along with existing detectors. Thanks to cameras with different focal lengths, distant objects can be labeled and converted into canonical images. RVNet [43] is a single-shot object detection network based on YOLOv3 [44], and it projects radar point clouds onto the image plane of the camera to generate a “sparse radar image” that contains information about depth, lateral velocity, and longitudinal velocity. Specifically, RVNet has two separate input branches, respectively, for the monocular camera and the radar features, and two output branches, respectively, for small obstacles and big obstacles. To perform robust detection results, GRIF-Net [45] has been designed as a low-level sensor fusion detector, which combines two regions of interest from radar and camera feature maps through a gated RoI fusion (GRIF). To make better use of the sparse radar point cloud, the designed GRIF especially adopts an explicit gating mechanism to adaptively select the appropriate data when either the radar or camera sensor is abnormal. However, there is currently little research that considers the mutual assistance between radar and camera, which leads to insufficient utilization of information from heterogeneous sensors and insufficient fusion capacity of features. In addition, the context relationship between the features of these two modalities is often ignored during the fusion process. To address the mentioned issues, this paper designs a ConCs-Fusion network for 3D object detection based on context clustering, which fully utilizes the complementary information between the two modalities and effectively enhances the 3D object detection performance of radar-camera mutual assistance.
3. Methods
In this section, we will concentrate on the ConCs-Fusion network structure and loss function. The overall network architecture and detailed modules will be explained in Section 3.1, Section 3.2, Section 3.3 and Section 3.4, while in Section 3.5 we will discuss the loss function used in this study.
3.1. The Overall Architecture of ConCs-Fusion Network
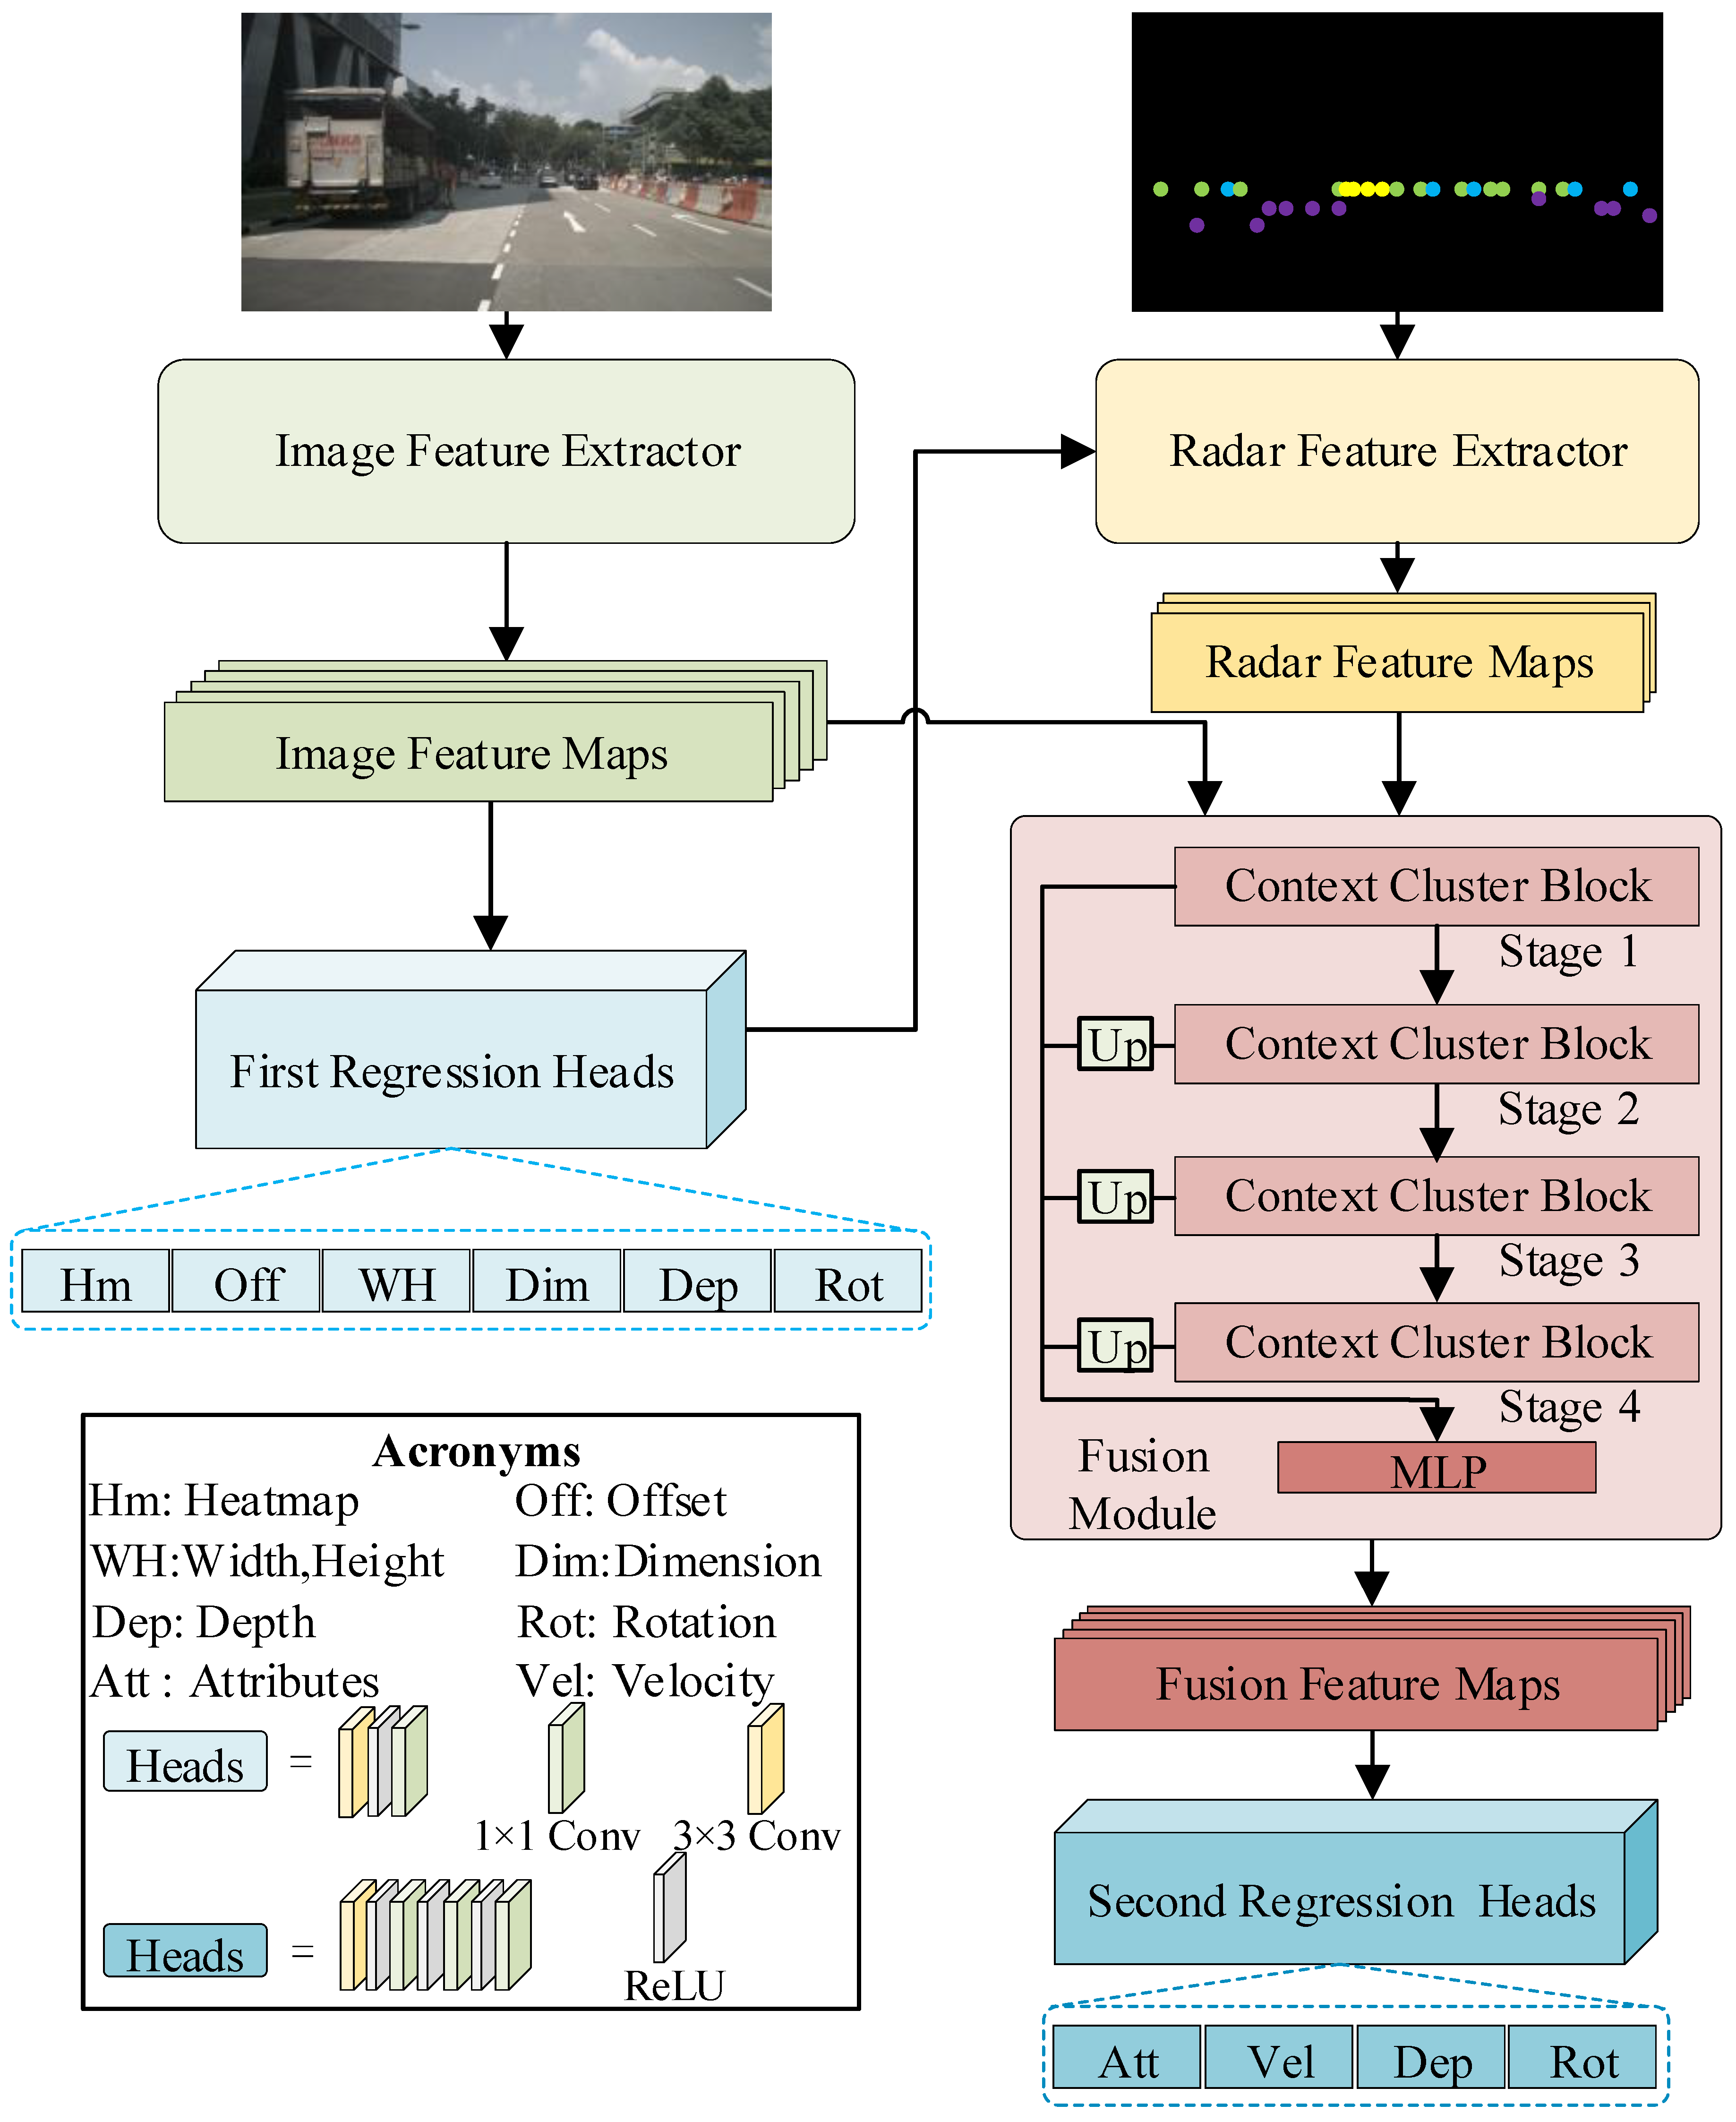
In this study, a ConCs-Fusion network model is designed, mainly containing of an image feature extractor, a radar feature extractor, and a fusion module. The image feature extractor utilizes DLA to extract features from the images and uses multiple regression heads to predict information of the objects, including rotation, offset, width, depth, height, and the keypoint heatmap. The radar feature extractor employs a frustum association method to apply pillar expansion to the radar point cloud, and it associates the information predicted from the images with the radar information to obtain radar features. The fusion module combines the radar features and image features to achieve mutual assistance between the two modal data and uses multiple regression heads to predict the 3D information of the objects. The overall network framework is shown in Figure 2.
In the fusion module of the ConCs-Fusion network, the context cluster blocks are used to learn multi-scale features of the radar point cloud and images. Then, the features of different sizes outputted by the context cluster blocks are fused through transposed convolutions. The fused features are then nonlinearly represented using MLP to reduce the feature dimension, aiming to improve the model’s inference speed.
3.2. The Image Feature Extractor
In this article, we have applied the concept of CenterNet to extract features from images.The concept of CenterNet is to predict the center point of objects. The image feature extractor is trained on input image to predict its keypoint heatmap, and the output keypoint heatmap can be represented as , where W is for width, H for height, R for the output stride downsampling ratio, and C for the number of the channels to predict the center points of objects in C classes. When the output prediction is , it indicates the detection of the object’s keypoint; when the prediction is , namely the background, it indicates that the pixel does not belong to any object in class c. During the network training process, we have employed the focal loss function [46] for the keypoint heatmap.
where N is the number of key points in the image; and are hyperparameters, whose values are set to 2 and 4, respectively; is the ground-truth heatmap generated by the object.
Among the different backbone network structures provided by CenterNet, one of them is the DLA, which is efficient and suitable for extracting features from images. The original DLA structure is shown in Figure 3. DLA has fewer parameters and uses iterative deep aggregation to improve the resolution of feature maps. This allows it to effectively capture feature information from objects of different sizes in the image, thereby improving the detection performance of the network. The structure of DLA consists of multiple convolutional blocks, which are aggregated hierarchically and iteratively on several levels. The feature iteration helps to learn spatial features of the objects, while the feature aggregation enhances semantic learning and also ensures efficient gradient propagation to avoid the problem of vanishing gradients. It is worth noting that in this paper, we go along with CenterNet and use the DLA structure of the improved version that CenterNet offers, which incorporates deformable convolution [47,48] and more skip connections. The deformable convolution mentioned above improves the network’s ability to adapt to geometric variations of the object, as well as its ability to focus on pertinent image regions.
3.3. The Radar Feature Extractor
A frustum association method is employed to associate the target information detected by the radar and predicted by the image feature, as shown in Figure 4. Radar points are projected onto the image coordinate system and expanded into radar pillars using pillar expansion. This compensates for the lack of height information in the radar. The radar feature maps are then extracted from the the associated results using the formula as below
The formula takes into account the feature map channel , a normalizing factor and the feature value . Moreover, and are the coordinates of the jth object’s center point on the image; and are the width and height of the jth object’s the two-dimensional bounding boxes. The parameter controls the width and height of the heat map, and it is proportional to the two-dimensional bounding boxes of the object. If two objects share some heatmap areas, the one with the smaller depth value is selected.
3.4. Fusion Module
In the fusion module designed in this paper, the first step is to achieve bidirectional assistance between radar and camera through multi-scale context cluster blocks. Then, the different scale features outputted by the context cluster blocks are learned using transposed convolution, and these features are fused by concatenation. Finally, the fused features are subjected to a nonlinear transformation through MLP to reduce the feature dimension and improve the model’s representation and generalization ability for the fused features. The structure of the fusion module is shown in Figure 5.
The context cluster block consists of two main parts, namely the point reducer for learning low-dimensional feature representation and the cluster block for learning the contextual relationship between features, as shown in Figure 6. The point reducer mainly contains a convolutional layer, which reduces the number of feature points through convolution to improve the speed of model computation, and then the processed feature points are passed to the cluster block. The cluster block mainly consists of a group normalization layer, a cluster layer, and an MLP layer. The group normalization layer normalizes the feature channels to improve the model’s generalization ability. The cluster layer is composed of feature aggregating and feature dispatching and it enables mutual assistance between radar and camera. The main purpose of the MLP is to transform the number of feature channels to achieve channel alignment for skip connections.
In the cluster layer, the radar features and image features are treated as a set of points , where and d represents the feature dimension. We linearly project the feature point set to obtain the projected feature point set , which is then used to calculate the similarity between features. We define k center points in the feature space and calculate the cosine similarity between and each center point. Based on the similarity, the feature points are assigned to the most similar center point, generating a total of k clusters.
Feature aggregating is the dynamic aggregation of all feature points within a cluster based on similarity. Assuming a cluster contains q feature points (a subset of ) with a similarity of to the center point, these q feature points are mapped to the corresponding value space , where is the dimension of the value space.
Finally, by obtaining a value space center in the value space, all elements in the value space are aggregated to obtain the radar–camera fusion feature point , which, within each cluster, represents the aggregation of radar and camera features from the same object. This is shown in Figure 7a.
where and are learnable scalars used for scaling and shifting. is a sigmoid activation function used to scale the similarity between features to the range (). represents the feature point i in , and the feature factor G is introduced to normalize the features.
Based on their similarity, we adaptively allocate radar–camera fusion feature point to original feature points in the cluster, and this process is called feature dispatching, as shown in Figure 7b. The updated feature points can be represented as
The above equation is similar to formula (2) and uses the same similarity calculation scheme. Then, a fully connected (FC) layer is utilized to match the feature dimensions, mapping from the value space to the original space d.
This process enables communication between feature points, as shown in Figure 7c, where original points receive fused feature points from the same object across heterogeneous sensors, achieving mutual assistance between radar and camera.
3.5. Loss Functions
In this paper, we calculate the corresponding loss function for the predictions generated by different regression heads to measure the difference between the predictions and the true values. By computing these loss functions, we can propagate the gradients of the network parameters and update the weights to better train the network. To effectively handle the issue of class imbalance in object detection tasks, in the head of keypoint heatmap, we use focal loss [46], whose hyperparameters are set the same as CenterNet. For the regression head of object attributes, we use binary cross-entropy (BCE) loss. We combine BCE loss and L1 loss for the rotation regression head’s loss function. For the other heads, we use L1 loss. The overall loss function is the sum of the losses from all regression heads.
4. Results
We have evaluated our ConCs-Fusion network on the nuScenes dataset. In Section 4.1, we will provide detailed information about the implementation of our experiments. In Section 4.2, we will compare our method with other 3D object detection methods. In Section 4.3, we will explain the conducted ablation studies to demonstrate the effectiveness and robustness of our approach.
4.1. Experimental Setup
4.1.1. Dataset
nuScenes [19] is a dataset that consists of complex, diverse, and large-scale driving scenes, aiming to advance the development of autonomous driving technology. It includes a full dataset and a mini dataset to cater to the needs of different researchers. Also, it has 1000 driving scenes collected in Boston and Singapore, both known for their complex road traffic and challenging driving environments. The sensor data in the dataset include point clouds from LiDAR, images from cameras, and point clouds from millimeter-wave radar. The distribution of different types of sensors in the nuScenes dataset is shown in Figure 8.
4.1.2. Evaluation Metrics
The nuScenes detection task requires the detection of 10 object classes using 3D bounding boxes, attributes, and velocities. To evaluate the detection accuracy, we use the average precision (AP) metric and set a match by thresholding the two-dimensional center distance on the ground plane. The mean average precision (mAP) can be expressed as
where represents the number of predicted classes and represents the distance threshold between the predicted bounding box and the center point. In this study, we set the threshold as meters.
We have computed the following five true positive (TP) metrics, namely average translation error (ATE), average scale error (ASE), average orientation error (AOE), average velocity error (AVE), and average attribute error (AAE). Based on these metrics, we have calculated the mTP for all classes.
NDS is the most important and decisive evaluation metric for the nuScenes dataset. The NDS metric effectively reflects various aspects of the detection task, such as velocity and attribute estimation. It can be represented as
where represents the set of the five mean TP metrics.
4.1.3. Implementation Details
The nuScenes dataset provides a large amount of data in various complex scenarios. The dataset is divided into training datasets (168,780 samples), validation datasets (36,114 samples), and test datasets (36,048 samples). Additionally, to assess the generalization capability of our model, we conducted experiments on the official mini_nuScenes dataset, which consists of 1938 training samples and 486 validation samples.
For our experiments, we utilized the Pytorch 1.7, CUDA 11.0, and CUDNN 8.0. During the training phase, we employed an NVIDIA A100 PCIe 80 GB GPU and adjust the model parameters using the Adam optimizer. CenterNet provides a detailed analysis of the differences between various backbone network models. Considering both the performance and model training time, we chose a balanced DLA structure and used its pretrained model, which had been trained for 140 epochs on the nuScenes dataset. Moreover, 30 epochs were trained additionally to obtain predictions of attributes and velocity. We trained the model for 60 epochs by implementing different augmentation strategies, including random right–left flipping and random shifting, with a probability of 0.5 for flipping and 0.1 for shifting. The initial learning rate was set to , and the learning rate was decayed to 10% of its original value at the 30th epoch. The batch size was set to 48. During the testing phase, we only employed flipping augmentation and a single NVIDIA GeForce RTX 3090 24G GPU.
4.2. Detection Performance Evaluation
We compared our ConCs-Fusion method with several other methods, including InfoFocus [30] and BirdNet+ [49] which are based on laser radar, CenterNet [17], QD_3DT [20], and FCOS3D [24] which are based on cameras; and CenterFusion [12], which is a camera–radar-based method. The results are shown in Table 2.
On the test dataset, ConCs-Fusion demonstrates a significant improvement in the NDS metric compared to InfoFocus and BirdNet+. Specifically, there is a relative improvement of 15.19% and 53.72% respectively. When compared to CenterNet, QD_3DT, and FCOS3D, ConCs-Fusion achieves relative improvements of 16.97%, 26.39%, and 6.31% in the NDS metric. Similarly, compared to the camera-radar-based CenterFusion, ConCs-Fusion shows a relative improvement of 1.34% in the NDS metric.
Moving on to the validation dataset, ConCs-Fusion also exhibits positive results. It shows a relative improvement of 17.31% and 2.95% in the NDS metric when compared to CenterNet and CenterFusion, respectively. Moreover, on the mini_nuScenes validation dataset, ConCs-Fusion achieves relative improvements of 22.60% and 5.60% in the NDS metric compared to CenterNet and CenterFusion, respectively.
Additionally, ConCs-Fusion showcases improvements in the mAP metric to varying degrees. It outperforms other methods in terms of translation, orientation, velocity, and attribute error metrics. Particularly, in terms of orientation error metrics, ConCs-Fusion demonstrates a notable relative increase of 60.47% on the test set compared to InfoFocus, 24.51% on the validation set compared to CenterNet, and 17.36% compared to CenterFusion. On the mini_nuScenes dataset, ConCs-Fusion achieves a relative increase of 23.49% compared to CenterNet and 9.93% compared to CenterFusion.
The experimental results on nuScenes and mini_nuScenes datasets demonstrate that ConCs-Fusion, through the mutual assistance of radar and camera, can improve the performance of 3D object detection. Additionally, the similar NDS values on the test and validation datasets indicate that our method has good generalization ability.
Table 3 describes the mAP values of ConCs-Fusion, CenterNet, and CenterFusion methods for 10 different classes of object detection in nuScenes. The results show that our method improves the mAP values to varying degrees compared to the three methods mentioned above. Compared to CenterNet and CenterFusion, our method shows improvements in eight classes on the validation set. The most significant improvements are observed in the “car” and “motorcycle” classes, with an absolute increase of 3% (compared to CenterNet) and 1.4% (compared to CenterFusion) for “car”, and an absolute increase of 4.4% and 2.7% for “motorcycle”, respectively. On the mini_nuScenes dataset, the largest improvement is observed in the “bus” class, with differences of 5.9% and 1.9%, respectively.
The precision–recall (P-R) curve is an intuitive evaluation metric. Precision represents the probability of correctly predicted positive samples out of all predicted positive samples, calculated as
where TP denotes true positives, FP denotes false positives, and FN denotes false negatives.
Recall represents the probability of predicted positive samples out of all actual positive samples, calculated as
We have plotted the P-R curves for ConCs-Fusion, CenterNet, and CenterFusion on four classes. As shown in Figure 9, the P-R curves of the ConCs-Fusion network outperform those of the CenterNet and CenterFusion methods at four different thresholds.
4.3. Ablation Studies
We conducted ablation studies on the nuScenes test set, as shown in Table 4. In this section, we performed four experiments to investigate the impact of different upsampling methods and the use of MLP. We used CenterNet as the baseline method and study the effects of linear interpolation, transposed convolution, and MLP on the detection results. Table 4 shows the detection results of the ablation studies. Compared to the baseline, using linear interpolation to upsample the features in the first experiment resulted in a relative improvement of 5.57% on the NDS metric. In the second experiment, adding MLP layers on top of the previous experiment led to a definite improvement of 0.8%. In the third experiment, we employed transposed convolution, and the result shows a relative increase of 15.59% on the NDS metric. In the fourth experiment, we combined the transposed convolution from the third experiment with MLP, resulting in a relative improvement of 16.88% on the NDS metric and an absolute improvement of 1.10% on the mAP.
Figure 10 shows the mAP of the ablation studies for each class. The results indicate that using transposed convolution for upsampling and combining it with MLP to reduce dimensionality of the fused features can effectively improve the mAP for multiple classes.
5. Qualitative Result and Discussion
In this section, we present 3D object detection results and BEV plots in different real-world scenarios, which are from the nuScenes dataset, and compare our model with other methods.
5.1. Results of 3D Object Detection
Figure 11 shows the 3D object detection results in different scenes, providing a clear comparison of the detection performance between our method and the other methods. From these images of complex scenes, it can be observed that the ConCs-Fusion network is able to detect small objects at distant ranges and even occluded objects, thanks to the mutual assistance between radar and camera, which reduces missed detections. The missed detections are highlighted with yellow circles in the pictures. The visualized results demonstrate that our network effectively improves the performance of 3D object detection.
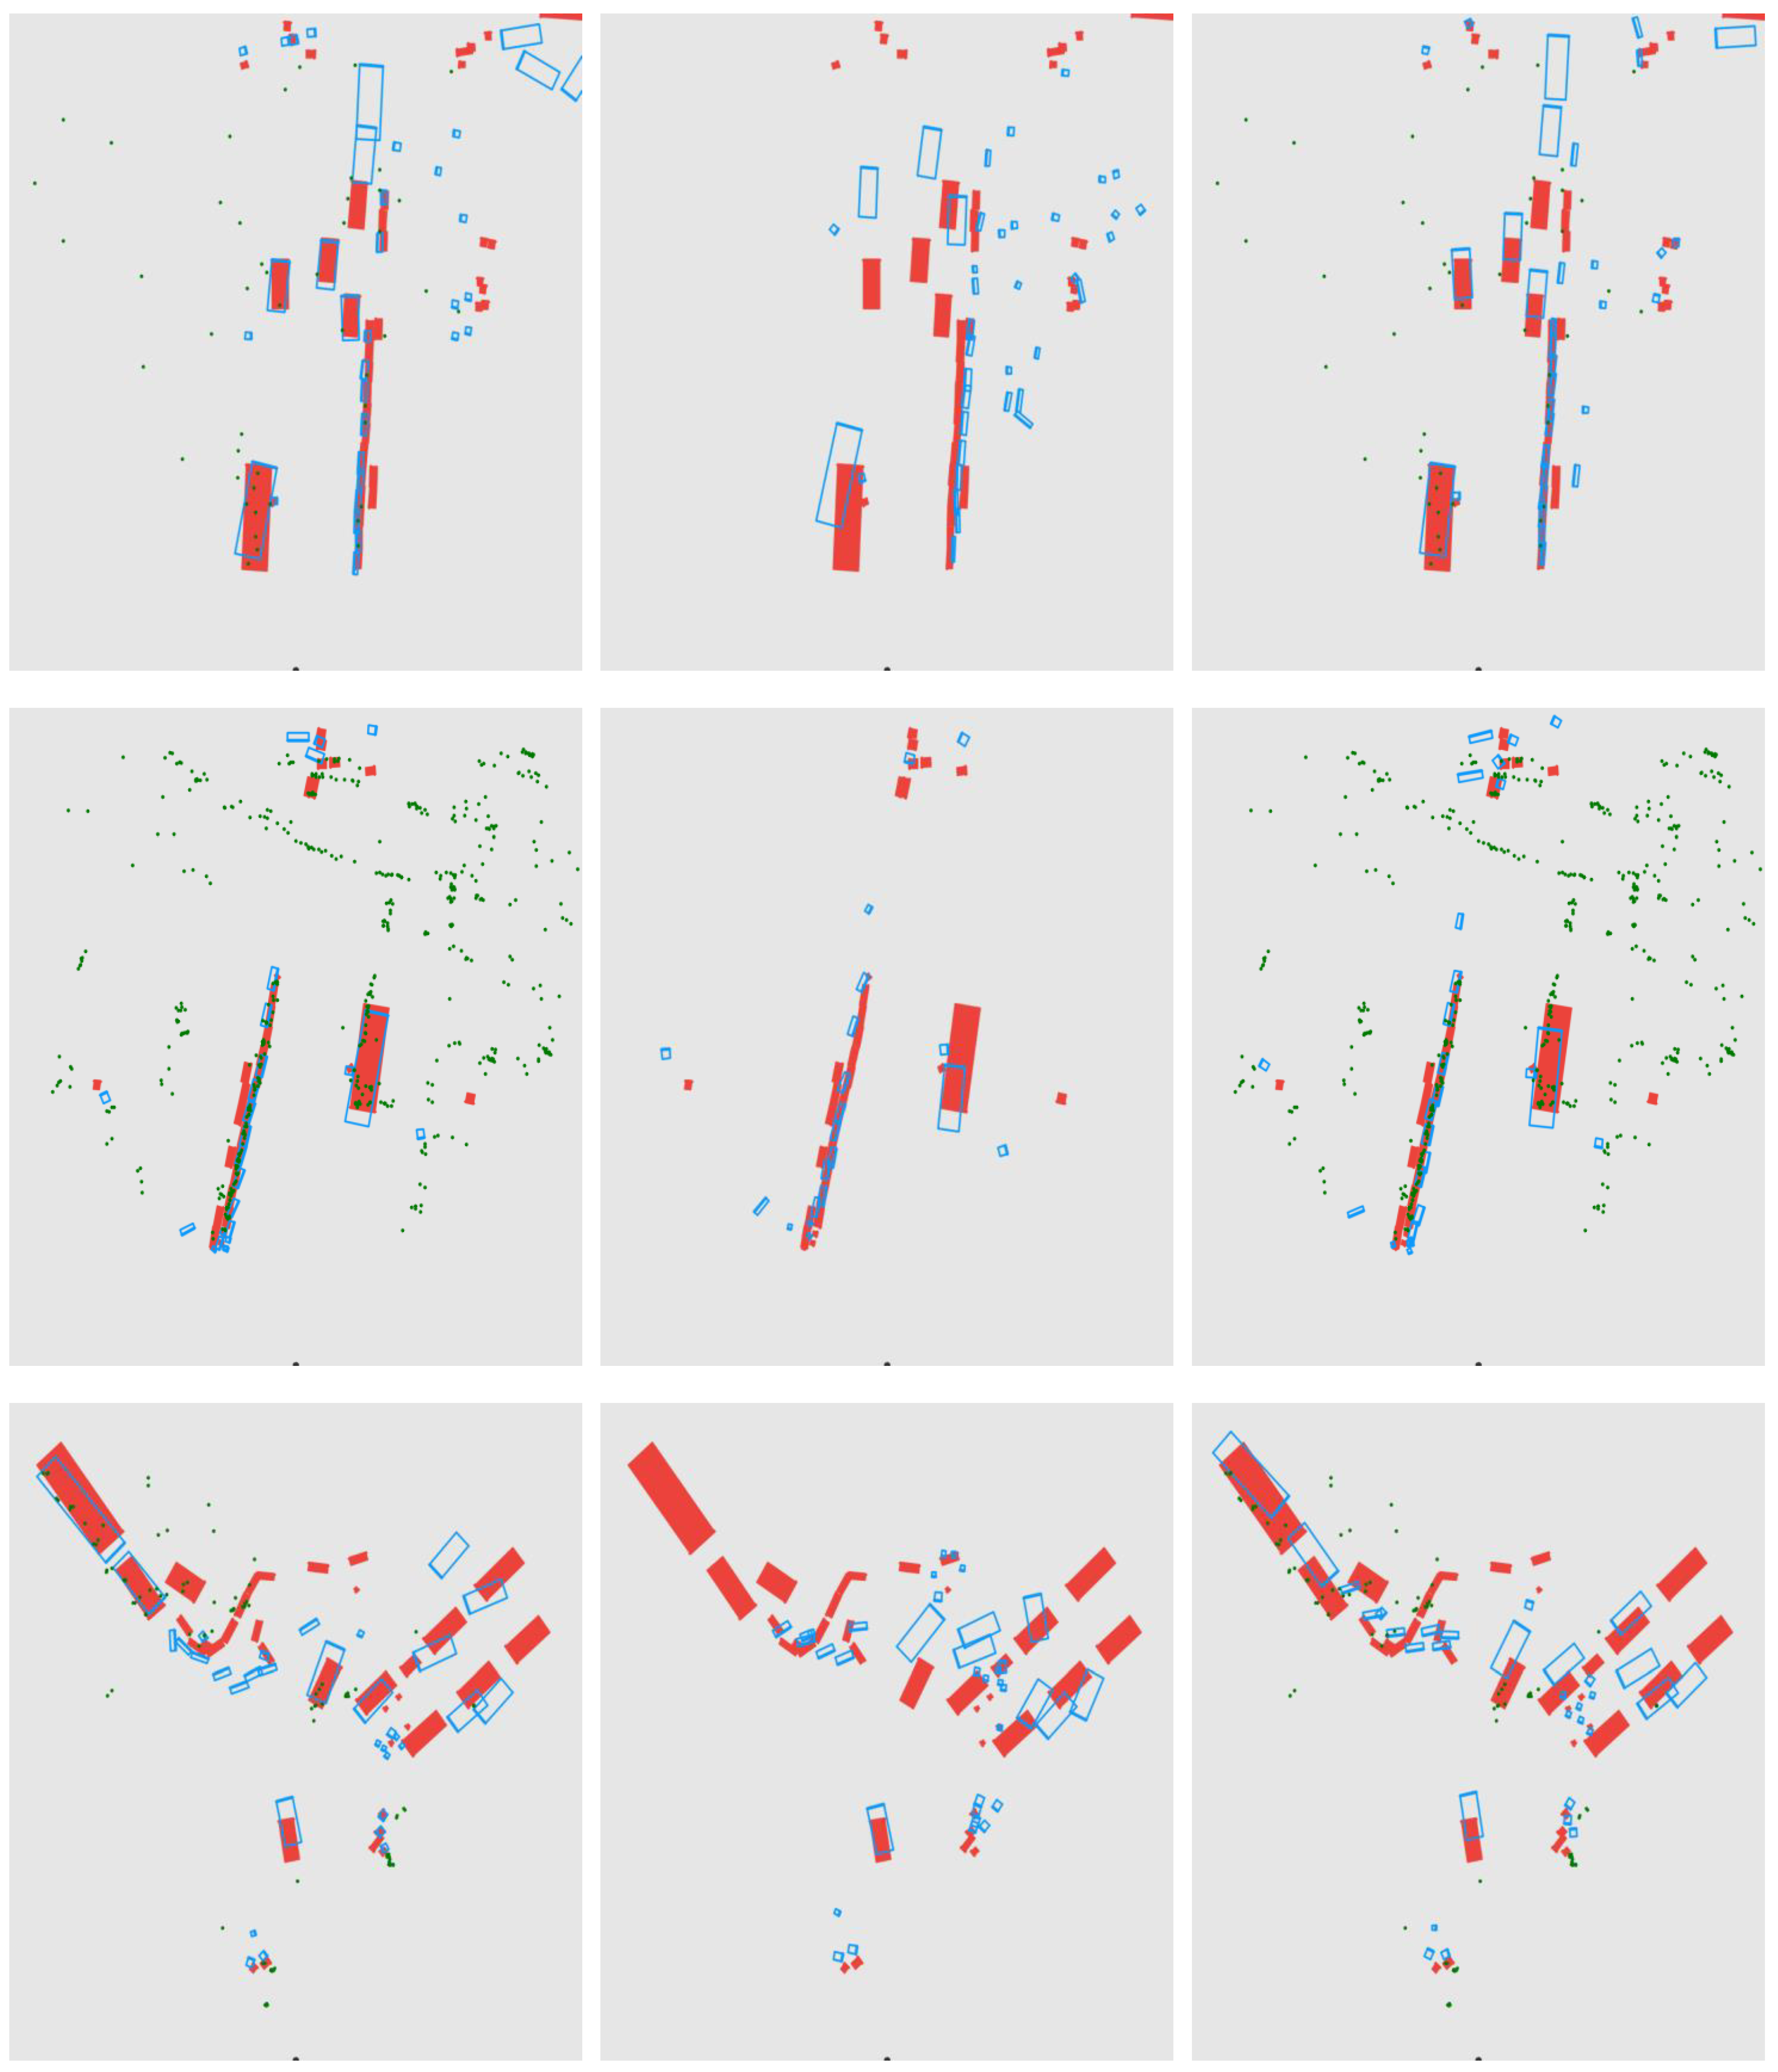
5.2. BEV Results with Object Detection
Figure 12 shows the BEV results. The first column shows the results of our ConCs-Fusion network, the second column shows CenterNet, and the third column shows CenterFusion. Our proposed method achieves more accurate estimation of distant objects and their orientation in the BEV perspective. This further confirms that the ConCs-Fusion network, through the mutual assistance of radar and camera, provides more robust detection results for environment perception systems.
6. Conclusions
In the task of object detection for autonomous driving, the combination of radar point clouds and camera images is a common approach. However, existing research mostly focuses on one-way sensor assistance, with little consideration given to the mutual assistance between different types of sensors. This paper proposes a ConCs-Fusion network that leverages the bidirectional assistance between the radar and camera for 3D object detection, effectively utilizing the information from both radar point clouds and images. In the fusion module, we treat the extracted heterogeneous sensor features as point sets, where the radar feature points and image feature points of the same object are clustered together. Within each cluster block, all the feature points are fused into a radar–camera feature fusion point, which is then assigned to the original feature points. This convenient information update method enables bidirectional cross-modal fusion of heterogeneous sensors. It is worth noting that extensive experiments were conducted on the nuScenes dataset and mini_nuScenes dataset in this paper. We compared our method with six different approaches, including both single-modal and multi-modal methods, and regarding the evaluation metrics NDS, mAOE, and mAVE, significant improvements have been made by our method. The experimental results demonstrate that the ConCs-Fusion network effectively leverages the information from different modalities to perform the bidirectional assistance, significantly improving the effectiveness of 3D object detection.
Author Contributions
Conceptualization, W.H.; methodology, W.H.; software, W.H.; validation, W.H.; formal analysis, W.H. and Y.Y.; writing—original draft preparation, W.H.; writing—review and editing, W.H., Y.Y., P.P. and Z.D.; visualization, W.H., Y.Y. and P.P.; supervision, Z.D.; funding acquisition, Z.D. All authors have read and agreed to the published version of the manuscript.
Funding
The research was supported in part by the Science, Technology and Innovation Commission of Shenzhen Municipality under Grant JCYJ20210324120002007, in part by the Science and Technology Planning Project of Key Laboratory of Advanced IntelliSense Technology, Guangdong Science and Technology Department under Grant 2019B121203006.
Data Availability Statement
The dataset generated and analyzed during the current study is available in the nuScenes repository. Available online: https://www.nuscenes.org/nuscenes (accessed on 9 March 2023).
Conflicts of Interest
The authors declare no conflict of interest.
References
- Tang, Y.; He, H.; Wang, Y.; Mao, Z.; Wang, H. Multi-modality 3D object detection in autonomous driving: A review. Neurocomputing 2023, 553, 126587. [Google Scholar] [CrossRef]
- Long, Y.; Kumar, A.; Morris, D.; Liu, X.; Castro, M.; Chakravarty, P. RADIANT: Radar-Image Association Network for 3D Object Detection. Proc. AAAI Conf. Artif. Intell. 2023, 37, 1808–1816. [Google Scholar] [CrossRef]
- Park, D.; Ambruş, R.; Guizilini, V.; Li, J.; Gaidon, A. Is Pseudo-Lidar needed for Monocular 3D Object detection? In Proceedings of the 2021 IEEE/CVF International Conference on Computer Vision (ICCV), Montreal, BC, Canada, 11–17 October 2021; pp. 3122–3132. [Google Scholar] [CrossRef]
- Huo, B.; Li, C.; Zhang, J.; Xue, Y.; Lin, Z. SAFF-SSD: Self-Attention Combined Feature Fusion-Based SSD for Small Object Detection in Remote Sensing. Remote Sens. 2023, 15, 3027. [Google Scholar] [CrossRef]
- Carion, N.; Massa, F.; Synnaeve, G.; Usunier, N.; Kirillov, A.; Zagoruyko, S. End-to-End Object Detection with Transformers. Comput. Vis. ECCV 2020 2020, 12346, 213–229. [Google Scholar] [CrossRef]
- Ren, S.; He, K.; Girshick, R.; Sun, J. Faster R-CNN: Towards Real-Time Object Detection with Region Proposal Networks. IEEE Trans. Pattern Anal. Mach. Intell. 2017, 39, 1137–1149. [Google Scholar] [CrossRef] [PubMed]
- Elaksher, A.; Ali, T.; Alharthy, A. A Quantitative Assessment of LIDAR Data Accuracy. Remote Sens. 2023, 15, 442. [Google Scholar] [CrossRef]
- Wei, Z.; Zhang, F.; Chang, S.; Liu, Y.; Wu, H.; Feng, Z. MmWave Radar and Vision Fusion for Object Detection in Autonomous Driving: A Review. Sensors 2022, 22, 2542. [Google Scholar] [CrossRef] [PubMed]
- Bi, X.; Tan, B.; Xu, Z.; Huang, L. A New Method of Target Detection Based on Autonomous Radar and Camera Data Fusion; Technical report; SAE Technical Paper; SAE: New York, NY, USA, 2017. [Google Scholar] [CrossRef]
- Chang, S.; Zhang, Y.; Zhang, F.; Zhao, X.; Huang, S.; Feng, Z.; Wei, Z. Spatial Attention Fusion for Obstacle Detection Using MmWave Radar and Vision Sensor. Sensors 2020, 20, 956. [Google Scholar] [CrossRef] [PubMed]
- Drews, F.; Feng, D.; Faion, F.; Rosenbaum, L.; Ulrich, M.; Gläser, C. DeepFusion: A Robust and Modular 3D Object Detector for Lidars, Cameras and Radars. In Proceedings of the 2022 IEEE/RSJ International Conference on Intelligent Robots and Systems (IROS), Kyoto, Japan, 23–27 October 2022; pp. 560–567. [Google Scholar] [CrossRef]
- Nabati, R.; Qi, H. CenterFusion: Center-based Radar and Camera Fusion for 3D Object Detection. In Proceedings of the 2021 IEEE Winter Conference on Applications of Computer Vision (WACV), Waikoloa, HI, USA, 3–8 January 2021; pp. 1526–1535. [Google Scholar] [CrossRef]
- Kim, J.; Kim, Y.; Kum, D. Low-Level Sensor Fusion for 3D Vehicle Detection Using Radar Range-Azimuth Heatmap and Monocular Image. In Computer Vision—ACCV 2020, Proceedings of the 15th Asian Conference on Computer Vision, Kyoto, Japan, 30 November–4 December 2020; Springer International Publishing: Berlin/Heidelberg, Germany, 2021; Volume 12624, pp. 388–402. [Google Scholar] [CrossRef]
- Chavez-Garcia, R.O.; Burlet, J.; Vu, T.D.; Aycard, O. Frontal object perception using radar and mono-vision. In Proceedings of the 2012 IEEE Intelligent Vehicles Symposium, Alcala de Henares, Spain, 3–7 June 2012; pp. 159–164. [Google Scholar] [CrossRef]
- Ćesić, J.; Marković, I.; Cvišić, I.; Petrović, I. Radar and stereo vision fusion for multitarget tracking on the special Euclidean group. Robot. Auton. Syst. 2016, 83, 338–348. [Google Scholar] [CrossRef]
- Ma, X.; Zhou, Y.; Wang, H.; Qin, C.; Sun, B.; Liu, C.; Fu, Y. Image as Set of Points. arXiv 2023. [Google Scholar] [CrossRef]
- Zhou, X.; Wang, D.; Krähenbühl, P. Objects as Points. arXiv 2019. [Google Scholar] [CrossRef]
- Yu, F.; Wang, D.; Shelhamer, E.; Darrell, T. Deep Layer Aggregation. In Proceedings of the 2018 IEEE/CVF Conference on Computer Vision and Pattern Recognition, Salt Lake City, UT, USA, 18–23 June 2018; pp. 2403–2412. [Google Scholar] [CrossRef]
- Caesar, H.; Bankiti, V.; Lang, A.H.; Vora, S.; Liong, V.E.; Xu, Q.; Krishnan, A.; Pan, Y.; Baldan, G.; Beijbom, O. nuScenes: A Multimodal Dataset for Autonomous Driving. In Proceedings of the 2020 IEEE/CVF Conference on Computer Vision and PatternRecognition (CVPR), Seattle, WA, USA, 13–19 June 2020; pp. 11618–11628. [Google Scholar] [CrossRef]
- Hu, H.N.; Yang, Y.H.; Fischer, T.; Darrell, T.; Yu, F.; Sun, M. Monocular Quasi-Dense 3D Object Tracking. IEEE Trans. Pattern Anal. Mach. Intell. 2023, 45, 1992–2008. [Google Scholar] [CrossRef] [PubMed]
- Chen, W.; Zhou, C.; Shang, G.; Wang, X.; Li, Z.; Xu, C.; Hu, K. SLAM Overview: From Single Sensor to Heterogeneous Fusion. Remote Sens. 2022, 14, 6033. [Google Scholar] [CrossRef]
- Guo, X.; Cao, Y.; Zhou, J.; Huang, Y.; Li, B. HDM-RRT: A Fast HD-Map-Guided Motion Planning Algorithm for Autonomous Driving in the Campus Environment. Remote Sens. 2023, 15, 487. [Google Scholar] [CrossRef]
- Chabot, F.; Chaouch, M.; Rabarisoa, J.; Teulière, C.; Chateau, T. Deep MANTA: A Coarse-to-Fine Many-Task Network for Joint 2D and 3D Vehicle Analysis from Monocular Image. In Proceedings of the 2017 IEEE Conference on Computer Vision and Pattern Recognition (CVPR), Honolulu, HI, USA, 21–26 June 2017; pp. 1827–1836. [Google Scholar] [CrossRef]
- Wang, T.; Zhu, X.; Pang, J.; Lin, D. FCOS3D: Fully Convolutional One-Stage Monocular 3D Object Detection. In Proceedings of the 2021 IEEE/CVF International Conference on Computer Vision Workshops (ICCVW), Montreal, BC, Canada, 11–17 October 2011; pp. 913–922. [Google Scholar] [CrossRef]
- Liu, Z.; Wu, Z.; Toth, R. SMOKE: Single-Stage Monocular 3D Object Detection via Keypoint Estimation. In Proceedings of the 2020 IEEE/CVF Conference on Computer Vision and Pattern Recognition Workshops (CVPRW), Seattle, WA, USA, 14–19 June 2020; pp. 4289–4298. [Google Scholar] [CrossRef]
- Li, Z.; Gao, Y.; Hong, Q.; Du, Y.; Serikawa, S.; Zhang, L. Keypoint3D: Keypoint-Based and Anchor-Free 3D Object Detection for Autonomous Driving with Monocular Vision. Remote Sens. 2023, 15, 1210. [Google Scholar] [CrossRef]
- Charles, R.Q.; Su, H.; Kaichun, M.; Guibas, L.J. PointNet: Deep Learning on Point Sets for 3D Classification and Segmentation. In Proceedings of the 2017 IEEE Conference on Computer Vision and Pattern Recognition (CVPR), Honolulu, HI, USA, 21–26 July 2017; pp. 77–85. [Google Scholar] [CrossRef]
- Qi, C.; Yi, L.; Su, H.; Guibas, L.J. PointNet++: Deep Hierarchical Feature Learning on Point Sets in a Metric Space. In Proceedings of the NIPS, Long Beach, CA, USA, 4–9 December 2017. [Google Scholar]
- Shi, S.; Wang, X.; Li, H. PointRCNN: 3D Object Proposal Generation and Detection From Point Cloud. In Proceedings of the 2019 IEEE/CVF Conference on Computer Vision and Pattern Recognition (CVPR), Long Beach, CA, USA, 15–20 June 2019; pp. 770–779. [Google Scholar] [CrossRef]
- Wang, J.; Lan, S.; Gao, M.; Davis, L.S. InfoFocus: 3D Object Detection for Autonomous Driving with Dynamic Information Modeling. In Computer Vision—ECCV 2020, Proceedings of the 16th European Conference, Glasgow, UK, 23–28 August 2020; Springer International Publishing: Berlin/Heidelberg, Germany, 2020; Volume 12355, pp. 405–420. [Google Scholar] [CrossRef]
- He, W.; Yang, X.; Wang, Y. A High-Resolution and Low-Complexity DOA Estimation Method with Unfolded Coprime Linear Arrays. Sensors 2019, 20, 218. [Google Scholar] [CrossRef] [PubMed]
- Svenningsson, P.; Fioranelli, F.; Yarovoy, A. Radar-PointGNN: Graph Based Object Recognition for Unstructured Radar Point-cloud Data. In Proceedings of the 2021 IEEE Radar Conference (RadarConf21), Atlanta, GA, USA, 7–14 May 2021; pp. 1–6. [Google Scholar] [CrossRef]
- Meyer, M.; Kuschk, G.; Tomforde, S. Graph Convolutional Networks for 3D Object Detection on Radar Data. In Proceedings of the 2021 IEEE/CVF International Conference on Computer Vision Workshops (ICCVW), Montreal, BC, Canada, 11–17 October 2021; pp. 3053–3062. [Google Scholar] [CrossRef]
- Yang, B.; Guo, R.; Liang, M.; Casas, S.; Urtasun, R. RadarNet: Exploiting Radar for Robust Perception of Dynamic Objects. In Computer Vision—ECCV 2020, Proceedings of the 16th European Conference, Glasgow, UK, 23–28 August 2020; Springer International Publishing: Berlin/Heidelberg, Germany, 2020; Volume 12363, pp. 496–512. [Google Scholar] [CrossRef]
- Wang, L.; Goldluecke, B. Sparse-PointNet: See Further in Autonomous Vehicles. IEEE Robot. Autom. Lett. 2021, 6, 7049–7056. [Google Scholar] [CrossRef]
- Qian, K.; Zhu, S.; Zhang, X.; Li, L.E. Robust Multimodal Vehicle Detection in Foggy Weather Using Complementary Lidar and Radar Signals. In Proceedings of the 2021 IEEE/CVF Conference on Computer Vision and Pattern Recognition (CVPR), Nashville, TN, USA, 20–25 June 2021; pp. 444–453. [Google Scholar] [CrossRef]
- Li, Y.J.; Park, J.; O’Toole, M.; Kitani, K. Modality-agnostic learning for radar-lidar fusion in vehicle detection. In Proceedings of the IEEE/CVF Conference on Computer Vision and Pattern Recognition, New Orleans, LA, USA, 18–24 June 2022; pp. 918–927. [Google Scholar] [CrossRef]
- Chen, X.; Ma, H.; Wan, J.; Li, B.; Xia, T. Multi-view 3D Object Detection Network for Autonomous Driving. In Proceedings of the 2017 IEEE Conference on Computer Vision and Pattern Recognition (CVPR), Honolulu, HI, USA, 21–26 June 2017; pp. 6526–6534. [Google Scholar] [CrossRef]
- Simonyan, K.; Zisserman, A. Very Deep Convolutional Networks for Large-Scale Image Recognition. arXiv 2015. [Google Scholar] [CrossRef]
- Ku, J.; Mozifian, M.; Lee, J.; Harakeh, A.; Waslander, S.L. Joint 3D Proposal Generation and Object Detection from View Aggregation. In Proceedings of the 2018 IEEE/RSJ International Conference on Intelligent Robots and Systems (IROS), Madrid, Spain, 1–5 October 2018; pp. 1–8. [Google Scholar] [CrossRef]
- Lin, T.Y.; Dollar, P.; Girshick, R.; He, K.; Hariharan, B.; Belongie, S. Feature Pyramid Networks for Object Detection. In Proceedings of the 2017 IEEE Conference on Computer Vision and Pattern Recognition (CVPR), Honolulu, HI, USA, 21–26 July 2017; pp. 936–944. [Google Scholar] [CrossRef]
- Chadwick, S.; Maddern, W.; Newman, P. Distant Vehicle Detection Using Radar and Vision. In Proceedings of the 2019 International Conference on Robotics and Automation (ICRA), Montreal, QC, Canada, 20–24 May 2019; pp. 8311–8317. [Google Scholar] [CrossRef]
- John, V.; Mita, S. RVNet: Deep Sensor Fusion of Monocular Camera and Radar for Image-Based Obstacle Detection in Challenging Environments. In Image and Video Technology, Proceedings of the 10th Pacific-Rim Symposium, PSIVT 2022, 12–14 November 2022; Springer International Publishing: Berlin/Heidelberg, Germany, 2019; Volume 11854, pp. 351–364. [Google Scholar] [CrossRef]
- Redmon, J.; Farhadi, A. Yolov3: An incremental improvement. arXiv 2018. [Google Scholar] [CrossRef]
- Kim, Y.; Choi, J.W.; Kum, D. GRIF Net: Gated Region of Interest Fusion Network for Robust 3D Object Detection from Radar Point Cloud and Monocular Image. In Proceedings of the 2020 IEEE/RSJ International Conference on Intelligent Robots and Systems (IROS), Las Vegas, NV, USA, 25–29 October 2020; pp. 10857–10864. [Google Scholar] [CrossRef]
- Lin, T.Y.; Goyal, P.; Girshick, R.; He, K.; Dollar, P. Focal Loss for Dense Object Detection. IEEE Trans. Pattern Anal. Mach. Intell. 2020, 42, 318–327. [Google Scholar] [CrossRef] [PubMed]
- Zhu, X.; Hu, H.; Lin, S.; Dai, J. Deformable convnets v2: More deformable, better results. In Proceedings of the IEEE/CVF Conference on Computer Vision and Pattern Recognition, Long Beach, CA, USA, 15–20 June 2019; pp. 9308–9316. [Google Scholar] [CrossRef]
- Dai, J.; Qi, H.; Xiong, Y.; Li, Y.; Zhang, G.; Hu, H.; Wei, Y. Deformable convolutional networks. In Proceedings of the IEEE International Conference on Computer Vision, Venice, Italy, 22–29 October 2017; pp. 764–773. [Google Scholar] [CrossRef]
- Barrera, A.; Guindel, C.; Beltran, J.; Garcia, F. BirdNet+: End-to-End 3D Object Detection in LiDAR Bird’s Eye View. In Proceedings of the 2020 IEEE 23rd International Conference on Intelligent Transportation Systems (ITSC), Rhodes, Greece, 20–23 September 2020; pp. 1–6. [Google Scholar] [CrossRef]
Figure 1.
Classification of multi-modal fusion methods. (a) Early fusion; (b) Intermediate Fusion; (c) Late Fusion.
Figure 1.
Classification of multi-modal fusion methods. (a) Early fusion; (b) Intermediate Fusion; (c) Late Fusion.

Figure 2.
A context clustering-based radar and camera fusion for 3D object detection network architecture.
Figure 2.
A context clustering-based radar and camera fusion for 3D object detection network architecture.

Figure 3.
The overall DLA backbone architecture.

Figure 4.
Overview of the radar feature extractor.

Figure 5.
The structure of the context cluster fusion module.

Figure 6.
Context cluster block architecture.

Figure 7.
Mutual assistance between radar and camera. “C” represents feature points from the camera, “R” represents feature points from the radar, and “RC” represents radar–camera fusion feature points. (a) shows the aggregation of feature points, (b) shows the reassignment of feature points, and (c) shows the fused feature points.

Figure 8.
The distribution of different types of sensors in the nuScenes dataset.

Figure 9.
The precision–recall (P-R) curves of ConCs-Fusion, CenterNet, and CenterFusion under different threshold conditions. Panels (a–d) correspond to the four different classes: car, pedestrian, motorcycle, and construction vehicle.
Figure 9.
The precision–recall (P-R) curves of ConCs-Fusion, CenterNet, and CenterFusion under different threshold conditions. Panels (a–d) correspond to the four different classes: car, pedestrian, motorcycle, and construction vehicle.

Figure 10.
The mAP of the ablation studies for each class.

Figure 11.
The visualized results of 3D object detection in different real-world scenarios. The first column shows the detection results of our proposed ConCs-Fusion method, the second column shows CenterNet results, and the third column shows CenterFusion results. Our method is able to detect objects that other methods cannot, as indicated by the yellow circles.

Figure 12.
The BEV plots in different real-world scenarios. The predicted results are represented by blue boxes, while the ground-truth boxes are represented by red boxes. The green points represent the radar point clouds.
Figure 12.
The BEV plots in different real-world scenarios. The predicted results are represented by blue boxes, while the ground-truth boxes are represented by red boxes. The green points represent the radar point clouds.


Table 1.
The common sensors.
| Sensors | Strengths | Limitations | |
|---|---|---|---|
| Optical Sensors | Monocular Camera | affordable and easy to deploy; intuitive understanding of object’s texture information | weak depth perception; sensitive to environmental conditions; prone to image distortion |
| LiDAR | high accuracy; providing 3D information about objects | large and expensive, vulnerable under adverse weather conditions like rain, fog, and snow | |
| Radar | capacity of detecting objects at long distances; strong adaptability in all weather conditions | false alarm rate relatively high; object information relatively abstract | |
Table 2.
Performance of 3D object detection using different methods on the nuScenes dataset. “Test” represents the results evaluated on the test dataset, while “Val” represents the results evaluated on the validation dataset. The symbol “↑” indicates that a higher value is better, while “↓” indicates that a lower value is better. “C” represents the camera modality, “L” represents the Lidar modality, and “R” represents the radar modality.
| Method | Datasets | Modality | NDS↑ | mAP↑ | Error↓ | ||||
|---|---|---|---|---|---|---|---|---|---|
| mATE | mASE | mAOE | mAVE | mAAE | |||||
| InfoFocus | Test | L | 0.395 | 0.395 | 0.363 | 0.265 | 1.132 | 1.000 | 0.395 |
| BirdNet+ | Test | L | 0.296 | 0.245 | 0.382 | 0.253 | 0.626 | 1.766 | 1.000 |
| CenterNet | Test | C | 0.389 | 0.312 | 0.673 | 0.257 | 0.599 | 1.448 | 0.138 |
| QD_3DT | Test | C | 0.360 | 0.270 | 0.714 | 0.247 | 0.464 | 1.307 | 0.326 |
| FCOS3D | Test | C | 0.428 | 0.358 | 0.690 | 0.249 | 0.452 | 1.434 | 0.124 |
| CenterFusion | Test | R+C | 0.449 | 0.324 | 0.633 | 0.261 | 0.514 | 0.610 | 0.117 |
| Ours | Test | R+C | 0.455 | 0.323 | 0.645 | 0.262 | 0.448 | 0.599 | 0.110 |
| CenterNet | Val | C | 0.387 | 0.320 | 0.688 | 0.261 | 0.601 | 1.162 | 0.183 |
| CenterFusion | Val | R+C | 0.441 | 0.319 | 0.678 | 0.267 | 0.549 | 0.543 | 0.144 |
| Ours | Val | R+C | 0.454 | 0.329 | 0.668 | 0.262 | 0.454 | 0.570 | 0.152 |
| CenterNet | mini_Val | C | 0.323 | 0.288 | 0.726 | 0.469 | 0.711 | 1.303 | 0.298 |
| CenterFusion | mini_Val | R+C | 0.375 | 0.309 | 0.679 | 0.461 | 0.604 | 0.747 | 0.305 |
| Ours | mini_Val | R+C | 0.396 | 0.313 | 0.671 | 0.469 | 0.544 | 0.614 | 0.308 |
Table 3.
The mAP values for each class of object detection on the nuScenes dataset. The symbol “↑” indicates that a higher value is better. “-” indicates that the class does not exist in the dataset.
Table 3.
The mAP values for each class of object detection on the nuScenes dataset. The symbol “↑” indicates that a higher value is better. “-” indicates that the class does not exist in the dataset.
| Method | Datasets | Modality | mAP↑ | |||||||||
|---|---|---|---|---|---|---|---|---|---|---|---|---|
| Car | Truck | Bus | Trailer | Const | Ped | Motor | Bic | Traff | Barrier | |||
| CenterNet | Test | C | 0.480 | 0.232 | 0.202 | 0.232 | 0.074 | 0.364 | 0.288 | 0.199 | 0.570 | 0.478 |
| CenterFusion | Test | R+C | 0.505 | 0.255 | 0.232 | 0.234 | 0.077 | 0.370 | 0.307 | 0.201 | 0.575 | 0.484 |
| Ours | Test | R+C | 0.509 | 0.256 | 0.223 | 0.232 | 0.075 | 0.370 | 0.302 | 0.207 | 0.569 | 0.484 |
| CenterNet | Val | C | 0.496 | 0.247 | 0.342 | 0.148 | 0.039 | 0.388 | 0.269 | 0.241 | 0.560 | 0.467 |
| CenterFusion | Val | R+C | 0.512 | 0.251 | 0.328 | 0.145 | 0.047 | 0.378 | 0.286 | 0.222 | 0.554 | 0.464 |
| Ours | Val | R+C | 0.526 | 0.259 | 0.345 | 0.152 | 0.058 | 0.389 | 0.313 | 0.243 | 0.551 | 0.449 |
| CenterNet | mini_Val | C | 0.494 | 0.388 | 0.481 | - | - | 0.455 | 0.295 | 0.127 | 0.632 | - |
| CenterFusion | mini_Val | R+C | 0.533 | 0.433 | 0.514 | - | - | 0.449 | 0.331 | 0.151 | 0.676 | - |
| Ours | mini_Val | R+C | 0.539 | 0.409 | 0.599 | - | - | 0.469 | 0.343 | 0.165 | 0.678 | - |
Table 4.
Ablation studies on the nuScenes test dataset. The symbol “↑” indicates that a higher value is better, while “↓” indicates that a lower value is better. "-" indicates that it is not used, and "✓" indicates that it is used.
Table 4.
Ablation studies on the nuScenes test dataset. The symbol “↑” indicates that a higher value is better, while “↓” indicates that a lower value is better. "-" indicates that it is not used, and "✓" indicates that it is used.
| Method | Upsample | MLP | NDS↑ | mAP↑ | Error↓ | ||||
|---|---|---|---|---|---|---|---|---|---|
| mATE | mASE | mAOE | mAVE | mAAE | |||||
| Baseline | - | - | 0.389 | 0.312 | 0.673 | 0.257 | 0.599 | 1.448 | 0.138 |
| ours | Inter | - | 0.411 | 0.285 | 0.717 | 0.270 | 0.507 | 0.699 | 0.128 |
| ours | Inter | ✓ | 0.454 | 0.320 | 0.635 | 0.264 | 0.453 | 0.596 | 0.108 |
| ours | ConvTrans2d | - | 0.450 | 0.317 | 0.644 | 0.263 | 0.468 | 0.602 | 0.107 |
| ours | ConvTrans2d | ✓ | 0.455 | 0.323 | 0.645 | 0.262 | 0.448 | 0.599 | 0.110 |
Disclaimer/Publisher’s Note: The statements, opinions and data contained in all publications are solely those of the individual author(s) and contributor(s) and not of MDPI and/or the editor(s). MDPI and/or the editor(s) disclaim responsibility for any injury to people or property resulting from any ideas, methods, instructions or products referred to in the content. |
© 2023 by the authors. Licensee MDPI, Basel, Switzerland. This article is an open access article distributed under the terms and conditions of the Creative Commons Attribution (CC BY) license (https://creativecommons.org/licenses/by/4.0/).
Share and Cite
MDPI and ACS Style
He, W.; Deng, Z.; Ye, Y.; Pan, P. ConCs-Fusion: A Context Clustering-Based Radar and Camera Fusion for Three-Dimensional Object Detection. Remote Sens. 2023, 15, 5130. https://doi.org/10.3390/rs15215130
AMA Style
He W, Deng Z, Ye Y, Pan P. ConCs-Fusion: A Context Clustering-Based Radar and Camera Fusion for Three-Dimensional Object Detection. Remote Sensing. 2023; 15(21):5130. https://doi.org/10.3390/rs15215130
Chicago/Turabian StyleHe, Wei, Zhenmiao Deng, Yishan Ye, and Pingping Pan. 2023. "ConCs-Fusion: A Context Clustering-Based Radar and Camera Fusion for Three-Dimensional Object Detection" Remote Sensing 15, no. 21: 5130. https://doi.org/10.3390/rs15215130
Note that from the first issue of 2016, this journal uses article numbers instead of page numbers. See further details here.