Article

Analysis of the Vertical Distribution and Driving Factors of Aerosol and Ozone Precursors in Huaniao Island, China, Based on Ground-Based MAX-DOAS

1
Department of Health Promotion and Behavioral Sciences, School of Public Health, Anhui Medical University, Hefei 230032, China
2
Key Lab of Environmental Optics and Technology, Anhui Institute of Optics and Fine Mechanics, Hefei Institutes of Physical Science, Chinese Academy of Sciences, Hefei 230031, China
3
School of Environmental Science and Engineering, Suzhou University of Science and Technology, Suzhou 215009, China
4
Institute of Physical Science and Information Technology, Anhui University, Hefei 230601, China
5
Information Materials and Intelligent Sensing Laboratory of Anhui Province, Anhui University, Hefei 230601, China
6
School of Life Sciences, Anhui Agricultural University, Hefei 230036, China
7
Anhui Provincial Academy of Eco-Environmental Science Research, Hefei 230071, China
8
Key Laboratory of Recycling and Eco-Treatment of Waste Biomass of Zhejiang Province, School of Environment and Natural Resources, Zhejiang University of Science and Technology, Hangzhou 310023, China
9
School of Environmental Science and Optoelectronic Technology, University of Science and Technology of China, Hefei 230026, China
10
Department of Precision Machinery and Precision Instrumentation, University of Science and Technology of China, Hefei 230026, China
11
Center for Excellence in Regional Atmospheric Environment, Institute of Urban Environment, Chinese Academy of Sciences, Xiamen 361021, China
12
Key Laboratory of Precision Scientific Instrumentation of Anhui Higher Education Institutes, University of Science and Technology of China, Hefei 230026, China
*
Author to whom correspondence should be addressed.
Remote Sens. 2023, 15(21), 5103; https://doi.org/10.3390/rs15215103
Submission received: 20 September 2023 / Revised: 17 October 2023 / Accepted: 24 October 2023 / Published: 25 October 2023

Abstract

:
Urban air pollution has become a regional environmental problem. In order to explore whether island areas were affected by the urban development of surrounding areas, in this paper, we systematically study the vertical distribution characteristics of atmospheric components, meteorological drivers, potential pollution sources, and the population health risks of fine particulate matter in island cities in China. The vertical profiles of three atmospheric pollutants (aerosols, NO2, and HCHO) in the lower troposphere of Huaniao Island in the East China Sea (ECS) were obtained using ground-based multi-axial differential optical absorption spectroscopy (MAX-DOAS). The results show that the aerosol extinction coefficients, NO2, and HCHO were primarily distributed at altitudes below 1 km, and the atmospheric pollutants in Zhoushan were obviously affected by high-altitude transfer. The main meteorological driving factors of aerosols, NO2, and HCHO were different at different altitudes. The key factor contributing to the high column concentrations of NO2 and HCHO in the upper air (greater than 400 m) was the transport of pollutants brought about by changes in wind speed. By exploring the main potential sources of atmospheric pollutants, it was found that the main sources of aerosols, NO2, and HCHO are coastal cities in the Yangtze River Delta, including southeast Zhejiang Province, southeast Fujian Province, Shanghai, ECS, and the Yellow Sea. Compared with aerosols and HCHO, local primary emissions are an important source of NO2, which are mainly related to industrial activities in Zhoushan Port. In addition, using the expose-response function model, the number of attributable cases of PM2.5 air pollution in Zhoushan City in 2019 accounted for 6.58% of the total population. This study enriches our understanding of the vertical distribution characteristics of atmospheric composition and health risk assessment on Chinese islands.

1. Introduction

Air pollution is a complex mixture of gases and particulate matter with local and non-local emission sources, causing spatiotemporal variations in concentration and composition that carry associated health risks [1,2]. To be specific, aerosols are multiphase systems made up of solid, liquid, and gas particles suspended in the atmosphere that pose a serious threat to human health and limit the visibility of the atmospheric environment [3,4,5]. Nitrogen oxides (NO2), one of the six conventional pollutants listed in China’s air quality evaluation standards, can promote the generation of ozone. They can also cause serious photochemical pollution and are closely related to mental illness [6,7,8]. Formaldehyde (HCHO), which has detrimental effects on both human health and the atmosphere, is crucial to the O3 and NO2 cycles [9,10]. Studying the distribution characteristics, sources, and health risks of aerosols and ozone precursors (NO2 and HCHO) is crucial for protecting the public’s health and reducing air pollution.
The Yangtze River Delta (YRD) city cluster, which includes Zhejiang, Jiangsu, Shanghai, and Anhui Provinces, has played an important part in China’s economic development and faces serious air pollution problems [11]. Scholars have conducted extensive and in-depth studies on the distribution and propagation process of air pollutants and their impact on population health [12,13,14], including the effect of meteorological conditions on the distribution of air pollutants [15,16] and the spatial correlation between air pollution and public health [17,18]. However, most studies have focused on large cities such as Shanghai, Nanjing, Hangzhou, and Hefei [19,20]. Because of its unique geographical environment, in addition to its inland cities, there are many coastal cities in the YRD region. Island cities are relatively clean areas, and with the expansion of the scale of urban agglomeration in the YRD region, high-intensity industrial production and the rapid expansion of cities have reduced the pollution buffer distance between cities. Environmental problems in various cities have become regional environmental problems [21,22]. Therefore, it is essential to monitor the air quality of island cities and determine whether they are affected by transport in surrounding developed urban areas. Scholars have also studied the distribution and source characteristics of atmospheric components in the island regions of China. Wang et al. [23] reported that Hebei Province, Shandong Province, and the YRD are important sources of aerosols over Huaniao Island due to regional transport. Based on the four seasons of Huaniao Island, Wang et al. [24] analyzed the impact of land transport from surrounding cities on the aerosol characteristics of the East China Sea (ECS). Xue et al. [25] discussed the spatiotemporal variation characteristics of NO2 on Chongming Ecological Island in the vicinity of the Shanghai area using an ozone monitor. Wu et al. [26] discovered that the marine fine particulate pollution air mass over the Dongsha and Nansha Islands in the South China Sea came from the Japanese islands, Chinese mainland, and Korean Peninsula. Additionally, it mostly traversed the developed and urbanized parts of East Asia. There is a common understanding that regional transport has a significant impact on the distribution of air pollution components in island areas.
Vertical observations should be made to fully understand regional transport [27]. Traditional ground observations have limitations in monitoring atmospheric pollutants’ (such as aerosols, HCHO, and NO2) vertical distribution characteristics, particularly in island areas where the vertical distribution of atmospheric components used for regional air pollution research remains insufficient. The model simulation shows great uncertainty in the vertical profiles of atmospheric pollutants such as aerosols, and it was found that it is difficult to accurately quantify the intensity of aerosol cloud interaction due to the great uncertainty in the parameterization scheme of aerosol and cloud microphysics [28,29,30,31,32,33,34]. The characterization of aerosol effects on clouds was another source of bias, mainly reflected in the fact that the activation rates of cloud condensation nuclei and ice nuclei were not well understood and therefore difficult to quantify [35,36,37,38]. The measurement of the instrument was a valuable tool for evaluating the performance of the model and helping to improve the relevant parameterization scheme [39,40]. In addition, with the atmospheric model, it is difficult to accurately capture the aerosol concentration of clouds because it does not reflect the vertical transport of aerosol and water vapor removal (especially in the upper troposphere) [41,42,43,44]. Therefore, the MAX-DOAS observation network covering the YRD region was established to obtain tropospheric column concentrations and track the regional transport of trace gases [45,46]. Over the past ten years, the column density and vertical distribution of trace gases (aerosols, NO2, HCHO, SO2, O3, HONO, BrO, and OClO) in urban and island environments have been extensively measured using MAX-DOAS [47,48,49]. Research results regarding the distribution of air pollution in the YRD and island areas of China based on MAX-DOAS have been obtained [27,50]. Tian et al. [6] analyzed the high-altitude transmission characteristics of NO2, HCHO, and HCHO gases in urban Nanjing, Hefei, and Shanghai in the YRD based on the MAX-DAOS system. Xing et al. [51] and Zheng et al. [52] analyzed the tropospheric distribution and sources of NO2 and HCHO in the coastal cities of the Bohai Sea using MAX-DOAS. It is thus possible to employ MAX-DOAS to investigate information on tropospheric aerosol, NO2, and HCHO distribution at various altitudes in island cities.
In this work, the profile products of aerosols, HCHO, and NO2 obtained with MAX-DOAS were used to analyze the summer atmospheric components of the troposphere on Huaniao Island, Zhoushan City, China. The vertical distribution characteristics of aerosols, NO2, and HCHO, the influence of meteorological factors, the identification of potential sources, and the health risk assessment of PM2.5 are discussed. The results can provide novel insights into island areas’ public health risk assessment and air pollution control.

2. Materials and Methods

2.1. Observation Site

The observation instrument (MAX-DOAS) was set up on Huaniao Island (30.86°N, 122.67°E), Zhoushan City, Zhejiang Province, China (Figure S1). Although this area has little traffic and no industrial emission locations, Yangshan Port, one of the world’s major container ship ports, makes it susceptible to ship emissions [24,53]. Huaniao Island represents a typical island area in the YRD region, and an observational study of this site is of considerable scientific significance for understanding the transport contribution and health risks of air pollutants in the ECS.

2.2. Instrument and Vertical Profile Retrieval Method

A commercial MAX-DOAS instrument (Airyx, Skyspec series) was used in this study. This instrument has two main parts, the spectrometer unit and the telescope unit, with additional sensors for USB communication and control electronics to record temperature, pressure, and tilt. A Peltier element was mounted on the spectrometer housing unit to cool and heat the spectrometer in order to stabilize its temperature at 20 ± 0.05 °C. A stepper motor was used to operate an outdoor mounted telescope (field of view 0.2° × 0.8°) serving to collect scattered sunlight at different elevation angles and then transmit it to the spectrometer through optical fibers. The rotating prism consisted of a quartz glass tube, and light was reflected through the lens to the fiber at the end of the adjustable tube above. This device was composed of a stepper motor that transfers scattered sunlight captured at various elevation angles through a glass fiber bundle to the spectrometer unit. The entire scan sequence consisted of elevation angles (1°, 2°, 3°, 4°, 5°, 6°, 8°, 10°, 15°, 30°, and 90°) and azimuth angles (fixed at 0°). With varying light intensity, the entire time series was approximately 15 min. To ensure that the observations collected at all altitudes had comparable intensity, the exposure time for each observation was automatically modified according to the intensity of the scattered sunlight obtained. At night, the instrument was set to collect the dark current and offset spectrum and subtract them from the spectrum measured during the day [46,51].
In this study, the solar scattering spectra and DOAS fitting outcomes for the differential slant column densities (DSCDs) of O4, NO2, and HCHO were processed using the QDOAS software (http://uv-vis.aeronomie.be/software/QDOAS/, accessed on 22 December 2022), created by the Royal Belgian Institute for Space and Aviation Research (BIRA-IASB). Only solar zenith angle (SZA) filter spectra greater than 75° were gathered to avoid the severe stratospheric absorption effect. The reference spectra from the two zenith spectra that were acquired before and after each elevation sequence were chosen for DOAS fitting. Table 1 presents the specific configuration. O4 (NO2) and HCHO had fitting intervals of 338–370 nm and 322.5–358 nm, respectively. During the retrieval process, the absorption cross-sections of trace gases were applied, referring to the recommended settings of the CINDI-2 intercomparison campaign [51]. Figure 1 displays an illustration of the DOAS fitting outcomes noted on 20 July 2017. For the DOAS fitting findings, an RMS > 5.0 × 10⁻⁴ was ruled out. Following processing, the O4, NO2, and HCHO DSCDs were retained in amounts of 90.32%, 90.21%, and 90.66%, respectively.
The Heidelberg profile algorithm and optimal estimating approach were used to recover the vertical distributions of aerosols, NO2, and HCHO, and SCIATRAN was chosen as the forward transfer model [62,63]. This algorithm has been described previously [51,64]. The troposphere was separated into 28 layers within a height range of 3 km, with a vertical resolution of 100 m beneath 2 km and 200 m above 2 km. The aerosol optical property value, single scattering albedo, and aerosol asymmetry factor were considered to be 0.08, 0.92, and 0.68, respectively, in the Heidelberg profiles. Retrieved contours that had relative errors more than 50% and degrees of freedom lower than 1.0 were also eliminated.

2.3. Potential Source Analysis of Atmospheric Pollutants

Backward trajectories were computed using data from the National Center for Environmental Prediction (NCEP) Global Data Assimilation database (ftp://arlftp.arlhq.noaa.gov/pub/archives/gdas1/, accessed on 15 October 2023) [65]. Using the HYSPLIT model, the 24 h and 72 h inverse trajectories of the air mass at the Zhoushan site were analyzed, and cluster analysis was performed. The potential sources of daytime gaseous pollutants at multiple heights in the Huaniao Island area were studied from 19 July to 23 August 2019. The study area was divided into several 0.5° × 0.5° grids. After the research area was gridded, a single grid coordinate was (i, j), and the total number of route endpoints falling within the lattice point ij was defined as nij. The total number of endpoints with pollutant levels over the established threshold was defined as mij. Potential sources of gaseous pollutants (aerosols, NO2, and HCHO) were analyzed in this study, and the average values (Avg) of gaseous pollutants were set as the threshold. A trajectory is regarded as polluted when the concentration associated with a given backward trajectory exceeds the threshold value. The potential source contribution function (PSCF) values are defined as:
P S C F i j = m i j n i j
The weight Wij is expressed as:
W i j = 1.00 n i j > 3 A v g 0.70 A v g < n i j 3 A v g   0.42 0.5 A v g < n i j A v g     0.17 n i j 0.5 A v g
where Avg is the average number of endpoints in each cell.
Further weighted calculations of the potential source contribution function (WPSCF) and the values are shown in Equation (3):
W P S C F = W i j × P S C F i j

2.4. Health Risk Assessment

Using the expose-response function of PM2.5 at each of the health endpoints found in prior epidemiological studies, the health risk posed by particulate matter pollution in Zhoushan City was assessed [66,67]. Equations (4) and (5) can be used to calculate the number of cases that can be directly linked to PM2.5 pollution (ΔE):
E i = E 0 e x p β i C C 0
Δ E = P E i E 0
where C is the actual PM2.5 concentration (μg·m−3). In this study, C refers to the average value of the data from three sites at the China National Environmental Monitoring Center (CNEMC, http://www.cnemc.cn/, accessed on 1 September 2023) in Zhoushan City in 2019. C0 is the baseline PM2.5 concentration (the WHO standard of 25 μg·m−3 was used in this work); βi, the exposure-response coefficient; E0, population health insurance under C0; Ei, the population health risk under C; and P, the total population of the study area. The total population of Zhoushan City in 2019 was 1.176 million.

2.5. Ancillary Data

The PM2.5 and NO2 concentrations for the research period were obtained from the monitoring station of the CNEMC. For quality control, the z-score approach was used to eliminate extreme outliers from the CNEMC data [68,69]. The Global Analytical Dataset of NCEP and the atmospheric meteorological model Weather Research and Forecasting (WRF) (0.1° × 0.1° spatial resolution) were used to acquire data on wind speed (WS), wind direction (WD), relative humidity (RH), and temperature (T) at various altitude levels of 0–3 km. Previous studies have provided detailed descriptions of the WRF model and its parameter settings [64].

3. Results

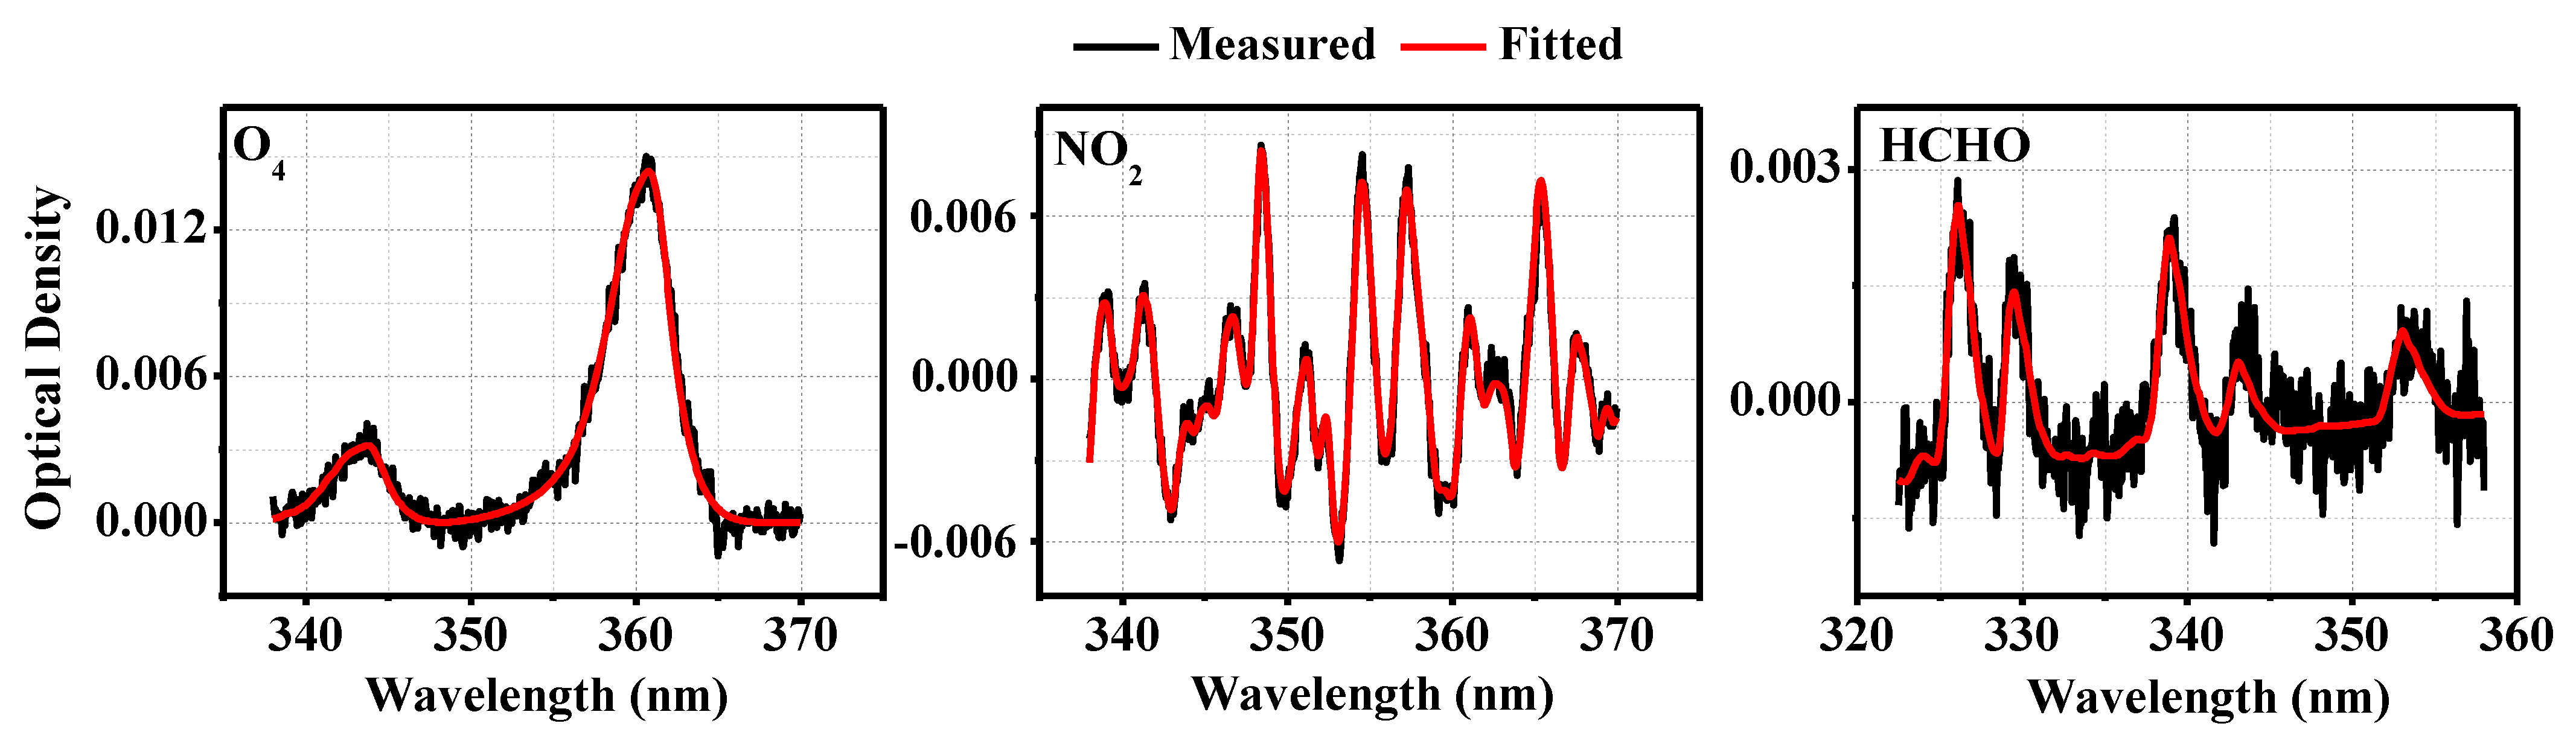
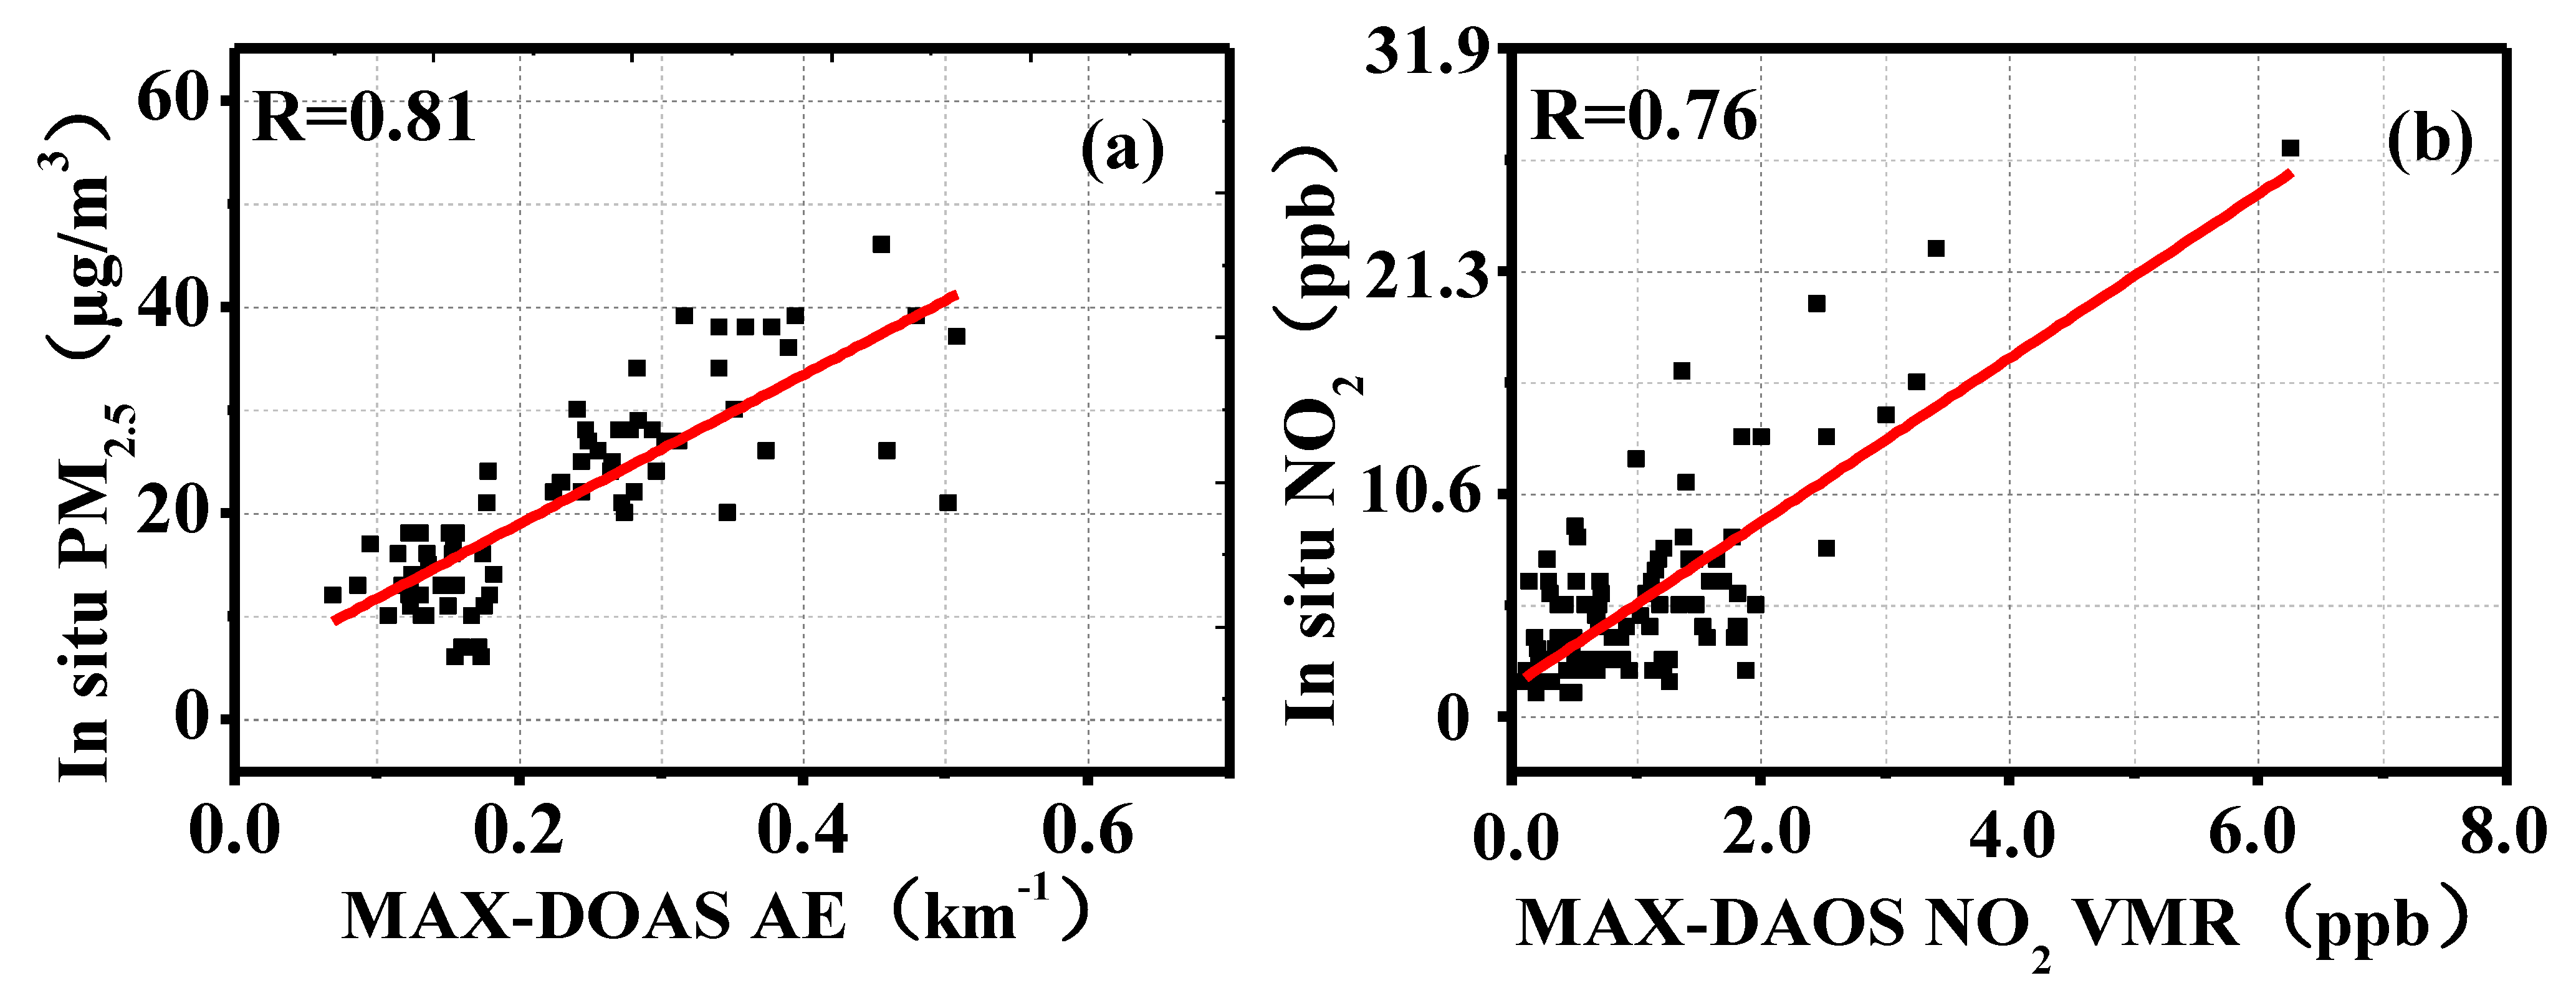
3.1. Data Verification

The accuracy of the MAX-DAOS inversion results was confirmed by referring to the method of Ou et al. [20]. To be specific, the aerosol extinction coefficient (AE) and NO2 at 10 m above ground level obtained using MAX-DOAS were compared with the CNEMC data (Figure 2 and Figure S2). This method has been validated in many studies [51,70]. The results from the two instruments were normalized to hourly averages before the correlation analysis [51]. Linear analysis was performed on the AE and NO2 concentrations at 10 m above the ground and on the PM2.5 and NO2 concentrations at the corresponding state control station, and the correlation coefficients (R) were 0.81 and 0.76, respectively. The formaldehyde obtained through MAX-DOAS inversion and the formaldehyde obtained through USTC TROPOMI showed a good correlation, and the correlation coefficient R was 0.78. This shows that the data obtained based on MAX-DOAS inversion are reliable. On this basis, the vertical distribution characteristics of AE, NO2, and HCHO are analyzed below.

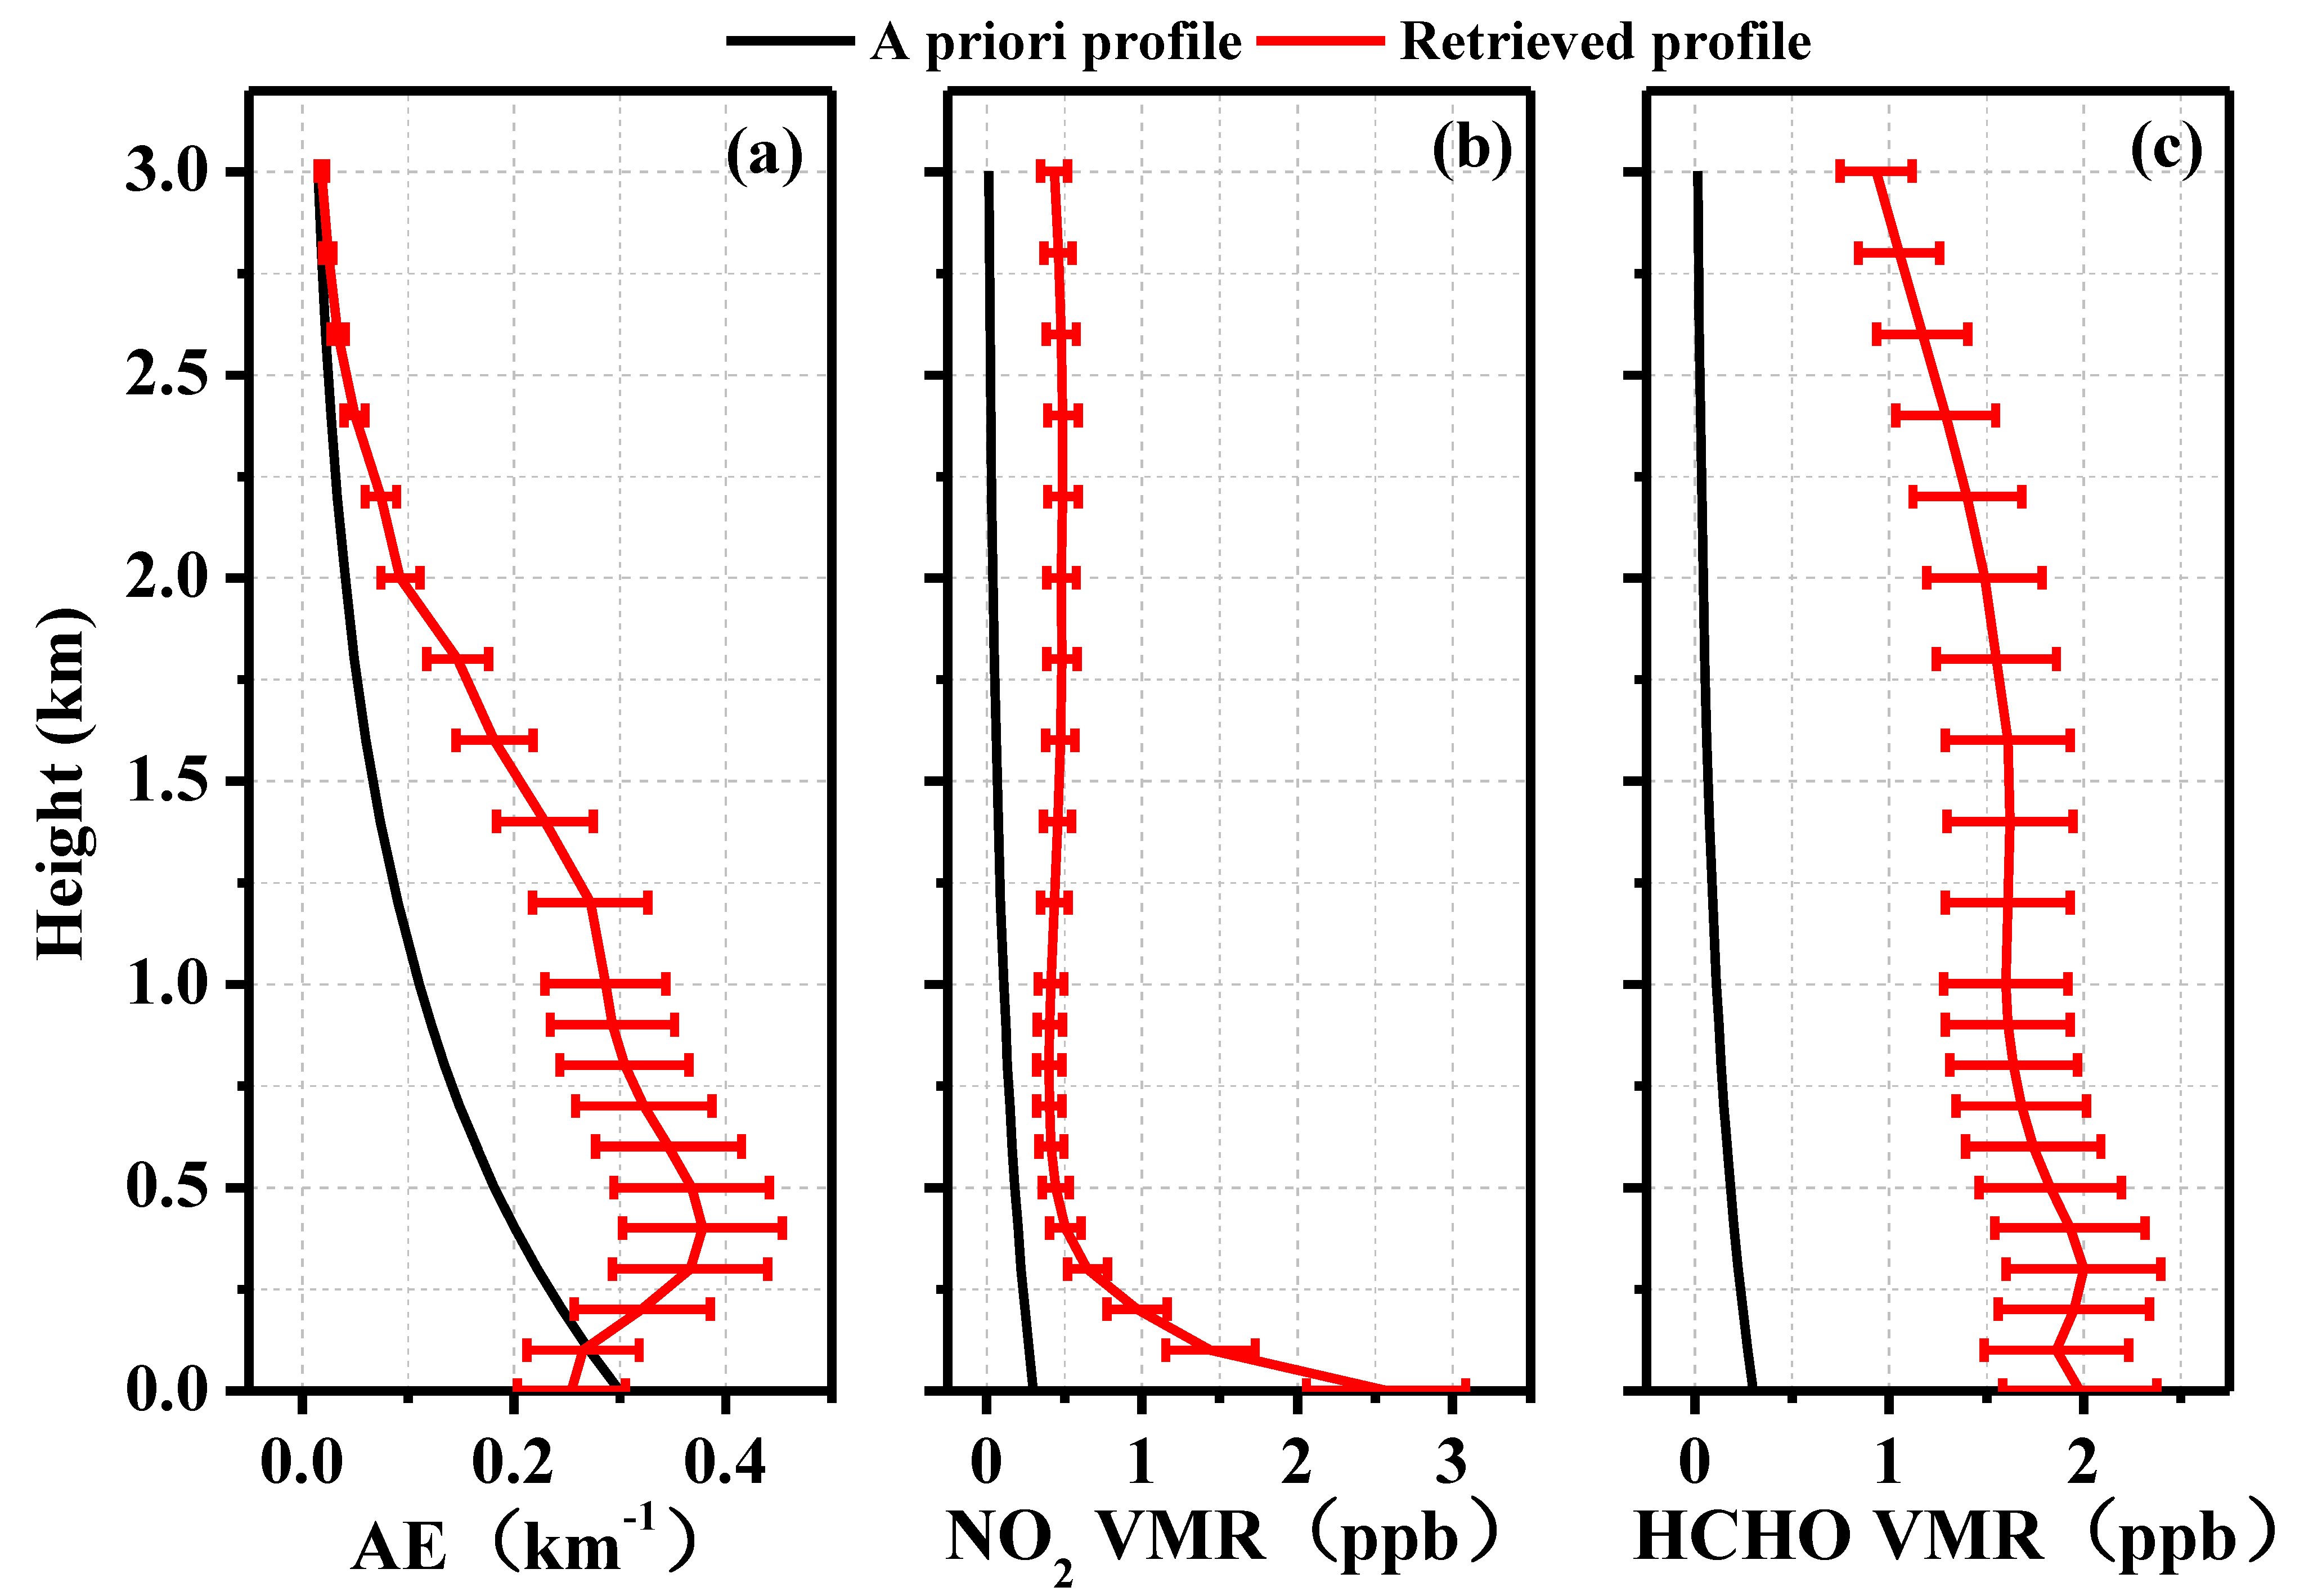
3.2. Vertical Distribution Characteristics of Pollutants

As is shown in Figure 3, 75.72% of the aerosols were dispersed primarily below 1 km. From near the ground to 500 m, the aerosol content exhibited an increasing trend with a Gaussian distribution. The peak value of the average AE appeared at 400 m, with a maximum value of 0.38 km−1. NO2 showed an exponentially decreasing trend from 0 to 3 km, and the proportion of NO2 below 0.5 km reached 49.43%; however, the proportion of NO2 above 1 km was 38.33%. NO2 mainly derives from traffic sources, and the reason for this phenomenon may be the effect of NO2 produced by ship transportation on NO2 near the ground of Huaniao Island [71]. The vertical distribution of HCHO showed a Gaussian distribution, and the proportion of HCHO below 1 km was 59.10%. Figure 3c shows that the HCHO value suddenly increases at 0.3 km and 1.5 km. In order to explore the reason for this, the daily profile diagram was analyzed, and it was found that HCHO has an obvious high-altitude transmission phenomenon (Figure S3). This finding is consistent with the conclusions of other studies. Dasgupta et al. [72] found in their report that the mixed proportion of HCHO in coastal areas increased with the increase in altitude. In addition, the observation site is located in the East China Sea, and regional transmission may also be an important reason for the increase in the pollutant content [73,74]. Xing et al. [51] analyzed the vertical distribution characteristics and potential source characteristics of aerosol, NO2, and HCHO in the Bohai Sea region of China and found that the high concentration values of aerosols, NO2, and HCHO were distributed near the ground, at 100–200 and 200–300 m, respectively, which were mainly influenced by local emissions. Tian et al. [6] selected three cities in the Yangtze River Delta (Hefei, Nanjing and Shanghai) for long-term observations of NO2, SO2, and HCHO and found that meteorological conditions had an important impact on the regional transport of pollutants. These studies were based on the island area or the Yangtze River Delta area, and the conclusions were basically consistent with the vertical distribution of gases and meteorological drivers analyzed in this study.

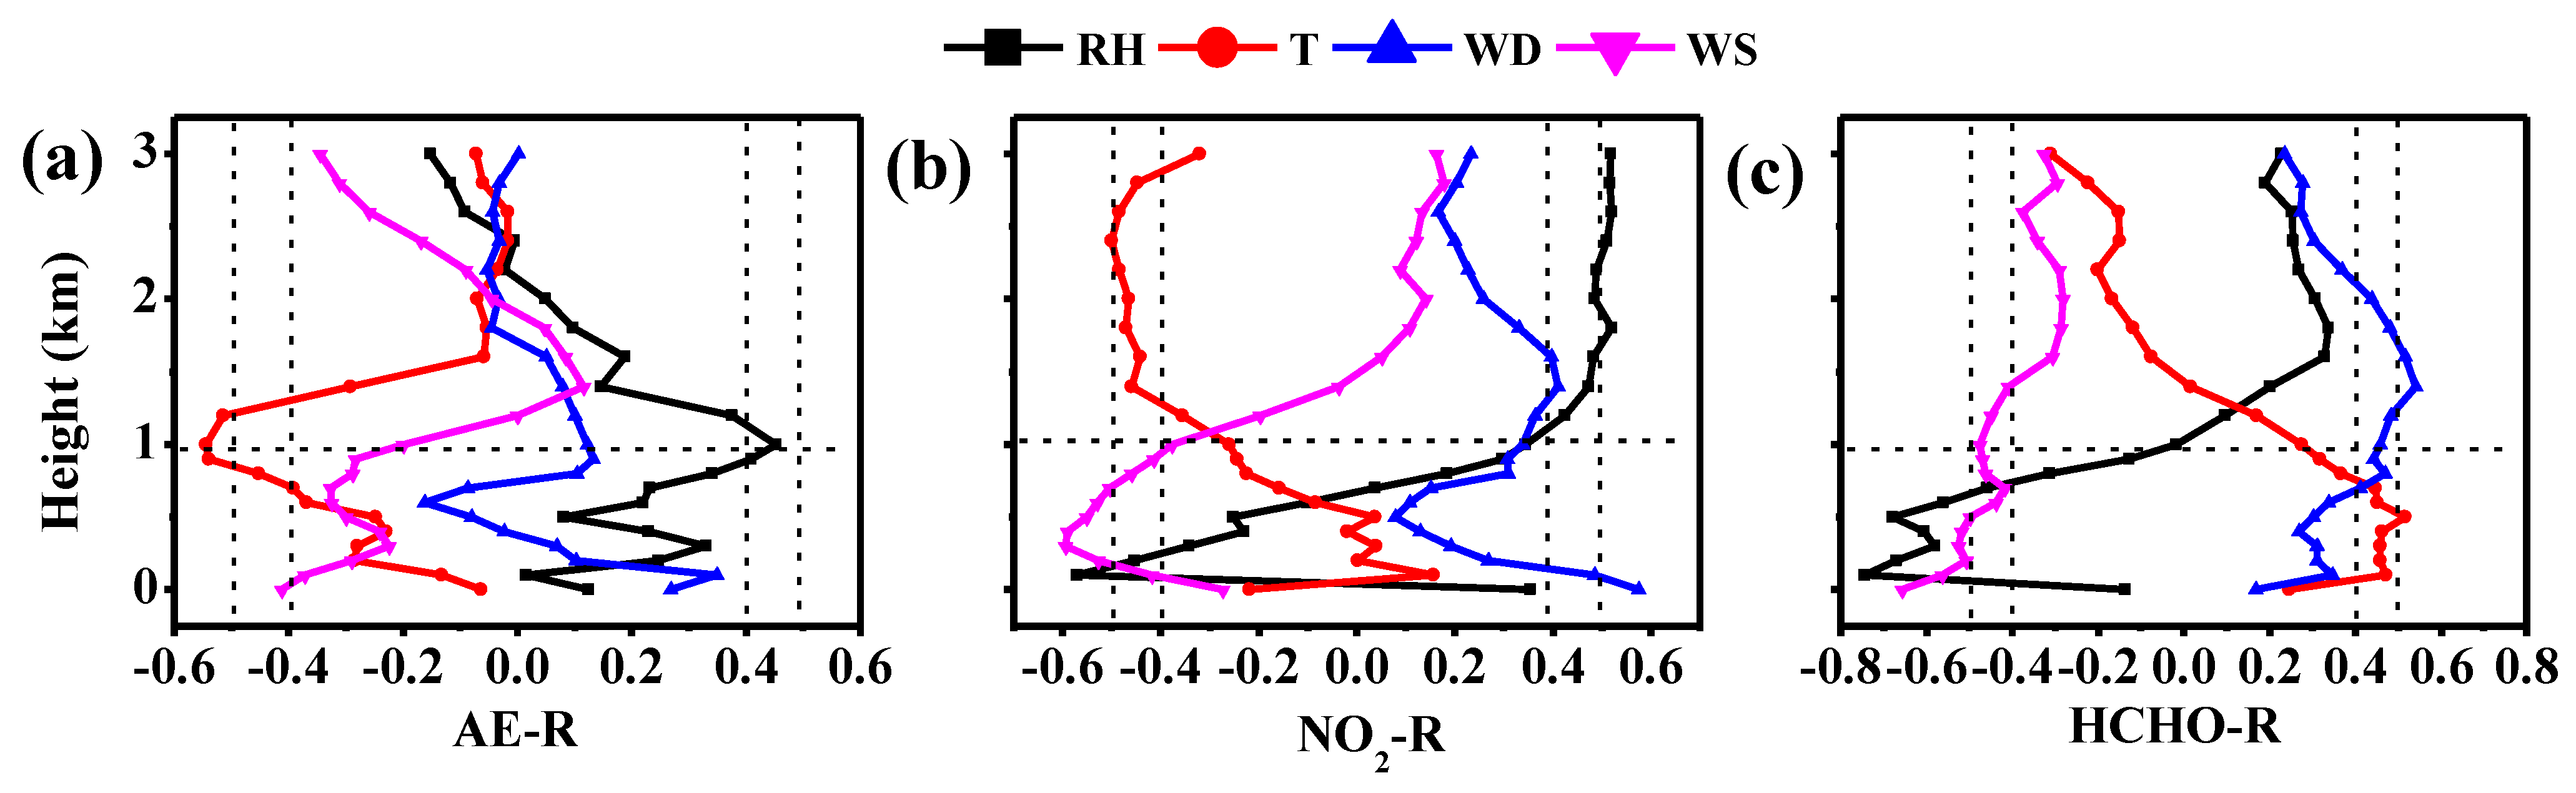
3.3. Vertical Distribution of Meteorological Factors

In order to explore the meteorological factors driving the vertical variation in atmospheric composition, a correlation analysis between the meteorological vertical profile and the atmospheric composition at the corresponding height was carried out. The weather profile obtained using the WRF model simulation showed a RH variation range of 60–90% in vertical height (Figure S4). The T decreased from near the ground to 3 km. The WD was mainly southeast below 1 km and mainly southwest above 1 km. The winds above 1 km were relatively strong (WS > 7.5 m/s), and the average WS at a level above 1 km was concentrated in 6–7 m/s.

3.4. Effects of Air Pollution on Human Health

The health risks posed by PM2.5 are closely related to public health and are receiving increasing attention. Because Huaniao Island has a relatively small population, in this study, we selected Zhoushan City as the research area for health risk assessment and conducted a health risk assessment based on the average PM2.5 of CNEMC in Zhoushan. Table S1 lists the incidence rates and PM2.5 exposure-response coefficients (mean and 95% CI) for the selected health outcomes. There are currently three state control stations in Zhoushan, and the monitoring data from these stations represent the city’s typical air pollution levels. Zhoushan City has good atmospheric conditions and is a relatively clean island area.
The number of cases in Zhoushan that could be linked to particle air pollution was calculated using the exposure-response function, outcome frequency, exposure concentration, and threshold level (Table 2). In 2019, fine particle air pollution was responsible for 117 deaths. There were 151 new cases of chronic bronchitis, 39 hospitalizations for respiratory illnesses, and 27 hospitalizations for cardiovascular illnesses. There were 2684 medical visits and 283 pediatric visits, respectively. In addition, there were 67,659 days of restricted activity, 1263 asthma attacks, and 5167 attacks of acute bronchitis. Moreover, the number of people in Zhoushan who were exposed to PM2.5 in 2019 was 77.74 × 10⁴, accounting for 6.58% of the city’s total population. Compared to thriving urban centers in the YRD region like Shanghai [66] and Hefei [20], the health risks of Zhoushan from particulate matter are relatively low; however, particulate matter emissions still need to be controlled.

4. Discussion

4.1. Vertical Distribution of Meteorological Factors

The relationship between meteorological factors and various gases at a range of vertical heights was investigated using a correlation analysis. Figure 4 shows that, in the range of 500–1000 m, aerosols are negatively and positively correlated with T and RH, respectively. This suggests that a high AE may be related to a high water vapor concentration and that increasing RH promotes secondary particle formation [64,75]. At heights below 1 km, NO2 presents a significant negative correlation with RH and WS and a significant positive correlation with WD, which indicates that the southeast and southwest directions are also the primary sources of NO2 transport near the surface. At altitudes greater than 1 km, NO2 exhibited a negative correlation with T and a positive correlation with RH. Unlike aerosols and NO2, HCHO was significantly correlated with the meteorological factors. At heights below 1 km, HCHO was strongly negatively linked with RH and WS and positively correlated with T. High temperatures contribute to an increase in formaldehyde content [76]. At altitudes greater than 1 km, HCHO had a negative correlation with WS and a positive correlation with WD, indicating that the drop in HCHO concentration is largely caused by an increase in WS [77].
Moreover, the dominant meteorological factors affecting the atmospheric composition (aerosols, NO2, and HCHO) at different altitudes (10 m, 400 m, and 1000 m) were identified using a random forest model [78]. Near the surface (10 m), WS was the main influencing factor for aerosols and HCHO, while WD was the main influencing factor for NO2 (Figure 5). At 400 m, WD was the main controlling factor for aerosols, and WS was the main influencing factor for NO2 and HCHO. At a height of 1 km, T was the main controlling factor for aerosols, and WS was the main influencing factor for NO2 and HCHO. This result verifies the change characteristics of the atmospheric pollution components at vertical heights, as shown in Figure 3. RH, T, and WS had significant effects on formaldehyde at different heights, a finding which is consistent with the conclusions shown in Figure 4. In general, pollutant transport caused by changes in WS was the main reason for the high NO2 and HCHO concentrations at high altitudes (>400 m).

4.2. Potential Sources of Aerosol, NO2, and HCHO

The air mass back trajectories arriving in Zhoushan in July and August 2019 at altitudes of 10 m, 400 m, and 1000 m were computed in order to evaluate the effects of regional transport on atmospheric pollutants (Figure 6). The impact of movement on trace gases (such as NO2 and HCHO) and aerosols, respectively, was assessed using 24 h and 72 h air mass back trajectories, which took into account their various lifetimes. For the associated hourly trajectory arrival timings, the hourly averaged aerosol extinction coefficients, NO2 VMR, and HCHO VMR were employed. Table 3, Table 4 and Table 5 and Figure 6 provide an overview of the key clusters that arrive in Zhoushan at 10 m, 400 m, and 1000 m. For aerosols, cluster 3 is associated with a maximum AE of 10 m (0.27 ± 0.11 km−1), mainly from the South China Sea. Cluster 2 is associated with a maximum extinction coefficient of 400 m (0.53 ± 0.58 km−1), mainly from Zhejiang Province, Fujian Province, and the South China Sea. Cluster 2 is also associated with a maximum extinction coefficient of 1000 m (0.35 ± 0.30 km−1), mainly from the ECS. For NO2, cluster 2 is related to the highest concentrations at 10 m (5.10 ± 3.87 ppb) and 1000 m (0.43 ± 0.39 ppb). This demonstrates that NO2 pollution in Zhoushan at 10 m and 1000 m was significantly affected by short-distance trajectories coming from northern Zhejiang Province and Shanghai. Cluster 4 had the highest concentrations at 400 m (0.84 ± 0.50 ppb), indicating that the short-distance trajectories from the ECS had a considerable impact on NO2 pollution in Zhoushan at 400 m. For HCHO, clusters 3 and 4 were related to the highest concentrations at 10 m (2.19 ± 1.65 ppb), 400 m (2.21 ± 2.69 ppb), and 1000 m (1.94 ± 1.40 ppb). These clusters suggest that HCHO pollution in Zhoushan was significantly impacted by short-distance trajectories coming from the ECS, Hangzhou City.
Additionally, the possible aerosol, NO2, and HCHO source regions in Zhoushan were based on the WPSCF analysis (Figure 7). Local emissions in southeast Zhejiang Province, southeast Fujian Province, Shanghai, the ECS, and the Yellow Sea were the primary possible source locations of aerosols, NO2, and HCHO at all altitudes, which is consistent with the findings of various other studies [50,64,79]. Aerosol sources are widely distributed near the surface; they are mainly distributed in the Yellow Sea, the coastal areas of Zhejiang and Fujian Provinces, and the ECS. Noteworthy was the identification of Korea as a significant potential source of aerosols at 10 m. The main sources of NO2 near the surface are distributed in the coastal urban agglomerations of Zhejiang Province, Fujian Province, and Shanghai. The potential sources of NO2 at 400 and 1000 m were mainly distributed in the ECS around Zhoushan. Local primary emissions are a significant source of NO2 compared to aerosols and HCHO, and we found that industrial primary emissions and ship-related aerosol emissions account for 17.6% of the total NO2 emissions. Local primary emissions are mostly associated with industrial activity in ports. Compared with aerosols and HCHO, local primary emissions are a significant source of NO2, which are mostly associated with industrial activity in ports, and we found that aerosol emissions from ships and industrial primary emissions account for 17.6% [23,51].

5. Conclusions

This investigation demonstrated the features of the vertical and temporal distribution of aerosols, NO2, and HCHO, their meteorological controlling factors, potential pollution sources, and the health risks of fine particles in an island region based on MAX-DOAS vertical observation data. Aerosols, NO2, and HCHO were mostly distributed below 1 km, accounting for 75.72%, 64.79%, and 59.10%, respectively. The vertical distribution of HCHO was Gaussian, and the peak value of HCHO at 1.5 km may be influenced by the high-altitude transport of pollutants caused by typhoon events. Based on the wind profile data, the main meteorological factors controlling aerosols, NO2, and HCHO at different elevations were quantified using correlation analysis and a random forest model. RH and T decreased from near the ground to 3 km. The WDs were mainly southeastern and southwestern. The overall WS was high and may be affected by typhoons. At 500–1000 m, aerosols were negatively correlated with temperature, indicating that aerosols in the upper air mainly originated from secondary particles. The transport of pollutants caused by changes in WS was the main reason for the high aerosol, NO2, and HCHO concentrations in the upper air (more than 400 m). The potential sources of air pollution components at various elevations were qualitatively assessed based on the PSCF model. The main potential source areas of aerosols, NO2, and HCHO were southeastern Zhejiang Province, southeastern Fujian Province, Shanghai, the ECS, and the Yellow Sea. South Korea is a potential source of aerosols near the ground. Compared with aerosols and HCHO, local primary emissions are an important source of NO2, which are mainly related to industrial activities in Zhoushan Port. Finally, the health risk assessment results of PM2.5 pollution in the Zhoushan region showed that 77,390 people were affected by PM2.5 in 2019, accounting for 6.58% of the total population. This study found that port ship transport activities in island areas were important local pollution sources, and the industrialization degree of developed cities had obvious adverse effects on air quality in island areas through regional transmission. The health risks of urban residents in island areas exposed to air pollutants such as NO2 and HCHO deserve further specific research.

Supplementary Materials

The following supporting information can be downloaded at: https://www.mdpi.com/article/10.3390/rs15215103/s1, Figure S1. The research area (a) and the MAX-DAOS instrument location (b). Figure S2: Linear regression plots between MAX-DOAS and HCHO, TROPOMI and HCHO. Figure S3: Diurnal variation in the vertical profiles of NO2 (a) and HCHO (b) during the study period. Figure S4. Vertical profile distribution of relative humidity (RH), temperature (T), wind direction (WD) and wind speed (WS). Table S1: Exposure-response coefficients and incidence rate (per person) used in the analysis.

Author Contributions

Conceptualization, J.O. and C.X.; validation, Y.Z. and J.F.; writing—original draft, J.O.; writing—review and editing, C.X., Q.H. and C.L.; software, J.F., X.J., M.Z., T.L. and Q.L.; formal analysis, X.W., L.L., B.C. and H.Y.; resources, C.L. All authors have read and agreed to the published version of the manuscript.

Funding

This research was supported by grants from the Natural Science Foundation of Anhui Province (2208085QD117) and the National Natural Science Foundation of China (42207113).

Data Availability Statement

QDOAS spectral fitting software (http://uv-vis.aeronomie.be/software/QDOAS/, accessed on 22 December 2022). The HYSPLIT (Hybrid Single particle Lagrangian Integrated Trajectory) model (https://www.ready.noaa.gov/HYSPLIT.php, accessed on 15 October 2023). The China National Environmental Monitoring Center (CNEMC) network (https://quotsoft.net/air/, accessed on 1 September 2023).

Acknowledgments

We acknowledge all developers for contributing to the development of the WRF-Chem model and our access to the WRF-Chem preprocessor tool mozbc and fire_emiss provided by the Atmospheric Chemistry Observations and Modeling Lab (ACOM) of NCAR. We thank the NCEP for providing the final reanalysis dataset (FNL) and the Remote Sensing Group of the University of Science and Technology of China for the support and help with the ground remote sensing data. We thank the Belgian Institute for Space Aeronomy (BIRAIASB), Brussels, Belgium, for their freely accessible QDOAS software. We acknowledge the great contribution of the SCIATRAN radiative transfer model. We thank the National Oceanic and Atmospheric Administration (NOAA) Air Resources Laboratory (ARL) for the provision of the HYSPLIT transport and dispersion model.

Conflicts of Interest

The authors declare no conflict of interest.

References

  1. Sadiktsis, I.; Galvao, M.F.O.; Mustafa, M.; Toublanc, M.; Endirlik, B.Ü.; Silvergren, S.; Johansson, C.; Dreij, K. A yearlong monitoring campaign of polycyclic aromatic compounds andother air pollutants at three sites in Sweden: Source identification, in vitrotoxicity and human health risk assessment. Chemosphere 2023, 332, 138862. [Google Scholar] [CrossRef] [PubMed]
  2. Yuan, J.; Wang, X.; Feng, Z.; Zhang, Y.; Yu, M. Spatiotemporal Variations of Aerosol Optical Depth and the Spatial Heterogeneity Relationship of Potential Factors Based on the Multi-Scale Geographically Weighted Regression Model in Chinese National-Level Urban Agglomerations. Remote Sens. 2023, 15, 4613. [Google Scholar] [CrossRef]
  3. Kanakidou, M.; Seinfeld, J.H.; Pandis, S.N.; Barnes, I.; Dentener, F.J.; Facchini, M.C.; Van Dingenen, R.; Ervens, B.; Nenes, A.; Nielsen, C.J.; et al. Organic aerosol and global climate modelling: A review. Atmos. Chem. Phys. 2005, 5, 1053–1123. [Google Scholar] [CrossRef]
  4. Xu, S.; Wang, S.; Xia, M.; Lin, H.; Xing, C.; Ji, X.; Su, W.; Tan, W.; Liu, C.; Hu, Q. Observations by Ground-Based MAX-DOAS of the Vertical Characters of Winter Pollution and the Influencing Factors of HONO Generation in Shanghai, China. Remote Sens. 2021, 13, 3518. [Google Scholar] [CrossRef]
  5. Li, N.; Zhang, H.R.; Zhu, S.H.; Liao, H.; Hu, J.L.; Tang, K.Q.; Feng, W.H.; Zhang, R.H.; Shi, C.; Xu, H.M.; et al. Secondary PM2.5 dominates aerosol pollution in the Yangtze River Delta region: Environmental and health effects of the Clean air Plan. Environ. Int. 2023, 171, 107725. [Google Scholar] [CrossRef]
  6. Tian, X.; Xie, P.H.; Xu, J.; Li, A.; Wang, Y.; Qin, M.; Hu, Z.K. Long-term observations of tropospheric NO2, SO2 and HCHO by MAX-DOAS in Yangtze River Delta area, China. J. Environ. Sci. 2018, 71, 207–221. [Google Scholar] [CrossRef]
  7. Klompmaker, J.O.; Hoek, G.; Bloemsma, L.D.; Wijga, A.H.; van den Brink, C.; Brunekreef, B.; Lebret, E.; Gehring, U.; Janssen, N.A.H. Associations of combined exposures to surrounding green, air pollution and traffic noise on mental health. Eniron. Int. 2019, 129, 525–537. [Google Scholar] [CrossRef]
  8. Gignac, F.; Righi, V.; Toran, R.; Errandonea, L.P.; Ortiz, R.; Mijling, B.; Naranjo, A.; Nieuwenhuijsen, M.; Creus, J.; Basagaña, X. Short-term NO2 exposure and cognitive and mental health: A panel study based on a citizen science project in Barcelona, Spain. Environ. Int. 2022, 164, 107284. [Google Scholar] [CrossRef]
  9. Fan, J.C.; Wang, T.J.; Wang, Q.G.; Ma, D.Y.; Li, Y.S.; Zhou, M.Q.; Wang, T. Assessment of HCHO in Beijing during 2009 to 2020 using satellite observation and numerical model: Spatial characteristic and impact factor. Sci. Total Environ. 2023, 894, 165050. [Google Scholar] [CrossRef]
  10. Su, W.J.; Hu, Q.H.; Chen, Y.J.; Lin, J.N.; Zhang, C.X.; Liu, C. Inferring global surface HCHO concentrations from multisource hyperspectral satellites and their application to HCHO-related global cancer burden estimation. Environ. Int. 2022, 170, 107600. [Google Scholar] [CrossRef]
  11. Shen, Y.; Jiang, F.; Feng, S.Z.; Zheng, Y.H.; Cai, Z.; Lyu, X.P. Impact of weather and emission changes on NO2 concentrations in China during 2014–2019. Environ. Pollut. 2020, 269, 116163. [Google Scholar] [CrossRef] [PubMed]
  12. Notario, A.; Gutiérrez-Álvarez, I.; Adame, J.A. Atmospheric benzene measurements in the main metropolitan and industrial areas of Spain from 2014 to 2017. Atmos. Res. 2020, 238, 104896. [Google Scholar] [CrossRef]
  13. Xue, J.X.; Zhao, T.; Luo, Y.F.; Miao, C.K.; Su, P.J.; Liu, F.; Zhang, G.H.; Qin, S.D.; Song, Y.T.; Bu, N.S.; et al. Identification of ozone sensitivity for NO2 and secondary HCHO based on MAX-DOAS measurements in northeast China. Environ. Int. 2022, 160, 107048. [Google Scholar] [CrossRef] [PubMed]
  14. Yang, X.Y.; Gao, Y.G.; Li, Q.B.; He, J.; Liu, Y.; Duan, K.Q.; Xu, X.J.; Ji, D.S. Maritime and coastal observations of ambient PM2.5 and its elemental compositions in the Bohai Bay of China during spring and summer: Levels, spatial distribution and source apportionment. Atmos. Res. 2023, 293, 106897. [Google Scholar] [CrossRef]
  15. Feng, T.; Liu, L.; Zhao, S.Y. Impacts of haze and nitrogen oxide alleviation on summertime ozone formation: A modeling study over the Yangtze River Delta, China. Environ. Pollut. 2023, 335, 122347. [Google Scholar] [CrossRef]
  16. Gao, C.Y.; Xing, C.Z.; Tan, W.; Lin, H.; Bu, N.S.; Xue, J.X.; Liu, F.; Liu, W.Q. Vertical characteristics and potential sources of aerosols over northeast China using ground-based MAX-DOAS. Atmos. Pollut. Res. 2023, 14, 101691. [Google Scholar] [CrossRef]
  17. Requia, W.J.; Higgins, C.D.; Adams, M.D.; Mohamed, M.; Koutrakis, P. The health impacts of weekday traffic: A health risk assessment of PM2.5 emissions during congested periods. Environ. Int. 2018, 111, 164–176. [Google Scholar] [CrossRef]
  18. Sheng, L.; Qin, M.; Li, L.; Wang, C.; Gong, K.; Liu, T.; Li, J.; Hu, J. Impacts of emissions along the lower Yangtze River on air quality and public health in the Yangtze River delta, China. Atmos. Pollut. Res. 2022, 13, 101420. [Google Scholar] [CrossRef]
  19. Tan, W.; Zhao, S.H.; Liu, C.; Chan, K.L.; Xie, Z.Q.; Zhu, Y.; Su, W.J.; Zhang, C.X.; Liu, H.R.; Xing, C.Z.; et al. Estimation of winter time NOx emissions in Hefei, a typical inland city of China, using mobile MAX-DOAS observations. Atmos. Environ. 2019, 200, 228–242. [Google Scholar] [CrossRef]
  20. Ou, J.P.; Hu, Q.H.; Liu, H.R.; Hong, Q.Q.; Wang, X.Q.; Xu, S.Q.; Wang, Z.; Liu, W.Q. Characteristic Analysis of Continuous New Particle Formation Events in Hefei: A Case Study of the May Day Holiday in China. Ecotox. Environ. Saf. 2021, 220, 112329. [Google Scholar] [CrossRef]
  21. Reddy, K.R.O.; Zhang, X.Y.; Bi, L. Seasonal aerosol variations over a coastal city, Zhoushan, China from CALIPSO observations. Atmos. Res. 2019, 218, 117–128. [Google Scholar] [CrossRef]
  22. Su, W.J.; Liu, C.; Hu, Q.H.; Zhao, S.F.; Sun, Y.W.; Wang, W.; Zhu, Y.Z.; Liu, J.G.; Kim, J. Primary and secondary sources of ambient formaldehyde in the Yangtze River Delta based on ozone mapping and profiler suite (OMPS) observations. Atmos. Chem. Phys. 2019, 19, 6717–6736. [Google Scholar] [CrossRef]
  23. Wang, F.J.; Chen, Y.; Meng, X.; Fu, J.P.; Wang, B. The contribution of anthropogenic sources to the aerosols over East China Sea. Atmos. Environ. 2016, 127, 22–33. [Google Scholar] [CrossRef]
  24. Wang, B.; Chen, Y.; Zhou, S.Q.; Li, H.W.; Wang, F.H.; Yang, T.J. The influence of terrestrial transport on visibility and aerosol properties over the coastal East China Sea. Sci. Total Environ. 2019, 649, 652–660. [Google Scholar] [CrossRef]
  25. Xue, R.B.; Wang, S.S.; Li, D.R.; Zou, Z.; Chan, K.L.; Valks, P.; Saiz-Lopez, A.; Zhou, B. Spatio-temporal variations in NO2 and SO2 over Shanghai and Chongming Eco-Island measured by Ozone Monitoring Instrument (OMI) during 2008–2017. J. Clean. Prod. 2020, 258, 120563. [Google Scholar] [CrossRef]
  26. Wu, C.H.; Yuan, C.S.; Yen, P.H.; Yeh, M.J.; Soong, K.Y. Diurnal and seasonal variation, chemical characteristics, and source identification of marine fine particles at two remote islands in South China Sea: A superimposition effect of local emissions and long-range transport. Atmos. Environ. 2022, 270, 118889. [Google Scholar] [CrossRef]
  27. Hu, Q.H.; Liu, C.; Li, Q.H.; Liu, T.; Ji, X.G.; Zhu, Y.Z.; Xing, C.Z.; Liu, H.R.; Tan, W.; Gao, M. Vertical profiles of the transport fluxes of aerosol and its precursors between Beijing and its southwest cities. Environ. Pollut. 2022, 312, 119988. [Google Scholar] [CrossRef]
  28. Fan, J.; Han, B.; Varble, A.; Morrison, H.; North, K.; Kollias, P.; Chen, B.; Dong, X.; Giangrande, S.E.; Khain, A. Cloud-resolving Model Intercomparison of an MC3E Squall Line Case: Part I—Convective Updrafts. J. Geophys. Res.-Atmos. 2017, 122, 9351–9378. [Google Scholar] [CrossRef]
  29. Shan, Y.; Shi, H.; Fan, J.; Lin, L.; Gao, L.; He, C.; Gao, M.; Miao, L.; Zhang, L.; Xia, X. Revealing Bias of Cloud Radiative Effect in WRF Simulation: Bias Quantification and Source Attribution. J. Geophys. Res.-Atmos. 2022, 127, e2021JD036319. [Google Scholar] [CrossRef]
  30. Milbrandt, J.A.; McTaggart-Cowan, R. Sedimentation-Induced Errors in Bulk Microphysics Schemes. J. Atmos. Sci. 2010, 67, 3931–3948. [Google Scholar] [CrossRef]
  31. Lin, L.; Fu, Q.; Liu, X.; Shan, Y.; Giangrande, S.E.; Elsaesser, G.S.; Yang, K.; Wang, D. Improved Convective Ice Microphysics Parameterization in the NCAR CAM Model. J. Geophys. Res.-Atmos. 2021, 126, e2020JD034157. [Google Scholar] [CrossRef]
  32. Lin, L.; Liu, X.; Fu, Q.; Shan, Y. Climate Impacts of Convective Cloud Microphysics in NCAR CAM5. J. Climate 2023, 36, 3183–3202. [Google Scholar] [CrossRef]
  33. Shan, Y.; Wilcox, E.M.; Gao, L.; Lin, L.; Mitchell, D.L.; Yin, Y.; Zhao, T.; Zhang, L.; Shi, H.; Gao, M. Evaluating Errors in Gamma-Function Representations of the Raindrop Size Distribution: A Method for Determining the Optimal Parameter Set for Use in Bulk Microphysics Schemes. J. Atmos. Sci. 2020, 77, 513–529. [Google Scholar] [CrossRef]
  34. Shan, Y.; Liu, X.; Lin, L.; Ke, Z.; Lu, Z.; Tilmes, S.; Gao, L.; Yu, P. The Role of In-Cloud Wet Removal in Simulating Aerosol Vertical Profiles and Cloud Radiative Forcing. J. Geophys. Res.-Atmos. 2023, 128, D038564. [Google Scholar] [CrossRef]
  35. Ghan, S.J.; Abdul-Razzak, H.; Nenes, A.; Ming, Y.; Liu, X.; Ovchinnikov, M.; Shipway, B.; Meskhidze, N.; Xu, J.; Shi, X. Droplet Nucleation: Physically-Based Parameterizations and Comparative Evaluation. J. Adv. Model. Earth Syst. 2011, 3. [Google Scholar] [CrossRef]
  36. Fan, J.; Wang, Y.; Rosenfeld, D.; Liu, X. Review of Aerosol–Cloud Interactions: Mechanisms, Significance, and Challenges. J. Atmos. Sci. 2016, 73, 4221–4252. [Google Scholar] [CrossRef]
  37. Jiang, H.; Yin, Y.; Su, H.; Shan, Y.; Gao, R. The Characteristics of Atmospheric Ice Nuclei Measured at the Top of Huangshan (the Yellow Mountains) in Southeast China Using a Newly Built Static Vacuum Water Vapor Diffusion Chamber. Atmos. Res. 2015, 153, 200–208. [Google Scholar] [CrossRef]
  38. Jiang, H.; Yin, Y.; Wang, X.; Gao, R.; Yuan, L.; Chen, K.; Shan, Y. The Measurement and Parameterization of Ice Nucleating Particles in Different Backgrounds of China. Atmos. Res. 2016, 181, 72–80. [Google Scholar] [CrossRef]
  39. Zhang, X.; Yin, Y.; Lin, Z.; Han, Y.; Hao, J.; Yuan, L.; Chen, K.; Chen, J.; Kong, S.; Shan, Y. Observation of Aerosol Number Size Distribution and New Particle Formation at a Mountainous Site in Southeast China. Sci. Total Environ. 2017, 575, 309–320. [Google Scholar] [CrossRef]
  40. Zhang, L.; Zhao, T.; Gong, S.; Kong, S.; Tang, L.; Liu, D.; Wang, Y.; Jin, L.; Shan, Y.; Tan, C. Updated Emission Inventories of Power Plants in Simulating Air Quality during Haze Periods over East China. Atmos. Chem. Phys. 2018, 18, 2065–2079. [Google Scholar] [CrossRef]
  41. Yu, P.; Froyd, K.D.; Portmann, R.W.; Toon, O.B.; Freitas, S.R.; Bardeen, C.G.; Brock, C.; Fan, T.; Gao, R.; Katich, J.M. Efficient In-Cloud Removal of Aerosols by Deep Convection. Geophys. Res. Lett. 2019, 46, 1061–1069. [Google Scholar] [CrossRef] [PubMed]
  42. Shan, Y.; Liu, X.; Lin, L.; Ke, Z.; Lu, Z. An Improved Representation of Aerosol Wet Removal by Deep Convection and Impacts on Simulated Aerosol Vertical Profiles. J. Geophys. Res.-Atmos. 2021, 126, e2020JD034173. [Google Scholar] [CrossRef]
  43. Ke, Z.; Liu, X.; Wu, M.; Shan, Y.; Shi, Y. Improved Dust Representation and Impacts on Dust Transport and Radiative Effect in CAM5. J. Adv. Model Earth Syst. 2022, 14, e2021MS002845. [Google Scholar] [CrossRef]
  44. Lou, X.; Shi, Y.; Shan, Y. A Numerical Simulation of CCN Impacts on Weather Modification Efficiency. Front. Environ. Sci. 2023, 11, 1181207. [Google Scholar] [CrossRef]
  45. Schreier, S.F.; Richter, A.; Peters, E.; Ostendorf, M.; Schmalwieser, A.W.; Weihs, P.; Burrows, J.P. Dual ground-based MAX-DOAS observations in Vienna, Austria: Evaluation of horizontal and temporal NO2, HCHO, and CHOCHO distributions and comparison with independent data sets. Atmos. Environ. 2019, 5, 100059. [Google Scholar] [CrossRef]
  46. Liu, C.; Xing, C.Z.; Hu, Q.H.; Li, Q.H.; Liu, H.R.; Hong, Q.Q.; Tan, W.; Ji, X.G.; Lin, H.; Lu, C.; et al. Ground-based hyperspectral stereoscopic remote sensing network: A promising strategy to learn coordinated control of O3 and PM2.5 over China. Engineering 2022, 19, 71–83. [Google Scholar] [CrossRef]
  47. Javed, Z.; Liu, C.; Khokhar, M.F.; Xing, C.Z.; Tan, W.; Subhani, M.A.; Rehman, A.; Tanvir, A. Investigating the impact of Glyoxal retrieval from MAX-DOAS observations during haze and non-haze conditions in Beijing. J. Environ. Sci. 2019, 80, 296–305. [Google Scholar] [CrossRef]
  48. Shoaib, A.; Khokhar, M.F.; Sandhu, O. Investigating the temporal variation of formaldehyde using MAX-DOAS and satellite observations over Islamabad, Pakistan. Atmos. Pollut. Res. 2020, 11, 193–204. [Google Scholar] [CrossRef]
  49. Ji, X.G.; Liu, C.; Wang, Y.; Hu, Q.H.; Lin, H.; Zhao, F.; Xing, C.Z.; Tang, G.Q.; Zhang, J.Q.; Wagner, T. Ozone profiles without blind area retrieved from MAX-DOAS measurements and comprehensive validation with multi-platform observations. Remote Sens. Environ. 2023, 284, 113339. [Google Scholar] [CrossRef]
  50. Ren, B.; Xie, P.H.; Xu, J.; Li, A.; Tian, X.; Hu, Z.K.; Huang, Y.Y.; Li, X.M.; Zhang, Q.; Ren, H.M.; et al. Use of the PSCF method to analyze the variations of potential sources and transports of NO2, SO2, and HCHO observed by MAX-DOAS in Nanjing, China during 2019. Sci. Total Environ. 2021, 782, 146865. [Google Scholar] [CrossRef]
  51. Xing, C.Z.; Liu, C.; Hong, Q.Q.; Liu, H.R.; Wu, H.Y.; Lin, J.N.; Song, Y.H.; Chen, Y.J.; Liu, T.; Hu, Q.H.; et al. Vertical distributions and potential sources of wintertime atmospheric pollutants and the corresponding ozone production on the coast of Bohai Sea. J. Environ. Manag. 2022, 319, 115721. [Google Scholar] [CrossRef] [PubMed]
  52. Zheng, X.J.; Javed, Z.S.; Liu, C.; Tanvir, A.; Sandhu, O.; Liu, H.R.; Ji, X.G.; Xing, C.Z.; Lin, H.; Du, D.L. MAX-DOAS and in-situ measurements of aerosols and trace gases over Dongying, China: Insight into ozone formation sensitivity based on secondary HCHO. J. Environ. Sci. 2024, 135, 656–668. [Google Scholar] [CrossRef] [PubMed]
  53. Zhou, S.; Li, H.; Yang, T.; Chen, Y.; Deng, C.; Gao, Y.; Chen, C.P.; Xu, J. Characteristics and sources of aerosol aminiums over the eastern coast of China: Insights from the integrated observations in a island city, adjacent island and the marginal seas. Atmos. Chem. Phys. 2019, 19, 10447–10467. [Google Scholar] [CrossRef]
  54. Vandaele, A.C.; Hermans, C.; Simon, P.C.; Carleer, M.; Colin, R.; Fally, S.; Mérienne, M.F.; Jenouvrier, A.; Coquart, B. Measurements of the NO2 obsorption cross section rom 42000 cm−1 to 10000 cm−1 (238–1000 nm) at 220 K and 294 K. J. Quant. Spectrosc. Radiat. Transf. 1998, 59, 171–184. [Google Scholar] [CrossRef]
  55. Serdyuchenko, A.; Gorshelev, V.; Weber, M.; Chehade, W.; Burrows, J. High spectral resolution ozone absorption cross-sections–Part 2: Temperature dependence. Atmos. Meas. Tech. 2014, 7, 625–636. [Google Scholar] [CrossRef]
  56. Thalman, R.; Volkamer, R. Temperature dependent absorption cross-sections of O2–O2 collision pairs between 340 and 630 nm and at atmospherically relevant pressure. Phys. Chem. Chem. Phys. 2013, 15, 15371–15381. [Google Scholar] [CrossRef]
  57. Fleischmann, O.C.; Hartmann, M.; Burrows, J.P.; Orphal, J. New ultraviolet absorption cross-sections of BrO at atmospheric temperatures measured by time-windowing Fourier transform spectroscopy. J. Photochem. Photobiol. A Chem. 2004, 168, 117–132. [Google Scholar] [CrossRef]
  58. Rothman, L.S.; Gordon, I.E.; Barbe, A.; Benner, D.C.; Bernath, P.F.; Birk, M.; Boudon, V.; Brown, L.R.; Campargue, A.; Champion, J.P. The HITRAN 2008 molecular spectroscopic database. J. Quant. Spectrosc. Radiat. Transf. 2009, 110, 533–572. [Google Scholar] [CrossRef]
  59. Meller, R.; Moortgat, G.K. Temperature dependence of the absorption cross sections formaldehyde between 223 and 323 K in the wavelength range 225–375 nm. J. Geophys Res.-Biogeo 2000, 105, 7089–7101. [Google Scholar] [CrossRef]
  60. Chance, K.V.; Spurr, R.J. Ring effect studies: Rayleigh scattering, including molecular parameters for rotational Raman scattering, and the Fraunhofer spectrum. Appl. Opt. 1997, 36, 5224–5230. [Google Scholar] [CrossRef]
  61. Chance, K.; Kurucz, R.L. An improved high-resolution solar reference spectrum for earth’s atmosphere measurements in the ultraviolet, visible, and near infrared. J. Quant. Pectrosc. Radiat. Transf. 2010, 111, 1289–1295. [Google Scholar] [CrossRef]
  62. Frieß, U.; Monks, P.S.; Remedios, J.J.; Rozanov, A.; Sinreich, R.; Wagner, T.; Platt, U. MAX-DOAS O4 measurements: A new technique to derive information on atmospheric aerosols: 2. Modeling studies. J. Geophys. Res.-Atmos. 2006, 111, D14203. [Google Scholar] [CrossRef]
  63. Rozanov, V.V.; Kurosu, T.; Burrows, J.P. Retrieval of atmospheric constituents in the UV-Visible: A new quasi-analytical approach for the calculation of weighting functions. J. Quant. Spectrosc. Radiat. Transf. 1998, 60, 277–299. [Google Scholar] [CrossRef]
  64. Ou, J.P.; Hu, Q.H.; Liu, H.R.; Hong, Q.Q.; Xing, C.Z.; Tan, W.; Lin, H.; Wang, X.Q.; Xu, H.; Zhu, P.C.; et al. Vertical Characterization and Potential Sources of Aerosols in Different Seasons over the Yangtze River Delta Using Ground-Based MAX-DOAS. Environ. Pollut. 2021, 279, 116898. [Google Scholar] [CrossRef]
  65. Wang, Y.; Zhang, X.; Draxler, R.R. TrajStat: GIS-based software that uses various trajectory statistical analysis methods to identify potential sources from long-term air pollution measurement data. Environ. Model. Softw. 2009, 24, 938–939. [Google Scholar] [CrossRef]
  66. Kan, H.D.; Chen, B.H. Particulate air pollution in urban areas of Shanghai, China: Health based economic assessment. Sci. Total Environ. 2004, 322, 71–79. [Google Scholar] [CrossRef]
  67. Xu, X.M.; Zhang, H.F.; Chen, J.M.; Li, Q.; Wang, X.F.; Wang, W.X.; Zhang, Q.Z.; Xue, L.K.; Ding, A.J.; Mellouki, A. Six sources mainly contributing to the haze episodes and health risk assessment of PM2.5 at Beijing suburb in winter 2016. Ecotox. Environ. Saf. 2018, 166, 146–156. [Google Scholar] [CrossRef]
  68. Barrero, M.A.; Orza, J.A.G.; Cabello, M.; Canton, L. Categorisation of air quality monitoring stations by evaluation of PM10 variability. Sci. Total Environ. 2015, 524–525, 225–236. [Google Scholar] [CrossRef]
  69. Yin, H.; Liu, C.; Hu, Q.; Liu, T.; Wang, S.; Gao, M.; Xu, S.; Zhang, C.; Su, W. Opposite impact of emission reduction during the COVID-19 lockdown period on the surface concentrations of PM2.5 and O3 in Wuhan, China. Environ. Pollut. 2021, 289, 117899. [Google Scholar] [CrossRef]
  70. Hong, Q.Q.; Liu, C.; Hu, Q.H.; Xing, C.Z.; Tan, W.; Liu, H.R.; Huang, Y.; Zhu, Y.; Zhang, J.S.; Geng, T.Z.; et al. Evolution of the vertical structure of air pollutants during winter heavy pollution episodes: The role of regional transport and potential sources. Atmos. Res. 2019, 228, 206–222. [Google Scholar] [CrossRef]
  71. Zou, Z.; Zhao, J.R.; Zhang, C.G.; Zhang, Y.; Yang, X.; Chen, J.M.; Xu, J.P.; Xue, R.P.; Zhou, B. Effects of cleaner ship fuels on air quality and implications for future policy: A case study of Chongming Ecological Island in China. J. Clean. Prod. 2020, 267, 122088. [Google Scholar] [CrossRef]
  72. Dasgupta, P.K.; Li, J.; Zhang, G.; Luke, W.T.; McClenny, W.A.; Stutz, J.; Fried, A. Summertime ambient formaldehyde in five US metropolitan areas: Nashville, Atlanta, Houston, Philadelphia, and Tampa. Environ. Sci. Technol. 2005, 39, 4767–4783. [Google Scholar] [CrossRef] [PubMed]
  73. Li, C.J.; Wang, X.H.; Zhu, L.X.; Liu, K.; Zong, C.X.; Wei, N.; Li, D. Enhanced impacts evaluation of Typhoon Sinlaku (2020) on atmospheric microplastics in South China Sea during the East Asian Summer Monsoon. Sci. Total Environ. 2022, 806, 150767. [Google Scholar] [CrossRef] [PubMed]
  74. Zhang, R.F.; Wang, S.S.; Zhang, S.B.; Xue, R.B.; Zhu, J.; Zhou, B. MAX-DOAS observation in the midlatitude marine boundary layer: Influences of typhoon forced air mass. J. Environ. Sci. 2022, 120, 63–73. [Google Scholar] [CrossRef]
  75. Sun, T.Z.; Che, H.Z.; Qi, B.; Wang, Y.Q.; Dong, Y.S.; Xia, X.G.; Wang, H.; Gui, K.; Zheng, Y.; Zhao, H.J.; et al. Aerosol optical characteristics and their vertical distributions under enhanced haze pollution events: Effect of the regional transport of different aerosol types over eastern China. Atmos. Chem. Phys. 2018, 18, 2949–2971. [Google Scholar] [CrossRef]
  76. Souri, A.H.; Kumar, R.; Chong, H.S.; Golbazi, M.Y.; Knowland, K.E.; Geddes, J.; Johnson, M.S. Decoupling in the vertical shape of HCHO during a sea breeze event: The effect on trace gas satellite retrievals and column-to-surface translation. Atmos. Environ. 2023, 309, 119929. [Google Scholar] [CrossRef]
  77. Wang, Y.; Ali, M.A.; Bilal, M.; Qiu, Z.F.; Mhawish, A.; Almazroui, M.; Shahid, S.; Islam, M.N.; Zhang, Y.Z.; Hague, M.N. Identification of NO2 and SO2 Pollution Hotspots and Sources in Jiangsu Province of China. Remote Sens. 2021, 13, 3742. [Google Scholar] [CrossRef]
  78. Chen, Q.L.; Ding, J.; Zhu, D.; Hu, H.W.; Delgado-Baquerizo, M.; Ma, Y.B.; He, J.Z.; Zhu, Y.G. Rare microbial taxa as the major drivers of ecosystem multi functionality in long-term fertilized soils. Soil Biol. Biochem. 2020, 141, 107686. [Google Scholar] [CrossRef]
  79. Zong, Z.; Wang, X.; Tian, C.; Chen, Y.; Fu, S.; Qu, L.; Ji, L.; Li, J.; Zhang, G. PMF and PSCF based source apportionment of PM2.5 at a regional background site in North China. Atmos. Res. 2018, 203, 207–215. [Google Scholar] [CrossRef]
Figure 1. Examples of O4, NO2, and HCHO DOAS fitting findings at the Zhoushan site.
Remotesensing 15 05103 g001
Figure 2. Linear regression plots between (a) MAX-DOAS AE and CNEMC PM2.5, (b) MAX-DOAS NO2 and CNEMC NO2.
Remotesensing 15 05103 g002
Figure 3. The averaged vertical profiles of aerosols (a), NO2 (b), and HCHO (c) from July to August 2019. Error bars represent the mean retrieved errors of AE, NO2, and HCHO.
Remotesensing 15 05103 g003
Figure 4. Correlations of (a) AE-R (between aerosol extinction coefficient and meteorological factors), (b) NO2-R (between NO2 and meteorological factors), and (c) HCHO-R (between HCHO and meteorological factors). The meteorological factors include RH, T, WD and WS.
Remotesensing 15 05103 g004
Figure 5. Random forest regression model shows the main meteorological drivers of aerosols (a), NO2 (b), and HCHO (c). The MSE stands for mean square error. The related taxa had a substantial impact on these atmospheric components, as indicated by the symbols * p < 0.05, ** p < 0.01, and *** p < 0.001 on the bar.
Remotesensing 15 05103 g005
Figure 6. The average 24 h (above) and 72 h (below) backward trajectory of arrivals at Zhoushan at 10 m (a), 400 m (b) and 1000 m (c) in July–August 2019.
Remotesensing 15 05103 g006
Figure 7. WPSCF distribution map of 1–3 represents aerosols (upper panel), NO2 (middle panel), and HCHO (lower panel) at the Zhoushan site at 10 m (a), 400 m (b), and 1000 m (c) from July to August 2019.
Remotesensing 15 05103 g007
Table 1. Setting up the DOAS retrieval for a spectrum analysis of NO2, O4, and HCHO.
ParameterData SourceFitting Interval (nm)
O4/NO2HCHO
Wavelength range 338–370322.5–358
NO2298 K, I0 correction (SCD of 1017 molecules cm−2) [54]
NO2220 K, I0 correction (SCD of 1017 molecules cm−2) [54]
O3223 K, I0 correction (SCD of 1020 molecules cm−2) [55]
O3243 K, I0 correction (SCD of 1020 molecules cm−2) [55]
O4293 K [56]
BrO223 K [57]
H2O296 K, HITEMP [58]×
HCHO297 K [59]
Ringcalculated with QDOAS [60]
Wavelength calibrationA high-resolution solar reference spectrum (SAO2010 solar spectra) [61]
Polynomial degree Order 3Order 5
Intensity offset ConstantConstant
Table 2. Cases attributable to particle air pollution in Zhoushan’s urban area in 2019 (mean and 95% CI).
Health EndpointsAttributable Number of Cases
Long-term mortality (adult > 30 years)112 (68, 158)
Chronic bronchitis151 (43, 258)
Short-term mortality5 (2, 8)
Respiratory hospital admission39 (3, 75)
Cardiovascular hospital admission27 (14, 39)
Outpatient visits—internal medicine2684 (1500, 3868)
Outpatient visits—pediatrics283 (102, 465)
Acute bronchitis5167 (1782, 8527)
Asthma attack (children < 15 years)735 (452, 1034)
Asthma attack (adults > 15 years)528 (258, 797)
RADs (adults > 20 years)67,659 (56,950, 78,335)
Sum77,390 (61,173, 93,564)
RADs: Days of restricted activity are defined as any days where a respondent was forced to alter his or her normal activity.
Table 3. Trajectory ratios and averaged AE for all trajectory clusters arriving at Zhoushan at 10 m, 400 m, and 1000 m from July to August 2019.
ClusterRatio (%)AE (km−1)
Mean ± SD
10 m128.280.27 ± 0.21
237.120.24 ± 0.10
334.600.28 ± 0.13
all100.000.25 ± 0.14
400 m140.400.33 ± 0.52
226.010.53 ± 0.58
333.590.37 ± 0.82
all100.000.39 ± 0.63
1000 m116.670.28 ± 0.21
230.560.35 ± 0.30
332.320.27 ± 0.20
420.450.32 ± 0.31
all100.000.31 ± 0.26
Table 4. Trajectory ratios and averaged NO2 for all trajectory clusters arriving at Zhoushan at 10 m, 400 m, and 1000 m from July to August 2019.
ClusterRatio (%)NO2 (ppb)
Mean ± SD
10 m148.991.42 ± 1.24
214.395.10 ± 3.87
336.622.77 ± 2.08
all100.002.34 ± 2.19
400 m132.830.28 ± 0.26
212.630.35 ± 0.18
337.370.45 ± 0.40
417.170.84 ± 0.50
all100.000.43 ± 0.39
1000 m138.890.37 ± 0.31
221.210.43 ± 0.39
325.000.32 ± 0.28
414.900.43 ± 0.36
all100.000.38 ± 0.33
Table 5. Trajectory ratios and averaged HCHO for all trajectory clusters arriving at Zhoushan at 10 m, 400 m, and 1000 m from July to August 2019.
ClusterRatio (%)HCHO (ppb)
Mean ± SD
10 m148.992.10 ± 1.33
214.391.76 ± 0.77
336.622.19 ± 1.65
all100.002.12 ± 1.47
400 m132.831.54 ± 1.05
212.631.30 ± 0.95
337.372.21 ± 2.69
417.171.91 ± 1.12
all100.001.90 ± 2.10
1000 m138.891.29 ± 0.83
221.211.32 ± 0.82
325.001.61 ± 1.75
414.901.94 ± 1.40
all100.001.55 ± 1.34
Disclaimer/Publisher’s Note: The statements, opinions and data contained in all publications are solely those of the individual author(s) and contributor(s) and not of MDPI and/or the editor(s). MDPI and/or the editor(s) disclaim responsibility for any injury to people or property resulting from any ideas, methods, instructions or products referred to in the content.

