


Feature Relation Guided Cross-View Image Based Geo-Localization

Institute of Geospatial Information, PLA Strategic Support Force Information Engineering University, Zhengzhou 450001, China
*
Author to whom correspondence should be addressed.
Remote Sens. 2023, 15(20), 5029; https://doi.org/10.3390/rs15205029
Submission received: 18 September 2023
/
Revised: 9 October 2023
/
Accepted: 13 October 2023
/
Published: 19 October 2023
(This article belongs to the Special Issue Computer Vision and Image Processing in Remote Sensing)
Abstract
:The goal of cross-view image based geo-localization is to determine the location of a given street-view image by matching it with a collection of geo-tagged aerial images, which has important applications in the fields of remote sensing information utilization and augmented reality. Most current cross-view image based geo-localization methods focus on the image content and ignore the relations between feature nodes, resulting in insufficient mining of effective information. To address this problem, this study proposes feature relation guided cross-view image based geo-localization. This method first processes aerial remote sensing images using a polar transform to achieve the geometric coarse alignment of ground-to-aerial images, and then realizes local contextual feature concern and global feature correlation modeling of the images through the feature relation guided attention generation module designed in this study. Specifically, the module includes two branches of deformable convolution based multiscale contextual feature extraction and global spatial relations mining, which effectively capture global structural information between feature nodes at different locations while correlating contextual features and guiding global feature attention generation. Finally, a novel feature aggregation module, MixVPR, is introduced to aggregate global feature descriptors to accomplish image matching and localization. After experimental validation, the cross-view image based geo-localization algorithm proposed in this study yields results of 92.08%, 97.70%, and 98.66% for the top 1, top 5, and top 10 metrics, respectively, in CVUSA, a popular public cross-view dataset, and exhibits superior performance compared to algorithms of the same type.
1. Introduction
Image based geo-localization has drawn significant attention over the past years in the computer vision community due to its potential applications in autonomous driving [1] and robot navigation. Traditional image based geo-localization is normally performed in the context where both the query images and geo-tagged reference images in the database are taken from the ground view; however, due to the difficulty of ground image acquisition in some areas, it is difficult to construct a reference image database covering the whole world. Thus, this technology lacks wide applicability. Considering the dense global coverage of satellite and unmanned aerial vehicle (UAV) imagery today, matching ground view photos to aerial imagery is gradually becoming an increasingly popular geo-localization approach. However, because of the considerable difference in shooting viewpoints between ground-to-aerial images, it is difficult to effectively establish the feature correlations of the same scene on images from different viewpoints, making this technique a challenging scientific task since its conception.
Notably, the development of deep learning technology has provided an effective solution for this task. Currently, most cross-view image geo-localization methods [2,3,4] based on deep learning transform the problem into a metric learning task. Specifically, a feature extraction network is developed to extract the depth features of the images. Subsequently, the network is trained such that the image pairs with a high matching degree are closer and the image pairs with a low matching degree are farther away from each other. Therefore, the extraction of robust global image feature descriptors is the key to realizing this task.
Previous studies have shown that algorithmic networks based purely on the image content (image appearance or semantics) without considering the geometric correspondence between ground-to-aerial images are often difficult to train and perform poorly. To reduce the feature gaps caused by cross views, Shi et al. [5,6,7] explored the geometric correspondence between ground-to-aerial images. They reported that (1) horizontal lines in the ground panorama image have an approximately constant depth and thus correspond to concentric circles in the aerial remote sensing image, and that (2) vertical lines in the ground panorama image have a depth that increases with the y-coordinate and thus correspond to radial lines in the aerial remote sensing image. Based on this geometric correspondence, they applied polar transform to the aerial remote sensing image for the transformed aerial remote sensing image to have a geometric configuration similar to that of the corresponding ground panorama image, thus realizing an approximate image-domain alignment between image pairs. However, as polar transform relies completely on priori knowledge of the corresponding geometric structures of the two views without considering the image scene content, it can lead to serious distortion of the image content while generating a large geometric deformation. In response to the above issues, a common solution is to incorporate attention mechanisms into an algorithmic network to enhance the extraction ability of the key features of an image. However, as these attention mechanisms generate local feature attention through ordinary convolution with a restricted sensory field without mining the positional layout between individual feature objects from a global perspective, it is difficult to utilize rich structural knowledge on a global scale, which also limits the effect enhancement of the algorithm.
In fact, in the process of cross-view image based geo-localization, effective global structural knowledge is a beneficial information supplement, in addition to image scene content. For example, in the process of cross-view image based geo-localization by the human eye, in addition to comparing the features at the target location, we typically repeatedly compare the location layout and spatial relations among the features. Therefore, in addition to focusing on the content of the feature itself, this study also focuses on the correlation extraction of the features, and skillfully uses the geometric structure knowledge of the location corresponding to the features to guide the completion of image geolocation across different views.
To better capture the spatial layout and relative positional relations between image features and guide the generation of global image attention, we design a multiscale contextual information extraction and global relation guided attention generation module based on deformable convolution [8,9]. Based on the polar transform to realize basic alignment in the image domain, deformable convolution is introduced to deal with the geometric deformation of images caused by the imaging principle of ground panorama images and polar transform of aerial images. The deformable convolution of multiple different receptive fields is used to extract rich image details and multiscale contextual association information, which enhances the understanding of the image content and improves the robustness and adaptability of the features. This enables the features to respond to complex image scenes and changed perspectives. To mine global information, we establish a relation affinity matrix between feature nodes and extract the relations between each feature node, thus realizing the modeling of global relations. Finally, the relations extracted by the two branches are combined to guide the reweighting of different positions and to apply different concerns. The MixVPR [10] feature aggregation strategy is also used to generate global image feature descriptors. Through experiments, the proposed method achieves satisfactory results for cross-view correlation datasets.
The contributions of this paper can be summarized as follows:
- (1)
- We propose a cross-view image based geo-localization method based on feature relation guidance. Feature position reweighting is guided by learning the location layout and spatial structure among the image features. Simultaneously, deformable convolution is introduced to reduce the geometric deformation of ground and aerial remote sensing images. This is the first cross-view image based geo-localization method that attempts to solve the effect of geometric distortion.
- (2)
- Multiscale contextual information extraction based on deformable convolution and a global relations jointly guided attention generation module is designed. The module extracts multiscale contextual information of images according to the deformable convolution with different convolution kernel sizes, simultaneously achieving relation mining between different feature nodes using global relations awareness, and guiding attention generation according to these two relations. Consequently, a feature descriptor jointly characterized by contextual information and global relations is obtained, which enhances the discriminability of the image features.
- (3)
- The method proposed in this study outperforms other methods of the same type on a public dataset and shows good accuracy results. We also attempt to study the practicality of cross-view image based geo-localization methods by testing several public algorithms on a self-built dataset.
2. Related Work
Image based geo-localization is generally regarded as an image retrieval task [11,12,13], and extracting feature descriptors that are more robust to images has become the key to achieving this task. In early cross-view image based geo-localization methods, manual feature extraction operators [14] were widely used; however, the extreme differences in perspective limited the application of this technique. In recent years, as deep learning technology gradually dominates the field of computer vision, the cross-view image based geo-localization has also found more advanced solutions. Workman and Jacobs [15] first introduced deep features to the cross-view matching task. They used a fine-tuned AlexNet network on ImageNet and Places [16] to extract deep features for cross-view image matching. Lin et al. [2] proposed the first deep learning method to achieve ground-to-aerial geo-localization based on two Siamese CNNs. Comparative experiments demonstrated a significant improvement in performance compared with handcrafted descriptors. Hu et al. [17] proposed CVM-Net, which adopts the NetVLAD module [18] to aggregate CNN feature units for the generation of discriminative image representations. In order to bridge the huge domain gap between ground images and aerial remote sensing images, Regmi and Shah [19] used a generative adversarial network (GAN) to synthesize aerial view images from ground images, and then fused the features of ground images and synthesized aerial images into descriptors for retrieval matching. Shi et al. [5,6,7] applied a polar transform to aerial remote sensing images in the geometric correspondence between ground-to-aerial images, and realized the basic geometric alignment between aerial images and ground images.
On the other hand, as a ground panorama image has a shooting range far beyond that of ordinary images, it can provide rich feature information for cross-view image matching; however, at the same time, the complex background and redundant information can cause interference to the feature extraction. Therefore, the effective extraction of useful information and the discarding of useless information constitute a major research focus in cross-view image based geo-localization tasks. Kin et al. [20] integrated context-aware feature reweighting networks into their model to focus on regions that contributed positively to matching positioning. Cai et al. [21] proposed a lightweight attention module that introduced a context-aware feature reweighting strategy into the feature extraction operator through spatial attention and channel attention, and improved the representation ability of CNN features. SSA-Net [22] is a multiscale spatial attention mechanism that can automatically select appropriate features according to the scale of different objects and weigh important features according to location to achieve more robust feature extraction. To eliminate geometric deformation and content distortion caused by polar transform, a spatial-aware feature aggregation (SAFA) attention module, which embeds the relative positions of features into image descriptors to make it more distinguishable, was developed [5].
Compared with the existing work, we hope that the newly designed network can fully learn the relations between image features while focusing on the image content, and use these relations to guide the generation of attention to improve the discriminative power of image descriptors.
3. Methods
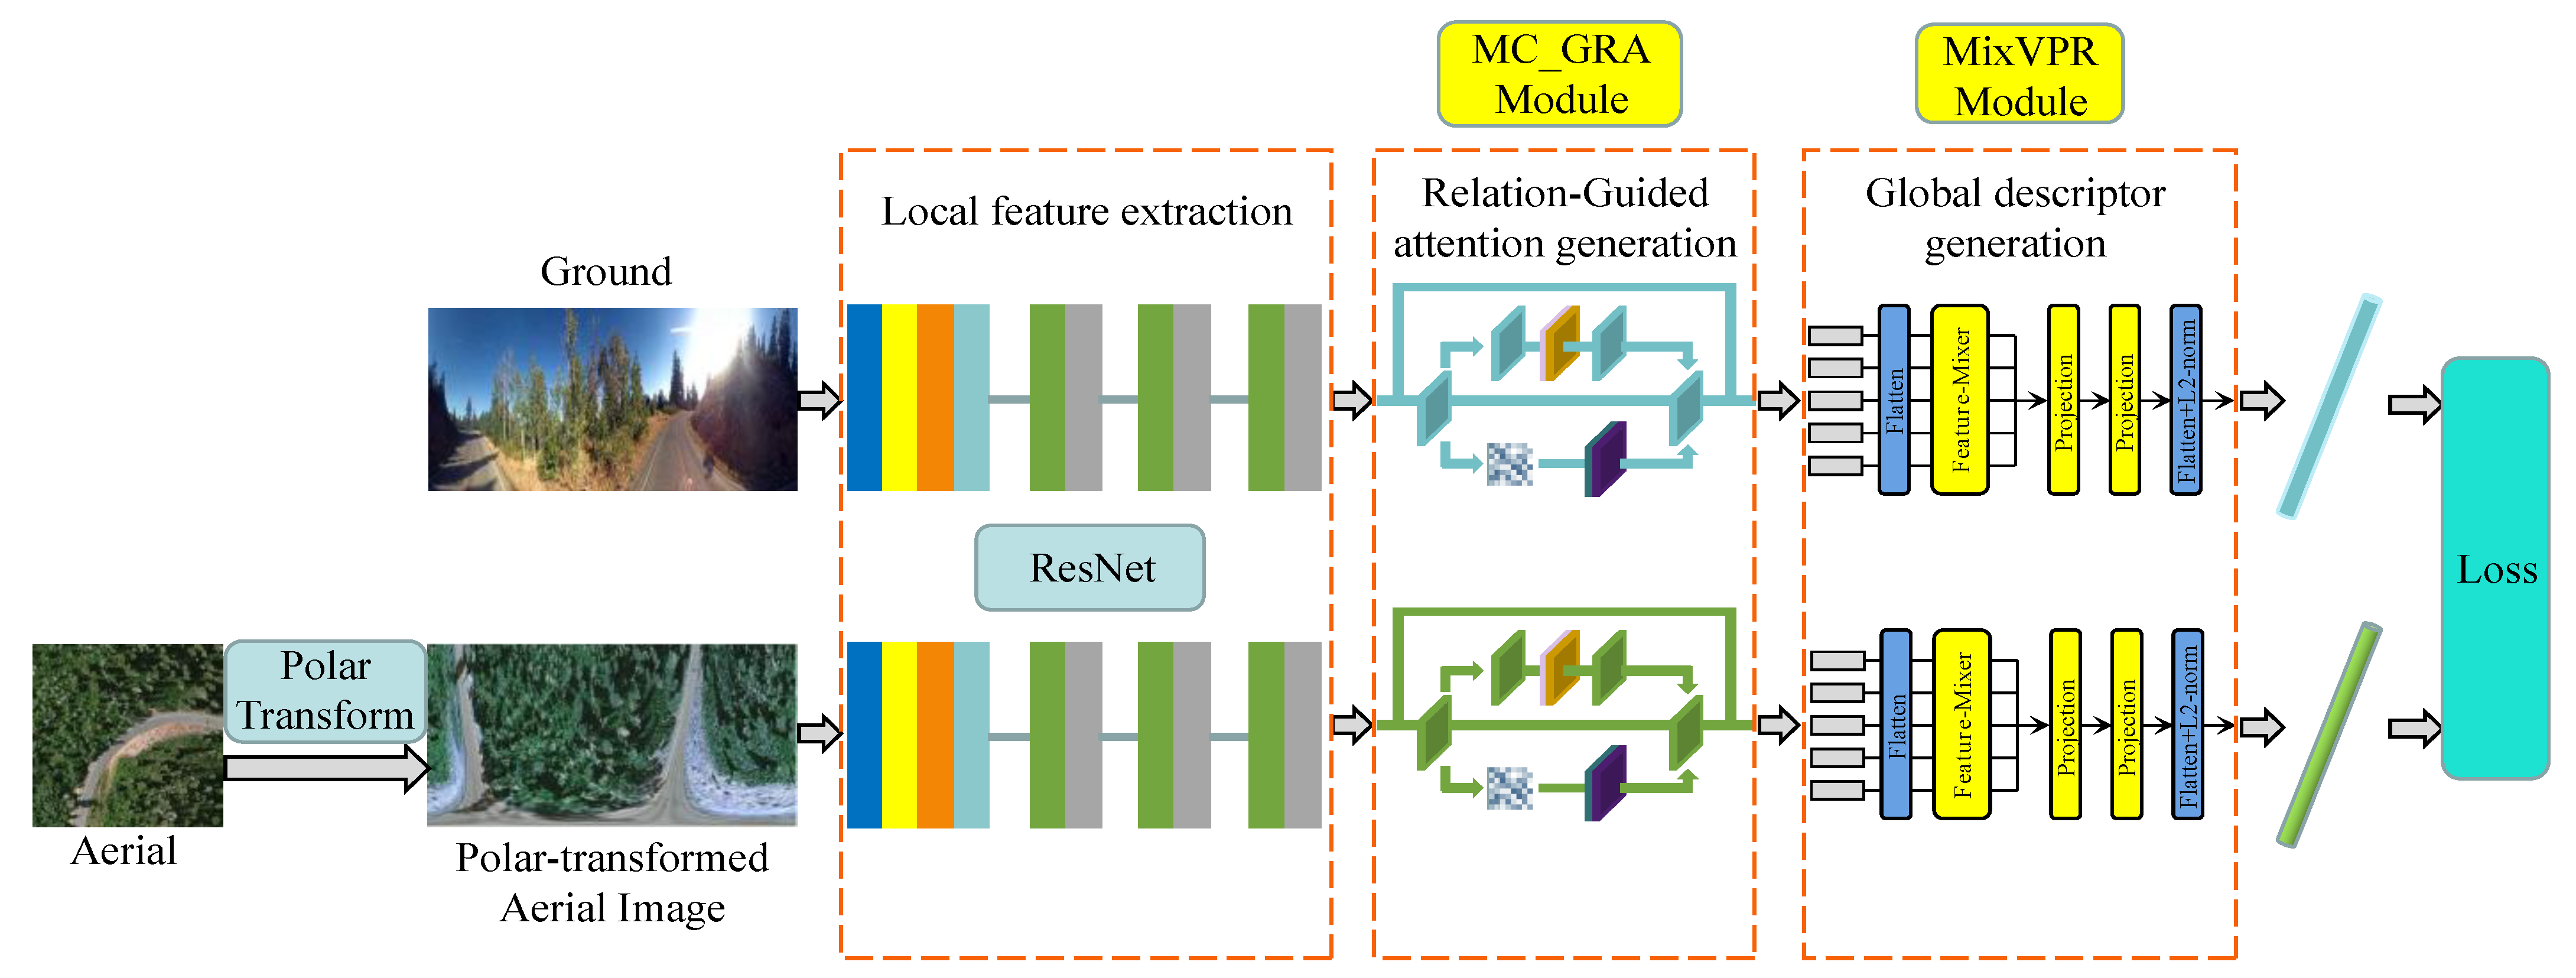
Similar to most existing cross-view image based geo-localization methods [5,17,22], we utilize a Siamese neural network as the overall architecture of the algorithm, as shown in the flowchart in Figure 1. The inputs of the network contain the ground panorama image and aerial remote sensing image after polar transform. ResNet50, based on deep residual networks, has been widely used in a variety of feature extraction applications and has shown convincing results in a variety of deep learning tasks [23,24]. Therefore, our feature extraction backbone network selects the ResNet50 operator, which removes the fourth residual block, pooling layer, and full connection layer. The Multiscale Context and Global Relations Attention (MC_GRA) module designed in this study is added to the backbone network. A new feature aggregation module, the MixVPR model, is also introduced to aggregate global features. Finally, a weighted soft-margin triplet loss function is used to train the model.
3.1. Polar Transform
To narrow the gap in the image domain between ground and aerial images, according to the geometric correspondence between image pairs, a polar transform is used to preprocess aerial remote sensing images. First, the polar origin is set as the center of the aerial remote sensing image corresponding to the geographic label, and the 0° direction is selected as the north direction, corresponding to the positive direction of the y-axis on the ground image aligned with the geographic coordinates. Subsequently, the image size after polar transform is limited to the same value as that of the ground panorama image, and the angle corresponding to each column of the aerial remote sensing image the polar transform is the same as that of the ground panorama image. Finally, a uniform sampling strategy is applied along the radial line in the aerial remote sensing image in order for the innermost and outermost circles of the aerial remote sensing image to be mapped to the bottom and top lines of the transformed image, respectively.
Polar transform between the original aerial remote sensing image points and the target-transformed aerial remote sensing image points is defined as
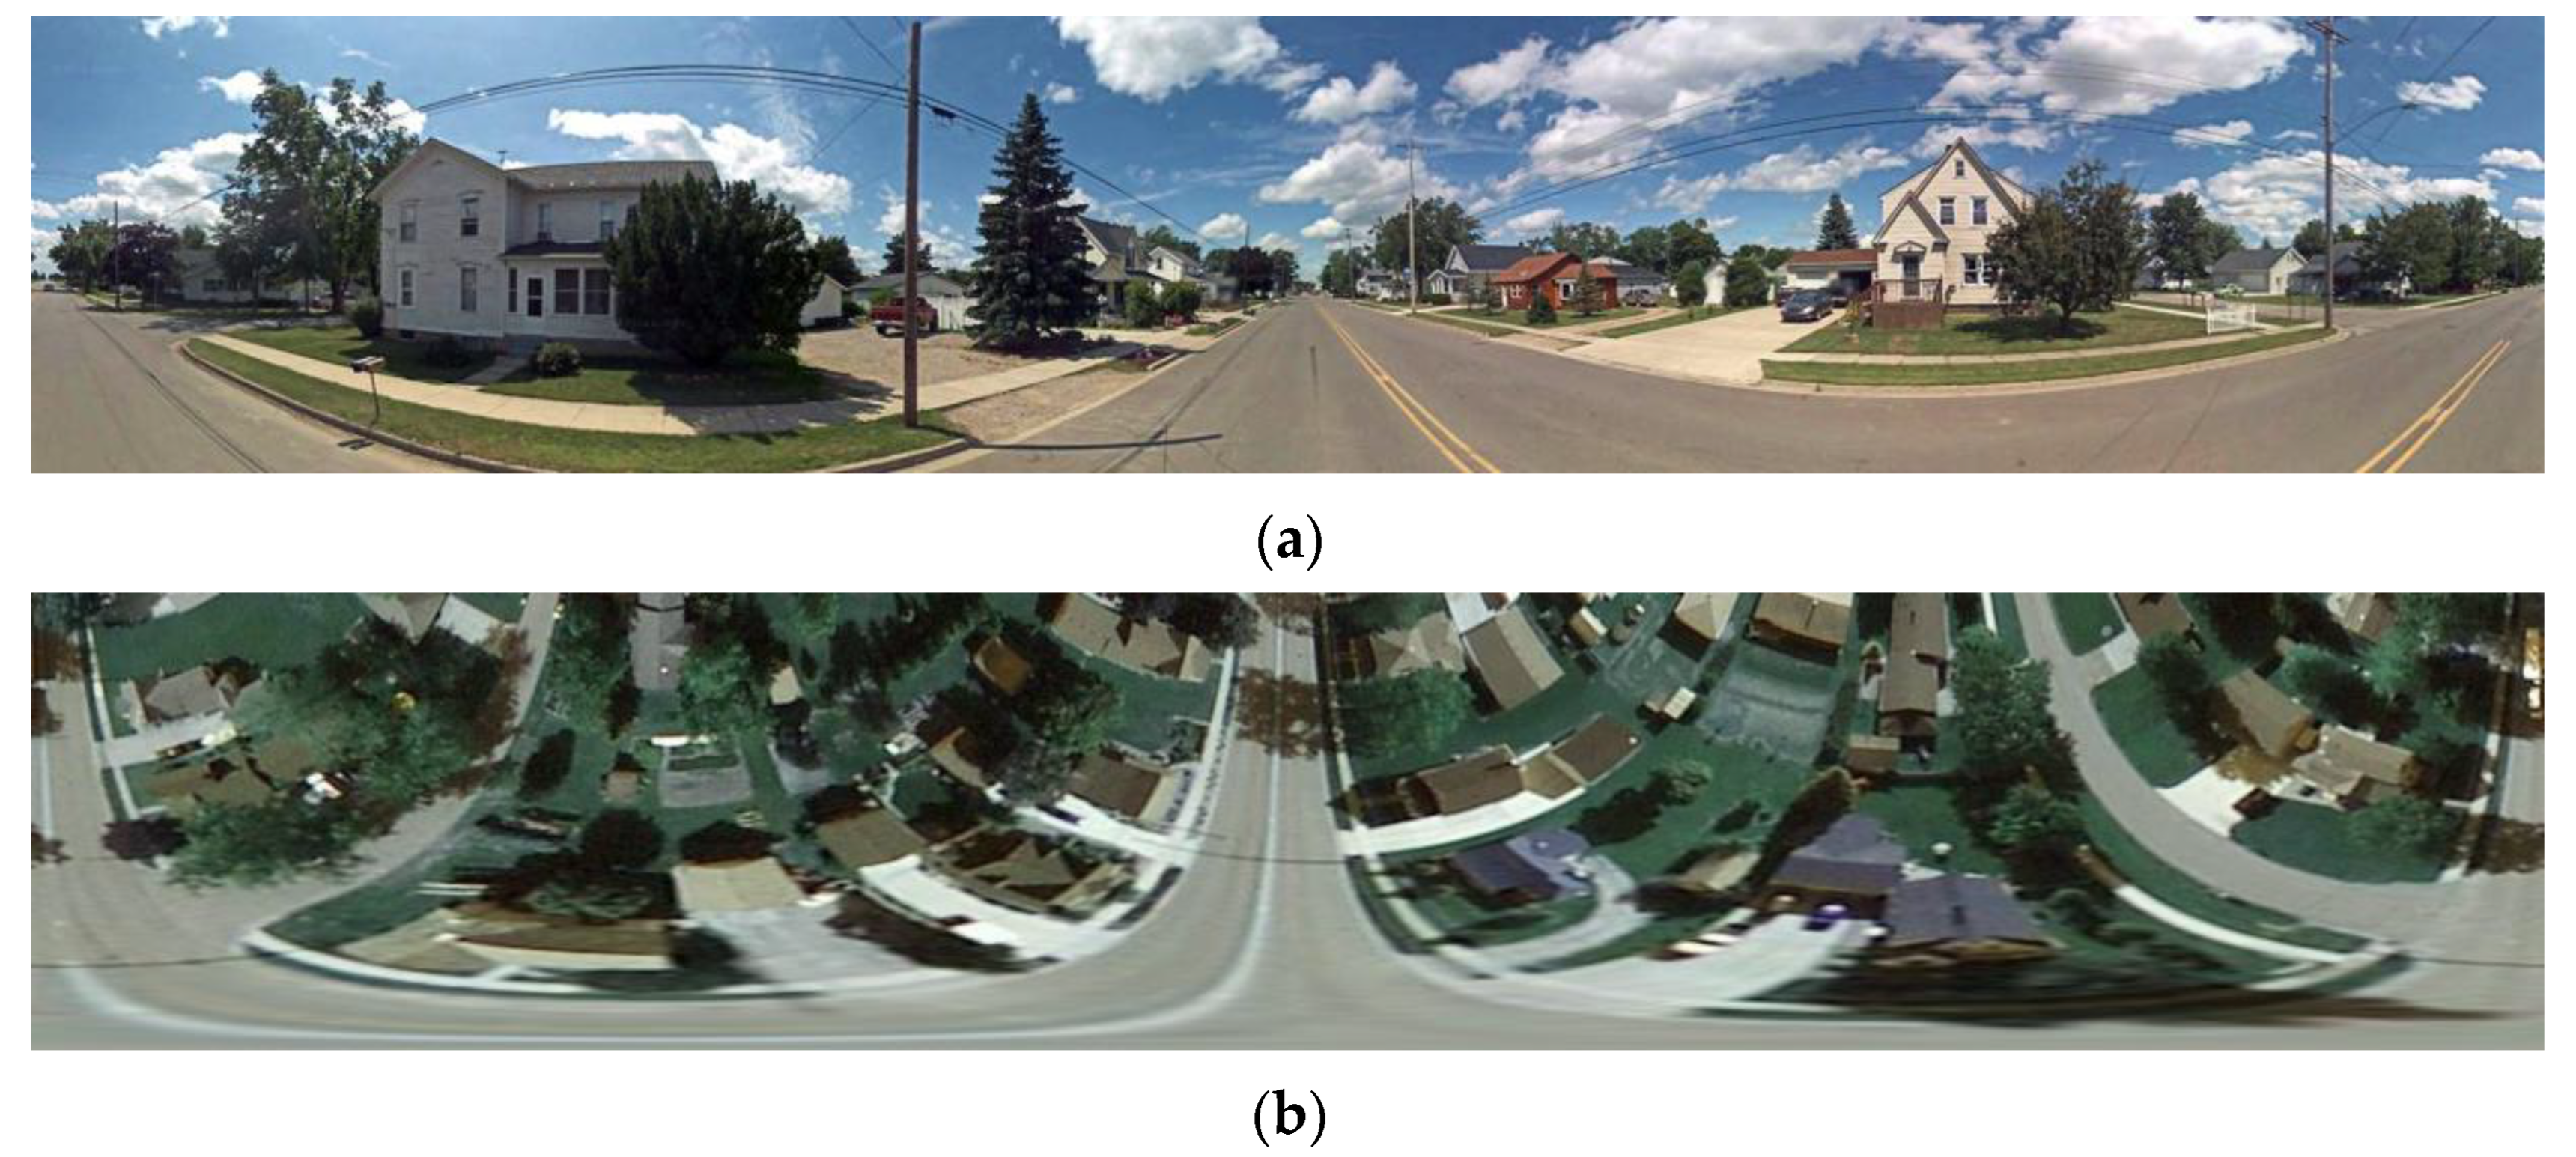
where is the size of aerial remote sensing image; and represent the height and width of the target-transformed aerial remote sensing image, respectively. The aerial remote sensing image after polar transform produces a ground-view image that respects the scene content of the image, that is, the corresponding ground-to-aerial image pair has approximately the same arrangement of scene objects. However, this alone is not sufficient to completely close the domain gap between the two views, mainly because the overlap between the image pairs is incomplete, and many features, such as the sky present in the ground view, cannot be recovered in this manner. By exploring the principle of polar transform and the imaging principle of ground panorama images, it was found that both types of images have huge geometric distortion, which is reflected in the appearance of the image as a distortion of the content, as shown in Figure 2. Figure 2a shows the real ground panorama image, and Figure 2b shows the aerial remote sensing image after the polar transform. This universal geometric deformation affects the generation of image feature descriptors to a certain extent, thereby affecting the accuracy of the algorithm. Therefore, this is a new attempt to find a suitable method for reducing geometric distortion in cross-view image based geo-localization algorithms.
3.2. Multiscale Contextual Information and Global Relations Jointly Guide the Attention Generation Module
The multiscale contextual information and global relations jointly guide the attention generation module, MC_GRA, which includes two branches. The first branch uses two deformable convolution kernels of different sizes to process feature images, which not only reduces the effect of geometric deformation but also enhances the extraction of image contextual information through changes in different receptive fields. The second branch uses position coding to embed position layout information into image features, and introduces a relations affinity matrix to mine the relative relations between feature nodes after position coding. Finally, by combining the feature relation information extracted from the two branches, the model guide assigns weights to the features of different positions to realize the joint representation of the image. The detailed architecture of MC_GRA is shown in Figure 3.
3.2.1. Multiscale Contextual Information Extraction Based on Deformable Convolution
In deep learning-based image processing tasks, the contextual information of an image refers to the fact that the current pixel is affected by the information of its surrounding pixels or regions. Contextual information can provide relations between the concerned features and the surrounding features, including the layout information between the features, to provide additional information for cross-view image based geo-localization tasks. Therefore, a branch for contextual information extraction is added to the relation guided attention generation module.
Influenced by the CBAM [25] spatial attention operator, we designed a contextual information extraction operator with the same architecture (Figure 3). However, unlike the CBAM operator, we used the deformable convolution with sizes of and to replace the standard convolution of to learn the spatial attention mask. Thus, we not only considered the scale and deformation of features, but we also achieved the purpose of extracting the image contextual information through changes in different receptive fields.
Deformable convolution is primarily used to address the adverse effects of the geometric deformation of ground-to-aerial images. The standard conventional method typically uses fixed geometric structures to encode feature information and then captures the receptive field. However, due to the variable and irregular shape of the object, it is difficult for this coding method to capture the appropriate receptive fields, which leads to a limited expression ability of the network. The deformable convolution proposed in [8] allows the sampling points to adapt according to the semantic region of the object through a convolution kernel with deformable ability.
The traditional convolution structure is defined in Equation (3). Taking a convolution as an example, for each output , nine positions are sampled from , all of which are spread out at the central position . Therefore, the output of the traditional convolution is
where represents location on the feature map; denotes a regular grid of convolution sampling that defines the receptive field size and dilation; enumerates the locations in ; denotes the weight.
Deformable convolution adds an offset to the traditional convolution operation to transform the regular convolution into an irregular convolution, and the output of the deformable convolution is
where is the predicted offset, and the calculation of the offset is shown in Figure 4. For an input feature map, assuming that the original convolution operation is , in order to learn the offset, we first learn the offset of each pixel with another convolution. The number of channels in the offset feature map shown in the figure is , indicating that each pixel is offset in the and directions. The calculated relative offset is then added to the pixel index value of the original image to obtain the absolute offset of the pixel index of the input feature map. Second, the index pixel value after the offset is obtained with bilinear interpolation, and a new feature map is obtained. The deformable convolution is then realized with conventional convolution.
For the extraction of contextual information, given the input feature graph , the relational embedding graph after the branch processing of contextual information extraction can be represented as
where and denote the maximum and average pooling operators along the feature channel, respectively; represents convolution; represents deformable convolution.
3.2.2. Global Relations Mining Module
The relation guided attention generation module designed in this study not only uses multiscale deformable convolution to extract image contextual information but also utilizes a global relations mining module to capture the spatial dependence between any two positions of feature images in the self-attention mechanism. Influenced by the ideas in [26,27], we introduce an affinity matrix of the same principle to explore the relations between different feature nodes. The affinity matrix, also known as the association matrix, is a statistical technique used to organize the similarities between a set of data points. In the global relations mining module, the relation affinity matrix provides rich global relevant information.
The basic principles are shown in Figure 3. Given the feature graph of the input image, we take the -dimensional feature vector of each spatial position as the feature node, i.e., for the feature graph whose length and width are and , respectively, the spatial relation mining module learns the relations between a total of feature nodes. The spatial position of the feature map is raster scanned, and the label between the feature nodes is specified as . Each feature node is then represented as , where .
The relations between each pair of feature nodes is defined as the relational affinity in the embedding space, which is expressed as follows:
where and represent the embedded functions implemented with spatial convolution processing. Through a batch normalization (BN) layer and activation, the functions are expressed as follows:
The terms are used to represent the bidirectional relations between feature node and feature node . The relational affinity matrix represents the pair relations between all feature nodes, as shown in Figure 3. For the -th feature node, we take the pair relations between it and all feature nodes as the relation vector to be mined, and stack these pair relations to obtain the attention relation features at this spatial position, expressed as . This specific operation is performed to extract from each feature node according to the generated relational affinity matrix , change the number of channels to generate feature graph with the same size as the input feature graph, and extract again to generate the feature graph with the same operation. The feature maps and along the feature channel are combined to obtain , that is, the relation feature map obtained by the global relations mining of the input feature map.
3.2.3. Relation Guided Attention Generation
To further use the information extracted from the two relational extraction branches to guide the attention generation, we connect the extracted contextual information and global structure information through an embedding function to obtain the spatial relational perception feature graph :
where represents a convolution operation; the convolution kernel is , and is aimed at reducing the channel dimension of the feature maps to one. Subsequently, through the modeling function, the spatial attention of each feature node is generated by the relation feature graph , which is combined with the feature node to complete the joint representation of the feature relations. The formula used is as follows:
where and represent the attention generation guide functions implemented using a convolution and BN; represents the activation function; is the feature node attention diagram generated by the relation guided; represents the multiplication of elements.
3.3. Feature Aggregation Strategy
Global feature descriptors are mostly used in cross-view image based geo-localization tasks to deal with sharp differences in viewpoints. Therefore, suitable feature aggregation strategies are particularly important. In this study, we adopt the State-of-the-Art feature aggregation strategy MixVPR [10] for the geo-localization tasks. MixVPR takes as input the feature maps extracted from the pretrained backbone network and then iteratively incorporates global relations into each individual feature map using multiple feature mixers with the same structure and consisting entirely of multilayer perceptrons (MLPs), thereby eliminating the need for local or pyramid aggregation in NetVLAD. The effectiveness and trainability of the global descriptor are significantly improved and its principal structure is shown in Figure 5.
For a given input , after flattened, a feature mixer is used to generate an output of the same shape, which is then sent to the second feature mixer block, and so on, until consecutive high speeds are achieved. The formula used is as follows:
The dimension of is the same as that of the extracted feature map . To further reduce its dimensions, two fully connected layers are added after the feature mixer to reduce its depth (channel) and row dimensions. This operation can be considered to be a weighted pool operation that controls the size of the final global descriptor. First, using a depth projection, is mapped from to , as follows:
where denotes the weight of the fully connected layer. Next, a line-by-line projection is applied to map the output from to , as expressed by Equation (16).
where is the weight of the fully connected layer; the dimension of the final output is . Finally, the global feature descriptor is output with flattening and L2 normalization.
3.4. Weighted Soft-Margin Triplet Loss
Triplet loss is often used as an objective function to find image feature embeddings for image matching and retrieval tasks [28,29]. A triplet is composed of an anchor point, positive (matching) example, and negative (unmatching) example. The purpose of triplet loss is to learn a distance metric that brings a positive example closer to the anchor while pushing negative examples far apart. Following most geo-localization methods [17], we adopt a weighted soft-margin triplet loss [17] to train our network.
where and are the Euclidean distances of the positive examples and negative examples to the chosen anchor, respectively; is used to adjust the loss gradient and thus controls the convergence rate of the function.
4. Experiments
4.1. Datasets
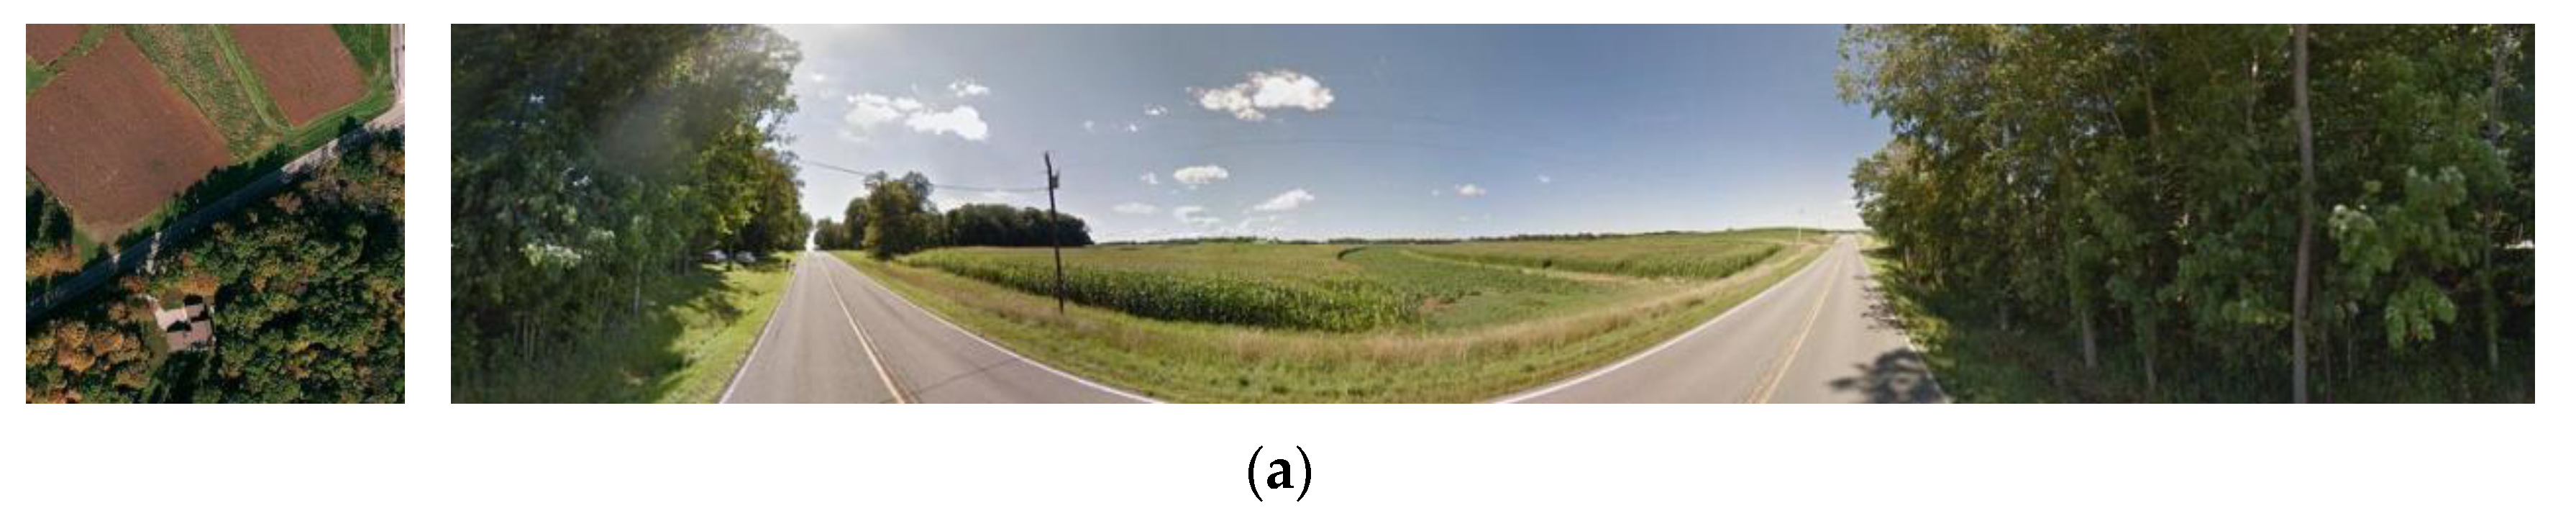
We performed the relevant experiments using three large datasets: CVUSA [30], VIGOR [31], and Taipei (a self-built dataset). Figure 6 shows examples of these three datasets.
CVUSA [28] is a cross-view image dataset that consists of ground and satellite views aligned at the center of geographic coordinates, containing 35,532 ground-to-aerial image pairs for training and 8884 image pairs for testing. The ground image was a panoramic view collected from Google Street View, while the corresponding aerial view image was downloaded from Microsoft Bing Maps. The ground-to-aerial image pairs in the dataset are aligned northward.
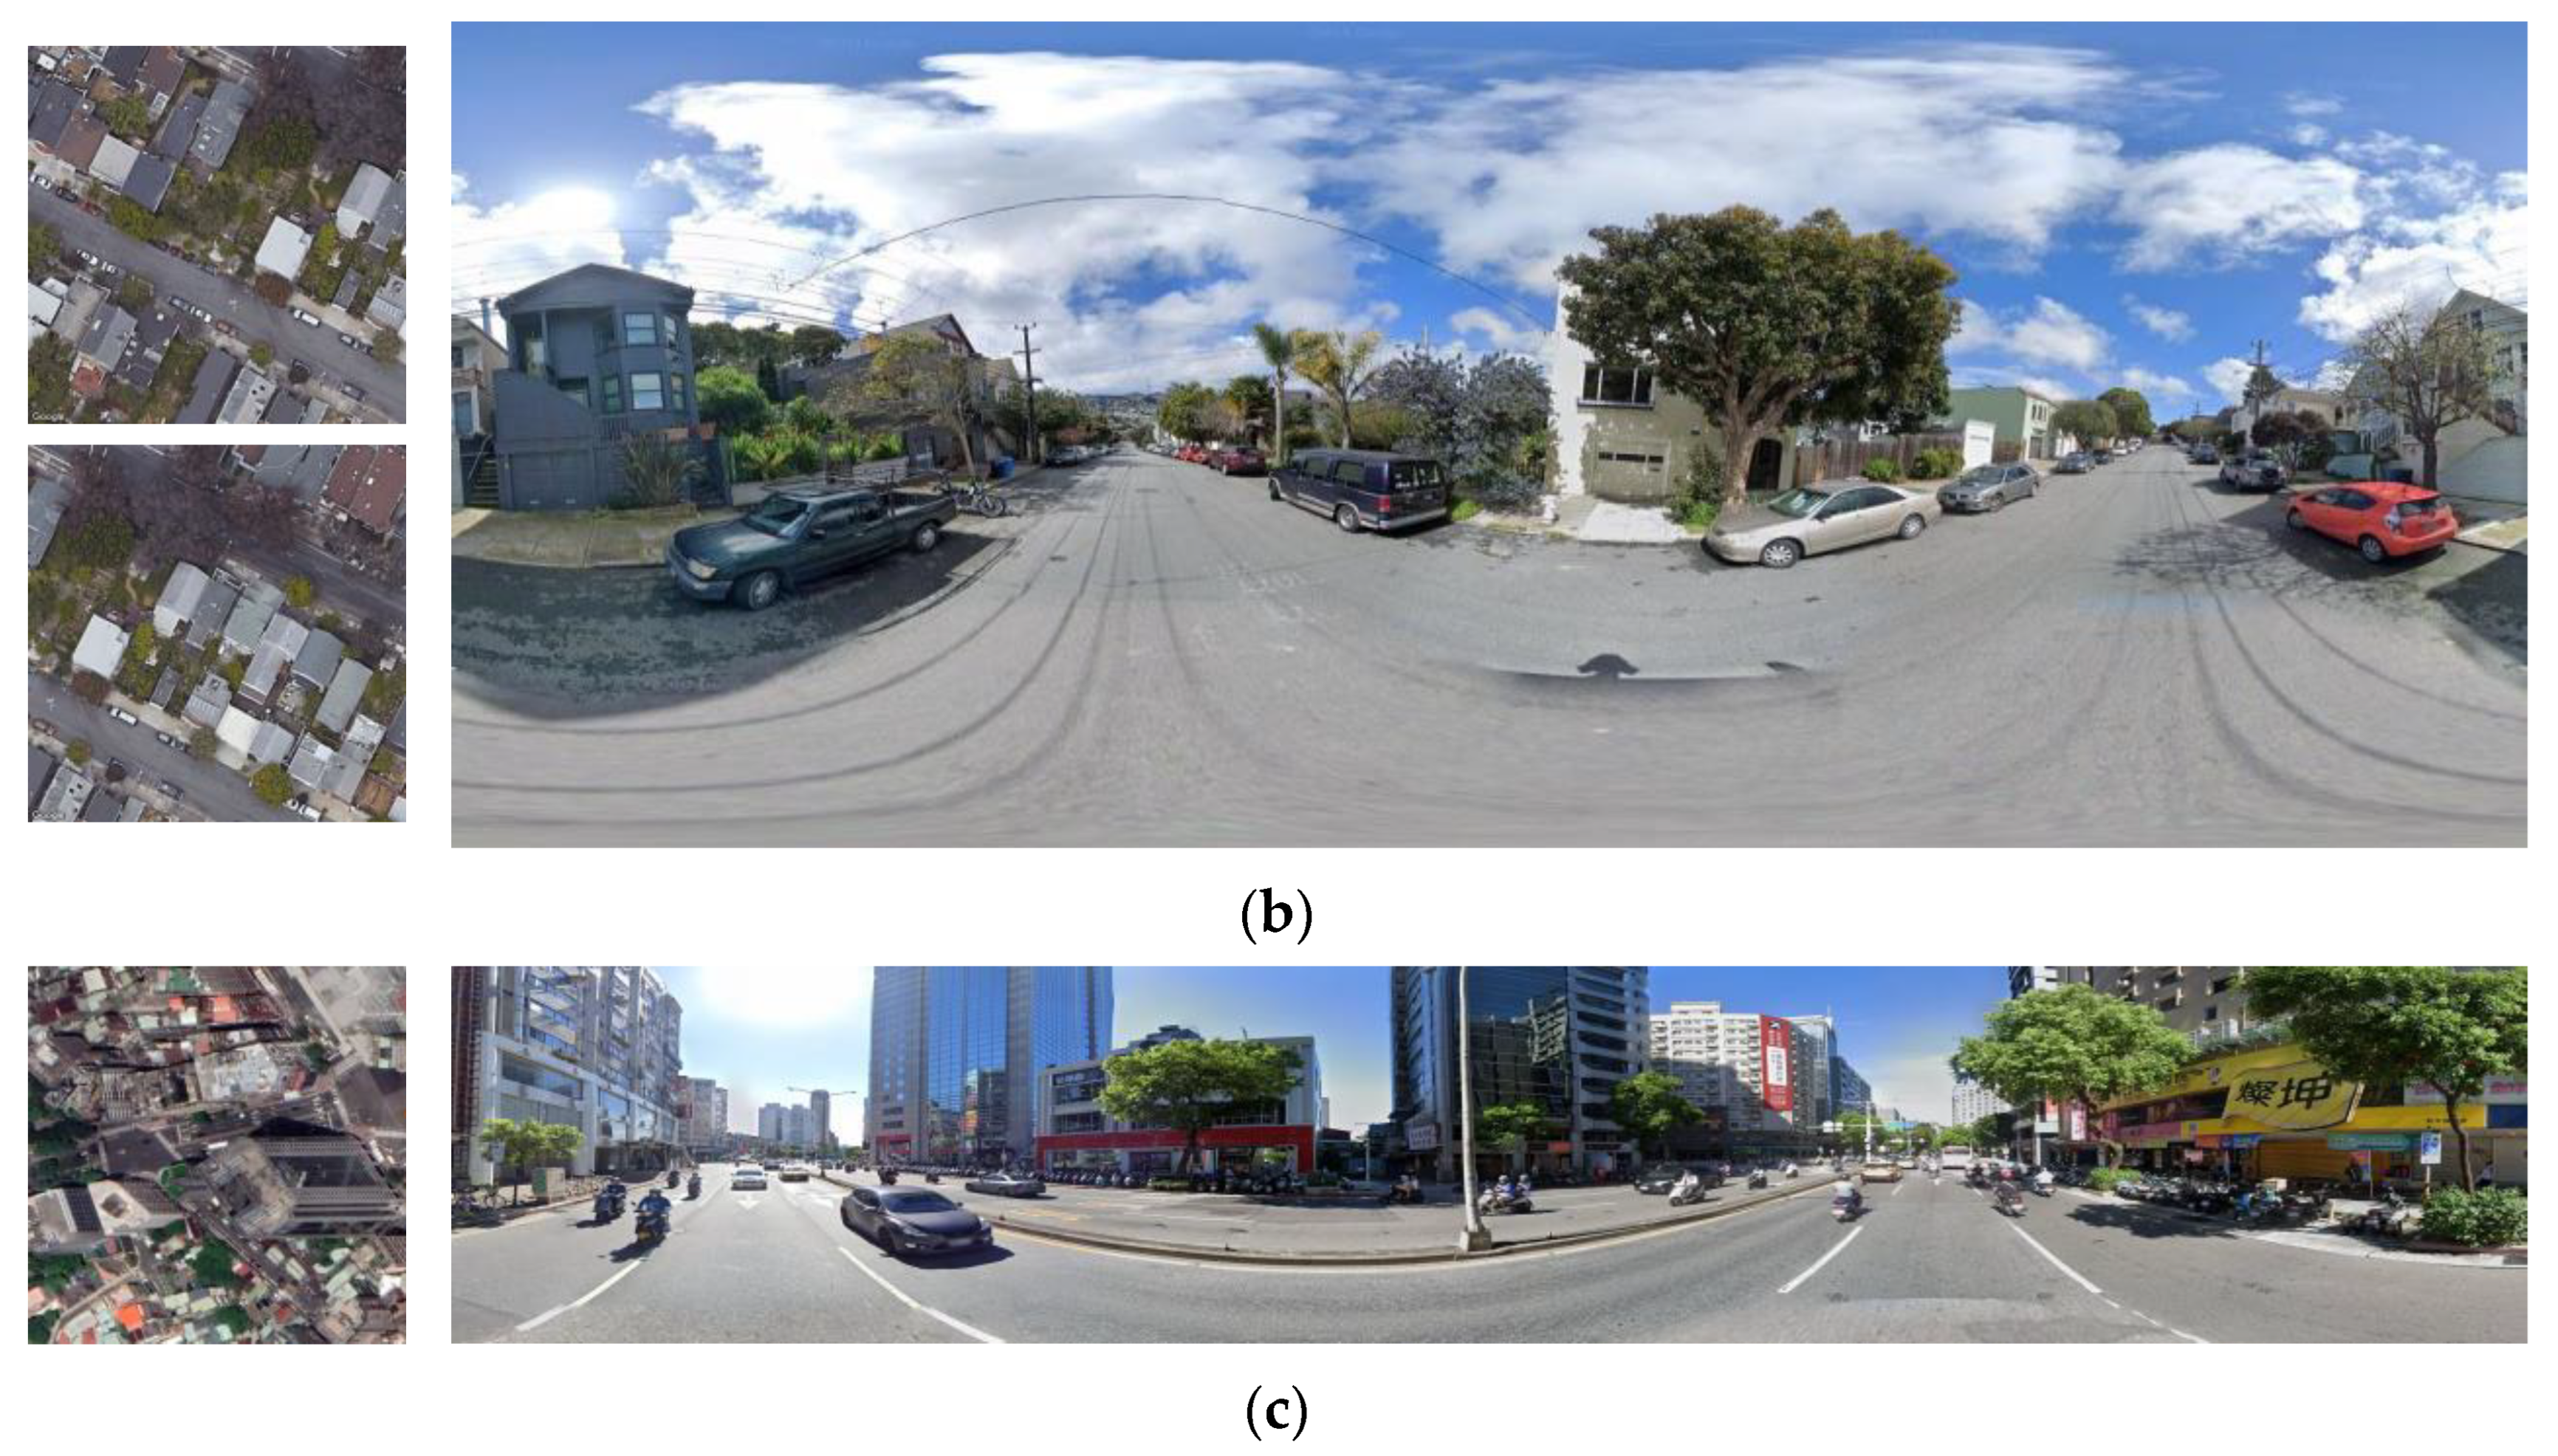
The VIGOR dataset [29] contains 238,696 ground panorama images and 90,618 aerial images from four U.S. cities (Manhattan, San Francisco, Chicago, and Seattle). Unlike traditional datasets, such as CVUSA [28] and CVACT [3], the VIGOR dataset assumes that the query street-view image can belong to any position in the target area. Therefore, the street view and satellite images in the dataset do not realize the center coordinate alignment of geographical coordinates. In contrast, the VIGOR dataset can be adjusted according to the difference between the center coordinates of the aerial and street-view images; the matched image pairs were divided into positive matching and half-positive matching (as shown in Figure 6b; the upper left satellite image is the positive satellite image corresponding to the street-view image, and the lower left is the half-positive satellite image). A street-view image usually corresponds to two positive and two half-positive satellite images. As the matching image pairs are not strictly aligned in the center of the geographic coordinates, the gap in image content is larger, and the difficulty of matching and positioning is greater.
The Taipei dataset is a self-built dataset used in this study. It contains cross-view image pairs of Taipei City, Taiwan, China, where the geographical coordinates of the ground-to-aerial images are aligned at the center. However, unlike the CVUSA [28] and VIGOR [29] datasets, the ground panorama images were acquired from an all-round 360° perspective. To simulate a real positioning situation by capturing street-view images with handheld camera equipment in dense urban areas, all ground panorama images of the Taipei dataset were obtained from a 270° perspective. Moreover, the shooting angle in the vertical direction is limited, as shown in Figure 6c. Therefore, the street view content in the Taipei dataset is very challenging; however, it is a good breakthrough for practicality research on cross-view image based geo-localization algorithms. The dataset contained 28,530 ground-to-aerial image pairs for training and 7131 image pairs for testing.
4.2. Experimental Details
The algorithm was implemented in PyTorch using the ResNet50 [32] model of pre-trained weights on ImageNet [4] as the backbone, and removed the fourth residual module, subsequent pooling layer, and fully connected layer. Thus, the multiscale contextual information and global relations jointly guided the attention generation module to accept the input of three-layer output feature maps. The value of the triplet loss function parameter was . Adam [33] was used to train and optimize the network optimizer. The regularization strategy of weight attenuation was adopted to avoid overfitting, and the weight attenuation coefficient was . The learning rate adopted a phased learning rate adjustment strategy; that is, the entire training process of the network was divided into three stages. For the first rounds of training, the learning rate was set to , for rounds of training, and the learning rate was set to ; for subsequent training rounds, the learning rate was set to . For the data used in the training, the size of the aerial images was uniformly set to , whereas the size of the ground panorama image and the aerial images obtained after polar transform were unified to . The batch size of the training was . In each batch, each query ground image had a unique matching aerial image, and unmatched aerial images. Therefore, we developed a total of triples; similarly, for each aerial image, there was a matching ground image and unmatched ground images, which also yielded triples. Thus, a total of triples were constructed for each batch.
4.3. Evaluation Metric
Similar to the most widely used metrics for evaluating cross-view image based geo-localization algorithms [3,34,35], we adopted the recall accuracy at top-K as our evaluation metric to exam the performance of our model and computer with the same type methods Specifically, given a ground-level query image, it is regarded as “successfully localized” if its ground truth aerial image is within the nearest top-K retrieved images. The percentage of query images which were correctly localized is reported as r@K.
5. Experimental Results
5.1. Comparison with the Results of Other Related Methods
- (1)
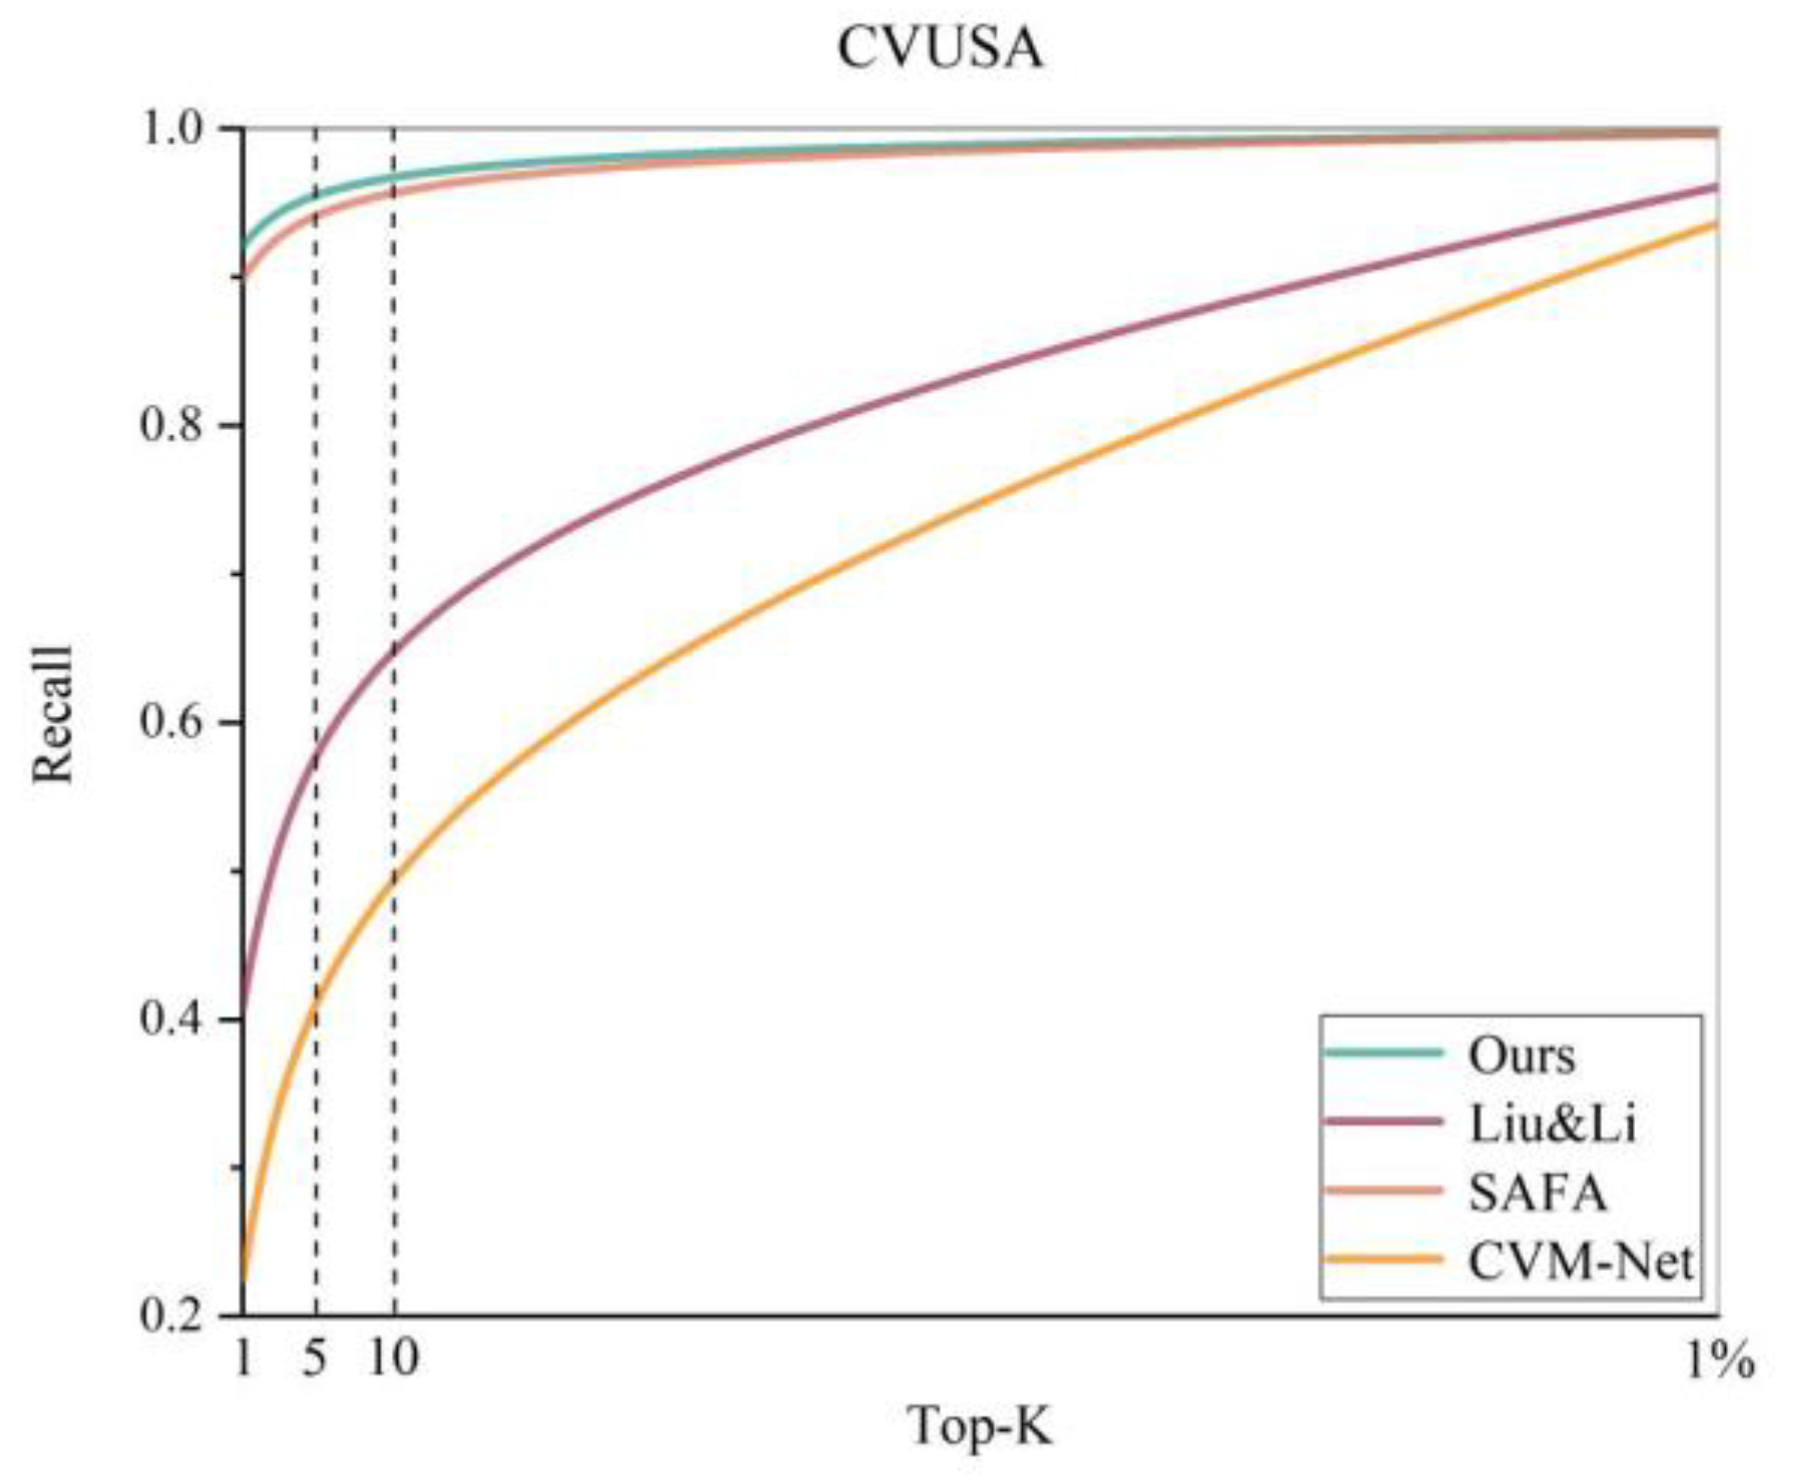
- Results in the CVUSA dataset: To prove the effectiveness of our proposed method, we utilized several classical algorithms to compare the experimental results in the CVUSA dataset. Among these, CVM-Net [17], as well as those in Workman et al. [36] and Liu and Li [3], are more basic cross-view image based geo-localization algorithms that focus on the construction of the feature extraction network, whereas the algorithm by Cai et al. [21] added a spatial attention mechanism, proving the beneficial role of the attention mechanism in the feature extraction process. However, SAFA [5], DSM [6], and SSA-Net [22] adopt the same polar transform strategy and the idea of an attention mechanism as in this study; therefore, the comparison of the results better highlights the superiority of the present method. The experimental results are listed in Table 1, and Figure 7 shows the complete recall@K plots of the experiments of these cross-view image based geo-localization algorithms. The results show that our algorithm achieves the best results in the top 1, top 5, and top 10 metrics, while the metric top 1% metric is on par with that of the DSM algorithm and slightly lower than that of the SSA-Net algorithm, which is the best in a comprehensive manner.
- (2)
- Results in the VIGOR dataset: As the ground-to-aerial image pairs in the VIGOR dataset are not strictly geo-coordinate center-aligned, the method based on polar transform may not be suitable for processing this dataset. Therefore, we designed two types of experiments for the algorithm based on polar transform processing and directly matched localization. The results are compared in Table 2. For the proposed algorithm, the accuracy of the algorithm with polar transform processing is 13% lower than that of the algorithm with direct image matching in the top 1 metric. However, compared with the SAFA algorithm, the accuracy of our algorithm exceeds its results in both cases, i.e., polar transform processing and directly matched localization. Compared with the official VIGOR algorithm, the accuracy of the proposed algorithm exceeds it in the two indicators, in the top 5 and top 10 metrics. The complete results of the recall@K plot are shown in Figure 8.
- (3)
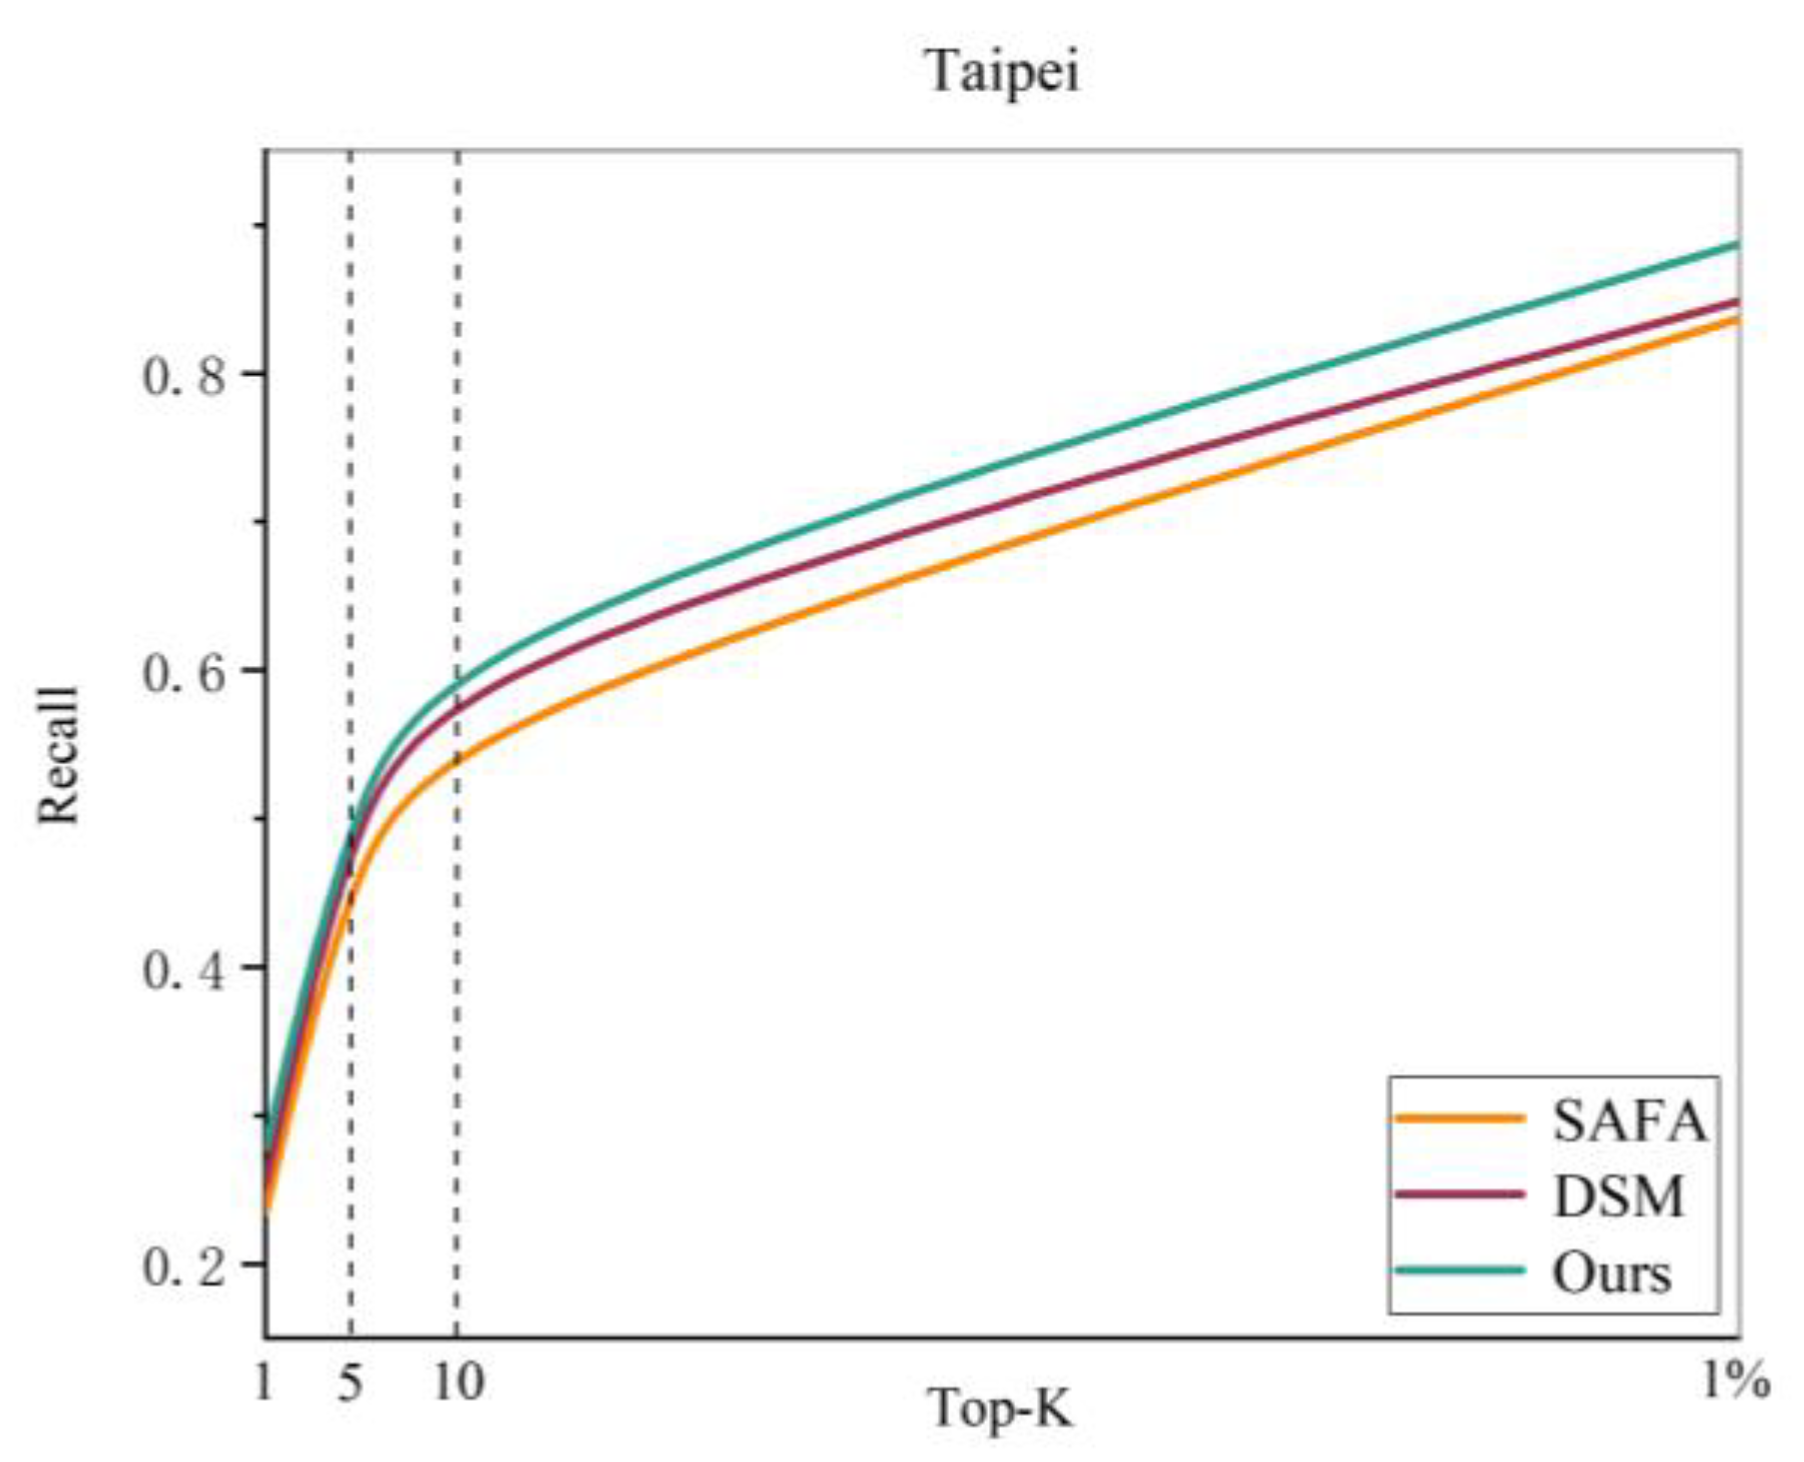
- Results in the Taipei dataset: To verify the practicability of the cross-view image based geo-localization methods, we used a self-built Taipei dataset for testing. The results of this method are compared with those of two widely recognized algorithms of the same type.
As shown in Table 3, the results of the three algorithms in the Taipei dataset are significantly reduced compared with the other two datasets; this proves that the self-built Taipei dataset is more challenging than other public datasets. In this study, the design of the new algorithm, however, is still the top 1 metric compared with the other two algorithms by 4.35% and 2.44%, respectively, and its advantages for the same type of algorithm are verified. An experimental attempt is also made to enhance the practicality of cross-view image based geo-localization. The complete results of the recall@K plot are shown in Figure 9.
5.2. Ablation Experiments
We designed relevant experiments to verify the effectiveness of the proposed multiscale contextual information and global relations that jointly guided the attention generation module MC_GRA and the introduced deformable convolution.
- (1)
- Role of the MC_GRA module: To verify the function of our designed MC_GRA module, we used max pooling and the CBAM attention module to replace the MC_GRA module in the original method. For the case of fixed algorithm parameters, the ground panorama image and aerial remote sensing image from polar transform were used as the network inputs. The results obtained for the CVUSA and VIGOR datasets are listed in Table 4.
As displayed in Table 4, compared with the baseline model, the attention module designed in this study improves the top 1 metric by 33% and 16% in the cross-view datasets of CVUSA and VIGOR datasets, respectively, and improves the top 1 metric by 3.96% and 2.78%, respectively, compared to the CBAM attention mechanism. This proves that the module designed in this paper has a significant effect on improving the accuracy of the algorithm. The complete recall@K plot is shown in Figure 10.
- (2)
- Role of deformable convolution: In this algorithm, we innovatively introduce deformable convolution to deal with the deformation caused by the panorama images imaging process and polar transform of the aerial remote sensing image. To verify the role of deformable convolution, we replaced the deformable convolution with a standard convolution of the same size in the MC_GRA module designed in this study, and conducted training and testing on two cross-view image datasets, CVUSA and VIGOR. The results are summarized in Table 5.
5.3. Visual of Attention
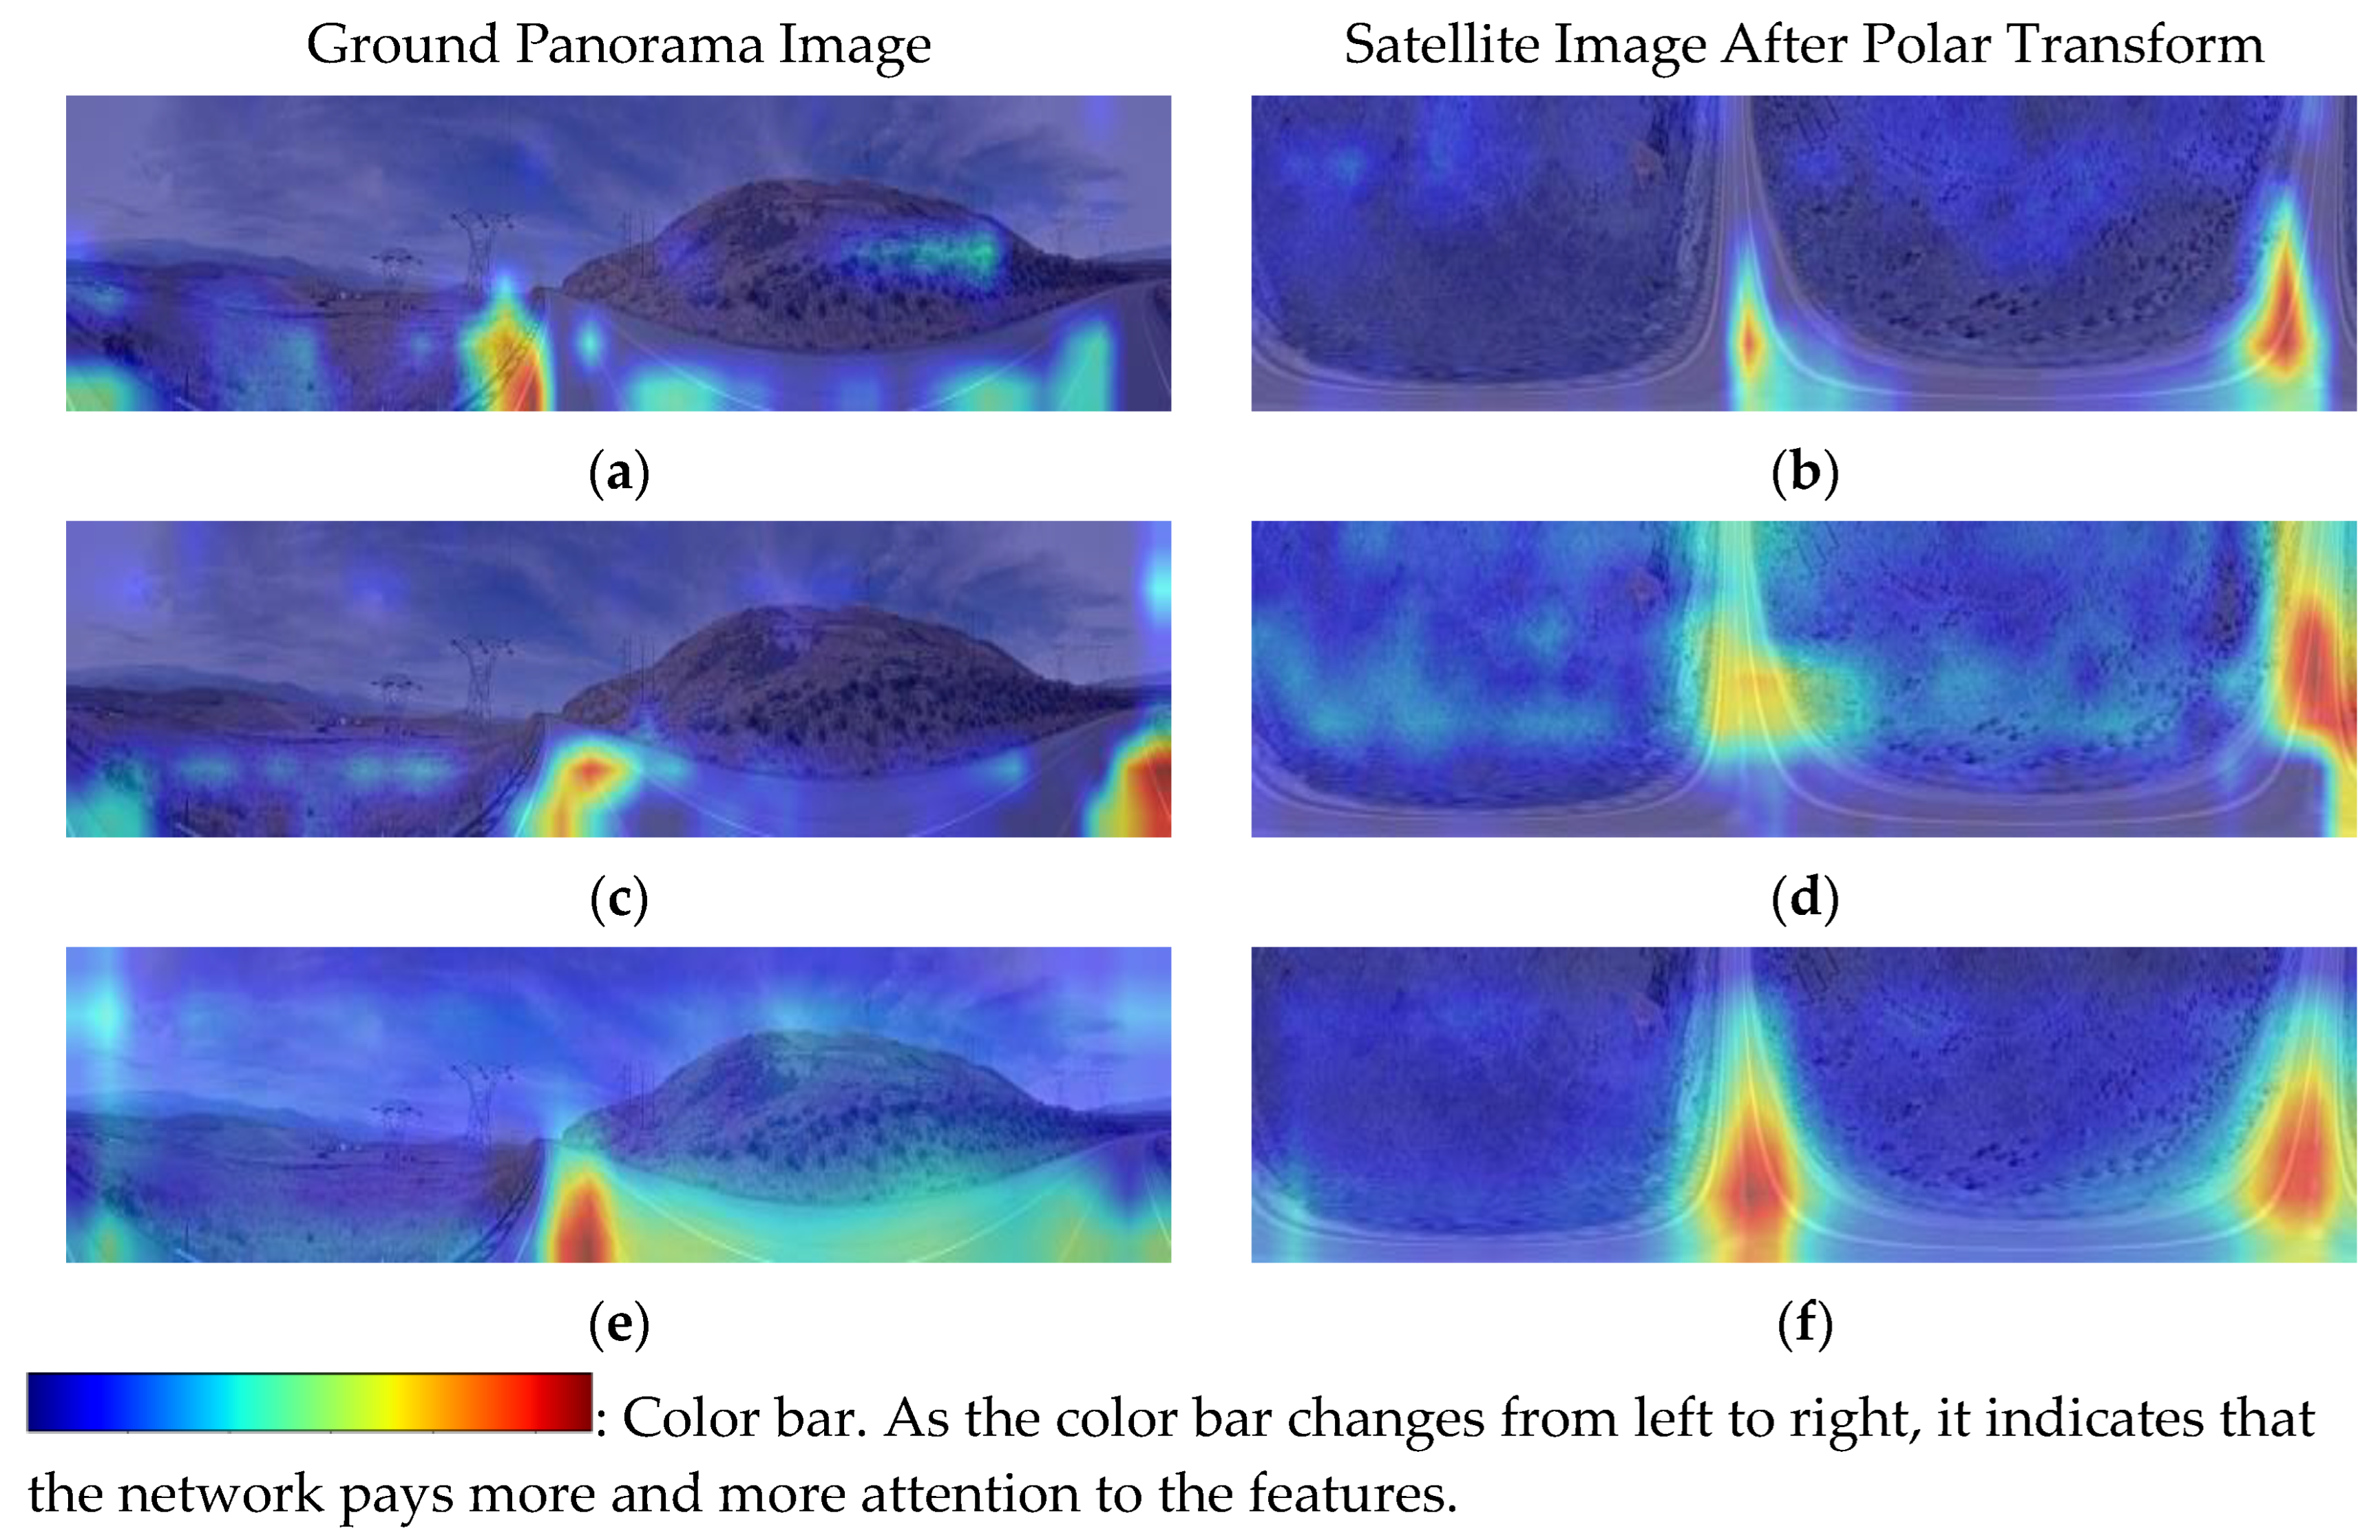
To demonstrate the role of the relation guided attention generation module designed in this study more intuitively, we used Grad-CAM [37] to generate visual feature heat maps for the visual interpretation of the embedded feature maps. Figure 12a,c,e represent the feature heat maps of the ground image processed with the baseline model, CBAM attention module, and relation guided attention generation module designed in this study, respectively. Figure 12b,d,f represent the heat maps of the corresponding aerial remote sensing image after polar transform in the three cases. The depth of the color in the figure is proportional to the network attention level. The lighter yellow color fades/decreases as the network pays attention to this area; otherwise, it is the focus area.
6. Discussion
6.1. Comparison with Other Methods in Different Datasets
A comparison of the results in Table 1 and Table 2 shows that the accuracy of the algorithms decreased significantly when the center coordinates of the ground-to-aerial image are not aligned. In addition, by comparing the algorithm results in the VIGOR dataset before and after polar transform preprocessing of the aerial remote sensing images in Table 2, it can be seen that the accuracy of the algorithm after polar transform is much lower than that of the direct matching algorithm. The reasons for these two results are as follows. (1) When the geographic coordinate centers of the ground-to-aerial image are not aligned, the ground street view is usually a part of the corresponding aerial remote sensing image, and there are fewer valuable matching features that can be extracted, which limits the matching accuracy. (2) The premise of polar transform is the geometric correspondence between the center of the aerial remote sensing image and the ground image. However, the VIGOR dataset does not meet this condition, and the aerial remote sensing image after polar transform not only fails to narrow the gap between the two image domains but also loses more valuable matching information due to serious image distortion. The self-built Taipei dataset is used to verify the practicality of the cross-view image based geo-localization algorithms. As displayed in Table 3, several algorithms exhibit low accuracy in this dataset. The reasons for this are as follows. (1) The Taipei dataset was collected from the entire Taipei area. Most aerial remote sensing images contain dense and complex urban buildings and high mountains and dense forests, resulting in a serious occlusion of key matching features, such as roads, and few effective matching features. (2) To simulate the actual effect of cross-view image geo-localization of panorama images captured with mobile phones and other handheld photography devices in real situations, the shooting angles of the ground panorama images in the self-built Taipei dataset were all 270°. Compared with traditional street-view images with cross-view datasets, a limited view angle leads to the loss of street-view content, resulting in a sharp increase in matching ambiguity, which seriously affects the matching accuracy of the model.
6.2. Analysis of Ablation Experiments
As can be observed from the experimental results in Table 4 and Table 5, the relation guided attention generation module designed in this research and the introduction of deformable convolution play an important role in the model. This is because of the following reasons: (1) Compared with the traditional attention mechanisms (CBAM, etc.) that generate local attention solely from image content, the model designed in this study focuses on capturing the relations between different feature nodes and driving attention generation. This mainly mined relation contains both contextual information and global information, which can establish the long-range dependency between the features. The attention generated in this way is determined by the feature itself and the relational vectors between all positions; therefore, it can locate the feature region while suppressing the background information and while focusing on the local and global information, and finally improves the robustness of the image descriptor. (2) The ground panorama image is imaged with equal rectangular projection, and obvious distortion occurs in this process, specifically, the landscape near the center of the image is be enlarged and distorted. Traditional standard convolution cannot deal with this situation effectively because of its fixed convolution kernel center and fixed convolution size. The deformable convolution introduces learnable offsets in the receptive field in order for the convolution region to always be covered around the object shape and for it to effectively deal with various situations such as target movement, size scaling, and rotation. Before mining image feature relations, the potential relations between features are restored as much as possible.
6.3. Experimental Analysis of Heat Map Visualization
To visualize the role of this algorithm in image processing, we generated a feature heat map of the image. Figure 12 shows that the key features for matching are mainly the road information for the geospatial images that realize the geometric alignment of the images after the polar transform. Comparing the two sets of images in Figure 12a–d, it can be concluded that the attention mechanism helps the network focus its attention on critical matching features, which proves the effectiveness of the attention mechanism in the cross-view image based geo-localization task. A comparison of the two groups of images in Figure 12c–f shows that the heat map of the image processed by the relation guided attention generation module designed in this study is more refined and significantly deeper in color for the key road information compared to the CBAM attention mechanism. This indicates that through the guidance of contextual information and global relations, the attention of worthless features is restricted, and attention is more clearly focused on discriminative regions. Furthermore, because of the mining of information from feature relations, the attention generated by this algorithm is more holistic, which is conducive to better clustering of feature descriptors.
7. Conclusions
In order to make better use of feature relation to guide the image matching and positioning tasks, a new cross-view image based geo-localization algorithm is proposed in this paper. This algorithm designs a relation guided attention generation model. Deformable convolution and multiscale feature extraction branches were used to deal with the impact of the geometric deformation of the ground-to-aerial images, and the contextual information of the target features was extracted. The global relations mining branch was then used to obtain the correlation between each feature node according to the relation affinity matrix between the feature nodes. On this basis, the features and relations between them were overlaid, and the model guided the inference of the current location’s attention. The proposed cross-view image based geo-localization algorithm designed by us fully considers the position–layout relations between image features and effectively improves the correlation between local and global features. Thus, the representation capability of the feature descriptors can be significantly enhanced, making the algorithm easy to train and significantly improving its effectiveness. The experimental results demonstrate that our method achieves better results for the same type of cross-view image based geo-localization algorithm, which proves the effectiveness of our proposed method. In addition, in this study, related work was performed for eliminating the influence of the geometric deformation of the image and studying the practicability of the algorithms. Although several widely recognized algorithms were not effective on our self-built Taipei dataset, we hope that this attempt will lead future researchers to improve the practicability of the algorithm.
Of course, there are some limitations and areas for improvement in this study. Examples are outlined as follows: (1) The algorithm designed in this paper is still powerless for the problem of image center coordinate deviation, which limits the practical research of the algorithm. (2) This algorithm has good experimental results for simple tasks in image scenes. In the face of complex terrain, such as cities, mountains, and other scenes with serious occlusion, the effect is poor. Therefore, the focus of future research on cross-view image based geo-localization tasks should be to solve practical application problems such as image center shift, and to explore ways to increase the robustness of the model to cope with complex scenes in order to gradually guide the algorithm to engineering applications.
Author Contributions
Conceptualization, J.L. and H.G.; methodology, Q.H. and J.L.; software, Q.H.; validation, Q.H., J.L. and Y.P.; formal analysis, Q.H. and X.L.; investigation, Z.G. and K.Z.; resources, J.L. and X.L.; writing—original draft preparation, Q.H.; writing—review and editing, J.L. and Y.P.; visualization, Q.H. and K.Z.; supervision, H.G. and Z.G. All authors have read and agreed to the published version of the manuscript.
Funding
This research was funded by the National Science Foundation of China, grant number 42301464.
Data Availability Statement
Not applicable.
Conflicts of Interest
The authors declare no conflict of interest.
Abbreviations
| MixVPR | Mixing for Visual Place Recognition |
| CVUSA | Cross-View dataset of the United States of America |
| CNN | Convolutional Neural Networks |
| NetVLAD | Vector of Locally Aggregated Descriptors Net |
| MC_GRA | Multiscale Context and Global Relations Attention Module |
| CBAM | Convolutional Block Attention Module |
| VIGOR | Cross-View Image Geo-Localization beyond One-to-One Retrieval |
| Grad-CAM | Gradient-Weighted Class Activation Mapping |
References
- McManus, C.; Churchill, W.; Maddern, W.; Stewart, A.D.; Newman, P. Shady Dealings: Robust, Long-Term Visual Localisation Using Illumination Invariance. In Proceedings of the 2014 IEEE International Conference on Robotics and Automation (ICRA), Hong Kong, China, 31 May–5 June 2014; pp. 901–906. [Google Scholar]
- Lin, T.-Y.; Yin, C.; Belongie, S.; Hays, J. Learning Deep Representations for Ground-to-Aerial Geolocalization. In Proceedings of the 2015 IEEE Conference on Computer Vision and Pattern Recognition (CVPR), Boston, MA, USA, 7–12 June 2015; pp. 5007–5015. [Google Scholar]
- Liu, L.; Li, H. Lending Orientation to Neural Networks for Cross-View Geo-Localization. In Proceedings of the IEEE/CVF Conference on Computer Vision and Pattern Recognition, Long Beach, CA, USA, 20 June 2019; pp. 5617–5626. [Google Scholar] [CrossRef]
- Tian, Y.; Chen, C.; Shah, M. Cross-View Image Matching for Geo-Localization in Urban Environments. In Proceedings of the 2017 IEEE Conference on Computer Vision and Pattern Recognition (CVPR), Honolulu, HI, USA, 21–26 July 2017; pp. 1998–2006. [Google Scholar]
- Shi, Y.; Liu, L.; Yu, X.; Li, H. Spatial-Aware Feature Aggregation for Cross-View Image Based Geo-Localization. Adv. Neural Inf. Process. Syst. 2019, 32, 10090–10100. [Google Scholar]
- Shi, Y.; Yu, X.; Campbell, D.; Li, H. Where Am I Looking At? Joint Location and Orientation Estimation by Cross-View Matching. In Proceedings of the 2020 IEEE/CVF Conference on Computer Vision and Pattern Recognition (CVPR), Seattle, WA, USA, 13–19 June 2020; pp. 4063–4071. [Google Scholar]
- Shi, Y.; Yu, X.; Liu, L.; Campbell, D.; Koniusz, P.; Li, H. Accurate 3-DoF Camera Geo-Localization via Ground-to-Satellite Image Matching. IEEE Trans. Pattern Anal. Mach. Intell. 2022, 45, 2682–2697. [Google Scholar] [CrossRef] [PubMed]
- Dai, J.; Qi, H.; Xiong, Y.; Li, Y.; Zhang, G.; Hu, H.; Wei, Y. Deformable Convolutional Networks. In Proceedings of the IEEE International Conference on Computer Vision, Venice, Italy, 22–29 October 2017; pp. 764–773. [Google Scholar]
- Zhu, X.; Hu, H.; Lin, S.; Dai, J. Deformable ConvNets v2: More Deformable, Better Results. In Proceeding of the IEEE/CVF Conference on Computer Vision and Pattern Recognition, Long Beach, CA, USA, 16–20 June 2019; pp. 9308–9316. [Google Scholar]
- Ali-Bey, A.; Chaib-Draa, B.; Giguere, P. MixVPR: Feature Mixing for Visual Place Recognition. In Proceedings of the 2023 IEEE/CVF Winter Conference on Applications of Computer Vision (WACV), Waikoloa, HI, USA, 2–7 January 2023; pp. 2997–3006. [Google Scholar]
- Kim, H.J.; Dunn, E.; Frahm, J.-M. Predicting Good Features for Image Geo-Localization Using Per-Bundle VLAD. In Proceedings of the 2015 IEEE International Conference on Computer Vision (ICCV), Santiago, Chile, 7–13 December 2015; pp. 1170–1178. [Google Scholar]
- Chen, D.M.; Baatz, G.; Koser, K.; Tsai, S.S.; Vedantham, R.; Pylvanainen, T.; Roimela, K.; Chen, X.; Bach, J.; Pollefeys, M.; et al. City-Scale Landmark Identification on Mobile Devices. In Proceedings of the CVPR 2011, Colorado Springs, CO, USA, 20–25 June 2011; pp. 737–744. [Google Scholar]
- Hutchison, D.; Kanade, T.; Kittler, J.; Kleinberg, J.M.; Mattern, F.; Mitchell, J.C.; Naor, M.; Nierstrasz, O.; Pandu Rangan, C.; Steffen, B.; et al. Accurate Image Localization Based on Google Maps Street View. In Computer Vision—ECCV 2010; Daniilidis, K., Maragos, P., Paragios, N., Eds.; Lecture Notes in Computer Science; Springer: Berlin/Heidelberg, Germany, 2010; Volume 6314, pp. 255–268. ISBN 978-3-642-15560-4. [Google Scholar]
- Lowe, D.G. Distinctive Image Features from Scale-Invariant Keypoints. Int. J. Comput. Vis. 2004, 60, 91–110. [Google Scholar] [CrossRef]
- Workman, S.; Jacobs, N. On the Location Dependence of Convolutional Neural Network Features. In Proceedings of the 2015 IEEE Conference on Computer Vision and Pattern Recognition Workshops (CVPRW), Boston, MA, USA, 7–12 June 2015; pp. 70–78. [Google Scholar]
- Zhou, B.; Lapedriza, A.; Xiao, J.; Torralba, A.; Oliva, A. Learning Deep Features for Scene Recognition Using Places Database. Adv. Neural Inf. Process. 2014, 27, 487–495. [Google Scholar]
- Hu, S.; Feng, M.; Nguyen, R.M.H.; Lee, G.H. CVM-Net: Cross-View Matching Network for Image-Based Ground-to-Aerial Geo-Localization. In Proceedings of the IEEE Conference on Computer Vision and Pattern Recognition, Salt Lake City, UT, USA, 18–23 June 2018; pp. 7258–7267. [Google Scholar]
- Arandjelovic, R.; Gronat, P.; Torii, A.; Pajdla, T.; Sivic, J. NetVLAD: CNN Architecture for Weakly Supervised Place Recognition. In Proceedings of the IEEE Conference on Computer Vision and Pattern Recognition, Las Vegas, NV, USA, 27–30 June 2016; pp. 5297–5307. [Google Scholar]
- Regmi, K.; Shah, M. Bridging the domain gap for ground-to-aerial image matching. In Proceedings of the IEEE/CVF International Conference on Computer Vision, Seoul, Republic of Korea, 27 October–2 November 2019; pp. 470–479. [Google Scholar]
- Kim, H.J.; Dunn, E.; Frahm, J.-M. Learned Contextual Feature Reweighting for Image Geo-Localization. In Proceedings of the 2017 IEEE Conference on Computer Vision and Pattern Recognition (CVPR), Honolulu, HI, USA, 21–26 July 2017; pp. 3251–3260. [Google Scholar]
- Cai, S.; Guo, Y.; Khan, S.; Hu, J.; Wen, G. Ground-to-Aerial Image Geo-Localization with a Hard Exemplar Reweighting Triplet Loss. In Proceedings of the 2019 IEEE/CVF International Conference on Computer Vision (ICCV), Seoul, Republic of Korea, 27 October–2 November 2019; pp. 8390–8399. [Google Scholar]
- Zhang, X.; Meng, X.; Yin, H.; Wang, Y.; Yue, Y.; Xing, Y.; Zhang, Y. SSA-Net: Spatial Scale Attention Network for Image-Based Geo-Localization. IEEE Geosci. Remote Sens. Lett. 2022, 19, 1–5. [Google Scholar] [CrossRef]
- Naushad, R.; Kaur, T.; Ghaderpour, E. Deep Transfer Learning for Land Use and Land Cover Classification: A Comparative Study. Sensors 2021, 21, 8083. [Google Scholar] [CrossRef] [PubMed]
- Wei, J.; Yue, W.; Li, M.; Gao, J. Mapping Human Perception of Urban Landscape from Street-View Images: A Deep-Learning Approach. Int. J. Appl. Earth Obs. Geoinf. 2022, 112, 102886. [Google Scholar] [CrossRef]
- Woo, S.; Park, J.; Lee, J.-Y.; Kweon, I.S. CBAM: Convolutional Block Attention Module. In Computer Vision—ECCV 2018; Ferrari, V., Hebert, M., Sminchisescu, C., Weiss, Y., Eds.; Lecture Notes in Computer Science; Springer International Publishing: Cham, Switzerland, 2018; Volume 11211, pp. 3–19. ISBN 978-3-030-01233-5. [Google Scholar]
- Fu, J.; Liu, J.; Tian, H.; Li, Y.; Bao, Y.; Fang, Z.; Lu, H. Dual Attention Network for Scene Segmentation 2019. In Proceedings of the IEEE/CVF Conference on Computer Vision and Pattern Recognition, Long Beach, CA, USA, 16–20 June 2019; pp. 3146–3154. [Google Scholar]
- Zhang, Z.; Lan, C.; Zeng, W.; Jin, X.; Chen, Z. Relation-Aware Global Attention for Person Re-Identification. In Proceedings of the 2020 IEEE/CVF Conference on Computer Vision and Pattern Recognition (CVPR), Seattle, WA, USA, 13–19 June 2020; pp. 3183–3192. [Google Scholar]
- Zhou, S.; Wang, J.; Shi, R.; Hou, Q.; Gong, Y.; Zheng, N. Large Margin Learning in Set to Set Similarity Comparison for Person Re-Identification. IEEE Trans. Multimed. 2017, 20, 593–604. [Google Scholar] [CrossRef]
- Zhao, C.; Lv, X.; Zhang, Z.; Zuo, W.; Wu, J.; Miao, D. Deep Fusion Feature Representation Learning with Hard Mining Center-Triplet Loss for Person Re-Identification. IEEE Trans. Multimed. 2020, 22, 3180–3195. [Google Scholar] [CrossRef]
- Zhai, M.; Bessinger, Z.; Workman, S.; Jacobs, N. Predicting Ground-Level Scene Layout from Aerial Imagery. In Proceedings of the 2017 IEEE Conference on Computer Vision and Pattern Recognition (CVPR), Honolulu, HI, USA, 21–26 July 2017; pp. 4132–4140. [Google Scholar]
- Zhu, S.; Yang, T.; Chen, C. VIGOR: Cross-View Image Geo-Localization beyond One-to-One Retrieval. In Proceedings of the 2021 IEEE/CVF Conference on Computer Vision and Pattern Recognition (CVPR), Nashville, TN, USA, 20–25 June 2021; pp. 5316–5325. [Google Scholar]
- He, K.; Zhang, X.; Ren, S.; Sun, J. Deep Residual Learning for Image Recognition. In Proceedings of the 2016 IEEE Conference on Computer Vision and Pattern Recognition (CVPR), Las Vegas, NV, USA, 27–30 June 2016; pp. 770–778. [Google Scholar]
- Kingma, D.P.; Lei, J. Adam: A Method for Stochastic Optimization. arXiv 2015, arXiv:1412.6980. [Google Scholar]
- Vo, N.N.; Hays, J. Localizing and Orienting Street Views Using Overhead Imagery. In Computer Vision—ECCV 2016; Leibe, B., Matas, J., Sebe, N., Welling, M., Eds.; Lecture Notes in Computer Science; Springer International Publishing: Cham, Switzerland, 2016; Volume 9905, pp. 494–509. ISBN 978-3-319-46447-3. [Google Scholar]
- Shi, Y.; Yu, X.; Liu, L.; Zhang, T.; Li, H. Optimal Feature Transport for Cross-View Image Geo-Localization. In Proceedings of the AAAI Conference on Artificial Intelligence, New York, NY, USA, 7–12 February 2020; Volume 34, pp. 11990–11997. [Google Scholar] [CrossRef]
- Workman, S.; Souvenir, R.; Jacobs, N. Wide-Area Image Geolocalization with Aerial Reference Imagery. In Proceedings of the 2015 IEEE International Conference on Computer Vision (ICCV), Santiago, Chile, 7–13 December 2015; pp. 3961–3969. [Google Scholar]
- Selvaraju, R.R.; Cogswell, M.; Das, A.; Vedantam, R.; Parikh, D.; Batra, D. Grad-CAM: Visual Explanations from Deep Networks via Gradient-Based Localization. In Proceedings of the 2017 IEEE International Conference on Computer Vision (ICCV), Venice, Italy, 22–29 October 2017; pp. 618–626. [Google Scholar]
Figure 1.
Overall architecture of the algorithm.

Figure 2.
Geometrically distorted ground-to-aerial image pair. (a) Ground panorama image. (b) Aerial remote sensing image after polar transform.
Figure 2.
Geometrically distorted ground-to-aerial image pair. (a) Ground panorama image. (b) Aerial remote sensing image after polar transform.

Figure 3.
Structure diagram of MC_GRA module.

Figure 4.
Schematic of deformable convolution.

Figure 5.
Schematic structure of MixVPR.

Figure 6.
Three examples of cross-view datasets. Aerial images (left) and ground panorama images (right). (a) CVUSA. (b) VIGOR. (c) Taipei.
Figure 6.
Three examples of cross-view datasets. Aerial images (left) and ground panorama images (right). (a) CVUSA. (b) VIGOR. (c) Taipei.


Figure 7.
Accuracy results of the cross-view image based geo-localization algorithms on the CVUSA dataset with the recall@K plot.
Figure 7.
Accuracy results of the cross-view image based geo-localization algorithms on the CVUSA dataset with the recall@K plot.

Figure 8.
Accuracy results of the cross-view image based geo-localization algorithms in the VIGOR dataset with the recall@K plot.
Figure 8.
Accuracy results of the cross-view image based geo-localization algorithms in the VIGOR dataset with the recall@K plot.

Figure 9.
Accuracy results of the cross-view image based geo-localization algorithms in the Taipei dataset with the recall@K plot.
Figure 9.
Accuracy results of the cross-view image based geo-localization algorithms in the Taipei dataset with the recall@K plot.

Figure 10.
Recall@K plot of experiments comparing our module with baseline model in (a) CVUSA and (b) VIGOR datasets.
Figure 10.
Recall@K plot of experiments comparing our module with baseline model in (a) CVUSA and (b) VIGOR datasets.

Figure 11.
Recall@K plot of effectiveness experiment of deformable convolution in (a) CVUSA and (b) VIGOR datasets.
Figure 11.
Recall@K plot of effectiveness experiment of deformable convolution in (a) CVUSA and (b) VIGOR datasets.

Figure 12.
Model visualization heat map. (a) Attention heat baseline model. (b) Attention heat baseline model. (c) Attention heatmap for CBAM model. (d) Attention heatmap for CBAM model. (e) Attention heatmap for MC_GRA model. (f) Attention heatmap for MC_GRA model.
Figure 12.
Model visualization heat map. (a) Attention heat baseline model. (b) Attention heat baseline model. (c) Attention heatmap for CBAM model. (d) Attention heatmap for CBAM model. (e) Attention heatmap for MC_GRA model. (f) Attention heatmap for MC_GRA model.


Table 1.
Comparison of results of various methods in the CVUSA dataset.
| Method | CVUSA | |||
|---|---|---|---|---|
| r@1 | r@5 | r@10 | r@1% | |
| Workman et al. [36] | - | - | - | 34.30 |
| CVM-Net [17] | 22.47 | 49.98 | 63.18 | 93.62 |
| Liu and Li [3] | 40.79 | 66.82 | 76.36 | 96.08 |
| Cai et al. [21] | - | - | - | 98.30 |
| SAFA [5] | 89.84 | 96.83 | 98.14 | 99.64 |
| SSA-Net [22] | 91.52 | 97.69 | 98.57 | 99.71 |
| DSM [6] | 91.96 | 97.50 | 98.54 | 99.67 |
| Ours | 92.08 | 97.70 | 98.66 | 99.67 |
Note: The bold font represents the optimal value for each column, and ‘-’ indicates that the results of this method are not available.
Table 2.
Comparison of results of various methods in the VIGOR dataset.
| Method | VIGOR (Same-Area) | |||
|---|---|---|---|---|
| r@1 | r@5 | r@10 | r@1% | |
| Siamese-VGG | 18.69 | 43.64 | 55.36 | 97.55 |
| SAFA+Polar [5] | 24.13 | 45.58 | - | 95.26 |
| Ours+Polar | 27.54 | 51.16 | 60.88 | 96.78 |
| SAFA [5] | 33.93 | 58.42 | 68.12 | 98.24 |
| SAFA+Mining [31] | 38.02 | 62.87 | 71.12 | 97.63 |
| VIGOR [31] | 41.07 | 65.81 | 74.05 | 98.37 |
| Ours | 40.56 | 66.37 | 74.48 | 98.02 |
Note: The bold font represents the optimal value for each column, and ‘-’ indicates that the results of this method are not available.
Table 3.
Comparison of results of various methods in the Taipei dataset.
| Method | Taipei | |||
|---|---|---|---|---|
| r@1 | r@5 | r@10 | r@1% | |
| SAFA [5] | 23.51 | 47.50 | 57.43 | 83.69 |
| DSM [6] | 25.42 | 50.32 | 61.57 | 84.87 |
| Ours | 27.86 | 51.43 | 63.54 | 88.74 |
Note: The bold font represents the optimal value for each column.
Table 4.
Validation of our designed MC_GRA module in CVUSA and VIGOR datasets.
| Method | CVUSA | |||
| r@1 | r@5 | r@10 | r@1% | |
| Baseline | 59.18 | 80.80 | 87.20 | 97.83 |
| CBAM [23] | 88.12 | 96.21 | 97.67 | 99.50 |
| Ours | 92.08 | 97.70 | 98.66 | 99.67 |
| Method | VIGOR (Same Area) | |||
| r@1 | r@5 | r@10 | r@1% | |
| Baseline | 11.03 | 26.06 | 34.60 | 92.58 |
| CBAM [23] | 23.44 | 44.63 | 53.99 | 95.56 |
| Ours | 27.54 | 51.16 | 60.88 | 96.78 |
Note: The bold font represents the optimal value for each column.
Table 5.
Validation of deformable convolution in CVUSA and VIGOR datasets.
| Method | CVUSA | |||
| r@1 | r@5 | r@10 | r@1% | |
| MC_GRA (Standard convolution) | 90.17 | 97.02 | 98.08 | 99.63 |
| MC_GRA | 92.08 | 97.70 | 98.66 | 99.67 |
| Method | VIGOR (Same Area) | |||
| r@1 | r@5 | r@10 | r@1% | |
| MC_GRA (Standard convolution) | 25.24 | 50.47 | 60.35 | 96.72 |
| MC_GRA | 27.54 | 51.16 | 60.88 | 96.78 |
Note: The bold font represents the optimal value for each column.
Disclaimer/Publisher’s Note: The statements, opinions and data contained in all publications are solely those of the individual author(s) and contributor(s) and not of MDPI and/or the editor(s). MDPI and/or the editor(s) disclaim responsibility for any injury to people or property resulting from any ideas, methods, instructions or products referred to in the content. |
© 2023 by the authors. Licensee MDPI, Basel, Switzerland. This article is an open access article distributed under the terms and conditions of the Creative Commons Attribution (CC BY) license (https://creativecommons.org/licenses/by/4.0/).
Share and Cite
MDPI and ACS Style
Hou, Q.; Lu, J.; Guo, H.; Liu, X.; Gong, Z.; Zhu, K.; Ping, Y. Feature Relation Guided Cross-View Image Based Geo-Localization. Remote Sens. 2023, 15, 5029. https://doi.org/10.3390/rs15205029
AMA Style
Hou Q, Lu J, Guo H, Liu X, Gong Z, Zhu K, Ping Y. Feature Relation Guided Cross-View Image Based Geo-Localization. Remote Sensing. 2023; 15(20):5029. https://doi.org/10.3390/rs15205029
Chicago/Turabian StyleHou, Qingfeng, Jun Lu, Haitao Guo, Xiangyun Liu, Zhihui Gong, Kun Zhu, and Yifan Ping. 2023. "Feature Relation Guided Cross-View Image Based Geo-Localization" Remote Sensing 15, no. 20: 5029. https://doi.org/10.3390/rs15205029
Note that from the first issue of 2016, this journal uses article numbers instead of page numbers. See further details here.