
Analysis of Electromagnetic Wave and Multipath Suppression from Overhead Perspective
by
 ,
,
Haolan Luo
1 ,
,
Wenqiang Zhang
2,
Zhaoting Ren
2,
Chuantian Tang
1,
Yu Ou
1,
Guolong Cui
1,3 and
Shisheng Guo
1,3,* 1
School of Information and Communication Engineering, University of Electronic Science and Technology of China, Chengdu 611731, China
2
Qingdao Hisense Hitachi Air-Conditioning Systems Co., Ltd., Qingdao 266555, China
3
Yangtze Delta Region Institute, University of Electronic Science and Technology of China, Quzhou 324000, China
*
Author to whom correspondence should be addressed.
Remote Sens. 2023, 15(20), 4903; https://doi.org/10.3390/rs15204903
Submission received: 6 August 2023
/
Revised: 23 September 2023
/
Accepted: 5 October 2023
/
Published: 10 October 2023
(This article belongs to the Special Issue Advances in Radar Systems for Target Detection and Tracking)
Abstract
:The multipath problem in indoor target detection has always been a long-standing research hotspot. Although there are many solutions to the multipath problem in a horizontal line of sight, the multipath problem of single-station radar from an overhead perspective still needs to be solved. At present, there is a lack of detailed analysis on the multipath propagation law of electromagnetic waves from an overhead perspective. This paper first analyzes the multipath propagation law of overhead perspective and reveals a combination multipath propagation phenomenon that is easily overlooked, which is formed by walls, ground, and targets. In addition, during the analysis process, the influence of coherent sources generated by multipath on angle estimation was fully considered, and verified through simulation and measured data. Then, based on the result of propagation analysis, this paper proposes a multipath ghost target suppression method. This method first establishes a multipath ghost target location dictionary based on building information, and then matches the tracking results with the dictionary to suppress successfully matched multipath ghost targets. Finally, several experiments are carried out to verify the effectiveness of this method.
1. Introduction
Due to the advantage of radar not being affected by environmental factors such as light and temperature, it has been widely used in the fields of indoor target gesture recognition [1], vital sign monitoring [2], fall detection [3], and localization and tracking [4,5,6,7,8,9,10] in recent years. It is worth noting that electromagnetic (EM) waves can be reflected by fixed objects such as floors, walls, and furniture in indoor environments, resulting in radar echoes containing not only effective target signals but also ghost target signals generated by the reflection path. Therefore, research on indoor multipath has attracted the attention of a large number of researchers in recent years.
One of the research hotpots in indoor multipath is multipath utilization, and the core of this type of research is mainly to use multipath signals to estimate the position of targets in non-line-of-sight (NLOS) areas [11,12,13], in order to estimate building layout [14,15] and so on. Another is the suppression of multipath signals. These works mainly use the fusion of results from different detection views [16,17], deep learning [18] methods, or the theory of compressive sensing [19] to achieve multipath ghost target suppression. However, these studies mainly consider the detection perspective in a horizontal line of sight. When there are multiple targets in the room, mutual occlusion among the targets can lead to missed detection of the occluded targets. Although the methods mentioned in [16,17] can be used to solve this problem, they are not applicable in single-perspective application scenarios.
To address this issue, relevant scholars have begun to consider indoor target detection from an overhead perspective. In addition, with the continuous deepening of the smart home field, people are beginning to try to combine radar with central air-conditioners and other household appliances to achieve intelligent control of household appliances [20]. Therefore, more and more researchers are turning their attention to the study of indoor target detection based on an overhead perspective. In [21,22], the authors solved the problem of people-counting from an overhead perspective using the likelihood ratio and deep learning methods, respectively. However, these two methods only provide the target quantity, and the target’s location can’t be obtained. For the research work on the positioning problem based on an overhead perspective radar, A. Antonucci et al. [23] evaluated the performance of existing target localization and tracking methods from an overhead perspective. However, they did not consider the issue of multipath propagation from an overhead perspective.
Compared to the horizontal line of sight, when detecting indoor targets from an overhead perspective, not only the reflection from the wall but also the reflection from the ground should be considered. In [24,25], the researchers only considered wall reflection but did not consider ground reflection. Similarly, ref. [26] mainly focuses on the ghost targets generated by ground, but does not consider multipath propagation related to walls. In [27], Z. Hao et al. proposed a multipath-assisted localization (MAL) localization method that utilizes ground and wall reflections. However, this paper separately mentions wall and ground reflections when utilizing multipath and does not discuss the combined reflection of wall and ground. In fact, when the target is close to the wall, the wall, ground, and target form a structure similar to a corner reflector, resulting in strong combined multipath reflection signal. To our knowledge, there is nothing in the literature on this phenomenon.
Another noteworthy problem for consideration is the formation of coherent sources from various multipath signals. When two signals traverse a similar propagation distance, EM wave signals traveling along different paths tend to form coherent sources. During the processing of array signals, these coherent sources can lead to an autocorrelation matrix with diminished rank, resulting in a decline in the performance of angle estimation algorithms [28]. In the context of detection for horizontal line of sight, where the emphasis lies on azimuth detection range, a beam with wide azimuth and narrow elevation dimensions is typically employed for detection. As a consequence, multipath coherent sources tend to emerge primarily when the target is in close proximity to a reflecting surface. In contrast, overhead perspective detection needs to keep the detection range of both azimuth and elevation dimensions, and the ground under the overhead perspective will always follow the target as a fixed reflecting surface. Therefore, the multipath signals from an overhead perspective are more abundant, making it easier to form coherent sources.
Currently, modeling of multipath signals primarily relies on linear tracking models [29,30,31]. However, these studies do not take into account the influence of multipath coherent sources on signal processing. M. Mercuri et al. [32] addressed the issue of coherence between multipath signals from nearby targets and direct signals from distant targets during signal modeling. Based on this, they proposed a method for extracting vital signs from distant targets. Nevertheless, they did not consider the impact of multipath coherent sources on localization results. In fact, when multipath signals form coherent sources, the localization results can significantly deviate from those derived from linear tracking models due to the degradation in angle estimation algorithm performance. This, in turn, affects the accurate assessment of echo components.
In summary, there are two noteworthy issues concerning the multipath propagation of EM waves from an overhead perspective. Firstly, a structure akin to a corner reflector is created by the interplay of the target, the ground, and a third reflecting surface (such as a wall). This gives rise to robust multipath reflections that often go unnoticed. Secondly, when detecting from an overhead perspective, it becomes imperative to take into account the detection range in both azimuth and elevation. In such cases, the radar is exposed to a high volume of multipath signals, which means that multipath coherent sources are easier to form. This diminishes the precision of angle estimation and heightens the difficulty of echo component analysis.
In order to fill this gap, this research first completed the establishment of an EM wave propagation model from an overhead perspective and verified the correctness of the model through multiple experiments. It is worth mentioning that, in data analysis, the negative impact of coherent sources formed by different propagation paths on the performance of angle estimation is fully considered. On this basis, this paper proposes a multipath ghost target suppression method. This method first confirms the track of the direct path from the tracking results, and then establishes a comprehensive multipath ghost target position dictionary based on its track information and building layout. By matching the remaining track with the dictionary and deleting the successfully matched tracks, the suppression of multipath ghost targets is achieved.
The remainder of this paper is organized as follows. In Section 2, the system model of overhead perspective is introduced, which includes the EM propagation model, the received signal of the multipath scenario, and the three dimensional (3D) point cloud generation method. In Section 3, the experimental process is introduced, and the echo components of the target at different positions are analyzed in detail, which verifies the correctness of the established EM propagation model and clarifies the formation mechanism of multipath ghost targets. Section 4 introduces the multipath ghost target suppression method for overhead perspective, and the conclusion is drawn in Section 5.
2. System Model of Overhead Perspective
In this section, we introduce the system model in an indoor multipath environment for an overhead perspective in detail. First, the model of EM wave propagation is established in Section 2.1. Then, we introduce the indoor multipath scenario received signal in Section 2.2. Finally, the method of the target location is described in Section 2.3.
2.1. The Model of EM Propagation for an Overhead Perspective
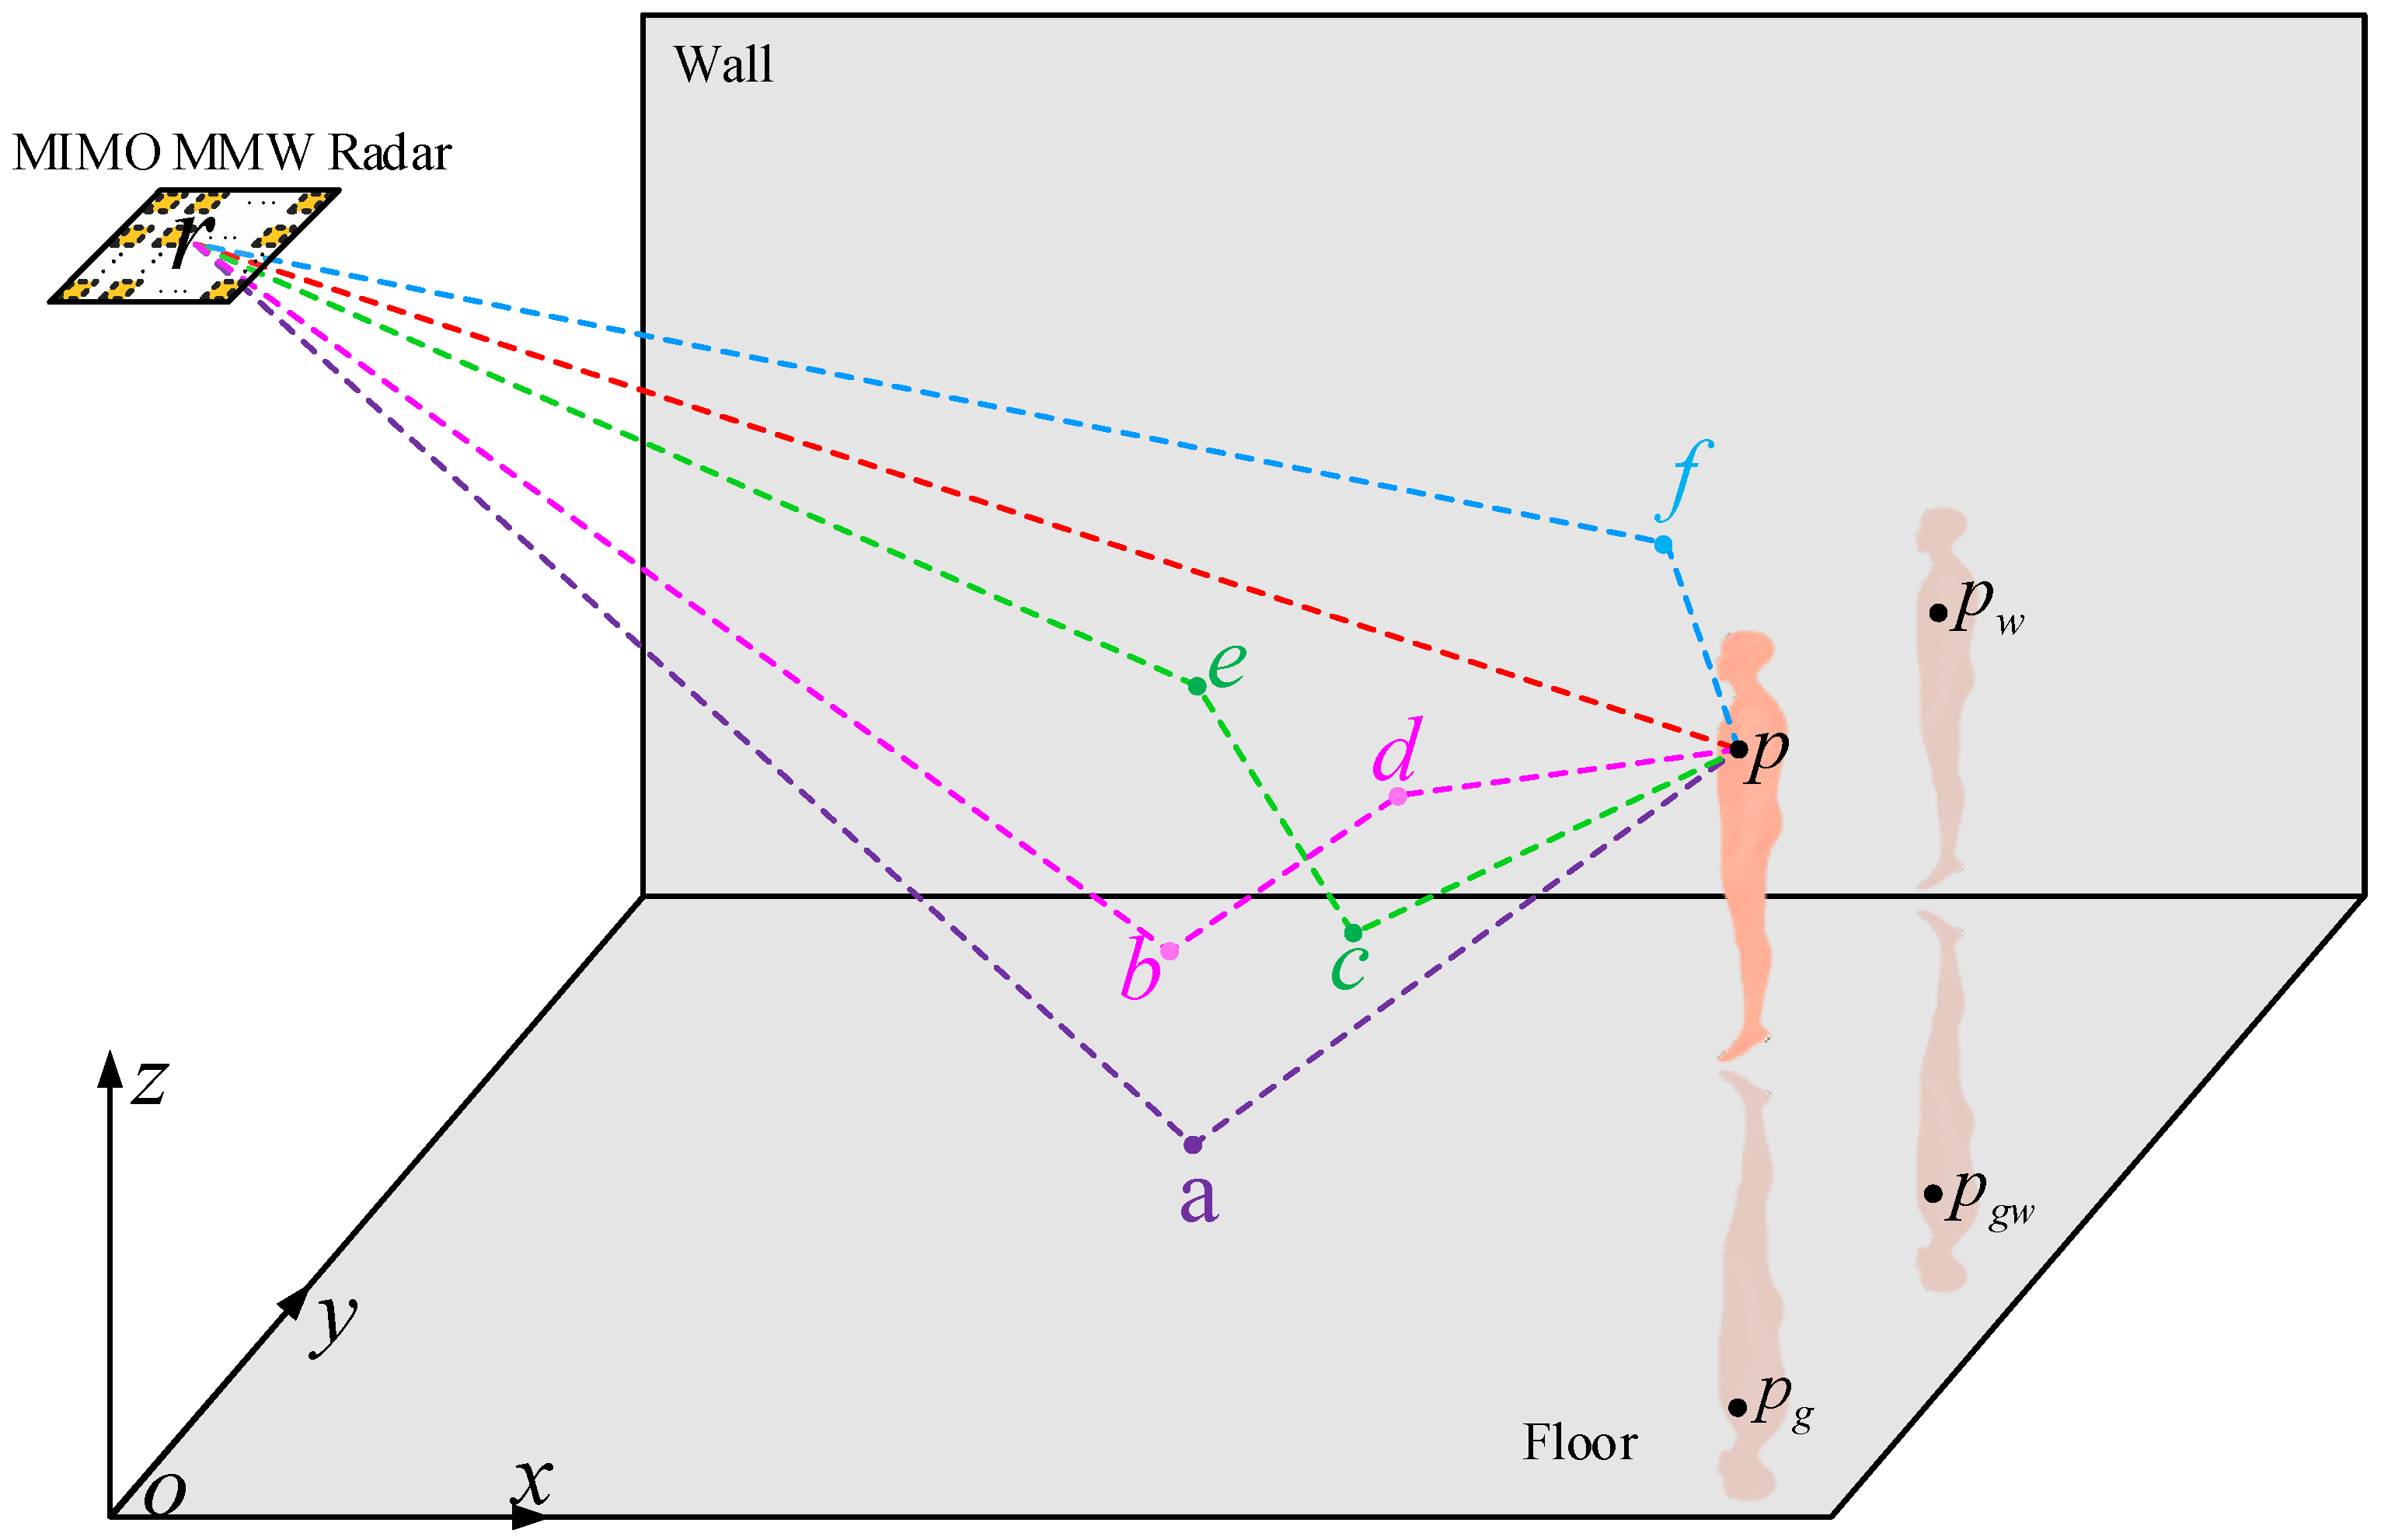
A multiple input multiple output (MIMO) radar is deployed on the top of a room, and it transmits EM waves downward, as shown in Figure 1. When a target p is close to a wall in the room, the transmitting paths of EM waves primarily include , , , , and , which are represented by , , , , and , respectively. The receiving paths mainly include , , , , and , which are represented by , , , , and , respectively. Table 1 lists the possible transmitting paths and receiving paths. As a result, the complete propagation paths of EM waves between radar and target are combinations of transmitting paths and receiving paths.
Among these propagation paths, is generated directly by the target’s reflection, and its reflection attenuation is minimal. Therefore, the echo of this path is an important part of the echo signal and is most helpful for target positioning. For the propagation paths of and , in addition to the reflection of the target, the EM waves in these two paths are further reflected once by the ground. The echo signals generated by these two paths have strong strengths and are common multipath reflection signals, which cannot generally be ignored. Furthermore, since the transmitting and receiving paths of these two propagation paths are the same as each other, their propagation distances are equal, so that these two signals form a coherent source. Coherent sources cause the autocorrelation matrix of the array signal to be rank-deficient, which affects the results of angle estimation. This causes the positioning results of multipath signals to deviate from the corresponding theoretical positions, increasing the difficulty of multipath signal recognition. The specific content of this phenomenon is explained in detail in the experimental section of this paper. Similar to and , the echoes generated by and are both reflected once by the wall and target, and the their propagation distances are the same; thus, they can also form a coherent source.
With regard to the path , let the space coordinates of p be . The mirror symmetrical point of point p with respect to the ground is located at . Similarly, the coordinates of point with respect to the mirror symmetrical point of the wall are , where D is the distance between the target and the wall. Analogously, the coordinates of with respect to the mirror symmetrical point p of the wall are for the path . Meanwhile, the mirror symmetrical point of point is located at . We can see that the coordinates of and are the same. Therefore, the propagation distances of the paths and are the same. Similarly, the propagation distances of the paths and are the same as the paths and . Therefore, despite the fact that the signals of these four paths have significant energy attenuation after multiple reflections, the strength of the new signal generated by the superposition of these four signals cannot be ignored due to their same propagation distances. Similarly, these four paths will also form coherent sources.
2.2. Received Signal in an Indoor Multipath Scenario
The radar transmits a linear frequency modulation signal within a sweep time T, which can be expressed as
where is the amplitude of the transmitted signal, represents the carrier frequency, k denotes the frequency modulation slope, and represents the initial phase of the transmitted signal. represents the rectangle function and can be expressed as
Let the coordinates of radar be , where H is the height of radar. Then, the distance between radar and target can be calculated as
and its corresponding time delay can be expressed as
Similarly, the time delays corresponding to the other propagation paths in Section 2.1 are denoted as , respectively. Then, the received signal can be written as
where represents the EM wave energy attenuation coefficient of the lth propagation path.
After mixing the echo signal with the transmitted signal and omitting the quadratic components, the beat signal received by the receiver is given by
where is the amplitude corresponding to each propagation path.
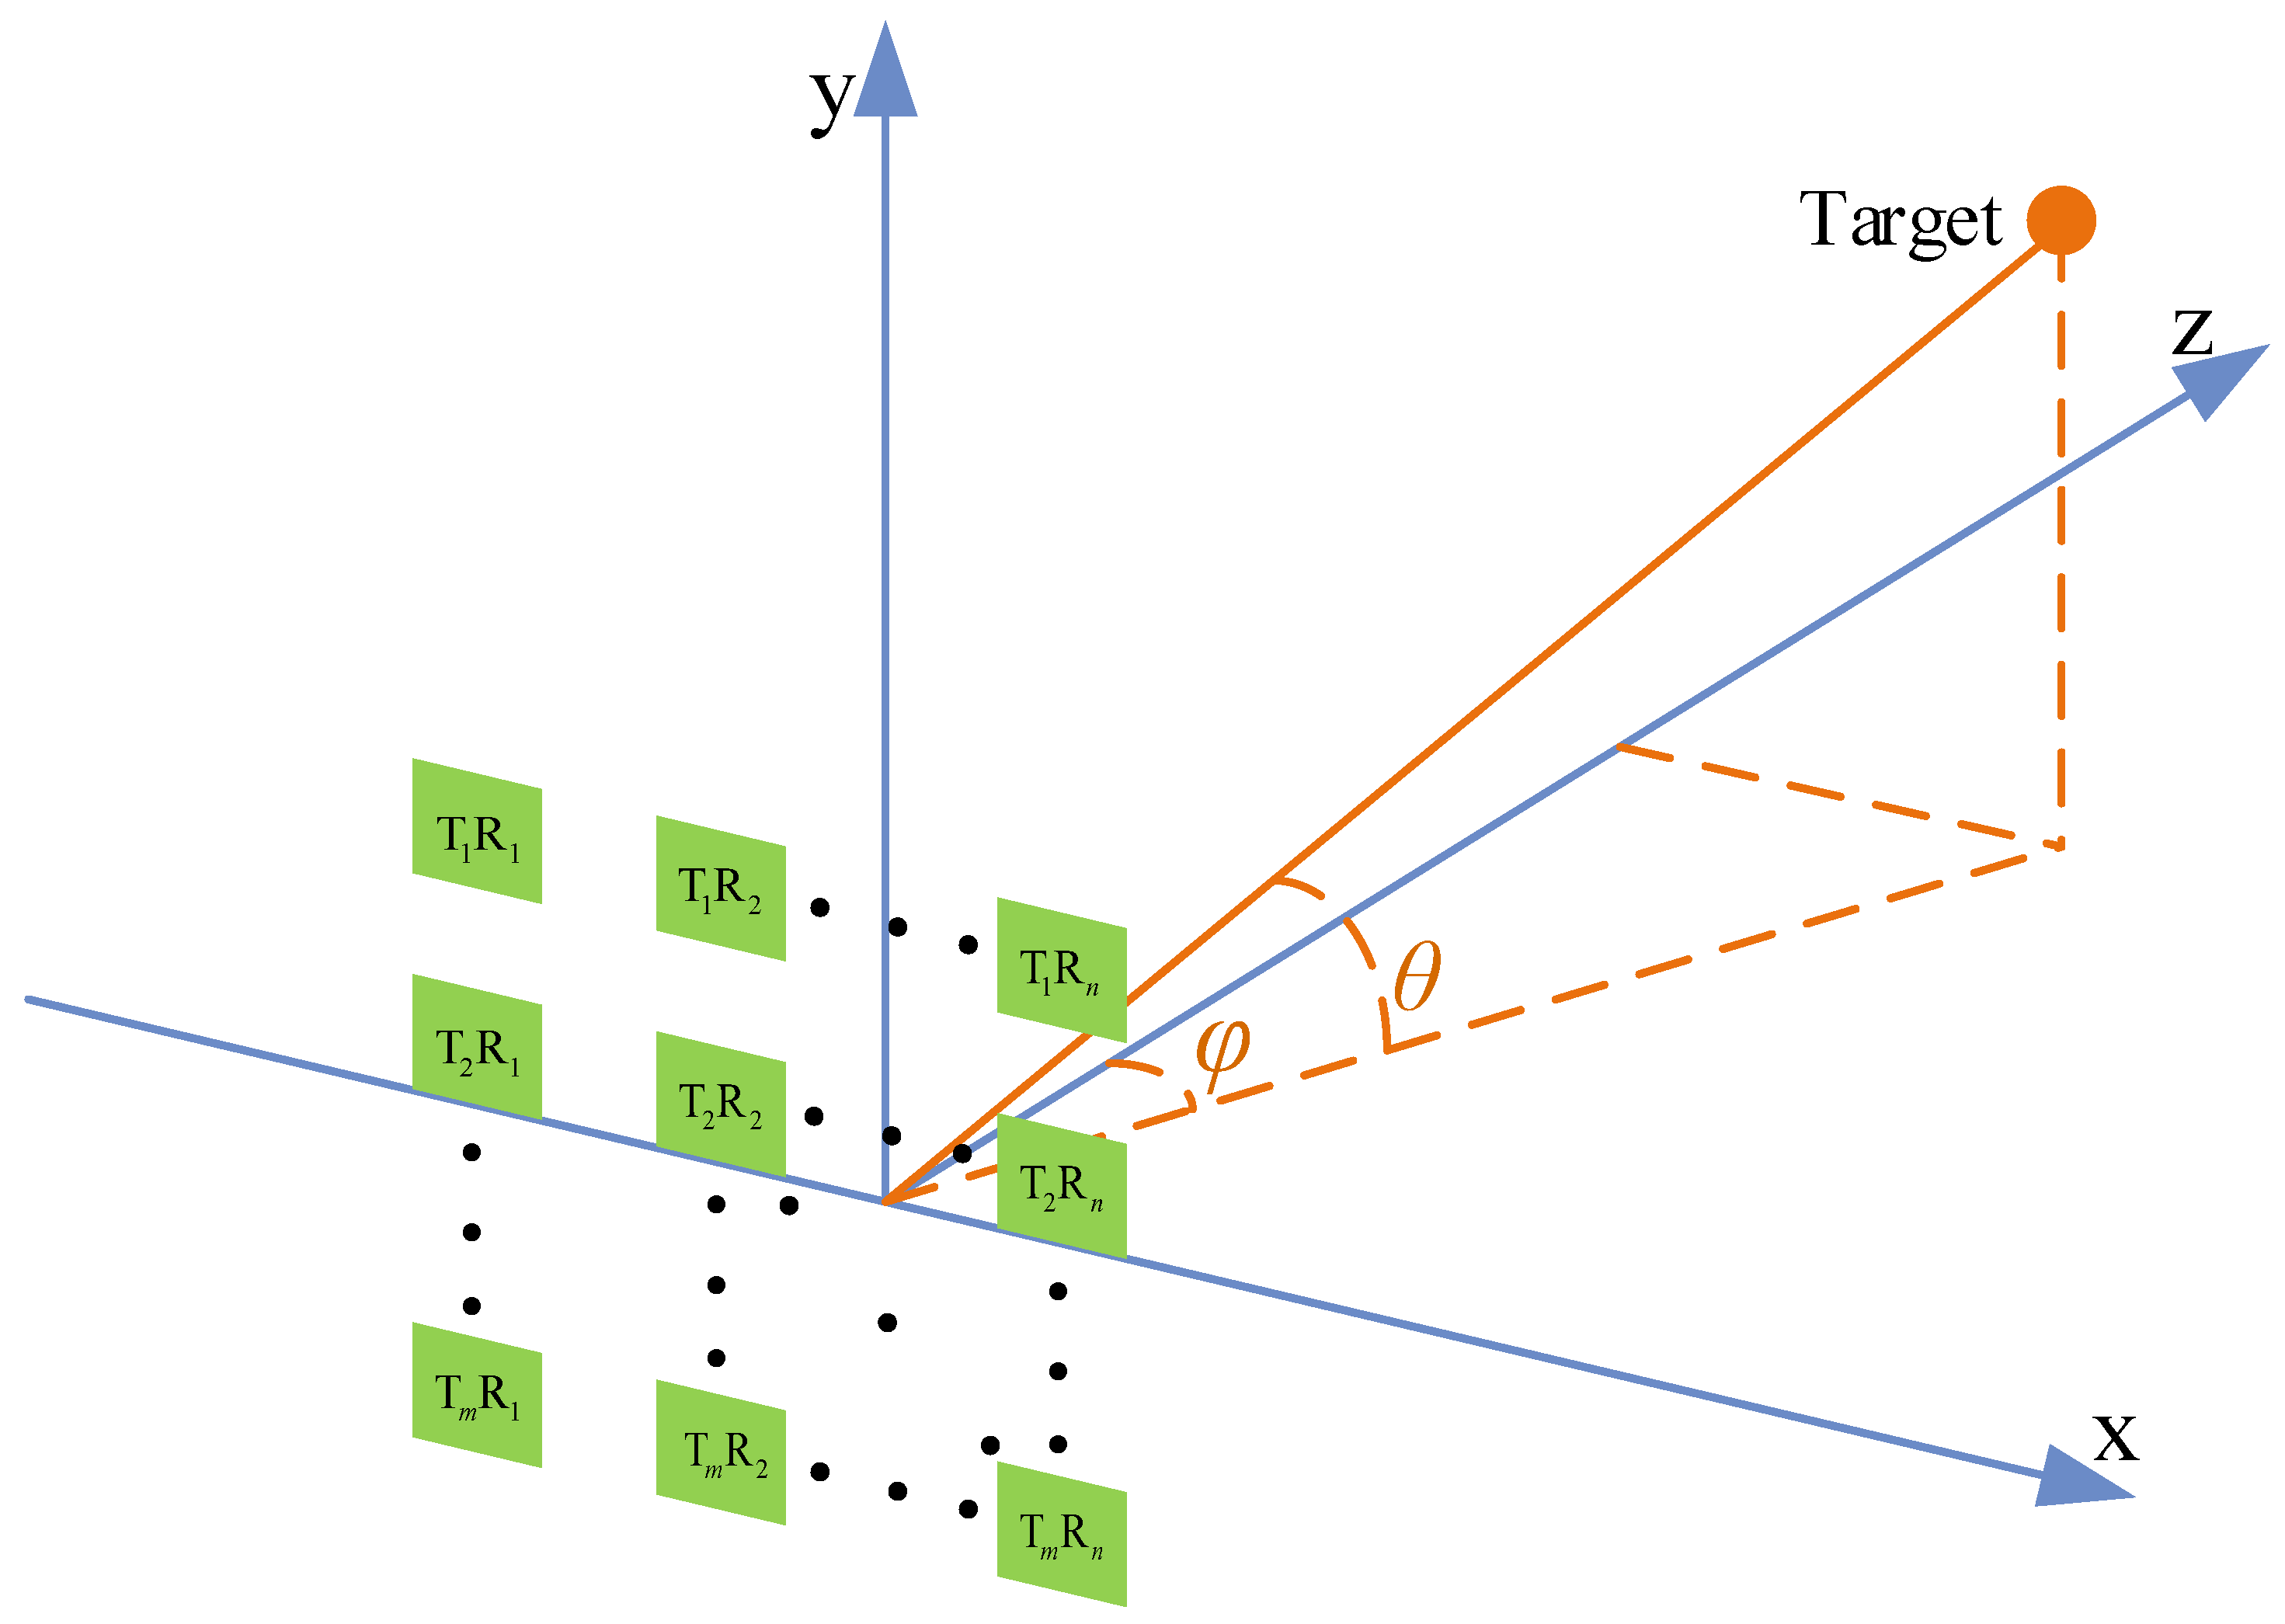
A schematic diagram of a typical virtual array [33] for a time-division transmitted MIMO radar is shown in Figure 2. The equivalent transceiver pair formed by the mth transmitting antenna and the nth receiving antenna is denoted by , while and denote the phase differences of signals received by adjacent antennas in the x and y axes, respectively. and can be calculated by
Herein, and represent the elevation angle and azimuth angle of the target, respectively. is the wavelength of the transmitting signal; d denotes the distance between the adjacent receiving antennas, which is equal to . Considering the influence of noise and static object interference in an indoor environment, the beat signal received by can be expressed as
where is the noise signal in the environment and denotes the signal generated by the fixed objects in the room.
Figure 2.
The geometry of the equivalent array.

2.3. The 3D Point Cloud Generation Method
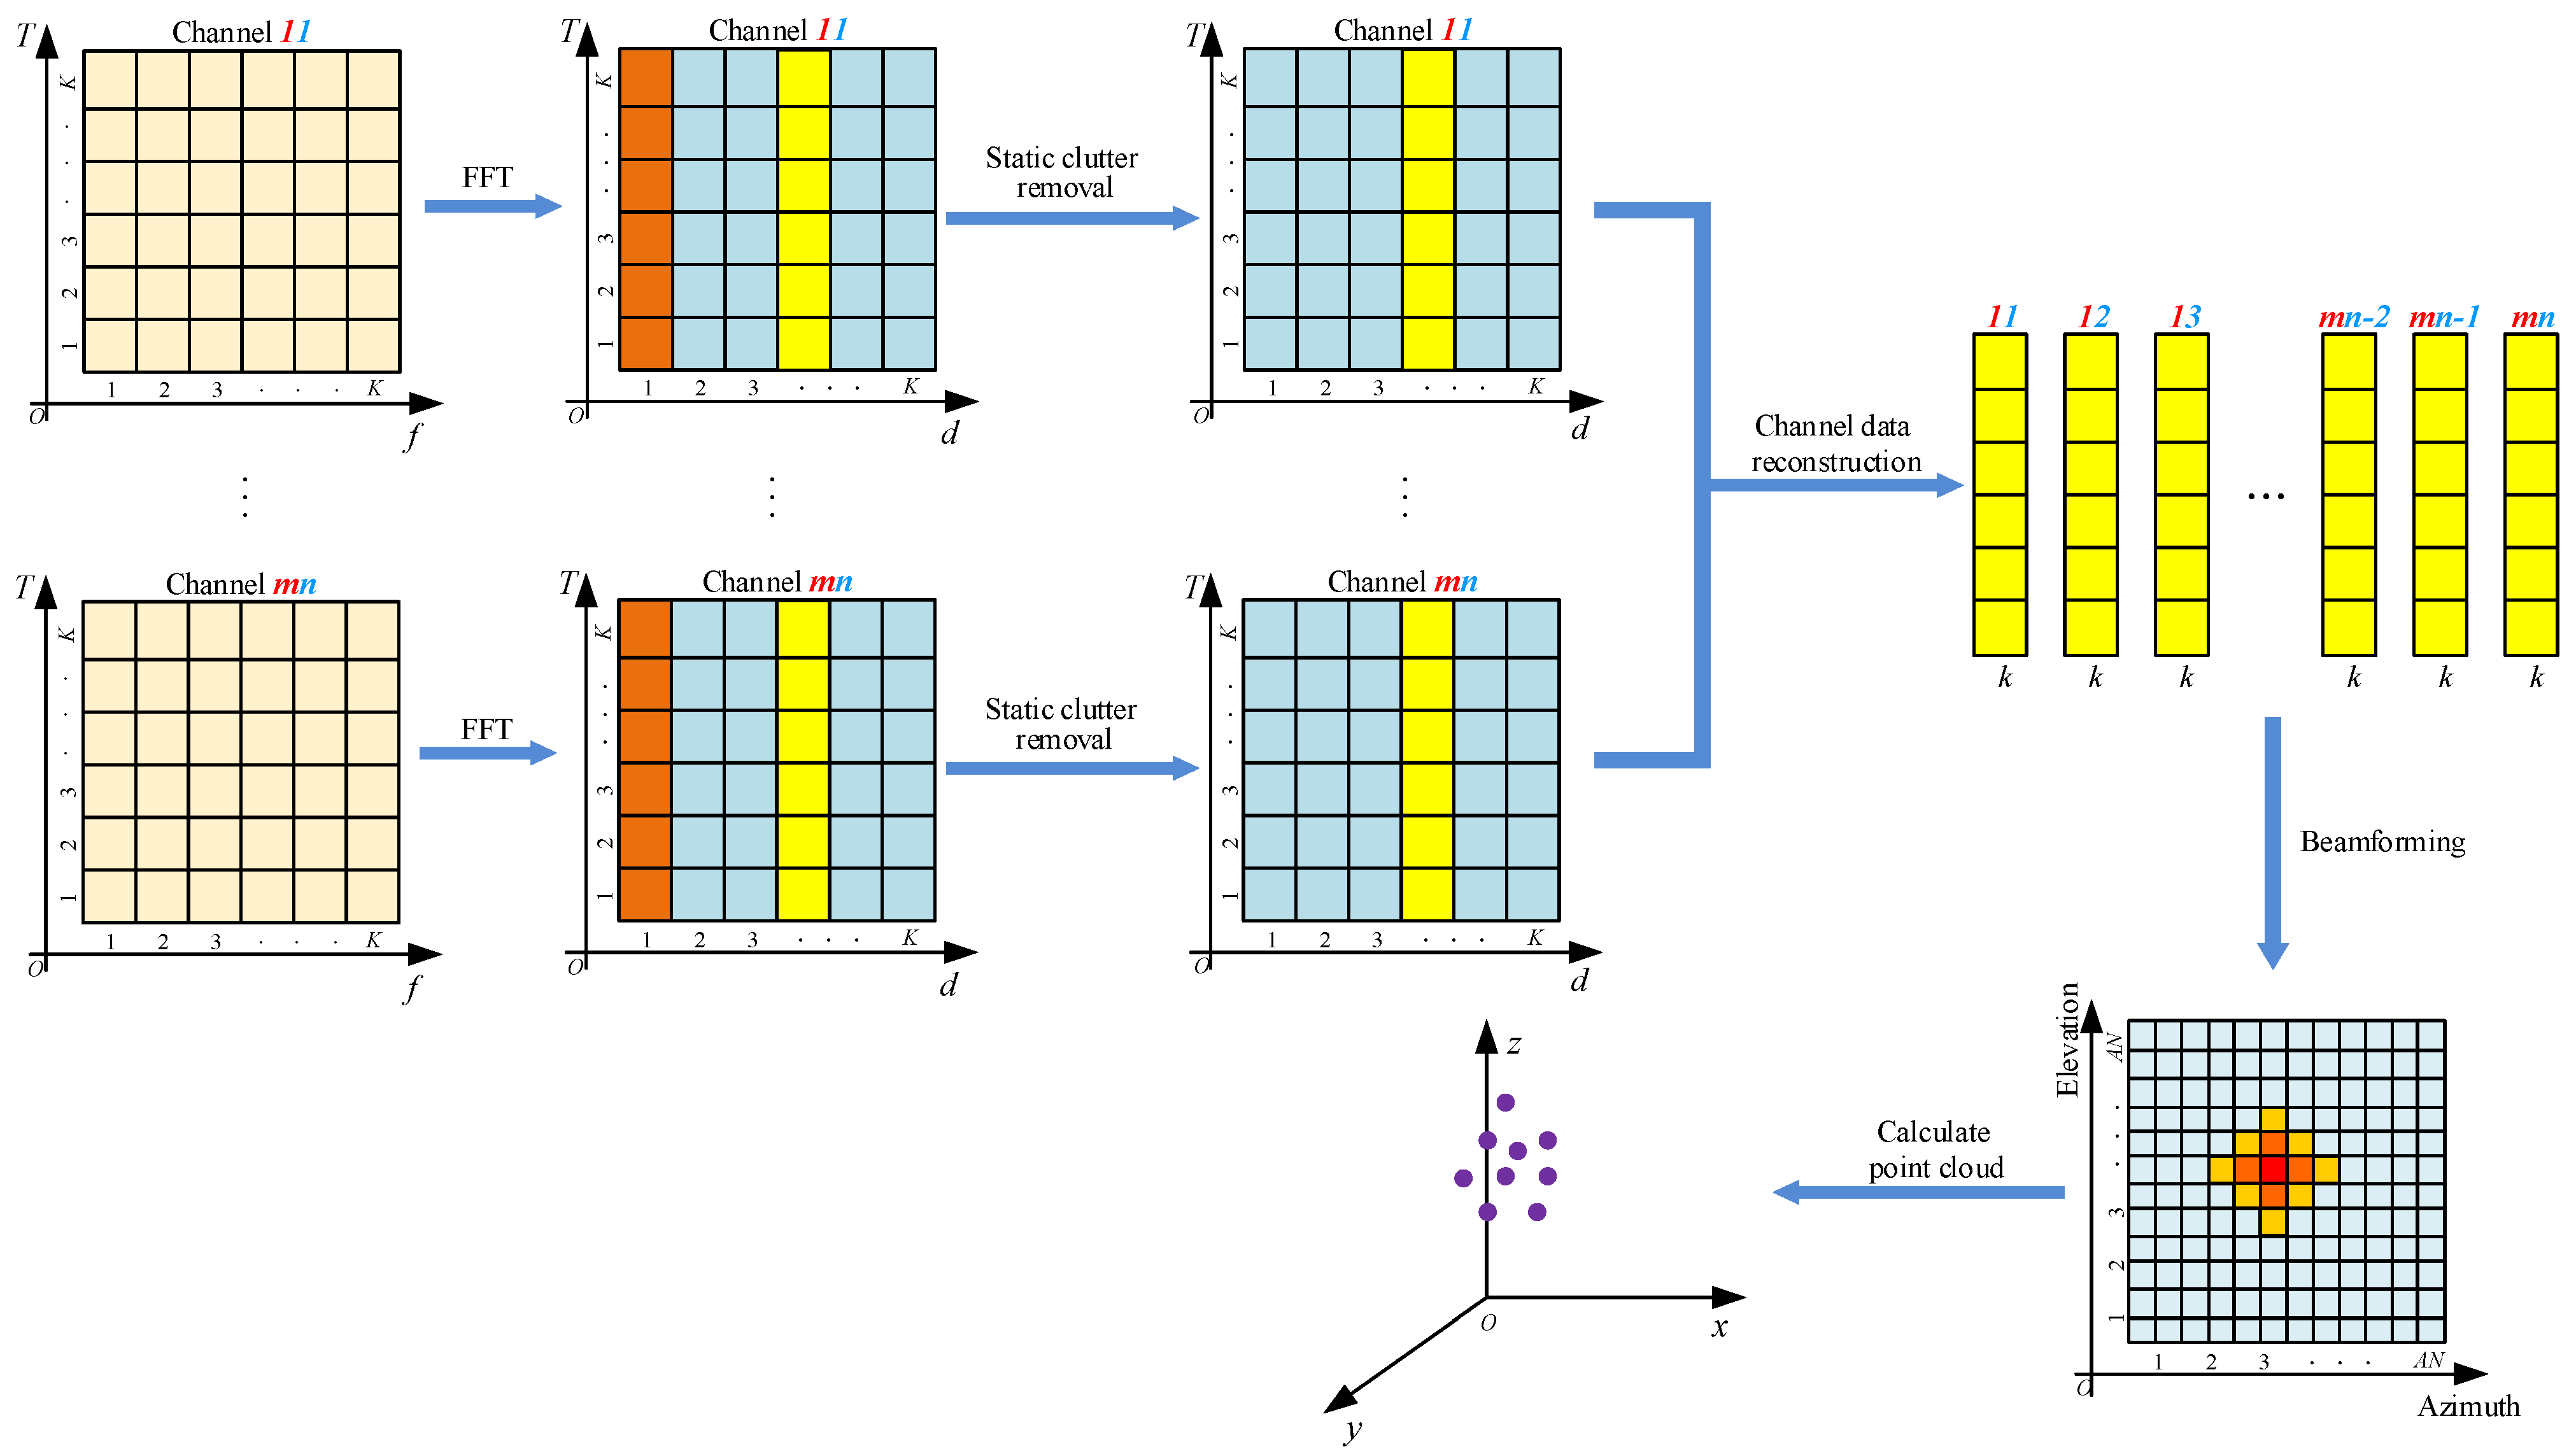
In this section, we introduce the 3D point cloud generation method for the MIMO radar system. The whole process mainly includes data preprocessing, target distance estimation, target angle estimation, and target position estimation. The flow chart of the adopted method is shown in Figure 3.
2.3.1. Data Preprocessing
It can be seen from Equation (6) that the beat signal can be regarded as a single-frequency signal whose frequency includes the distance information of the target. Thus, we can use the fast Fourier transform method (FFT) to obtain the target’s distance information [34].
Let the number of data cycles collected in each frame be ; then, after the FFT for each cycle, the range profile matrix can be expressed as
where is the number of the range bin, which is equal to the number of FFT points, represents a column vector, which contains the data of all cycles in the kth range bin in a frame, and .
In addition to the received echo induced by the targets, stationary objects such as the ground and walls in the room will also produce strong echo interference. In order to eliminate the interference caused by these stationary objects, a moving target indication (MTI) algorithm [35] is adopted, which is achieved by subtracting the mean value of the signal in each range bin. The specific process can be expressed as
where stands for computational mathematical expectation, and . After MTI, the range profile matrix can be expressed as
where .
2.3.2. Target Distance Estimation
Due to the noise in the environment and the micro-movements of the human body, the signal-to-noise ratios (SNRs) of the echo are different in different periods, which renders target detection difficult. Therefore, in order to improve the detection probability of the target, the incoherent accumulation method is used to improve the SNR. The signal amplitude of the kth range bin after incoherent accumulation is calculated by
Since the duration of each frame is short, the position of the moving target is almost unchanged for one accumulation process. Therefore, the signal energy on the range bin containing the target information is well accumulated. After incoherent accumulation, (11) is rewritten as
where .
Due to the human body being an extended target, the signals received by the radar will contain the reflected signals of various body parts, which will cause the target’s range profile to appear multi-peaked. To resolve this phenomenon, this paper adopts the ordered statistics constant false alarm rate (OS–CFAR) algorithm [36] to detect the target.
2.3.3. Target Angle Estimation
According to the beamforming theory [37], it is necessary to calculate the steering vector first before calculating the angle of the target. A typical spatial angle model from an overhead perspective is shown in the Figure 2. Taking the array element at the origin of the equivalent coordinate system as the reference array element, the steering vector can be expressed as
After calculating the steering vector of the target, the next step is to calculate the autocorrelation matrix of the target.
Based on the order of the antennas, the data of different channels for the same range bin in a frame are reorganized by a matrix , which has rows and columns. can be expressed as
Then, the correlation matrix of the signal is calculated by
We use the minimum-variance distortionless response (MVDR) algorithm [37] to obtain the spatial spectrum. At each direction (, ), it can be expressed as
Based on the , the peak position of is extracted to obtain the and of the target.
2.3.4. Target Point Cloud Generation
After getting the target’s distance, azimuth angle, and elevation angle, the target’s space coordinates can be calculated as
3. Echo Component Analysis for Overhead MMW Radar
In this section, several experiments are designed to verify the correctness of the EM propagation model mentioned above. We introduce them in two parts. First, the data of a specific location are analyzed in detail to demonstrate that the echo signal contains the signal of the propagation path in the established propagation model. Second, the universality of the established propagation model is verified with data from various locations.
3.1. Detailed Analysis of Typical Data
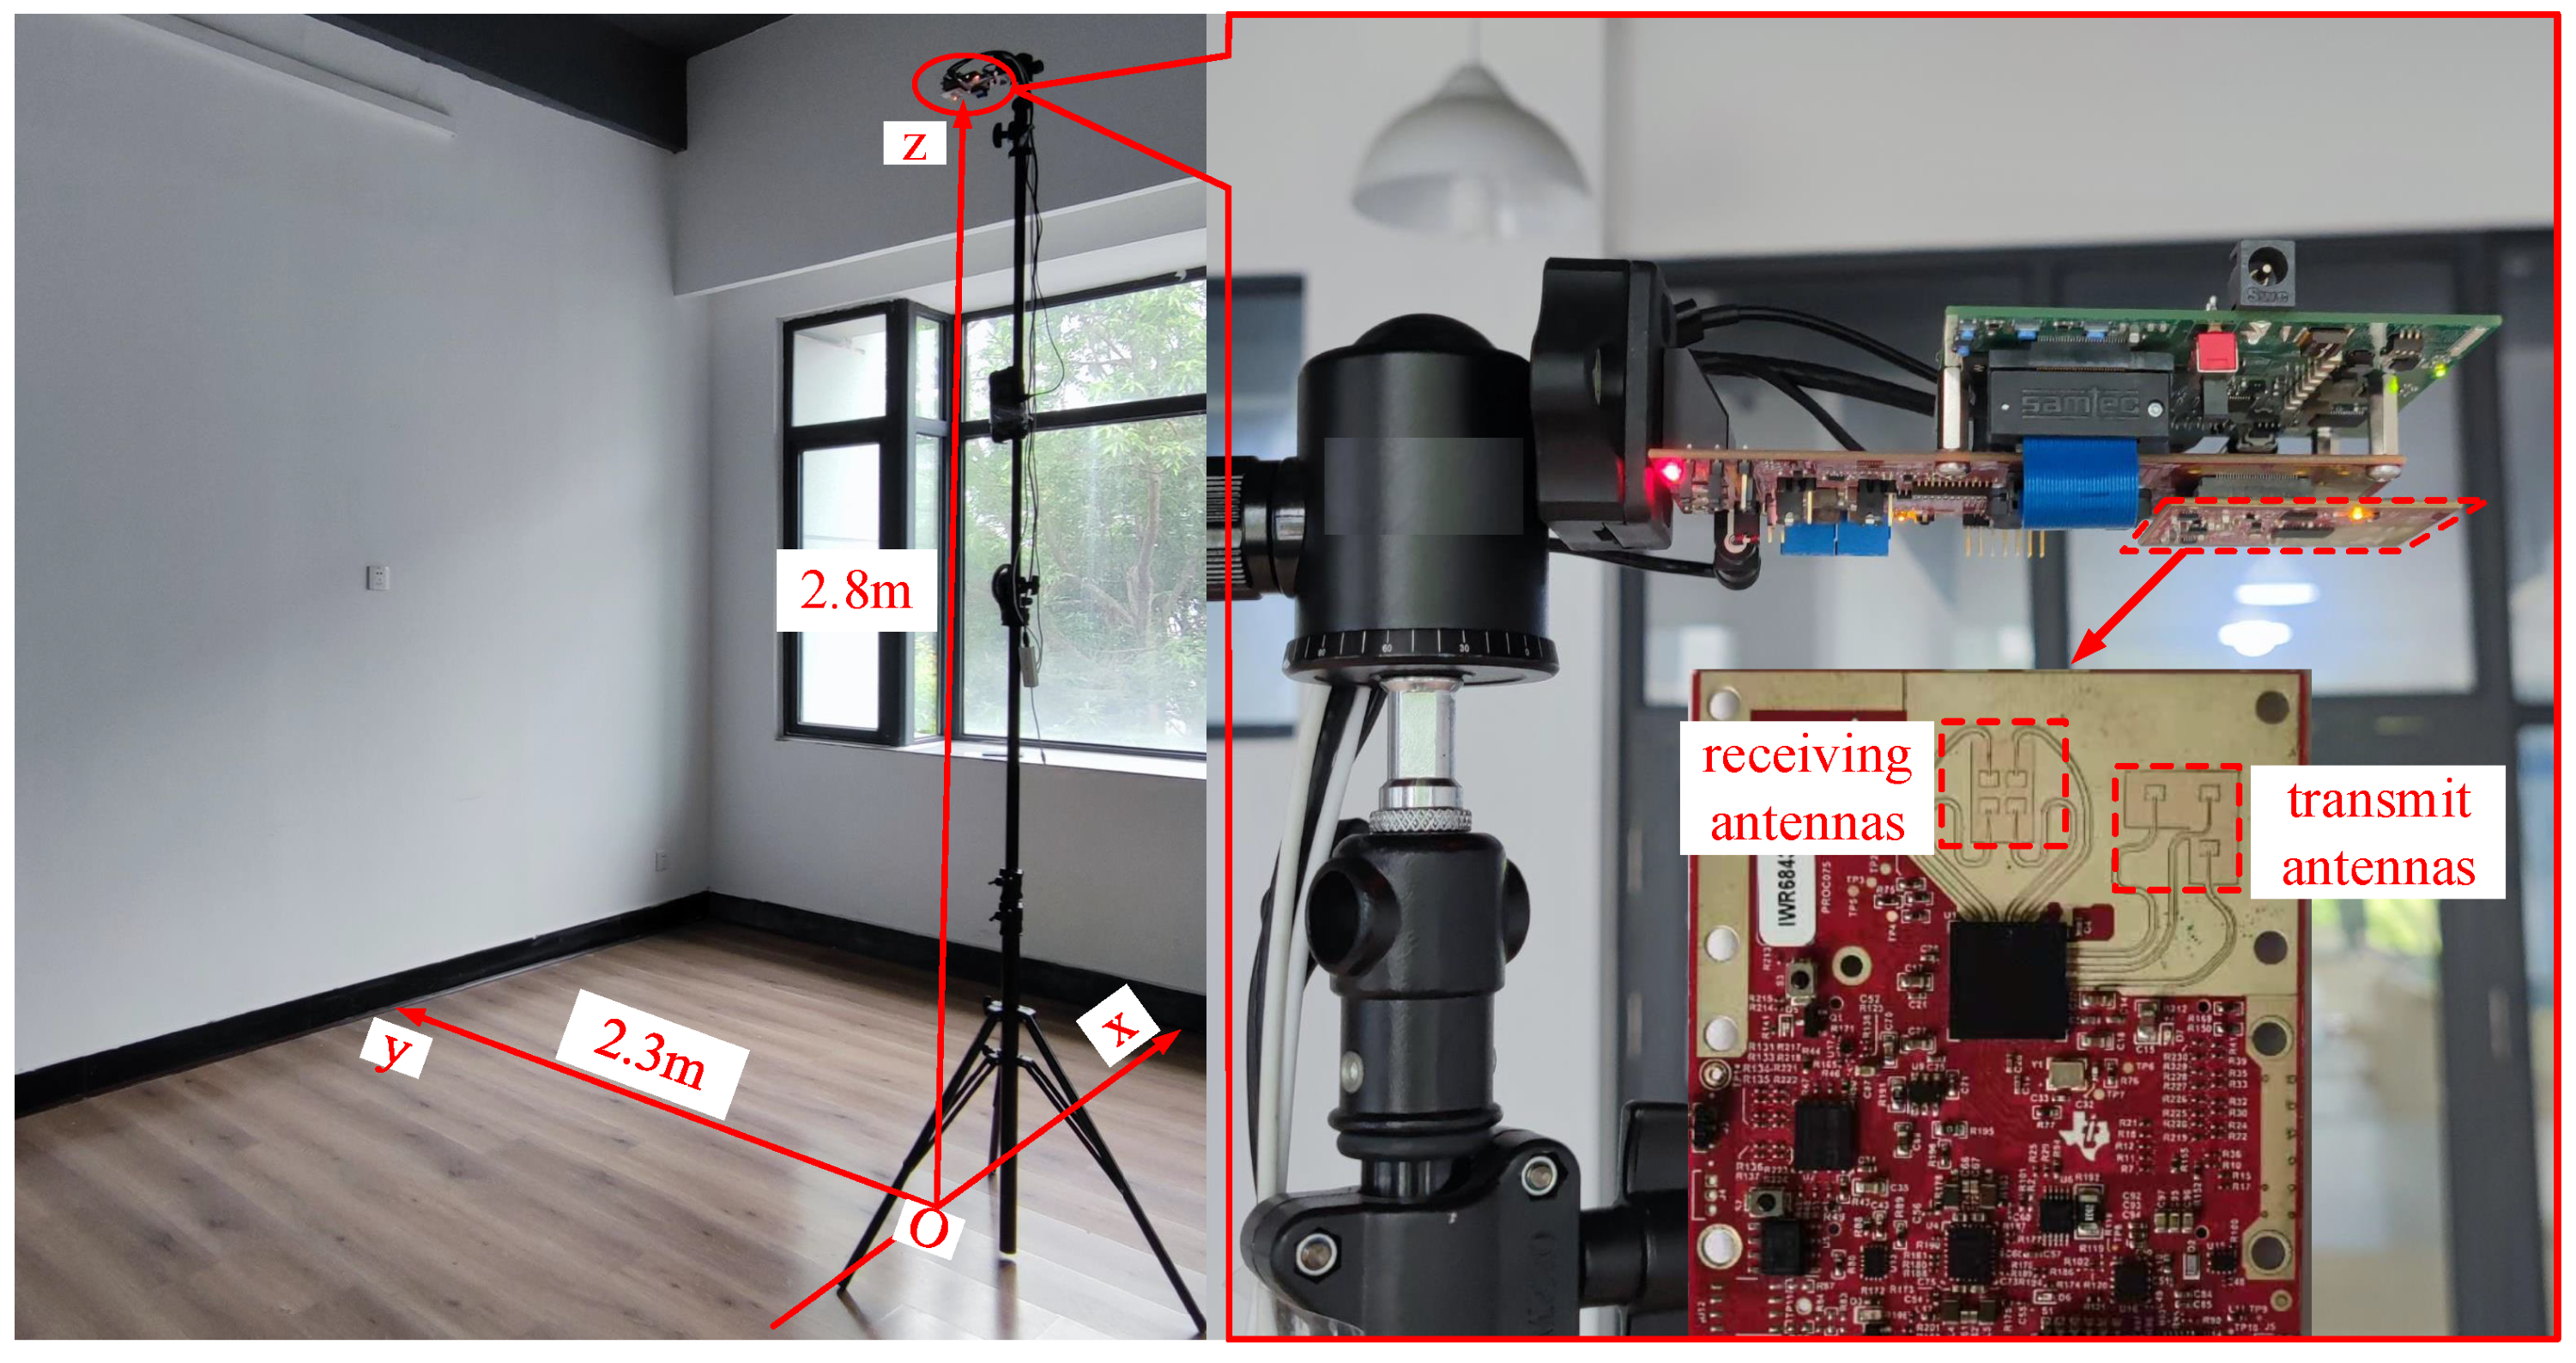
The experimental scenario is shown in Figure 4. The millimeter wave (MMW) radar used in the experiment is the TI IWR6843ISK-ODS. The radar has three transmitting antennas and four receiving antennas, which can transmit the linear frequency modulation signal with a frequency varying from 60 GHz to 64 GHz. The distance resolution of the signal we used is 4.3 cm, and the angle resolution is . Other important parameters are displayed in Table 2. Furthermore, the more detailed and specific information about IWR6843ISK-ODS is shown in [38].
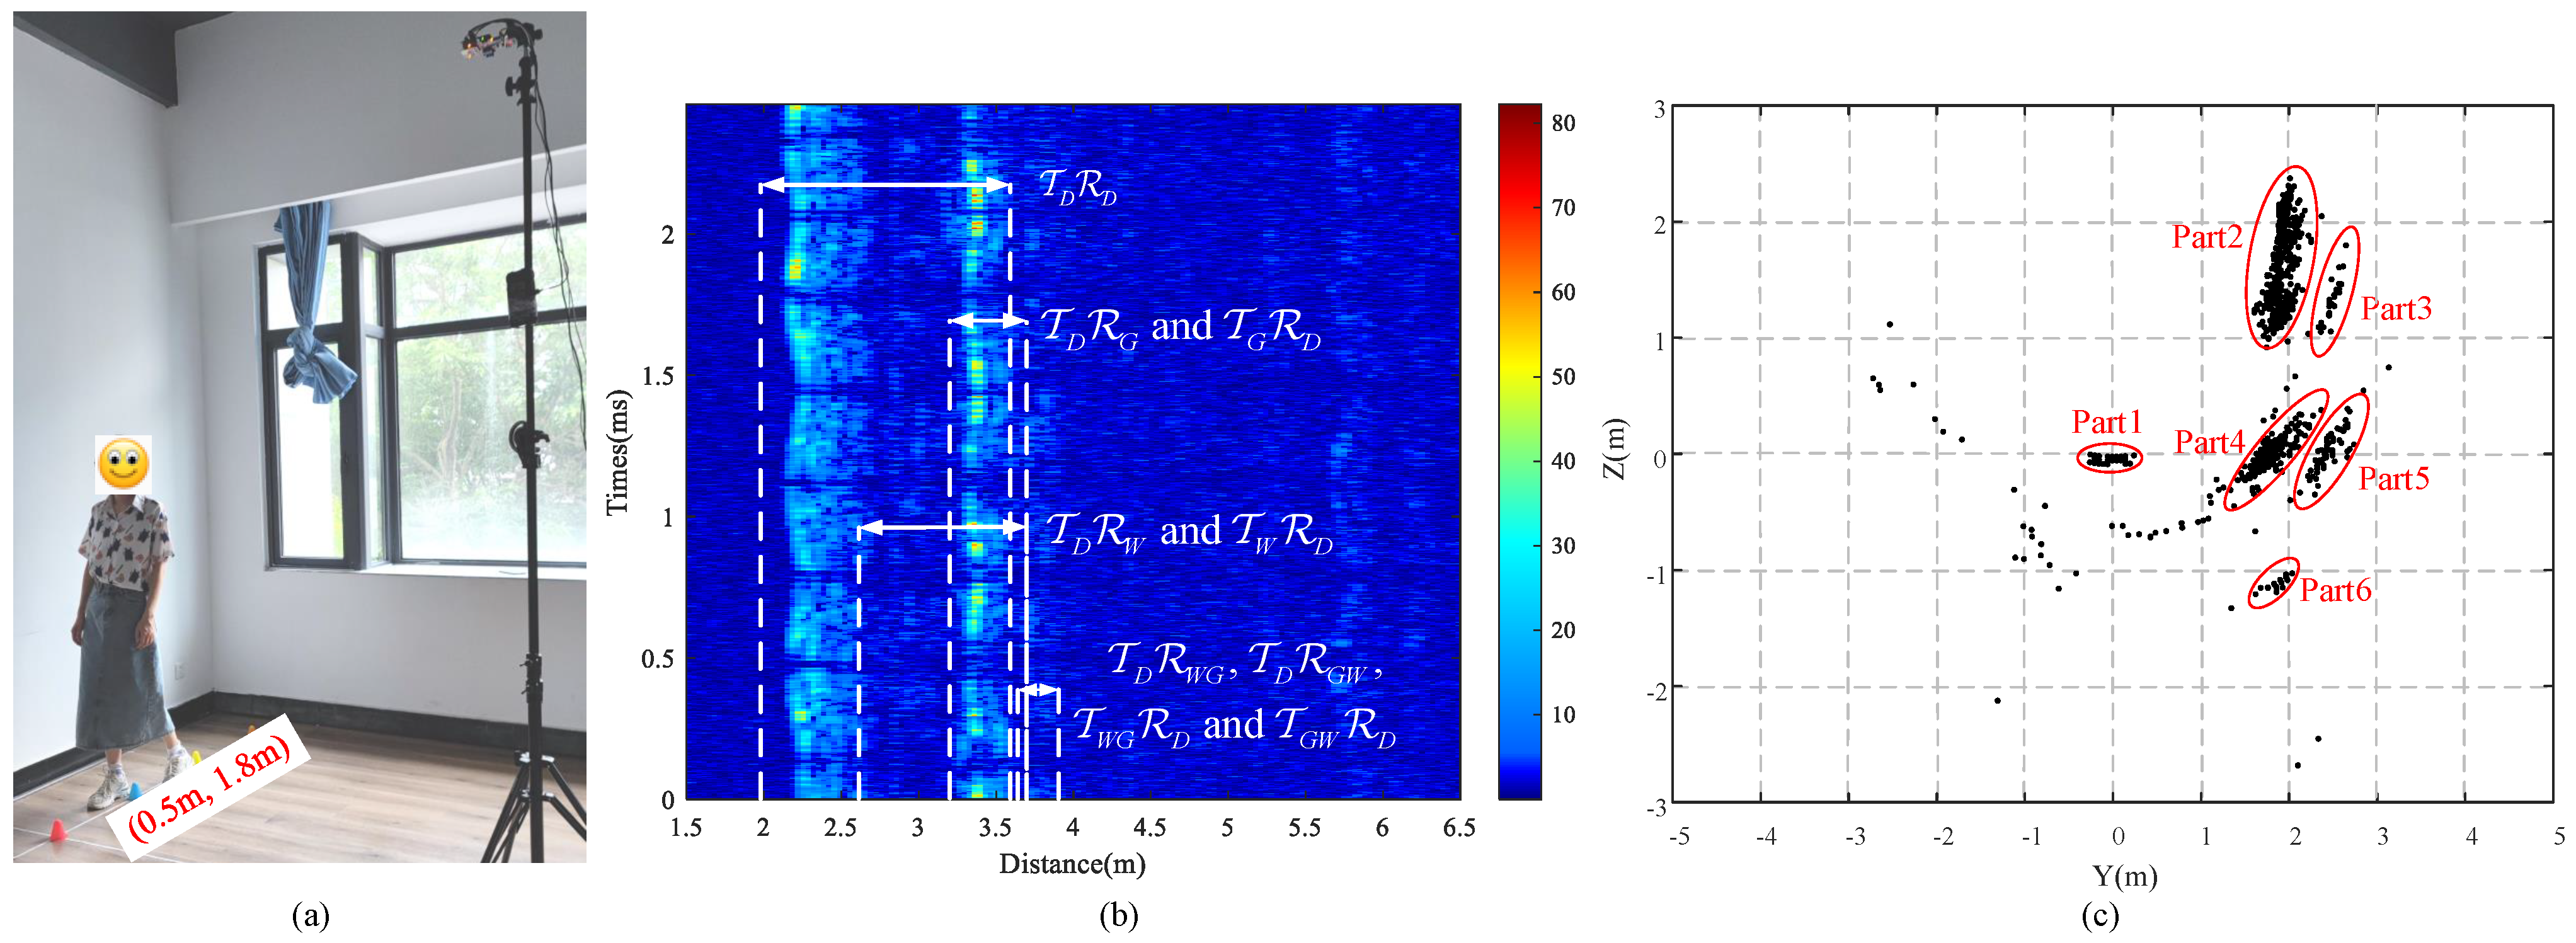
The data were collected at different positions near the wall during the experiment to verify the practicality of the established EM propagation model. First, we selected a typical position for detailed analysis. Herein, the position of the target was (0.5 m, 1.8 m), which is shown in Figure 5a, and the target was in a state of micro-motion during the data acquisition process. After processing fast time-dimensional FFT and MTI, we obtained the range profile depicted in Figure 5b. It is noted that, due to the swaying of the human body, the range profile shows undulating characteristics.
According to the EM propagation model established above, we calculated the distance of each propagation path and obtained the results shown in Figure 5b. Due to the human body being an extended target, the distance of each propagation path varies within a range. It can be seen from Figure 5b that the propagation distances of different propagation paths have the same range, so it is difficult to judge which path the signal travels through.
To further explore the origins of these signals, the point cloud generated algorithm mentioned above was used, and the result is shown in Figure 5c. We can see that there are six main clusters of point clouds in Figure 5c:
(1) Point Cloud Origin Analysis for Part 1: Since the values of the z and y coordinates of these points in Part 1 are close to 0 m, the points in this cluster are generated by the reflection of the ground, which are not canceled completely during preprocessing;
(2) Point Cloud Origin Analysis for Part 2: It can be seen from Figure 5c that the y coordinates of the points in this part are between 1.6 m and 2.2 m, i.e., they fluctuate near the actual y coordinate of the target. Furthermore, the distance ranges of these points from the radar are between 2.15 m and 2.65 m, which corresponds to the propagation distance of , so that the points in this part are generated by this path;
(3) Point Cloud Origin Analysis for Part 3: According to the calculation results, we know that the distances between Part 3 and the radar are between 2.89 m and 3.09 m, but their y coordinate values are larger than the actual y coordinate value of the target. Therefore, the points of Part 3 do not belong to . Further investigation reveals that the distances of EM waves propagated by paths and are both between 2.56 m and 3.6 m, which corresponds to the range of distances between these points and the radar. Therefore, there is a great possibility that the points in this part are generated by these two paths.
For further confirmation, we performed the following analysis. The mirror symmetrical point of point p with respect to the wall was located at , as shown in Section 2.1. Because the direction of arrival (DOA) of is the same as that of , the azimuth angle and elevation angle generated by are the same as . Let be the propagation distance of and and be the azimuth and elevation angles of , respectively. The height of the radar is H. Then, the elevation angle and azimuth angle of p and can be calculated as
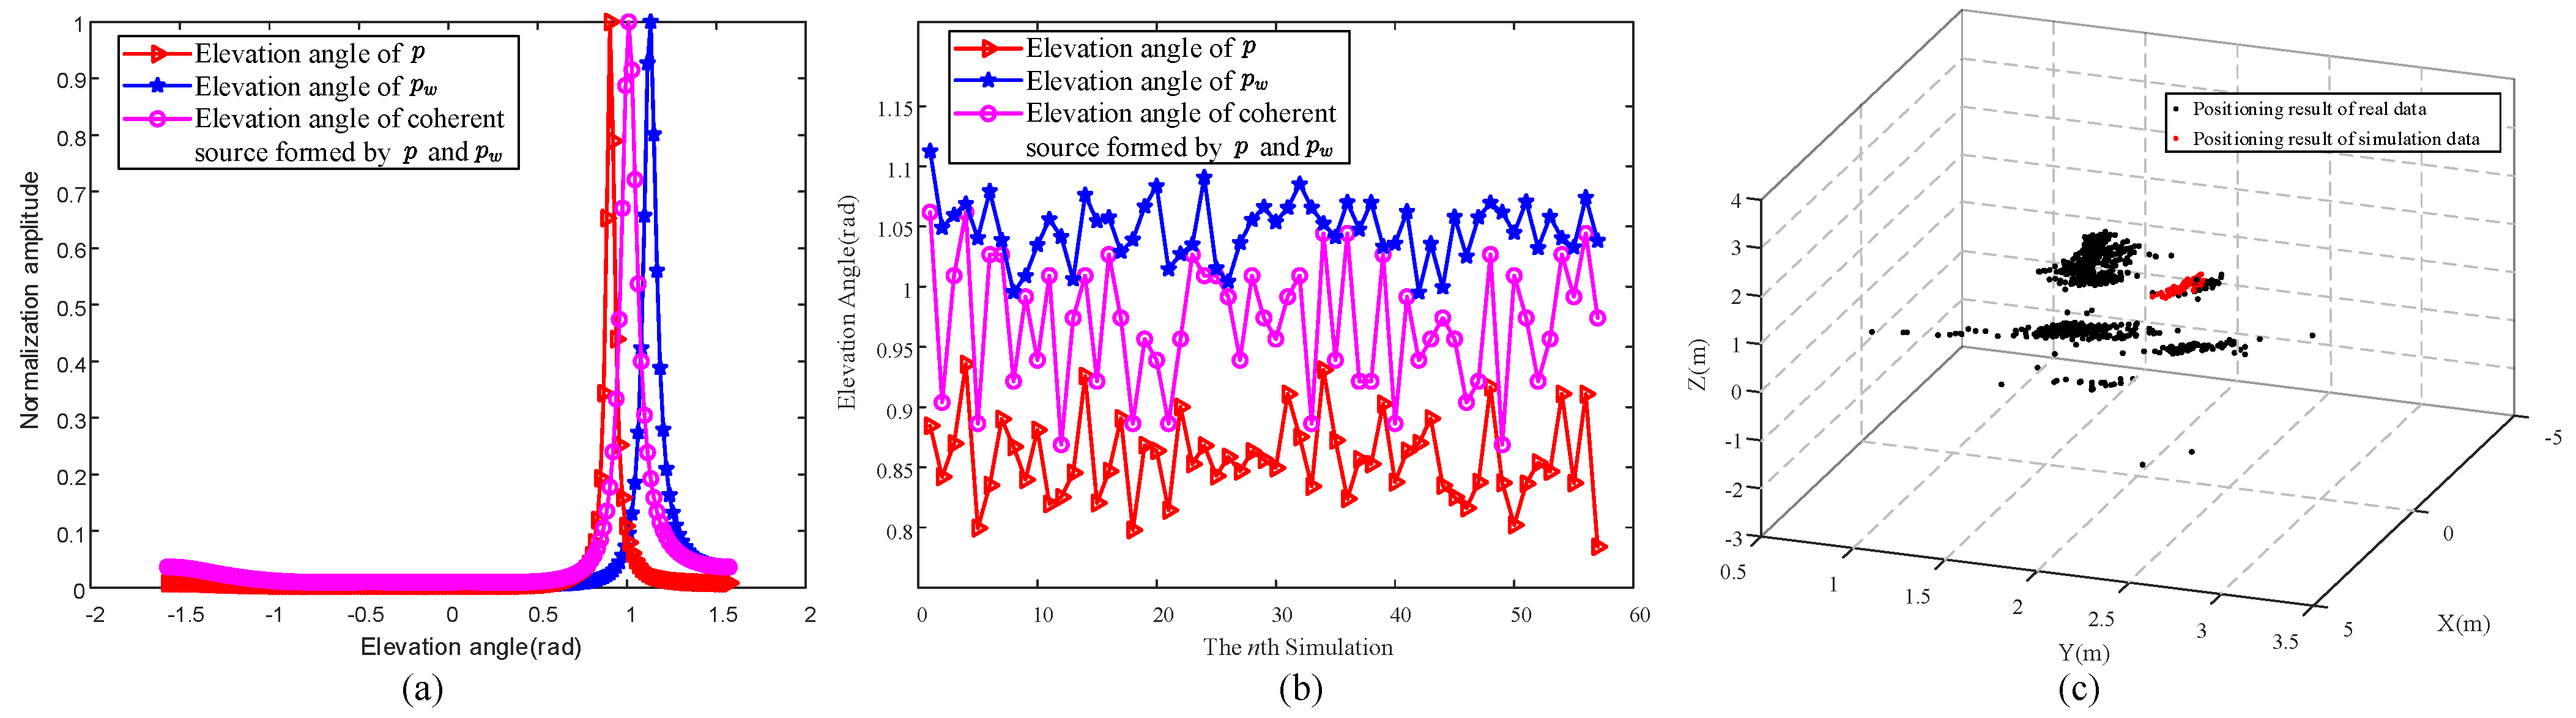
It should be noted that equals and equals . As a result, the two signals propagated by and form a coherent source, which results in the performance of the DOA algorithm being degraded [28]. In order to verify this assumption, some simulation experiments were performed, and the signal parameters in the simulation are consistent with those in Table 2. For each simulation, p, , and the coherent source signals formed by p and are added as signal sources. The spatial spectrum obtained from a simulation is shown in Figure 6a. We can see that the DOA of the coherent source is between the DOAs of and p. This shows that, when the two paths form a coherent source, it is difficult to obtain the DOAs of these two paths accurately.
In order to further prove the generality of the inference, several similar independent simulations are carried out in this paper. It is worth noting that, considering the fluctuation characteristics of the target’s radar cross section (RCS) in the actual environment, different attenuation coefficients were randomly added to the paths in different simulation experiments. The simulation results are shown in Figure 6b. It can be seen that, when the elevation angles of these two paths are close, the estimated DOA fluctuates in a range due to the characteristics of coherent sources and the different energy attenuation coefficients of different paths.
According to propagation paths and geometric relationship among the target, wall, and radar, the positions of points generated by the coherent source formed by paths and can be determined, which are shown as the red points in Figure 6c. Herein, the black points are the positioning results of the data shown in Figure 5. We can see that there are some black points distributed around these red points. Furthermore, to prove that the point cloud generated by simulation matches the point cloud obtained from measured data, we calculated the distance between the center of the red point cloud in Figure 6c and the corresponding point cloud center in Part 3, which is 10.43 cm. Considering that the human target is composed of multiple scattering points with a certain width and height, this result is within an acceptable range. This means that these points in Part 3 are generated by and ;
(4) Point Cloud Origin Analysis for Part 4 and Part 6: Assuming that the EM wave propagates along , the point cloud generated by it will appear in the mirror-symmetrical position of the target with respect to the ground. It can be seen from the point cloud of Part 4 in Figure 5c that these points in this cluster are located below the ground, whose y coordinates are around 1.8 m, which is close to the actual position of the target. Therefore, it is reasonable to think that the point cloud in Part 6 shown in Figure 5c is generated by the combination path of .
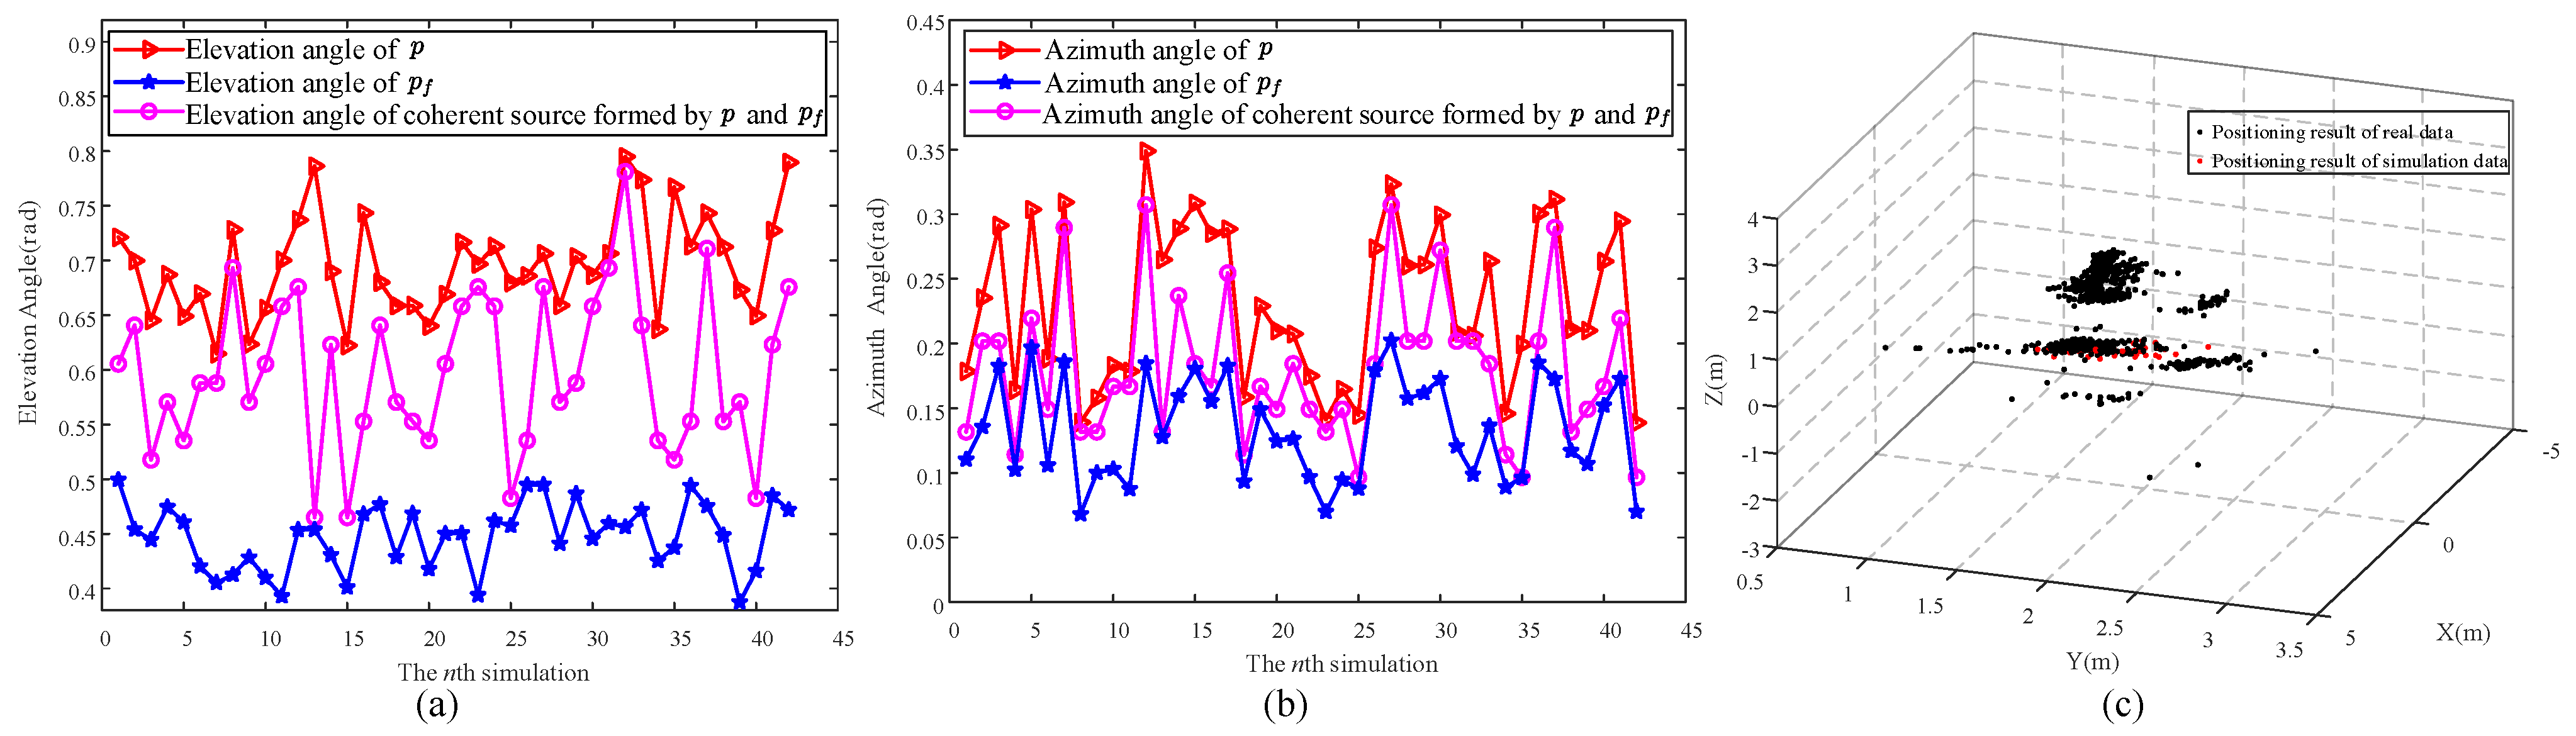
Next, the combination path of and is considered. When the EM wave propagates along , its DOA is the same as . Let the azimuth angle and elevation angle of be and , respectively, and the propagation distance of be . Then, and can be calculated by
Similarly, when the EM wave propagates along , its DOA is the same as , and its elevation angle and azimuth angle can be calculated using Equations (19a), (19b) and (19c).
Since the propagation distances of and are the same, these two paths form a coherent source, resulting in the performance degradation of the angle estimation algorithm. Following a similar idea to Figure 6c, we designed a simulation to verify it. In this simulation, there were two targets, and the distances between these two targets and the radar were the same, but with different azimuth and elevation angles. The DOA simulation results are depicted in Figure 7a,b. We can see that the azimuth angle and elevation angle of the coherent source are both between the azimuth angles and elevation angles of these two paths. This shows that the signals of and will form a coherent source.
The DOA of the coherent source is used to generate its corresponding spatial position, which is shown as the red points in Figure 7c. The black points shown in Figure 7c are the actual positioning results. It is worth mentioning that there are many black points located near these red points. Similar to the analysis of Part 3’s point cloud, we calculated the distance between the center of Part 6 and the center of red point cloud in Figure 7c center, and it is 10.61 cm. The distance is acceptable, which indicates that these black points are actually caused by the related sources formed by and .
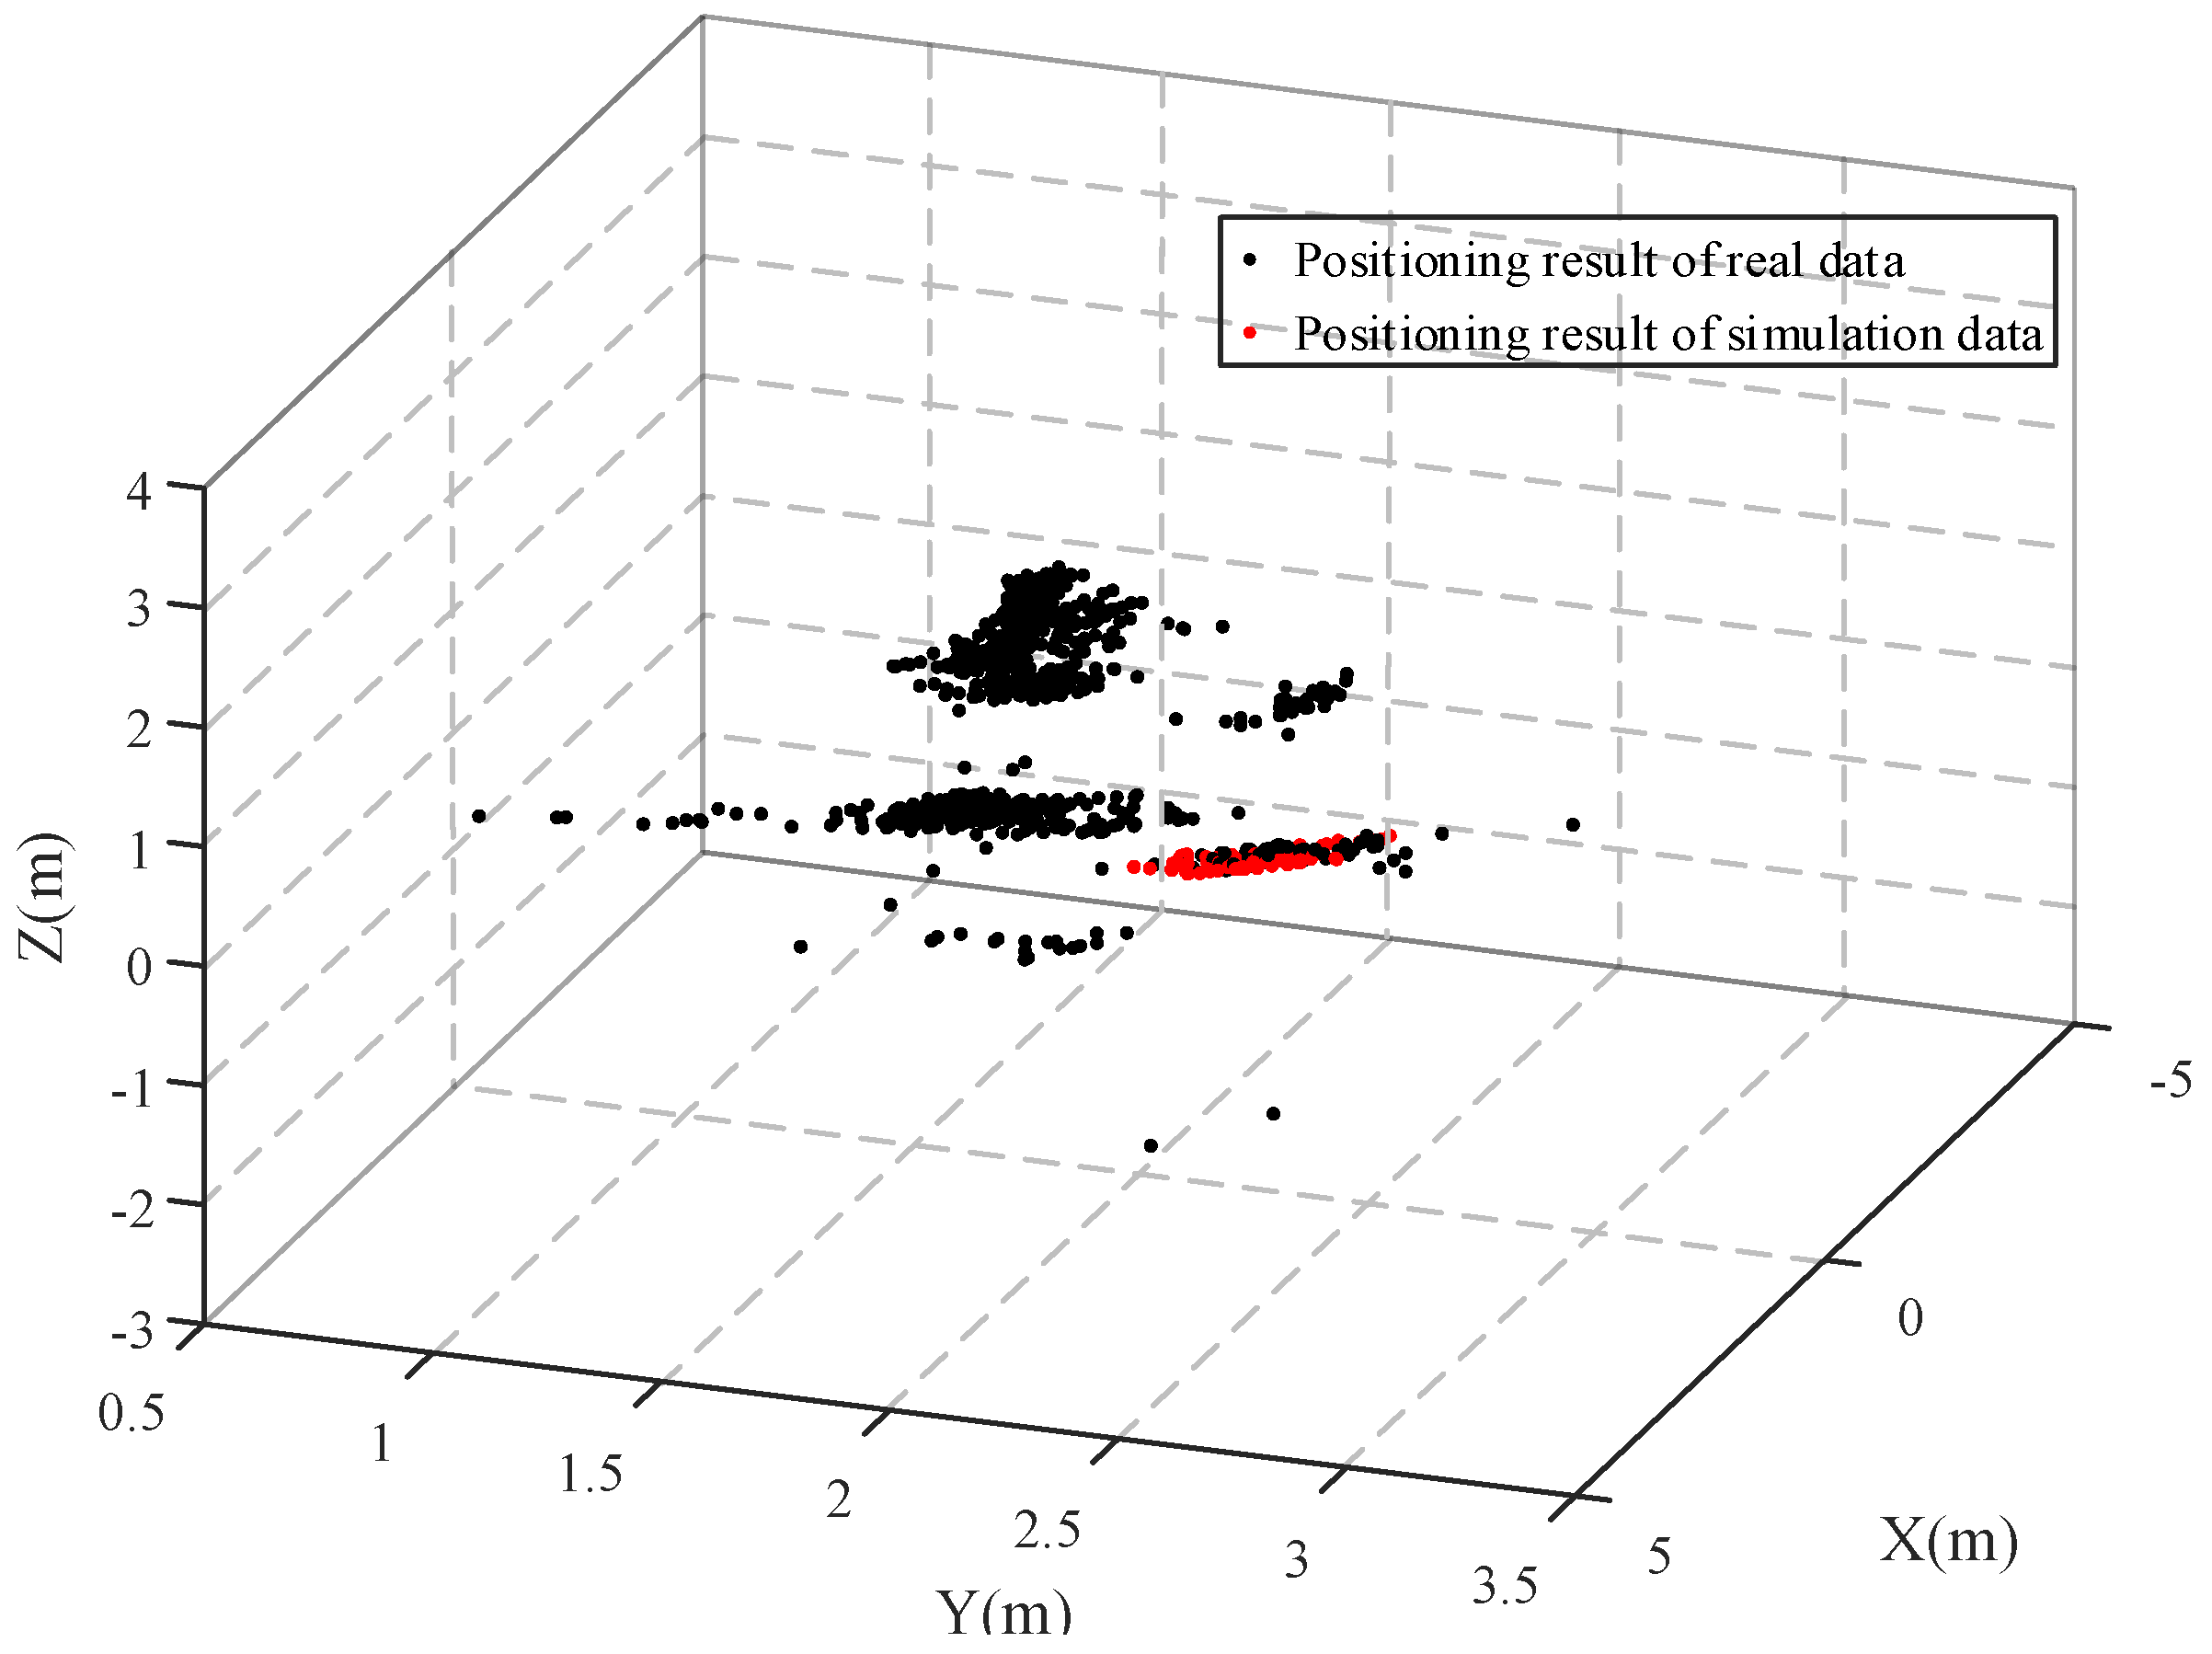
(5) Point Cloud Origin Analysis for Part 5: We find that the distances between the points of this part and the radar are between 3.69 m and 3.93 m. Considering the serious energy attenuation caused by multiple reflections, the combination paths of low-order reflections that conform to this distance range are prioritized. It is found that the propagation distances of , , , and are between 3.56 m and 3.7 m, so we give priority to the combination path of these four paths.
When the target is close to the wall, the target, ground, and wall form a structure similar to a corner reflector. Therefore, the composite reflection of the wall and the ground should be noted. From the analysis in Section 2.1, it can be seen that the propagation distances of , , , and are the same, and the DOAs of these four paths are proximate, so the propagation time delays of EM waves through these four paths are the same. These four paths form a coherent source, which leads to the performance degradation of the angle estimation algorithm. In order to verify this assumption, a similar simulation to that in Figure 7c is performed. The simulation results are displayed in Figure 8. Therein, the black points are the measured results, and the red points are the simulation results. It can be seen that there are some black points near these red points whose center is situated 9.87 cm away from the center of these black points. This demonstrates the plausibility of the propagation path assumption that is suggested.
3.2. Analysis of Data for Different Locations
This section tests the validation of the EM propagation model when the target is located at different locations. Due to the fact that the difference in distance between the target and the wall will lead to different signal components in the echo, this paper mainly considers three scenarios when the distances between the target and the wall are 0.5 m, 1 m, and 1.5 m. The signal components in the echoes for these three scenarios are analyzed in detail below.
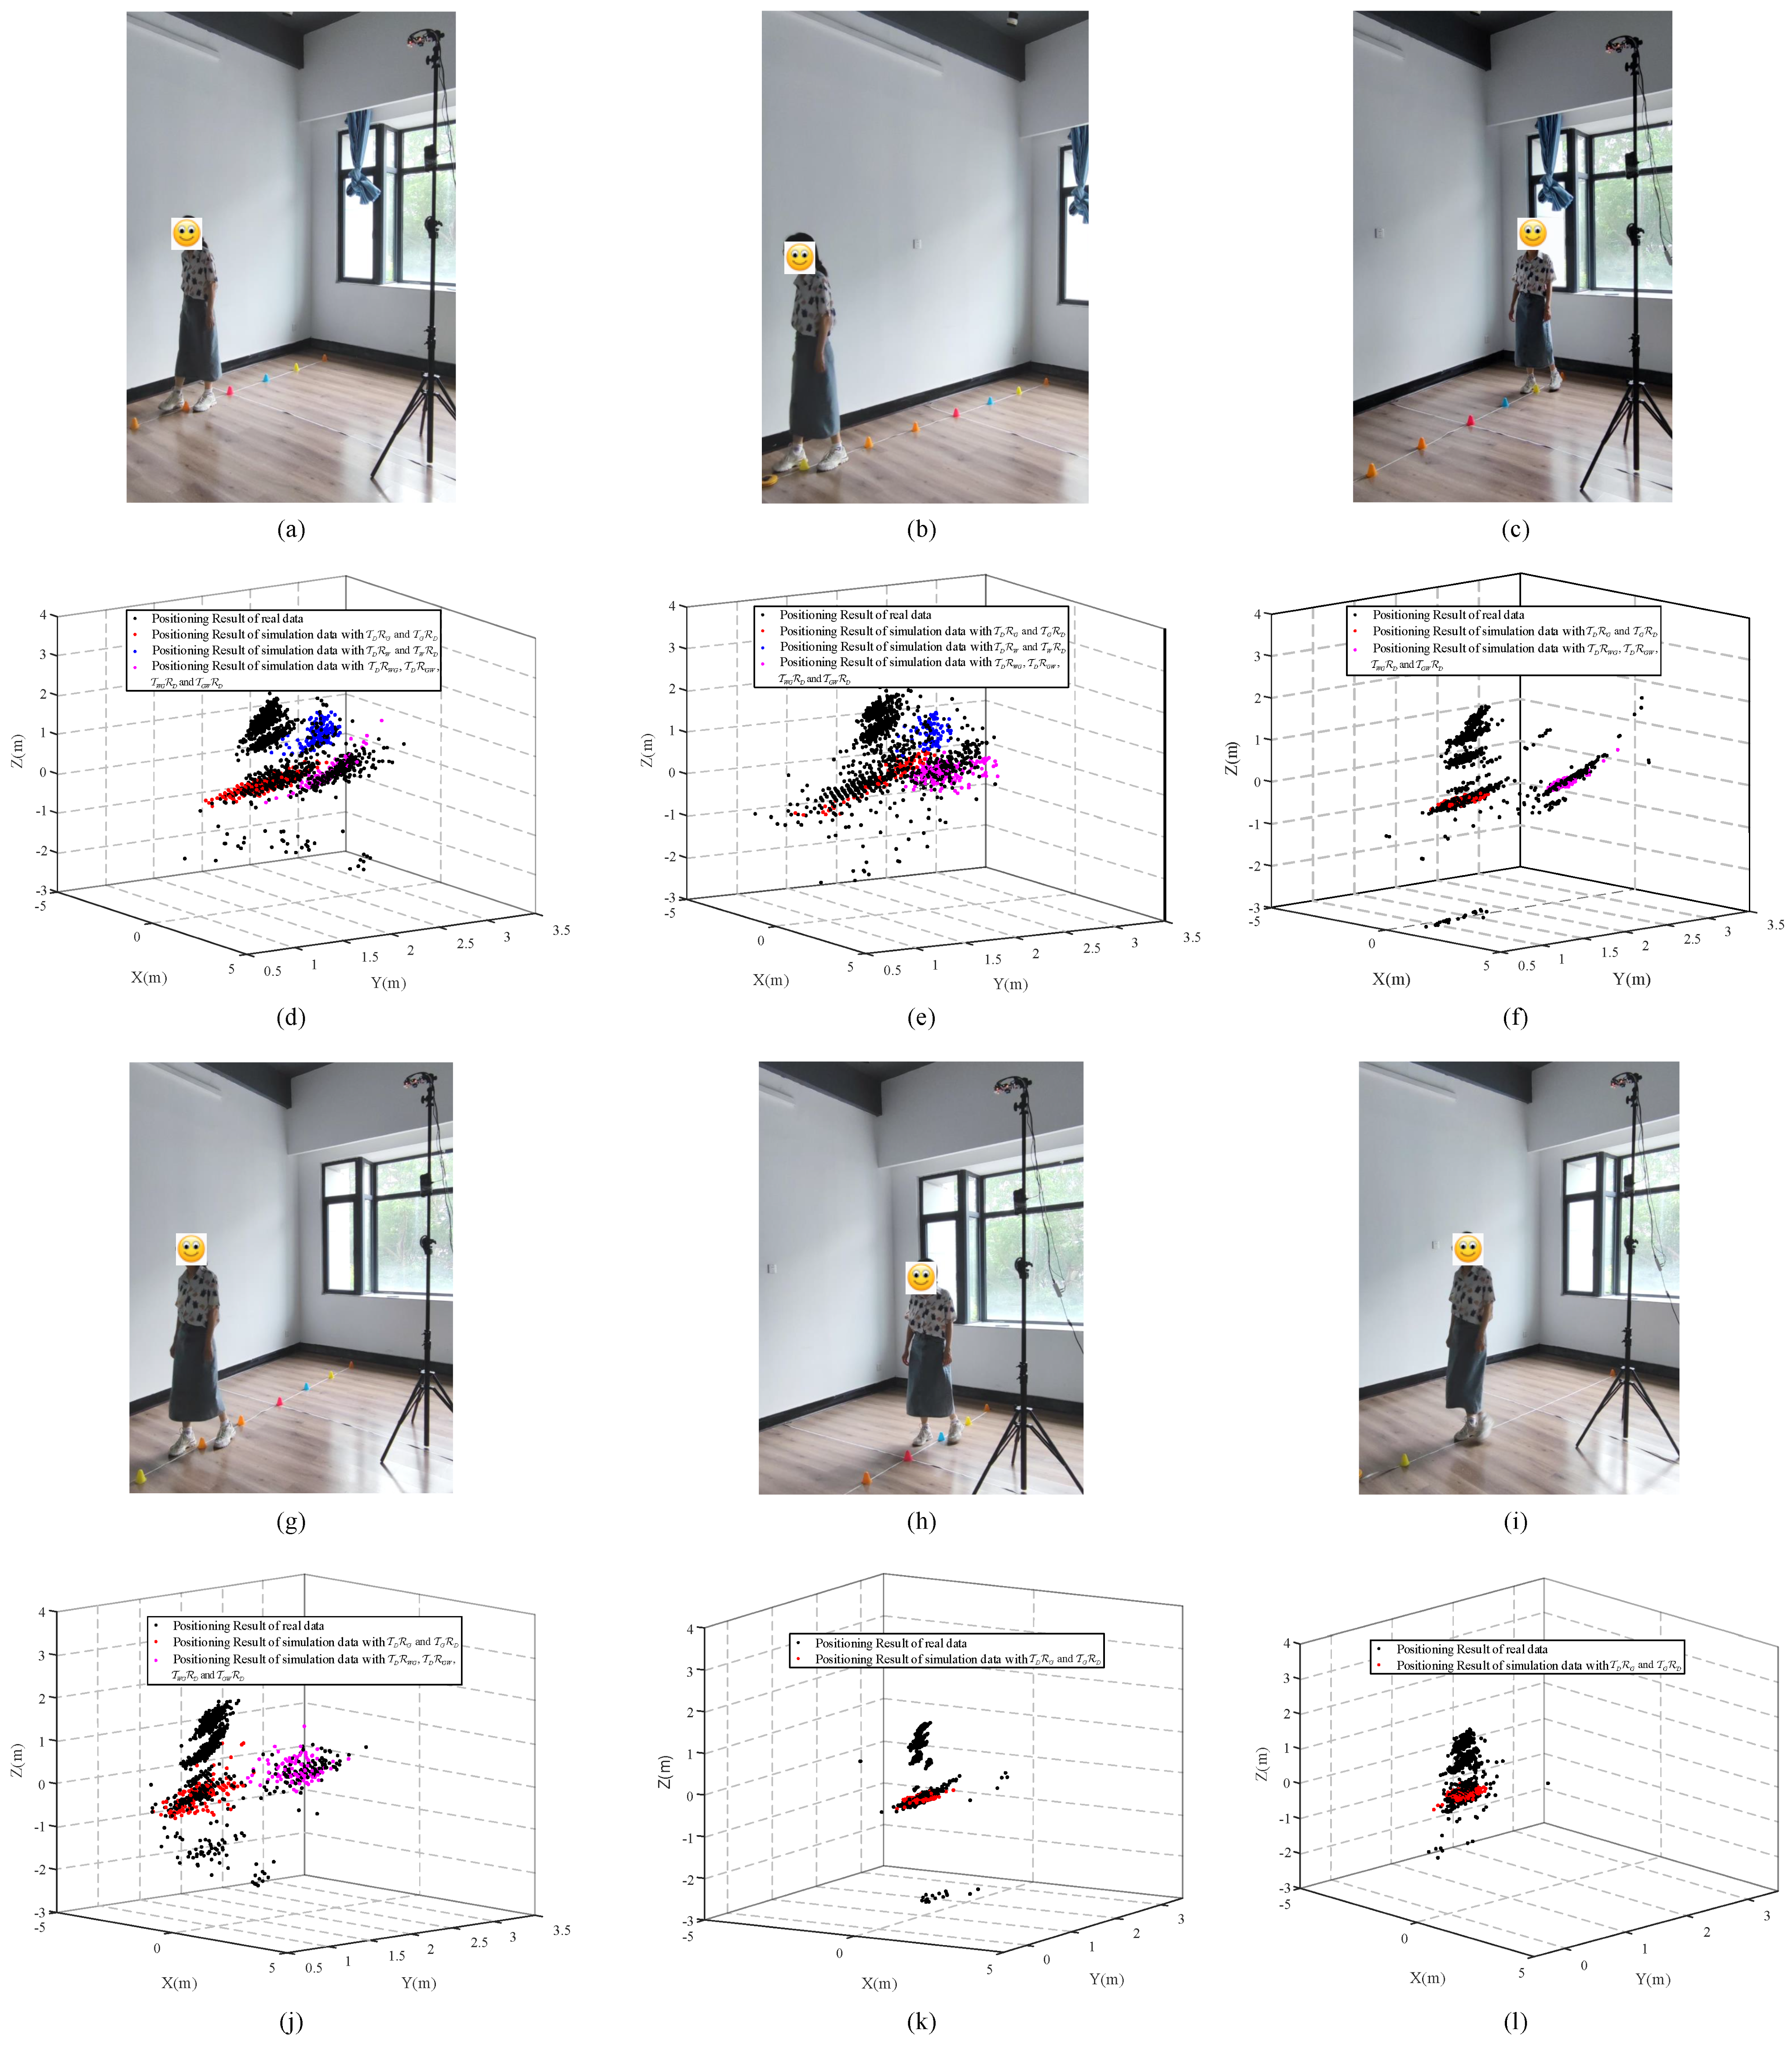
Case 1: In the two experiments depicted in Figure 9a,b, the distance between the target and the wall is 0.5 m, and the target’s coordinates are (−0.5 m, 1.8 m) and (−1.5 m, 1.8 m). The positioning results of these two experiments are shown in Figure 9d,e. Herein, the black points are the positioning results. Meanwhile, the red points are the positions of the ghost targets caused by paths and . And the blue points denote the positions of the ghost targets caused by paths and . The magenta points are the positions of the ghost targets caused by the wall and ground reflections generated by , , , and . We can see that there are many black points around the red, blue, and magenta points, which means that the EM propagation model established in Section 2.1 is applicable in these two cases displayed in Figure 9a,b;
Case 2: When the target changes position to (1 m, 1.3 m) and (−1 m, 1.3 m), the corresponding distances between the target and the wall are larger than that at (−0.5 m, 1.8 m) and (−1.5 m, 1.8 m). From (19b), we can find that, with the distance between the target and wall increasing, the of the target increases. Meanwhile, with the propagation distance increasing, the propagation attenuation increases. Therefore, when the target is located at (0.5 m, 1.3 m) and (−1 m, 1.3 m), the ghost target caused by the reflection of the wall is hardly observed. Similarly, the attenuation of EM waves propagating through the paths of , , , and will also increase, resulting in a reduction in the number of point clouds generated by these paths. As a result, there are a few black points surrounding the magenta points in Figure 9f,j. Furthermore, because the paths of and are only related to the ground, the relative position between the target and the ground has not changed with the changing of the target position. Thus, that the number of ghost point clouds generated by the ground does not change too much;
Case 3: When the distance between the target and the wall changed from 1 m to 1.5 m, as shown in Figure 9h,j, the positioning results were as displayed in Figure 9k,l. At this time, due to the EM waves’ propagation distances reflected by the wall being longer than the four previous cases, the energy of the EM wave is further attenuated, so it is difficult to see the ghost point cloud generated by , , , and . However, since the relative position between the target and the ground does not change, there are still ghost points generated by the two combination propagation paths of and .
To make the above analysis more convincing, we calculated the center distance difference (CDD) between the colored points and the corresponding black point cloud in Figure 9. The statistical results are shown in Table 3. In this table, type-1 represents the ghost point cloud generated by and , type-2 indicates the ghost point cloud generated by and , and type-3 means the ghost point cloud generated by , , , and . When the target is far from the wall, since the echo produced by the wall deteriorates with distance, the point cloud relating to the wall is excluded from the positioning results. Therefore, we did not calculate the CDD in these situations. From Table 3, we can see that the maximum CDD does not exceed 15 cm, which indicates that the above analysis is reliable.
4. Method of Suppressing Multipath Ghost Targets for an Overhead Perspective
In this section, we introduce a method to suppress the multipath ghost from an overhead perspective with a small-aperture MMW radar. Then, several sets of experimental data are used to verify the proposed multipath suppression method.
Based on the analysis mentioned above, the multipath signal generated by the moving target is closely related to the indoor environment, so it is necessary to estimate the location of the wall and the ground separately. We use the method mentioned in [39] to measure the position of the wall and floor.
4.1. Multipath Ghost Suppression Method
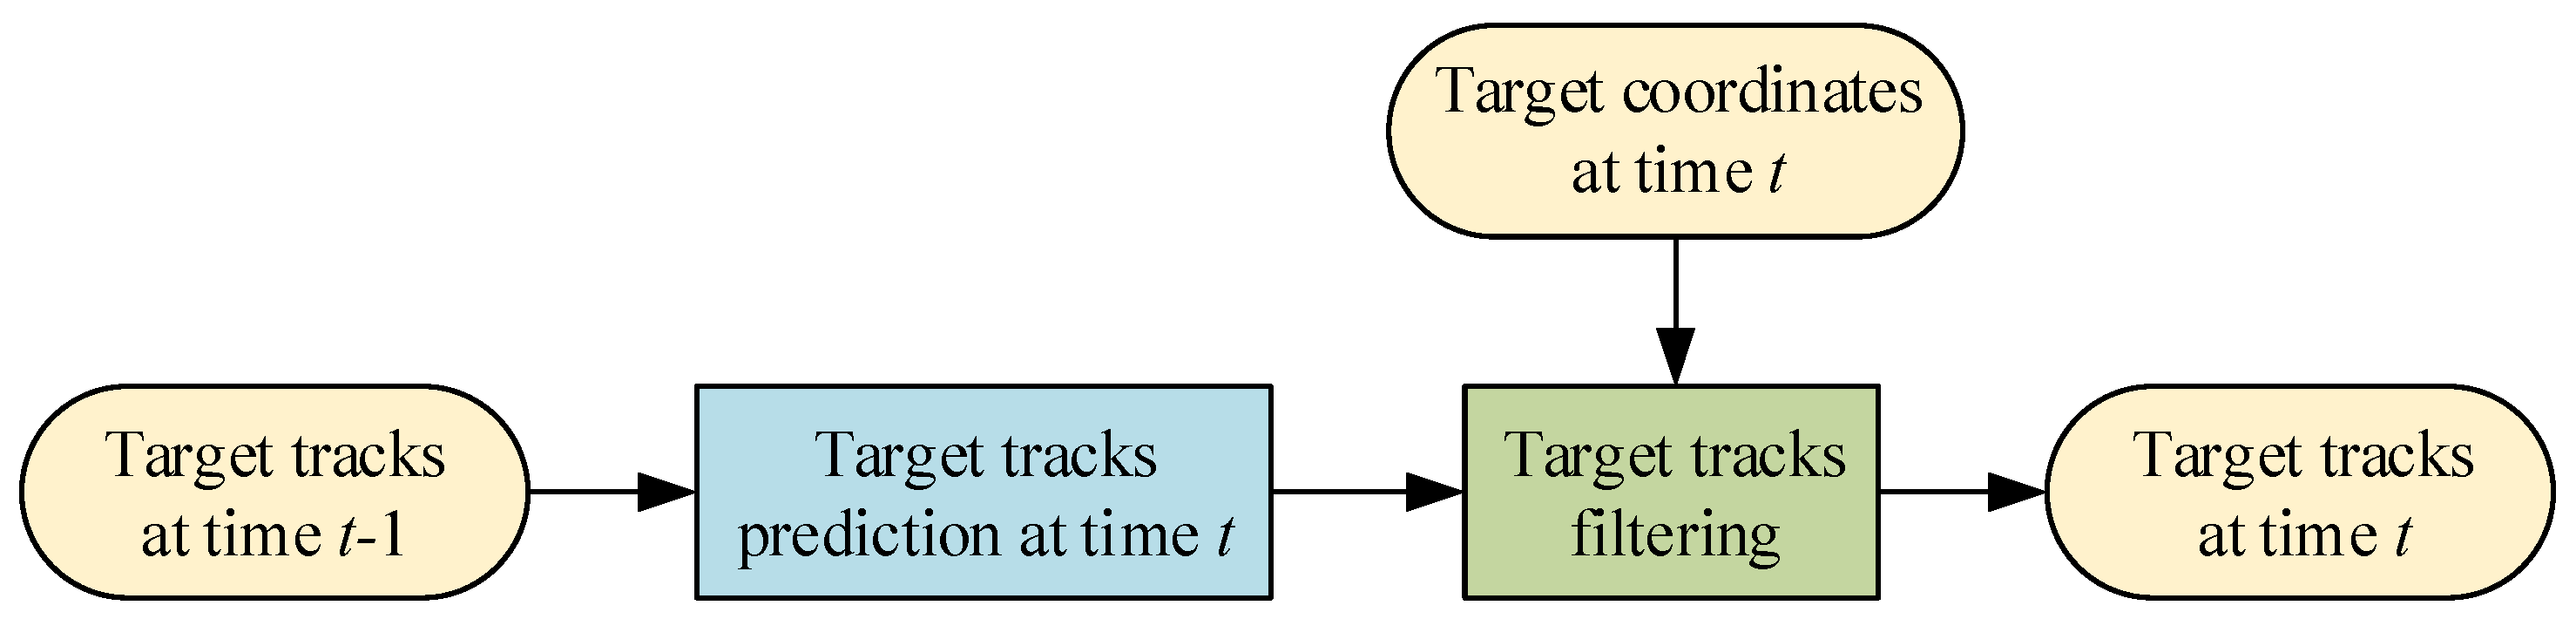
(1) Group Target Tracking: Due to the fact that the RCS of the human target fluctuates during movement, the number and location of measurement points obtained are different at different times, which means that targets are extended [40]. In addition, the influence of noise in the environment results in several false points in the location results. In order to achieve stable detection, we use the group target tracking method to filter the positioning results in this paper, and the workflow of tracking is shown in Figure 10.
The space coordinates of the targets at time t are obtained using Equation (18). It is worth noting that we can only obtain the spatial coordinates of the targets at the initial time () without the tracks of the targets at the previous time. Currently, the density-based spatial clustering of applications with noise (DBSCAN) [5] algorithm is used to cluster the spatial coordinates. The clustering results are taken as the initialization results of the candidate tracks.
Based on the initialization results, the prediction result of the jth candidate track at time t can be obtained via a classical Kalman filter [41], which can be expressed by
where is the state vector, which can be expressed as
is the state of the jth candidate track at time , and is the prediction result at time t based on the state at time . If the target motion is approximated to uniform linear motion in a short period of time, the state transition matrix is expressed as
After obtaining the , we need to associate it with the positioning result . Compared with point target tracking, extended target tracking involves associating one track with multiple positioning results, rather than one track with one positioning result. Moreover, the measurement quantity and shape of the extended target are uncertain. In order to measure the amount of uncertainty, N. Wahlstrom and E. Ozkan [42] defined the group residual covariance matrix , which can be expressed as
where is the observation matrix, denotes the predicted estimates of the state vector covariance matrix at time t, and represents the measurement covariance matrix. Therefore, the statistics of the residual vector can be calculated by
Next, we compare with a threshold , assign the corresponding measurement results below in to the current track, and store the results in a matrix .
Based on the associated results, the filtering result of the jth candidate track at time t can be obtained by
where denotes the Kalman gain matrix and is the mean of .
It is worth noting that, if the candidate track can be successfully associated with the positioning results in consecutive frames, the track will be judged as the true track. Similarly, if the continuous frames of the real track are not associated with the measurement, it is judged that the track is dead.
We stack the true tracks in a matrix with three rows and columns at the time t, . Herein, is the number of tracks after tracking. Rows 1 to 3 represent the x, y, and z coordinate values of different candidate tracks, respectively;
(2) Multipath Ghost Suppression: After target tracking, the short tracks generated by noise or clutter in the environment have been eliminated, and the remaining tracks are generated by target motion and multipath propagation. Therefore, the ghost track generated by multipath propagation is suppressed in this part.
Because the propagation distances of the EM waves reflected by the multipaths are longer than that of the EM wave directly reflected from the target, the track which is closest to the radar among the candidate targets can be determined as the track of the real target. Suppose that, among the candidate tracks, the ith candidate track is closest to the radar; then, the dictionary of the ghost targets corresponding to the ith candidate track is calculated based on the multipaths mentioned in Section 3. has three rows and columns, where each column represents a possible ghost target formed by the multipaths, and the first row to the third row corresponds to the x, y, and z coordinate values of the ghost targets, respectively. Then, the distances between and can be calculated by
If there is an element in that is less than the preset distance threshold , the jth candidate target is a ghost target, so it is deleted. Herein, g is a natural number between 1 and . The detailed suppression process is shown in Algorithm 1.
| Algorithm 1: Multipath ghost target suppression algorithm |
 |
4.2. Experimental Verification
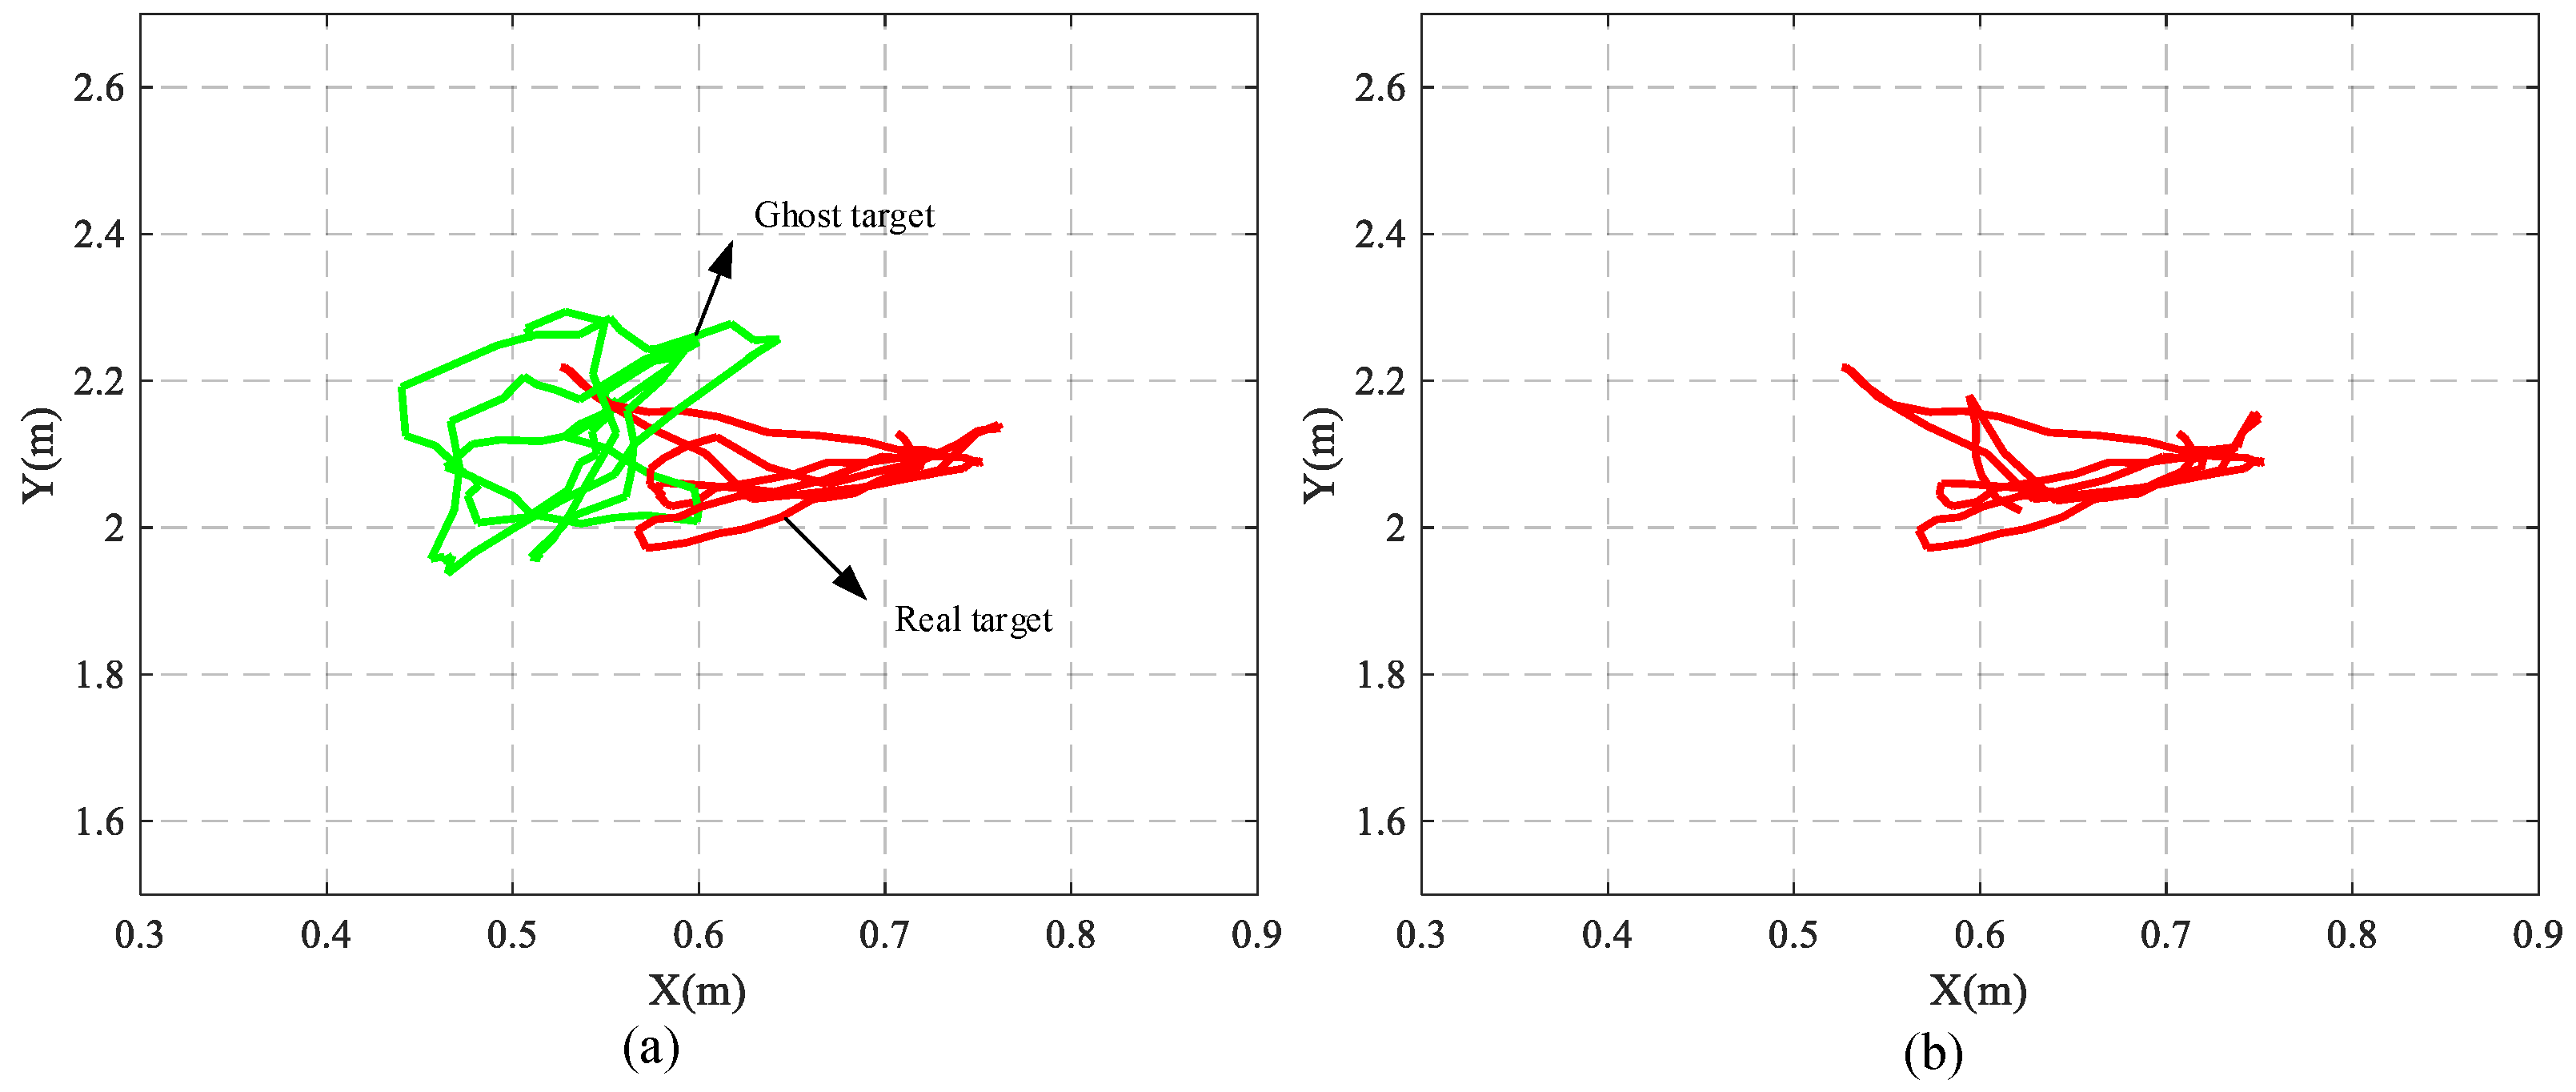
By using the processing steps above, multipath ghost target suppression was performed on the data shown in Figure 5, and the processing results shown in Figure 11 were obtained. From Figure 11a, we can see that there are two candidate targets in the result without using the suppression method. It is hard to distinguish which one is the true target. Benefiting from the proposed method, there is only one target which can be seen in Figure 11b, which means that the proposed method is effective.
In order to verify the applicability of the proposed method, the same processing was performed for the data at six different positions, as shown in Figure 9. The estimated target number within 100 frames of each position was counted, and the results are shown in Table 4. Notably, the first and fifth rows in Table 4 represent the coordinates of different positions. The second and sixth rows are the numbers of targets in each frame. Meanwhile, the third and seventh rows represent the percentage of frames with different target numbers in total frames before multipath ghost suppression. Similarly, the fourth and eighth rows denote the percentage of frames with different target numbers in total frames after multipath ghost suppression.
From the third and seventh rows of Table 4, we can see that the number of candidate targets always exceeds the actual number due to the existence of multipath ghosts. Nevertheless, after using the proposed method, the number of ghost targets is greatly suppressed, which can be seen in the fourth and eighth rows of Table 4. That is to say, the proposed method is effective.
5. Conclusions
This paper established the indoor EM wave propagation model for an overhead perspective, and an effective multipath ghost target suppression method was proposed. In summary, we established the model of EM propagation for an indoor overhead perspective and introduced the target location method in detail. Then, through the analysis of the measured data, the correctness of the established model was verified. In the process of analyzing the measured data, the influence of coherent sources formed by different propagation paths on DOA estimation was fully considered. Finally, using the established EM propagation model, an effective multipath ghost target suppression method was proposed, and experiments verified the effectiveness of this method.
Author Contributions
Conceptualization, H.L., G.C. and S.G.; methodology, H.L.; software, W.Z. and Z.R.; validation, H.L. and S.G.; formal analysis, H.L. and S.G.; investigation, H.L.; resources, W.Z. and Z.R.; data curation, Y.O. and C.T.; writing—original draft preparation, H.L.; writing—review and editing, S.G. and G.C.; visualization, H.L.; supervision, G.C. All authors have read and agreed to the published version of the manuscript.
Funding
This work was supported in part by the National Natural Science Foundation of China under Grant 62001091, in part by the Municipal Government of Quzhou under Grants No. 2022D008 and No. 2022D005, in part by the 111 Project under Grant B17008, and in part by the Guangdong Key Areas Research and Development Program under Project 2020B090905002.
Data Availability Statement
Not applicable.
Conflicts of Interest
The authors declare no conflict of interest.
References
- Xia, Z.; Luomei, Y.; Zhou, C.; Xu, F. Multidimensional feature representation and learning for robust hand-gesture recognition on commercial millimeter-wave radar. IEEE Trans. Geosci. Remote Sens. 2020, 59, 4749–4764. [Google Scholar] [CrossRef]
- Zhang, W.; Li, G.; Wang, Z.; Wu, H. Non-contact monitoring of human heartbeat signals using mm-wave frequency-modulated continuous-wave radar under low signal-to-noise ratio conditions. IET Radar Sonar Navig. 2020, 16, 456–469. [Google Scholar] [CrossRef]
- Wang, B.; Guo, L.; Zhang, H.; Guo, Y.X. A millimeter-Wave radar-based fall detection method using line kernel convolutional neural network. IEEE Sens. J. 2020, 20, 13364–13370. [Google Scholar] [CrossRef]
- Wu, C.; Zhang, F.; Wang, B.; Liu, K.R. mmTrack: Passive multi-person localization using commodity millimeter wave radio. In Proceedings of the IEEE INFOCOM 2020—IEEE Conference on Computer Communications, Toronto, ON, Canada, 6–9 July 2020; pp. 2400–2409. [Google Scholar]
- Zhao, P.; Lu, C.X.; Wang, J.; Chen, C.; Wang, W.; Trigoni, N.; Markham, A. mID: Tracking and identifying people with millimeter wave radar. In Proceedings of the 2019 15th International Conference on Distributed Computing in Sensor Systems, Santorini, Greece, 29–31 May 2020; pp. 33–40. [Google Scholar]
- Pegoraro, J.; Rossi, M. Real-time people tracking and identification from sparse mm-Wave radar point-clouds. IEEE Access 2020, 9, 78504–78520. [Google Scholar] [CrossRef]
- Pegoraro, J.; Meneghello, F.; Rossi, M. Multiperson continuous tracking and identification from mm-wave micro-doppler signatures. IEEE Trans. Geosci. Remote Sens. 2021, 59, 2994–3009. [Google Scholar] [CrossRef]
- Guo, S.; Chen, J.; Shi, Z.; Li, H.; Wu, P.; Li, S.; Cui, G.; Yang, X. Graph matching based image registration for multi-view through-the-wall imaging radar. IEEE Sens. J. 2022, 22, 1486–1494. [Google Scholar] [CrossRef]
- Ding, Y.; Huang, G.; Hu, J.; Li, Z.; Zhang, J.; Liu, X. Indoor target tracking using dual-frequency continuous-wave radar Based on the range-only measurements. IEEE Trans. Instrum. Meas. 2020, 69, 5385–5394. [Google Scholar] [CrossRef]
- Will, C.; Vaishnav, P.; Chakraborty, A.; Santra, A. Human target detection, tracking, and classification using 24-GHz FMCW radar. IEEE Sens. J. 2019, 17, 7283–7299. [Google Scholar] [CrossRef]
- Li, G.; Ge, Y.; Wang, Y.; Chen, Q.; Wang, G. Detection of human breathing in non-line-of-sight region by using mmWave FMCW radar. IEEE Trans. Instrum. Meas. 2022, 71, 1–11. [Google Scholar] [CrossRef]
- Tang, Q.; Li, J.; Wang, L.; Jia, Y.; Cui, G. Multipath imaging for NLOS targets behind an L-Shaped corner with single-channel UWB radar. IEEE Sens. J. 2022, 22, 1531–1540. [Google Scholar] [CrossRef]
- Fujita, S.; Sakamoto, T.; Sato, T. An accurate UWB radar imaging method using indoor multipath echoes for targets in shadow regions. In Proceedings of the 2010 International Conference on Indoor Positioning and Indoor Navigation, Zurich, Switzerland, 15–17 September 2010; pp. 1–7. [Google Scholar]
- Li, L.; Krolik, J.L. Simultaneous target and multipath positioning. IEEE J. Sel. Top. Signal Process. 2014, 8, 153–165. [Google Scholar] [CrossRef]
- Chen, J.; Zhang, Y.; Guo, S.; Cui, G.; Wu, P.; Jia, C.; Kong, L. Joint estimation of NLOS building layout and targets via sparsity-driven approach. IEEE Trans. Geosci. Remote Sens. 2022, 60, 1–13. [Google Scholar] [CrossRef]
- Li, H.; Cui, G.; Guo, S.; Kong, L.; Yang, X. Target tracking and ghost mitigation based on multi-view through-the-wall radar imaging. In Proceedings of the 2020 IEEE Radar Conference, Florence, Italy, 21–25 September 2020; pp. 1–5. [Google Scholar]
- Copa, E.I.P.; Aziz, K.; Rykunov, M.; De Greef, E.; Bourdoux, A.; Horlin, F. Radar fusion for multipath mitigation in indoor environments. In Proceedings of the 2020 IEEE Radar Conference, Florence, Italy, 21–25 September 2020; pp. 1–5. [Google Scholar]
- Jia, Y.; Guo, Y.; Chen, S.; Song, R.; Wang, G.; Zhong, X.; Yan, C.; Cui, G. Multipath ghost and side/grating lobe suppression based on stacked generative adversarial nets in MIMO through-wall radar imaging. IEEE Access 2019, 7, 143367–143380. [Google Scholar] [CrossRef]
- Abdalla, A.T.; Muqaibel, A.H.; Al-Dharrab, S. Aspect dependent multipath ghost suppression in TWRI under compressive sensing framework. In Proceedings of the 2015 International Conference on Communications, Signal Processing, and Their Applications, Sharjah, United Arab Emirates, 17–19 February 2015; pp. 1–6. [Google Scholar]
- Cardillo, E.; Li, C.; Caddemi, A. Embedded heating, ventilation, and air-conditioning control systems: From traditional technologies toward radar advanced sensing. Rev. Sci. Instrum. 2021, 92, 061501. [Google Scholar] [CrossRef]
- Choi, J.H.; Kim, J.E.; Kim, K.T. Deep learning approach for radar-based people counting. IEEE Internet Things J. 2021, 9, 7715–7730. [Google Scholar] [CrossRef]
- Choi, J.W.; Yim, D.H.; Cho, S.H. People counting based on an IR-UWB radar sensor. IEEE Sens. J. 2017, 17, 5717–5727. [Google Scholar] [CrossRef]
- Antonucci, A.; Corrà, M.; Ferrari, A.; Fontanelli, D.; Fusari, E.; Macii, D.; Palopoli, L. Performance analysis of a 60-GHz radar for indoor positioning and tracking. In Proceedings of the 2019 International Conference on Indoor Positioning and Indoor Navigation, Pisa, Italy, 30 September–3 October 2019; pp. 1–7. [Google Scholar]
- Jia, Y.; Tian, H.; Fan, S.; Liu, B. Motion feature and millimeter wave multi-path AoA-ToA based 3D indoor positioning. In Proceedings of the 2018 IEEE 29th Annual International Symposium on Personal, Indoor and Mobile Radio Communications, Bologna, Italy, 9–12 September 2018; pp. 1–7. [Google Scholar]
- Lin, Z.; Lv, T.; Mathiopoulos, P.T. 3-D indoor positioning for millimeter-wave massive MIMO systems. IEEE Trans. Commun. 2018, 66, 2472–2486. [Google Scholar] [CrossRef]
- Zhang, W.; Xu, Z.; Guo, S.; Jia, Y.; Wang, L.; He, T.; Shao, H. MIMO through-wall-radar down-view imaging for moving target with ground ghost suppression. Digit. Signal Process. 2023, 134, 10386. [Google Scholar] [CrossRef]
- Hao, Z.; Yan, H.; Dang, X.; Ma, Z.; Jin, P.; Ke, W. Millimeter-wave wadar localization using indoor multipath effect. Sensors 2022, 22, 5671. [Google Scholar] [CrossRef]
- Yang, J.; Cui, G.; Yu, X.; Lu, S.; Kong, L. Passive location for coherent near-field sources with non-uniform sparse linear array. In Proceedings of the 2017 IEEE Radar Conference (RadarConf), Seattle, WA, USA, 8–12 May 2017; pp. 1338–1343. [Google Scholar]
- Liu, C.; Liu, S.; Zhang, C.; Huang, Y.; Wang, H. Multipath propagation analysis and ghost target removal for FMCW automotive radars. In Proceedings of the IET International Radar Conference (IET IRC 2020), Online Conference, 4–6 November 2020; pp. 330–334. [Google Scholar]
- Kumbul, U.; Hayvaci, H.T. Multipath exploitation for knowledge-aided adaptive target detection. IET Radar Sonar Navigat. 2019, 13, 867–870. [Google Scholar] [CrossRef]
- Gui, L.; Yuan, W.; Xiao, F. CSI-based passive intrusion detection bound estimation in indoor NLoS scenario. Fundam. Res. 2022; in press. [Google Scholar] [CrossRef]
- Mercuri, M.; Lu, Y.; Polito, S.; Wieringa, F.; Liu, Y.H.; van der Veen, A.J.; Van Hoof, C.; Torfs, T. Enabling robust radar-based localization and vital signs monitoring in multipath propagation environments. IEEE Trans. Biomed. Eng. 2021, 68, 3228–3240. [Google Scholar] [CrossRef] [PubMed]
- Sun, S.; Petropulu, A.P.; Poor, H.V. MIMO radar for advanced driver-assistance systems and autonomous driving: Advantages and challenges. IEEE Signal Process Mag. 2020, 37, 98–117. [Google Scholar] [CrossRef]
- Jiang, M.; Guo, S.; Luo, H.; Yao, Y.; Cui, G. A robust target tracking method for crowded indoor environments using mmWave radar. Remote Sens. 2023, 15, 2425. [Google Scholar] [CrossRef]
- Zhang, G.; Geng, X.; Lin, Y.-J. Comprehensive mPoint: A method for 3D point cloud generation of human bodies utilizing FMCW MIMO mm-Wave radar. Sensors 2021, 21, 6455. [Google Scholar] [CrossRef] [PubMed]
- Rohling, H. Radar CFAR thresholding in clutter and multiple target situations. IEEE Trans. Aerosp. Electron. Syst. 1983, 4, 608–621. [Google Scholar] [CrossRef]
- Van Veen, B.D.; Buckley, K.M. Beamforming: A versatile approach to spatial filtering. IEEE ASSP Mag. 1988, 5, 4–24. [Google Scholar] [CrossRef] [PubMed]
- 60 GHz mmWave Sensor EVMs. 2020. Available online: https://www.ti.com/lit/ug/swru546e/swru546e.pdf (accessed on 19 August 2023).
- Guo, S.; Zhao, Q.; Cui, G.; Li, S.; Kong, L.; Yang, X. Behind corner targets location using small aperture millimeter wave radar in NLOS urban environment. IEEE J. Sel. Top. Appl. Earth Observ. Remote Sens. 2020, 13, 460–470. [Google Scholar] [CrossRef]
- Granström, K.; Natale, A.; Braca, P.; Ludeno, G.; Serafino, F. Gamma gaussian inverse wishart probability hypothesis density for extended target tracking using X-Band marine radar data. IEEE Trans. Geosci. Remote Sens. 2015, 53, 6617–6631. [Google Scholar] [CrossRef]
- Clark, D.; Godsill, S. Group target tracking with the gaussian mixture probability hypothesis density filter. In Proceedings of the 2007 3rd International Conference on Intelligent Sensors, Sensor Networks and Information, Melbourne, VIC, Australia, 3–6 December 2007; pp. 149–154. [Google Scholar]
- Wahlstrom, N.; Ozkan, E. Extended target tracking using gaussian processes. IEEE Trans. Signal Process. 2015, 63, 4165–4178. [Google Scholar] [CrossRef]
Figure 1.
Indoor EM propagation model from an overhead perspective.

Figure 3.
The flow chart of the adopted positioning method.

Figure 4.
The experimental scenario and radar.

Figure 5.
Experiment for a swaying target. (a) Experimental scenario. (b) The range profile of the target. (c) Side view of the positioning results.
Figure 5.
Experiment for a swaying target. (a) Experimental scenario. (b) The range profile of the target. (c) Side view of the positioning results.

Figure 6.
Analysis of the coherent source. (a) The DOAs of p and the coherent source formed by p and . (b) Simulation results of independent repetitive test for wall multipath coherent sources. (c) Positioning results of real data and simulation data generated by and .
Figure 6.
Analysis of the coherent source. (a) The DOAs of p and the coherent source formed by p and . (b) Simulation results of independent repetitive test for wall multipath coherent sources. (c) Positioning results of real data and simulation data generated by and .

Figure 7.
Analysis of the coherent source formed by and . (a) Independent repetitions of simulation analysis results for elevation angle. (b) Independent repetitions of simulation analysis results for azimuth angle. (c) Positioning results of real data and simulation data generated by and .
Figure 7.
Analysis of the coherent source formed by and . (a) Independent repetitions of simulation analysis results for elevation angle. (b) Independent repetitions of simulation analysis results for azimuth angle. (c) Positioning results of real data and simulation data generated by and .

Figure 8.
Positioning results of real data and simulation data formed by , , , and .

Figure 9.
Analysis of different positions. (a–f) The experimental scenarios and positioning results when the target is located at (−0.5 m, 1.8 m), (−1.5 m, 1.8 m), and (1 m, 1.3 m). (g–l) The experimental scenarios and positioning results when the target is located at (−1 m, 1.3 m), (0.5 m, 0.8 m), and (−1 m, 0.8 m).

Figure 10.
The workflow of target tracking.

Figure 11.
Comparison before and after multipath ghost suppression. (a) Before multipath ghost suppression. (b) After multipath ghost suppression.
Figure 11.
Comparison before and after multipath ghost suppression. (a) Before multipath ghost suppression. (b) After multipath ghost suppression.


Table 1.
Propagation paths of transmitting and receiving signals.
| Transmitting Paths | Receiving Paths | ||
|---|---|---|---|
| Path Name | Propagation Process | Path Name | Propagation Process |
Table 2.
MMW Radar Parameters.
| Parameter | Tx Power | Angle Resolution | Maximum Angle | Maximum Range | Carried Frequency | Range Resolution | Chirp Cycle Time |
|---|---|---|---|---|---|---|---|
| Value | 12 dBm | 8.57 m | 60 GHz | 4.3 cm | 171 us |
Table 3.
Statistical results of CDD at different positions.
| Target Position | (−0.5 m, 1.8 m) | (−1.5 m, 1.8 m) | (1 m, 1.3 m) | (−1 m, 1.3 m) | (0.5 m, 0.8 m) | (−1 m, 0.8 m) |
|---|---|---|---|---|---|---|
| CDD of type-1 (cm) | 14.76 | 4.79 | — | — | — | — |
| CDD of type-2 (cm) | 7.75 | 13.46 | 5.14 | 11.17 | 9.48 | 10.49 |
| CDD of type-3 (cm) | 14.27 | 12.5 | 10.47 | 10.13 | — | — |
Table 4.
Multipath ghost target suppression results at different positions.
| Target Position | (−0.5 m, 1.8 m) | (−1.5 m, 1.8 m) | (0.5 m, 1.3 m) | ||||||
|---|---|---|---|---|---|---|---|---|---|
| Target Number | 1 | 2 | 3 | 1 | 2 | 3 | 1 | 2 | 3 |
| Before Suppression | 7.37% | 84.21% | 8.42% | 1.09% | 0% | 98.91% | 0% | 100% | 0% |
| After Suppression | 100% | 0% | 0% | 100% | 0% | 0% | 100% | 0% | 0% |
| Target Position | (−1 m, 1.3 m) | (0.5 m, 0.8 m) | (−1 m, 0.8 m) | ||||||
| Target Number | 1 | 2 | 3 | 1 | 2 | 3 | 1 | 2 | 3 |
| Before Suppression | 0% | 22.11% | 77.89% | 0% | 100% | 0% | 14.29% | 85.71% | 0% |
| After Suppression | 100% | 0% | 0% | 100% | 0% | 0% | 100% | 0% | 0% |
Disclaimer/Publisher’s Note: The statements, opinions and data contained in all publications are solely those of the individual author(s) and contributor(s) and not of MDPI and/or the editor(s). MDPI and/or the editor(s) disclaim responsibility for any injury to people or property resulting from any ideas, methods, instructions or products referred to in the content. |
© 2023 by the authors. Licensee MDPI, Basel, Switzerland. This article is an open access article distributed under the terms and conditions of the Creative Commons Attribution (CC BY) license (https://creativecommons.org/licenses/by/4.0/).
Share and Cite
MDPI and ACS Style
Luo, H.; Zhang, W.; Ren, Z.; Tang, C.; Ou, Y.; Cui, G.; Guo, S. Analysis of Electromagnetic Wave and Multipath Suppression from Overhead Perspective. Remote Sens. 2023, 15, 4903. https://doi.org/10.3390/rs15204903
AMA Style
Luo H, Zhang W, Ren Z, Tang C, Ou Y, Cui G, Guo S. Analysis of Electromagnetic Wave and Multipath Suppression from Overhead Perspective. Remote Sensing. 2023; 15(20):4903. https://doi.org/10.3390/rs15204903
Chicago/Turabian StyleLuo, Haolan, Wenqiang Zhang, Zhaoting Ren, Chuantian Tang, Yu Ou, Guolong Cui, and Shisheng Guo. 2023. "Analysis of Electromagnetic Wave and Multipath Suppression from Overhead Perspective" Remote Sensing 15, no. 20: 4903. https://doi.org/10.3390/rs15204903
Note that from the first issue of 2016, this journal uses article numbers instead of page numbers. See further details here.