1. Introduction
As one of the world’s three major food crops, wheat plays a crucial role in providing phytochemicals that are essential for human health, such as vitamins, starch, protein, and dietary fiber. In 2022, China’s wheat production reached approximately 1.38 × 10
9 tons, accounting for about 20% of the country’s total grain production and highlighting the strategic importance of securing wheat production for food security [
1]. However, the phenomenon of wheat lodging, which refers to the bending or breaking of wheat stems due to adverse weather conditions or improper farming practices, poses a significant challenge to wheat cultivation [
2]. Wheat lodging adversely affects water and nutrient transport and photosynthesis and increases susceptibility to pests and diseases, hindering seed filling and having a substantial impact on wheat yield. The degree of lodging intensifies if it occurs during the late-ripening and late-filling stages of wheat growth, resulting in yield reductions ranging from 10% to 20%. If lodging happens before or after wheat flowering, the yield reduction can exceed 50%, leading to complete yield loss [
3]. Given this situation, leveraging computer technology to obtain timely and accurate regional wheat lodging information is vital for predicting total wheat yields and promoting global grain production regulation. Such efforts are crucial to supporting agricultural development and presenting food security strategies. Numerous strategies have been pursued within the realm of investigations concerning expansive canopy systems. These encompass approaches that dissect individual crops as distinct entities, utilizing visualization methodologies in tandem with wind dynamics [
4,
5,
6]. However, the methods centered on comprehensive measurements at a significant scale stand out as preeminent among these strategies. Currently, the most widely used methods for wheat lodging detection include manual field measurements and high-throughput remote sensing measurements [
7]. Manual measurements are subject to environmental variability and lack objectivity and uniform standards, resulting in inefficiencies and low accuracy in wheat lodging detection [
8,
9].
In recent years, remote sensing technology has emerged as a critical tool in detecting crop failure. Scholars have employed remote sensing techniques, including unmanned aerial vehicles (UAVs) and satellite imagery, to analyze the spatial structures and color differences between areas with and without wheat lodging. They have utilized deep learning and classical machine learning methods to advance wheat lodging detection research [
10,
11]. Despite its limitations regarding spatial and temporal resolution, satellite remote sensing has been used to monitor wheat lodging information. However, with the rapid development of UAV technology and data processing software, UAV remote sensing has gained popularity in agriculture due to its cost-effectiveness, operability, and high spatial and temporal resolutions [
12,
13]. Scholars have made significant progress in detecting wheat lodging using UAV RGB remote sensing images. For instance, Li Guang et al. achieved winter wheat lodging detection with an overall accuracy of 86.44% using textual methods, support vector machines, neural networks, and maximum likelihood methods [
14].
Zhang et al. extracted features from RGB images acquired using UAVs and evaluated three classification methods: random forest, neural networks, and support vector machines. They then incorporated the robust convolutional neural network, GoogLeNet, achieving a final accuracy of 93% [
15]. While classical machine learning methods have been widely used in these studies, they rely heavily on traditional feature selection methods and lack model robustness. With the advancement of computing power and the development of deep learning network architecture, deep learning techniques have shown remarkable results in agricultural disaster assessment and other areas. Based on UAV remote sensing images capturing wheat at five developmental stages, Yu et al. incorporated the attention module CBAM into the PSPNet model and employed the Tversky loss function, resulting in an approximate overall accuracy of 95% [
16]. In parallel, Zhang et al. presented a novel approach that integrates transfer learning and the Deeplabv3+ network to extract the lodging area of wheat during various growth stages [
17]. Their findings demonstrated an achieved dice coefficient of around 90%.
In practical applications, the wheat planting area data exhibit evident heterogeneity. The aforementioned deep learning methods rely solely on a singular type of remote sensing image data and are limited by a small data range, with most studies having data ranges of less than 0.32 hectares [
15,
16,
17], constraining their applicability to a restricted set of practical scenarios. Therefore, it is crucial to conduct a meticulous comparative inquiry concerning the identification of wheat lodging, imbuing the use of remote sensing image data with conspicuous heterogeneity. This imperative arises because of the evolving landscape in practical applications, whereby wheat cultivation regions exhibit overt disparities. Notably, our study bears the distinction of being the first to achieve exceptional efficacy across an expansive and heterogeneous field dataset.
This study utilized a comprehensive dataset spanning 2.3117 km2 of unmanned aerial vehicle (UAV) multispectral and RGB remote sensing images, comprising a total of six images acquired from three distinct districts and counties within Xiangyang City. The key objectives addressed in this research are as follows: (1) selecting the optimal model for accurately segmenting wheat lodging in complex field conditions; (2) conducting a comparative analysis of various remote sensing data types to identify the model with superior performance; and (3) developing a novel classification framework to address land affiliation variations and achieve the pixel-level classification of UAV images.
The rest of the paper is structured as follows:
Section 2 outlines the study area, data collection, and processing;
Section 3 presents the methodology;
Section 4 presents the comparative results of the models and inputs;
Section 5 contains the discussion; and
Section 6 concludes and offers future directions.
2. Materials
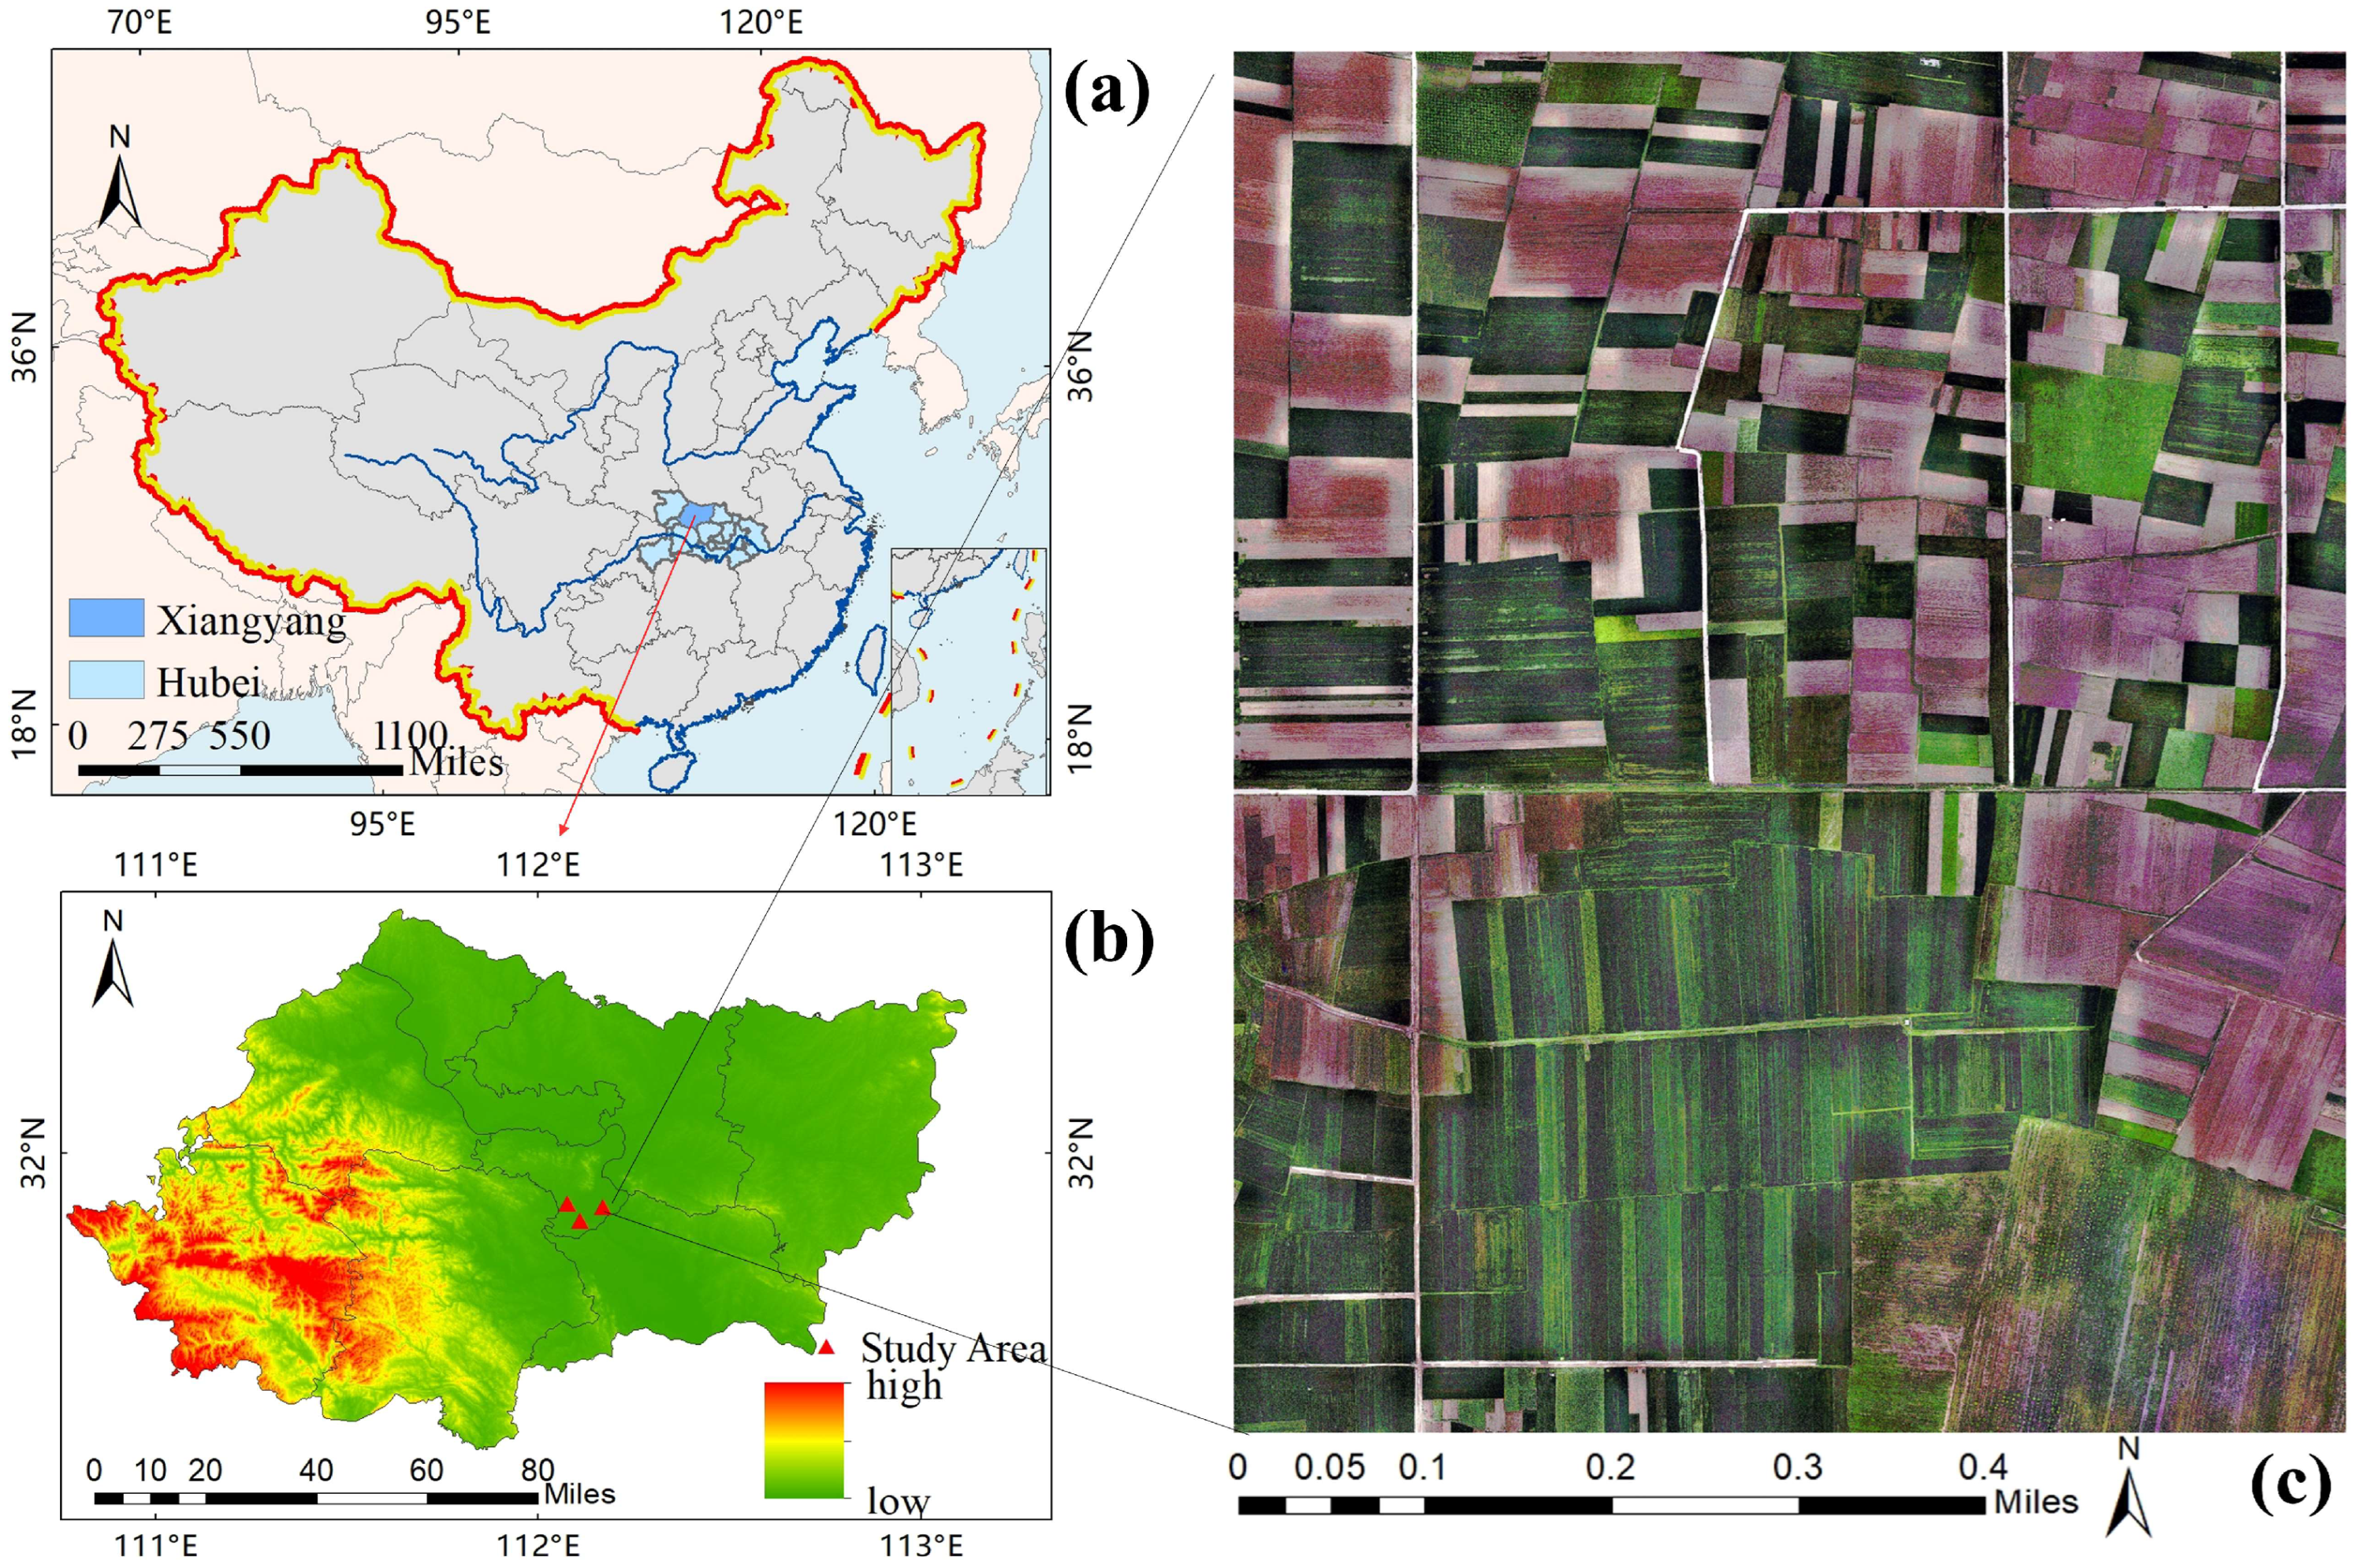
2.1. Description of Study Area
The study was conducted in Liangjiazhuang, Oumiao Town, Xiangcheng District, Hubei Province (112°09′12″E, 31°51′13″N) (
Figure 1), a region characterized by a humid subtropical monsoon climate featuring cold and dry winters, hot and rainy summers, and simultaneous precipitation and heat. The region experiences an average annual temperature ranging from 15.2 to 16.0 °C, with an average annual sunshine duration of 1622 to 1841 h and a frost-free period of approximately 250 days. These favorable climatic conditions provide an optimal environment for the robust growth of wheat. However, the area frequently experiences wheat lodging due to the adverse impact of severe weather conditions, including strong winds and heavy rainfall, coupled with suboptimal farming practices during the middle and late stages of wheat growth [
18].
2.2. Data Acquisition
The DJI M300 RTK multi-rotor UAV offers numerous advantages, including high operational efficiency, flight stability, altitude maneuverability, versatility in capturing various types of images, and minimal constraints on takeoff and landing, making it highly suitable for conducting rapid aerial photography operations in rural areas. Consequently, the M300 RTK UAV manufactured by Shenzhen DJI Innovation Technology Co. (Shenzhen, China) was utilized in this study. The UAV has a total weight of 6.3 kg (including the battery and rotors), a wheelbase of 895 mm, a maximum flight speed of 23 m/s, a maximum takeoff altitude of 7000 m, and exceptional hovering accuracy in the RTK mode: vertical ± 0.1 m; horizontal ± 0.1 m.
Data collection was completed from 23 April to 29 April 2022, under clear weather conditions with adequate illumination. The UAV was equipped with a Zenmuse H20 camera (DJI Technology Co., Shenzhen, China) and a RedEdge MX Dual dual-camera multi-spectrometer (MicaSense, Seattle, WA, USA). DJI Pilot software was utilized to plan the flight route, ensuring a flight altitude of 100 m with a heading overlap rate of 75% and a collateral overlap rate of 80%. This setup allowed for the acquisition of RGB remote sensing images with ground resolutions of 1.8 cm, as well as multispectral remote sensing images with an 8 cm resolution. The resulting imagery depicted instances of wheat lodging occurring during the middle and late stages of growth (
Figure 2).
2.3. DataSet Construction and Annotation
The images captured by the UAV underwent a series of processing steps using Agisoft Metashape software to generate four images. These images were subjected to essential operations, including standardization, the construction of a dense cloud, network construction, texture layer generation, and ortho-morph construction, using specialized photogrammetry software. To ensure consistency, all image layers were projected onto the WGS 1984 UTM Zone 50N projection coordinate system in the GeoTIFF format, based on the geographic location of the image area.
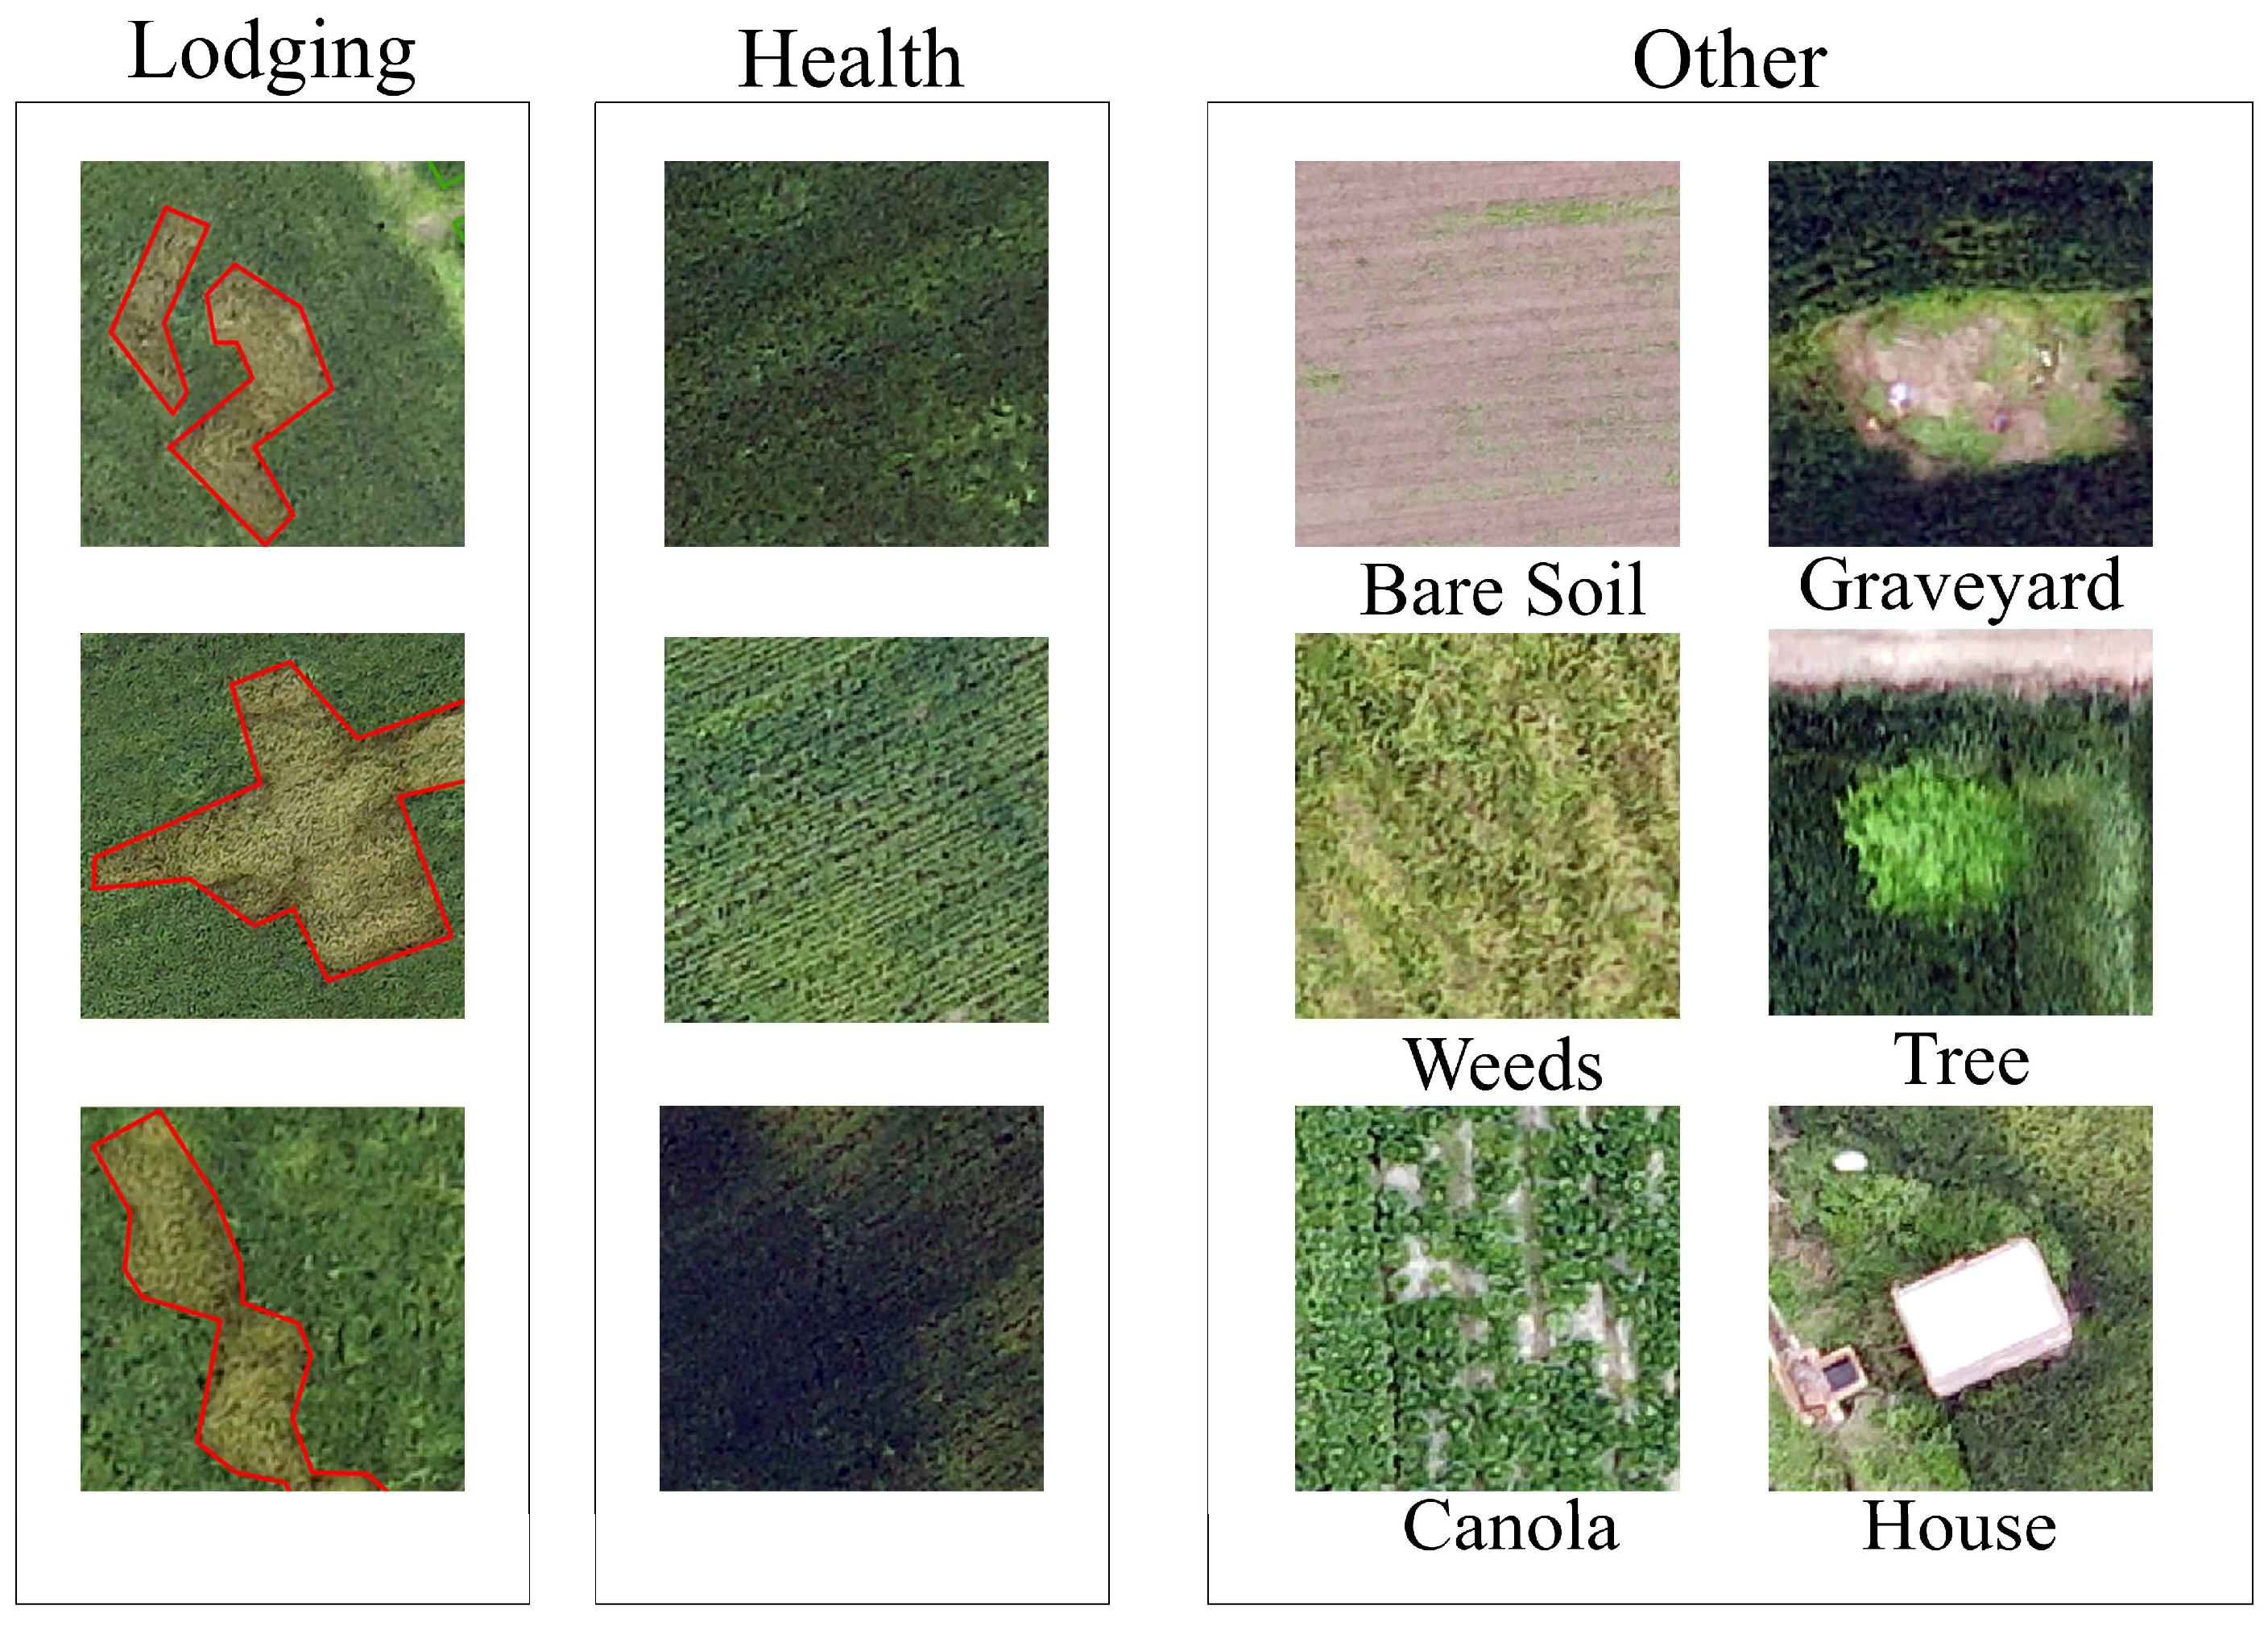
For this study, semantic segmentation techniques in deep learning were employed, requiring the data to be provided in the form of masks for the efficient labeling of classified regions. Manual labeling was conducted using ArcGIS Pro 2.5.2, with experienced interpreters conducting visual interpretations. The images were categorized into “Others” (including soil, weeds, canola, houses, etc.), “Health” (representing healthy wheat), and “Lodging” (indicating wheat lodging). The detection of wheat lodging served as a supervised classification task with three classes (
Figure 2). The visual interpretation of lodgings was cross-checked by two interpreters, with areas of uncertainty excluded from the subsequent classification. Furthermore, field visits were conducted to verify the accuracy of the visual interpretation.
To facilitate comparisons between different types of remote sensing data when modeling, the nearest resampling method in ArcGIS 10.7 was employed to resample RGB remote sensing images, multispectral remote sensing images, and their corresponding reference masks to an 8 cm resolution. This ensured consistency in evaluating the differences across various remote sensing data types.
2.4. Data Processing
Regarding the exported images, ensuring compliance with the criteria set forth by the semantic segmentation module in deep learning necessitated the utilization of a sliding cut approach. This approach effectively divided the images into non-repetitive segments with dimensions of 512 × 512, ensuring optimal compatibility with the module while maintaining a low repetition rate of 0.1.
The balance of the dataset plays a pivotal role in the performance of the deep learning model [
19]. This study employed a dataset balancing method, based on the pixel value ratio, to select the most suitable model. Specifically, the proportion of each label value within each image was initially computed. If the combined proportion of healthy or background label values exceeded 60% and the total proportion of lodging label values was less than 1%, the image was removed. By using this approach, the dataset was balanced across the three label types, leading to improved accuracy in evaluating the model performance. Simultaneously, in order to retain the realism of the original dataset’s label proportions, no balancing treatment was applied during the comparison of different frames and different types of remote sensing images. Following these principles, the dataset was divided into four distinct groups, with detailed information provided in
Table 1.
The four image blocks were randomly partitioned into training, validation, and test datasets, with a ratio of 7:2:1. The training and validation sets were utilized during the model training process, while the test set served as an independent dataset for evaluating the performance of the trained deep learning model.
Furthermore, to enhance the generalization capability and training efficiency during model training, a real-time data augmentation technique was employed in this study [
20]. As a crucial component within the PaddleRS framework’s data preprocessing pipeline, this technique encompassed several enhancements, including data normalization to the range [−1, 1] and random horizontal flipping with a probability of 50%. These augmentations aimed to improve the model’s ability to generalize to unseen data and expedite the training process.
3. Method
3.1. Training of Deep Neural Networks
Semantic segmentation is a comprehensive technique that integrates image classification, target detection, and image segmentation, aiming to partition an image into distinct regions with specific spatial extents while identifying the semantic class of each region. Compared to traditional methods, convolutional neural network (CNN)-based semantic segmentation enables end-to-end training, exhibits superior adaptability and scalability, and significantly enhances the accuracy of semantic segmentation models [
21].
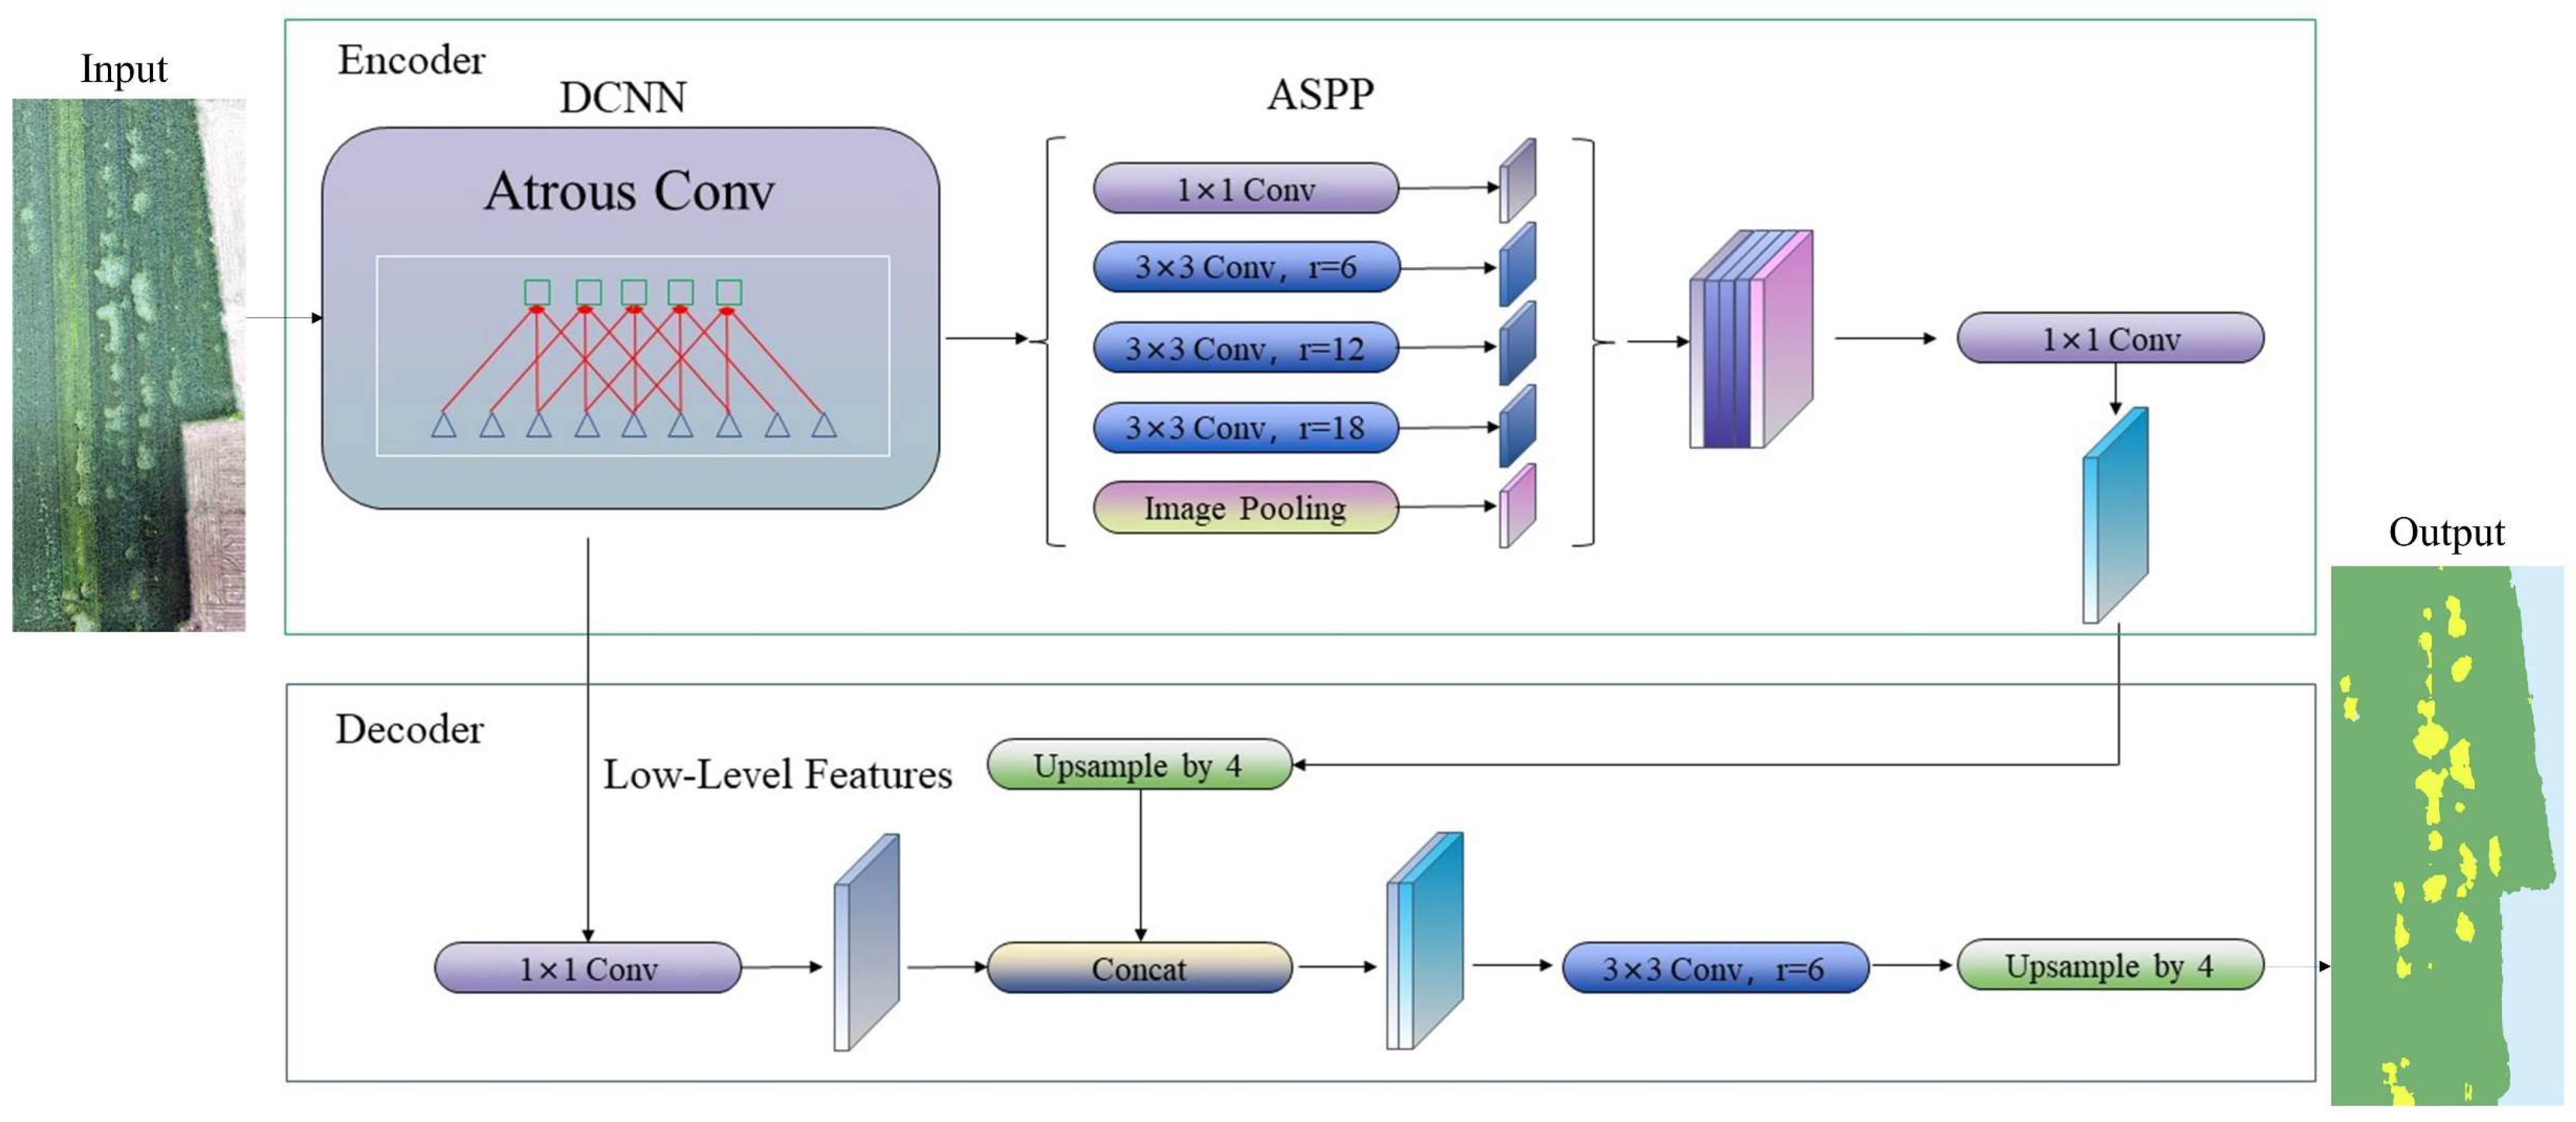
Deeplabv3+ is a widely used semantic segmentation model that is employed extensively in various domains. Its overarching architecture encompasses two integral components: the encoder and the decoder [
22] (
Figure 3). Deeplabv3+ extends the Deeplabv3 model by introducing a novel encoder–decoder network structure. The encoder module retains the core features of Deeplabv3 and leverages atrous convolution to enhance model detection capabilities for small targets, which is particularly beneficial for detecting small lodging areas. Notably, the encoder incorporates atrous spatial pyramid pooling (ASPP), a critical component that performs convolutions with various dilation rates, enabling the extraction of feature representations with diverse perceptual fields. ASPP effectively exploits multi-scale feature information to achieve superior object boundary segmentation. The decoder involves the upsampling and fusion of feature maps, combining the advantages of both methods to handle objects of different sizes and produce a robust model.
In addition to Deeplabv3+, we employed several classical model architectures that have been used in the field of semantic segmentation. These include U-net, Bisenetv2, HRNet, FastSCN, and RTFormer. The U-net model, characterized by an encoder–decoder structure, enables the precise recovery of edge information in the segmentation map via feature concatenation during upsampling [
23]. Bisenetv2 constructs a bilateral segmentation network with a two-way encoder that combines a lightweight network structure with a densely connected residual network structure, achieving a balance between computational speed and final accuracy [
24]. HRNet employs a high-resolution feature pyramid structure, leveraging multi-layer feature pyramids to handle objects at different scales and effectively improve model performance [
25]. The FastSCN model adopts a lightweight network structure that utilizes spatial context to enhance segmentation results [
26]. RTFormer, based on the Transformer architecture, utilizes the self-attentive mechanism to capture global contextual information while preserving spatial details, surpassing traditional convolutional neural networks (CNN) in capturing contexts [
27].
During the exploration of the optimal segmentation model, the six aforementioned models were trained on Dataset A, a balanced ultra-high-resolution image dataset, to maximize the model’s performance and generalization capabilities. Subsequently, a comparative analysis was conducted to select the most suitable semantic segmentation model for detecting wheat lodging.
3.2. Application of Multispectral Datasets
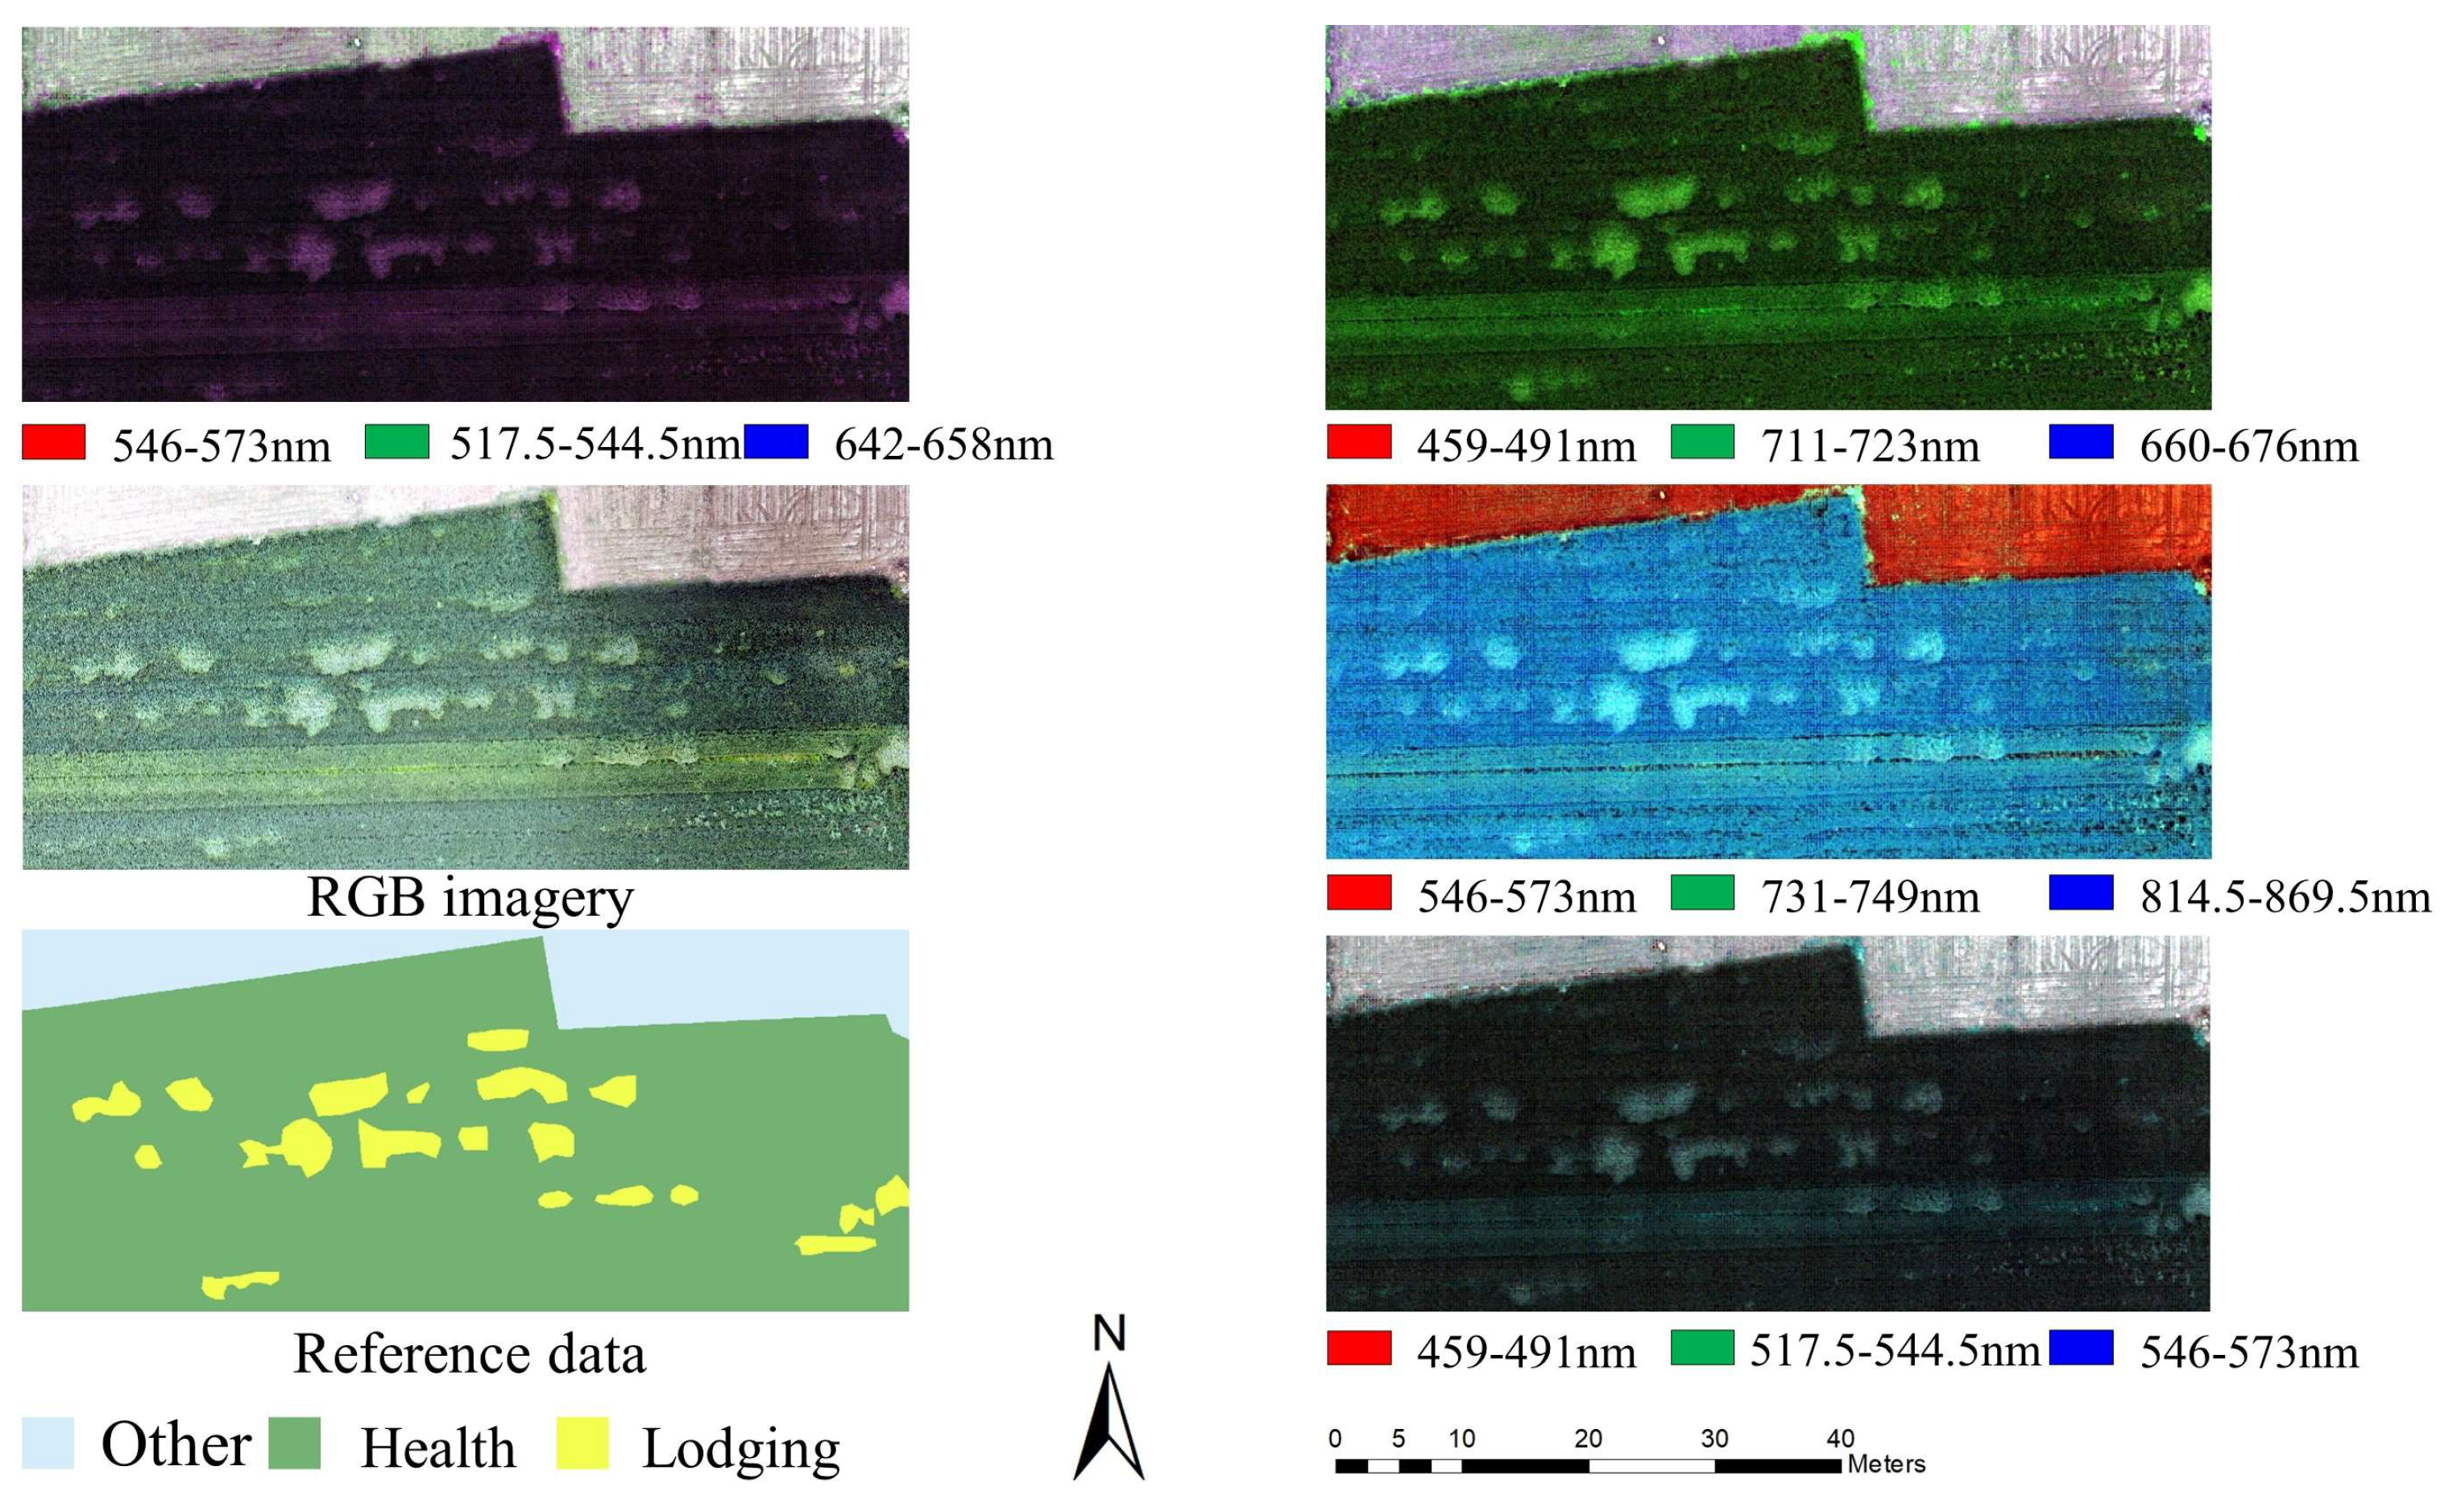
Multispectral image classification, an important application of hyperspectral technology, aims to classify various features based on the differences in reflectance across different wavelengths of light. Compared to traditional RGB images, multispectral data contain a richer set of waveband information (
Figure 4), enabling more detailed feature classification. In recent years, UAV-based multispectral imaging has been extensively used in agricultural disaster detection [
28,
29,
30,
31].
In the context of semantic segmentation, the dataset plays a pivotal role in training and evaluating the model’s performance. In this study, PaddleRS, an intelligent interpretation development kit for remote sensing images, was employed to optimize the classification model’s parameters, adjust the number of input bands, and utilize the pixel values from each band of the multispectral images as inputs. These inputs were further processed by a neural network model to identify the occurrence of wheat lodging. Unbalanced Datasets C and D were employed to compare the RGB data with multispectral data, leveraging the abundant spectral information present in multispectral data. Subsequently, the Deeplabv3+ model was employed to model the wheat lodging datasets, allowing for a comprehensive comparison between RGB and multispectral data.
3.3. Multi-Branch Binary Classification Framework
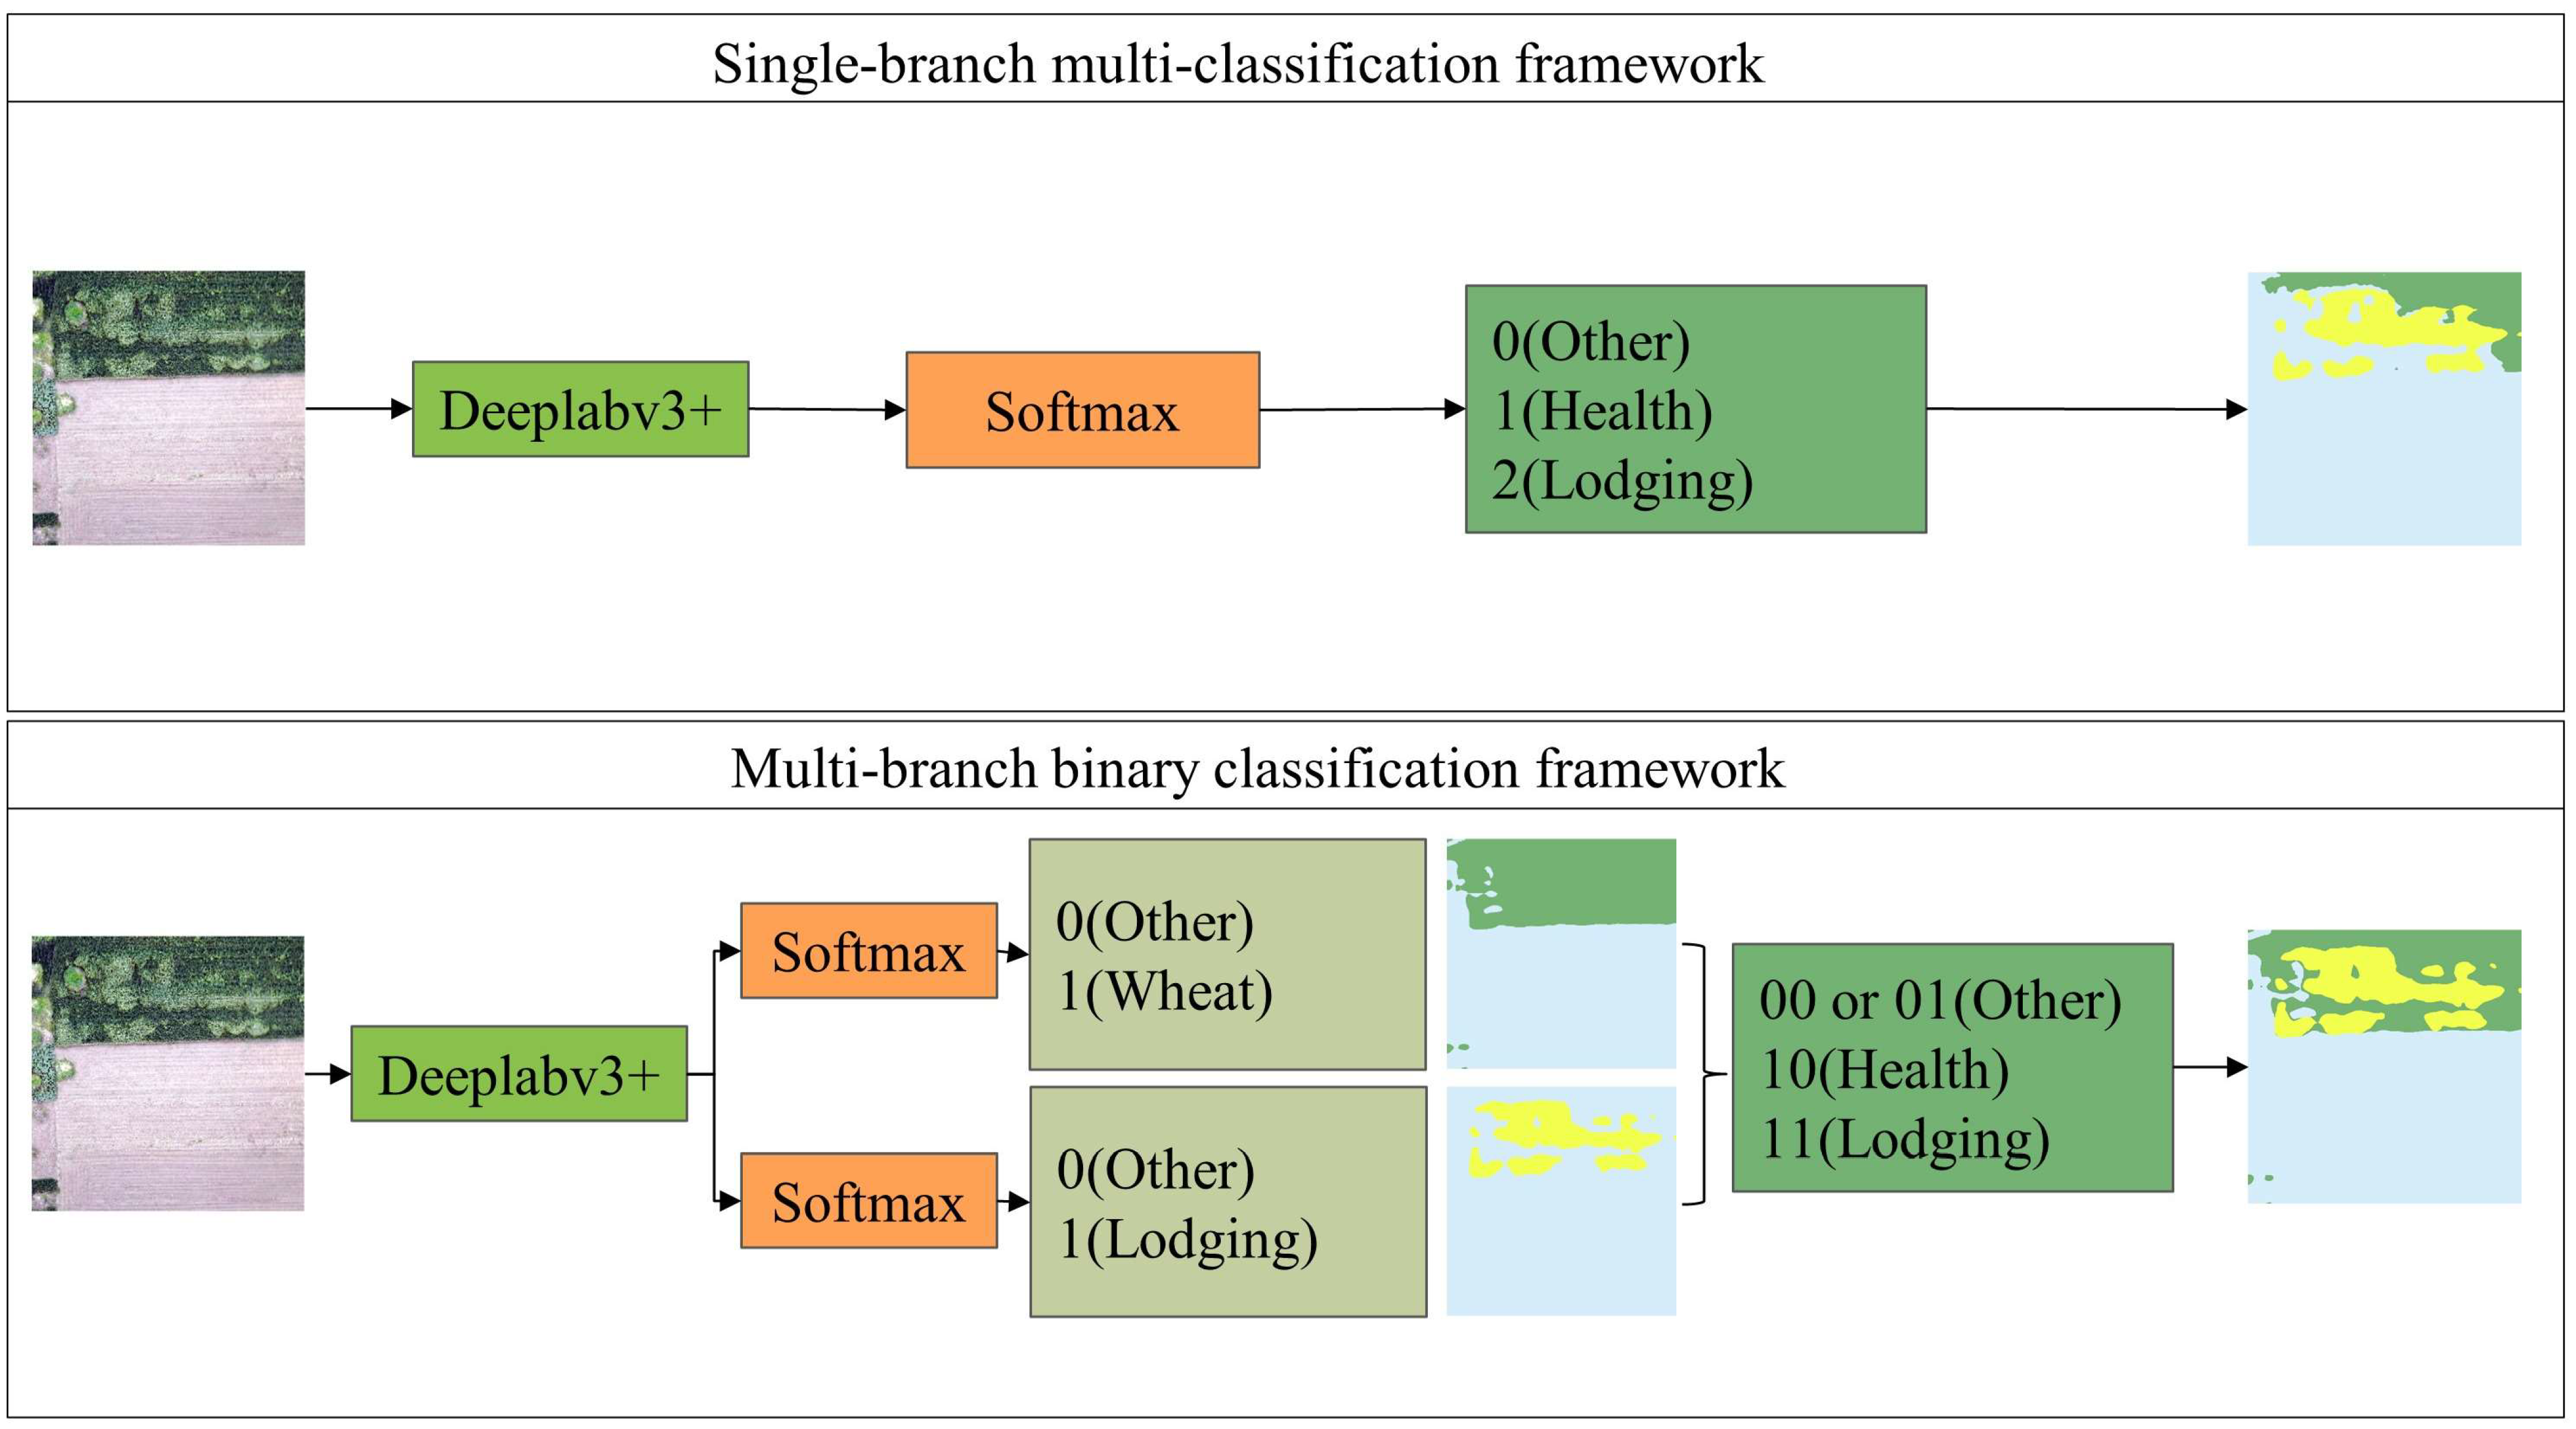
In most classification problems, the conventional approach involves using a single model for multi-classification, where the model extracts and transforms features from input data using neural networks or other machine learning algorithms. The output layer of this approach consists of nodes representing different classes, and the class of the input data is determined based on the scores of these nodes.
However, traditional multi-classification methods encounter a significant limitation when dealing with the special case of wheat lodging occurring only within wheat regions, specifically related to class affiliation. This situation can lead to the incorrect classification of other non-target regions such as wheat lodging, resulting in inaccurate classification outcomes. Such inaccuracies can significantly impact the detection of wheat lodging areas within the target region, necessitating a more refined classification method to address this issue.
Hence, this study constructed an innovative multi-branch binary classification framework [
32]. In this framework, an additional branch was added to the existing single branch, transforming the problem into a binary classification task. One branch focused on distinguishing wheat areas (including healthy wheat and wheat lodging) from other areas, while the other branch focused solely on identifying wheat lodging areas among other areas. Subsequently, the logic depicted in
Figure 5 was applied to the results obtained from the two branches, ensuring that wheat lodging was exclusively included within the wheat region.
During the actual training process, this study utilized Dataset A and Dataset B for image segmentation using the Deeplabv3+ model. The effectiveness of the multi-branch binary classification framework under different dataset balancing scenarios was compared to explore its performance across various situations.
3.4. Model Training
In this experiment, uniform hyperparameter settings were applied to all models. The experiments were conducted using PaddlePaddle 2.4.1 and a CUDA-compatible NVIDIA GPU (GeForce GTX 1080 Ti) with a CUDA11.7 library. As some datasets exhibited imbalanced class distributions, the lodging class contained a limited number of samples, thereby restricting the optimization effect of a single loss function. Hence, a combination of two loss functions, Dice and Cross Entropy, was employed for training to address this issue.
Regarding optimizer selection, the Momentum algorithm was utilized in this experiment. As for the learning rate scheduler, the OneCycleLR method was adopted to linearly increase the learning rate from a lower value to a higher value and subsequently linearly decrease it to a value close to 0. This approach facilitates faster model convergence and mitigates overfitting risks [
33]. The initial learning rate was set to 0.01 and gradually increased to 0.1 within the first 30% of the training cycles, followed by a gradual decrease to 0.0001 for the remaining 70% of the cycles. A total of 100 training cycles were conducted. Detailed parameter settings can be found in
Table 2.
3.5. Evaluation Metrics
To evaluate the model’s performance in wheat lodging detection, multiple metrics were employed, including recall, precision, intersection over union (IoU), and the F1 score.
These metrics assessed the model’s performance at the pixel level, where true positive (
) represented a case in which both the actual class and the detection class were positive (indicating a correct detection), false positive (
) denoted a positive value for an incorrect detection, and false negative (
) indicated a negative value for an incorrect detection. Among these metrics, particular emphasis was placed on the model’s ability to accurately identify wheat lodging situations; thus, the F1 score was selected as the evaluation metric [
34].
Furthermore, in evaluating the model’s performance in wheat lodging detection, this experiment devised a formula for quantifying the extraction accuracy. The area detected by the model () and the accurately extracted area () were computed based on the label map and detection results. Additionally, the extraction error was incorporated as an evaluation metric, calculated by comparing the difference between the extracted area and the actual area. This method enabled the measurement of the classifier’s accuracy and reliability, facilitating a better understanding of its performance in real-world applications.
5. Discussion
5.1. Impact of Different Segmentation Models on Wheat Lodging Recognition Accuracy
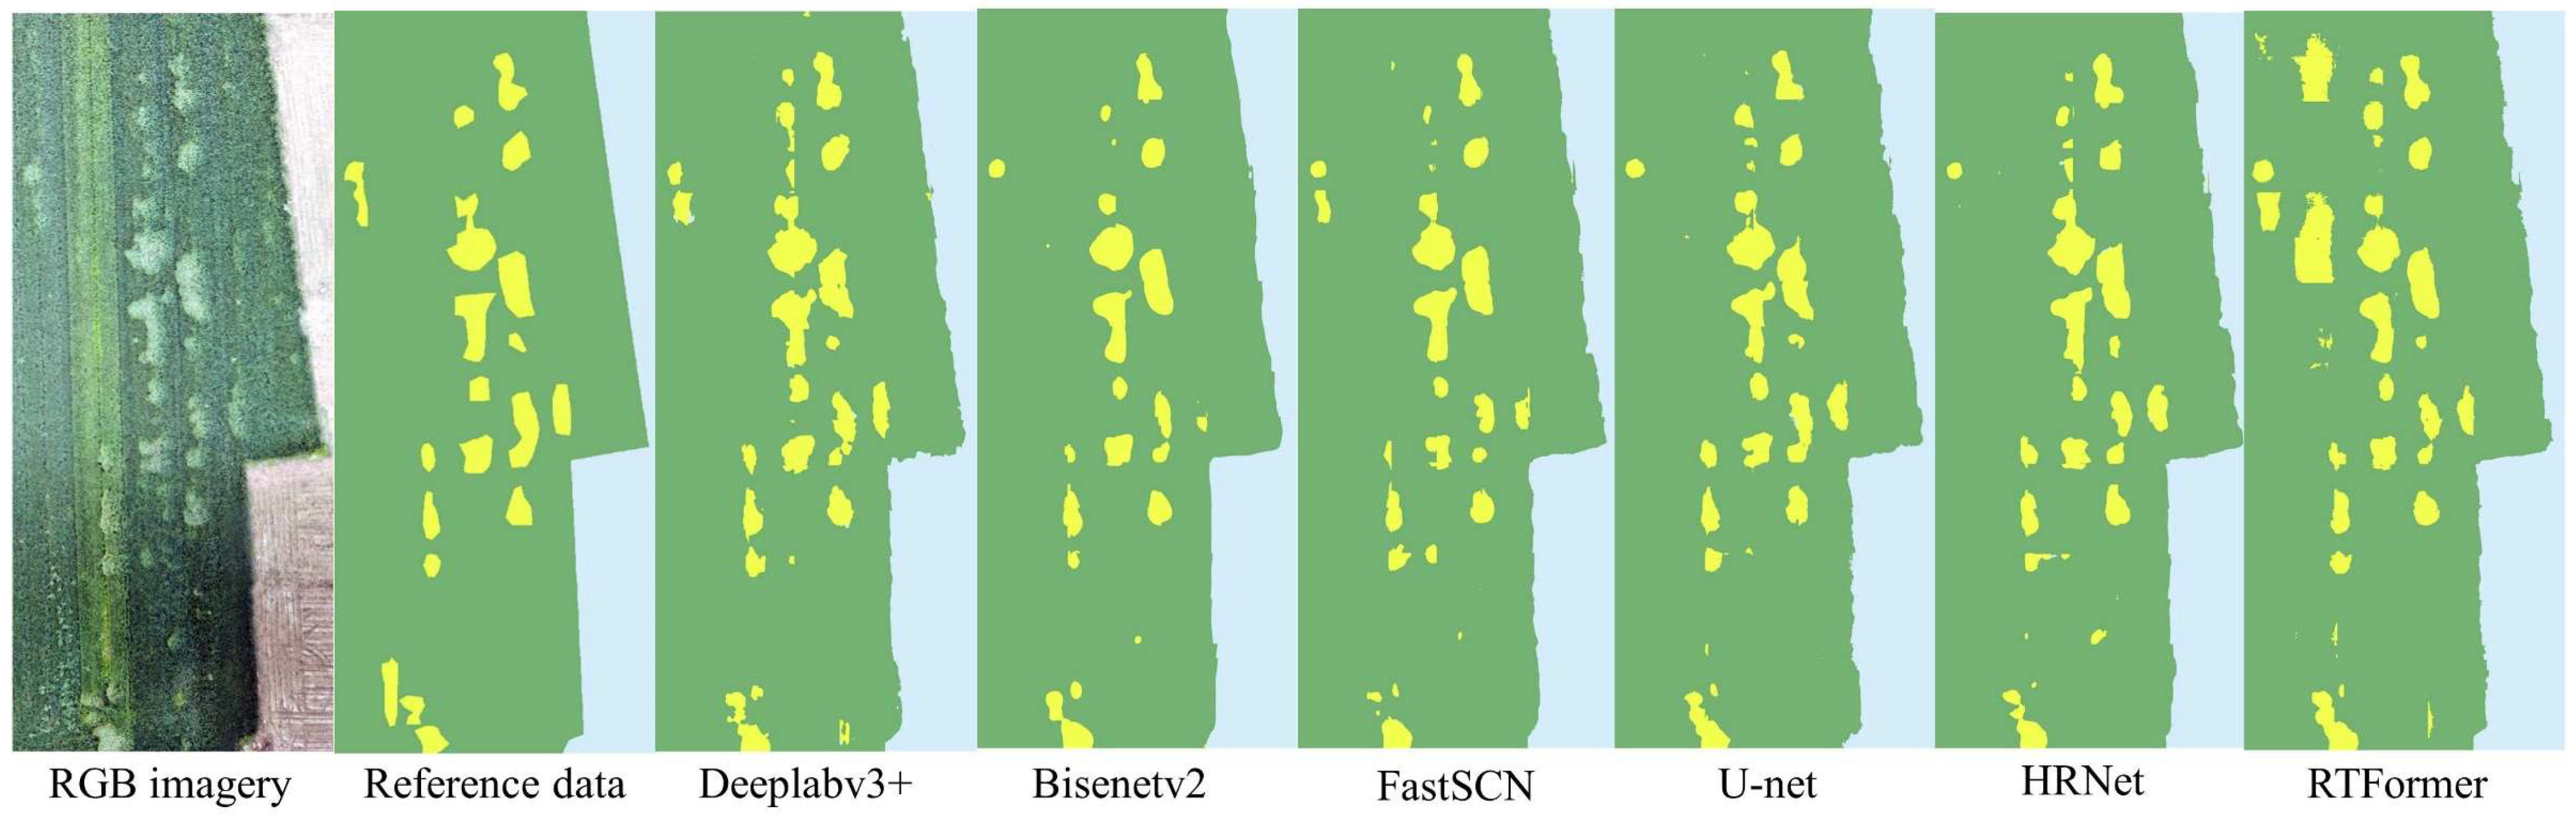
It is imperative to tailor semantic segmentation algorithms to specific scenarios. Evaluating multiple semantic segmentation models (Deeplabv3+, U-net, FastSCN, RTFormer, Bisenetv2, and HRnet) using the dataset revealed that the Deeplabv3+ model achieved the highest F1 score. This model demonstrated remarkable proficiency in accurately detecting small areas of wheat lodging and capturing the edge features of wheat lodging. The Deeplabv3+ model’s superiority stems from its utilization of advanced techniques such as null convolution and multi-scale feature fusion, enabling the effective semantic segmentation of small targets. Moreover, techniques such as global pooling and adaptive dilation convolution that are employed by the Deeplabv3+ model enhance edge detection accuracy. With its outstanding performance and generalization capabilities in detecting wheat lodging, the Deeplabv3+ model exhibits remarkable promise for practical applications.
5.2. Effect of Different Remote Sensing Data on Wheat Lodging Recognition Accuracy
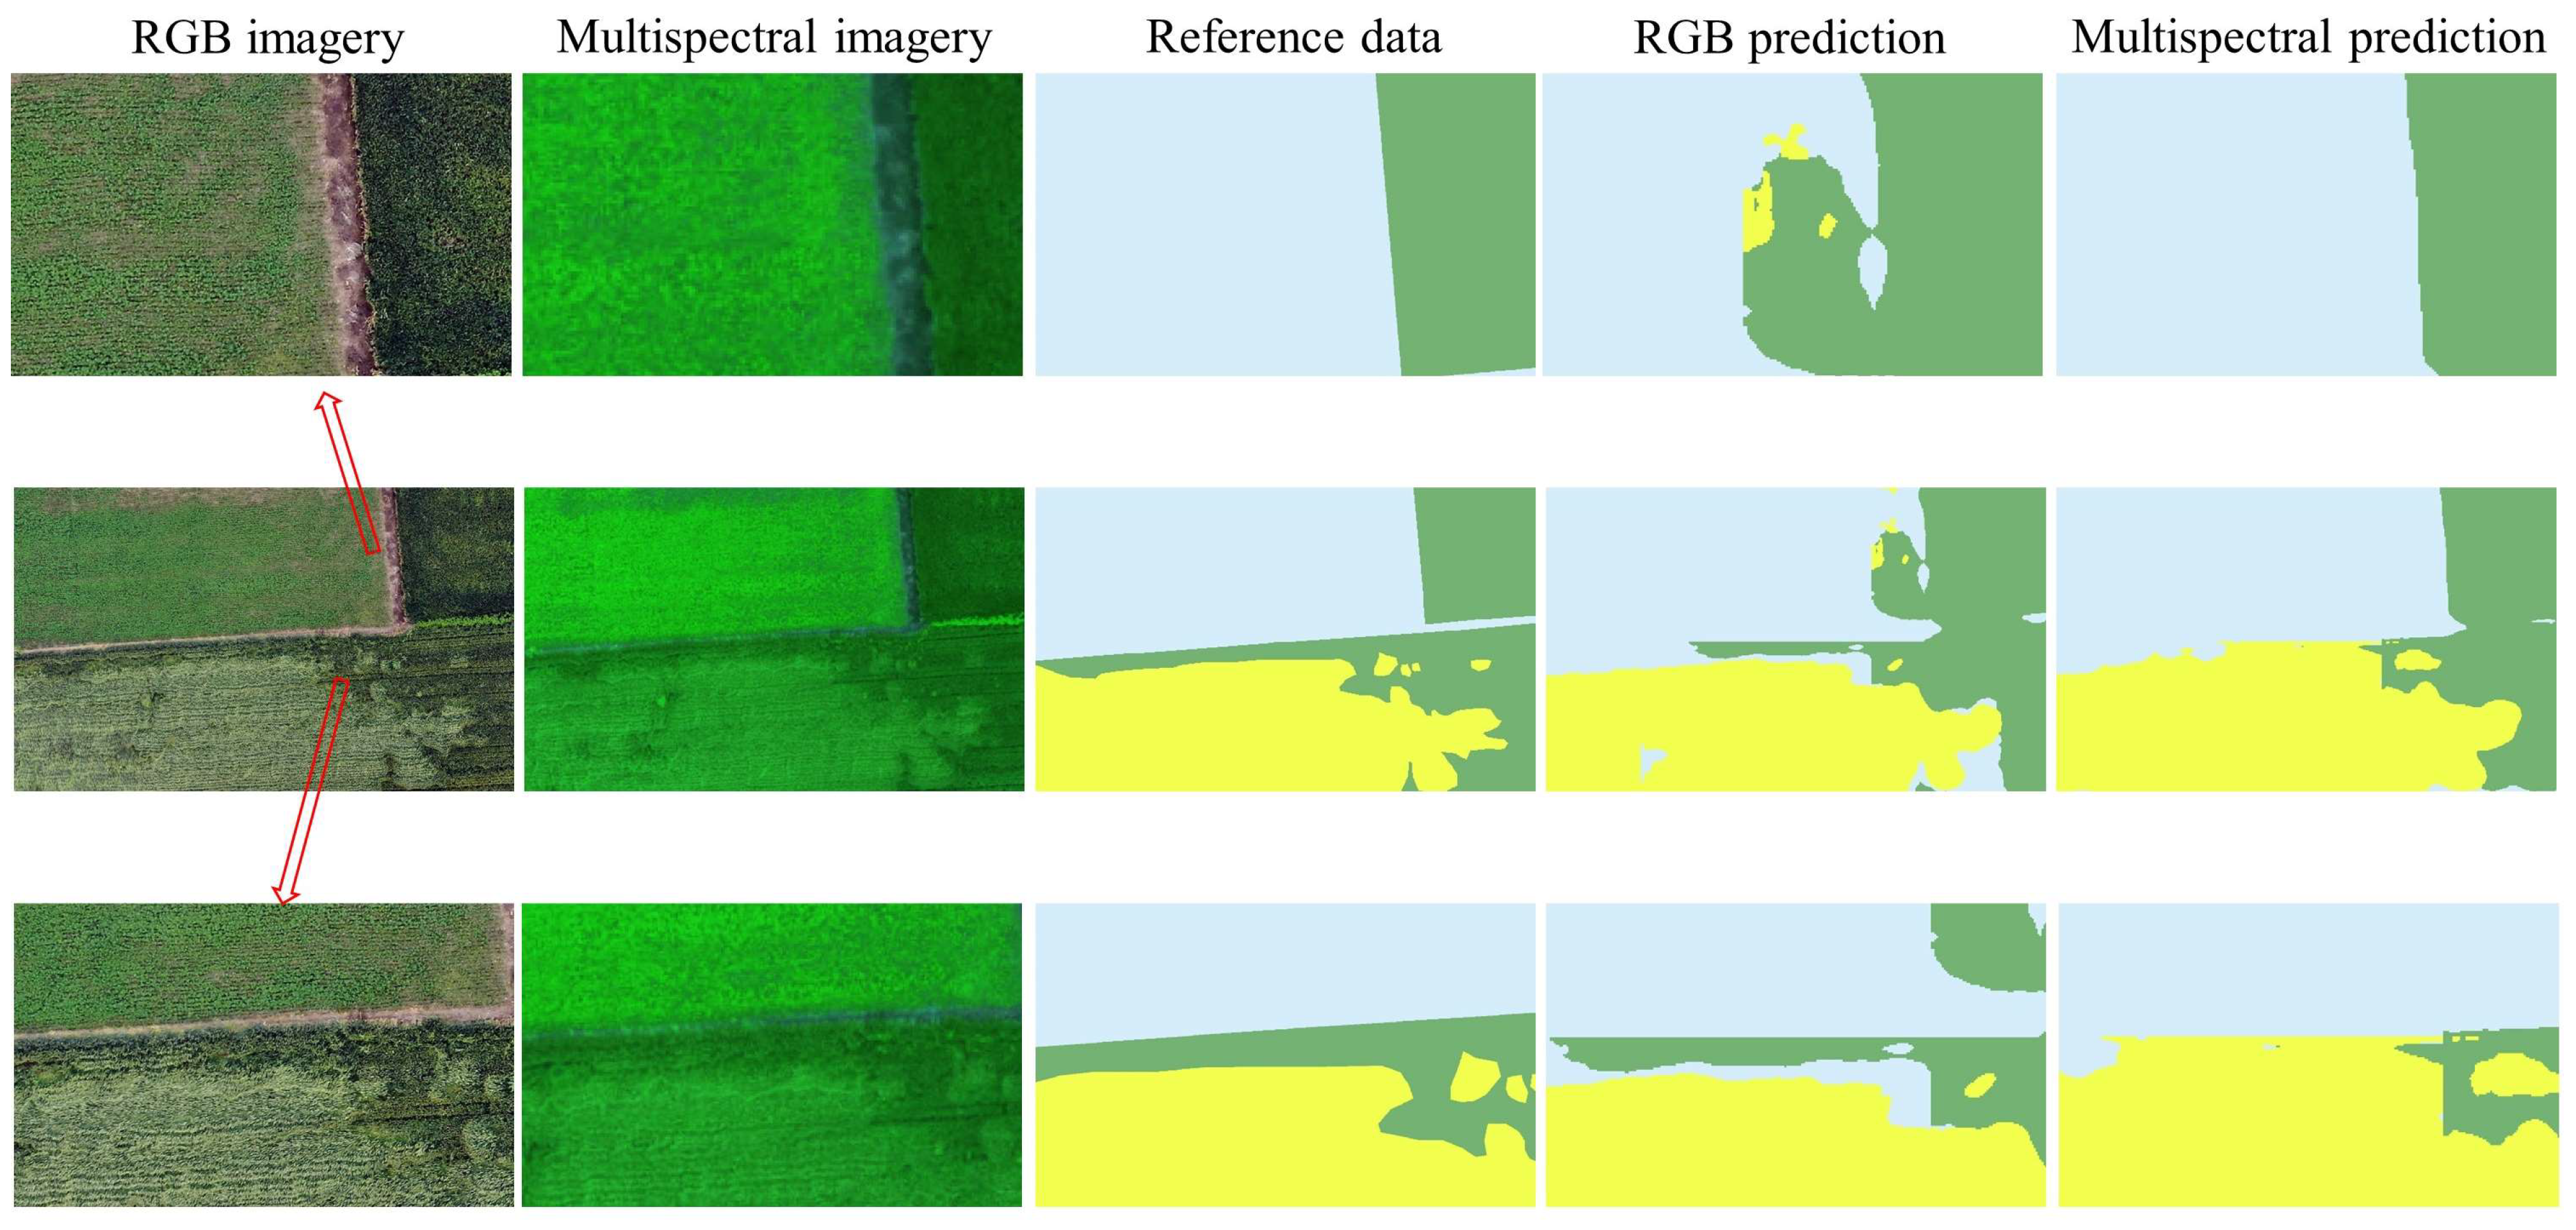
The findings indicated that both types of remote sensing image data could be utilized for wheat lodging detection, with the model trained on the RGB dataset outperforming the model trained on the multispectral dataset. This observation aligns with the findings of a study conducted by Zhao et al., where the U-net model accurately detected rice lodging using vegetation indices extracted from both RGB and multispectral data, with the model trained on the RGB dataset yielding superior results [
35]. Although the multispectral dataset offers richer spectral information, it also introduces additional noise and interference, thereby complicating image processing and feature extraction. Consequently, the multispectral dataset may exhibit a higher false positive rate compared to the model trained on the RGB dataset, leading to decreased accuracy. However, the multispectral dataset can provide supplementary information that enables the accurate detection of certain unidentified instances of wheat lodging, thereby enhancing the recall rate. In practical applications, a higher recall rate signifies closer proximity between the detected wheat lodging area and the actual one, arming farmers with more precise and effective information-based support to safeguard crop growth and yields; multispectral remote sensing data boast their own merits in practical applications. Both types of remote sensing images considered in the study offer advantages in terms of cost-effectiveness, a large coverage area, and operational efficiency, effectively addressing the practical requirements of wheat lodging detection.
5.3. Effect of Different Frameworks on Wheat Lodging Recognition Accuracy
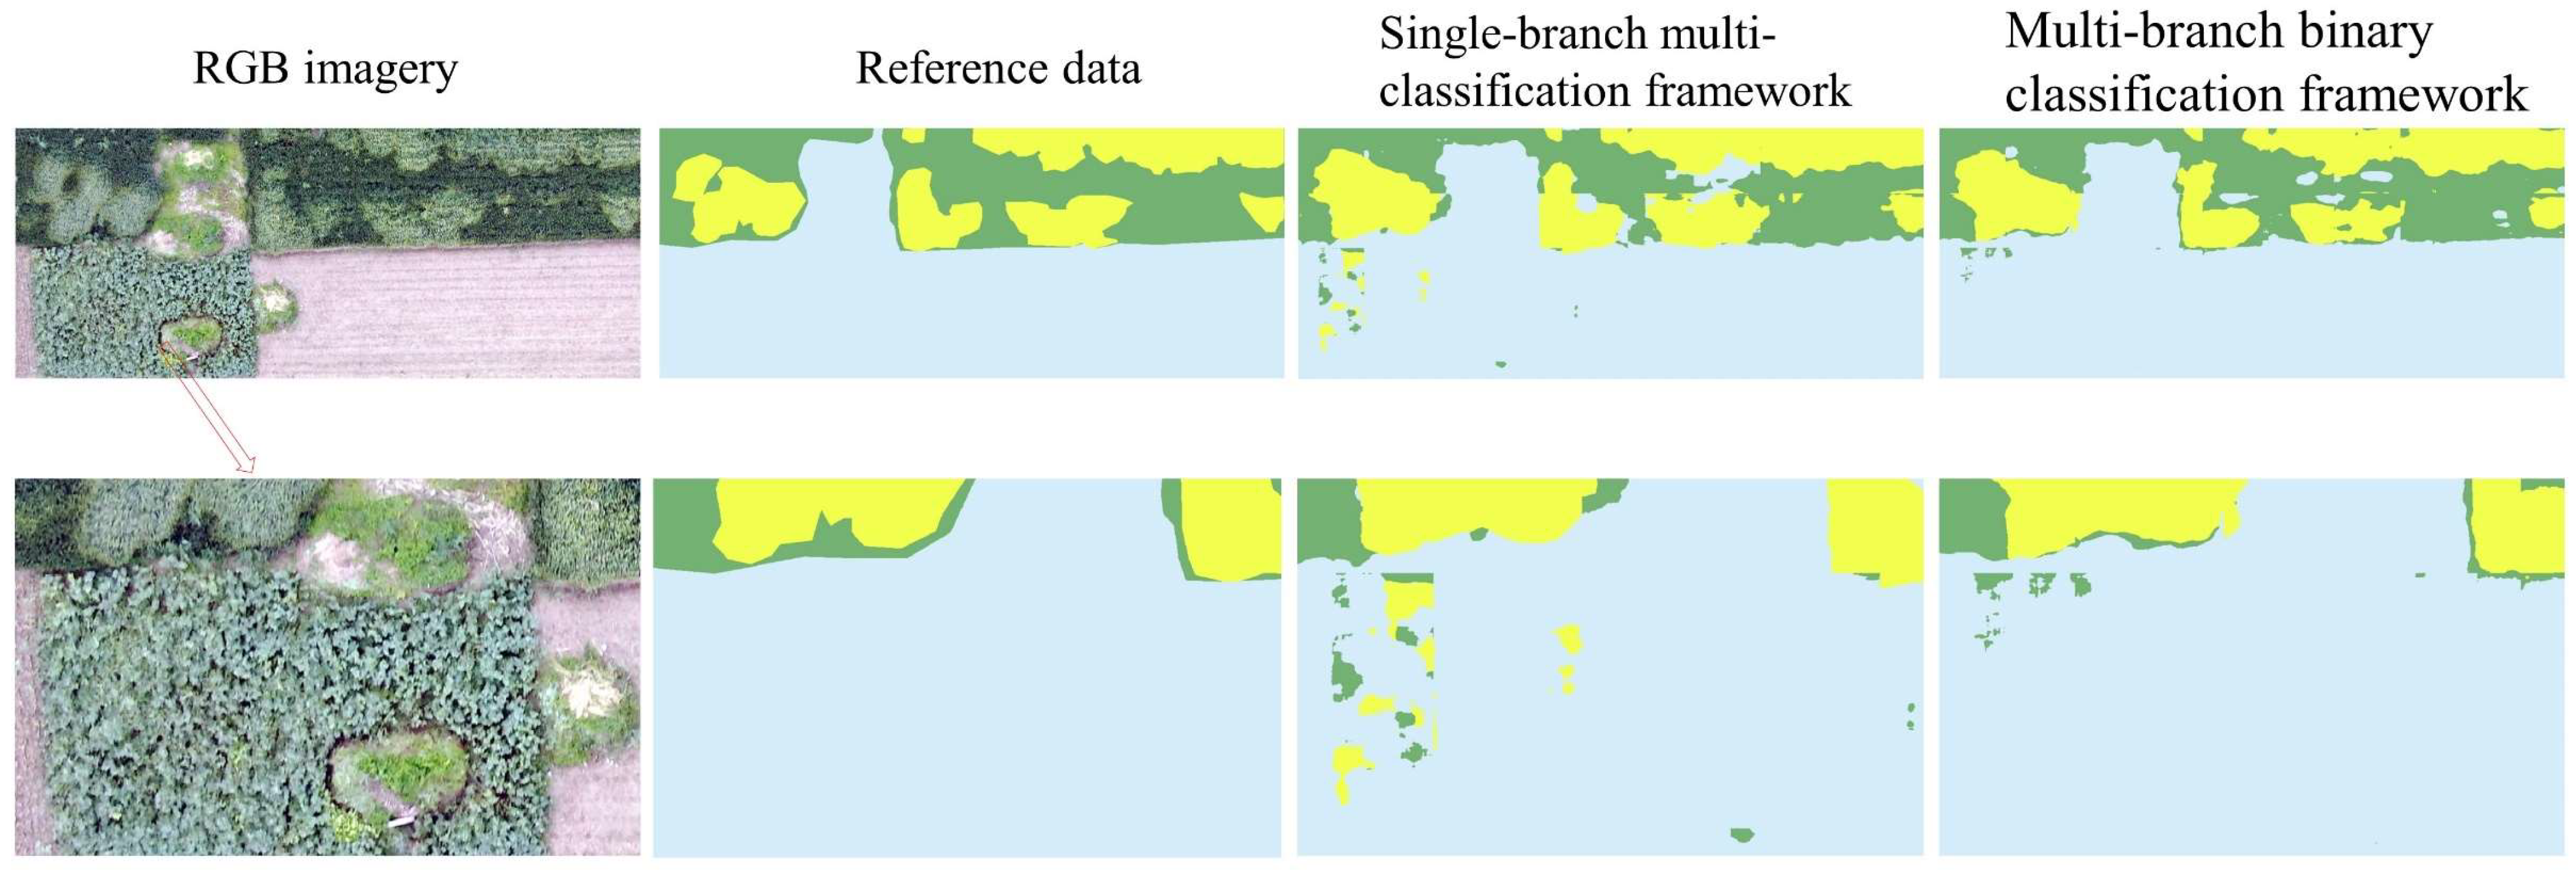
The experimental results demonstrated that the adoption of a multi-branch binary classification framework enhanced the model’s performance and area extraction accuracy. Notably, the multi-branch binary classification framework exhibited superior outcomes when confronted with non-equilibrium datasets, which has significant implications for wheat lodging detection. Given the scarcity of wheat lodging samples relative to healthy wheat samples and the presence of weeds and other plants with spectral and textural similarities to wheat lodging, optimizing a single-branch multi-classification framework model to a multi-branch binary classification framework model becomes imperative for simplifying classification complexity. A related study conducted by Wen et al. revealed that leveraging class-specific subnetworks for classification, each dedicated to a distinct class, enabled more accurate segmentation and classification while reducing competition among different classes, thereby enhancing the model performance [
36].
5.4. Identification of Wheat Lodging Areas
The accurate determination of wheat lodging in various area ranges was achieved using the raster transect function of ArcGIS10.7. The experimental results (
Table 6) indicated that, while the optimal model exhibited relatively high accuracy when detecting the total area of wheat lodging, significant errors arose when identifying small lodging areas, specifically those within the ranges of [0.01, 1], [1, 5], and [5, 10].
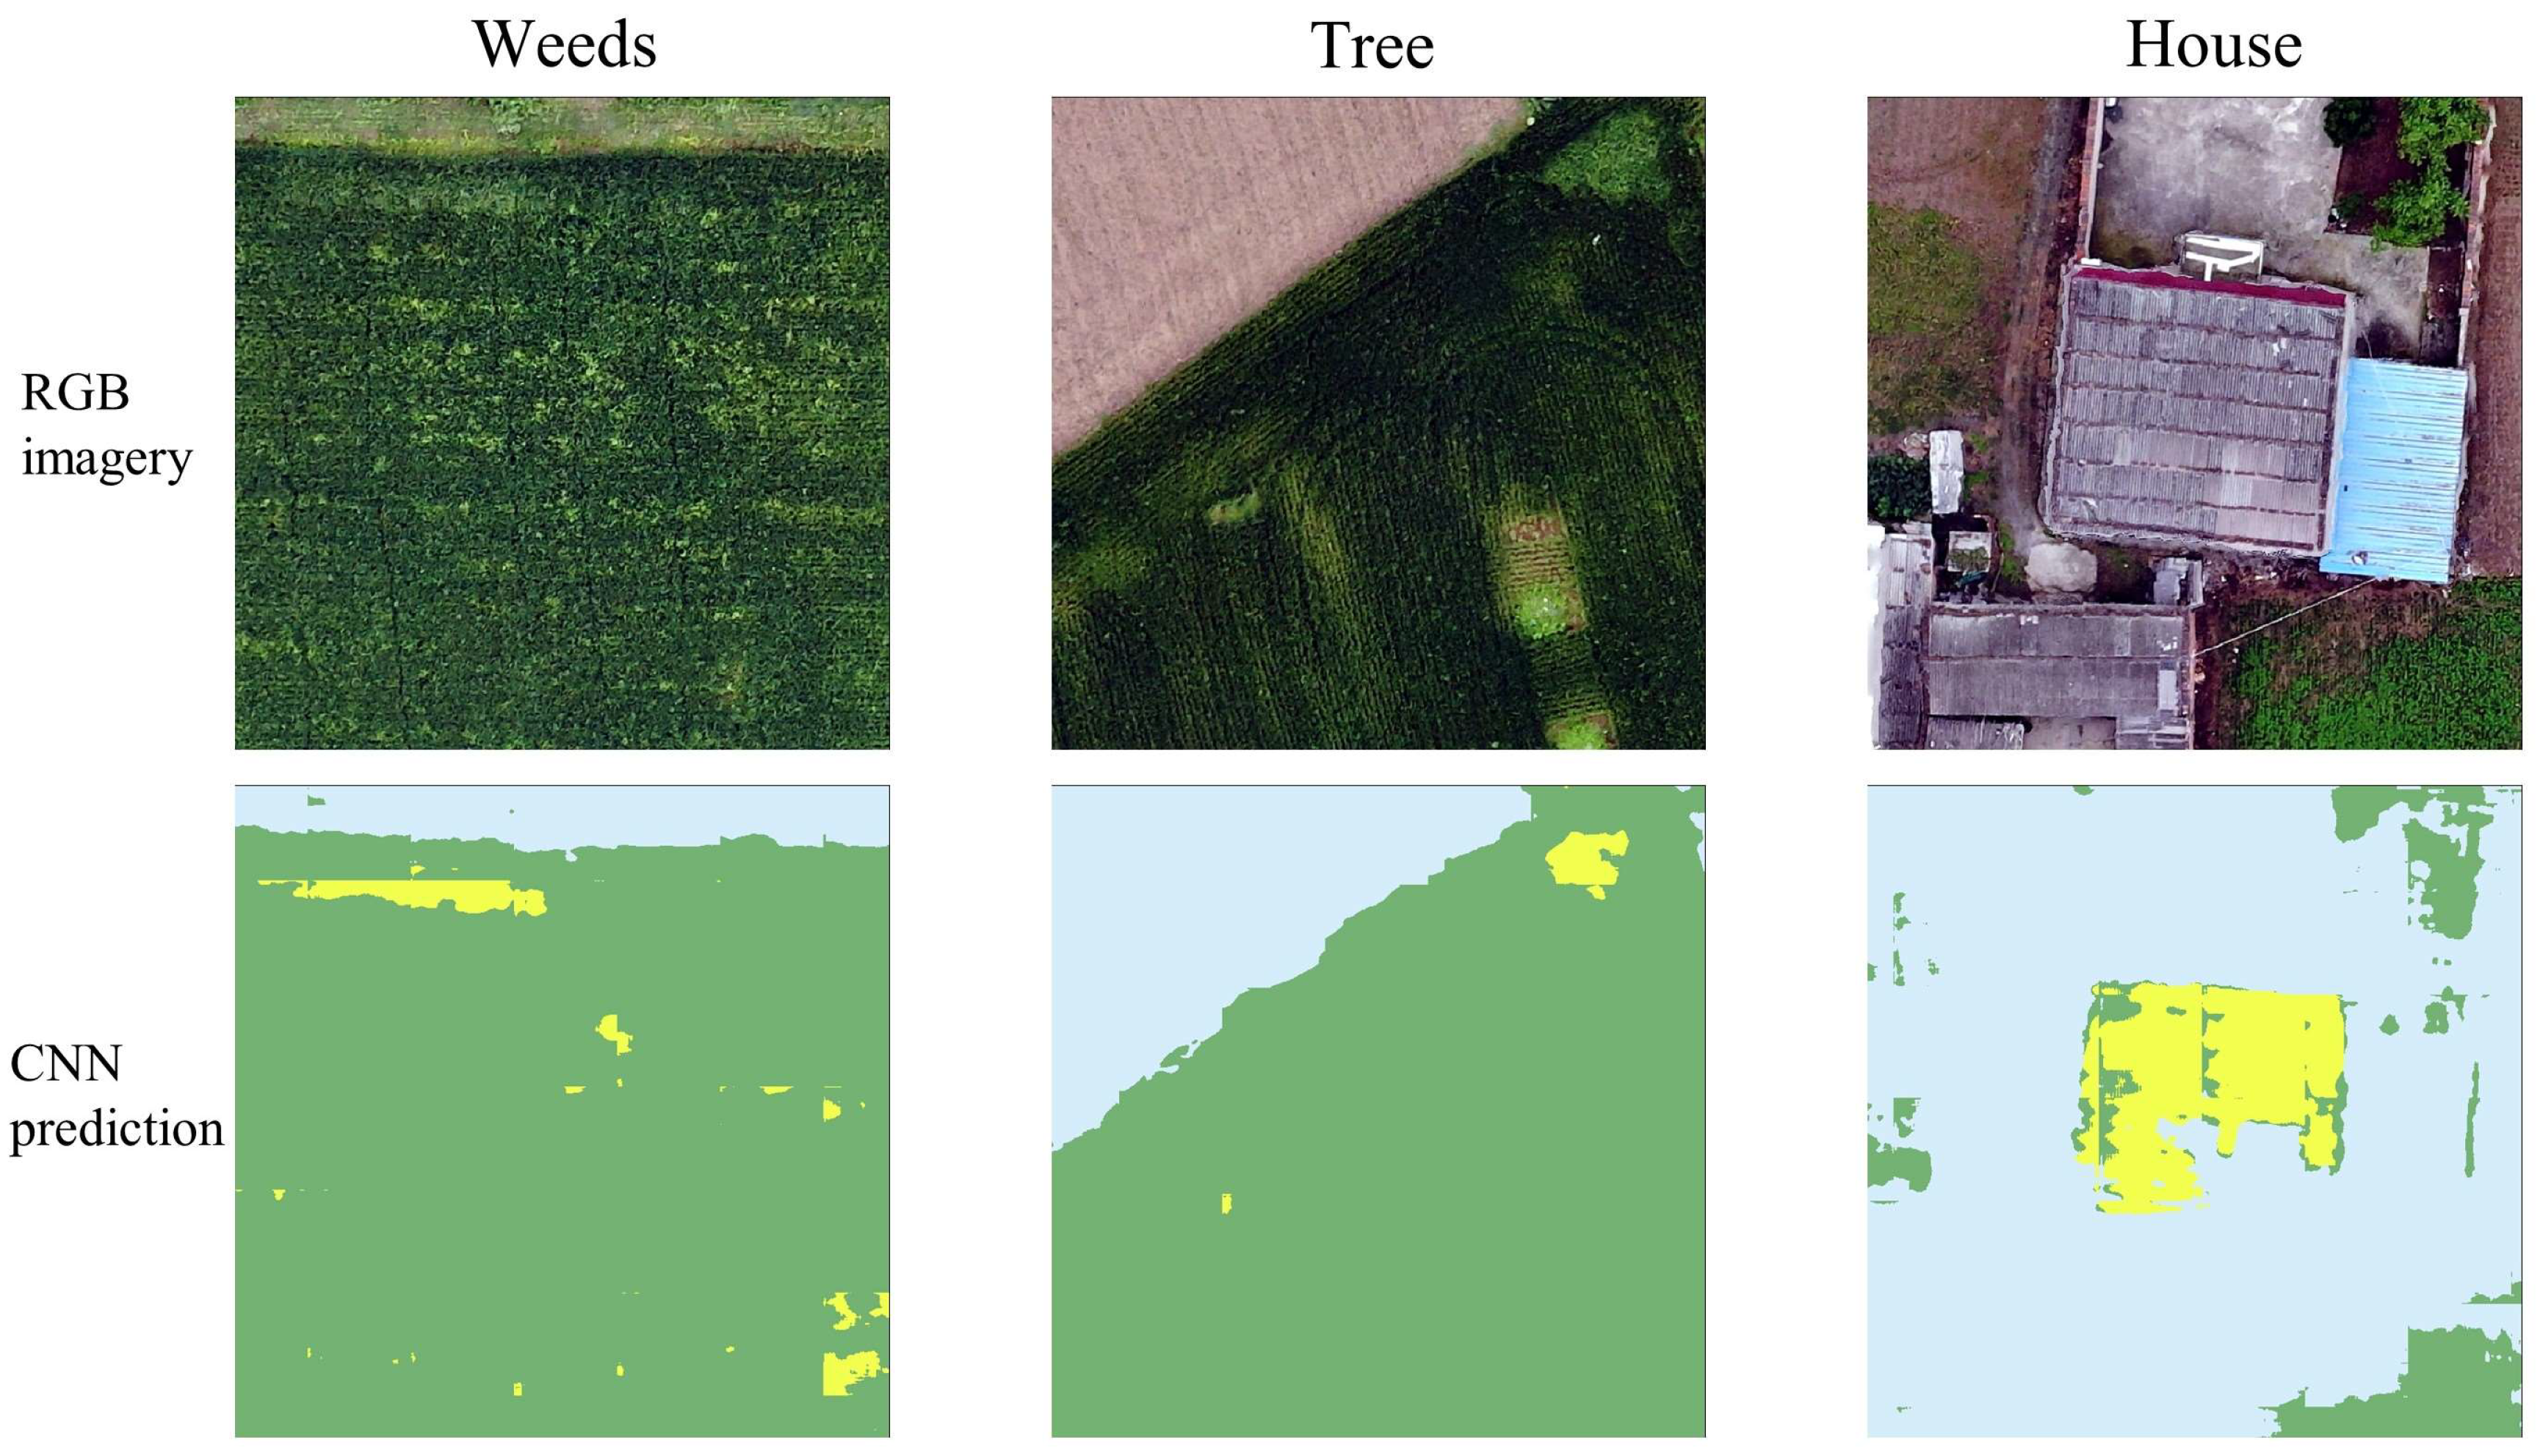
By conducting a comparative analysis between the original image and the detection image (
Figure 9), it became evident that certain instances of weeds, trees, and houses were erroneously classified as wheat lodging during the detection process. This misclassification could be attributed to the similarities in the spectral information between these objects and wheat lodging, an issue compounded by the dataset’s extensive range of land-cover types, which introduces complexity to the classification task. In a study conducted by Liu et al., a supervised classification approach demonstrated that favorable performance was achieved in wheat lodging detection by incorporating spectral features, vegetation index features, and texture features [
37]. Building upon this research, further model optimization could involve combining spectral features, vegetation index features, and texture features to collectively construct classification features, thereby enhancing the algorithm’s classification accuracy and mitigating misclassifications of other objects, such as wheat lodging. By employing such an approach, the accurate detection of wheat lodging areas could be achieved more reliably.
5.5. Effect of Different External Environments on the Accuracy of Wheat Lodging Recognition
The Deeplabv3+ model, with its end-to-end feature, has the advantage of focusing solely on the task’s input and output without the need for intricate feature extraction from the input data. This facilitates swift iterations in processing the task, distinguishing it from traditional machine learning algorithms. In contrast to previous studies, this research included varying lighting conditions, diverse wheat varieties, different growth periods within the study area, and a range of land-cover types. Additionally, data augmentation techniques were applied to the training dataset, resulting in a more heterogeneous and diverse dataset. Consequently, the methodology proposed in this study demonstrates strong adaptability to the actual environment, exhibiting good performance even in the presence of complex external factors.
When using the semantic segmentation approach, the lodging class segmentation model showcased exceptional performance, achieving an impressive F1 score of 90.30%. This achievement demonstrates its potential to accurately detect both healthy and wheat lodging areas in expansive farmland encompassing diverse land-cover types, using only consumer-grade RGB data acquired through unmanned aerial vehicles (UAVs) in conjunction with deep learning neural network models.
6. Conclusions
The findings of this study highlighted the superior performance of the Deeplabv3+ model over five alternative semantic segmentation models in terms of recognition accuracy, establishing its suitability for practical wheat lodging detection applications. Training the model using both multispectral and RGB data yielded excellent results, with RGB data proving particularly effective for wheat lodging detection in large-scale wheat fields. The adoption of the multi-branch binary classification framework significantly enhanced the area detection accuracy, particularly in non-equilibrium classes.
In summary, the utilization of consumer-grade UAV-captured ultra-high-resolution RGB images combined with deep neural networks presents a viable approach for accurately detecting wheat lodging under heterogeneous field conditions. This study involved a comprehensive examination of different algorithms, remote sensing data types, and model frameworks within the deep learning neural network model. The extensive experimental results affirm the stability and effectiveness of the proposed deep neural network model in large-scale data scenarios, characterized by varying location conditions, field types, and lighting characteristics. This methodology provides a valuable solution for accurately identifying wheat lodging across extensive areas, with a focus on high efficiency and cost-effectiveness.

 ,
, 


