
MCSPF-Net: A Precipitation Forecasting Method Using Multi-Channel Cloud Observations of FY-4A Satellite by 3D Convolution Neural Network


Abstract
:1. Introduction
2. Data
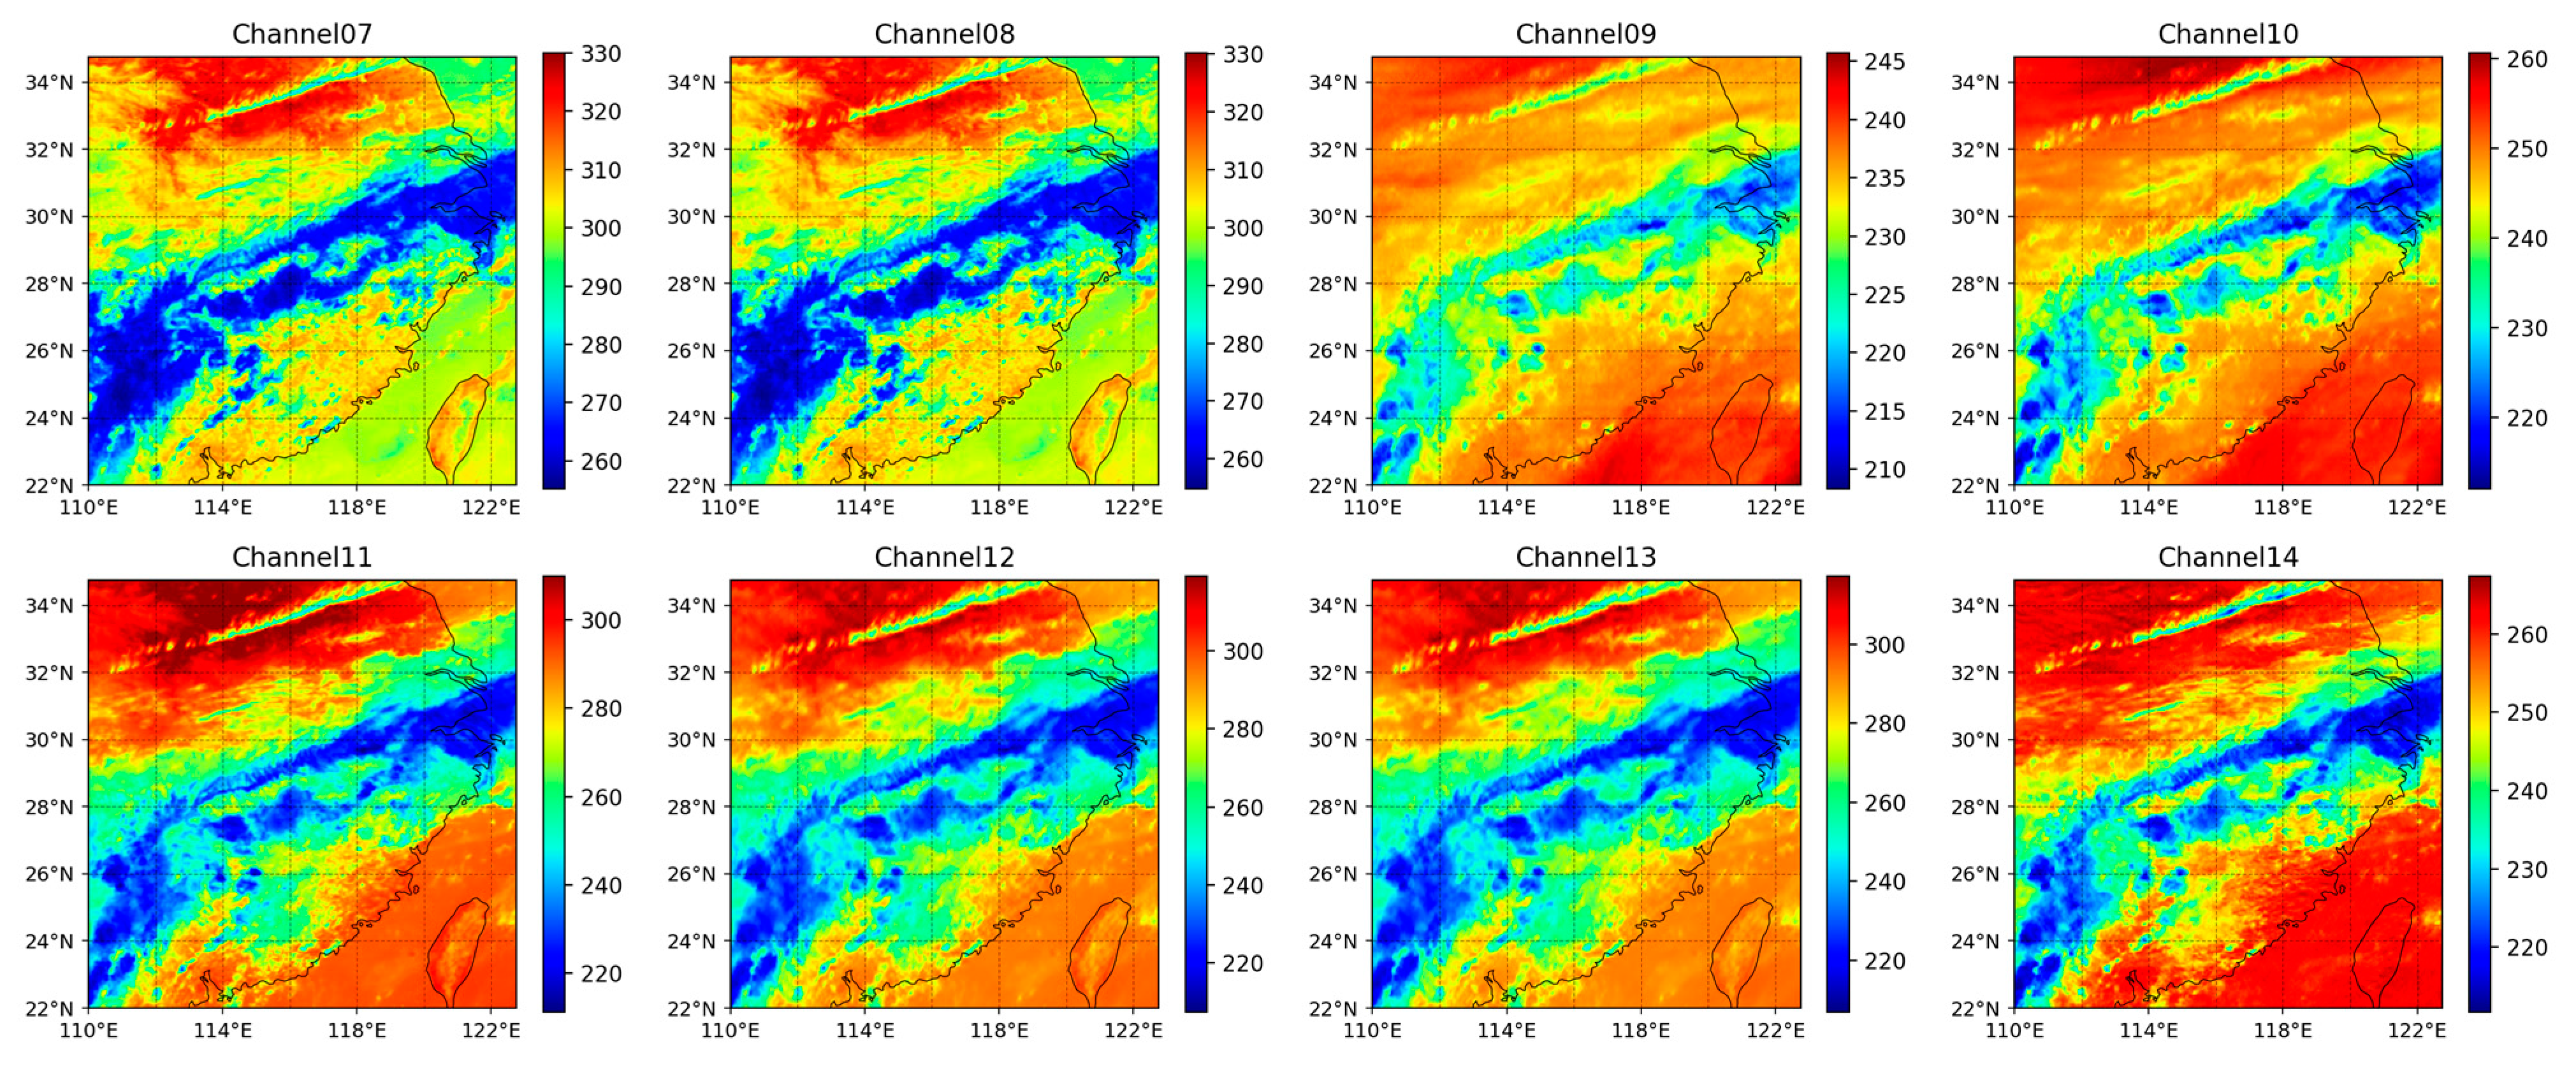
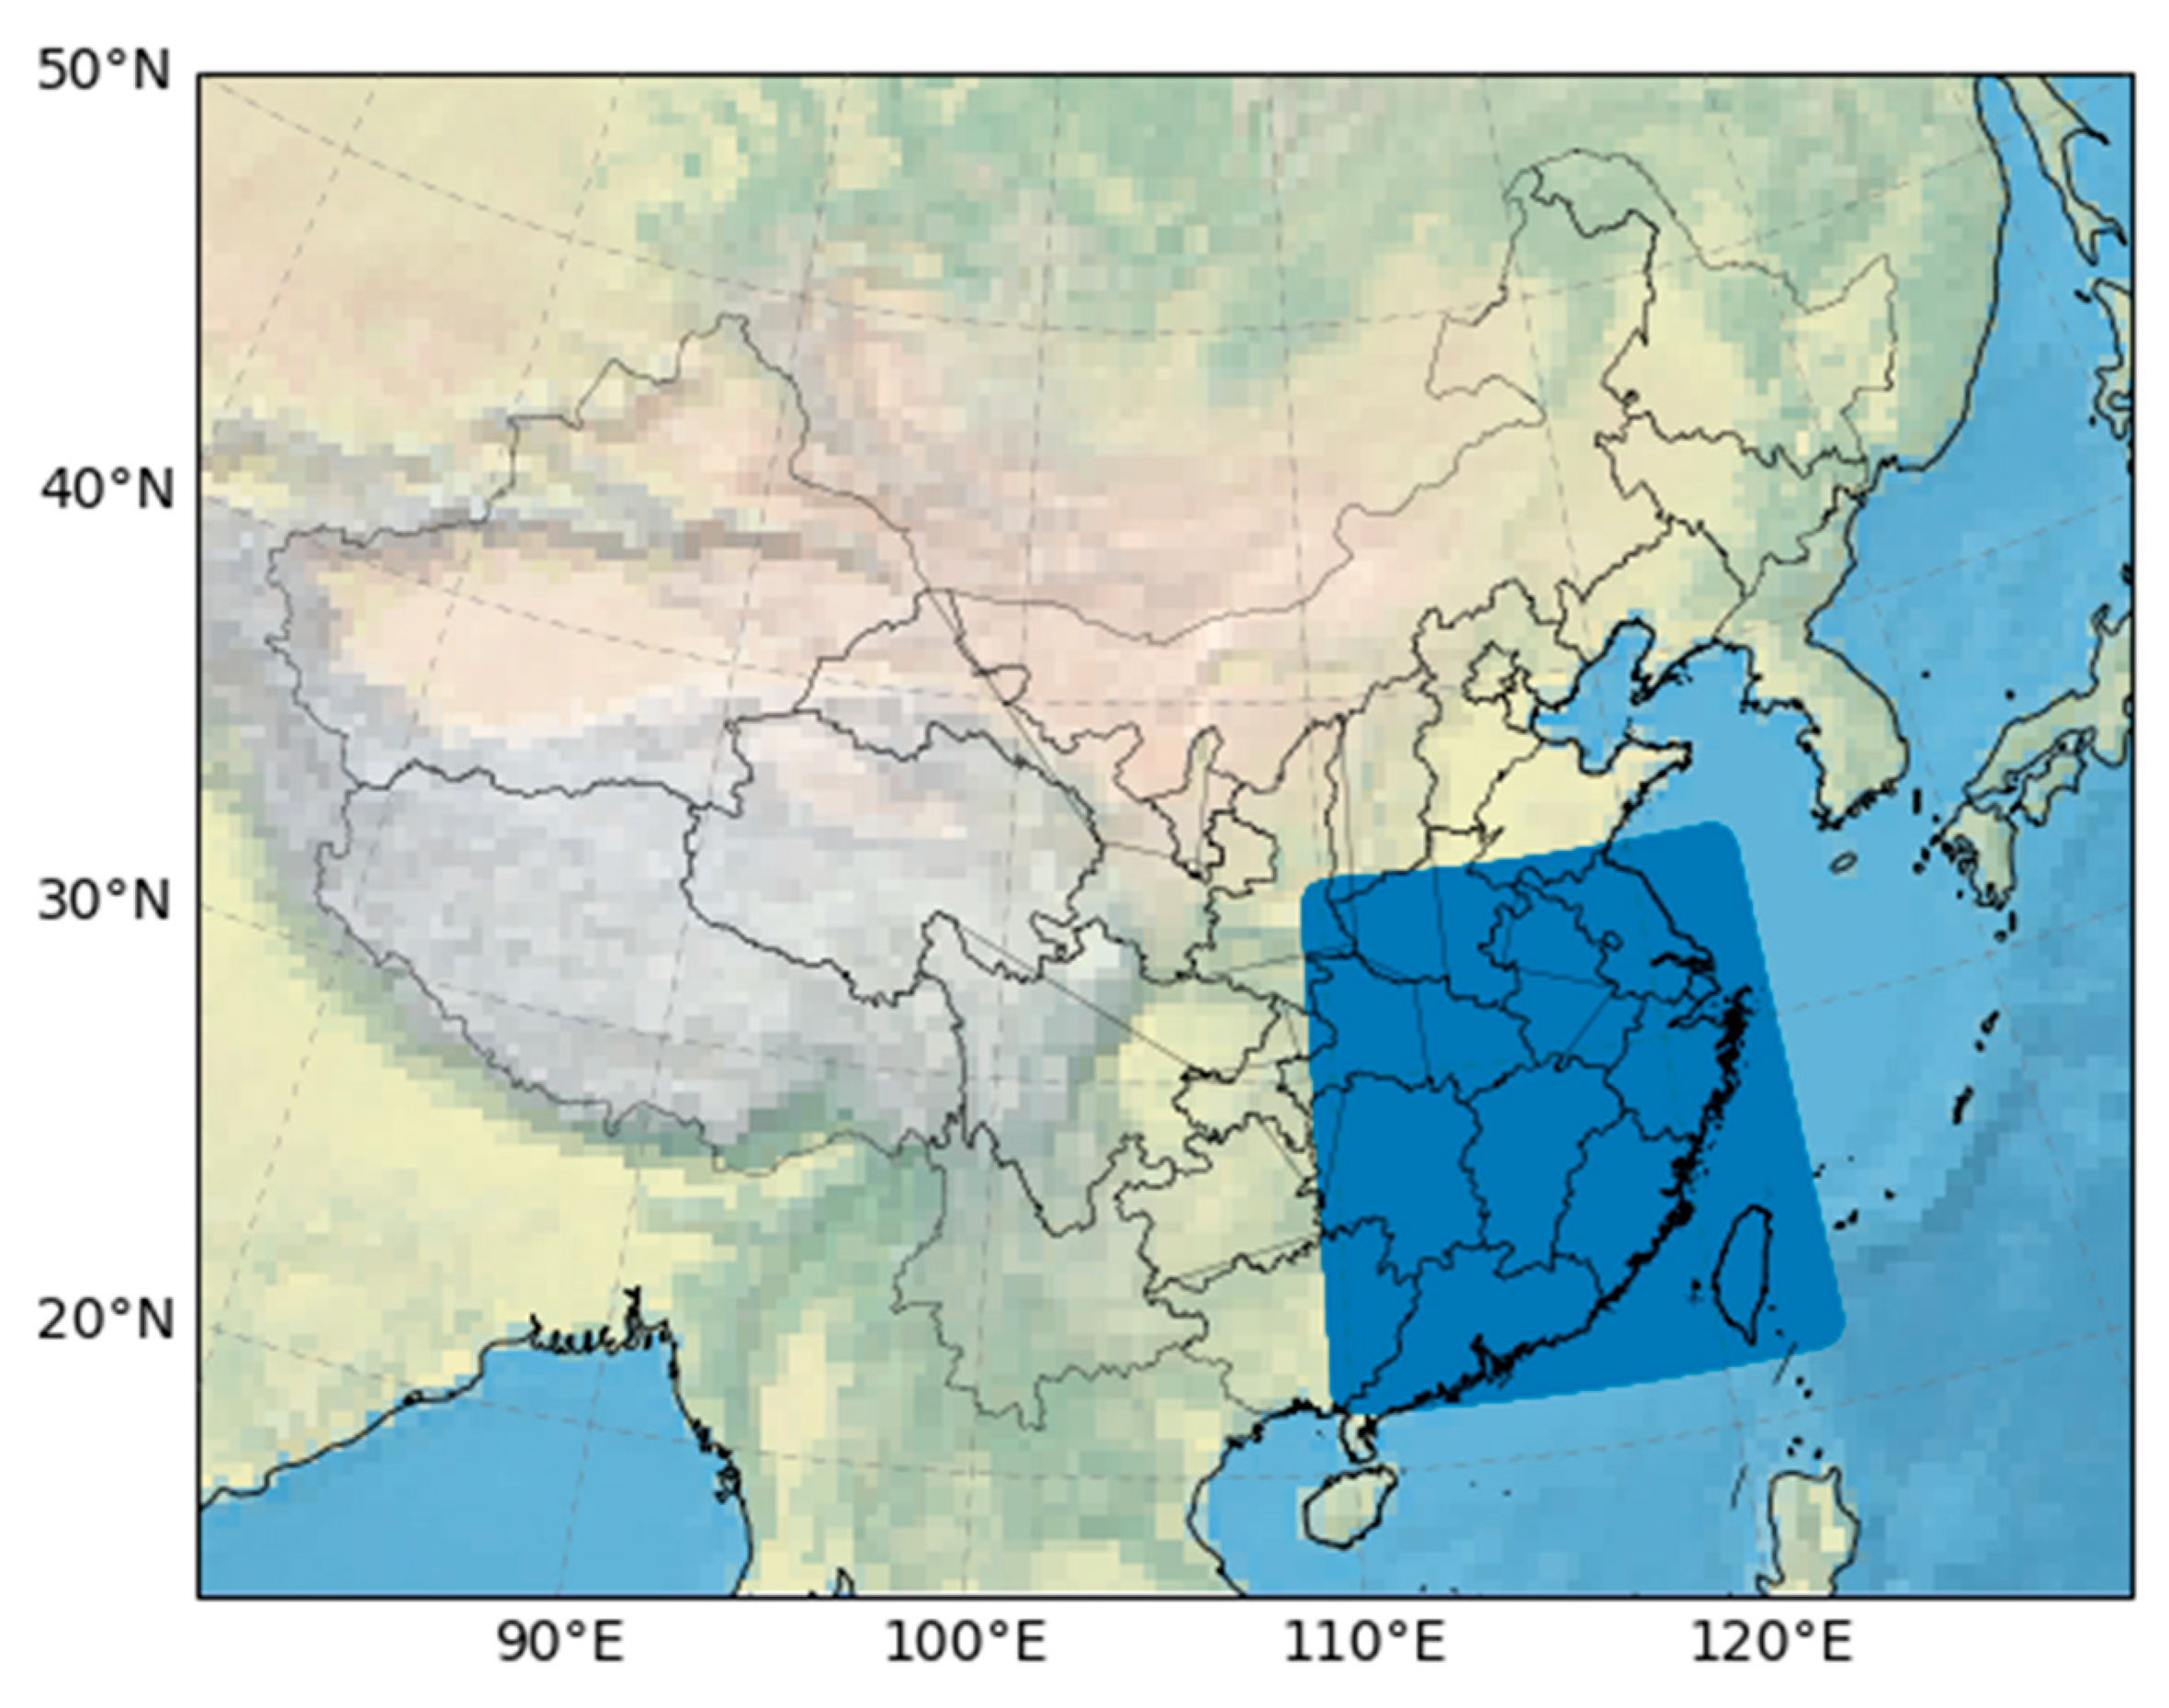
2.1. FY-4A
2.2. Evaluation Data
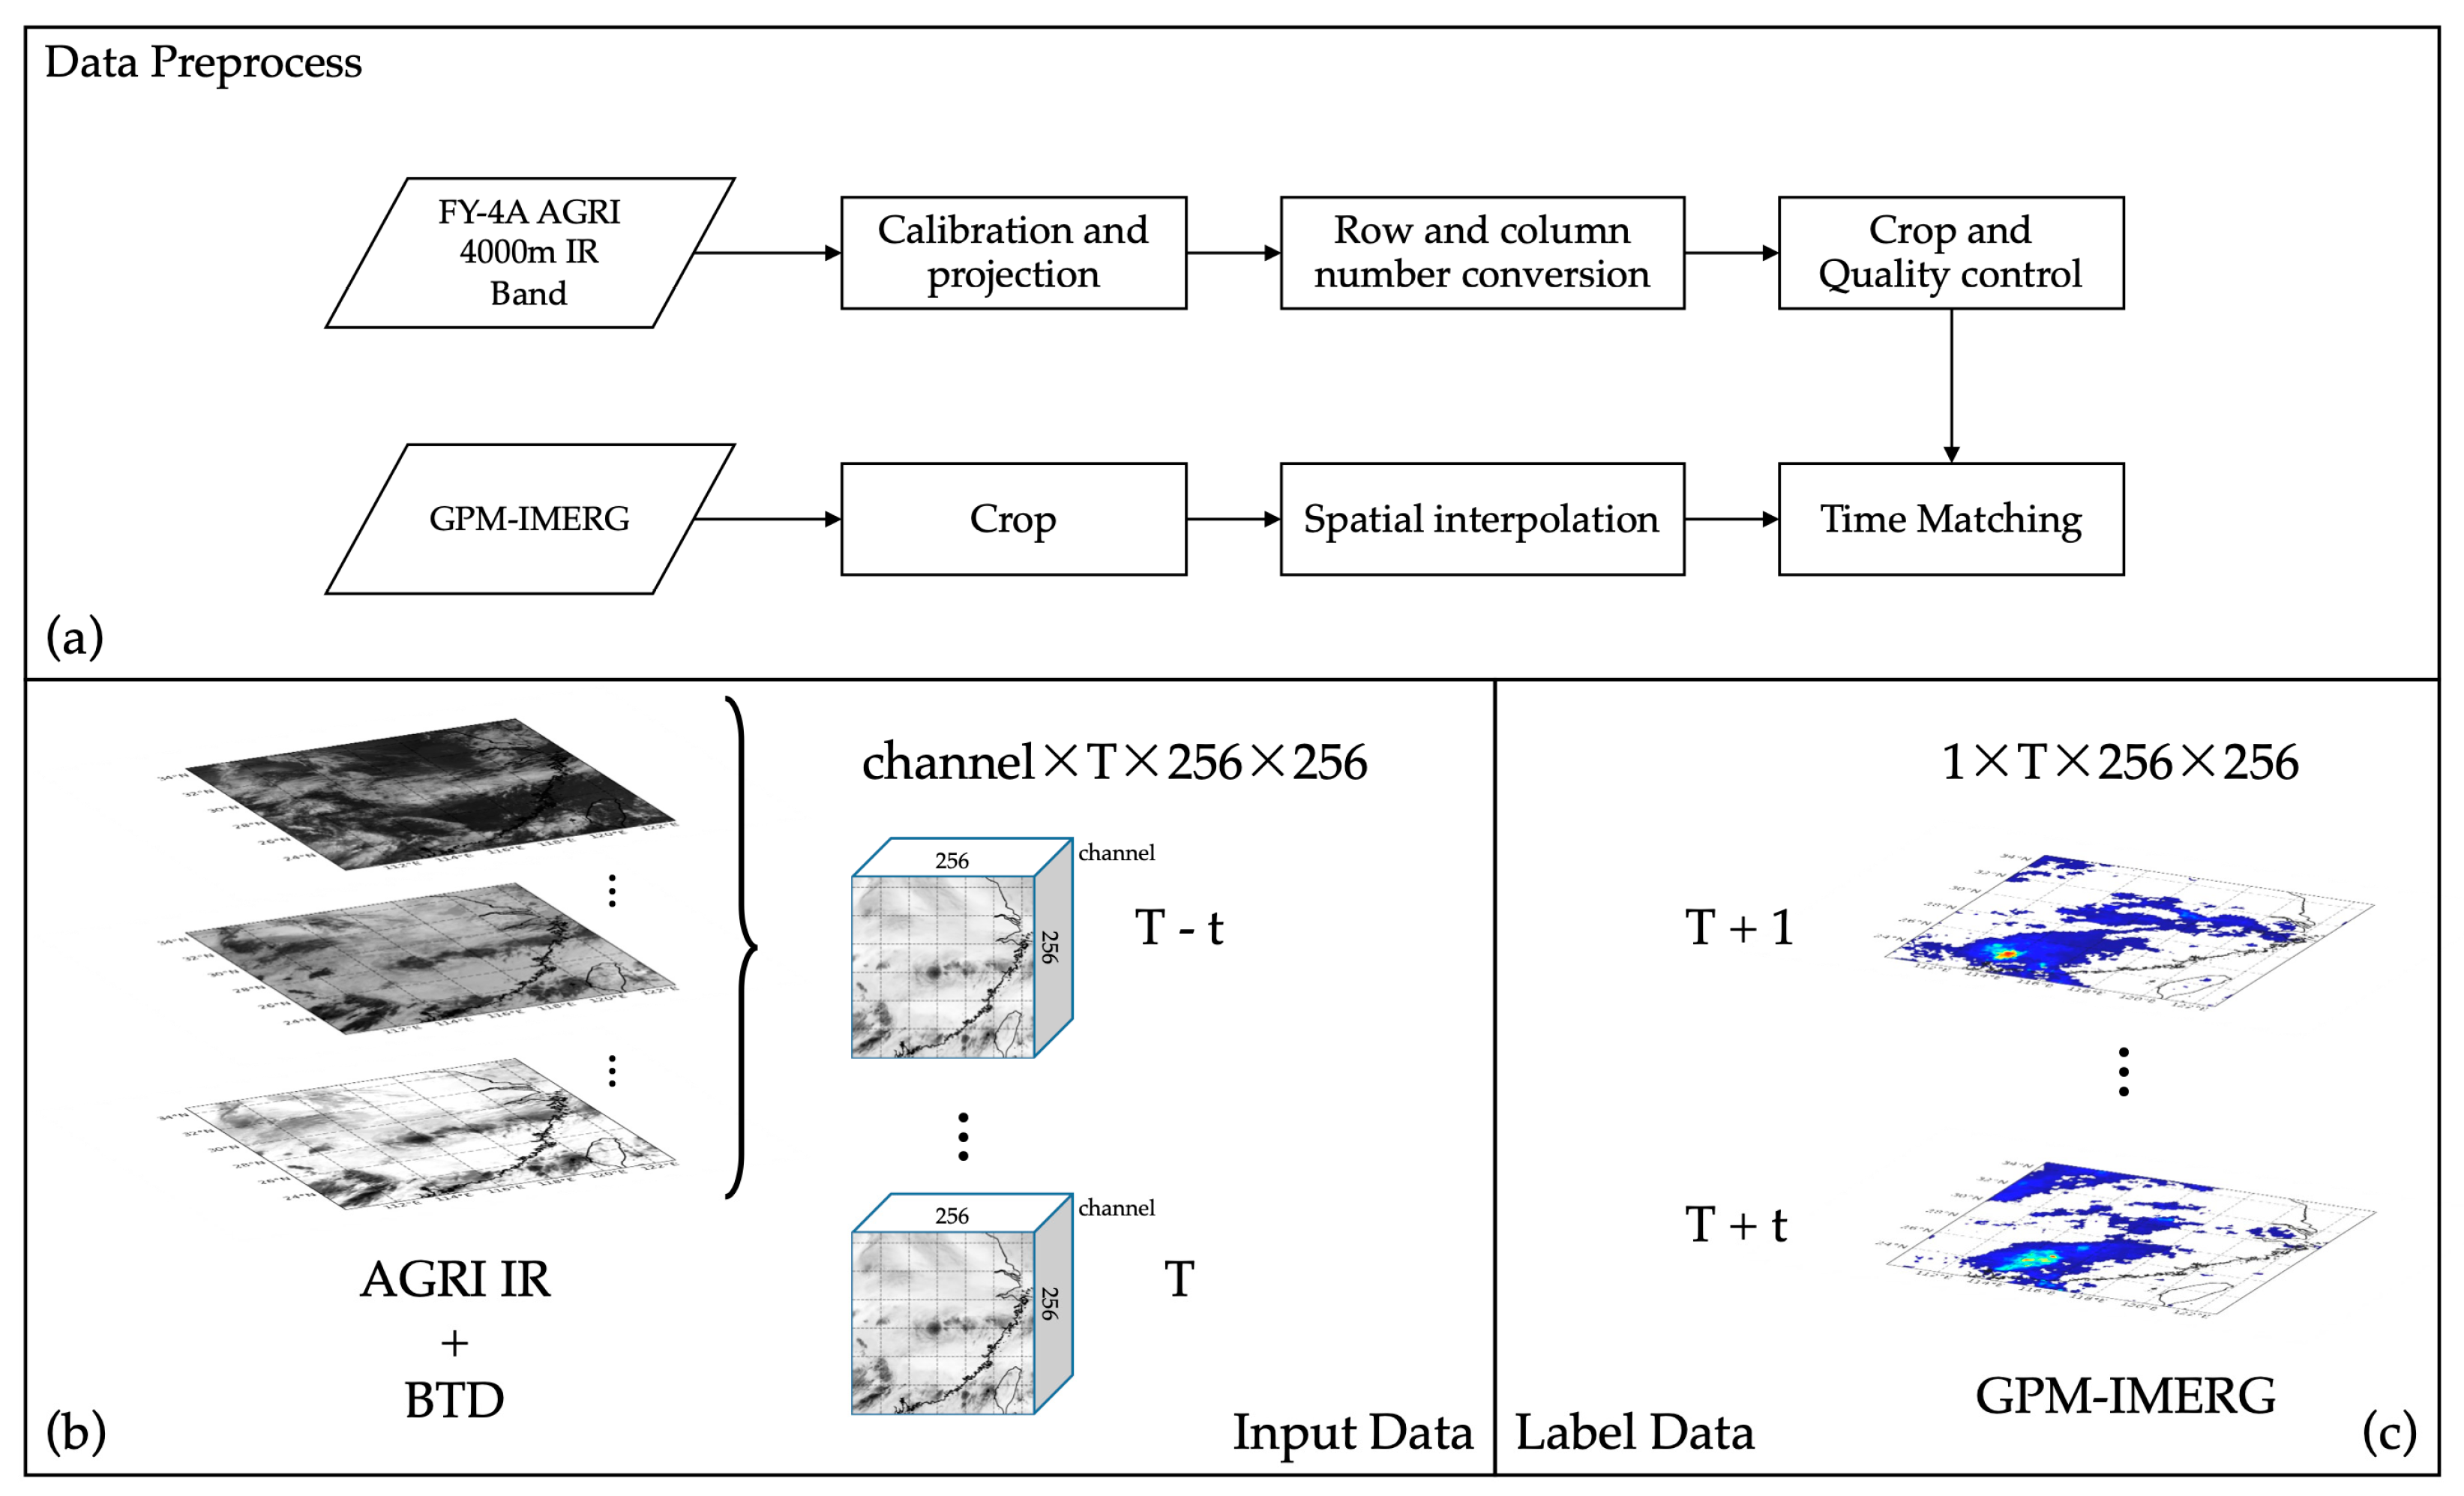
2.3. Data Pre-Processing
3. Method
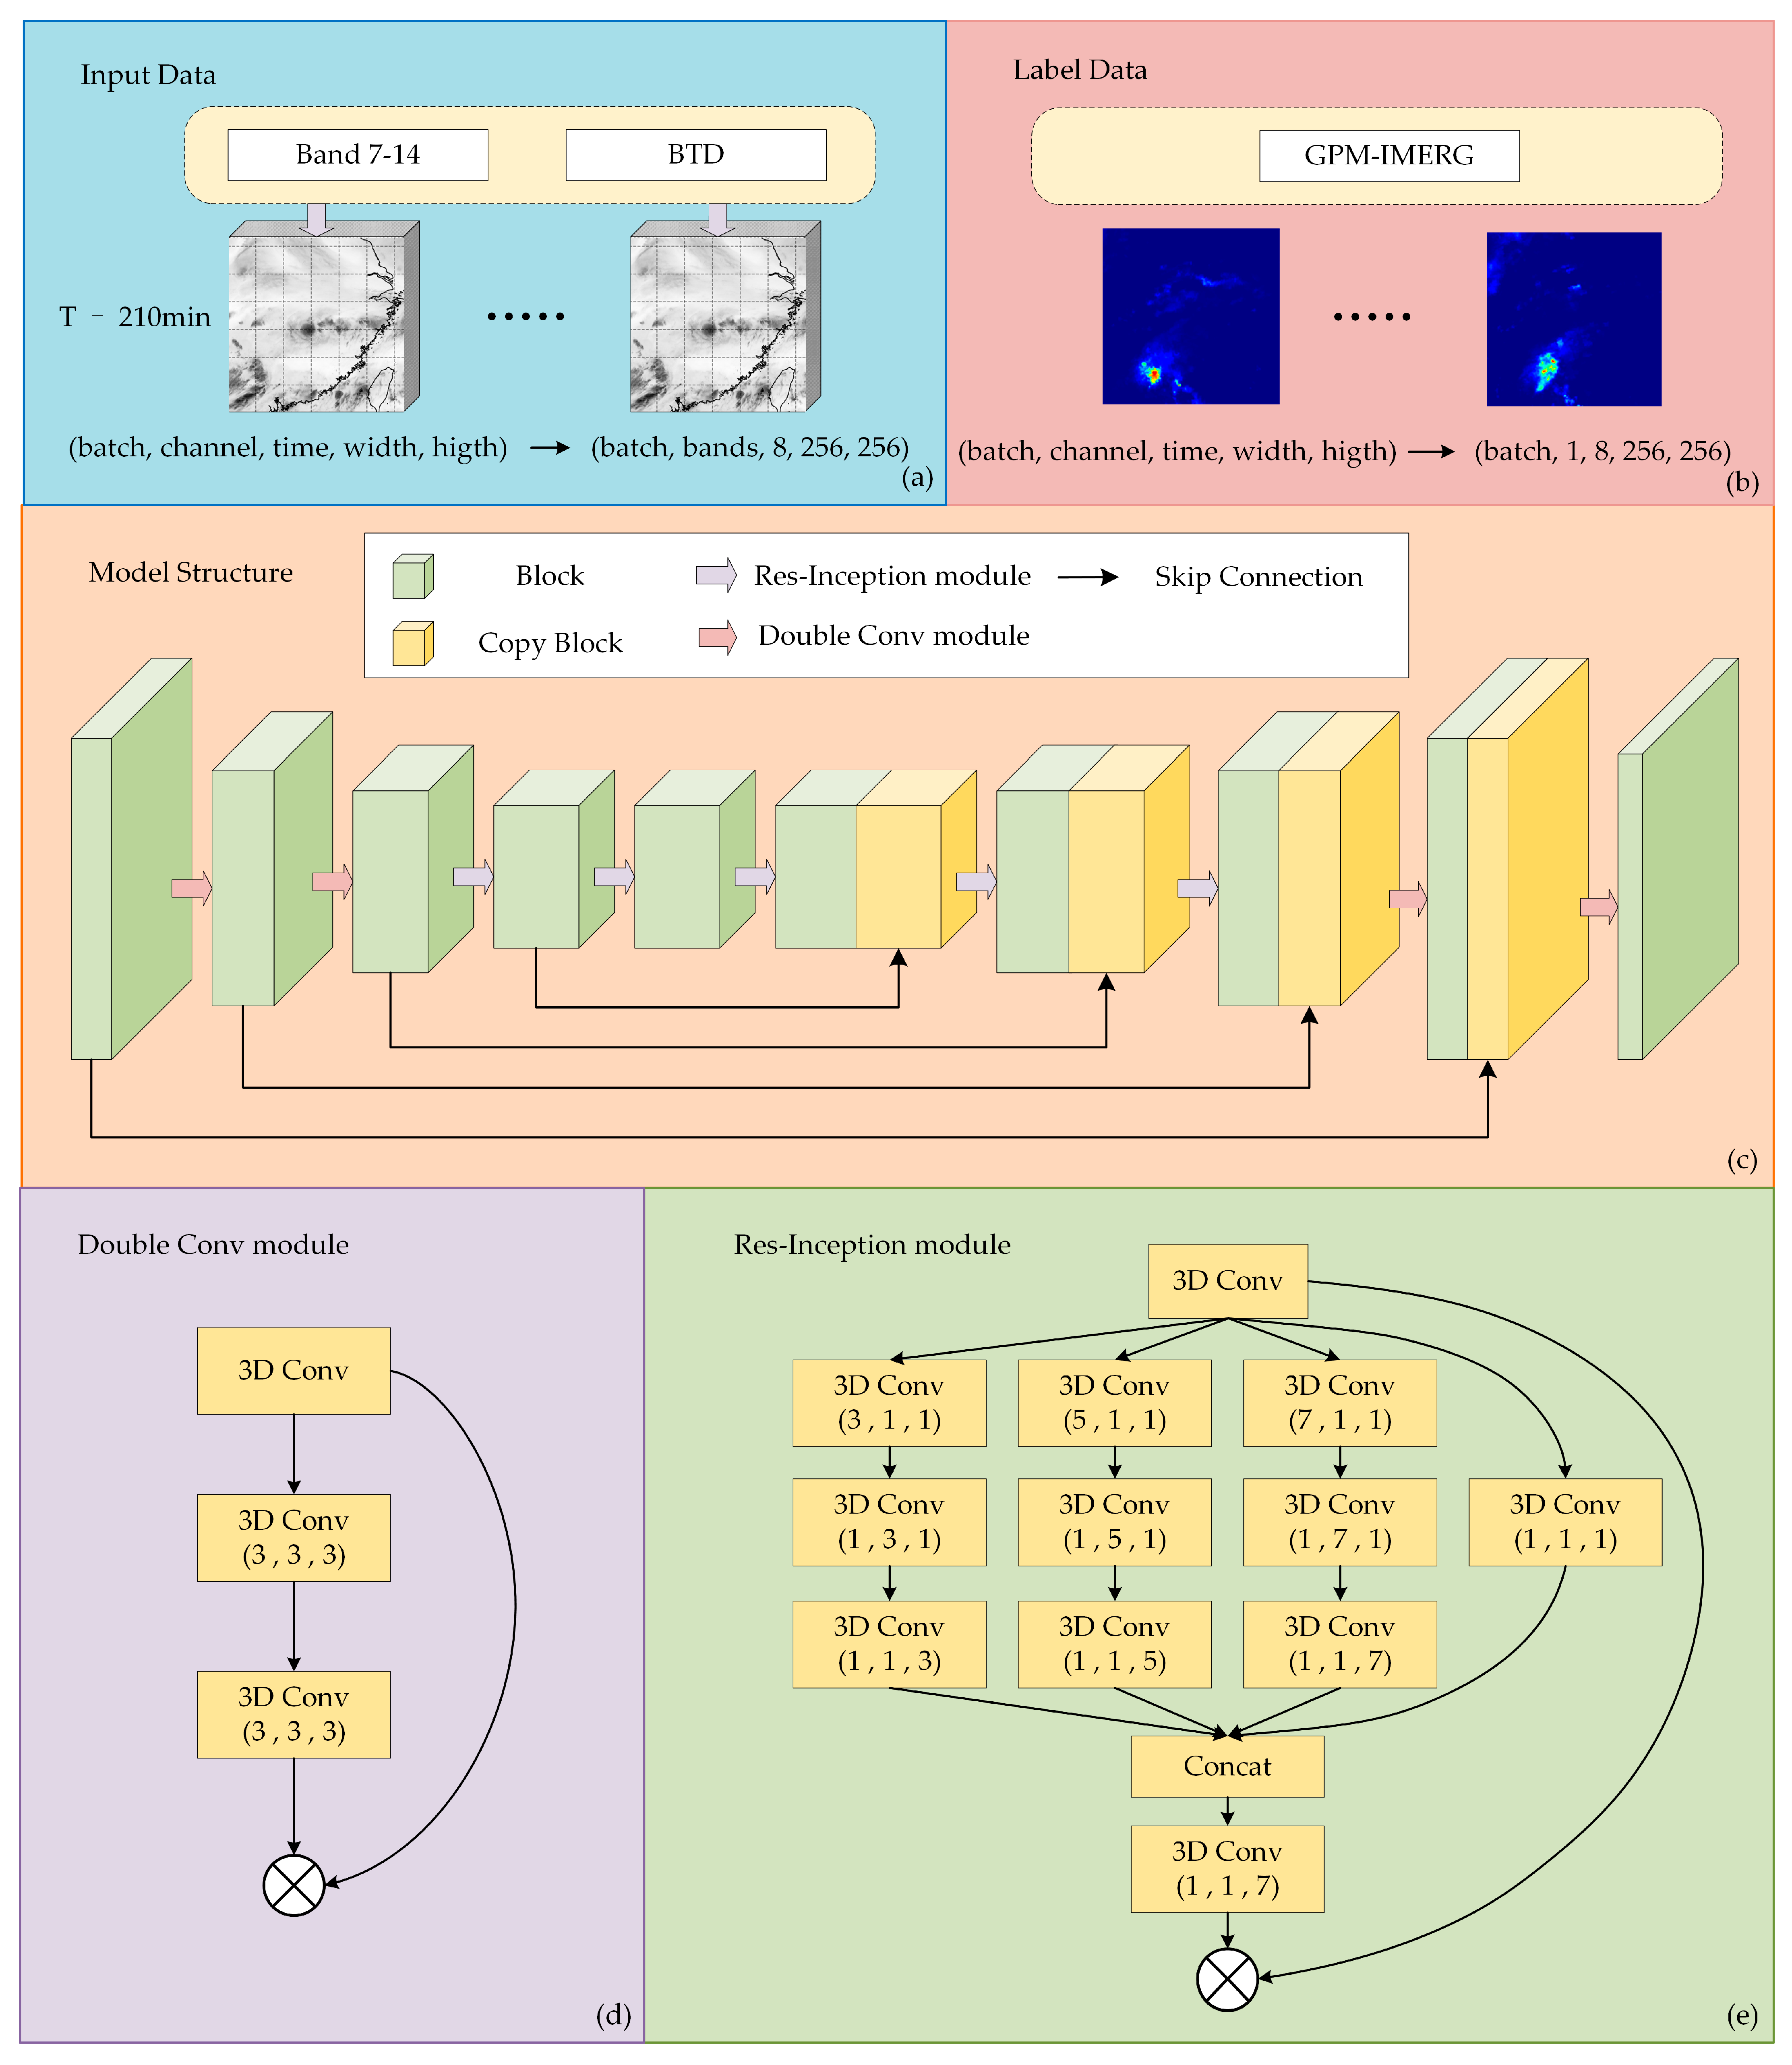
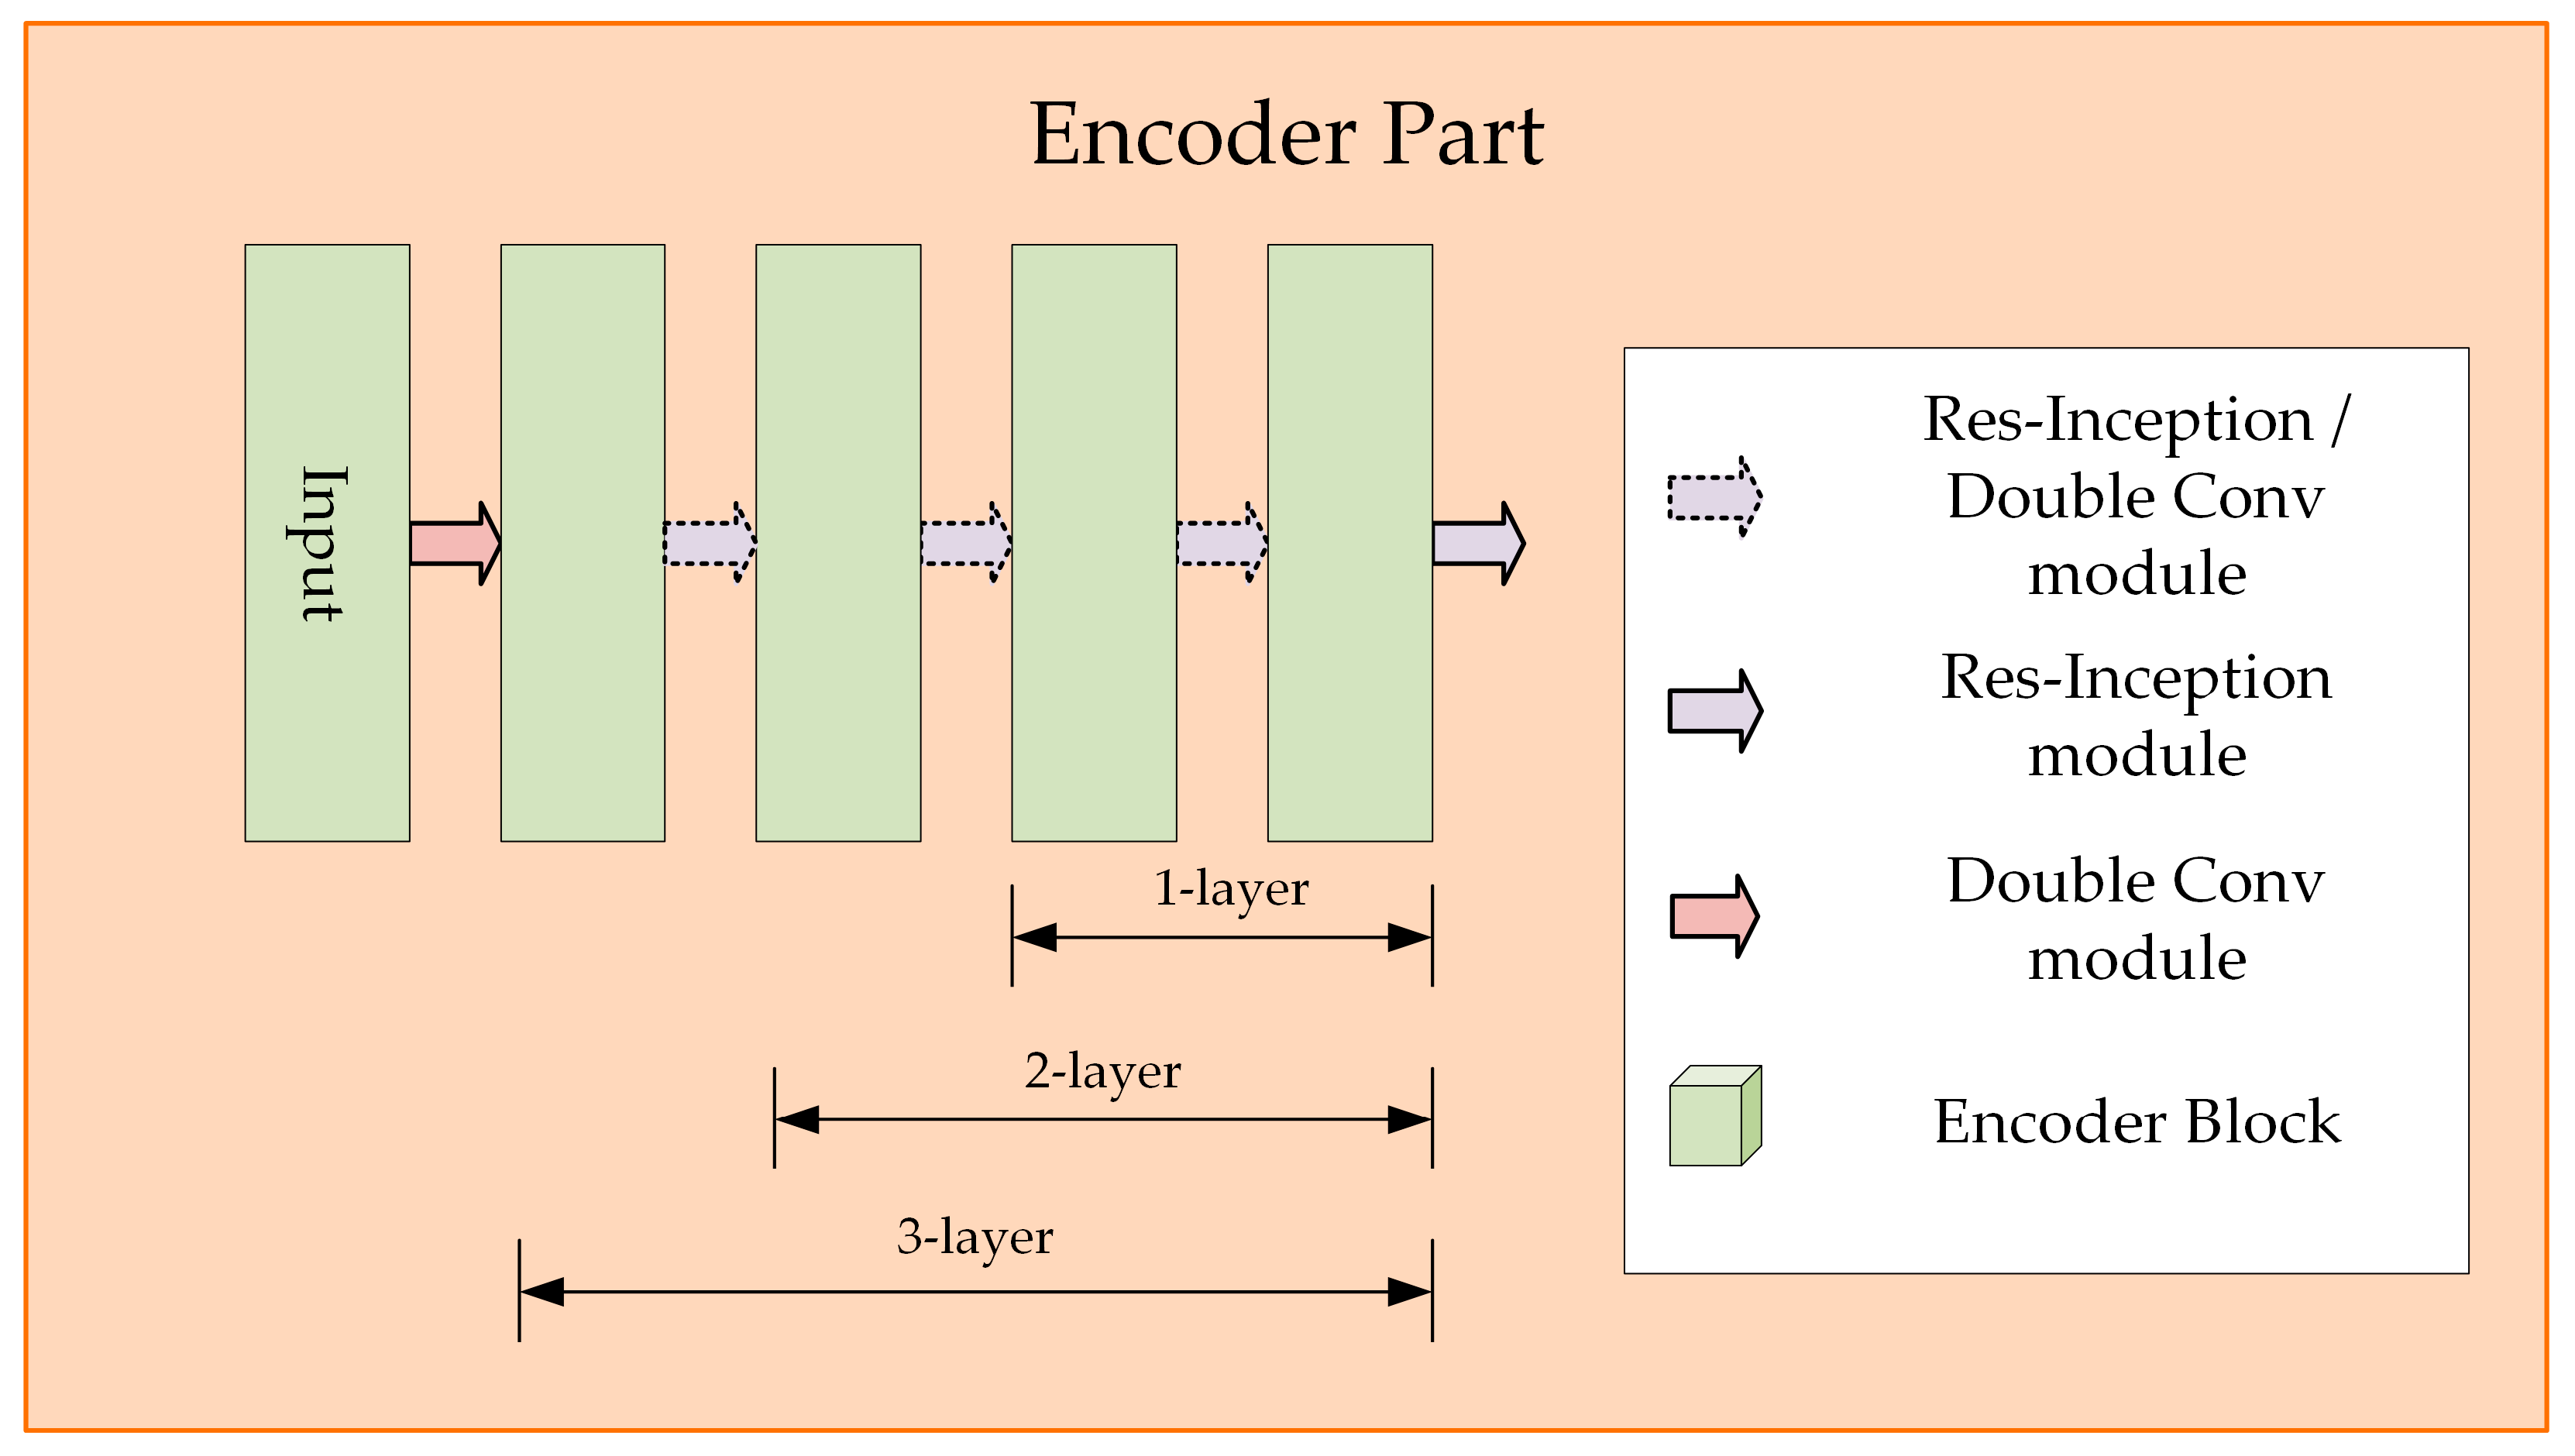
3.1. MCSPF-Net
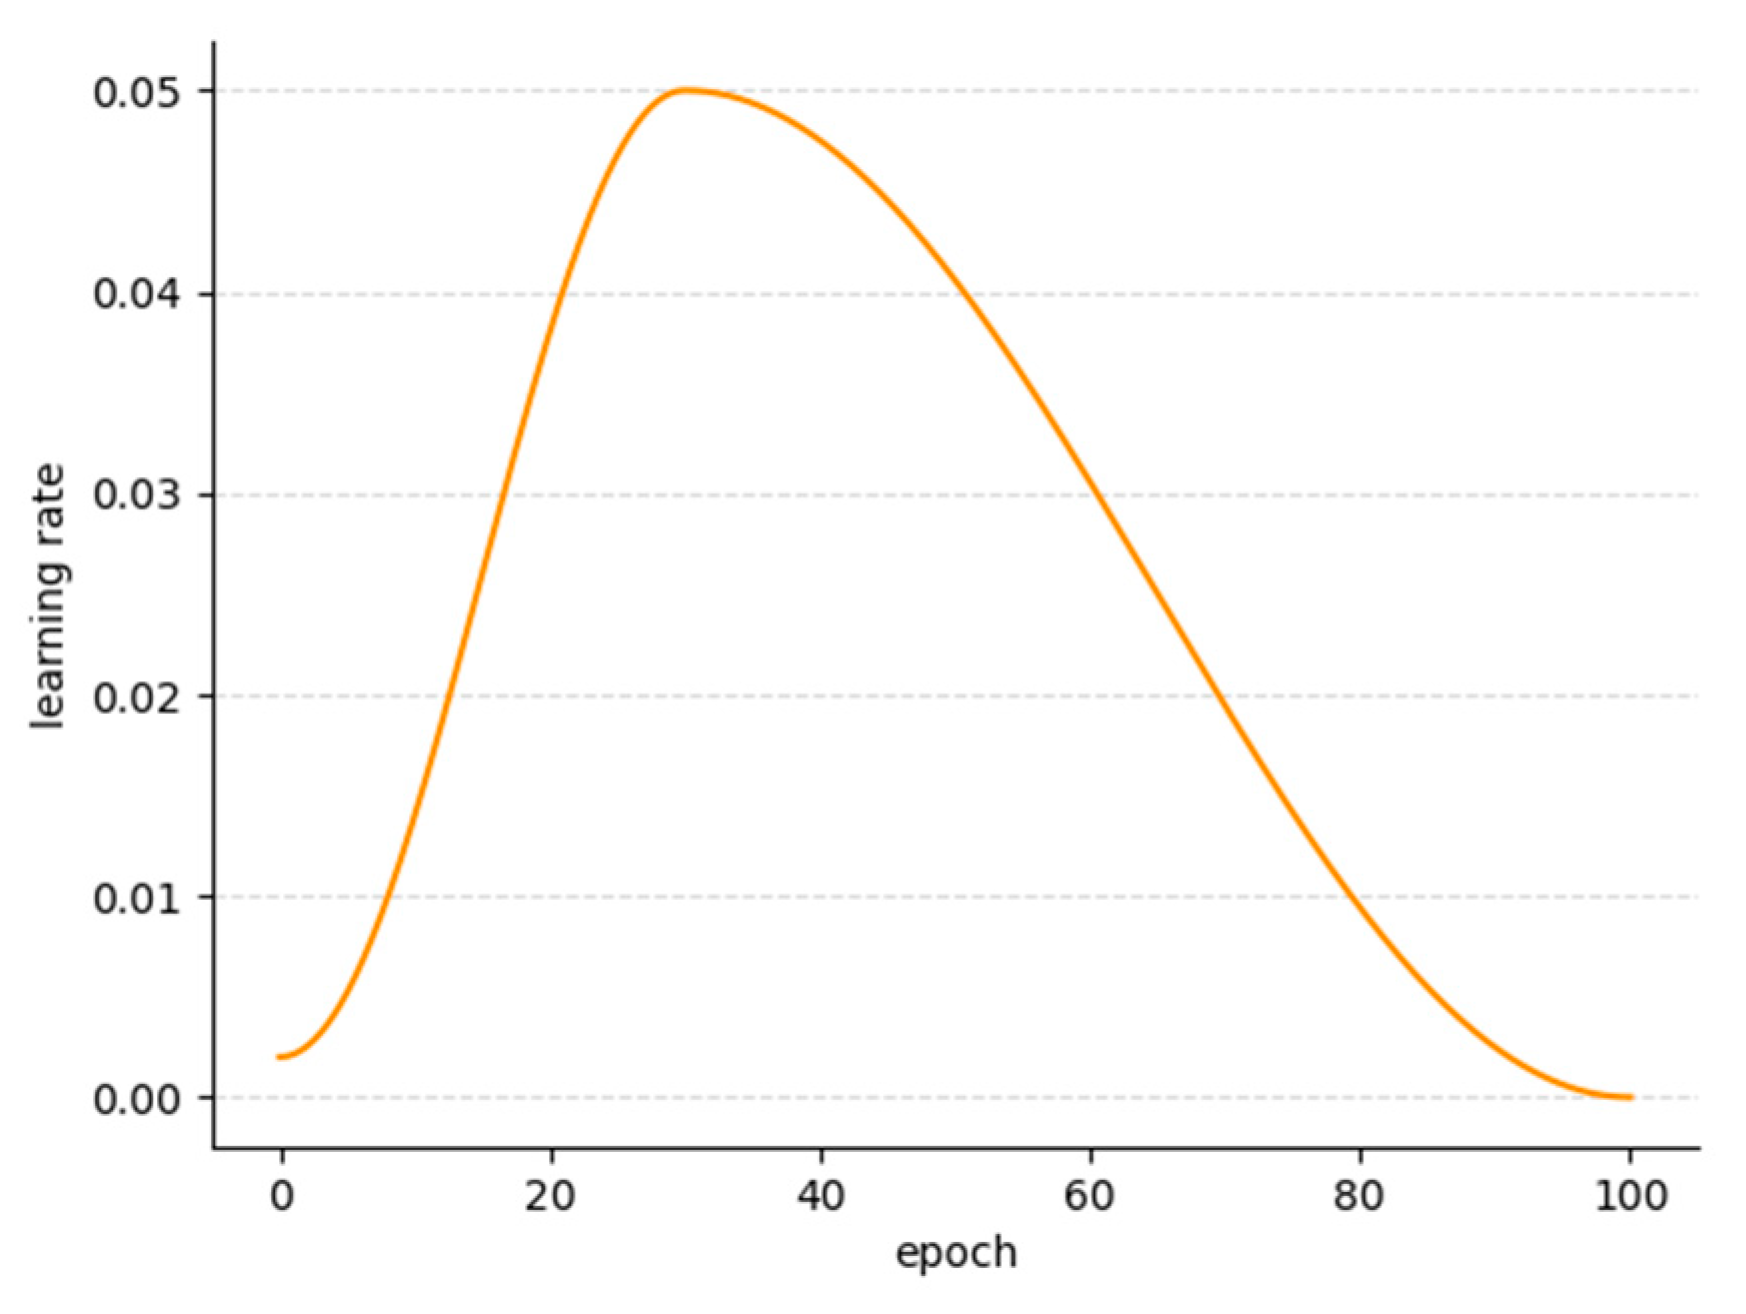
3.2. Training Methods
3.3. Experiment Design
4. Evaluation
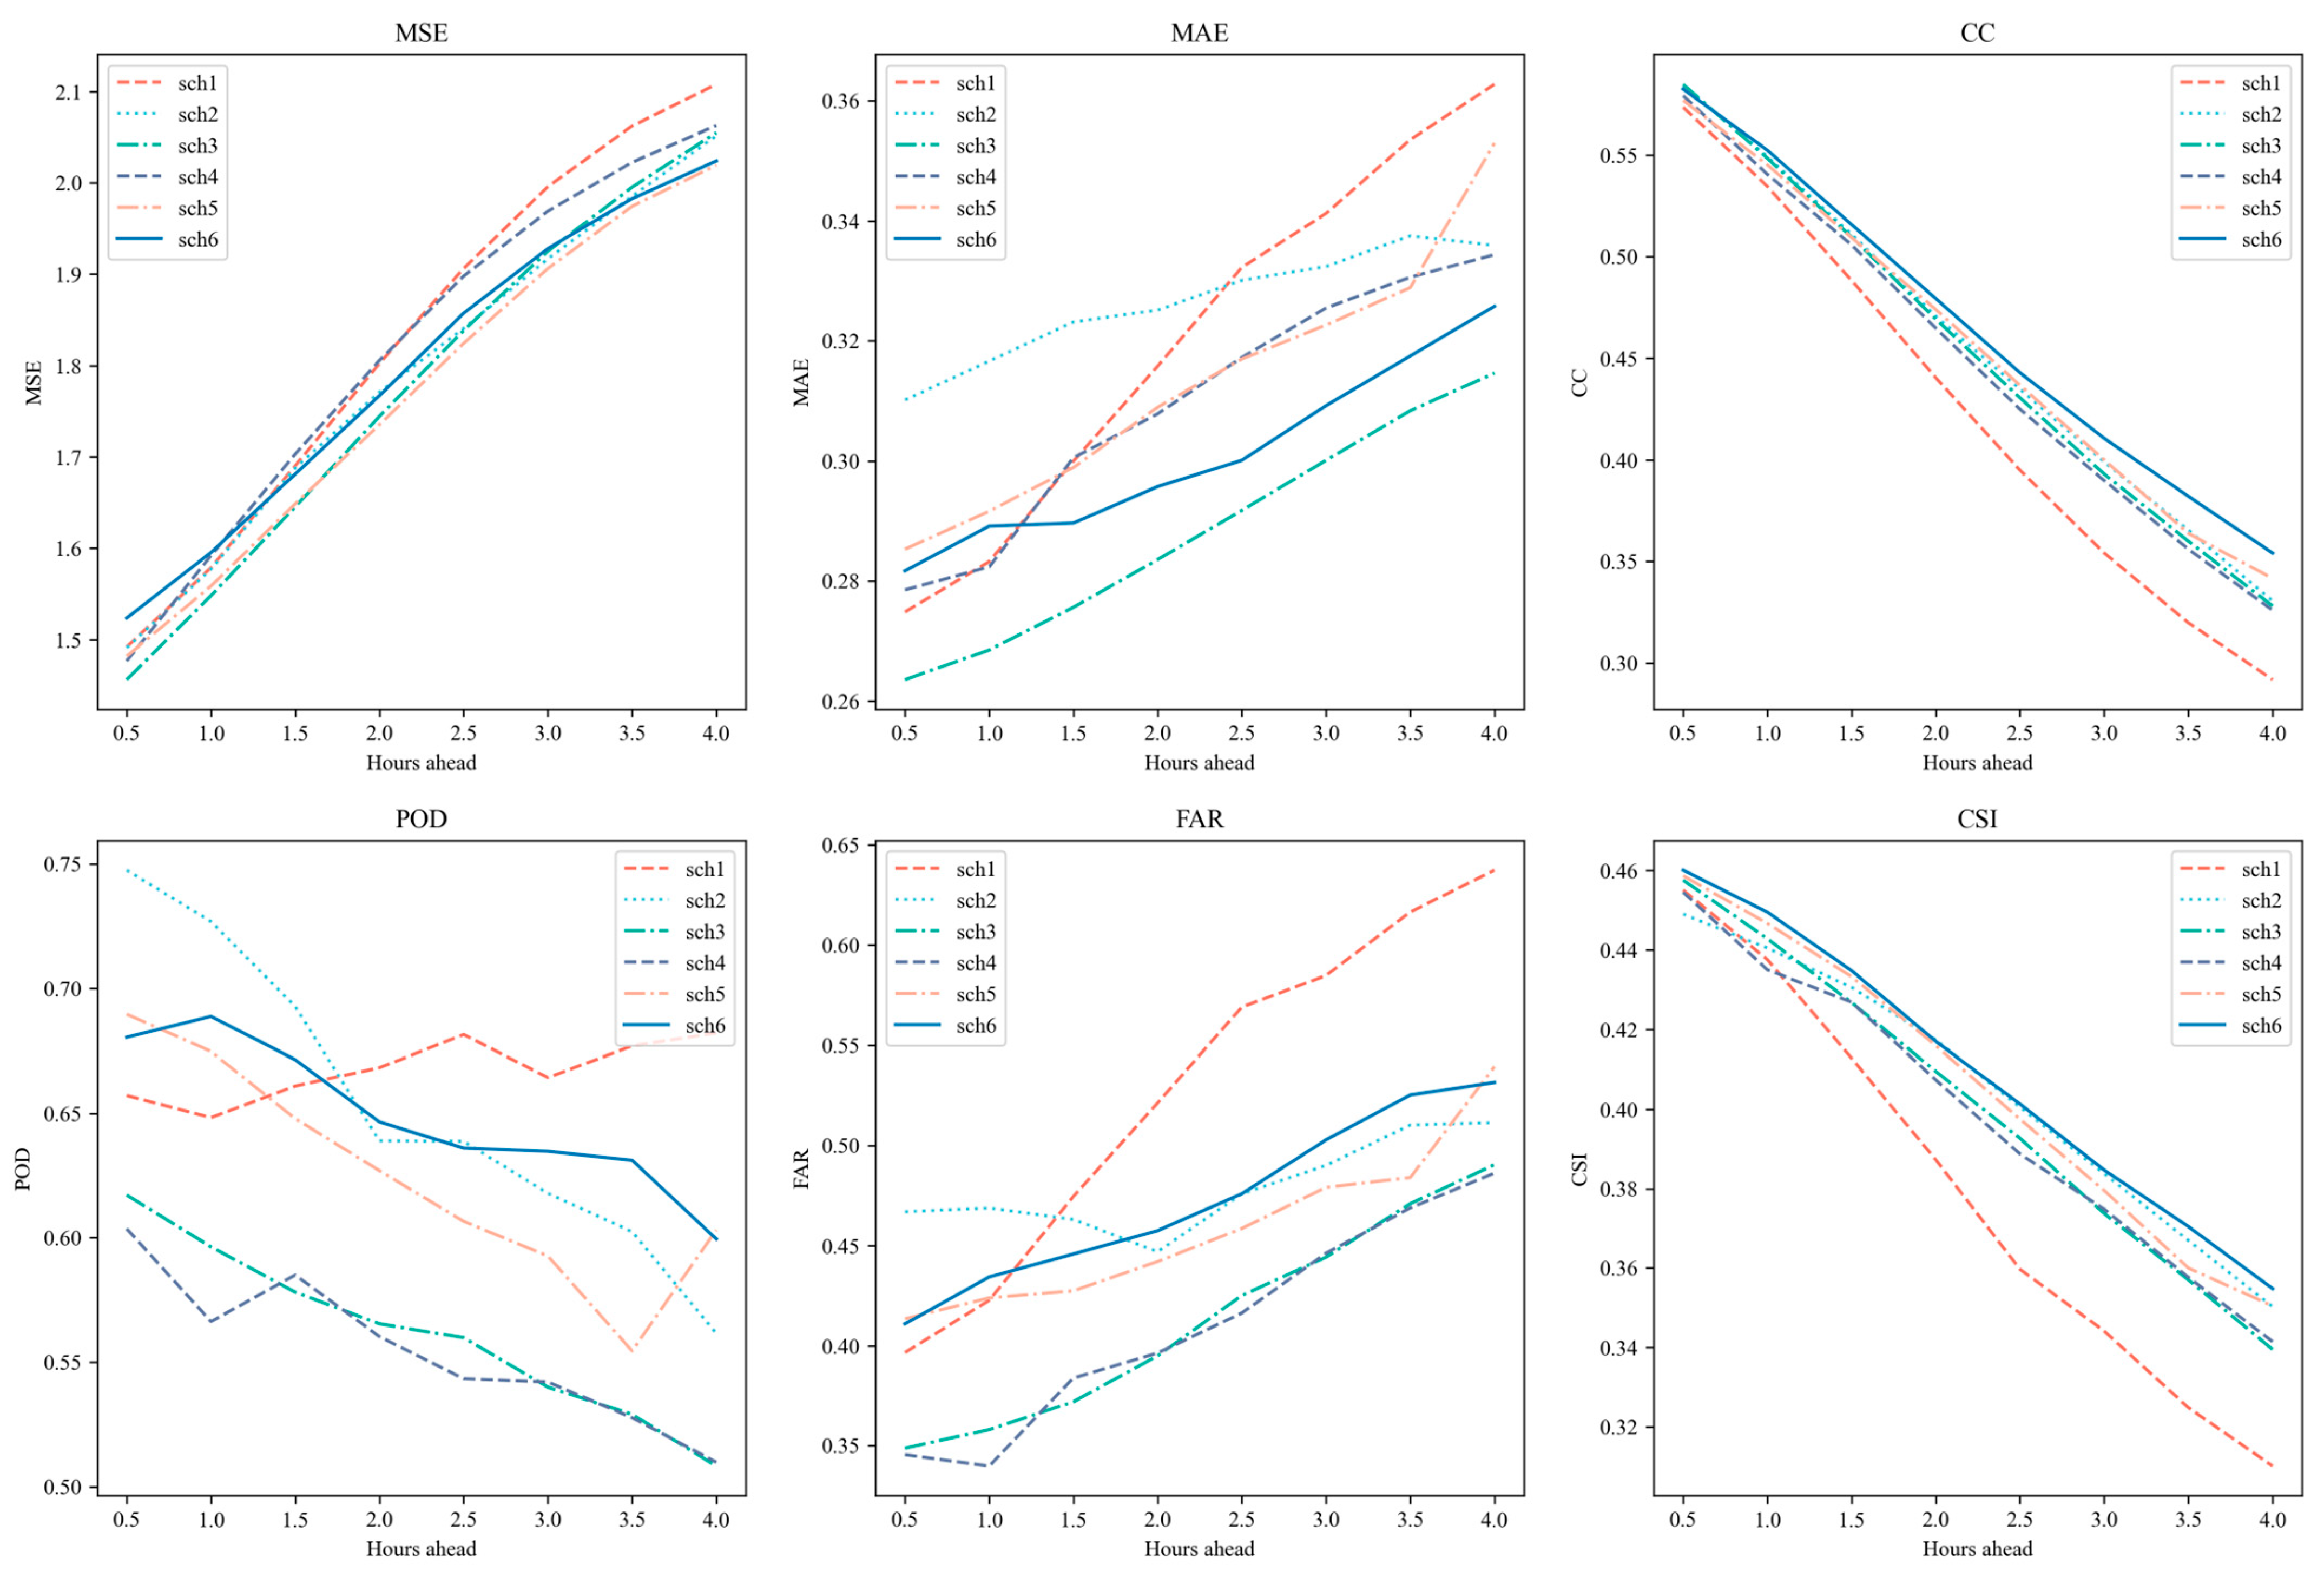
4.1. Performance Comparison of Band Combination Schemes in Precipitation Forecasting
4.2. Ablation Experiments
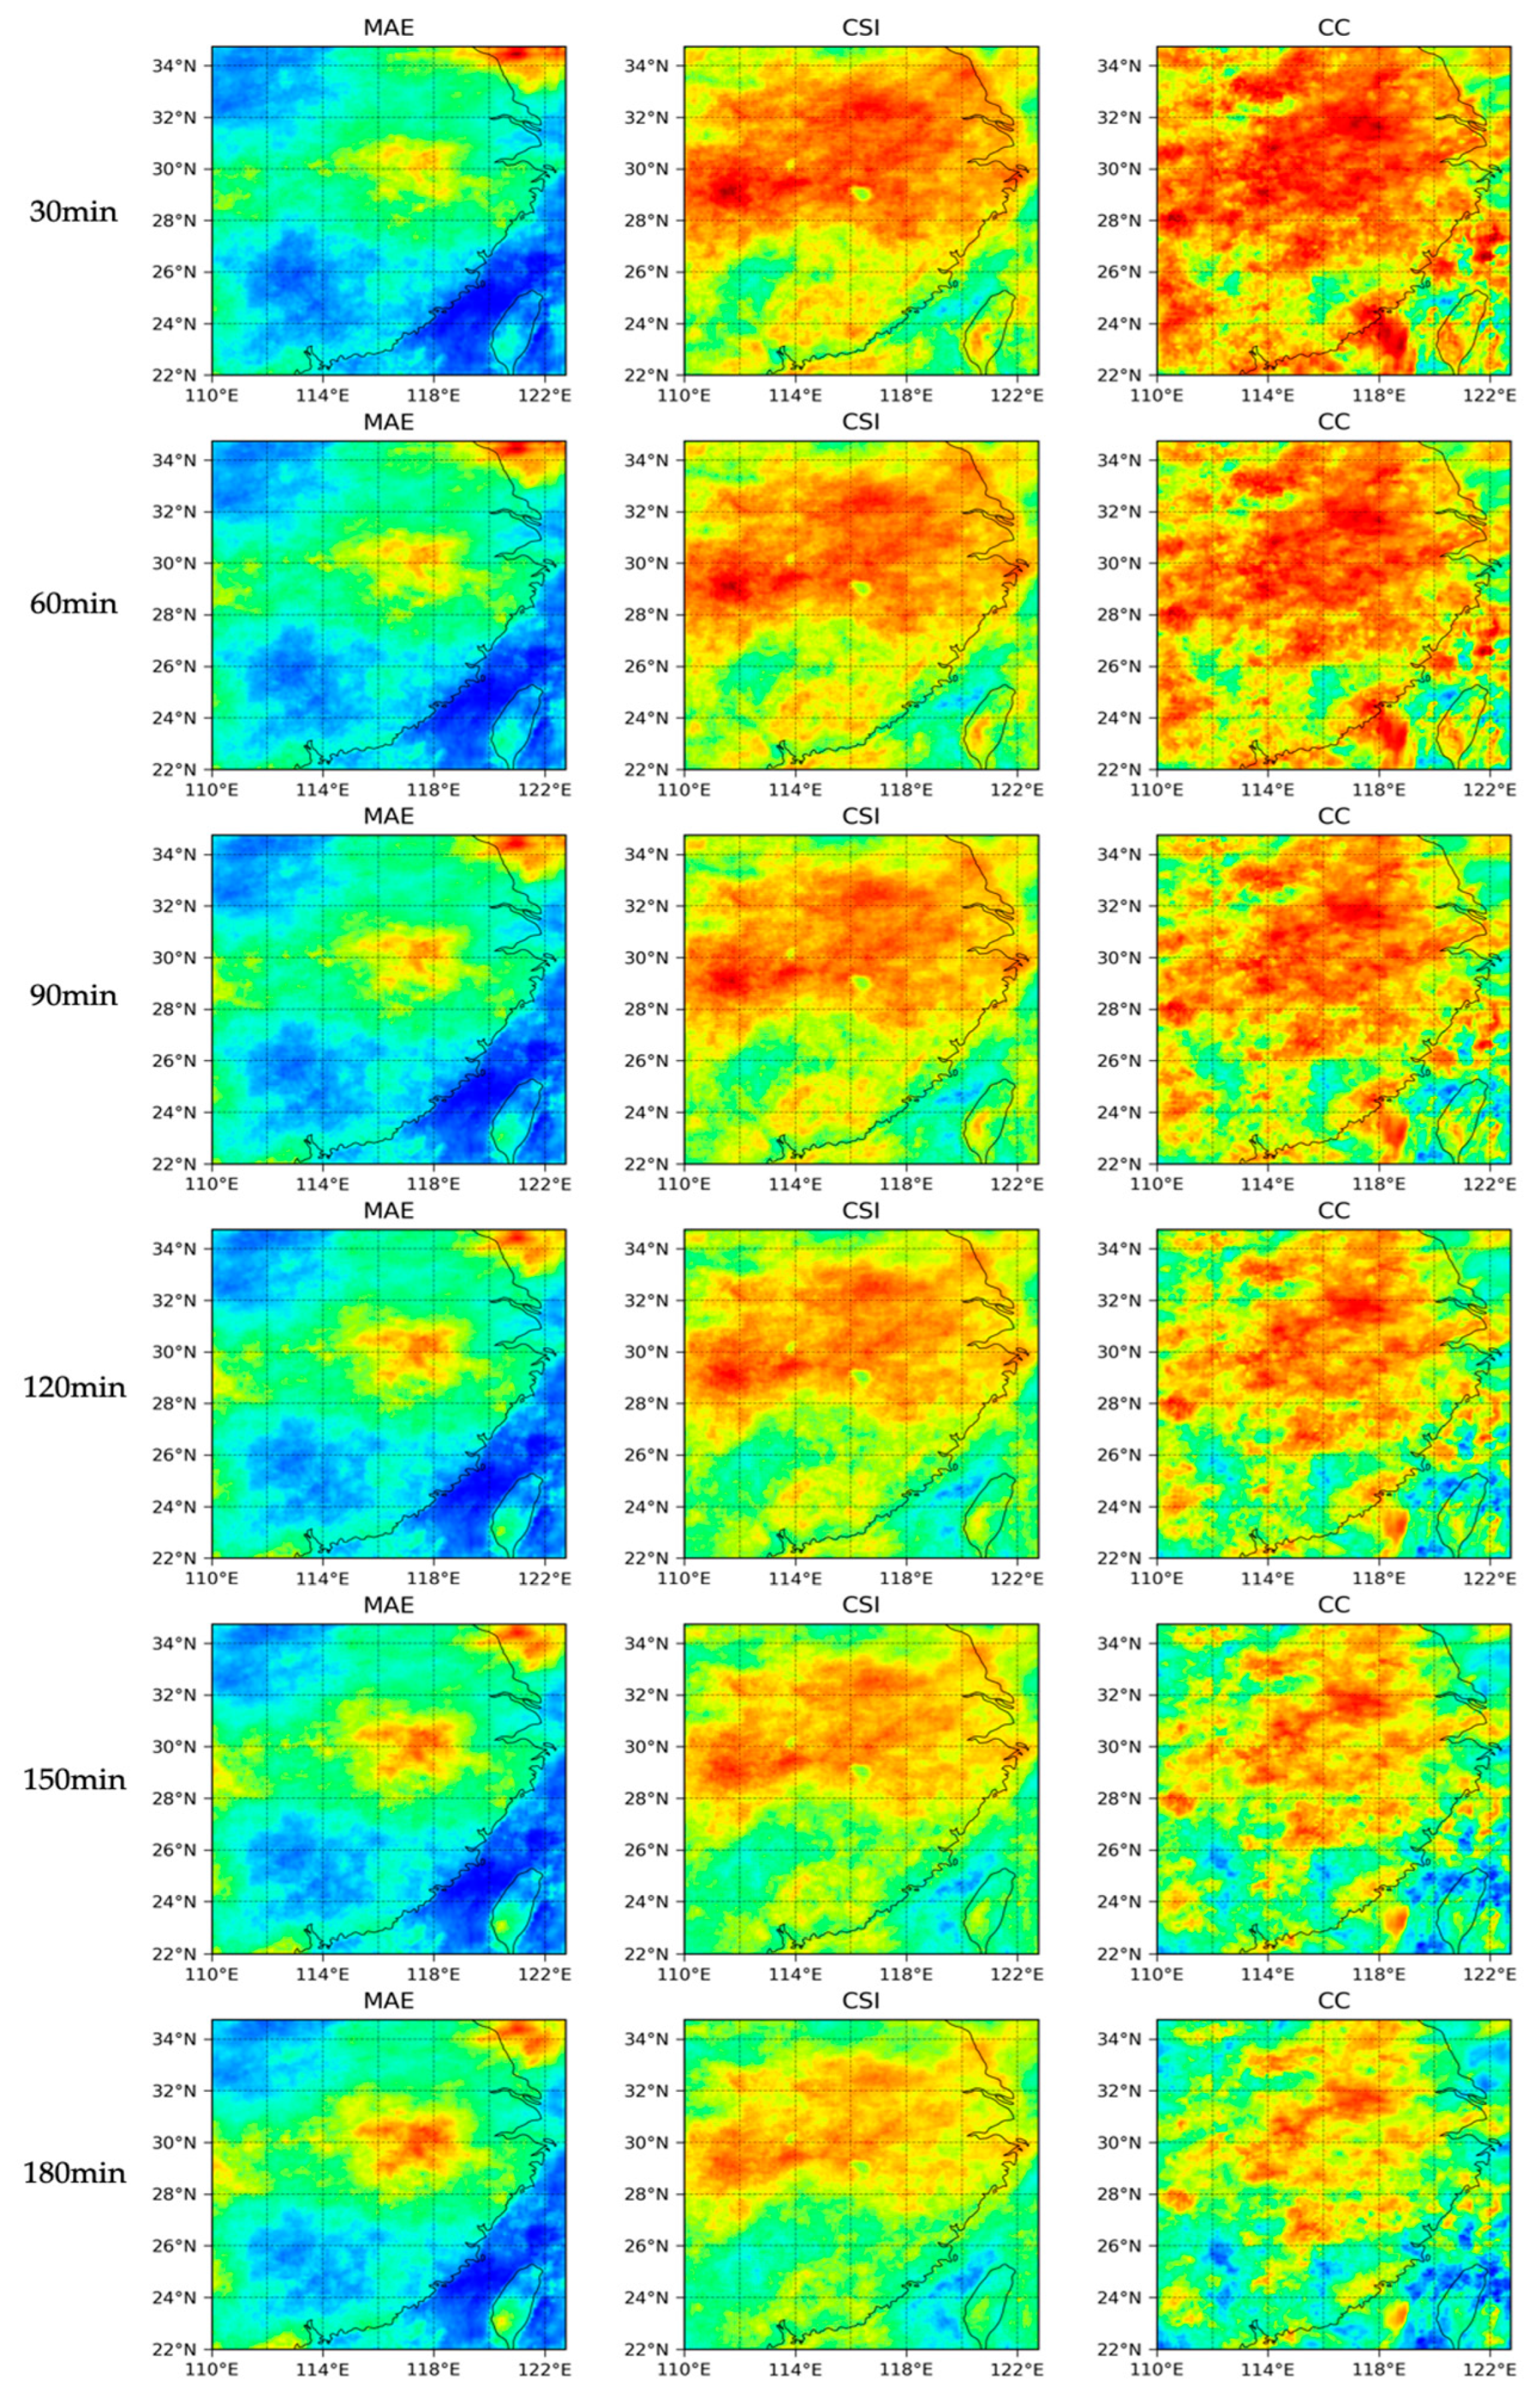
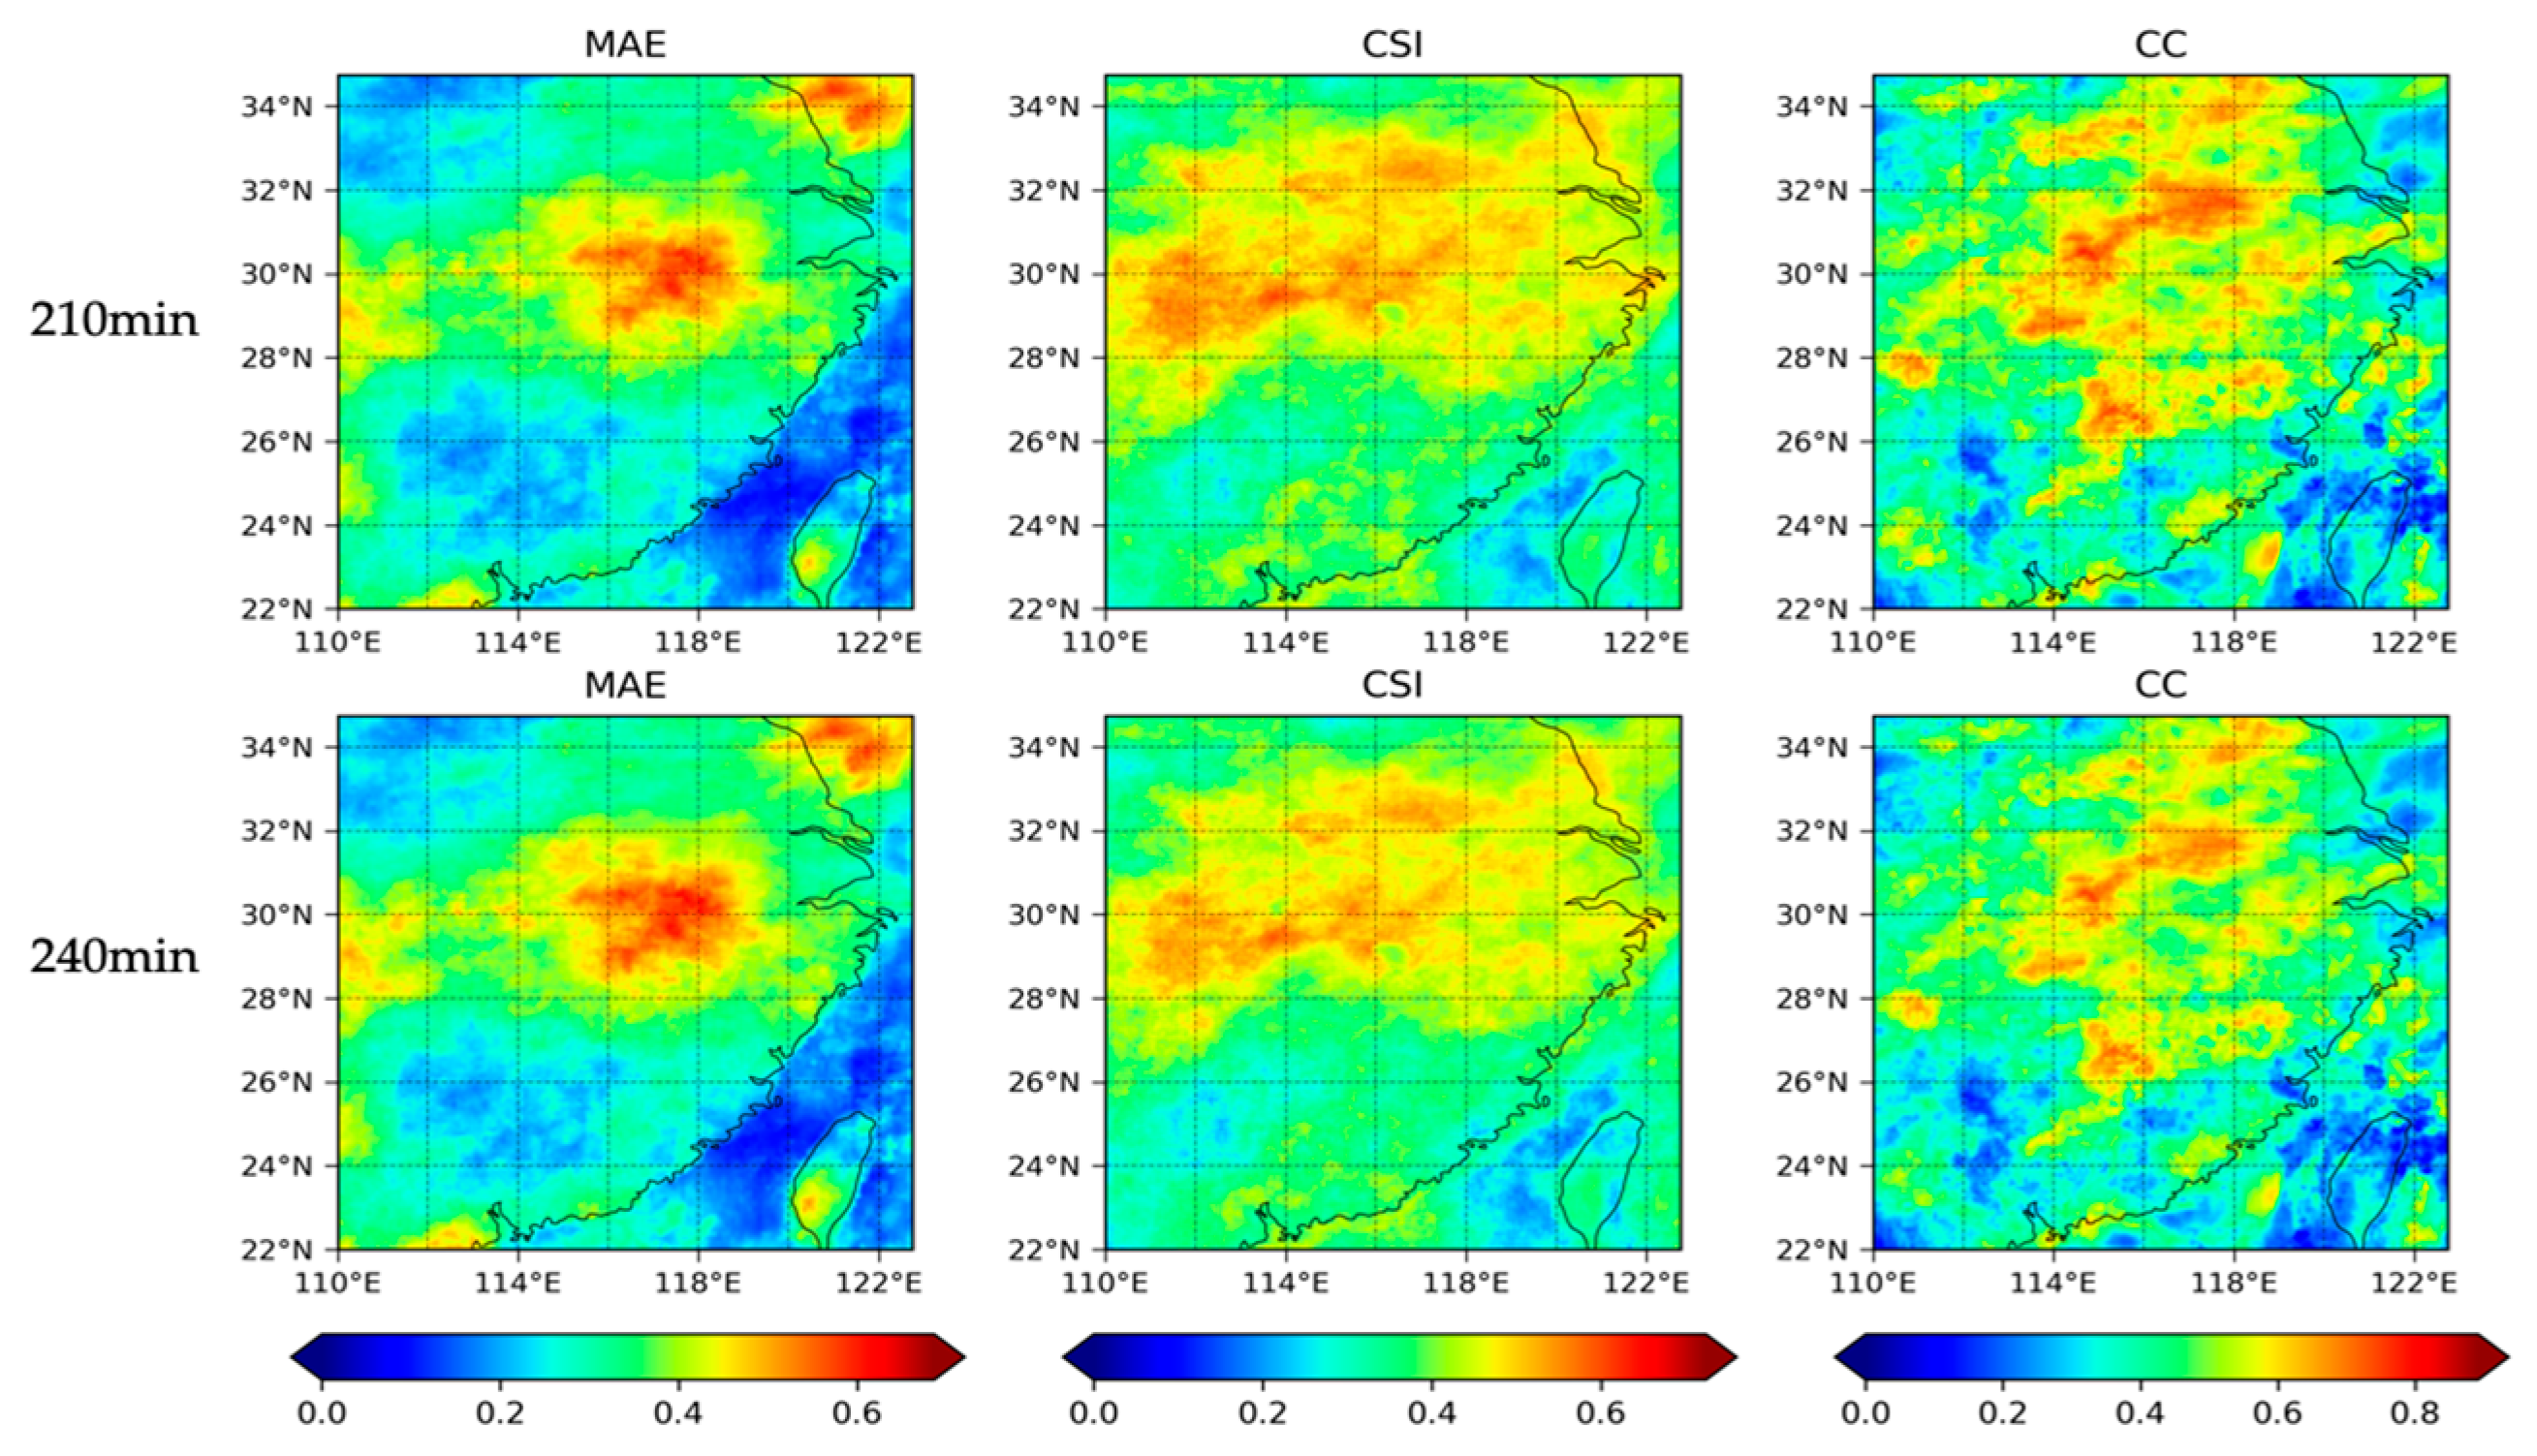
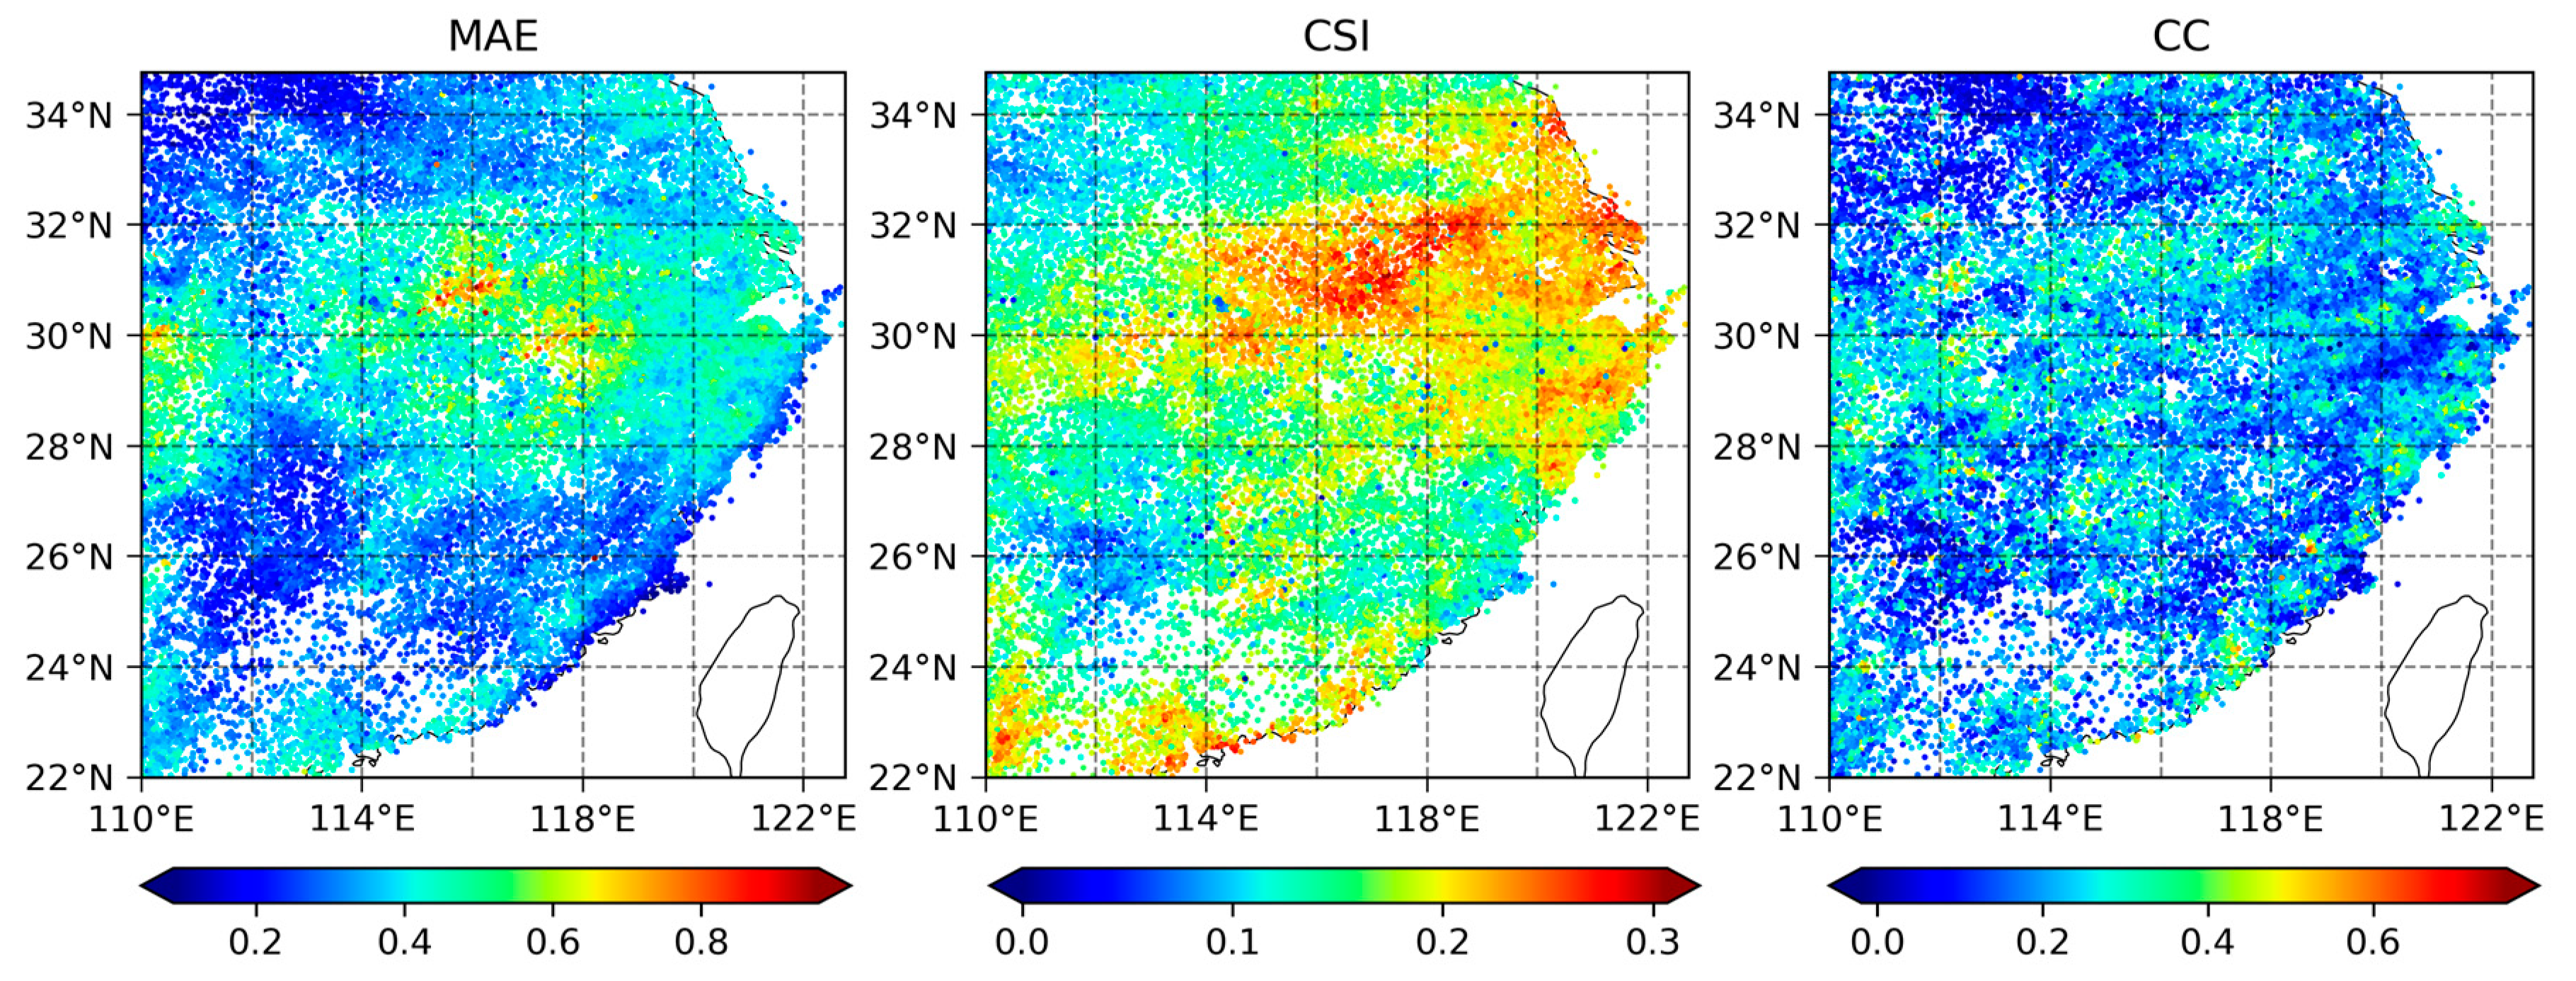
4.3. Spatial Distribution of Precipitation Forecasting Metric
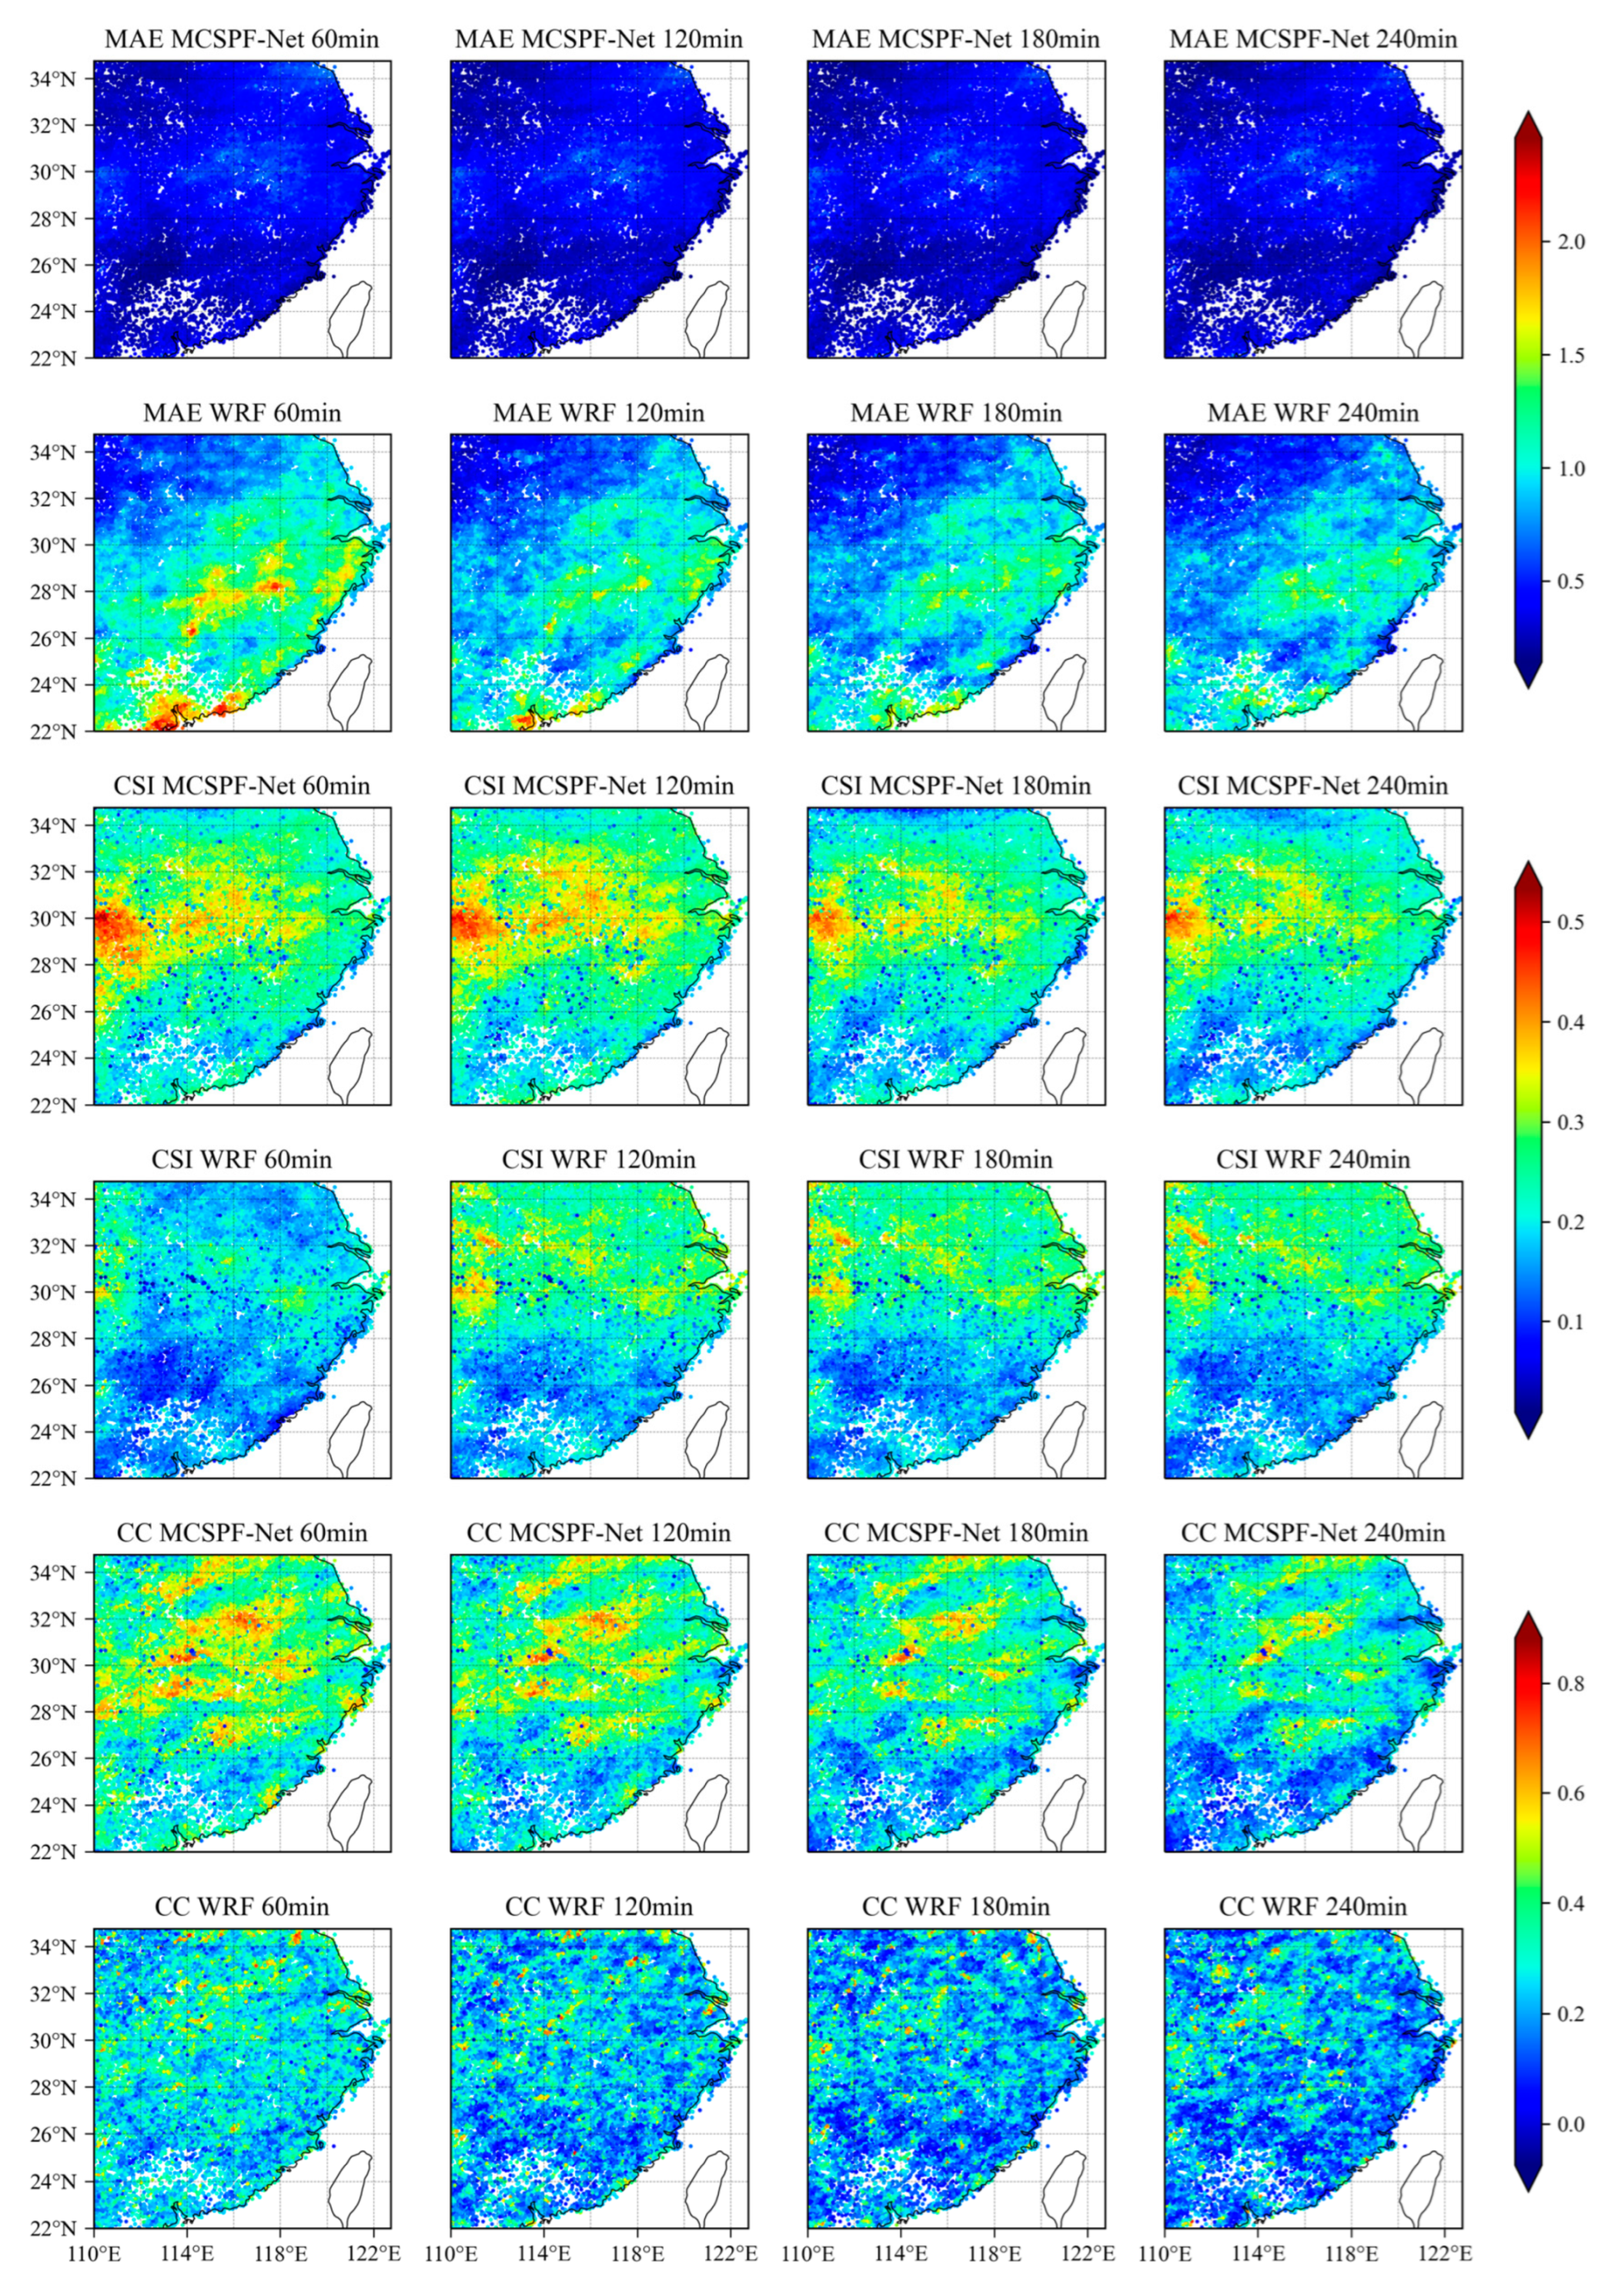
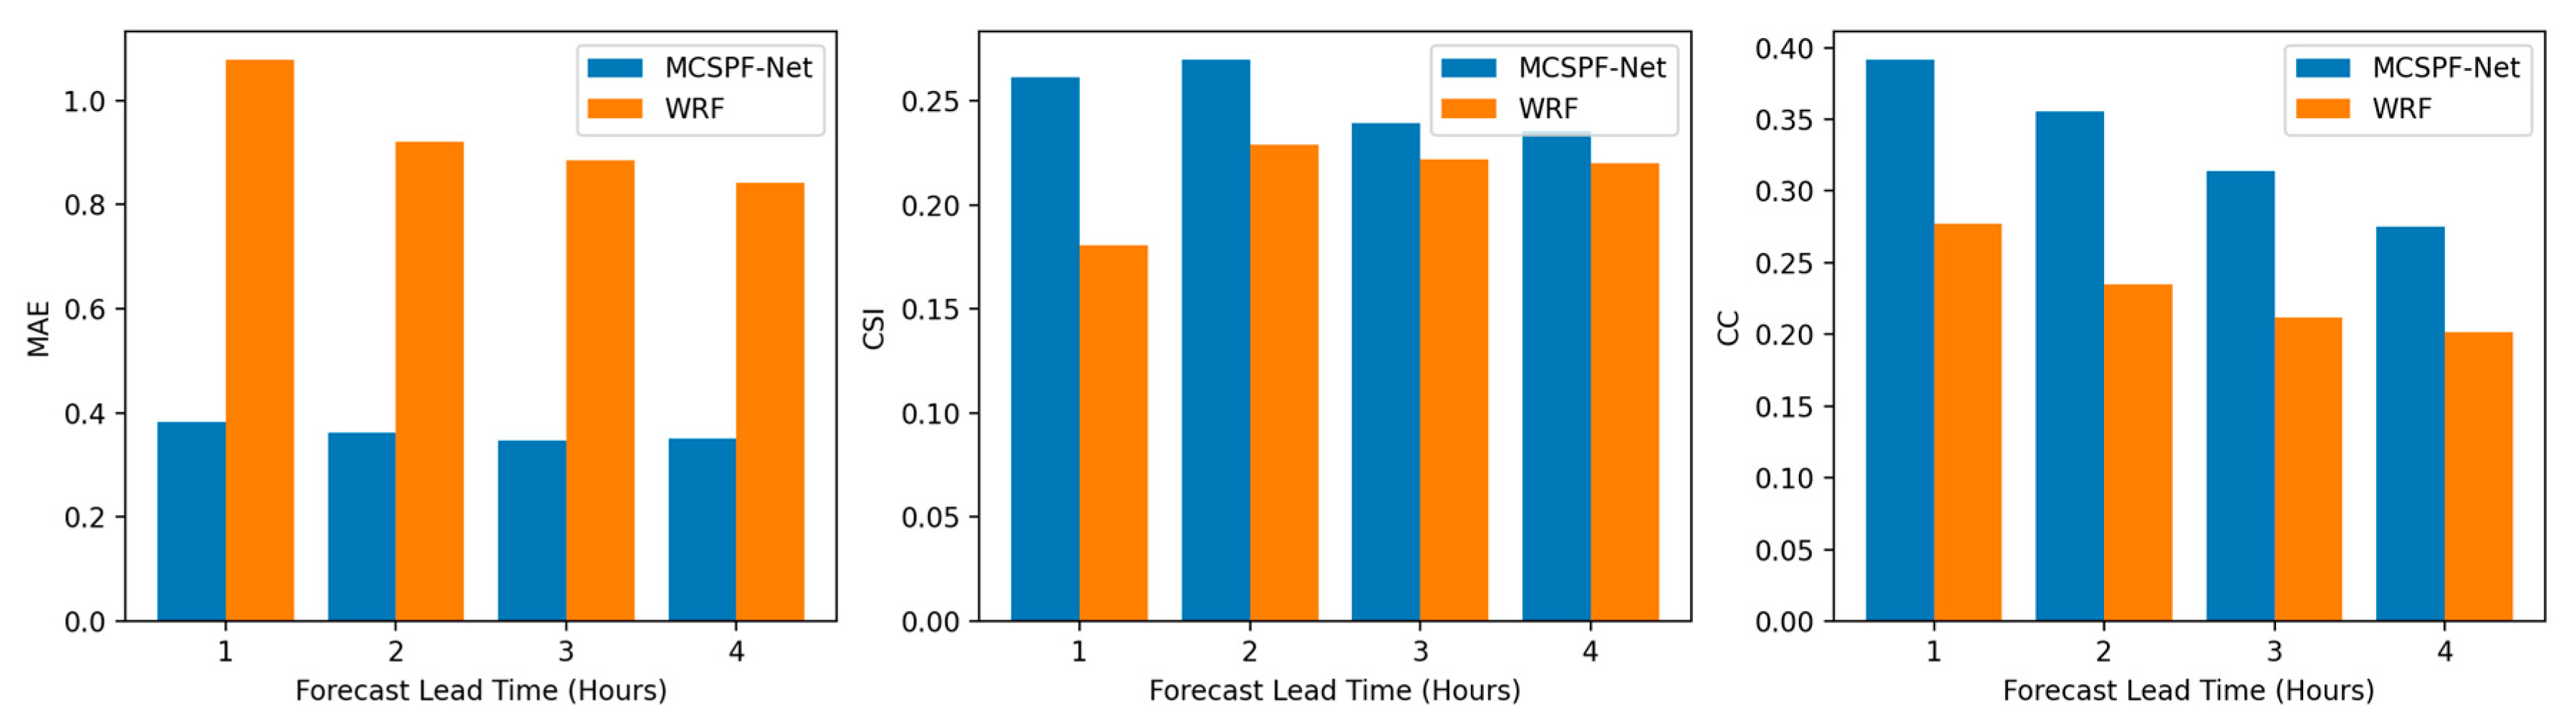
4.4. Evaluation of Precipitation Forecasting Performance with Numerical Weather Prediction Model
5. Discussion
6. Conclusions
Author Contributions
Funding
Acknowledgments
Conflicts of Interest
References
- Pan, X.; Lu, Y.; Zhao, K.; Huang, H.; Wang, M.; Chen, H. Improving Nowcasting of Convective Development by Incorporating Polarimetric Radar Variables into a Deep-Learning Model. Geophys. Res. Lett. 2021, 48, e2021GL095302. [Google Scholar] [CrossRef]
- Pan, B.; Hsu, K.; AghaKouchak, A.; Sorooshian, S. Improving Precipitation Estimation Using Convolutional Neural Network. Water Resour. Res. 2019, 55, 2301–2321. [Google Scholar] [CrossRef]
- Ma, Z.; Xu, J.; Ma, Y.; Zhu, S.; He, K.; Zhang, S.; Ma, W.; Xu, X. AERA5-Asia: A Long-Term Asian Precipitation Dataset (0.1°, 1-Hourly, 1951–2015, Asia) Anchoring the ERA5-Land under the Total Volume Control by APHRODITE. Bull. Am. Meteorol. Soc. 2022, 103, E1146–E1171. [Google Scholar] [CrossRef]
- Han, L.; Liang, H.; Chen, H.; Zhang, W.; Ge, Y. Convective Precipitation Nowcasting Using U-Net Model. IEEE Trans. Geosci. Remote Sens. 2022, 60, 1–8. [Google Scholar] [CrossRef]
- Mekonnen, K.; Melesse, A.M.; Woldesenbet, T.A. Spatial Evaluation of Satellite-Retrieved Extreme Rainfall Rates in the Upper Awash River Basin, Ethiopia. Atmos. Res. 2021, 249, 105297. [Google Scholar] [CrossRef]
- Wei, C.-C.; Huang, T.-H. Modular Neural Networks with Fully Convolutional Networks for Typhoon-Induced Short-Term Rainfall Predictions. Sensors 2021, 21, 4200. [Google Scholar] [CrossRef]
- Hwang, Y.; Clark, A.J.; Lakshmanan, V.; Koch, S.E. Improved Nowcasts by Blending Extrapolation and Model Forecasts. Weather Forecast. 2015, 30, 1201–1217. [Google Scholar] [CrossRef]
- Shakti, P.C.; Misumi, R.; Nakatani, T.; Iwanami, K.; Maki, M.; Seed, A.W.; Hirano, K. Comparison of Rainfall Nowcasting Derived from the STEPS Model and JMA Precipitation Nowcasts. Hydrol. Res. Lett. 2015, 9, 54–60. [Google Scholar] [CrossRef]
- Bauer, P.; Thorpe, A.; Brunet, G. The Quiet Revolution of Numerical Weather Prediction. Nature 2015, 525, 47–55. [Google Scholar] [CrossRef]
- Franch, G.; Maggio, V.; Coviello, L.; Pendesini, M.; Jurman, G.; Furlanello, C. TAASRAD19, a High-Resolution Weather Radar Reflectivity Dataset for Precipitation Nowcasting. Sci. Data 2020, 7, 234. [Google Scholar] [CrossRef]
- Tran, Q.K.; Song, S.K. Song Multi-ChannelWeather Radar Echo Extrapolation with Convolutional Recurrent Neural Networks. Remote Sens. 2019, 11, 2303. [Google Scholar] [CrossRef]
- Shi, X.; Chen, Z.; Wang, H.; Yeung, D.-Y.; Wong, W.; Woo, W. Convolutional LSTM Network: A Machine Learning Approach for Precipitation Nowcasting. In Proceedings of the 28th International Conference on Neural Information Processing Systems—Volume 1, Cambridge, MA, USA, 7–12 December 2015; MIT Press: Cambridge, MA, USA, 2015; pp. 802–810. [Google Scholar]
- Wang, Y.; Wu, H.; Zhang, J.; Gao, Z.; Wang, J.; Yu, P.S.; Long, M. PredRNN: A Recurrent Neural Network for Spatiotemporal Predictive Learning. IEEE Trans. Pattern Anal. Mach. Intell. 2022, 45, 2208–2225. [Google Scholar] [CrossRef] [PubMed]
- Sønderby, C.K.; Espeholt, L.; Heek, J.; Dehghani, M.; Oliver, A.; Salimans, T.; Agrawal, S.; Hickey, J.; Kalchbrenner, N. MetNet: A Neural Weather Model for Precipitation Forecasting. arXiv 2020, arXiv:2003.12140. [Google Scholar]
- Xue, M.; Hang, R.; Liu, Q.; Yuan, X.-T.; Lu, X. CNN-Based near-Real-Time Precipitation Estimation from Fengyun-2 Satellite over Xinjiang, China. Atmos. Res. 2021, 250, 105337. [Google Scholar] [CrossRef]
- Hong, J.; Mao, F.; Gong, W.; Gan, Y.; Zang, L.; Quan, J.; Chen, J. Assimilating Fengyun-4A Observations to Improve WRF-Chem PM2.5 Predictions in China. Atmos. Res. 2022, 265, 105878. [Google Scholar] [CrossRef]
- Ma, Z.; Zhu, S.; Yang, J. FY4QPE-MSA: An All-Day Near-Real-Time Quantitative Precipitation Estimation Framework Based on Multispectral Analysis from AGRI Onboard Chinese FY-4 Series Satellites. IEEE Trans. Geosci. Remote Sens. 2022, 60, 1–15. [Google Scholar] [CrossRef]
- Yu, C.; Hu, D.; Liu, M.; Wang, S.; Di, Y. Spatio-Temporal Accuracy Evaluation of Three High-Resolution Satellite Precipitation Products in China Area. Atmos. Res. 2020, 241, 104952. [Google Scholar] [CrossRef]
- Gao, Y.; Guan, J.; Zhang, F.; Wang, X.; Long, Z. Attention-Unet-Based Near-Real-Time Precipitation Estimation from Fengyun-4A Satellite Imageries. Remote Sens. 2022, 14, 2925. [Google Scholar] [CrossRef]
- Zhao, H.; Yang, B.; Yang, S.; Huang, Y.; Dong, G.; Bai, J.; Wang, Z. Systematical Estimation of GPM-Based Global Satellite Mapping of Precipitation Products over China. Atmos. Res. 2018, 201, 206–217. [Google Scholar] [CrossRef]
- Gebremicael, T.G. Satellite-Based Rainfall Estimates Evaluation Using a Parsimonious Hydrological Model in the Complex Climate and Topography of the Nile River Catchments. Atmos. Res. 2022, 12, 105939. [Google Scholar] [CrossRef]
- Moazami, S.; Najafi, M.R. A Comprehensive Evaluation of GPM-IMERG V06 and MRMS with Hourly Ground-Based Precipitation Observations across Canada. J. Hydrol. 2021, 594, 125929. [Google Scholar] [CrossRef]
- Sadeghi, M.; Asanjan, A.A.; Faridzad, M.; Nguyen, P.; Hsu, K.; Sorooshian, S.; Braithwaite, D. PERSIANN-CNN: Precipitation Estimation from Remotely Sensed Information Using Artificial Neural Networks–Convolutional Neural Networks. J. Hydrometeorol. 2019, 20, 2273–2289. [Google Scholar] [CrossRef]
- Kim, T.; Yang, T.; Zhang, L.; Hong, Y. Near Real-Time Hurricane Rainfall Forecasting Using Convolutional Neural Network Models with Integrated Multi-SatellitE Retrievals for GPM (IMERG) Product. Atmos. Res. 2022, 270, 106037. [Google Scholar] [CrossRef]
- Hayatbini, N.; Kong, B.; Hsu, K.; Nguyen, P.; Sorooshian, S.; Stephens, G.; Fowlkes, C.; Nemani, R. Conditional Generative Adversarial Networks (CGANs) for Near Real-Time Precipitation Estimation from Multispectral GOES-16 Satellite Imageries—PERSIANN-CGAN. Remote Sens. 2019, 11, 2193. [Google Scholar] [CrossRef]
- Hsu, K.; Gao, X.; Sorooshian, S.; Gupta, H.V. Precipitation Estimation from Remotely Sensed Information Using Artificial Neural Networks. J. Appl. Meteorol. 1997, 36, 1176–1190. [Google Scholar] [CrossRef]
- Hong, Y.; Hsu, K.-L.; Sorooshian, S.; Gao, X. Precipitation Estimation from Remotely Sensed Imagery Using an Artificial Neural Network Cloud Classification System. J. Appl. Meteorol. 2004, 43, 1834–1853. [Google Scholar] [CrossRef]
- Wang, C.; Tang, G.; Xiong, W.; Ma, Z.; Zhu, S. Infrared Precipitation Estimation Using Convolutional Neural Network for FengYun Satellites. J. Hydrol. 2021, 603, 127113. [Google Scholar] [CrossRef]
- Wang, C.; Xu, J.; Tang, G.; Yang, Y.; Hong, Y. Infrared Precipitation Estimation Using Convolutional Neural Network. IEEE Trans. Geosci. Remote Sens. 2020, 58, 8612–8625. [Google Scholar] [CrossRef]
- Zhu, S.; Ma, Z. PECA-FY4A: Precipitation Estimation Using Chromatographic Analysis Methodology for Full-Disc Multispectral Observations from FengYun-4A/AGRI. Remote Sens. Environ. 2022, 282, 113234. [Google Scholar] [CrossRef]
- Szegedy, C.; Vanhoucke, V.; Ioffe, S.; Shlens, J.; Wojna, Z. Rethinking the Inception Architecture for Computer Vision. arXiv 2015, arXiv:1512.00567v3. [Google Scholar]
- Xie, S.; Girshick, R.; Dollár, P.; Tu, Z.; He, K. Aggregated Residual Transformations for Deep Neural Networks. arXiv 2017, arXiv:1611.05431. [Google Scholar]
- Yang, J.; Zhang, Z.; Wei, C.; Lu, F.; Guo, Q. Introducing the New Generation of Chinese Geostationary Weather Satellites, Fengyun-4. Bull. Am. Meteorol. Soc. 2017, 98, 1637–1658. [Google Scholar] [CrossRef]
- Xian, D.; Zhang, P.; Gao, L.; Sun, R.; Zhang, H.; Jia, X. Fengyun Meteorological Satellite Products for Earth System Science Applications. Adv. Atmos. Sci. 2021, 38, 1267–1284. [Google Scholar] [CrossRef]
- Hu, Y.; Zhang, Y.; Yan, L.; Li, X.-M.; Dou, C.; Jia, G.; Si, Y.; Zhang, L. Evaluation of the Radiometric Calibration of FY4A-AGRI Thermal Infrared Data Using Lake Qinghai. IEEE Trans. Geosci. Remote Sens. 2021, 59, 8040–8050. [Google Scholar] [CrossRef]
- Zhang, P.; Lu, Q.; Hu, X.; Gu, S.; Yang, L.; Min, M.; Chen, L.; Xu, N.; Sun, L.; Bai, W.; et al. Latest Progress of the Chinese Meteorological Satellite Program and Core Data Processing Technologies. Adv. Atmos. Sci. 2019, 36, 1027–1045. [Google Scholar] [CrossRef]
- Zhang, A.; Xiao, L.; Min, C.; Chen, S.; Kulie, M.; Huang, C.; Liang, Z. Evaluation of Latest GPM-Era High-Resolution Satellite Precipitation Products during the May 2017 Guangdong Extreme Rainfall Event. Atmos. Res. 2019, 216, 76–85. [Google Scholar] [CrossRef]
- Anjum, M.N.; Ding, Y.; Shangguan, D.; Ahmad, I.; Ijaz, M.W.; Farid, H.U.; Yagoub, Y.E.; Zaman, M.; Adnan, M. Performance Evaluation of Latest Integrated Multi-Satellite Retrievals for Global Precipitation Measurement (IMERG) over the Northern Highlands of Pakistan. Atmos. Res. 2018, 205, 134–146. [Google Scholar] [CrossRef]
- Wang, Z.; Zhong, R.; Lai, C.; Chen, J. Evaluation of the GPM IMERG Satellite-Based Precipitation Products and the Hydrological Utility. Atmos. Res. 2017, 196, 151–163. [Google Scholar] [CrossRef]
- Pradhan, R.K.; Markonis, Y.; Vargas Godoy, M.R.; Villalba-Pradas, A.; Andreadis, K.M.; Nikolopoulos, E.I.; Papalexiou, S.M.; Rahim, A.; Tapiador, F.J.; Hanel, M. Review of GPM IMERG Performance: A Global Perspective. Remote Sens. Environ. 2022, 268, 112754. [Google Scholar] [CrossRef]
- Sungmin, O.; Foelsche, U.; Kirchengast, G.; Fuchsberger, J.; Tan, J.; Petersen, W.A. Evaluation of GPM IMERG Early, Late, and Final Rainfall Estimates Using WegenerNet Gauge Data in Southeastern Austria. Hydrol. Earth Syst. Sci. 2017, 21, 6559–6572. [Google Scholar] [CrossRef]
- Zhou, K.; Zheng, Y.; Dong, W.; Wang, T. A Deep Learning Network for Cloud-to-Ground Lightning Nowcasting with Multisource Data. J. Atmos. Ocean. Technol. 2020, 37, 927–942. [Google Scholar] [CrossRef]
- Ronneberger, O.; Fischer, P.; Brox, T. U-Net: Convolutional Networks for Biomedical Image Segmentation. In Medical Image Computing and Computer-Assisted Intervention—MICCAI 2015; Navab, N., Hornegger, J., Wells, W.M., Frangi, A.F., Eds.; Lecture Notes in Computer Science; Springer International Publishing: Cham, Switzerland, 2015; Volume 9351, pp. 234–241. ISBN 978-3-319-24573-7. [Google Scholar]
- Noh, H.; Hong, S.; Han, B. Learning Deconvolution Network for Semantic Segmentation. In Proceedings of the 2015 IEEE International Conference on Computer Vision (ICCV), Santiago, Chile, 7–13 December 2015; IEEE: Santiago, Chile, 2015; pp. 1520–1528. [Google Scholar]
- He, K.; Zhang, X.; Ren, S.; Sun, J. Deep Residual Learning for Image Recognition. In Proceedings of the 2016 IEEE Conference on Computer Vision and Pattern Recognition (CVPR), Las Vegas, NV, USA, 27–30 June 2016; IEEE: Las Vegas, NV, USA, 2016; pp. 770–778. [Google Scholar]
- Kingma, D.P.; Ba, J. Adam: A method for stochastic optimization. arXiv 2014, arXiv:1412.6980. [Google Scholar]
- Yang, X.; Zhao, C.; Luo, N.; Zhao, W.; Shi, W.; Yan, X. Evaluation and Comparison of Himawari-8 L2 V1.0, V2.1 and MODIS C6.1 Aerosol Products over Asia and the Oceania Regions. Atmos. Environ. 2020, 220, 117068. [Google Scholar] [CrossRef]
- Yang, Y.; Sun, W.; Chi, Y.; Yan, X.; Fan, H.; Yang, X.; Ma, Z.; Wang, Q.; Zhao, C. Machine Learning-Based Retrieval of Day and Night Cloud Macrophysical Parameters over East Asia Using Himawari-8 Data. Remote Sens. Environ. 2022, 273, 112971. [Google Scholar] [CrossRef]


| Spectral Coverage | Central Wavelength | Spectral Bandwidth | Spatial Resolution | Main Applications |
|---|---|---|---|---|
| Visible | 0.47 µm | 0.45–0.49 µm | 1 km | Aerosol |
| 0.65 µm | 0.55–0.75 µm | 0.5–1 km | Fog, cloud | |
| 0.825 µm | 0.75–0.90 µm | 1 km | Vegetation | |
| Short-wave infrared | 1.375 µm | 1.36–1.39 µm | 2 km | Cirrus |
| 1.61 µm | 1.58–1.64 µm | 2 km | Cloud, snow | |
| 2.25 µm | 2.1–2.35 µm | 2–4 km | Cirrus, aerosol | |
| Mid-wave infrared | 3.75 µm | 3.5–4.0 µm | 2 km | Fire |
| 3.75 µm | 3.5–4.0 µm | 2 km | Land surface | |
| Water vapor | 6.25 µm | 5.8–6.7 µm | 4 km | Upper-level water vapor |
| 7.1 µm | 6.9–7.3 µm | 4 km | Mid-level water vapor | |
| Long-wave infrared | 8.5 µm | 8.0–9.0 µm | 4 km | Volcanic, ash, cloud top, phase |
| 10.7 µm | 10.3–11.3 µm | 4 km | Sea surface temperature, Land surface temperature | |
| 12.0 µm | 11.5–12.5 µm | 4 km | Clouds, low-level water vapor | |
| 13.5 µm | 13.2–13.8 µm | 4 km | Clouds, air temperature |
| No. | Spectrum Type | Waveband | Channel Number |
|---|---|---|---|
| 1 | Mid-wave infrared + Water vapor + Long-wave infrared + BTD | T12.0–7.2 | 11 |
| 2 | Water vapor + Long-wave infrared + BTD | T10.7–13.3 | 8 |
| 3 | Water vapor + Long-wave infrared + BTD | T12.0–7.2 | 9 |
| 4 | Water vapor + Long-wave infrared + BTD | T10.7–13.3 | 5 |
| 5 | Mid-wave infrared + Water vapor + Long-wave infrared | IR3.75, WV6.5, WV7.2, IR8.5, IR10.7, IR12.0, IR13.3 | 8 |
| 6 | Water vapor + Long-wave infrared | WV6.5, WV7.2, IR8.5, IR10.7, IR12.0, IR13.3 | 6 |
| No. | POD | FAR | CSI | MSE | MAE | CC |
|---|---|---|---|---|---|---|
| 1 | 0.667 | 0.528 | 0.379 | 1.829 | 0.320 | 0.425 |
| 2 | 0.653 | 0.479 | 0.405 | 1.790 | 0.326 | 0.456 |
| 3 | 0.562 | 0.413 | 0.400 | 1.776 | 0.288 | 0.453 |
| 4 | 0.555 | 0.410 | 0.398 | 1.816 | 0.310 | 0.448 |
| 5 | 0.625 | 0.458 | 0.405 | 1.769 | 0.313 | 0.456 |
| 6 | 0.649 | 0.473 | 0.409 | 1.795 | 0.301 | 0.465 |
| Model | POD | FAR | CSI | MSE | MAE | CC |
|---|---|---|---|---|---|---|
| U-Net | 0.790 | 0.572 | 0.386 | 1.804 | 0.330 | 0.457 |
| Res-UNet | 0.556 | 0.421 | 0.396 | 1.885 | 0.298 | 0.412 |
| MCSPF-Net (1-layer) | 0.617 | 0.449 | 0.408 | 1.860 | 0.300 | 0.434 |
| MCSPF-Net (2-layer) | 0.649 | 0.473 | 0.409 | 1.795 | 0.301 | 0.465 |
| MCSPF-Net (3-layer) | 0.564 | 0.435 | 0.390 | 1.799 | 0.293 | 0.453 |
Disclaimer/Publisher’s Note: The statements, opinions and data contained in all publications are solely those of the individual author(s) and contributor(s) and not of MDPI and/or the editor(s). MDPI and/or the editor(s) disclaim responsibility for any injury to people or property resulting from any ideas, methods, instructions or products referred to in the content. |
© 2023 by the authors. Licensee MDPI, Basel, Switzerland. This article is an open access article distributed under the terms and conditions of the Creative Commons Attribution (CC BY) license (https://creativecommons.org/licenses/by/4.0/).
Share and Cite
Jiang, Y.; Gao, F.; Zhang, S.; Cheng, W.; Liu, C.; Wang, S. MCSPF-Net: A Precipitation Forecasting Method Using Multi-Channel Cloud Observations of FY-4A Satellite by 3D Convolution Neural Network. Remote Sens. 2023, 15, 4536. https://doi.org/10.3390/rs15184536
Jiang Y, Gao F, Zhang S, Cheng W, Liu C, Wang S. MCSPF-Net: A Precipitation Forecasting Method Using Multi-Channel Cloud Observations of FY-4A Satellite by 3D Convolution Neural Network. Remote Sensing. 2023; 15(18):4536. https://doi.org/10.3390/rs15184536
Chicago/Turabian StyleJiang, Yuhang, Feng Gao, Shaoqing Zhang, Wei Cheng, Chang Liu, and Shudong Wang. 2023. "MCSPF-Net: A Precipitation Forecasting Method Using Multi-Channel Cloud Observations of FY-4A Satellite by 3D Convolution Neural Network" Remote Sensing 15, no. 18: 4536. https://doi.org/10.3390/rs15184536