
Comprehensive Sustainability Indicator for Land Resource-Carrying Capacity in a Farming-Pastoral Region


1
Key Laboratory of Land Surface Pattern and Simulation, Institute of Geographical Sciences and Natural Resources Research, Chinese Academy of Sciences, Beijing 100101, China
2
Institute of Qinghai-Tibetan Plateau, Southwest Minzu University, Chengdu 610041, China
3
Key Laboratory of Natural Resource Coupling Process and Effects, Ministry of Natural Resources, Beijing 100055, China
4
Key Laboratory of Ecosystem Network Observation and Modeling, Institute of Geographical Sciences and Natural Resources Research, Chinese Academy of Sciences, Beijing 100101, China
*
Author to whom correspondence should be addressed.
†
These authors contributed equally to this work.
Remote Sens. 2023, 15(15), 3726; https://doi.org/10.3390/rs15153726
Submission received: 21 May 2023
/
Revised: 18 June 2023
/
Accepted: 4 July 2023
/
Published: 26 July 2023
Abstract
:The Northeast Farming-pastoral ecotone (NFPE) in China is crucial for farming and pastoralism. However, sustainable development of land resources faces several challenges from human activities and environmental degradation. Thus, assessing land resource-carrying capacity (LRCC) is crucial for effective land-use planning and management. This study proposes a comprehensive indicator system to evaluate LRCC in the NFPE. We integrate remote sensing, model simulation, and statistical data, employing Geographic Information System analysis and statistical techniques to assess spatiotemporal evolution characteristics of LRCC. Findings indicate increasing LRCC with spatial-temporal heterogeneity. The northern region exhibits relatively high and growing LRCC, while some eastern regions have low LRCC but a high growth trend. The southern region displays both low LRCC and growth. Balancing regional development and ecological protection requires considering spatial heterogeneity of LRCC in land-use planning and management decisions, facilitating differentiated land-use strategies for sustainable development.
1. Introduction
Land is a finite and irreplaceable resource for human survival and development that provides essential ecological, social, and economic benefits, food security, biodiversity conservation, climate regulation, environmental protection, economic development, and cultural social values [1,2,3,4,5]. However, rapid economic growth, population increase, and urbanization have intensified the contradictions among population, resources, and environment [6]. The shortage of land resources and their deteriorating quality pose serious challenges to urban sustainable development and the growth of urban economies [7]. Global land resources are under early warning and overload [8]. Therefore, ensuring the sustainable use and management of land becomes crucial in meeting current and future needs while preserving the natural systems that sustain life on Earth.
The land resource-carrying capacity (LRCC) refers to the ability of various factors, such as population, production activities, and the ecological environment, to be sustained and supported by land resources within a specific period [9]. Typically, LRCC encompasses two aspects: ecological carrying capacity and socioeconomic carrying capacity. Ecological carrying capacity accounts for the impact of land resources on the maintenance of ecosystems [10]. Socioeconomic carrying capacity considers the influence of land resources on population and economic activities [11]. The assessment of LRCC plays a crucial role in effective land management, sustainable agriculture, and environmental science [12,13]. It enables us to evaluate the balance between human needs and the sustainable utilization of land resources, thereby informing decision-making processes in these fields. The comprehensive indicator system method incorporates multiple indicators to provide a comprehensive evaluation of LRCC. This approach considers various factors that influence land resources and their ability to support human activities. By integrating ecological, social, and economic factors, the comprehensive indicator system offers a more holistic perspective on LRCC than relying on individual indicators alone [14,15].
The Farming-pastoral ecotone in northeastern China serves as a transitional region between farming and pastoralism [16]. It is the climate confluence zone of semi-humid and semi-arid regions. This ecologically significant area boasts diverse ecosystems, including grasslands, forests, wetlands, and farmlands, all of which are vital for the region’s ecological, social, and economic development [17]. However, this region faces numerous environmental challenges, such as soil erosion, deforestation, overgrazing, and water pollution, which have been further intensified by human activities like logging, agriculture, and urbanization. In response, the Chinese government has implemented a series of conservation measures, such as reforestation programs, grassland restoration, and wetland protection [18]. Among these various factors, our focus is on examining the impacts of land use, ecological conditions, and human activities on the LRCC in this region.
In the Northeast Farming-pastoral ecotone (NFPE), with its abundant land resources and diverse land-use practices [19], it is essential to ensure rational resource utilization for coordinated development. We acknowledge the significance of comprehending the interplay between land use, population dynamics, and environmental conditions for achieving sustainable development in the region. Therefore, we developed a comprehensive four-level hierarchical indicator system to assess the LRCC in the NFPE. This system integrates remote sensing data, statistical data, and model simulation data. The indicator system encompasses a target layer, criterion layer, element layer, and indicator layer, covering aspects of the ecological system and social economy. By utilizing this system, we conducted a comprehensive evaluation of the spatial–temporal evolution characteristics of land resource-carrying capacity in the NFPE over the past 20 years. The study aims to provide scientific evidence and decision-making support for the sustainable development of the region.
2. Materials and Methods
2.1. Study Area
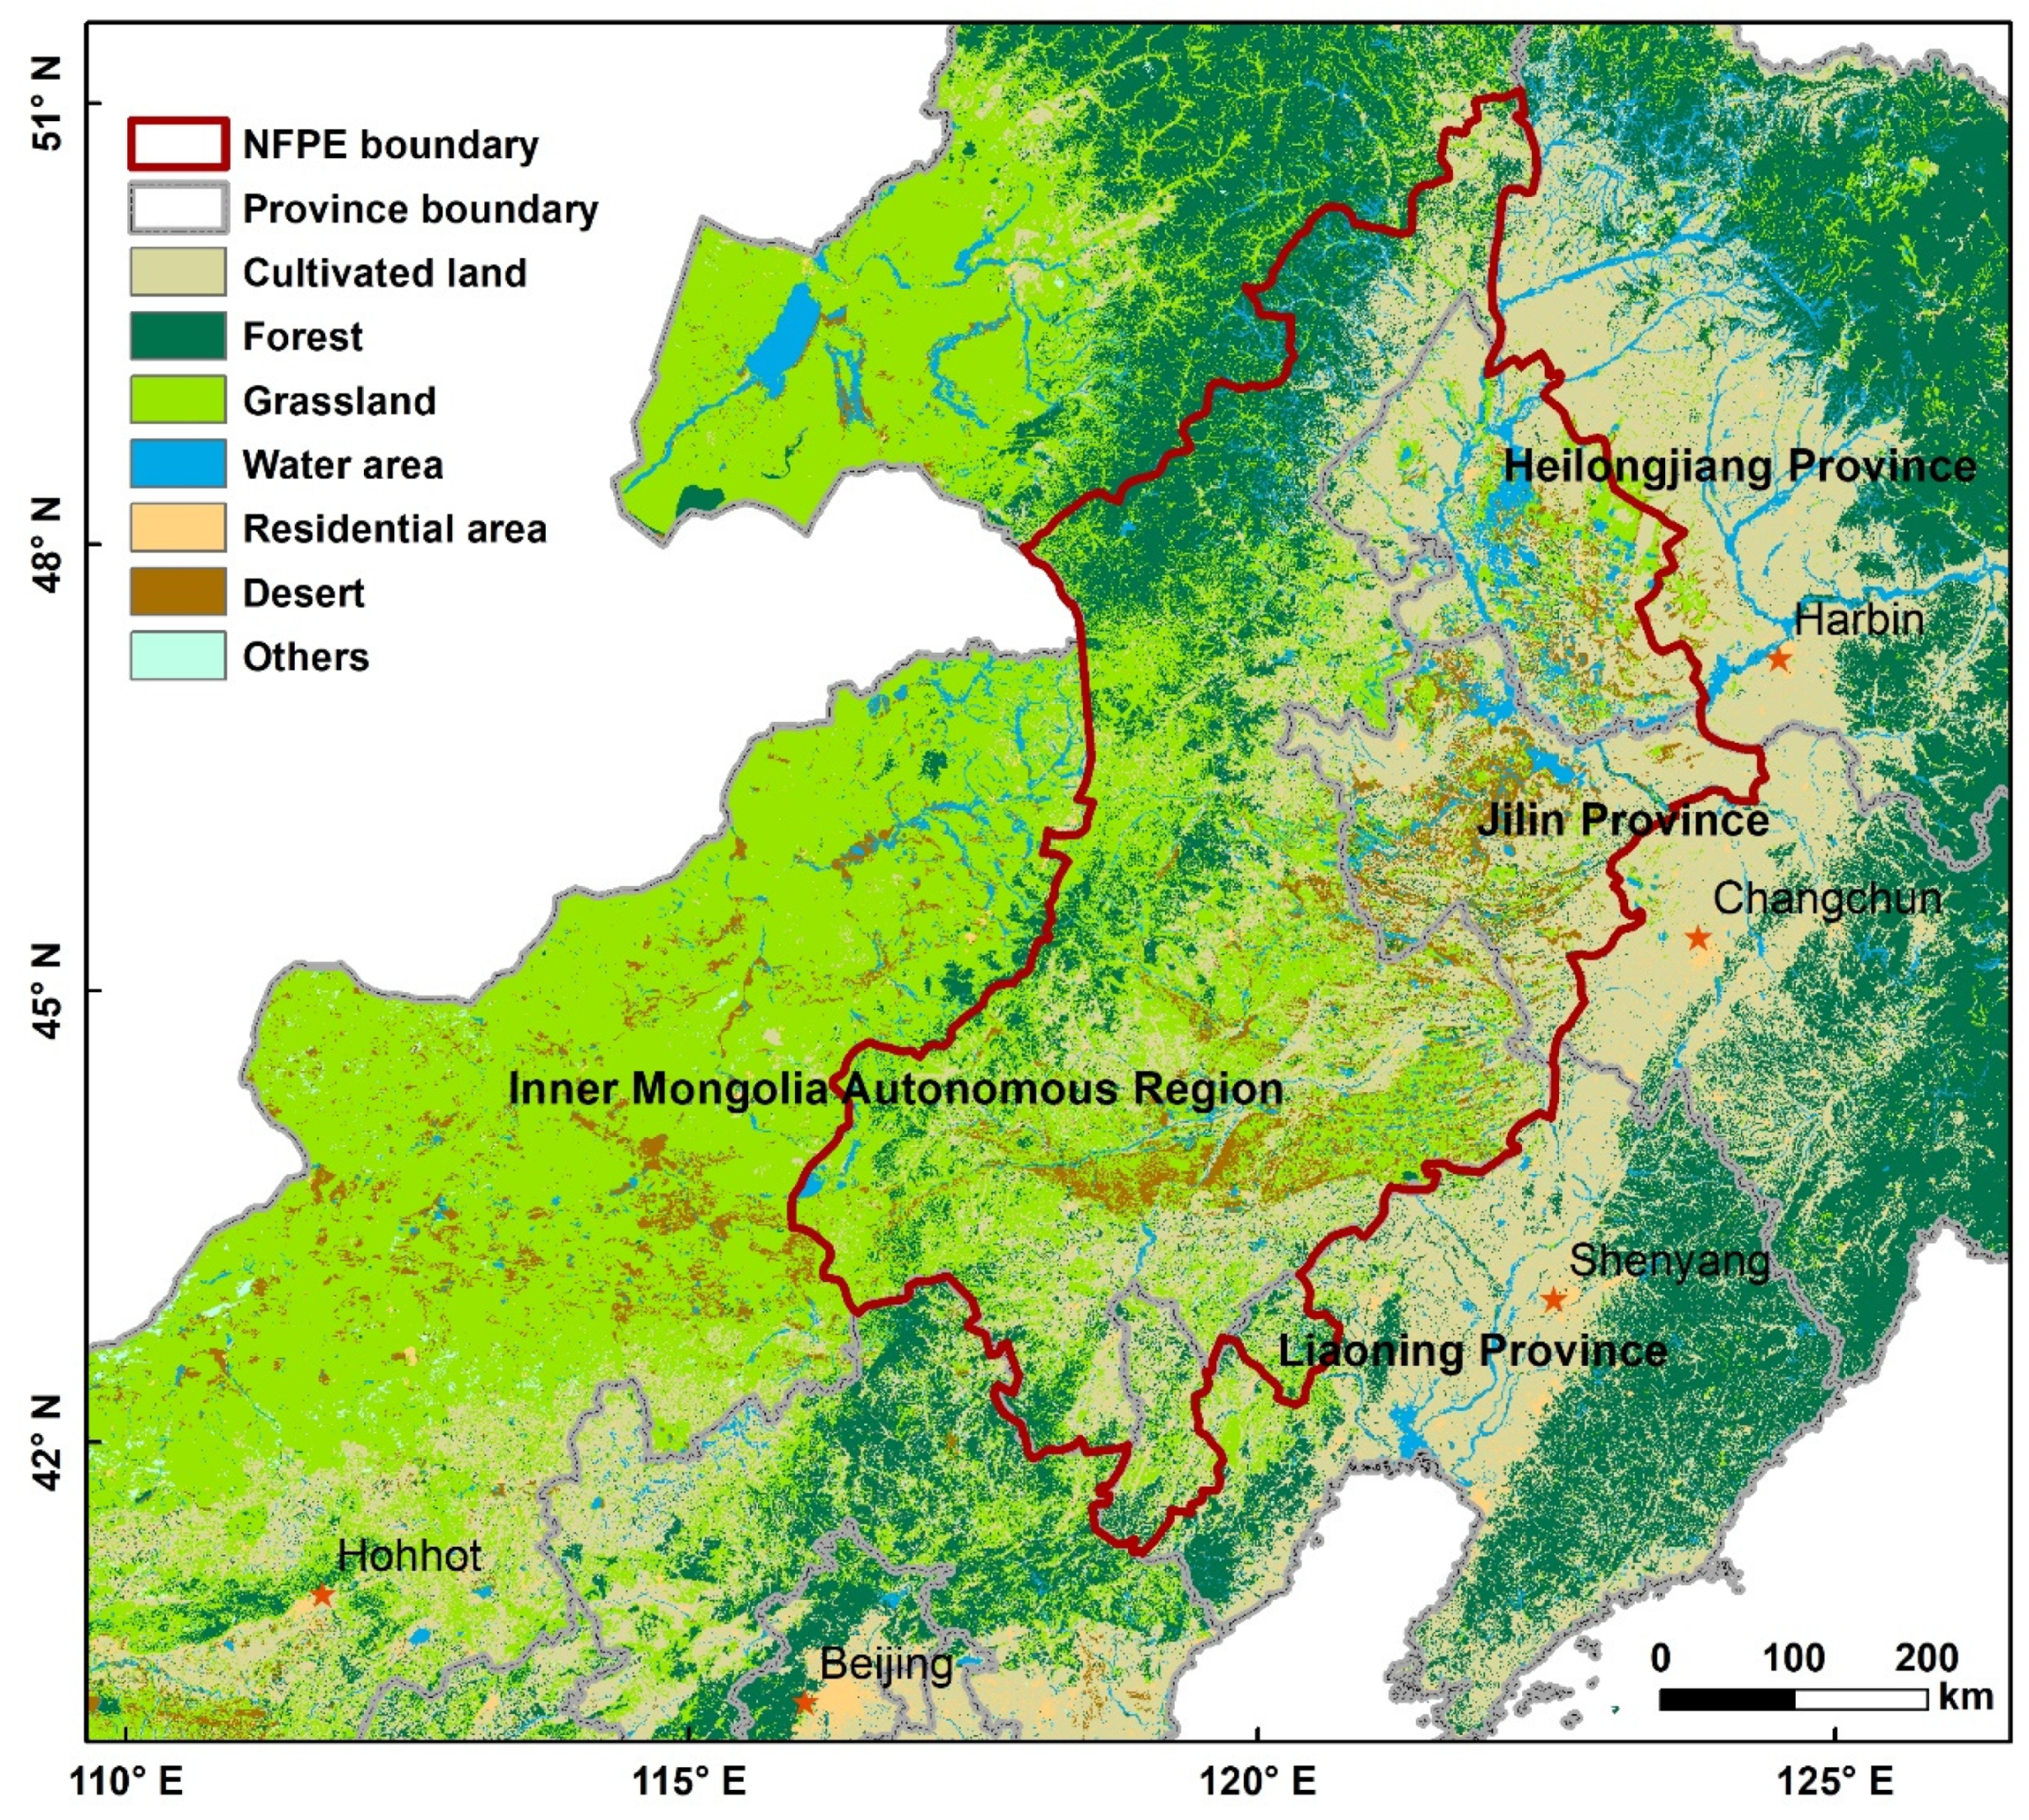
The NFPE is a transitional region located in northeastern China, connecting semi-humid farming districts with semi-arid pastoral regions. It spans from 116°21′E to 126°10′E and 40°36′N to 49°55′N, covering an area of 3.5 × 10⁵ km2 [20], situated at the intersection of Heilongjiang Province, Jilin Province, Liaoning Province, and Inner Mongolia Autonomous Region. The terrain gently slopes from the Mongolian Plateau in the west to the Northeast Plain in the east, with an average elevation of 479 m. The region has a typical temperate continental monsoon climate with distinct cold and warm seasons, wet and dry seasons, a mean annual temperature of 4.77 °C, and a mean annual precipitation of 425.20 mm. It is ecologically significant with diverse ecosystems, including grasslands, farmlands, forests, and wetlands, as well as a variety of soil types, such as chestnut soil, chernozem soil, wind-sand soil, and meadow soil (Figure 1). The region is also vital for constructing China’s “two screens and three belts” ecological security barriers and implementing major national ecological projects such as the Three North Shelterbelts, returning farmland to forests and grasslands, and Beijing–Tianjin sandstorm source control [21].
2.2. Methodology and Data
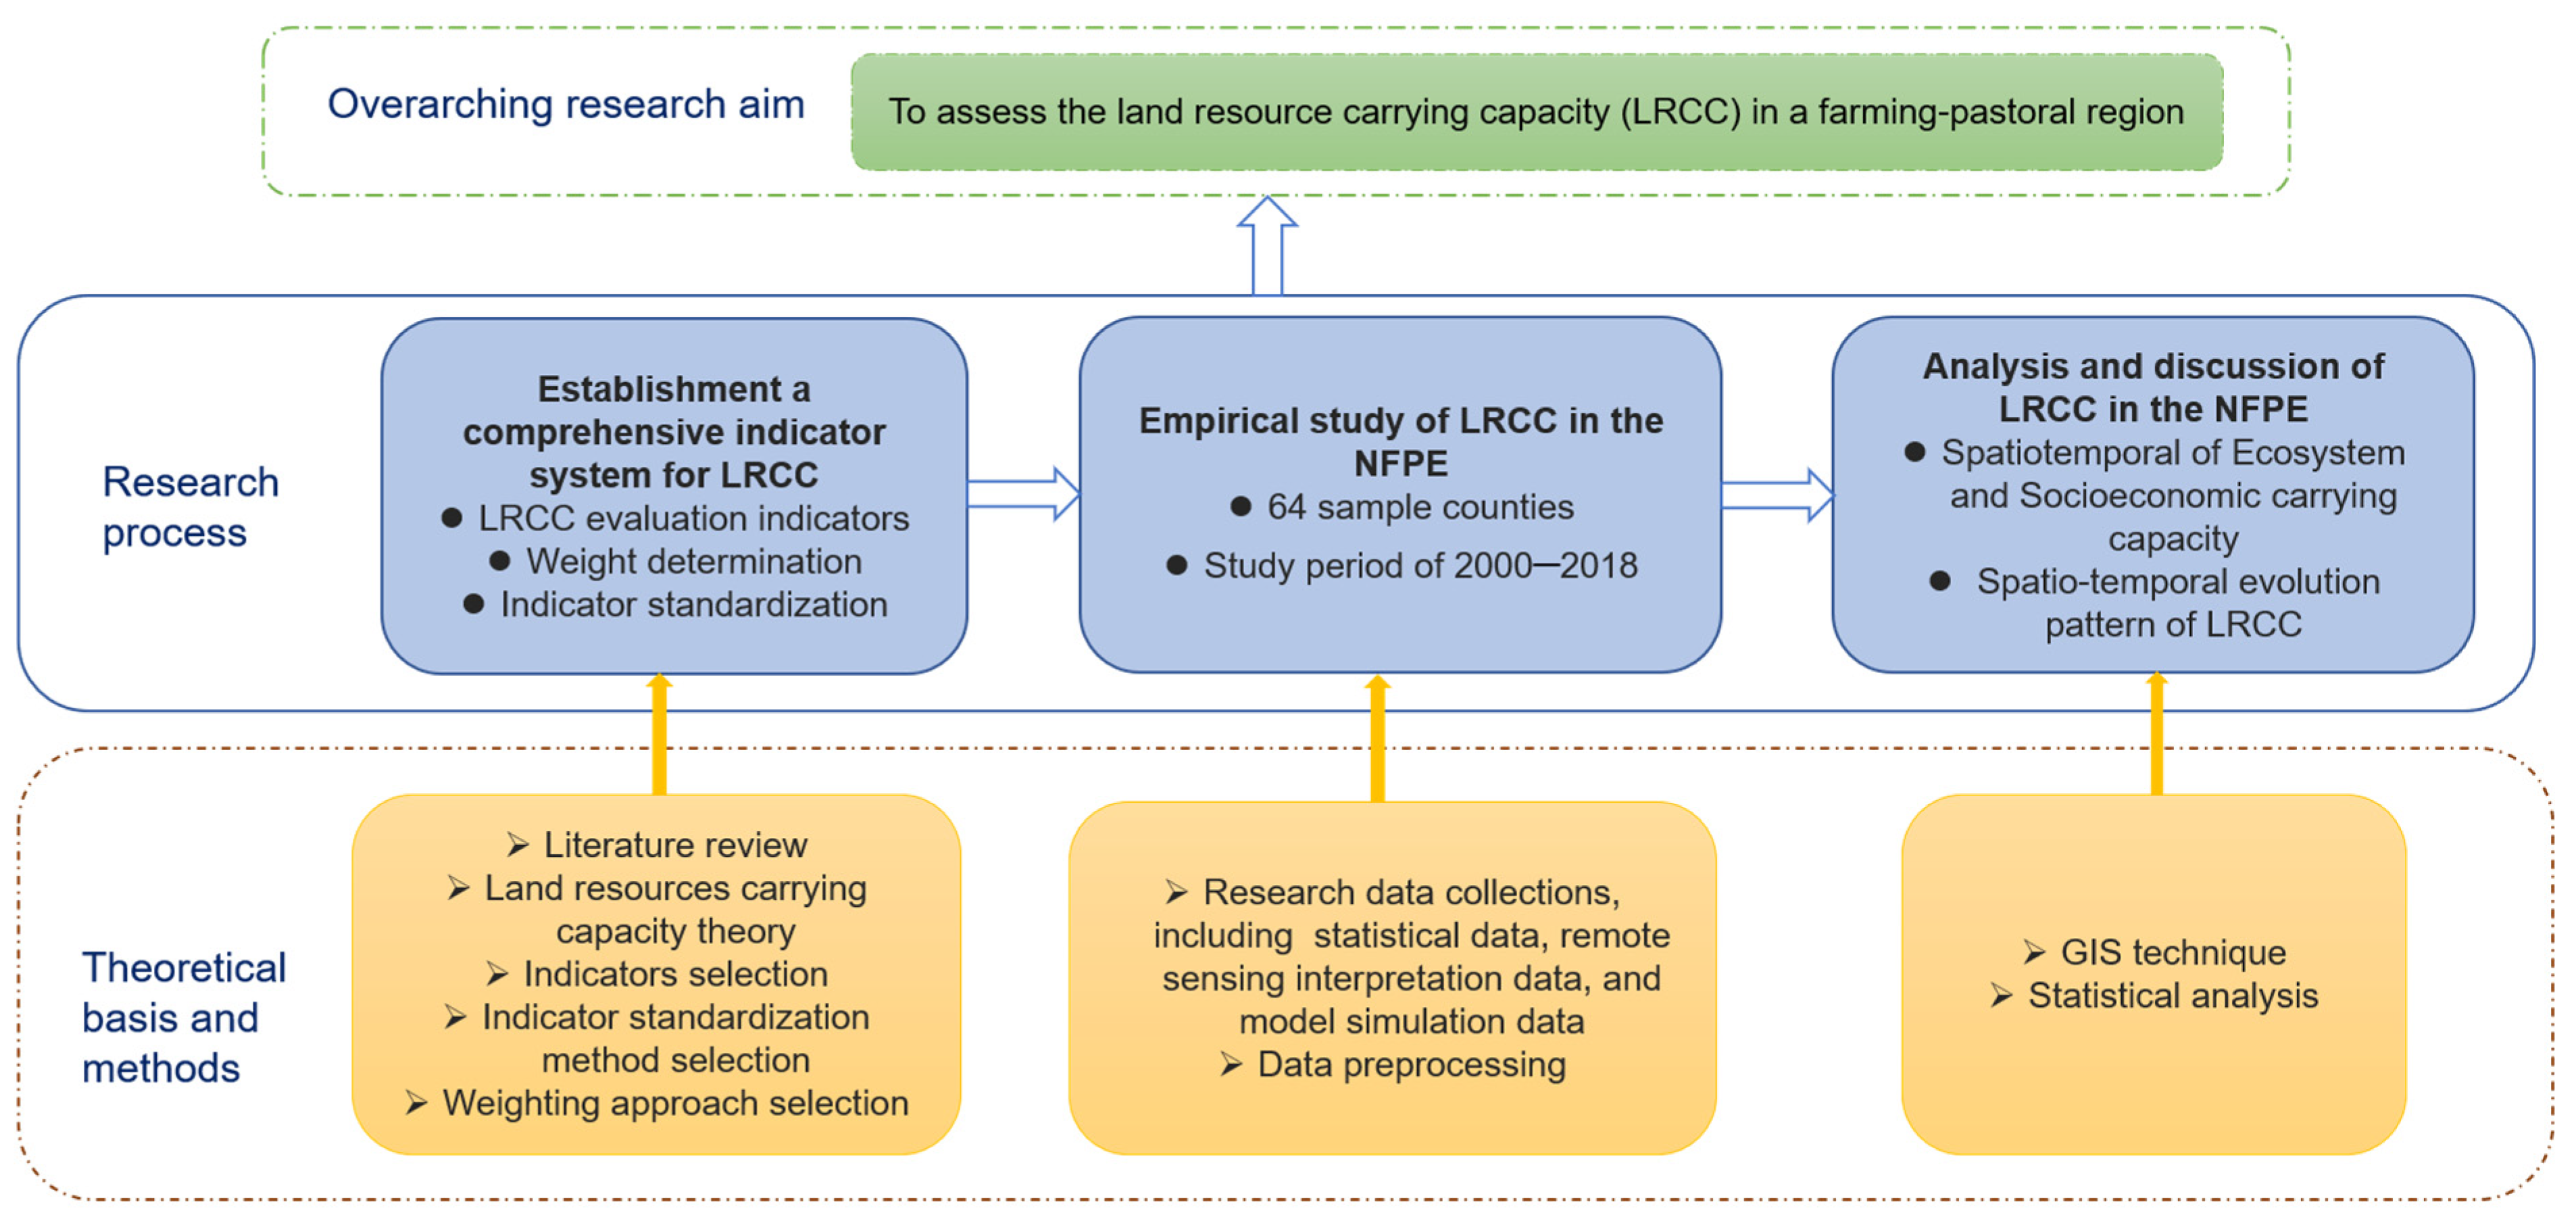
Here, based on the research objectives in the introduction, our research roadmap is as follows (Figure 2).
- (1)
- Establishing an Indicator System for Land Resource-Carrying Capacity
The indicator system of land resource-carrying capacity in the NFPE consists of 11 indicators, as presented in Table 1. When selecting indicators for the indicator system of LRCC, principles of independence, accessibility, and ease of operation should be considered to avoid redundancy of information between indicators. To establish an indicator system that is particularly fitting for the NFPE, a comprehensive view of the structure, process, and spatial pattern of the ecosystem was taken into account. The assessment methodology was based on the properties of operability, systematization, dynamics, comprehensiveness, and scientific rigor of the research. Relevant expert experience and literature data were combined to establish the indicator system using the analytic hierarchy process. The system was divided into four layers: target layer (land resource-carrying capacity), criterion layer (ecosystem carrying capacity and socioeconomic carrying capacity), element layer (grassland resource-carrying capacity, cultivated land resource-carrying capacity, other resources carrying capacity, construction scale carrying capacity of land resources, and population and economic carrying capacity of land resource), and indicator layer (grass yield per unit area, the proportion of grassland area, grassland coverage, per capita arable land area, per capita grain possession, the proportion of forest areas, the proportion of wetland areas, the added value of non-primary industry per unit of construction land, the proportion of construction lands, population density, and per capita gross domestic product (GDP)).
- (2)
- Data sources and processing
The detailed calculation methods for the 11 indicators are enumerated in Table 2. To calculate the 11 indicators in the comprehensive indicator system of LRCC, statistical data, remote-sensing data, and model simulation data were required. Socioeconomically, relevant indicators, such as population quantity, food production, and the output value of three industries, were acquired from the annual China Statistical Yearbook and used in calculating these indicators [22]. The primary remote sensing interpretation data were ecosystem-type datasets of the study area, which aided in quantifying various ecosystem types’ areas. The ecosystem types’ datasets, with a resolution of 1 km × 1 km, were manually interpreted based on Landsat imagery [23]. Grass yield and vegetation coverage were estimated through model simulations. The empirical model of grass yield established by Xu et al. [24] in the northeast temperate semi-humid grassland zone was used to evaluate grass yield, while vegetation cover was calculated using the dimidiate pixel model [25].
- (3)
- Standardizing indicators
As the indicator system for assessing LRCC covers multiple fields, such as population, construction scale, economy, and ecology, each indicator has different dimensions that make cross-indicator comparison challenging. To overcome this limitation, it is essential to standardize these indicators by mapping them onto a uniform value range that enables a fair comparison [26]. In this study, we used the range normalization method to standardize each indicator. Additionally, we categorized the indicators into ‘anticipated indicators’ (+) and ‘restrained indicators’ (−), based on their impact on LRCC. Anticipated indicators are those with a positive correlation to LRCC, where higher values indicate greater LRCC (Equation (1) for standardization). Conversely, restrained indicators are those with an inverse relationship to LRCC, where lower values indicate greater LRCC (Equation (2) for standardization).
where is the standardized value of indicator ; is the actual value of indicator ; and are the maximum and minimum values, respectively, observed for indicator across all counties and the time period of 2000 to 2018. This ensures that the calculations account for the variability in indicator values across counties and the specified time period. The dimensionless treatment of the data ensures that values with larger magnitudes are positively associated with the promotion of land resource-carrying capacity.
- (4)
- Determining the weights of indicators
The Analytic Hierarchy Process (AHP) is a method that can decompose complex problems into several layers and factors, which simplifies comparisons among the factors and helps to determine indicator weights [27,28]. AHP, when combined with an expert scoring method, can capture key issues of the study area based on expert experience, making it one of the primary methods for determining indicator weights in a comprehensive indicator evaluation method [29]. To apply the AHP method, relevant factors are initially stratified from top to bottom according to the actual problems, beginning with the target layer, followed by the criterion layer, element layer, and indicator layer. Then, a judgment matrix is built, with lower-layer factors influencing higher-layer ones, while factors within the same layer exhibit relative independence. Based on the judgment matrix, we invited subject matter experts including researchers and policymakers from various organizations with extensive knowledge of the NFPE, to score for the relative importance of indicators in criterion, element, and indicator layers. To derive the comprehensive weights of the indicators, we calculate the product of the relative importance assigned at each level. This approach enables us to consider the relative importance of different levels and elements, ensuring a scientifically and logically grounded determination of the overall weights. By multiplying the weights of each level, we achieve a comprehensive assessment that appropriately reflects the significance of various factors within the framework. The formula used for calculating the weight was as follows:
where is the weight of indicator , , , and are the relative importance of indicator in the criterion, element, and indicator layers, respectively.
- (5)
- Evaluation model for LRCC
To aggregate all the indicators, we established the Land Resources Carrying Capacity Index (LRCCI), which is calculated using the following equations:
where is the standardized value of indicator ; is the weight of indicator . The LRCCI ranges from 0 to 1, with higher values indicating a better LRCC.
The linear slope of LRCCI over time depicted the geographical differences and trends effectively and precisely [30]. A negative value of the slope indicates an overall decrease in LRCC; a positive value indicates an increase in LRCC. The changing trend was calculated for each county/pixel for certain periods via ArcGIS using the following formula:
where n is the study period and Yi represents the LRCCI for the year i (i = 1,2…n); here, i is the sequence number of the year.
3. Results
3.1. Indicator Weighting Analysis
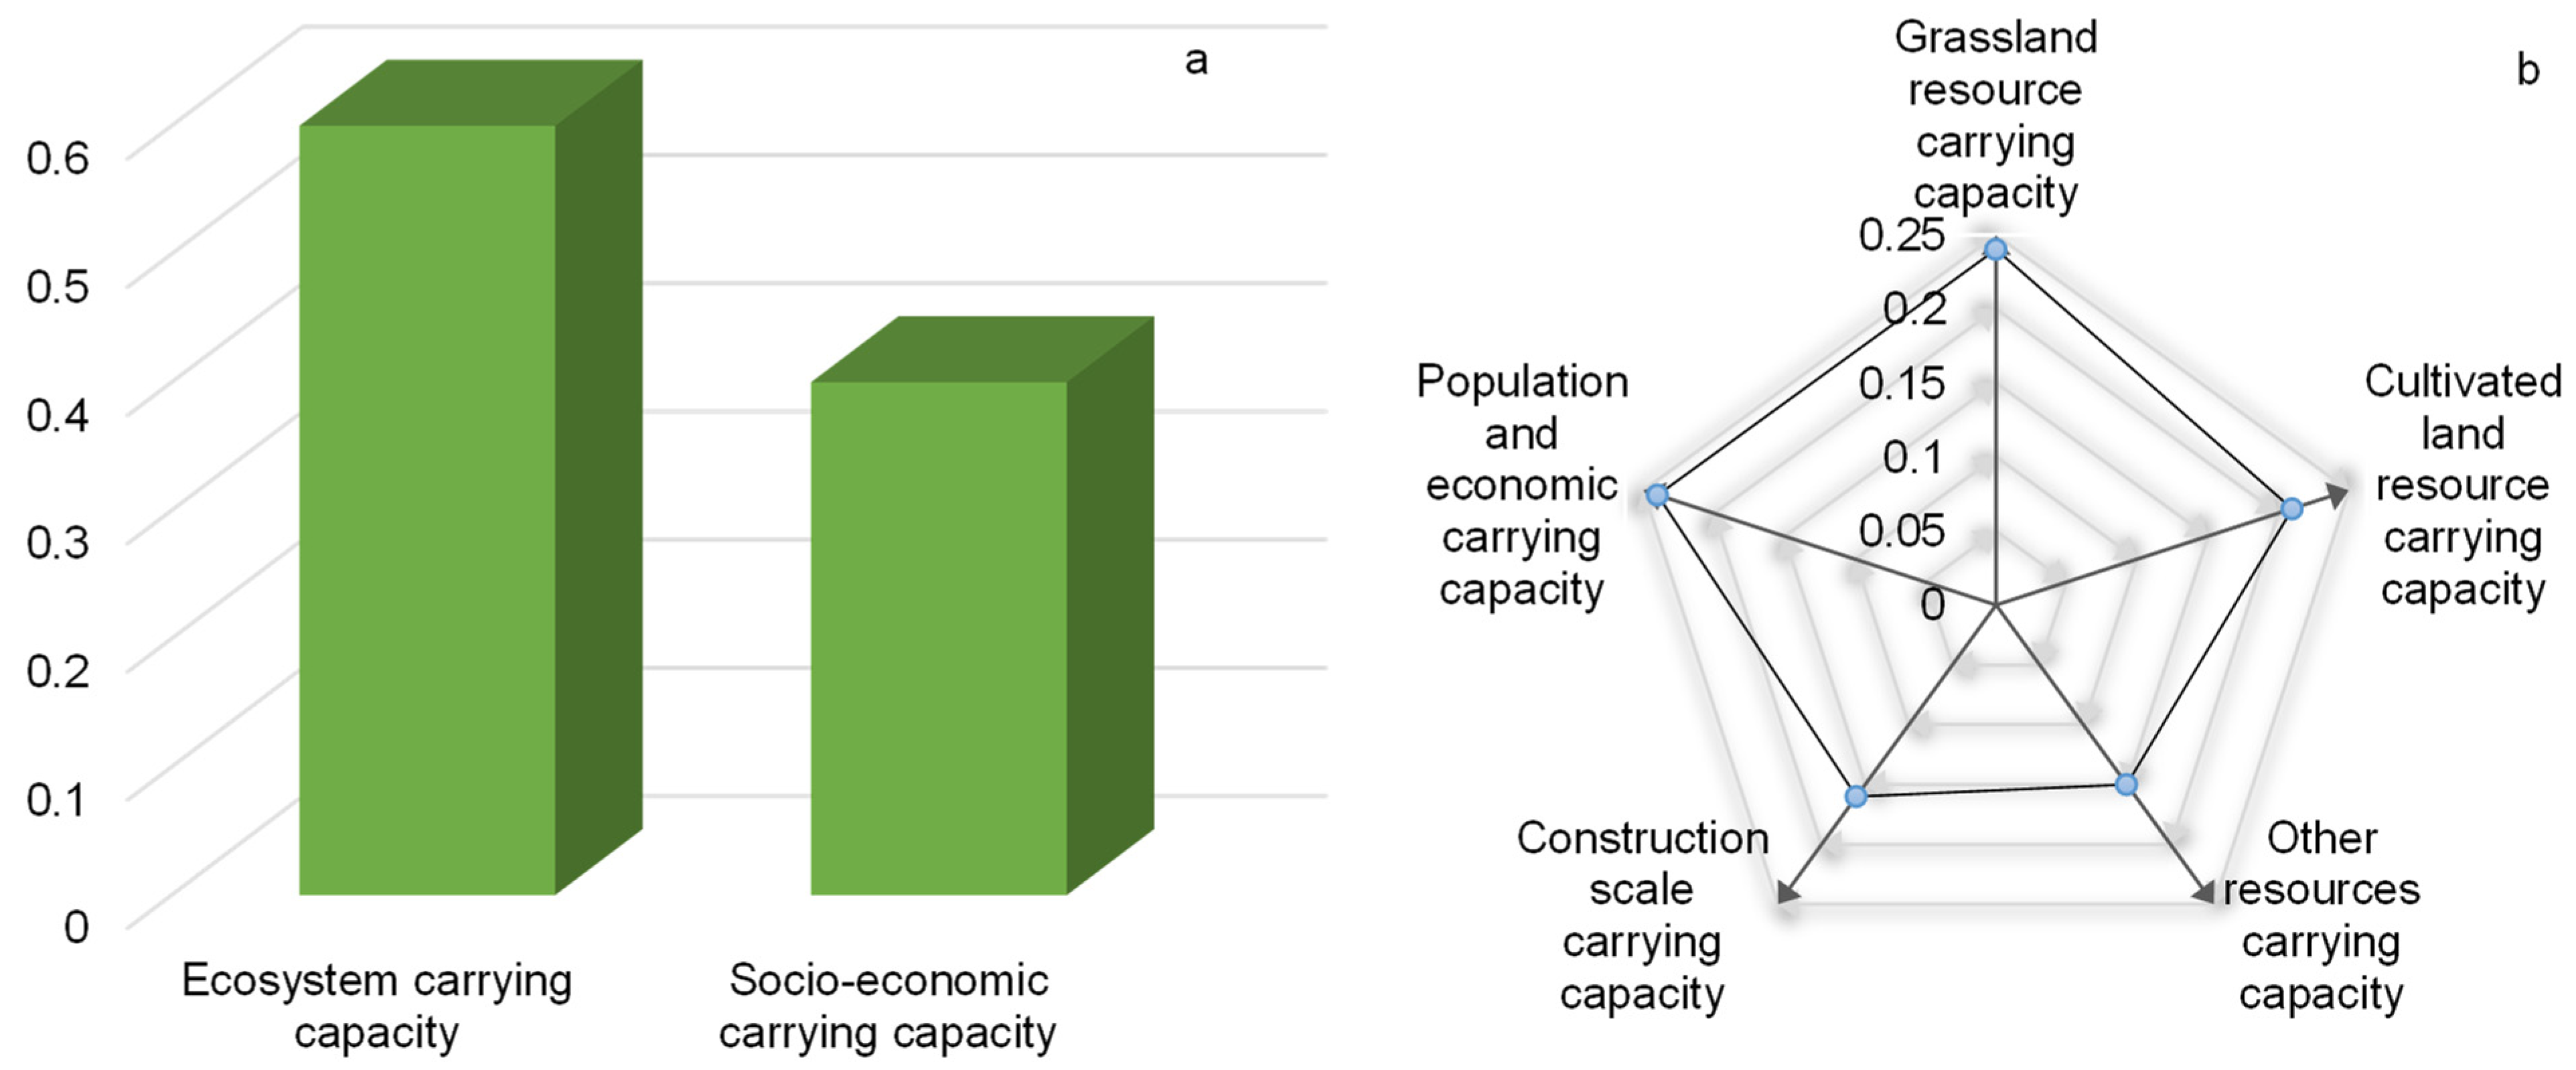
As Figure 3 shows, the weights assigned to ecosystem carrying capacity and socio-economic carrying capacity are 0.6 and 0.4 in the criterion layer, respectively. Within the element layer, higher weights are given to grassland resource-carrying capacity, population economic carrying capacity, and cultivated land resource-carrying capacity, while the weights assigned to construction scale-carrying capacity and other resource-carrying capacity are relatively lower. Table 3 presents the comprehensive weights of the indicators. The weight of per capita GDP and population density are relatively high, while the proportion of wetland areas and added value of non-primary industry per unit of construction land are relatively low.
3.2. Ecosystem Carrying Capacity
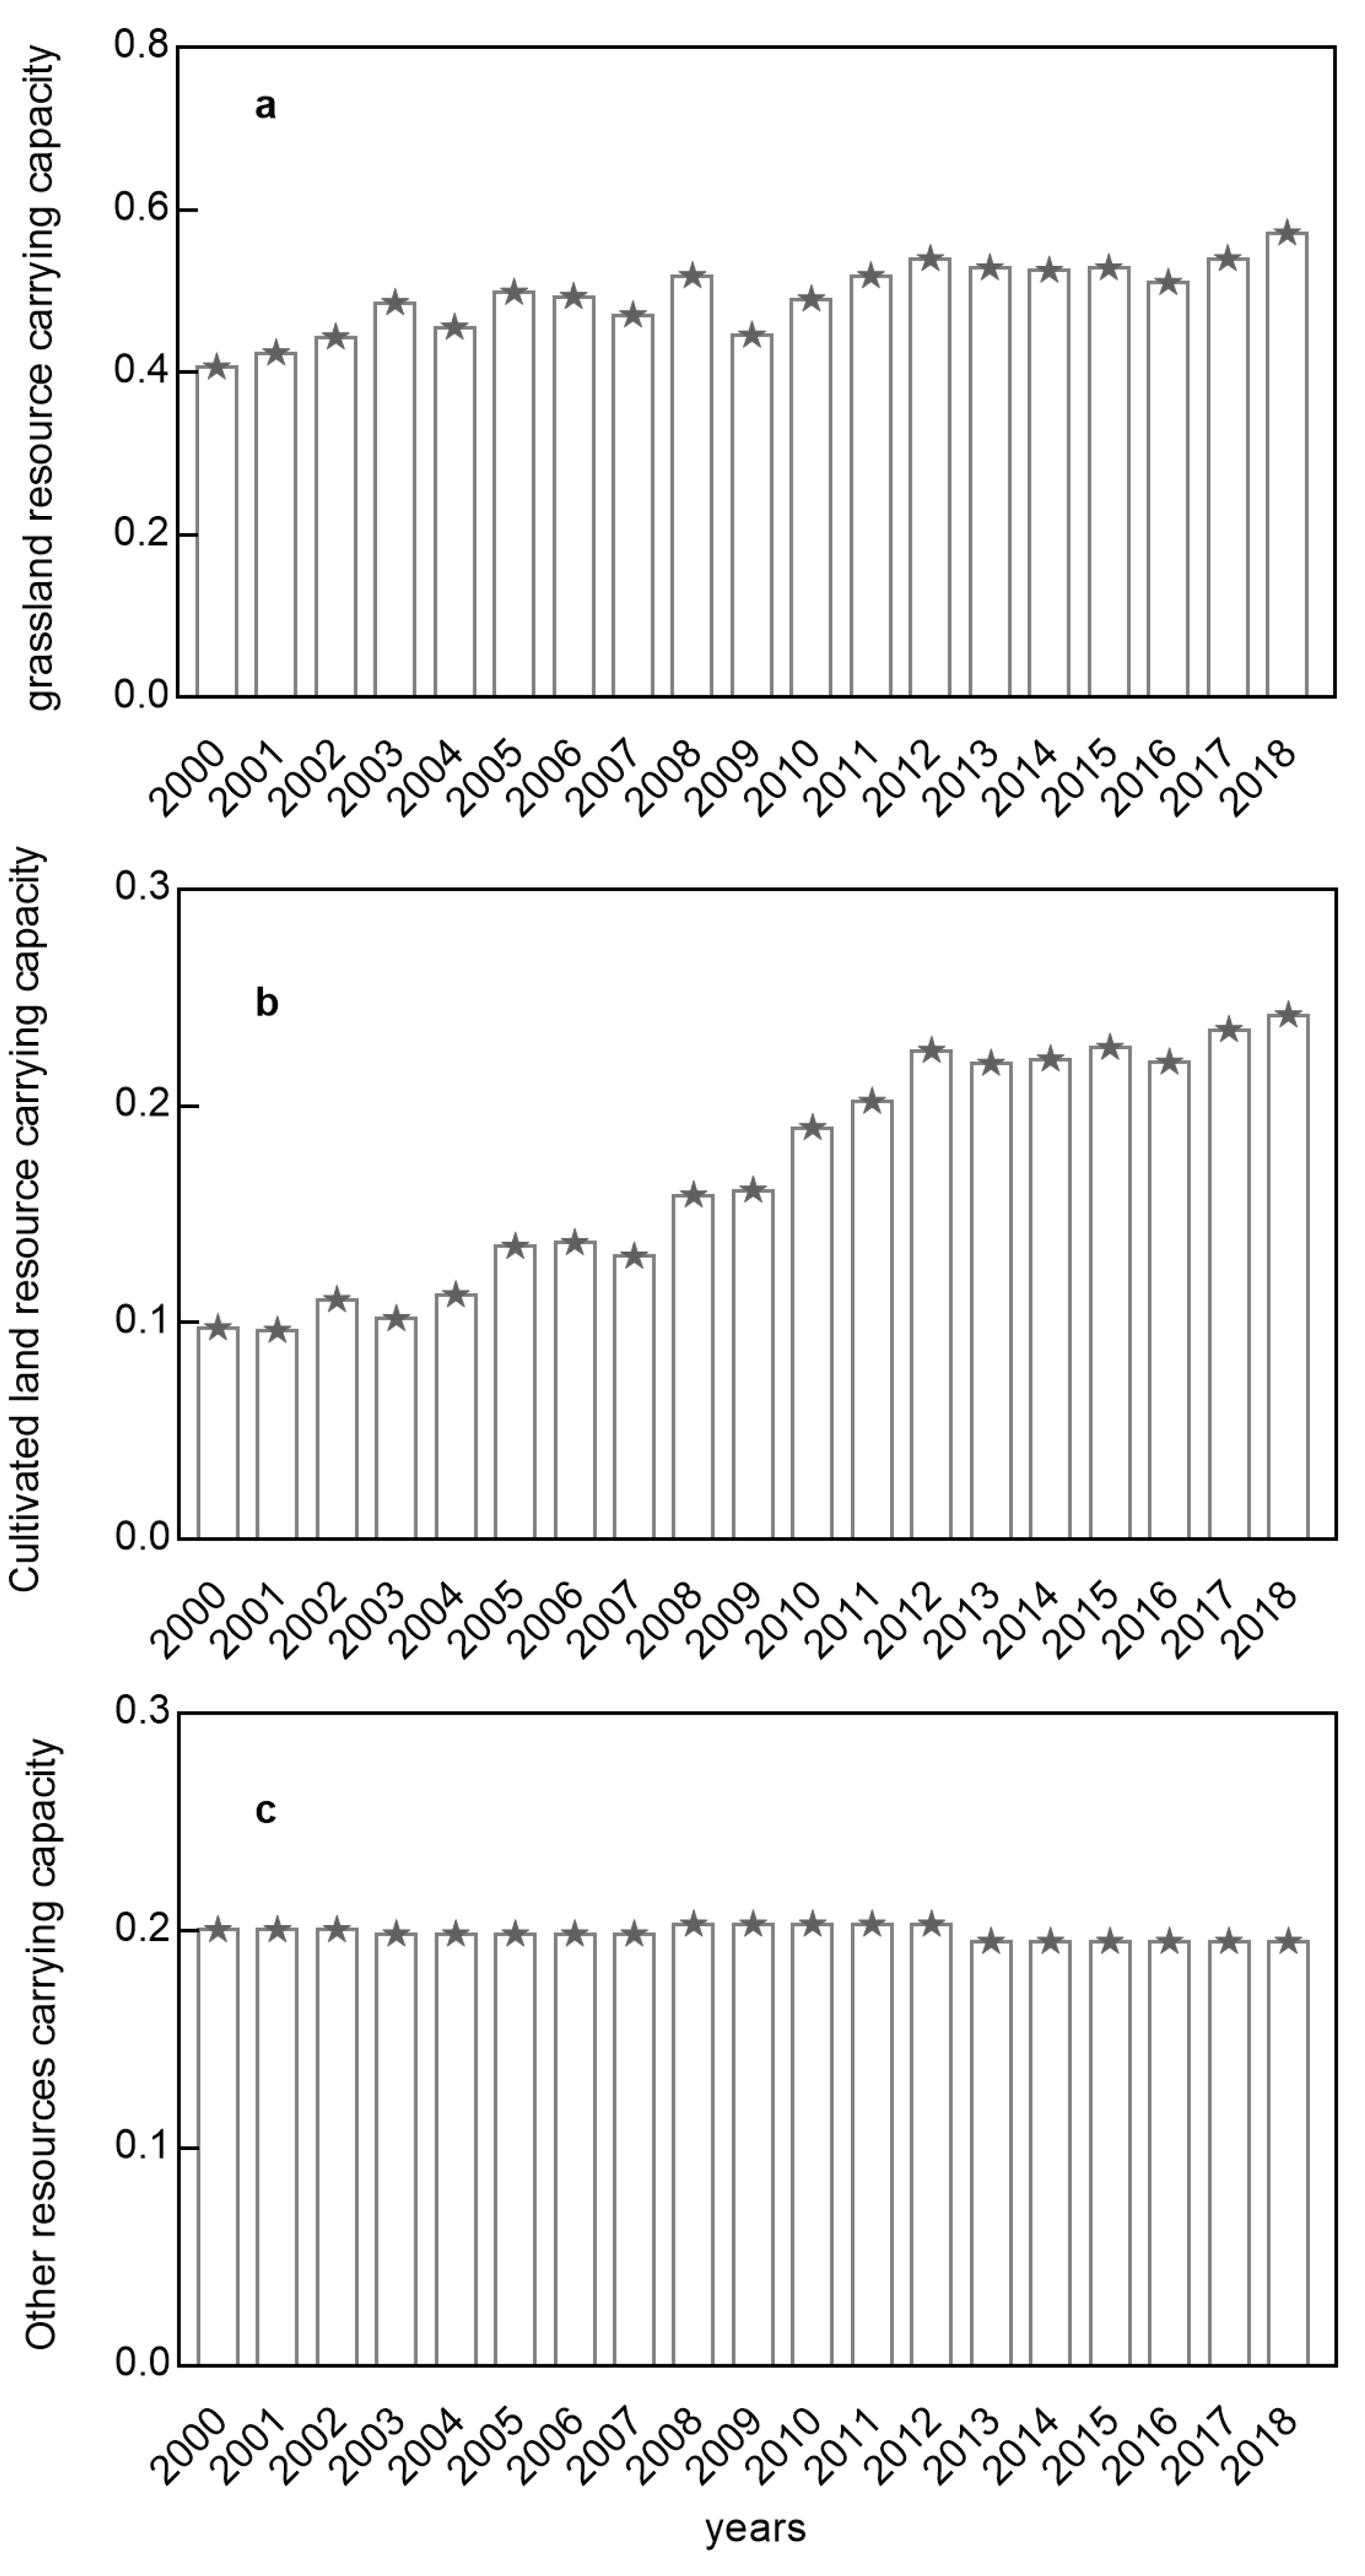
According to Figure 4, the carrying capacity of grassland resources in the NFPE exhibited a fluctuating upward trend from 2000 to 2018. The carrying capacity of grassland resources increased from 0.41 in 2000 to 0.57 in 2018, with an average annual increase of 0.007. Notably, the carrying capacity of grassland resources decreased to a low of 0.45 in 2009 before recovering to a higher level. In contrast, the carrying capacity of cultivated land resources showed a steady upward trend. The annual average carrying capacity of cultivated land resources in the NFPE was 0.17, increasing from 0.01 in 2000 to 0.24 in 2018, with an average annual increase of 0.009. Finally, the carrying capacity of other resources exhibited a relatively stable fluctuation trend, with an average annual carrying capacity of 0.20 in the NFPE.
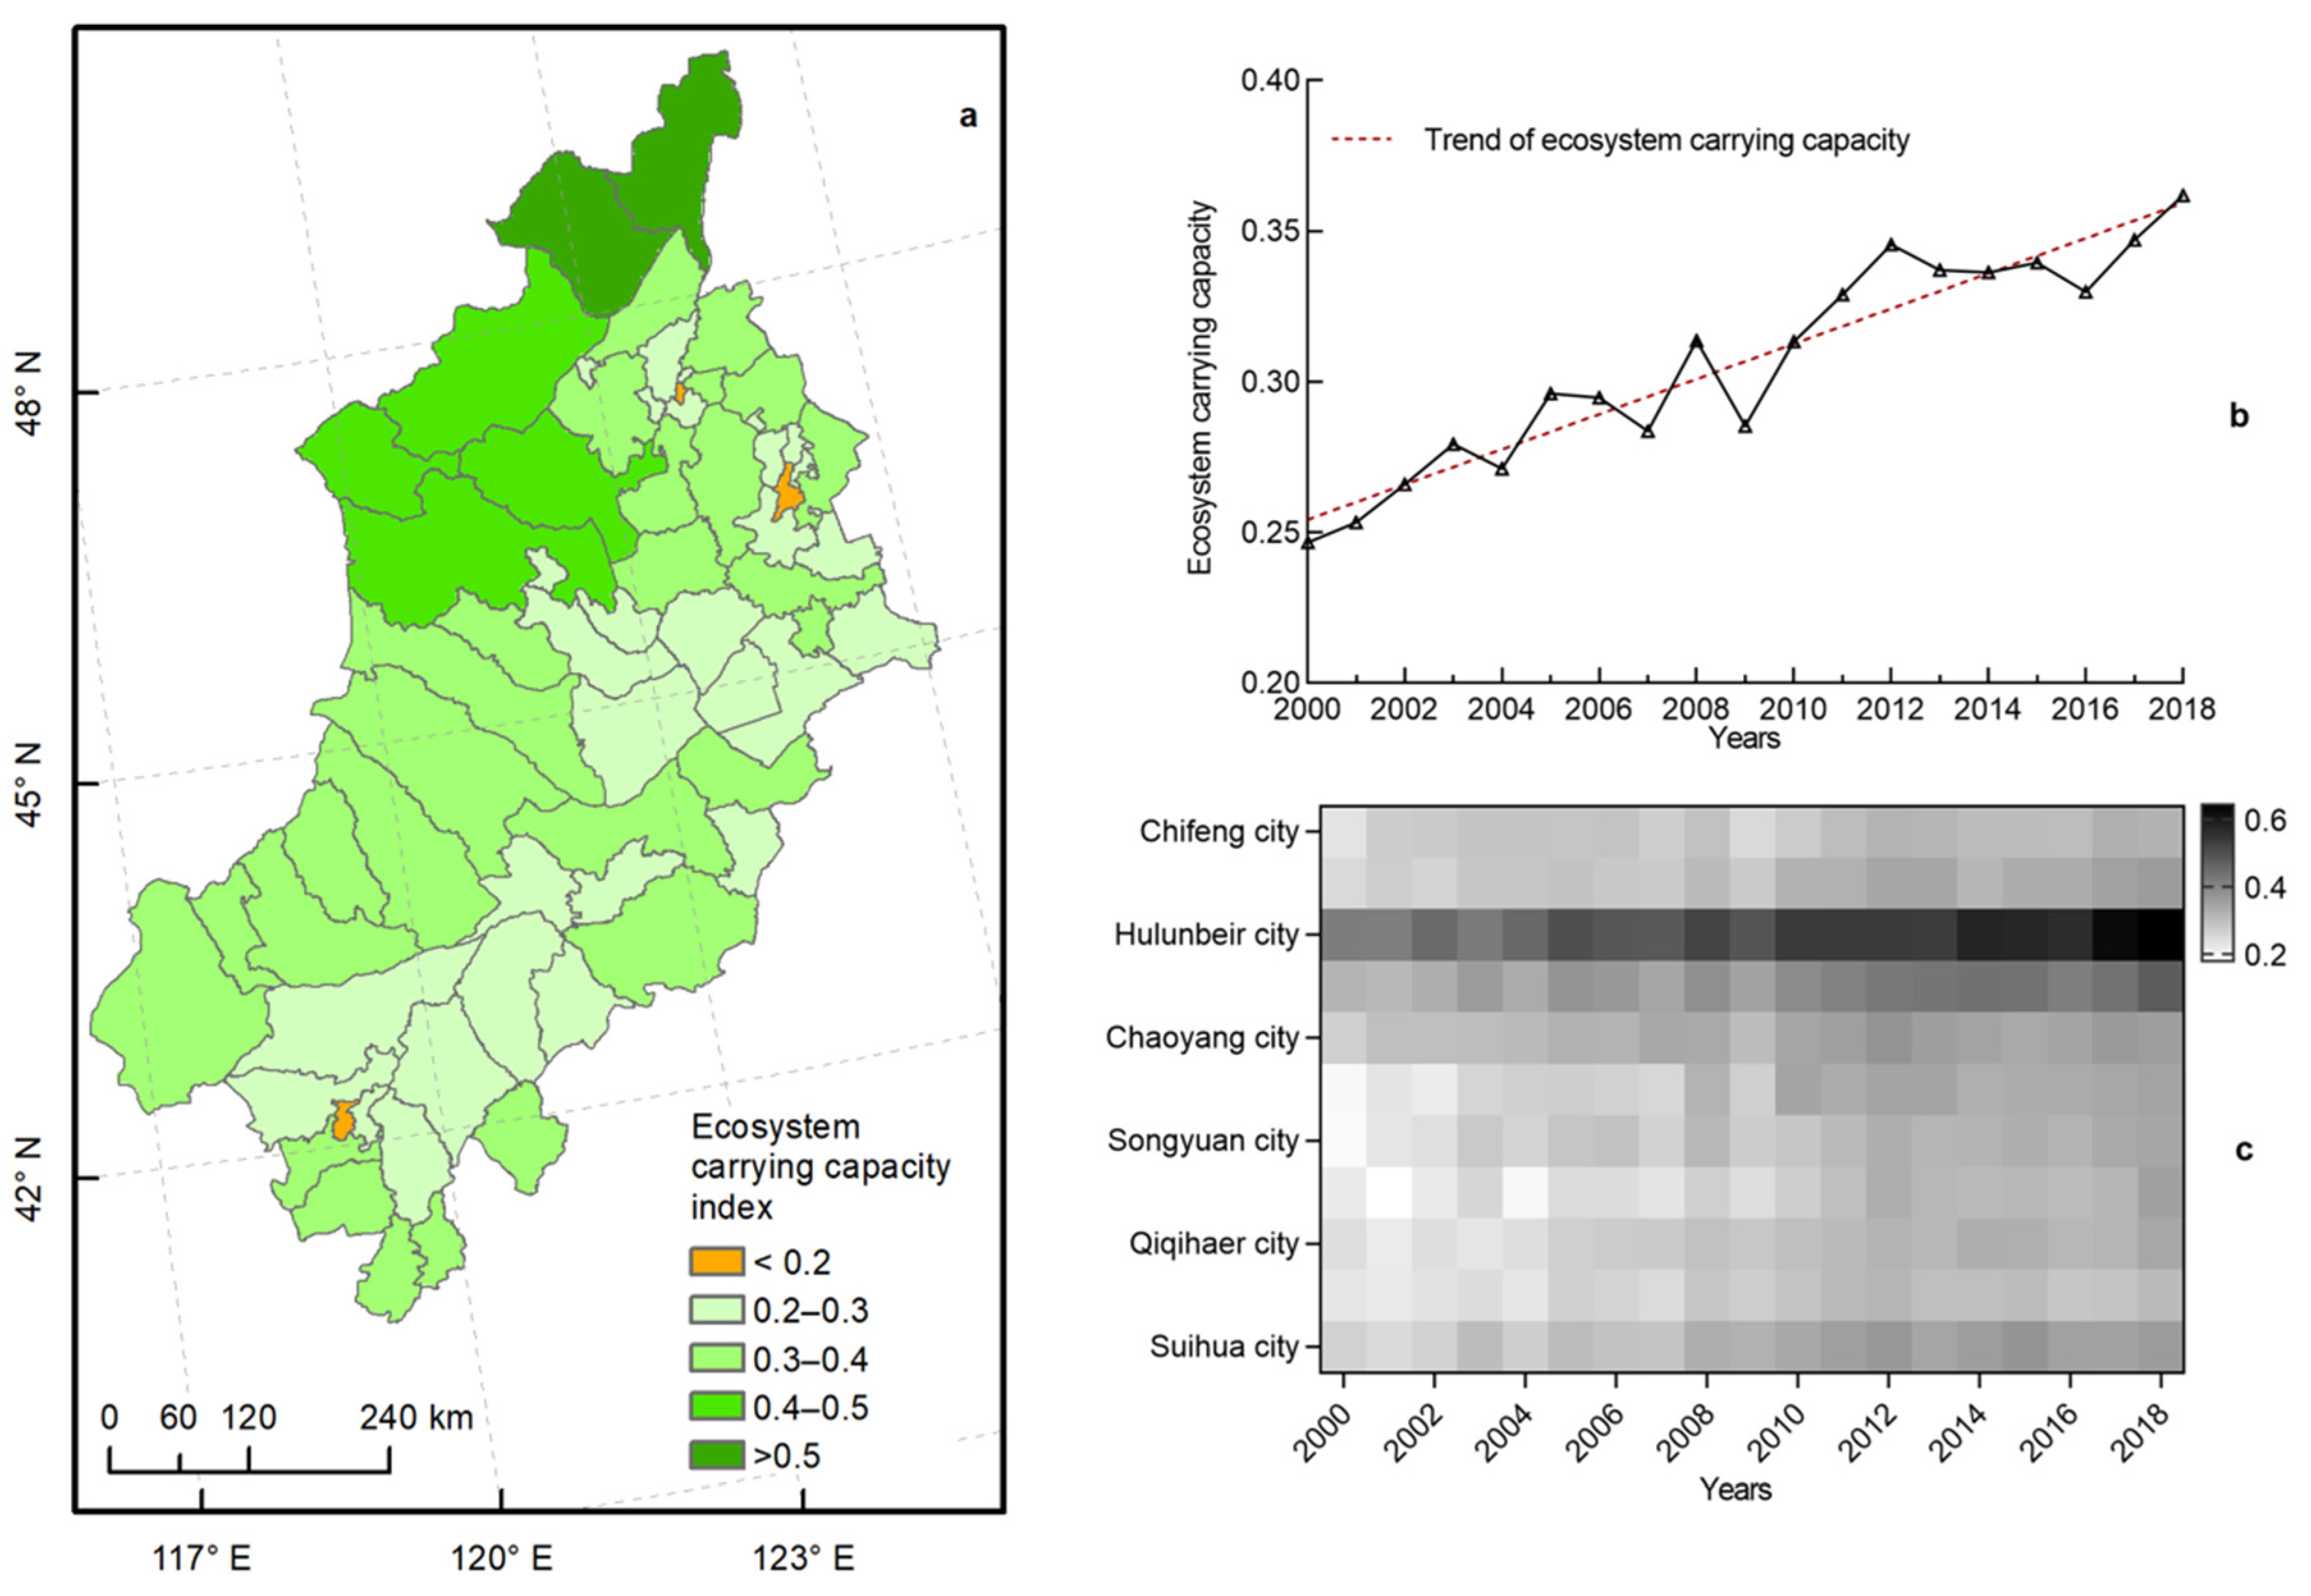
Figure 5a illustrates the spatial heterogeneity of ecosystem carrying capacity from 2000 to 2018. The ecological carrying capacity of most areas ranged from 0.2 to 0.4, with the northern part having a relatively higher carrying capacity while some parts of the central and southern regions having a lower carrying capacity.
Figure 5b presents the trend of ecosystem carrying capacity of the NFPE over the past 19 years. The carrying capacity gradually increased from 0.26 in 2000 to 0.36 in 2018. On average, the region had an annual carrying capacity of 0.31, with a yearly increase of 0.006. Analyzing the ecosystem carrying capacity of each league city, Figure 5c shows Hulun Buir City had the highest carrying capacity, with an annual average of 0.51, followed by Chaoyang City (0.38), and Baicheng City had the lowest carrying capacity (0.27). The highest average annual increase in ecosystem carrying capacity was also in HulunBuir City (0.01), while the lowest was in Chifeng City (0.003).
3.3. Socioeconomic Carrying Capacity
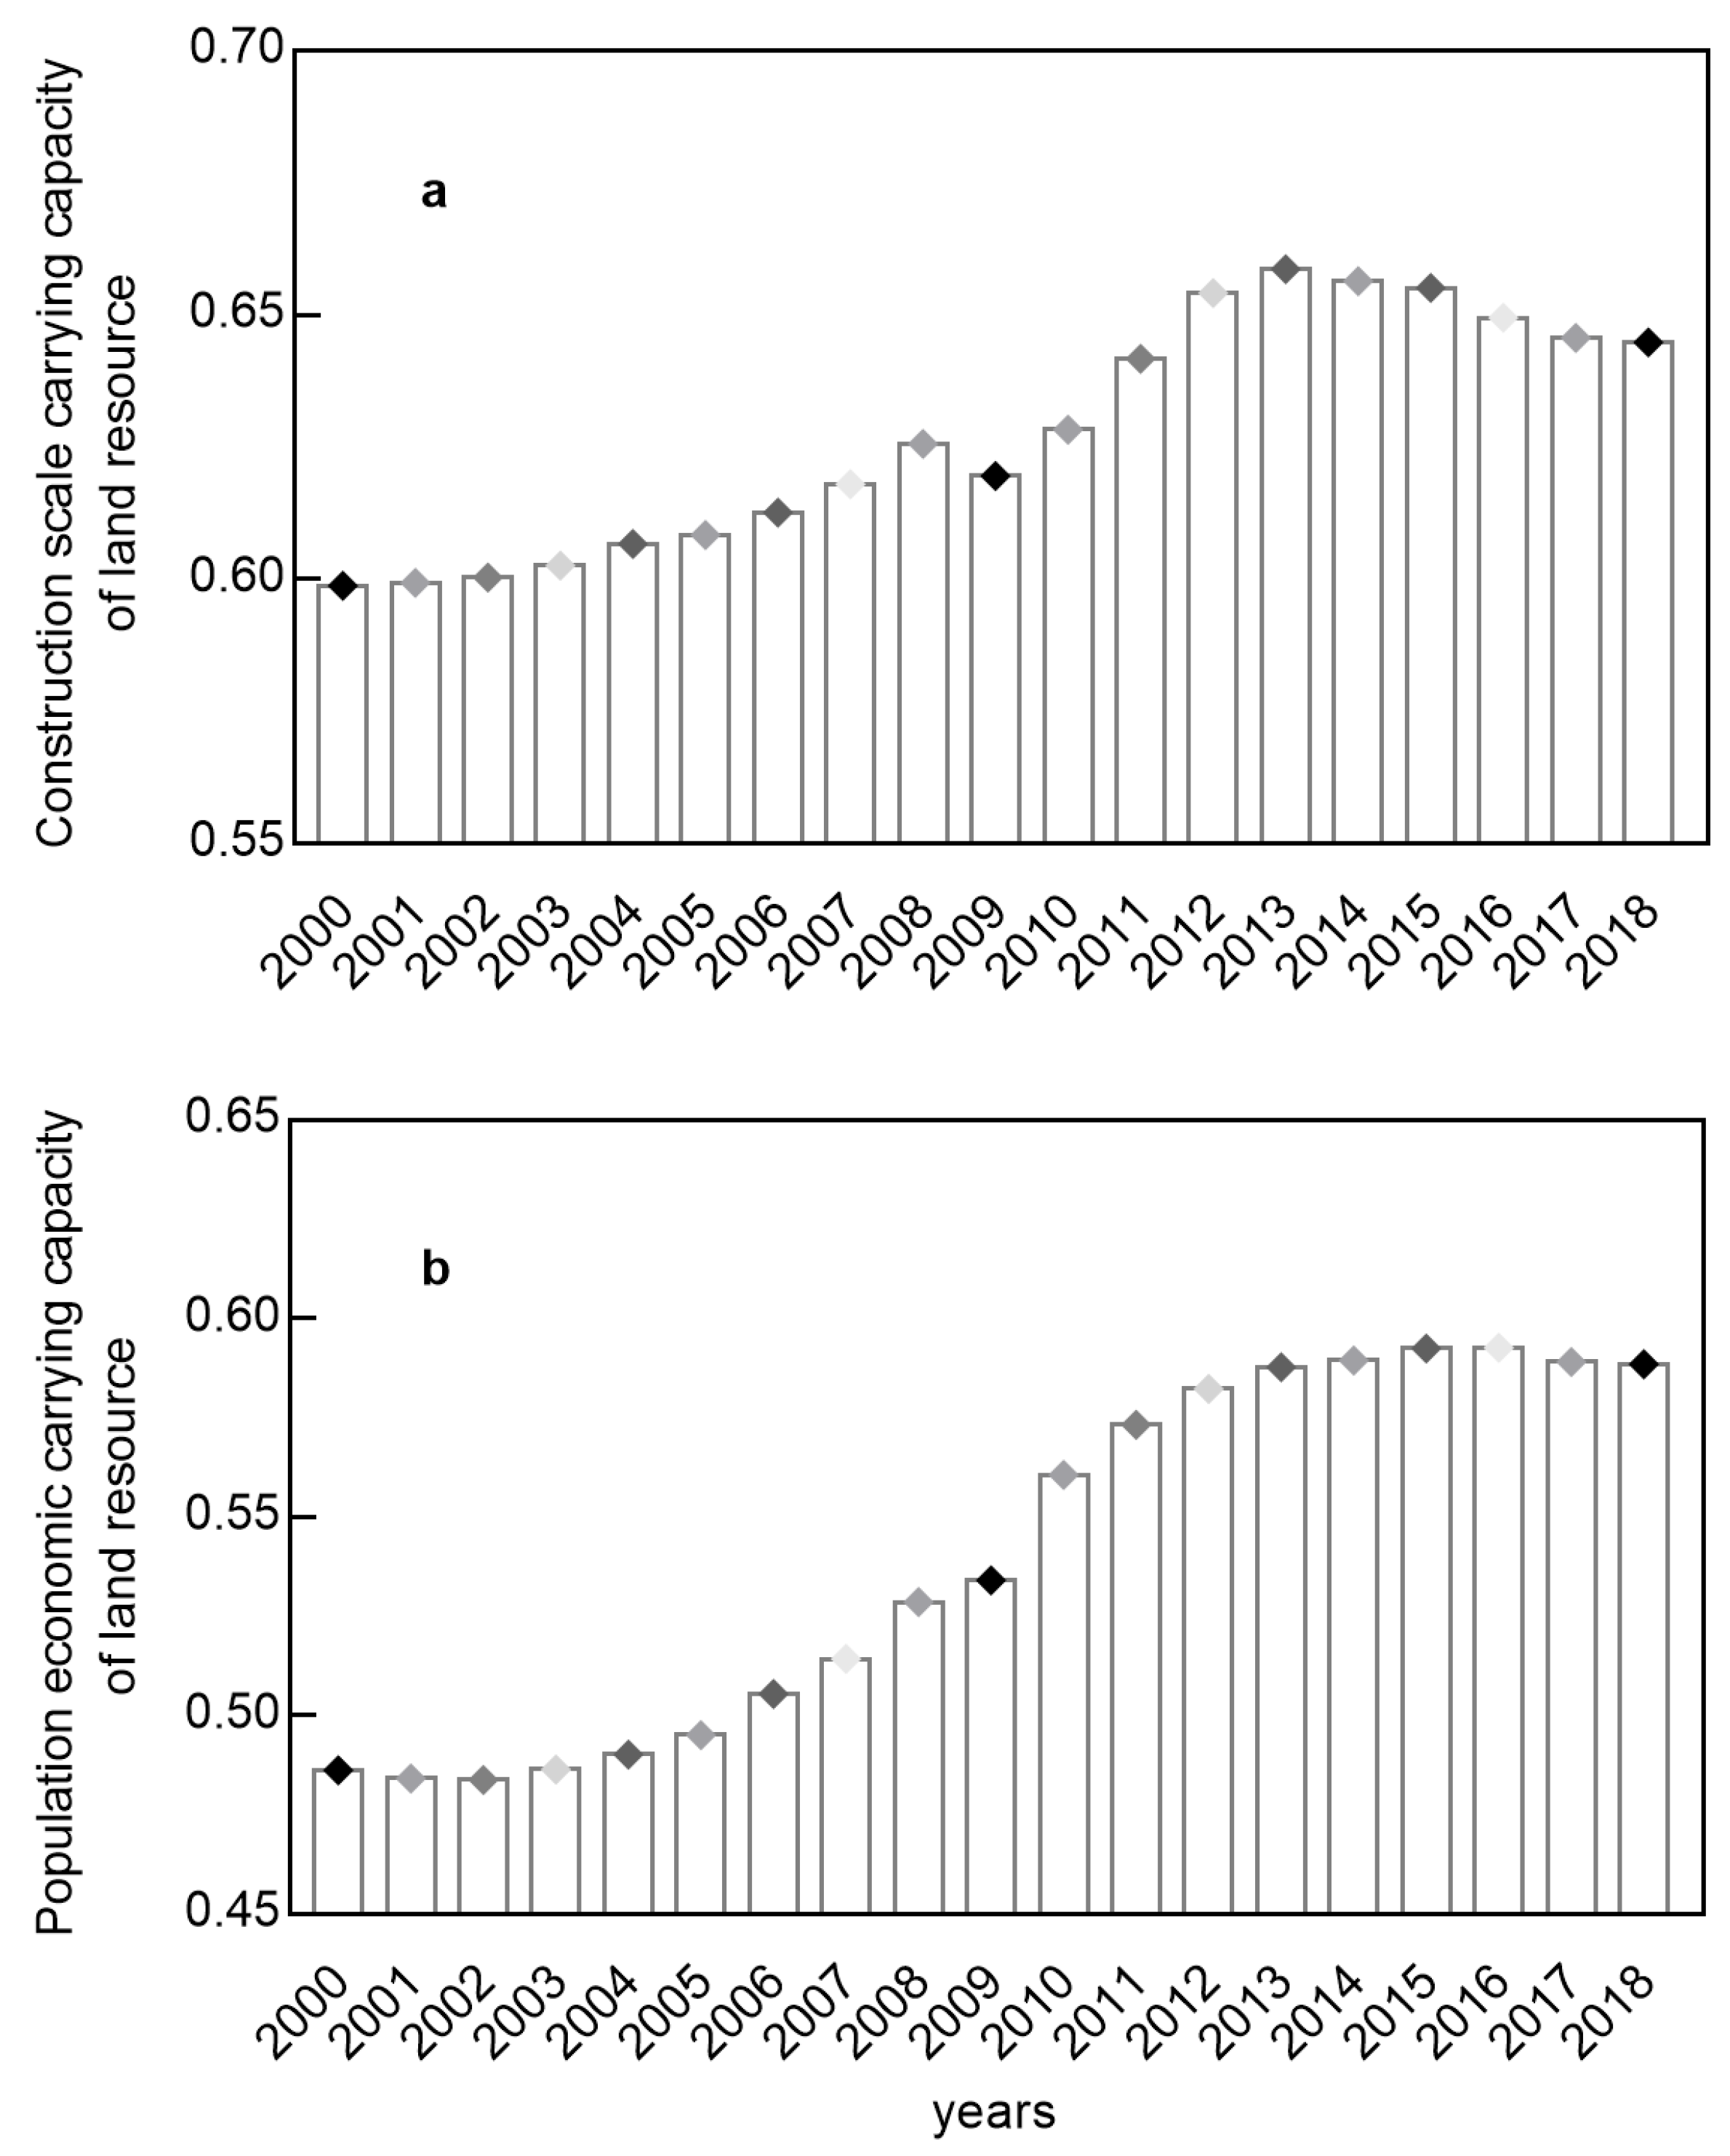
Based on the data presented in Figure 6a, the construction scale carrying capacity of land resources in the NFPE initially increased gradually and then slightly decreased during the period from 2000 to 2018. Conversely, Figure 6b illustrates that the population’s economic carrying capacity of land resources showed a steady increase in the early stage and then stabilized. The annual average population economic carrying capacity of land resources in the region was 0.54, with an average annual increase of 0.007.
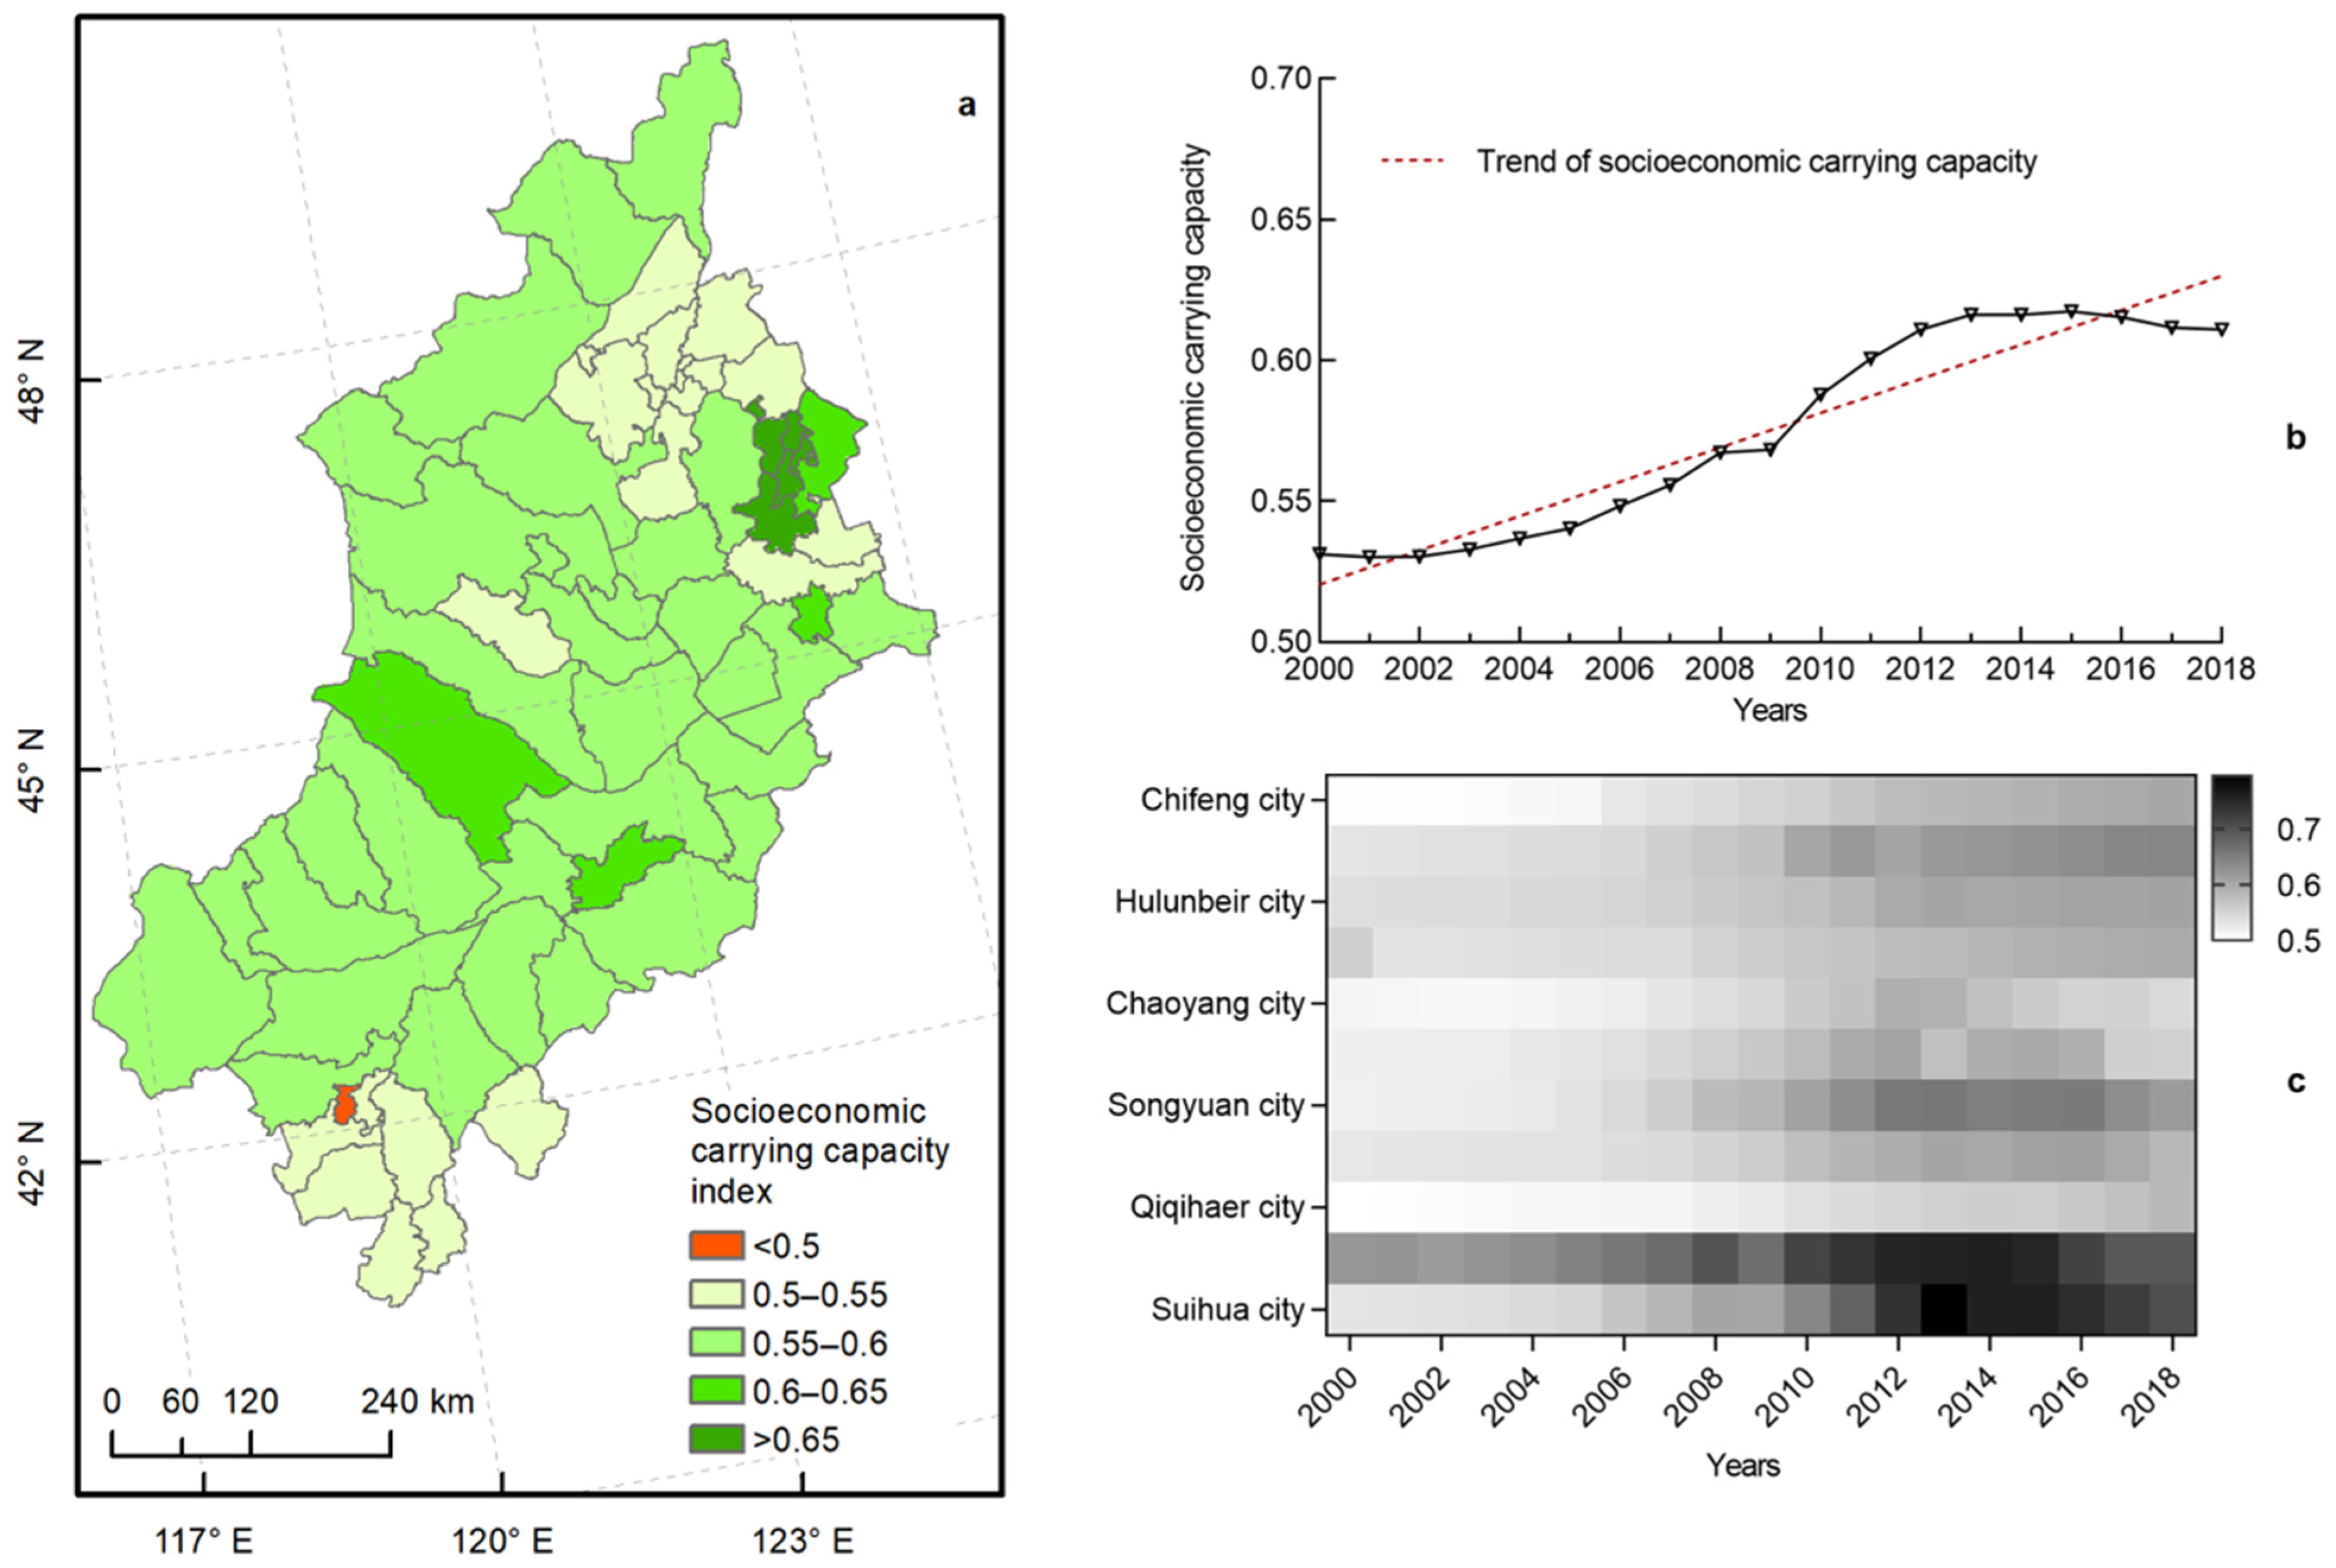
Figure 7a illustrates the spatial heterogeneity of socioeconomic carrying capacity from 2000 to 2018. The majority of the areas had a carrying capacity between 0.55 and 0.6. The socioeconomic carrying capacity of some areas in the east and central west was relatively high, whereas some areas in the northeast and south had a relatively low socioeconomic carrying capacity. Figure 7b shows the socioeconomic carrying capacity of the NFPE gradually strengthened in the early stage and then stabilized over the past 19 years. In 2000, the socioeconomic carrying capacity of the region was 0.53. By 2015, it reached its highest value (0.62) and then stabilized. By 2018, the socioeconomic carrying capacity was 0.61. The average annual carrying capacity of the ecosystem was 0.56, with an average annual increase of 0.006. Based on the analysis of the social economic carrying capacity of each league city, Figure 7c presents that Daqing City had the highest socioeconomic carrying capacity, with an annual average of 0.68, followed by Suihua City (0.64), whereas Baicheng City had the lowest (0.53). Suihua City had the highest average annual increase in socioeconomic carrying capacity (0.02), and Chaoyang had the lowest (0.003).
3.4. Spatial Disparities and Evolution of LRCC in NFPE
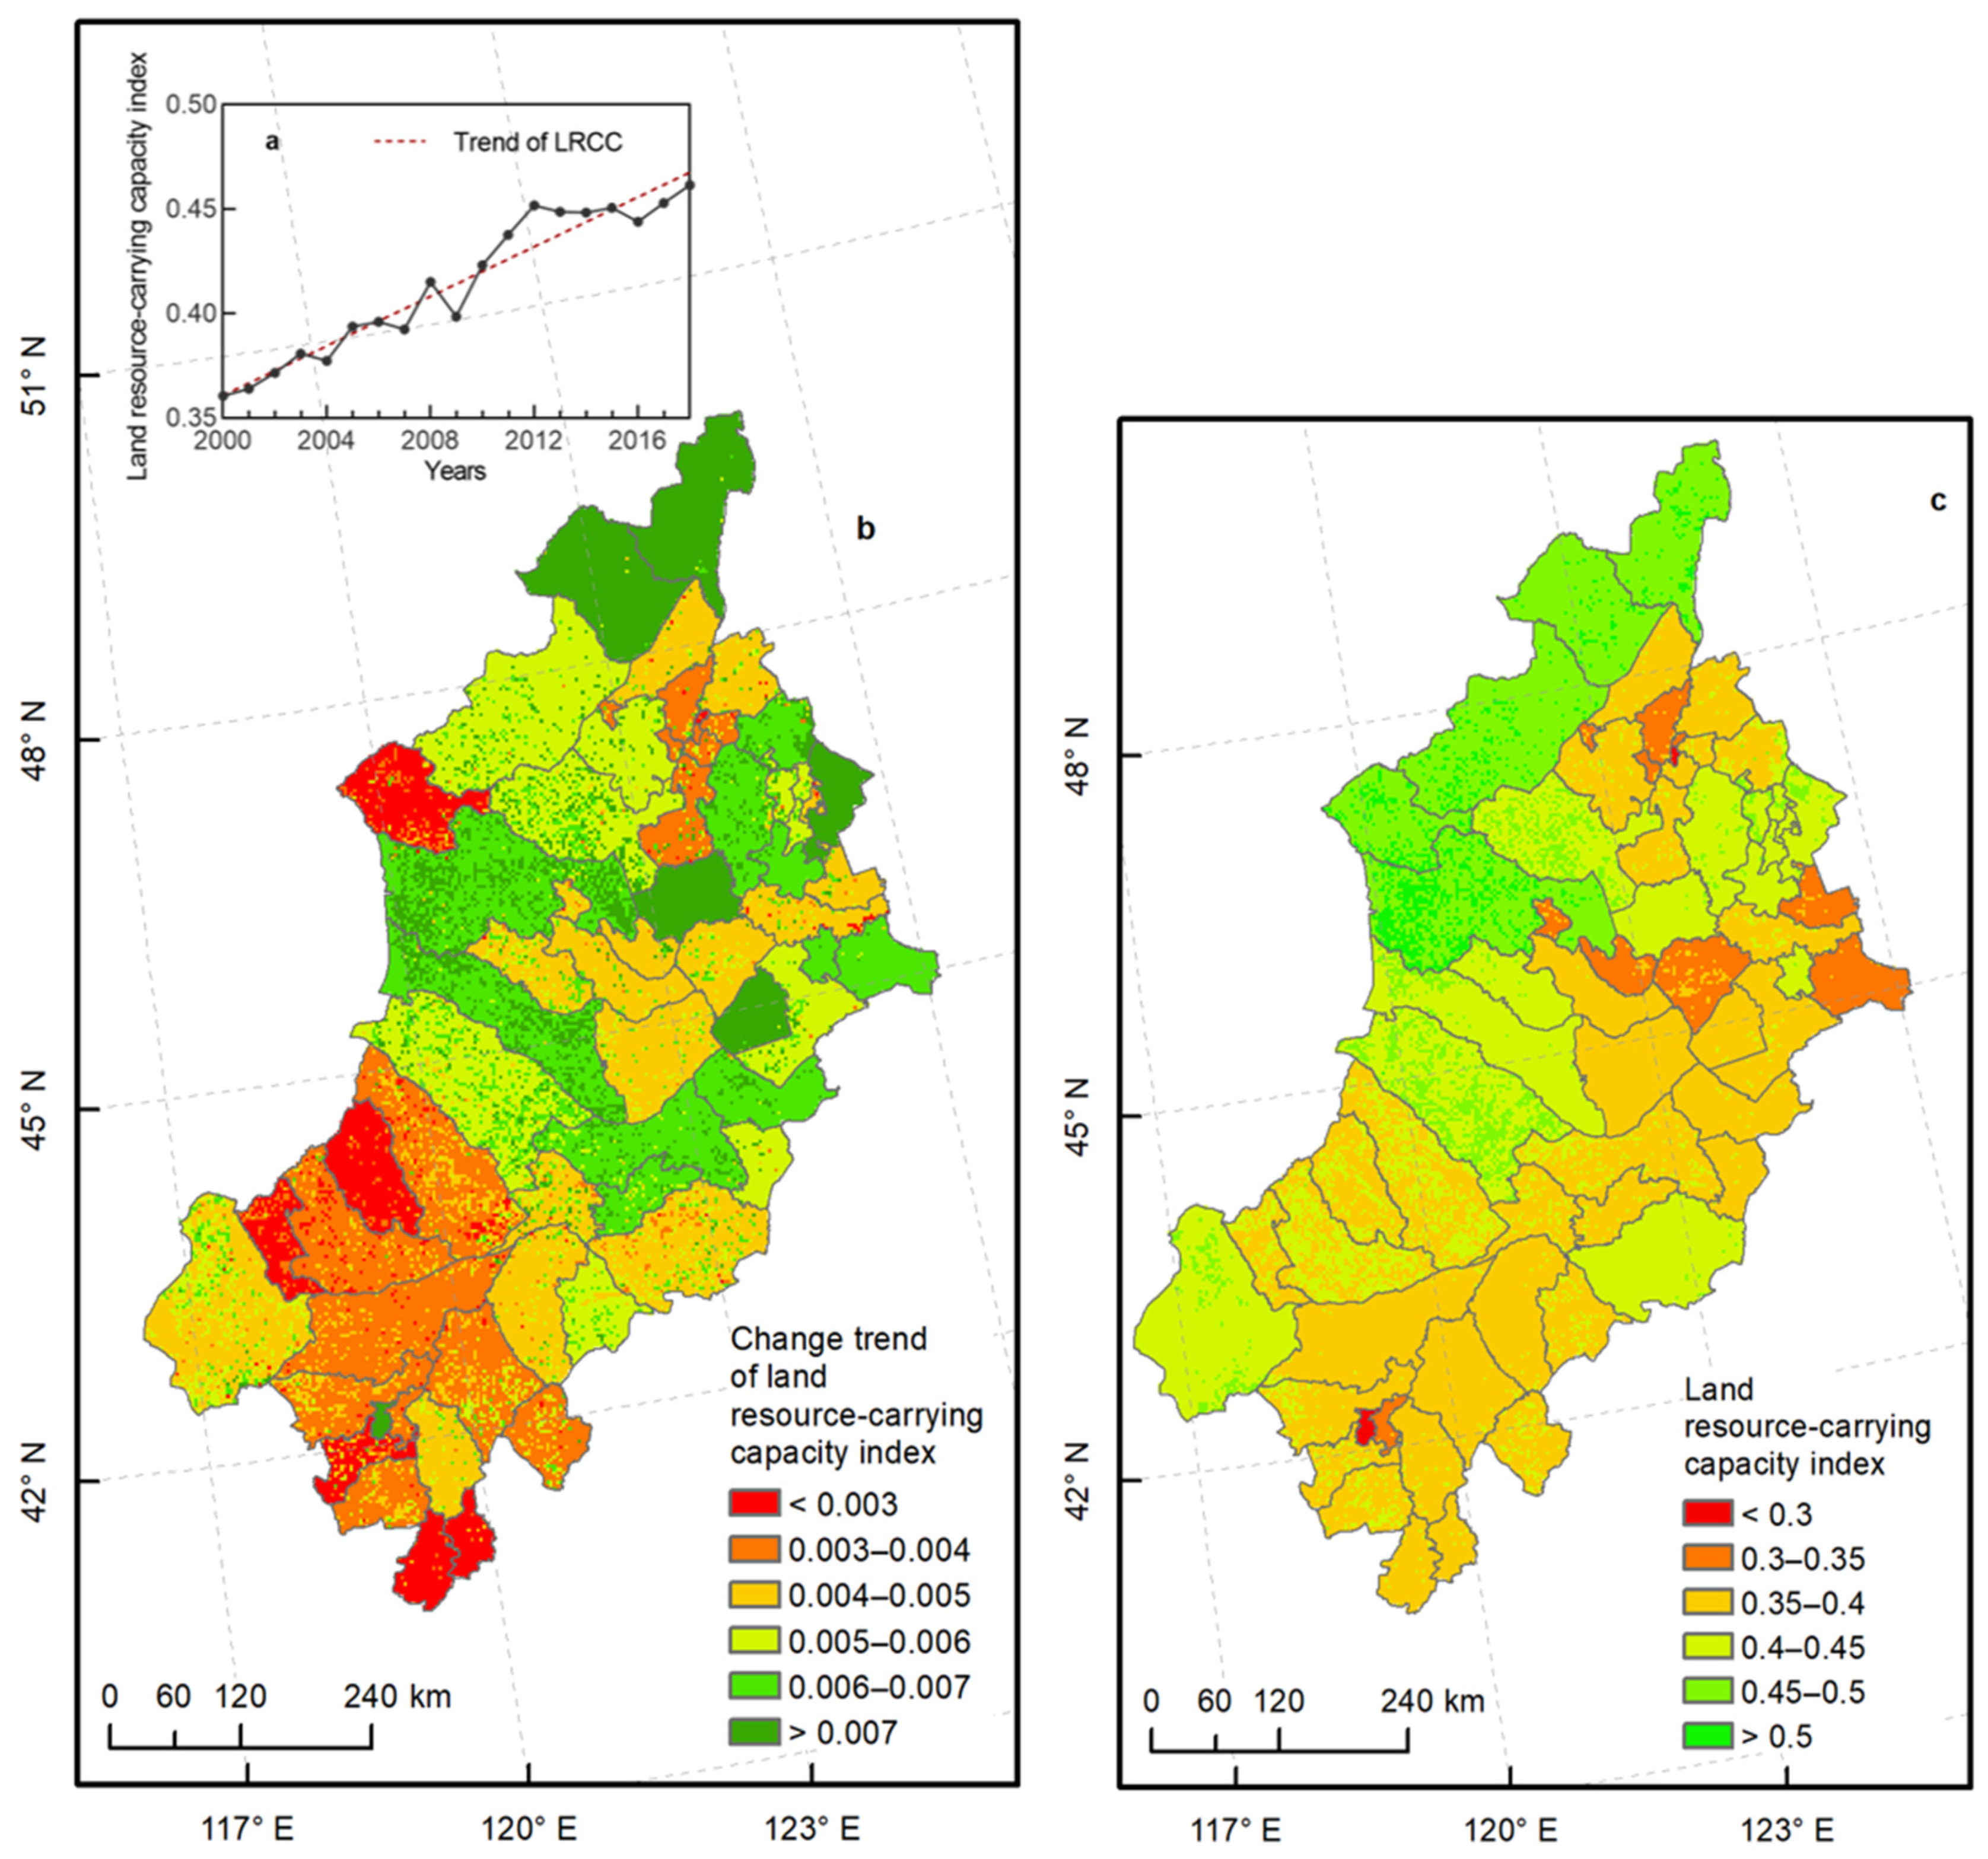
From a spatial perspective, Figure 8 shows the LRCCI in the NFPE had an average value of 0.41 from 2000 to 2018. The northwestern part of the NFPE had the highest LRCCI (>0.5), while a small area in the south had the lowest LRCCI (<0.3), and some scattered areas in the northeast had relatively low LRCCI (0.3–0.35) (Figure 8c). During the same period, the LRCC of the NFPE showed a fluctuating increase trend. The LRCCI increased from 0.36 in 2000 to 0.45 in 2018, with an average annual growth rate of 0.005 (Figure 8a). The increasing trend in the north was higher compared to the south (Figure 8b).
4. Discussion
4.1. LRCC Indicator System
The NFPE has a diverse ecosystem. Thus, the indicators for grassland resource-carrying capacity, cultivated land resource-carrying capacity, and other ecological resource-carrying capacity were selected. These indicators reflect the quality and quantity of land resources, which is crucial for preserving the ecological environment and maintaining ecological balance. The relevant indicators for land resource construction scale carrying capacity and land resource population economic carrying capacity were chosen. These indicators reflect the capacity of land resources to support economic and social development. A comprehensive evaluation method that takes into account the two aspects of the ecological system carrying capacity and socioeconomic carrying capacity can enhance people’s understanding of the future and connotation of LRCC and provide support for the sustainable use and management of land resources.
4.2. Changes in LRCC in NFPE
From 2000 to 2018, the carrying capacity of land resources in the NFPE gradually increased. This is due to the government’s efforts to promote ecological protection and restoration projects, which have facilitated the restoration and protection of the regional ecological environment, reduced the pressure on land resources, and thus increased the carrying capacity of land resources [31]. Furthermore, agricultural technology has significantly improved, and scientific and reasonable planting and breeding methods have made more effective use of land resources, thereby increased their productivity and carrying capacity. Additionally, the gradual popularization of environmental awareness has led to a reduction in damage to the ecological environment caused by human activities, which has helped to reduce the pressure on land resources and increase their carrying capacity. By optimizing the land-use structure and rationally allocating different types of land resources, land resources can be used more effectively, and the productivity and carrying capacity of the land can be improved. The combined effects of these factors have significantly improved the carrying capacity of land resources in the NFPE.
4.3. The Spatial Distribution of LRCC in NFPE
The carrying capacity of land resources in the NFPE shows spatial differences. The northwest region has a relatively high LRCCI, while the southern and eastern regions have a relatively low LRCCI. This spatial heterogeneity results from differences in factors such as terrain, climate, land type, and vegetation coverage across the region. Social and economic factors can also contribute to spatial heterogeneity in carrying capacity, with areas of higher economic development often having more infrastructure and resources to support larger populations. Population density, economic development level, and land-use patterns also vary across different regions of the NFPE, affecting the carrying capacity of land resources. In addition, the carrying capacity of land resources in the NFPE shows spatial–temporal heterogeneity. The land resource-carrying capacity index in the north has a greater tendency to increase, while that in the south has a lower tendency. This heterogeneity can result from changes in climate, natural disasters, and human activities such as land-use changes that can affect the carrying capacity of land resources over time. Overall, understanding the spatial and temporal distribution of land resource-carrying capacity is critical for sustainable land use and management in the NFPE.
4.4. Land Resource Management and Sustainable Development
To ensure the sustainable development of the NFPE, it is important to implement differentiated land-use strategies based on the spatial differences in land resource-carrying capacity. Decision-making regarding land-use planning and management should consider the spatial heterogeneity of LRCC, as different areas may require distinct approaches to ensure sustainable use and management of natural resources [32]. To guarantee the sustainable use and management of natural resources for present and future generations, we should effectively manage the spatially heterogeneous LRCC.
A comprehensive spatial analysis should be conducted to assess the carrying capacity of land resources in different regions and formulate land-use plans and management strategies tailored to the specific needs and characteristics of each area. The carrying capacity of land resources should be monitored and evaluated regularly to determine any changes over time. Management strategies and practices should be adapted to changing environmental and socioeconomic conditions to ensure the sustainable use of land resources over time [33]. Integrating different types of knowledge and innovative practices can improve our understanding of the spatial and temporal heterogeneity of LRCC and help develop more effective management strategies. Investing in research and innovation can facilitate the development of new technologies and techniques for sustainable land-use practices and improve our understanding of the spatial heterogeneity of LRCC.
In the NFPE, the northern part has a relatively high LRCC. It should harness the full potential of regions characterized by a high LRCC, and it is crucial to foster coordinated development among economic growth, ecological preservation, and social well-being. This necessitates land-use planning and management practices that thoroughly consider the principles of social, economic, and ecological sustainability. Additionally, active engagement and collaboration with stakeholders are essential to ensure the effectiveness of planning implementation and management. To develop modern agriculture and animal husbandry, it is essential to prioritize land conservation and environmental protection. This can be achieved by embracing an agricultural industrialization management model, strengthening the adjustment of planting structure, improving the quality of agricultural products, and bolstering productivity and returns from farmland and pastures. By implementing these measures, we can ensure sustainable and profitable agricultural practices while safeguarding our land and natural resources. In contrast, the eastern part of the ecotone has a high socioeconomic carrying capacity but a low ecosystem carrying capacity. Regions characterized by low land resource-carrying capacity often encounter significant challenges. Hence, it is imperative to take into account social, economic, and environmental factors comprehensively when formulating tailored land-use planning and management strategies. Collaboration with relevant local stakeholders is crucial to ensure the successful and effective implementation of these strategies. To ensure sustainable development in this region, it is crucial to implement land-use restrictions and strengthen ecological protection measures. This can be achieved through the promotion of sustainable practices such as eco-friendly tourism and the development of low-impact industries that prioritize environmental conservation. By diversifying the economic activities and reducing the ecological footprint, the region can strike a balance between economic growth and environmental sustainability. Additionally, investing in research and innovation for sustainable land management practices can help improve the ecosystem carrying capacity and enhance the overall resilience of the region.
5. Conclusions
Assessing the LRCC is crucial for sustainable land-use planning and management. In this study, a land-carrying capacity evaluation indicator system was developed by combining remote sensing data, model simulation data, and statistical data. Spatial analysis methods were used to visualize the spatiotemporal evolution pattern characteristics of LRCC in the NFPE. The study reveals that the carrying capacity of grassland resources and cultivated land resources increased between 2000 and 2018, while the carrying capacity of other resources remained relatively stable. The carrying capacity of land resource construction scale and population economic carrying capacity both increased in the early stage and then tended to stabilize or decline. Over the past 19 years, the LRCC has gradually increased, with a relatively large increasing trend of the LRCCI in the north and a relatively low increasing trend in the south. The average value of the LRCCI in the NFPE was 0.41, showing spatial heterogeneity. The northwest region of the NFPE demonstrates a relatively high LRCCI, which makes it highly suitable for agricultural and animal husbandry activities. Conversely, the southern and eastern region exhibit relatively lower LRCCI, necessitating the implementation of land-use restrictions, reinforced ecological protection measures, and the promotion of low-impact industries such as ecotourism. These strategies are essential for ensuring sustainable development in the NFPE.
Author Contributions
Conceptualization, S.W., Y.Z. and J.F.; methodology, S.W., Y.Z., H.F. and H.Z.; writing—original draft preparation, S.W.; writing—review and editing, Y.Z., H.Z. and J.F.; supervision, J.F.; funding acquisition, S.W. and J.F. All authors have read and agreed to the published version of the manuscript.
Funding
This research was funded by the Chinese Academy of Sciences Strategic Priority Program, grant numbers XDA23060401, China Postdoctoral Science Foundation funded project, grant number 2020M670427, and National Natural Science Foundation of China, grant number 42201320.
Data Availability Statement
Not applicable.
Acknowledgments
This work was supported financially by the Chinese Academy of Sciences Strategic Priority Program, China Postdoctoral Science Foundation funded project, and National Natural Science Foundation of China.
Conflicts of Interest
The authors declare no conflict of interest.
References
- Foley, J.A.; Defries, R.; Asner, G.P.; Barford, C.; Bonan, G.; Carpenter, S.R.; Chapin, F.S.; Coe, M.T.; Daily, G.C.; Gibbs, H.K.; et al. Global consequences of land use. Science 2005, 309, 570–574. [Google Scholar] [CrossRef] [Green Version]
- Lilburne, L.; Eger, A.; Mudge, P.; Ausseil, A.G.; Stevenson, B.; Herzig, A.; Beare, M. The Land Resource Circle: Supporting land-use decision making with an ecosystem-service-based framework of soil functions. Geoderma 2020, 363, 114134. [Google Scholar] [CrossRef]
- Liu, Y.; Zhou, Y. Reflections on China’s food security and land use policy under rapid urbanization. Land Use Policy 2021, 109, 105699. [Google Scholar] [CrossRef]
- Haines-Young, R. Land use and biodiversity relationships. Land Use Policy 2009, 26, S178–S186. [Google Scholar] [CrossRef]
- Barrera-Bassols, N.; Zinck, J.A.; Van, R.E. Symbolism, knowledge and management of soil and land resources in indigenous communities: Ethnopedology at global, regional and local scale. Catena 2006, 65, 118–137. [Google Scholar] [CrossRef]
- Zhang, J.; Fu, M.; Zhang, Z.; Tao, J.; Fu, W. A trade-off approach of optimal land allocation between socio-economic development and ecological stability. Ecol. Model. 2014, 272, 175–187. [Google Scholar] [CrossRef]
- Lambin, E.F.; Meyfroidt, P. Global land use change, economic globalization, and the looming land scarcity. Proc. Natl. Acad. Sci. USA 2011, 108, 3465–3472. [Google Scholar] [CrossRef] [PubMed]
- Xue, Q.; Yang, X.; Wu, F. A Three-Stage Hybrid Model for the Regional Assessment, Spatial Pattern Analysis and Source Apportionment of the Land Resources Comprehensive Supporting Capacity in the Yangtze River Delta Urban Agglomeration. Sci. Total Environ. 2020, 711, 134428. [Google Scholar] [CrossRef]
- Ma, B. Literature review on land carrying capacity of the coordinated development of population, resources, environment and economy. AIP Conf. Proc. 2017, 1890, 040106. [Google Scholar]
- Peng, J.; Du, Y.; Liu, Y.; Hu, X. How to assess urban development potential in mountain areas? An approach of ecological carrying capacity in the view of coupled human and natural systems. Ecol. Indic. 2016, 60, 1017–1030. [Google Scholar] [CrossRef]
- Meng, C.; Du, X.; Ren, Y.; Shen, L.; Cheng, G.; Wang, J. Sustainable urban development: An examination of literature evolution on urban carrying capacity in the Chinese context. J. Clean. Prod. 2020, 277, 122802. [Google Scholar] [CrossRef]
- Lane, M. The carrying capacity imperative: Assessing regional carrying capacity methodologies for sustainable land-use planning. Land Use Policy 2010, 27, 1038–1045. [Google Scholar] [CrossRef] [Green Version]
- He, Y.; Wang, Z. Water-land resource carrying capacity in China: Changing trends, main driving forces, and implications. J. Clean. Prod. 2022, 331, 130003. [Google Scholar] [CrossRef]
- Han, C.; Lu, B.; Zheng, J. Analysis and Prediction of Land Resources’ Carrying Capacity in 31 Provinces of China from 2008 to 2016. Sustainability 2021, 13, 13383. [Google Scholar] [CrossRef]
- Tsou, J.; Gao, Y.; Zhang, Y.; Genyun, S.; Ren, J.; Li, Y. Evaluating Urban Land Carrying Capacity Based on the Ecological Sensitivity Analysis: A Case Study in Hangzhou, China. Remote Sens. 2017, 9, 529. [Google Scholar] [CrossRef] [Green Version]
- Chen, W.; Li, A.; Hu, Y.; Li, L.; Zhao, H.; Han, X.; Yang, B. Exploring the long-term vegetation dynamics of different ecological zones in the farming-pastoral ecotone in northern China. Environ. Sci. Pollut. Res. 2021, 28, 27914–27932. [Google Scholar] [CrossRef]
- Li, Z.; Li, L.; Wang, Y.; Man, W.; Liu, W.; Nie, Q. Spatial Change of the Farming–Pastoral Ecotone in Northern China from 1985 to 2021. Land 2022, 11, 2179. [Google Scholar] [CrossRef]
- Liu, D.; Chen, J.; Ouyang, Z. Responses of landscape structure to the ecological restoration programs in the farming-pastoral ecotone of Northern China. Sci. Total Environ. 2020, 710, 136311. [Google Scholar] [CrossRef]
- Jian, Y.; Liu, Z.; Gong, J. Response of landscape dynamics to socio-economic development and biophysical setting across the farming-pastoral ecotone of northern China and its implications for regional sustainable land management. Land Use Policy 2022, 122, 106354. [Google Scholar] [CrossRef]
- Liu, J.; Gao, J.; Lv, S.; Han, Y.; Nie, Y. Shifting farming-pastoral ecotone in China under climate and land use changes. J. Arid Environ. 2011, 75, 298–308. [Google Scholar] [CrossRef]
- Chen, A.; Yang, X.; Guo, J.; Zhang, M.; Xing, X.; Yang, D.; Xu, B.; Jiang, L. Dynamic of land use, landscape, and their impact on ecological quality in the northern sand-prevention belt of China. J. Environ. Manag. 2022, 317, 115351. [Google Scholar] [CrossRef] [PubMed]
- National Bureau of Statistics. China Statistical Yearbook, 2000–2018; China Statistics Press: Beijing, China, 2000–2018.
- Xu, X.L. Spatial Distribution Data of Multi-Period Ecosystem Types in China. Resource and Environmental Science Data Registration and Publication System. 2023. Available online: http://www.resdc.cn (accessed on 10 September 2020). [CrossRef]
- Xu, B.; Yang, X.; Tao, W.; Qin, Z.; Liu, H.; Miao, J. Remote sensing monitoring upon the grass production in China. Acta Ecol. Sin. 2007, 27, 405–413. [Google Scholar] [CrossRef]
- Zhang, X.; Liao, C.; Li, J.; Sun, Q. Fractional vegetation cover estimation in arid and semi-arid environments using HJ-1 satellite hyperspectral data. Int. J. Appl. Earth Obs. Geoinf. 2013, 21, 506–512. [Google Scholar] [CrossRef]
- Zhao, C.; Shao, N.; Yang, S.; Ren, H.; Ge, Y.; Zhang, Z.; Zhao, Y.; Yin, X. Integrated assessment of ecosystem health using multiple indicator species. Ecol. Eng. 2019, 130, 157–168. [Google Scholar] [CrossRef]
- Saaty, T.L. Decision making with the analytic hierarchy process. Int. J. Serv. Sci. 2008, 1, 83–98. [Google Scholar] [CrossRef] [Green Version]
- Saaty, T.L. The Analytic Hierarchy Process; McGraw-Hill: New York, NY, USA, 1980. [Google Scholar]
- Zhang, Y.X.; Fan, J.W.; Wang, S.Z. Assessment of ecological carrying capacity and ecological security in China’s typical eco-engineering areas. Sustainability 2020, 12, 3923. [Google Scholar] [CrossRef]
- Ma, M.; Frank, V. Interannual variability of vegetation cover in the Chinese Heihe River Basin and its relation to meteorological parameters. Int. J. Remote Sens. 2006, 27, 3473–3486. [Google Scholar] [CrossRef]
- Cao, S.; Xia, C.; Suo, X.; Wei, Z. A framework for calculating the net benefits of ecological restoration programs in China. Ecosyst. Serv. 2021, 50, 101325. [Google Scholar] [CrossRef]
- Repetti, A.; Desthieux, G. A Relational Indicatorset Model for urban land-use planning and management: Methodological approach and application in two case studies. Landsc. Urban Plan. 2006, 77, 196–215. [Google Scholar] [CrossRef] [Green Version]
- Mbow, C.; Van Noordwijk, M.; Luedeling, E.; Neufeldt, H.; Minang, P.A.; Kowero, G. Agroforestry solutions to address food security and climate change challenges in Africa. Curr. Opin. Environ. Sustain. 2014, 6, 61–67. [Google Scholar] [CrossRef] [Green Version]
Figure 1.
Location of the study area.

Figure 2.
Technology roadmap for research.

Figure 3.
The weight of the criterion layer (a) and element layer (b).

Figure 4.
The grassland (a), cultivated land (b), and other resources (c) carrying capacity in the NFPE between 2000 and 2018.
Figure 4.
The grassland (a), cultivated land (b), and other resources (c) carrying capacity in the NFPE between 2000 and 2018.

Figure 5.
The ecosystem carrying capacity in the NFPE during 2000–2018. (a) the spatial pattern of annual average ecosystem carrying capacity; (b) the trend of changes in ecosystem carrying capacity; (c) the changes in ecosystem carrying capacity in various cities.
Figure 5.
The ecosystem carrying capacity in the NFPE during 2000–2018. (a) the spatial pattern of annual average ecosystem carrying capacity; (b) the trend of changes in ecosystem carrying capacity; (c) the changes in ecosystem carrying capacity in various cities.

Figure 6.
The construction scale (a) and population economic (b) carrying capacity of land resources in the NFPE between 2000 and 2018.
Figure 6.
The construction scale (a) and population economic (b) carrying capacity of land resources in the NFPE between 2000 and 2018.

Figure 7.
The socioeconomic carrying capacity changes in the NFPE during 2000–2018. (a) the spatial pattern of annual average socioeconomic carrying capacity; (b) the trend of changes in socioeconomic carrying capacity; (c) the changes in socioeconomic carrying capacity in various cities.
Figure 7.
The socioeconomic carrying capacity changes in the NFPE during 2000–2018. (a) the spatial pattern of annual average socioeconomic carrying capacity; (b) the trend of changes in socioeconomic carrying capacity; (c) the changes in socioeconomic carrying capacity in various cities.

Figure 8.
The land resource-carrying capacity index during 2000–2018. (a) the changing trends of land resource-carrying capacity index; (b) spatial pattern of change trend of land resource-carrying capacity index; (c) spatial distribution of land resource-carrying capacity index.
Figure 8.
The land resource-carrying capacity index during 2000–2018. (a) the changing trends of land resource-carrying capacity index; (b) spatial pattern of change trend of land resource-carrying capacity index; (c) spatial distribution of land resource-carrying capacity index.


Table 1.
Comprehensive indicator system of land resource-carrying capacity.
| Target Layer | Criterion Layer | Element Layer | Indicator Layer (Weight) (±) |
|---|---|---|---|
| Land resource-carrying capacity | Ecosystem carrying capacity | Grassland resource-carrying capacity | Grass yield per unit area (+) |
| Proportion of grassland area (+) | |||
| Grassland coverage (+) | |||
| Cultivated land resource-carrying capacity | Per capita arable land area (+) | ||
| Per capita grain possession (+) | |||
| Other resources carrying capacity | Proportion of forest area (+) | ||
| Proportion of wetland area (+) | |||
| Socio-economic carrying capacity | Construction scale carrying capacity | Added value of non-primary industry per unit of construction land (+) | |
| Proportion of construction land (−) | |||
| Population economic carrying capacity | Per capita GDP (−) | ||
| Population density (−) |
Note: + represents anticipated indicators; − represents restricted indicators.
Table 2.
Methods of calculating indicators and sources of data utilized.
| Indicators | Calculating Methods | Data Sources |
|---|---|---|
| Grass yield per unit area | The empirical model | NDVI, implemented as a model parameter, employed the MODIS vegetation index product—MOD13A2. |
| The proportion of grassland area | The percentage of grassland within a county | Ecosystem-type data for grassland areas were obtained from Resource and Environment Data Cloud Platform. (https://www.resdc.cn/DOI/DOI.aspx?DOIID=131 (accessed on 10 September 2020)) |
| Grassland coverage | Dimidiate pixel model | NDVI, implemented as a model parameter, employed the MODIS vegetation index product—MOD13A2. |
| Per capita arable land area | The ratio of arable land area to total population at the county level | Ecosystem-type data for the arable land area were obtained from the Resource and Environment Data Cloud Platform (https://www.resdc.cn/DOI/DOI.aspx?DOIID=131 (accessed on 9 January 2020)); the statistics of the total population was obtained from China Statistical Yearbook. |
| Per capita grain possession | The ratio of total grain yield to total population at the county level | The statistics of the total population and total grain yield were obtained from China Statistical Yearbook. |
| The proportion of forest area | The percentage of forest within a county | Ecosystem-type data for forest areas were obtained from Resource and Environment Data Cloud Platform. (https://www.resdc.cn/DOI/DOI.aspx?DOIID=131 (accessed on 10 September 2020)) |
| The proportion of wetland area | The percentage of wetlands within a county | Ecosystem-type data for wetland areas were obtained from Resource and Environment Data Cloud Platform. (https://www.resdc.cn/DOI/DOI.aspx?DOIID=131 (accessed on 10 September 2020)) |
| The added value of non-primary industry per unit of construction land | The ratio of the sum of the gross domestic product of the secondary and tertiary industry to the area of construction land at the county level | Ecosystem-type data for construction land area were obtained from Resource and Environment Data Cloud Platform (https://www.resdc.cn/DOI/DOI.aspx?DOIID=131 (accessed on 10 September 2020)); the statistics of the gross domestic product of the secondary and tertiary industry were obtained from China Statistical Yearbook. |
| The proportion of construction land | The percentage of construction land within a county | Ecosystem-type data for construction land area were obtained from Resource and Environment Data Cloud Platform. (https://www.resdc.cn/DOI/DOI.aspx?DOIID=131 (accessed on 10 September 2020)) |
| Per capita GDP | Based on county-level GDP statistics, weighted interpolation by land-use types, nighttime light brightness, and settlement density | Gridded data on per capita GDP were obtained from Resource and Environment Data Cloud Platform (https://www.resdc.cn/DOI/DOI.aspx?DOIID=33 (accessed on 6 July 2020)). |
| Population density | Based on county-level total population statistics, weighted interpolation by land-use types, nighttime light brightness, and settlement density | Gridded data on population density were obtained from Resource and Environment Data Cloud Platform (https://www.resdc.cn/DOI/DOI.aspx?DOIID=32 (accessed on 6 July 2020)). |
Table 3.
Weight of the indicator layer.
| Indicator | Weight |
|---|---|
| Grass yield per unit area | 0.084 |
| Proportion of grassland area | 0.072 |
| Grassland coverage | 0.084 |
| Per capita arable land area | 0.105 |
| Per capita grain possession | 0.105 |
| Proportion of forest area | 0.09 |
| Proportion of wetland area | 0.06 |
| Added value of non-primary industry per unit of construction land | 0.064 |
| Proportion of construction land | 0.096 |
| Per capita GDP | 0.12 |
| Population density | 0.12 |
Disclaimer/Publisher’s Note: The statements, opinions and data contained in all publications are solely those of the individual author(s) and contributor(s) and not of MDPI and/or the editor(s). MDPI and/or the editor(s) disclaim responsibility for any injury to people or property resulting from any ideas, methods, instructions or products referred to in the content. |
© 2023 by the authors. Licensee MDPI, Basel, Switzerland. This article is an open access article distributed under the terms and conditions of the Creative Commons Attribution (CC BY) license (https://creativecommons.org/licenses/by/4.0/).
Share and Cite
MDPI and ACS Style
Wang, S.; Zhang, Y.; Fan, J.; Zhang, H.; Fang, H. Comprehensive Sustainability Indicator for Land Resource-Carrying Capacity in a Farming-Pastoral Region. Remote Sens. 2023, 15, 3726. https://doi.org/10.3390/rs15153726
AMA Style
Wang S, Zhang Y, Fan J, Zhang H, Fang H. Comprehensive Sustainability Indicator for Land Resource-Carrying Capacity in a Farming-Pastoral Region. Remote Sensing. 2023; 15(15):3726. https://doi.org/10.3390/rs15153726
Chicago/Turabian StyleWang, Suizi, Yaxian Zhang, Jiangwen Fan, Haiyan Zhang, and Huajun Fang. 2023. "Comprehensive Sustainability Indicator for Land Resource-Carrying Capacity in a Farming-Pastoral Region" Remote Sensing 15, no. 15: 3726. https://doi.org/10.3390/rs15153726
Note that from the first issue of 2016, this journal uses article numbers instead of page numbers. See further details here.