
We Need to Communicate: Communicating Attention Network for Semantic Segmentation of High-Resolution Remote Sensing Images

1
College of Geodesy and Geomatics, Shandong University of Science and Technology, Qingdao 266590, China
2
Shandong Province Research Center of Engineering and Technology for “3S”—GPS, RS and GIS, Shandong University of Science and Technology, Qingdao 266590, China
3
Star-Rising Technologies Co., Ltd., Qingdao 266590, China
4
Chinese Academy of Surveying and Mapping, Beijing 100036, China
*
Authors to whom correspondence should be addressed.
Remote Sens. 2023, 15(14), 3619; https://doi.org/10.3390/rs15143619
Submission received: 4 June 2023
/
Revised: 5 July 2023
/
Accepted: 17 July 2023
/
Published: 20 July 2023
(This article belongs to the Special Issue Deep Learning and Computer Vision in Remote Sensing-II)
Abstract
:Traditional models that employ CNNs as encoders do not sufficiently combine high-level features and low-level features. However, high-level features are rich in semantic information but lack spatial detail, while low-level features are the opposite. Therefore, the integrated utilization of multi-level features and the bridging of the gap between them is crucial to promote the accuracy of semantic segmentation. To address this issue, we presented communicating mutual attention (CMA) and communicating self-attention (CSA) modules to enhance the interaction and fusion of different levels of feature maps. On the one hand, CMA aggregates the global context information of high-level features into low-level features and embeds the spatial detail localization characteristics of low-level features in high-level features. On the other hand, the CSA module is deployed to integrate the spatially detailed representation of low-level features into the attention map of high-level features. We have experimented with the communicating attention network (CANet), a U-net-like network composed of multiple CMA and CSA modules, on the ISPRS Vaihingen and Potsdam datasets with mean F1-scores of 89.61% and 92.60%, respectively. The results demonstrate that CANet embodies superior performance in the semantic segmentation task of remote sensing of images.
1. Introduction
As aerospace technology is constantly evolving, the spatial resolution, radiometric resolution, spectral resolution, and observation frequency of the sensors have been increased. As a result, both the quality and quantity of Earth Observation (EO) data have significantly improved. Remote sensing images find wide applications in various fields, including semantic segmentation [1,2,3,4], change detection [5,6], target detection [7,8], target extraction [9], and more. Semantic segmentation of remote sensing images in urban areas plays a crucial role in generating accurate land use maps [10]. Traditional methods applied to semantic segmentation based on edges [11] or regions [12], are known for their fast and efficient processing. However, different objects in urban areas may have the identical spectral signatures, such as grass and trees, roads and bridges. They are often difficult to distinguish by traditional methods, which leads to low accuracy in segmentation results. As a result, this is an obstacle to the widespread application of traditional segmentation methods. In recent years, there have been significant developments in deep learning techniques [13], and their high flexibility and accuracy have made them widely employed in semantic segmentation of remote sensing images. In addition, the ability of a convolutional neural network (CNN) to capture spatial features and the abstraction characteristics of object texture, edges, and shape [14] has led to a tremendous improvement in segmentation accuracy in the semantic segmentation task of remote sensing images [15]. By increasing in the number of layers in the CNN, the extracted features reach a higher level, characterized by a larger receptive field and richer semantic information [16]. However, relying solely on high-level features derived by the CNN for semantic segmentation while neglecting the geometric representation properties of low-level features results in a lack of spatial details, thus hindering the improvement of segmentation precision.
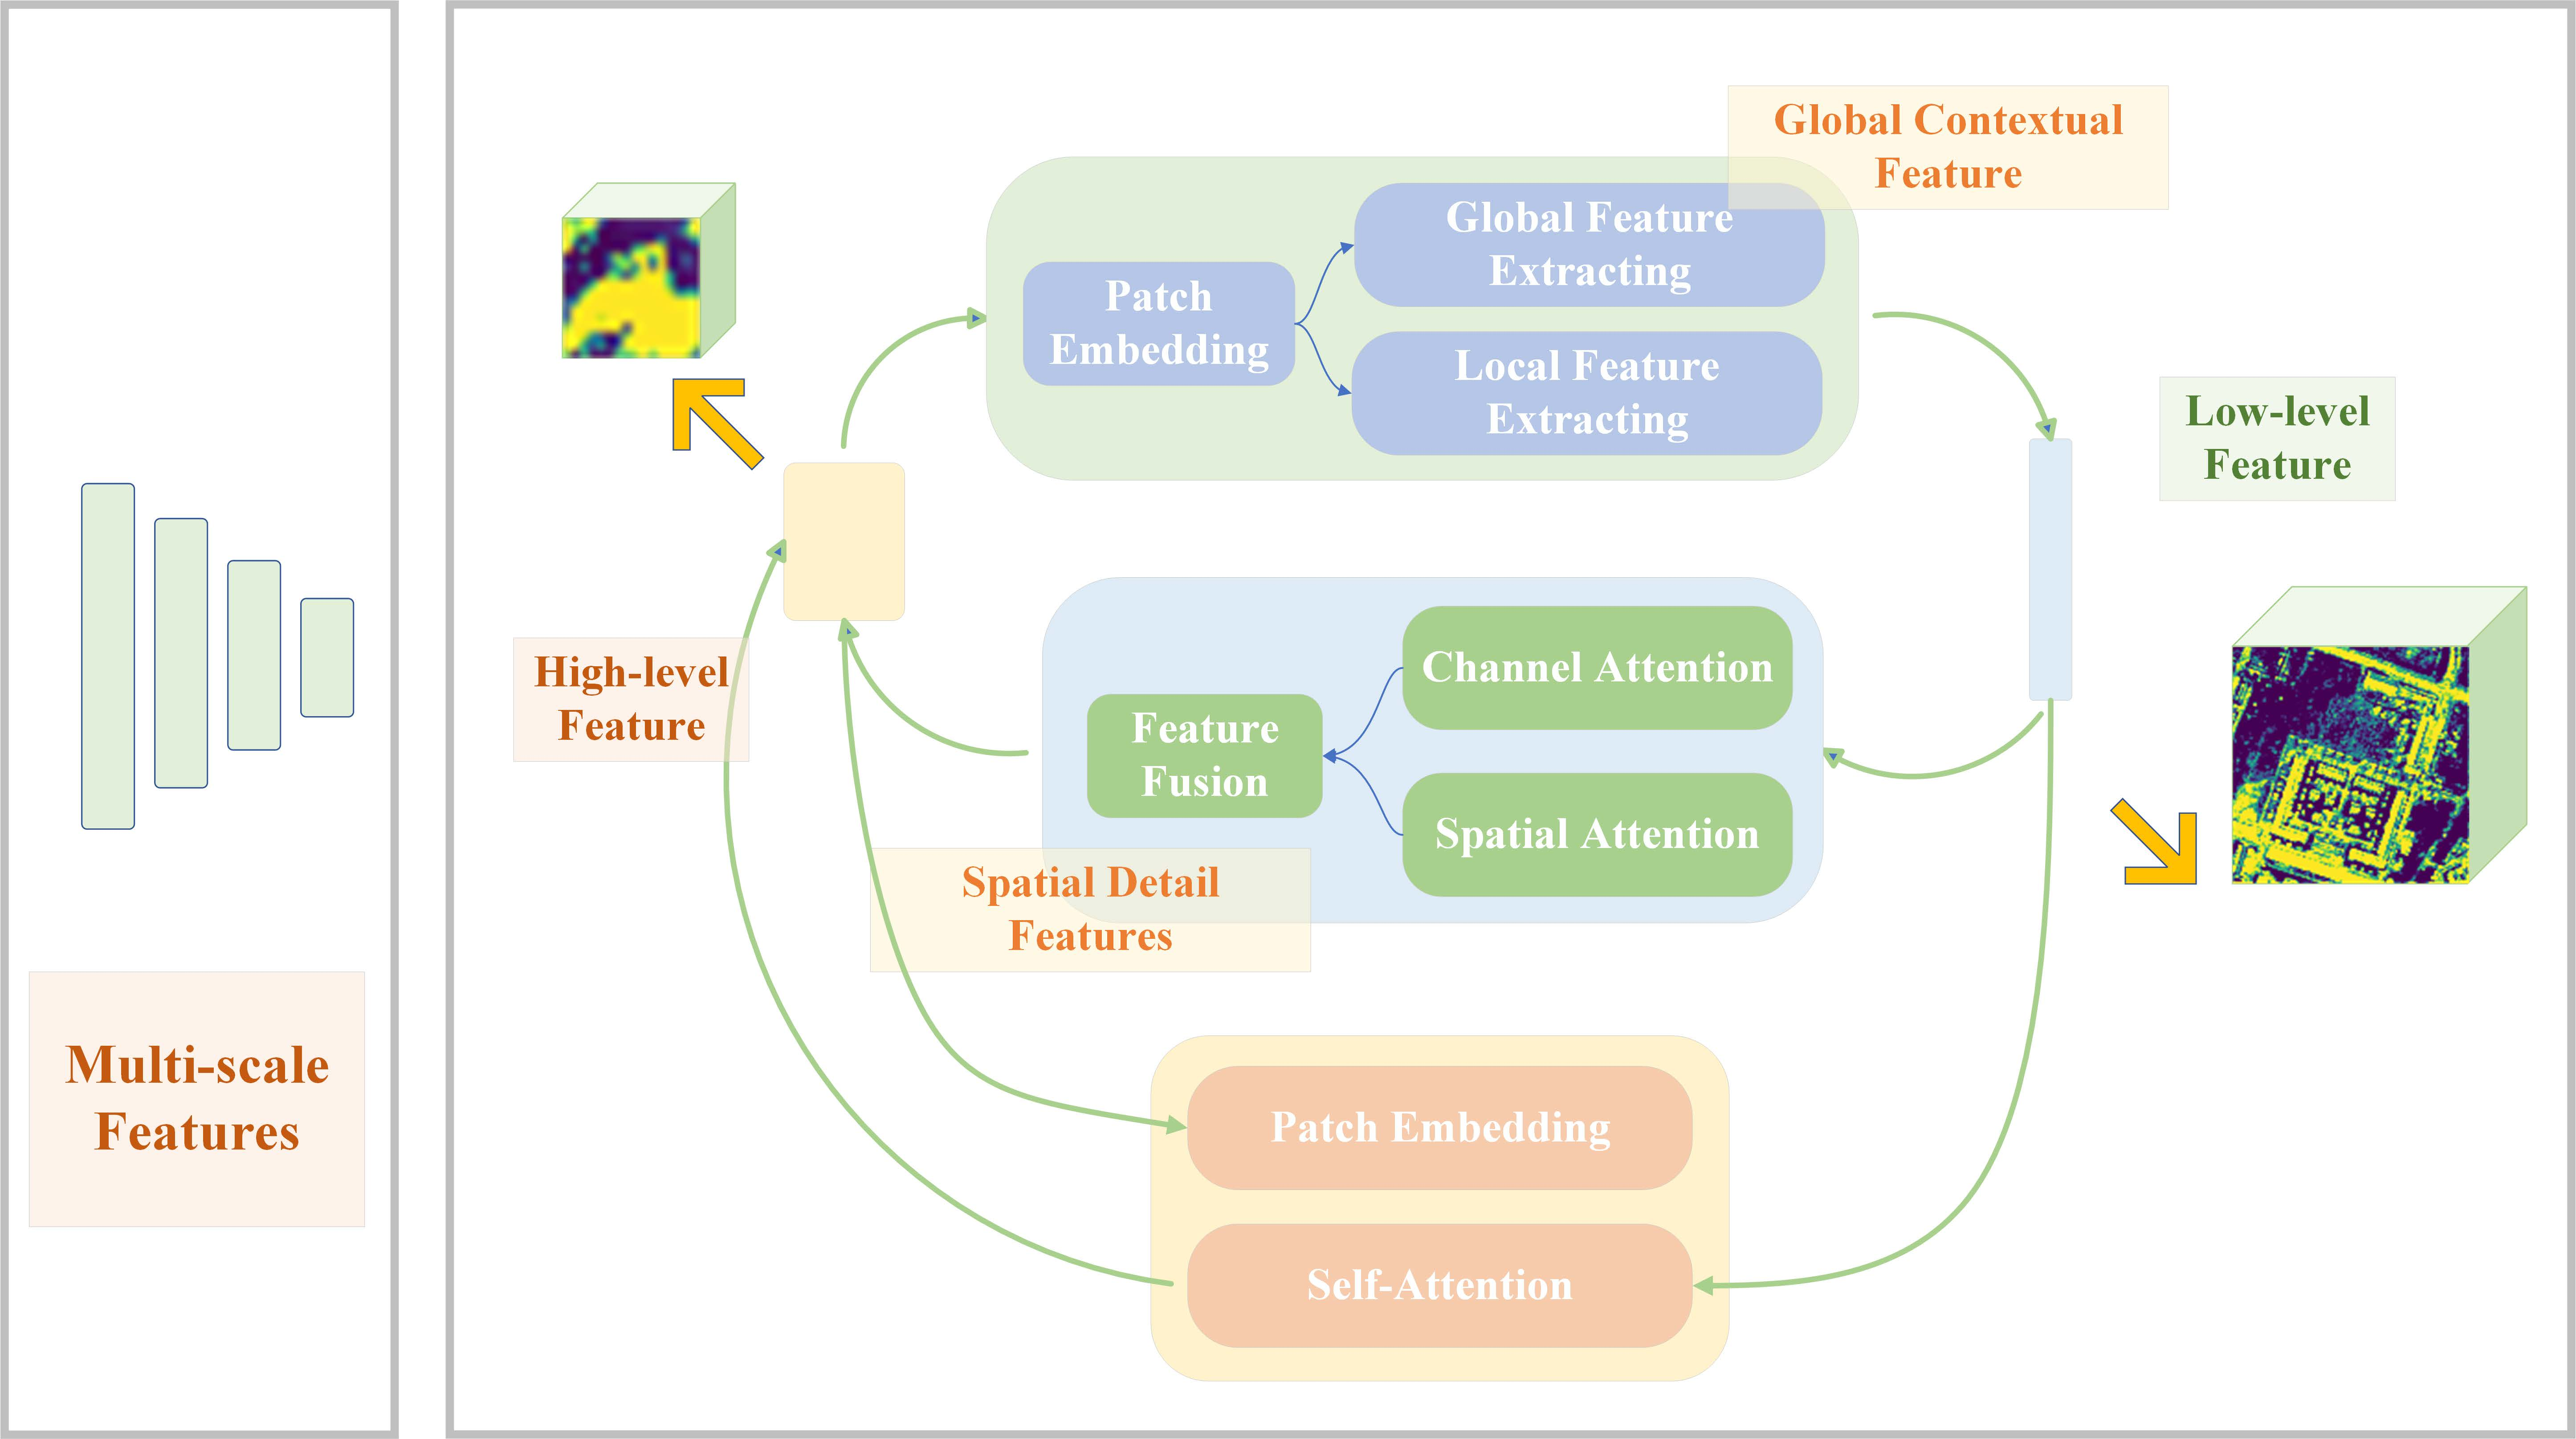
The distance from a satellite or UAV platform to an object on the Earth’s surface is much greater than the distance from an ordinary camera to the photographed object. There should also be an awareness that both the distance and the viewpoint differ, with an overview for remotely sensed images and a sideview for close-range images. Therefore, traditional images and remote sensing images contain variations. They cover a very wide spatial area and have a larger scale [17]. Moreover, objects in remote sensing images are relatively smaller compared to conventional images, which makes it more difficult to access global semantic representational properties. On the one hand, high-level features have coarse image resolution and lack spatial detail characteristics, which reduces the capability of the model to segment fine objects. On the other hand, low-level features have finer resolution and smaller receptive fields, providing greater geometric representation capability suitable for handling small targets. The discrepancy between the different levels of features (high and low level) is shown in Figure 1. However, the shallow CNN layers that produce low-level features lack abstract semantic information and contextual content, which limits the accuracy of semantic segmentation. In other words, focusing only on high-level or low-level features is insufficient for the semantic segmentation task of high-resolution remote sensing in urban areas. Therefore, it is crucial to combine high and low-level features to reduce the gap between them.
Several models have recently been proposed to improve the accuracy of semantic segmentation models for high-resolution remote sensing images by reducing the gap between the high-level and low-level feature representation. LANet [18] embedded semantic information from high-level features into low-level features to strengthen the semantic reference of low-level features. However, this model does not embed spatial information from low-level features into high-level features, resulting in the spatial distribution and physical content of the latter remaining unchanged. Moreover, when extracting the contextual information of high-level features, the model barely utilizes local regions to generate channel attention maps, thus failing to exploit global long-range dependent semantic information. Excessive emphasis on local regions leads to ambiguity in the pixel-level classification, while global contextual information can alleviate this problem [19,20].
We propose a novel communicating attention module to reduce the gap between the information representation capabilities of high-level and low-level features. The module is based on the discovery that high-level features are rich in contextual information and low-level features contain more spatially detailed content, while combining the two allows the model to have both long-range global modeling and segmentation capability for tiny objects. To address this challenge, we introduce two novel modules, namely CMA and CSA, to reduce the difference between high-level and low-level features. The CMA module consists of two branches, the high-level feature flow and the low-level feature flow, respectively. The two branches are combined into a loop to aggregate the global semantic information of high-level features into low-level features, while assigning the spatial information of low-level features to high-level features, which improves the long-range dependence and geometric representation of the model. The CSA module incorporates the spatial detail of low-level features when computing the attention map of high-level features, thereby avoiding excessive focus on global contextual information. This improves the perception of spatial details of high-level features and provides a trade-off between capturing global and local features. In this study, the model was tested using the ISPRS Potsdam and Vaihingen datasets to ensure the validity of the algorithm we propose.
To summarize, the contributions of this paper are as follows:
- (1)
- To bridge the gap between high-level and low-level features in terms of spatial distribution and physical content, we introduce two attention modules, CMA and CSA. These modules enhance the model’s ability to capture fine targets while maintaining the global semantic modeling capability.
- (2)
- We propose the CANet model for semantic segmentation of high-resolution remote sensing images. The model improves the accuracy of semantic segmentation in urban areas by fusing output features of different scales and levels from the CNN in the encoding stage using the attention mechanism.
2. Related Work
2.1. Semantic Segmentation of Remote Sensing Images
Semantic segmentation of remote sensing images is a hot research theme in the field of computer vision and remote sensing technology, which aims to segment pixels or regions in remote sensing images into categories with specific semantic labels. This technique is of significant value in application scenarios such as land cover classification [21], urban planning [22], and environmental surveillance [23]. In recent years, remarkable progress has been achieved in semantic segmentation of remote sensing images with the development of deep learning techniques.
Deep learning methods, especially convolutional neural networks (CNN), have become the mainstream technique for semantic segmentation of remote sensing images. In this regard, a typical model is the full convolutional network (FCN) [24], which first applied CNNs to pixel-level image segmentation. Afterwards, many modified models based on FCNs came into being. For example, SegNet [25] employs an encoder–decoder structure to improve segmentation performance, while U-Net [26] achieves accurate edge segmentation by skip connections.
Some researchers have focused on fusing multiscale information to improve the performance of semantic segmentation in remote sensing images. For example, DeepLabV3+ [27] employed dilated convolution and pyramidal pooling modules to capture multi-scale information. In addition, HRNet [28] proposed a high-resolution network that integrates high-resolution features and multi-scale features to improve segmentation accuracy. DANet [29] enabled better contextual information acquisition through a self-attention mechanism that improved the performance of remote sensing image segmentation. Meanwhile, DANet also introduces spatial and channel attention to further optimize the segmentation results.
Spatial resolution and spectral resolution are often not available at the same time, so the number of bands in high-resolution remote sensing images is low, and the capture of spectral characteristics of features is deficient. The Gaussian-weighting spectral (GWS) feature and the area shape index (ASI) feature are based on adaptive areas to compensate for the lack of high spatial resolution images for land cover classification features [30].
2.2. Attention Mechanism
Traditional convolutional neural network models have limitations in handling complex remote sensing images for semantic segmentation. For example, there are certain barriers to fully obtaining the content of the image, resulting in low accuracy. To overcome these obstacles, the attention mechanism is introduced into models for semantic segmentation tasks of remote sensing images. By adopting the attention mechanism, the model adaptively adjusts the weights of different features to better capture the important features in remote sensing images and increase the accuracy and robustness of segmentation. In addition, the attention mechanism can also reduce the computational complexity and the efficiency of the algorithm. Therefore, the attention mechanism model becomes one of the essential techniques in the segmentation field of remote sensing image semantics and is extensively used in various remote sensing image segmentation tasks.
Attention mechanisms for the areas mentioned above are typically classified into two categories: spatial attention and channel attention.
The earliest spatial attention model is the Spatial Transformer Network (STNet) [31], which is a neural network module that can adaptively perform spatial transformations on the input. Since remote sensing images typically have large scale, high dimensionality and complex spatial structure, it is not possible for traditional image segmentation methods to process them effectively. In contrast, STN networks can preprocess the input images by adaptive spatial transformations to improve the segmentation accuracy. Although the STN network has many advantages in the field of semantic segmentation of remote sensing images, it also exhibits some limitations. First, STN networks need a large amount of training data to learn the transformation parameters, otherwise, the problem of overfitting may occur. Second, STN networks may not be able to be efficiently handle some complex transformations (e.g., nonlinear transformations).
Channel attention mechanisms are also widely applied in semantic segmentation of remote sensing images. The earliest channel attention model is the Squeeze-and-Excitation Network (SENet) [32]. Specifically, SENet achieves a better feature representation by calculating the significance of each channel and weighting the channels according to their importance. However, the limitation of SENet is that it requires a large amount of computational resources. Therefore, there may be some challenges in practical application.
Several modified models using channel attention mechanisms have been developed, including CBAM (Convolutional Block Attention Module) [33], ECA-Net (Efficient Channel Attention Network) [34], and SKNet (Selective Kernel Networks) [35]. Among them, CBAM is a module that can be embedded into existing deep learning models, and it contains both the channel attention mechanism and spatial attention mechanism. The channel attention mechanism is used to adjust the importance of each channel, and it employs the spatial attention mechanism to adapt the significance of the spatial location. This combination can improve the capabilities of the model and is more flexible than other attention mechanism models. ECA-Net is a lightweight model that strengthens the model’s attention to important characteristics by introducing the ECA module. In addition, SKNet is a selective convolution-based model. It implements the channel attention mechanism by controlling the shape of each convolution kernel through selective weight vectors to enhance and augment the efficiency of the model.
MANet [36] utilizes multiple attention modules to model global long-range information and proposes linear complexity attention to solve the problem of operations that require huge memory and time consumption. UNetFormer [37] performs attention extraction for both global and local information, maintaining a balance between contextual and spatial detail information. CHGFNet [38] proposes a co-attention mechanism to fuse optical and SAR images, and thoroughly explores in depth the complementary relationship between the two images.
The attention mechanism plays an essential role in the semantic segmentation of remote sensing images. It can facilitate the model to capture the features of different regions and channels to promote the performance of the algorithm. In the future, with the continuous development of deep learning and remote sensing technology, the attention mechanism will also play a more crucial role in remote sensing image analysis.
2.3. Multi-Scale Feature Fusion
Multi-scale feature fusion is an extensively researched and employed technique in the field of semantic segmentation. Its primary objective is to integrate feature information from various scales and aims to enhance the accuracy of segmentation outcomes.
Some established researchers have utilized the traditional image pyramid approach, where the original image is scaled to different sizes, and the corresponding feature maps are retrieved and then integrated [39]. Other studies have adopted multiscale CNN models by introducing feature extraction modules at different scales directly in the network, for instance, the Pyramid Scene Parsing Network (PSPNet) [40] and DeepLabV3 [41].
Although multi-scale feature combination has been widely implemented in the field of semantic segmentation of remote sensing images, it still has some limitations and drawbacks. On the one hand, the conventional image pyramid method requires multiple scaling and feature abstraction of the original image, which is computationally intensive and prone to information loss and blurring. On the other hand, introducing multi-scale feature extraction modules directly into the network can reduce the computational effort and information loss, but tends to cause problems such as overfitting and a model complexity increase.
Some improvement approaches have been proposed for the issue of multi-scale feature fusion. For example, some studies have introduced attention mechanisms for adaptively selecting feature information at different scales [29,42]. Other studies have provided lightweight network structures based on deeply separable convolutions to reduce model complexity and computational complexity [43,44].
Building on the previous study, we propose the CMA and CSA modules for fusing high-level features with low-level features using the attention mechanism. Furthermore, we combine multiple attention modules to form the CANet model.
3. Materials and Methods
3.1. Approach Overview
To balance the ability to capture global contextual content and local spatial detail information, we propose the use of the CMA and CSA modules. Multiple CMA modules are embedded in CANet to reduce the gap between neighboring feature maps, while a CSA module is used to incorporate spatial geometric information when computing attention maps for high-level features. The redefined feature maps are then skip-connected to the decoder to output predicted images.
3.2. Communicating Mutual Attention (CMA)
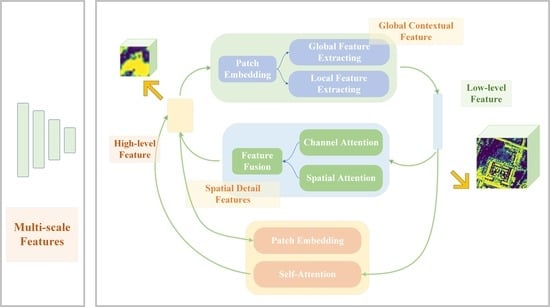
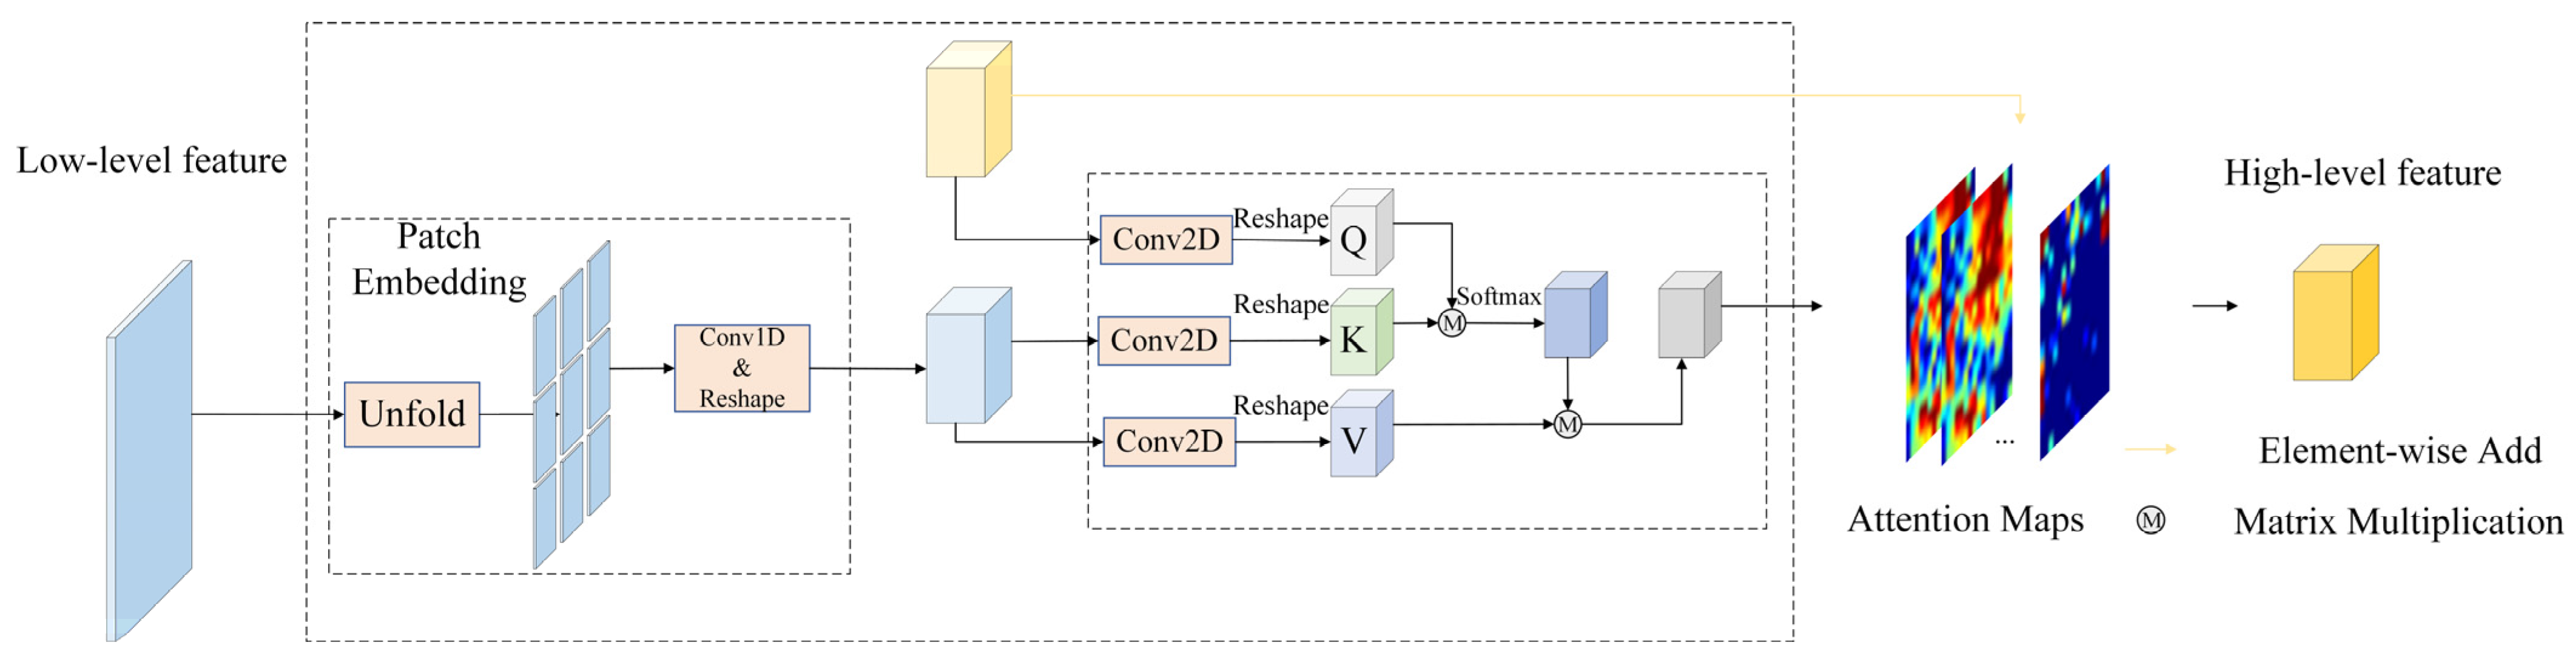
The communicating mutual attention module includes two branches: high-level feature flow (HLF) and low-level feature flow (LLF), as shown in Figure 2. The high-resolution coarse features preserve more spatial and contextual characteristics, while the low-resolution fine features are rich in semantic characteristics. The balance between the two flows is essential for semantic segmentation. The LLF extracts the spatial and contextual information of the low-level features, which is transformed into an attention map, and then it is combined with the high-level characteristics. At the same time, in the high-level feature flow, attention extracted from the high-level features is aggregated with the low-level features. It can be seen that the high-level feature flow forms a closed loop with the low-level feature flow. Therefore, high-level features can communicate with low-level features in this closed loop.
High-level features and low-level features are features output from different layers of the backbone network, so they have different shapes. In order to ensure that the features are the same shape, we have used patch embedding. To get the patches of low-level features, we first set and , where is the size of the kernel, is the size of the stride. is unfolded from to , where is equal to . Then, is reshaped to . Eventually, the 1D convolution is used in to ensure that has the same number of channels as .
Both exhaustive and detailed information is crucial for semantic segmentation because of the complexity of urban situations. This maintains a balance between global context and spatially detailed information [37]. Thus, we employ self-attention and 2D convolution to capture the global and local characteristics of low-level features. Features can be extracted from long-range information by self-attention, which can upgrade the global information of features. In order to achieve the above, we will first reshape into and use the 1D convolution to get the query matrix , , per column of the transformation result which is the 1D sequence of feature channels and each row is the value of a different channel at the same position in the feature map. Moreover, in the same way it is possible to obtain key matrix and value matrix .
We calculate the similarity of every row vector from to the corresponding elements of other row vectors from .
By using the softmax function for each row of the similarity matrix, the normalized similarity weights of the elements at each position of the feature graph can be produced in relation to all other elements.
The normalized similarity weight matrix is the matrix multiplied by to generate a matrix of shape . Finally, the shape of this matrix is transformed to to obtain the self-attention weight matrix.
where is the channel number of the characteristic graph.
Features with contextual information are generated by adding self-attention weights to the original feature map.
We deploy 2D convolution to obtain partial features. Finally, global features are aggregated with the local characteristics to generate the attention graph of the low-level feature stream.
Using spatial or channel attention mechanism alone cannot fully extract contextual features. Therefore, we divided the high-level feature flow into spatial attention and channel attention in parallel to provide precise context features. Spatial attention is identical to self-attention in the LLF. Channel attention generally uses global pooling; however, global pooling cannot capture information about the position of an image in 2D [45]. In addition, global pooling causes the feature map to lose spatial detailed information. Thus, we employ two pooling kernels and to pool horizontally and vertically to generate feature descriptors and .
The 2D convolution and sigmoid functions are used for and to obtain attention in the horizontal and vertical directions.
The spatial attention of is fused with the channel attention and converted to the same shape as by 1D convolution and upsampling.
The attention and extracted from the low-level feature stream and the high-level feature stream is added elementwise to the high-level and low-level features extracted by the encoder, respectively, for the purpose of feature communication. Hence, the rich spatially detailed information of the low-level features is aggregated into the high-level features. The semantic content is embedded in the low-level features.
3.3. Communicating Self Attention (CSA)
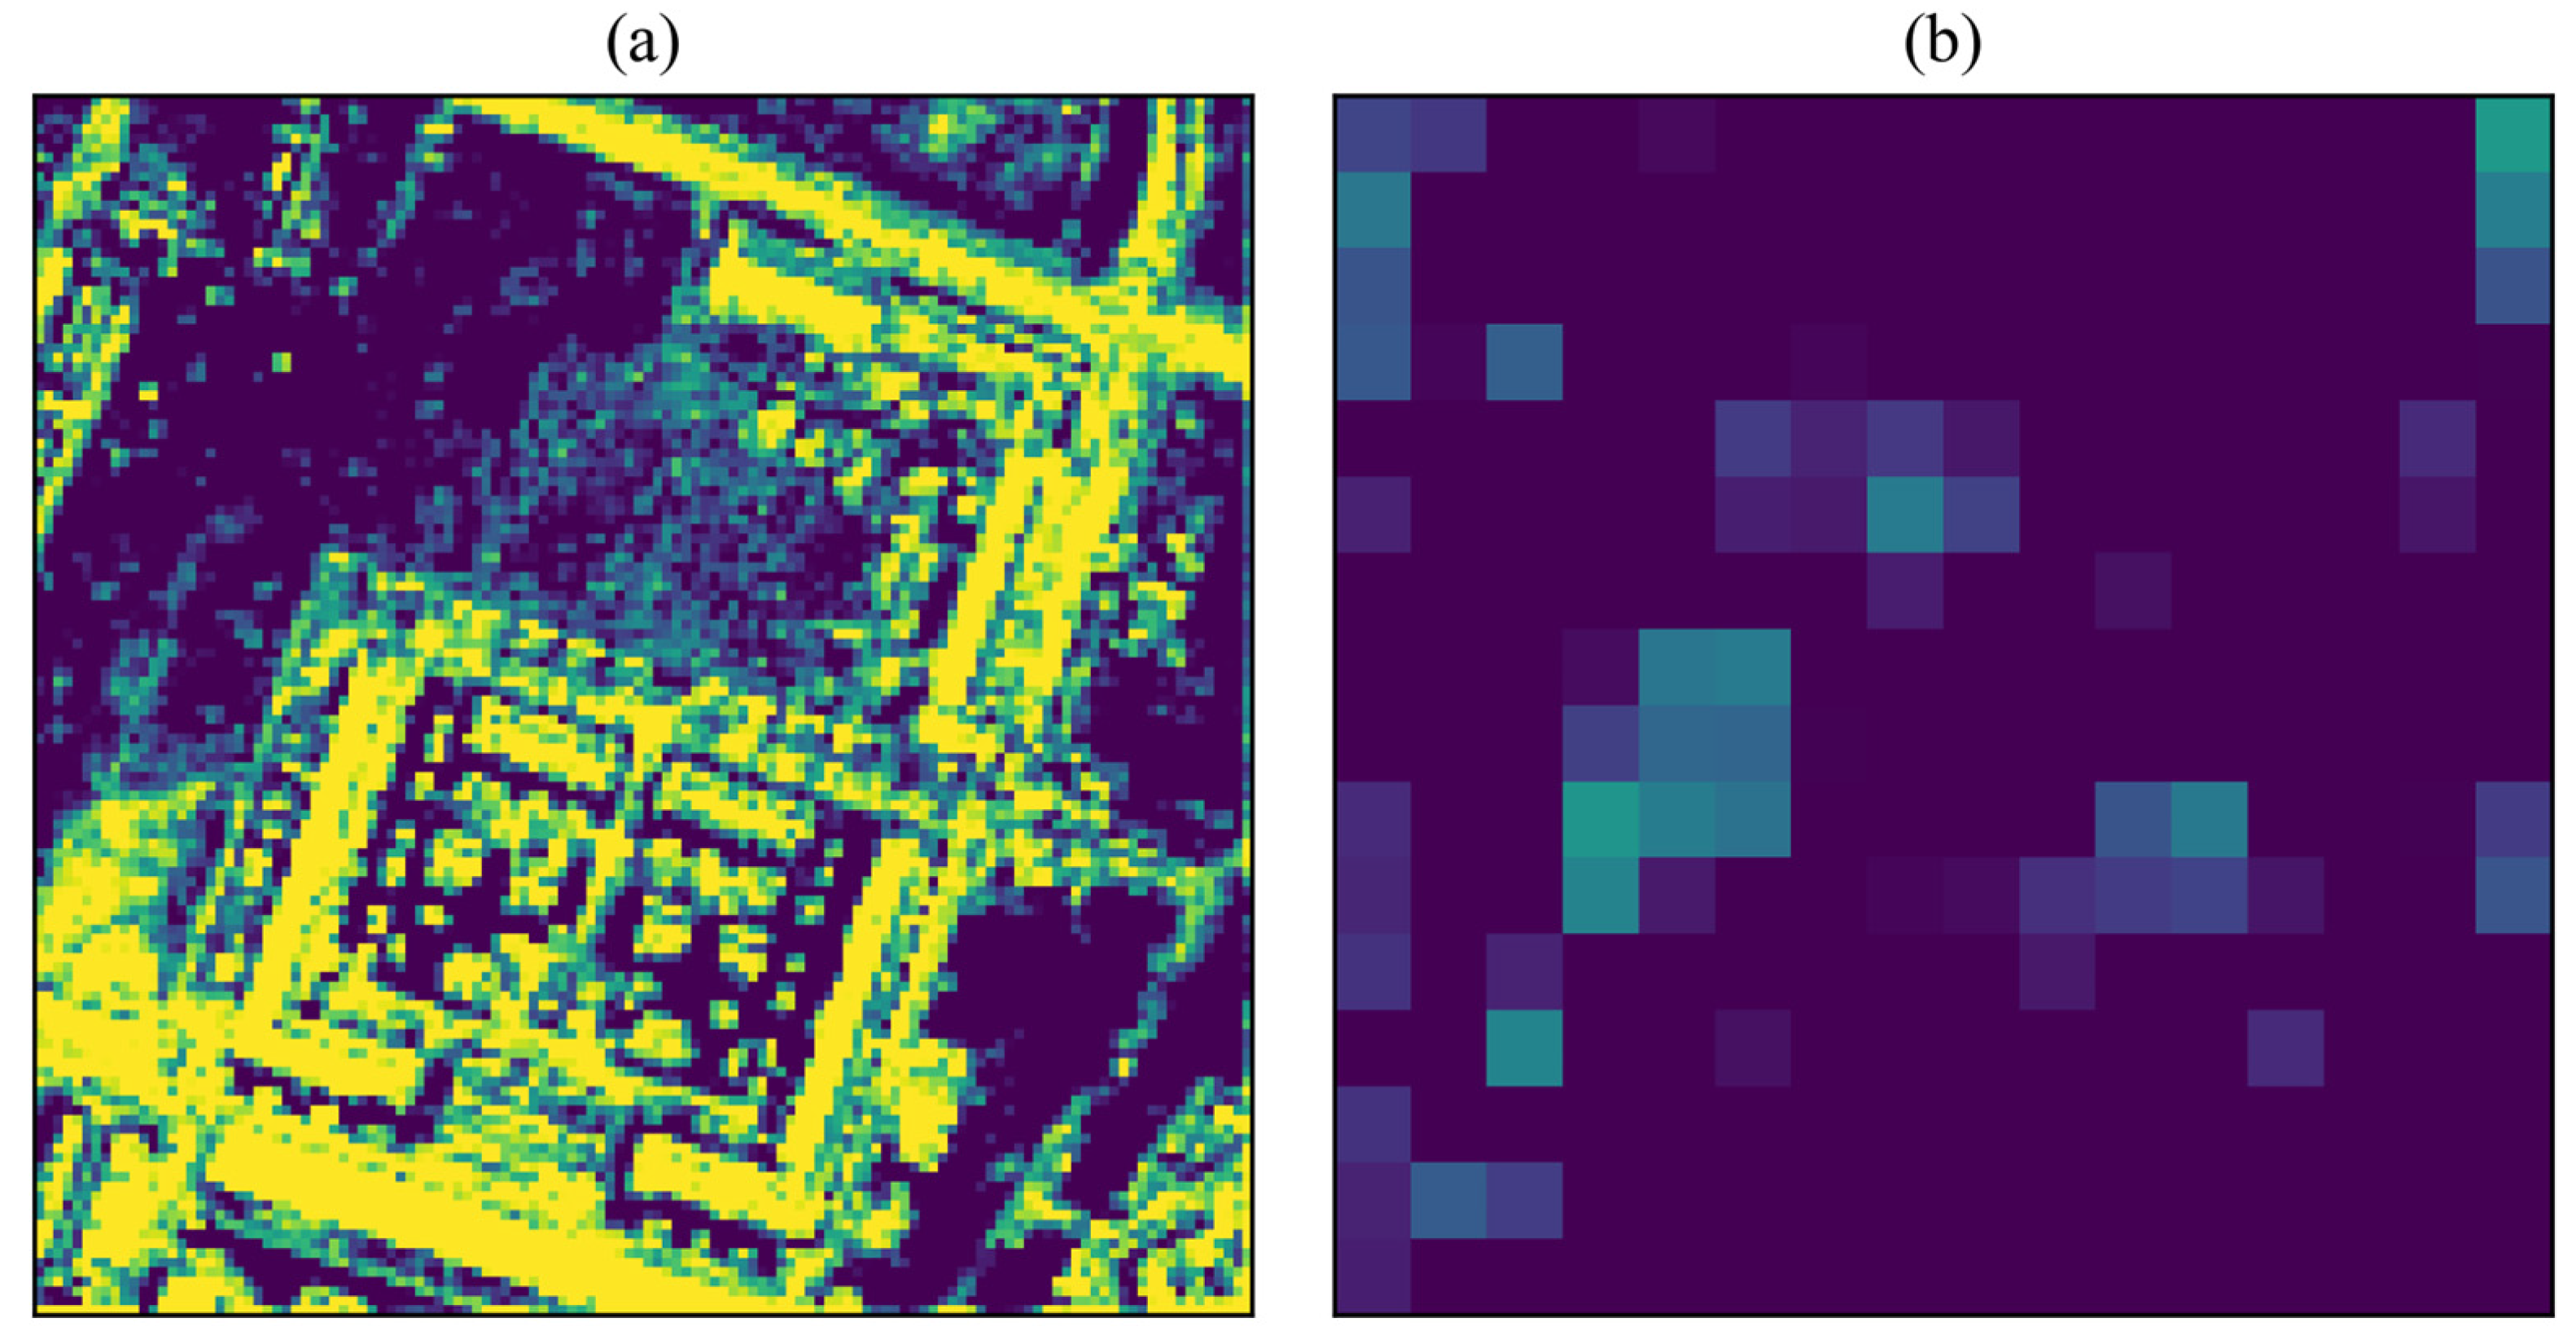
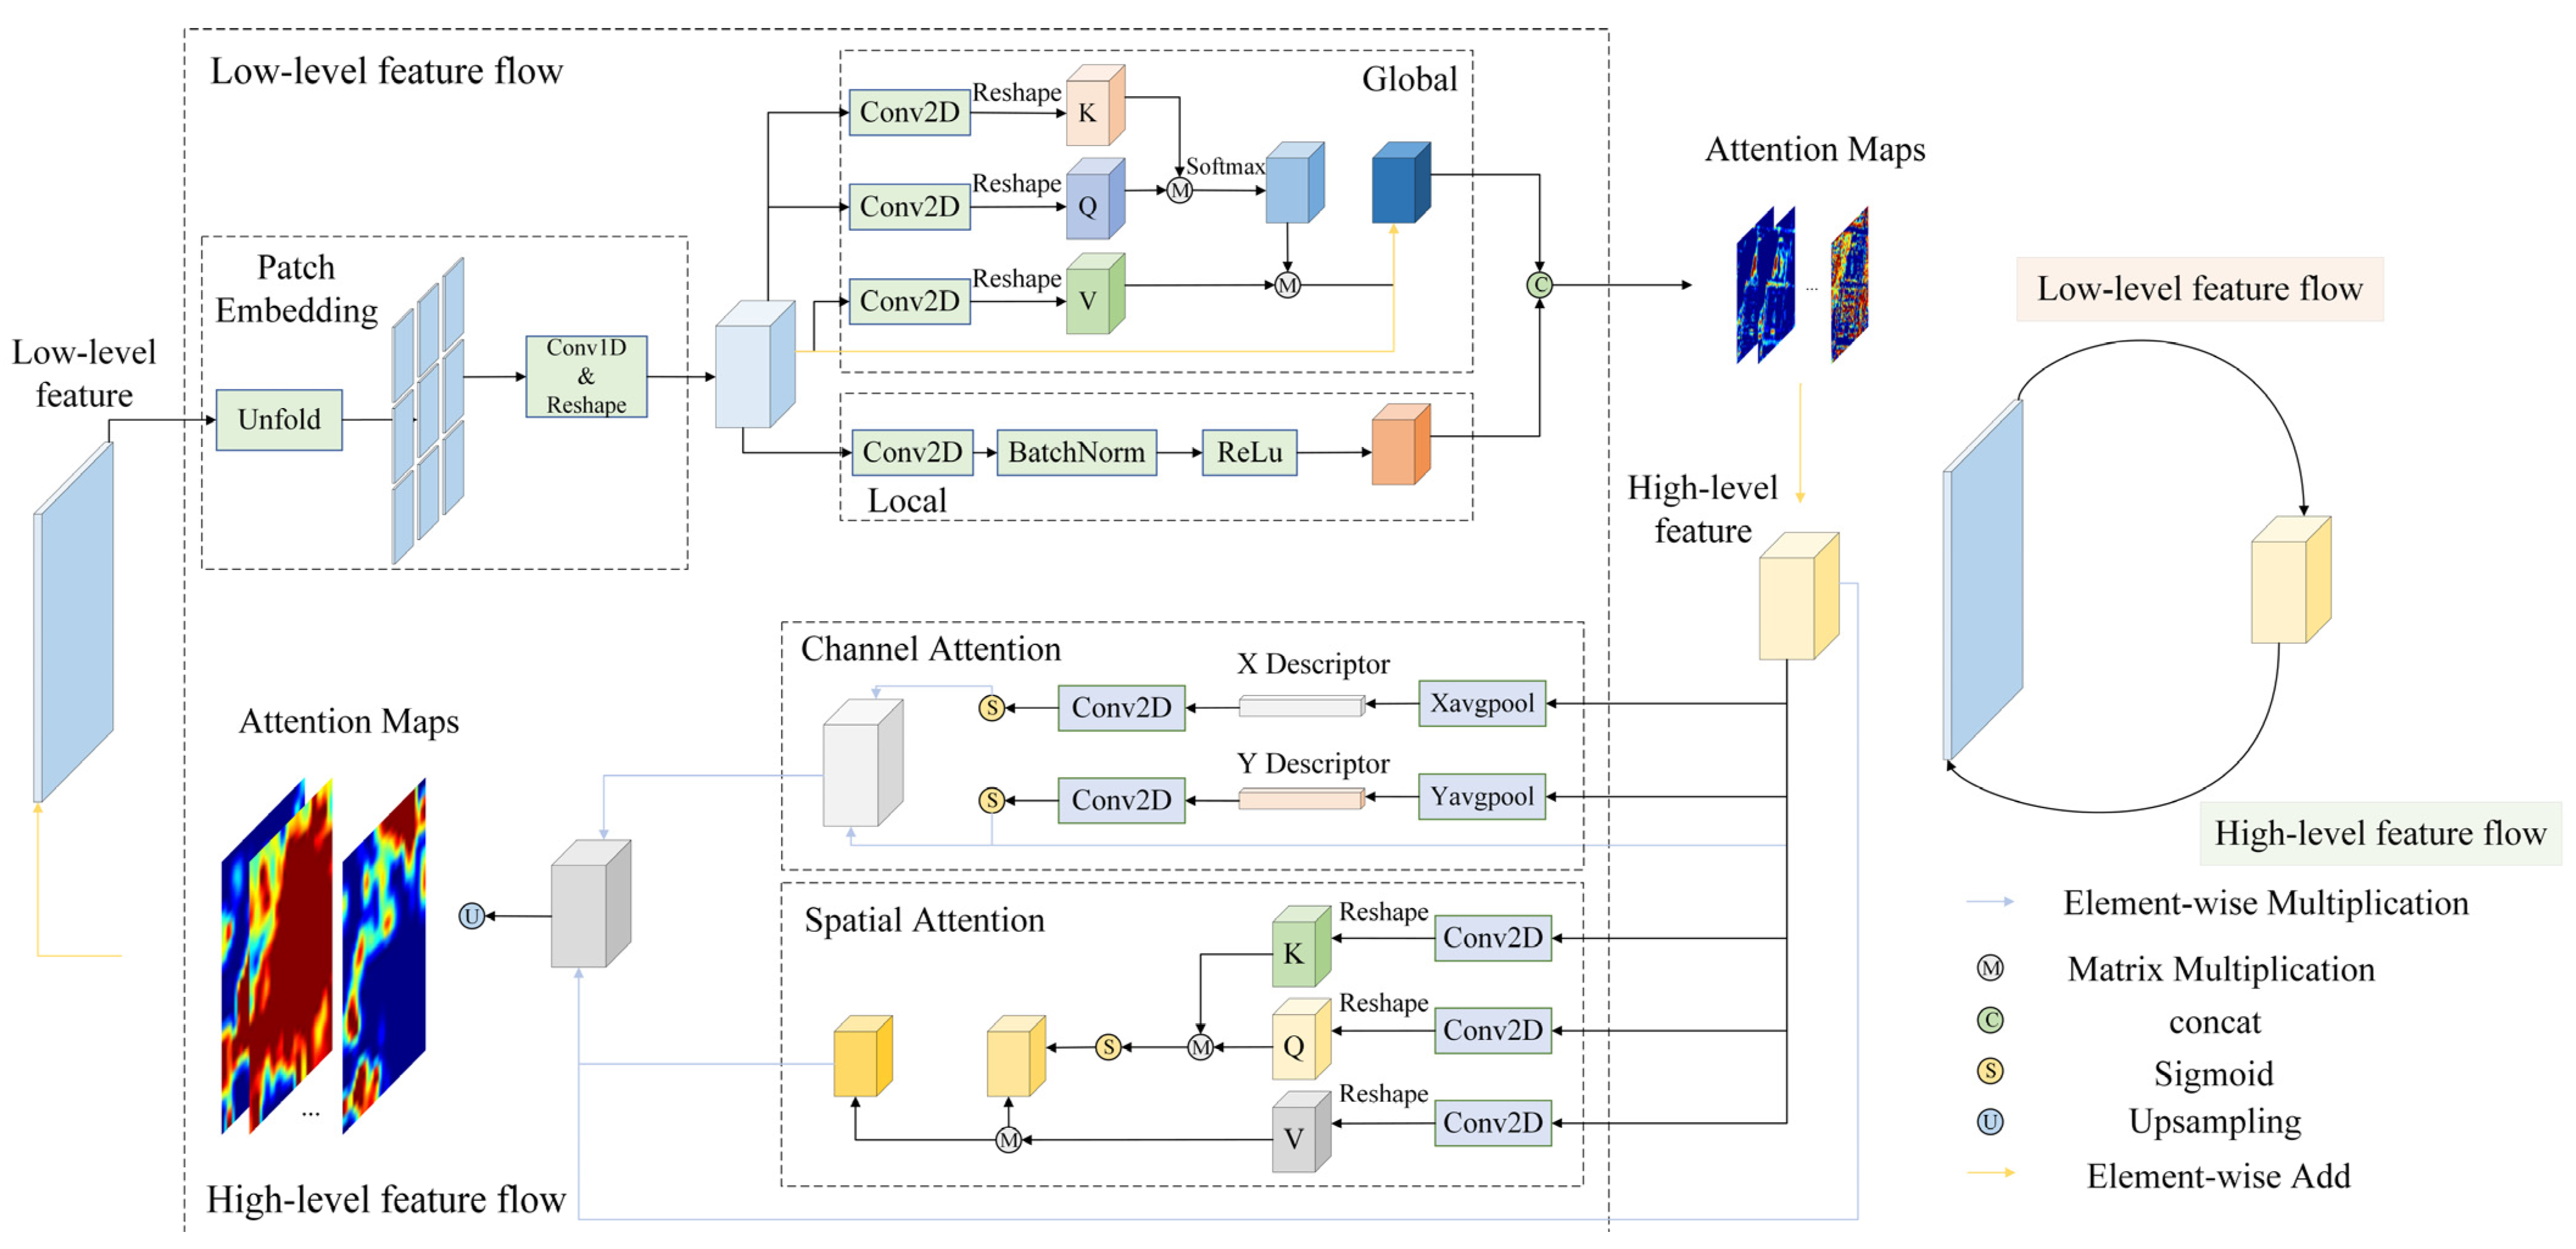
The attention maps for low-level and high-level features are typically computed separately without considering their interaction. However, the attention map of high-level features leads to a greater bias toward semantic information and misses the spatial detail representation of features, which is very unfavorable for semantic segmentation of urban areas that contain a variety of fine scenes. WiCoNet projects the contextual information of large area images into small local areas [46]. Consequently, we propose using the CSA module to improve the discrimination of tiny targets by introducing spatial characteristics of low-level features in the computation of attention maps of high-level features. Figure 3 shows the details of the CSA.
We first utilized patch embedding to make the low-level characteristics the identical shape as the high-level features, similar to the CMA module. In contrast to the calculation of the self-attention graph in the CMA, the matrix in CSA is derived from high-level features, while the and matrices are generated by transforming low-level features. In the above operation, the weight of spatial information in the attention map can be strengthened, balancing the attention coefficients of high-level features on contextual information and spatial location information, which provides sufficient effort to exploit the low-level features.
The attention maps generated by the CSA module are added element-wise to the high-level features. The deployment of residual connections can mitigate network degradation.
3.4. Communicating Attention Network (CANet)
Due to the fact that coarse-resolution high-level features lack rich spatial details and low-level features lack fine semantic content, both present complementary properties. Therefore, we propose the use of the CMA module to reduce the difference between the representation of high-level features and low-level features. The attention map provided by high-level features allows high-level features to focus further on contextual features and reduce the emphasis on spatial features, which is not conducive to improving the semantic segmentation accuracy of remote sensing images in urban areas. Hence, we designed the CSA module to incorporate the low-level features as auxiliary information added into the calculation of the attention graph of the high-level features.
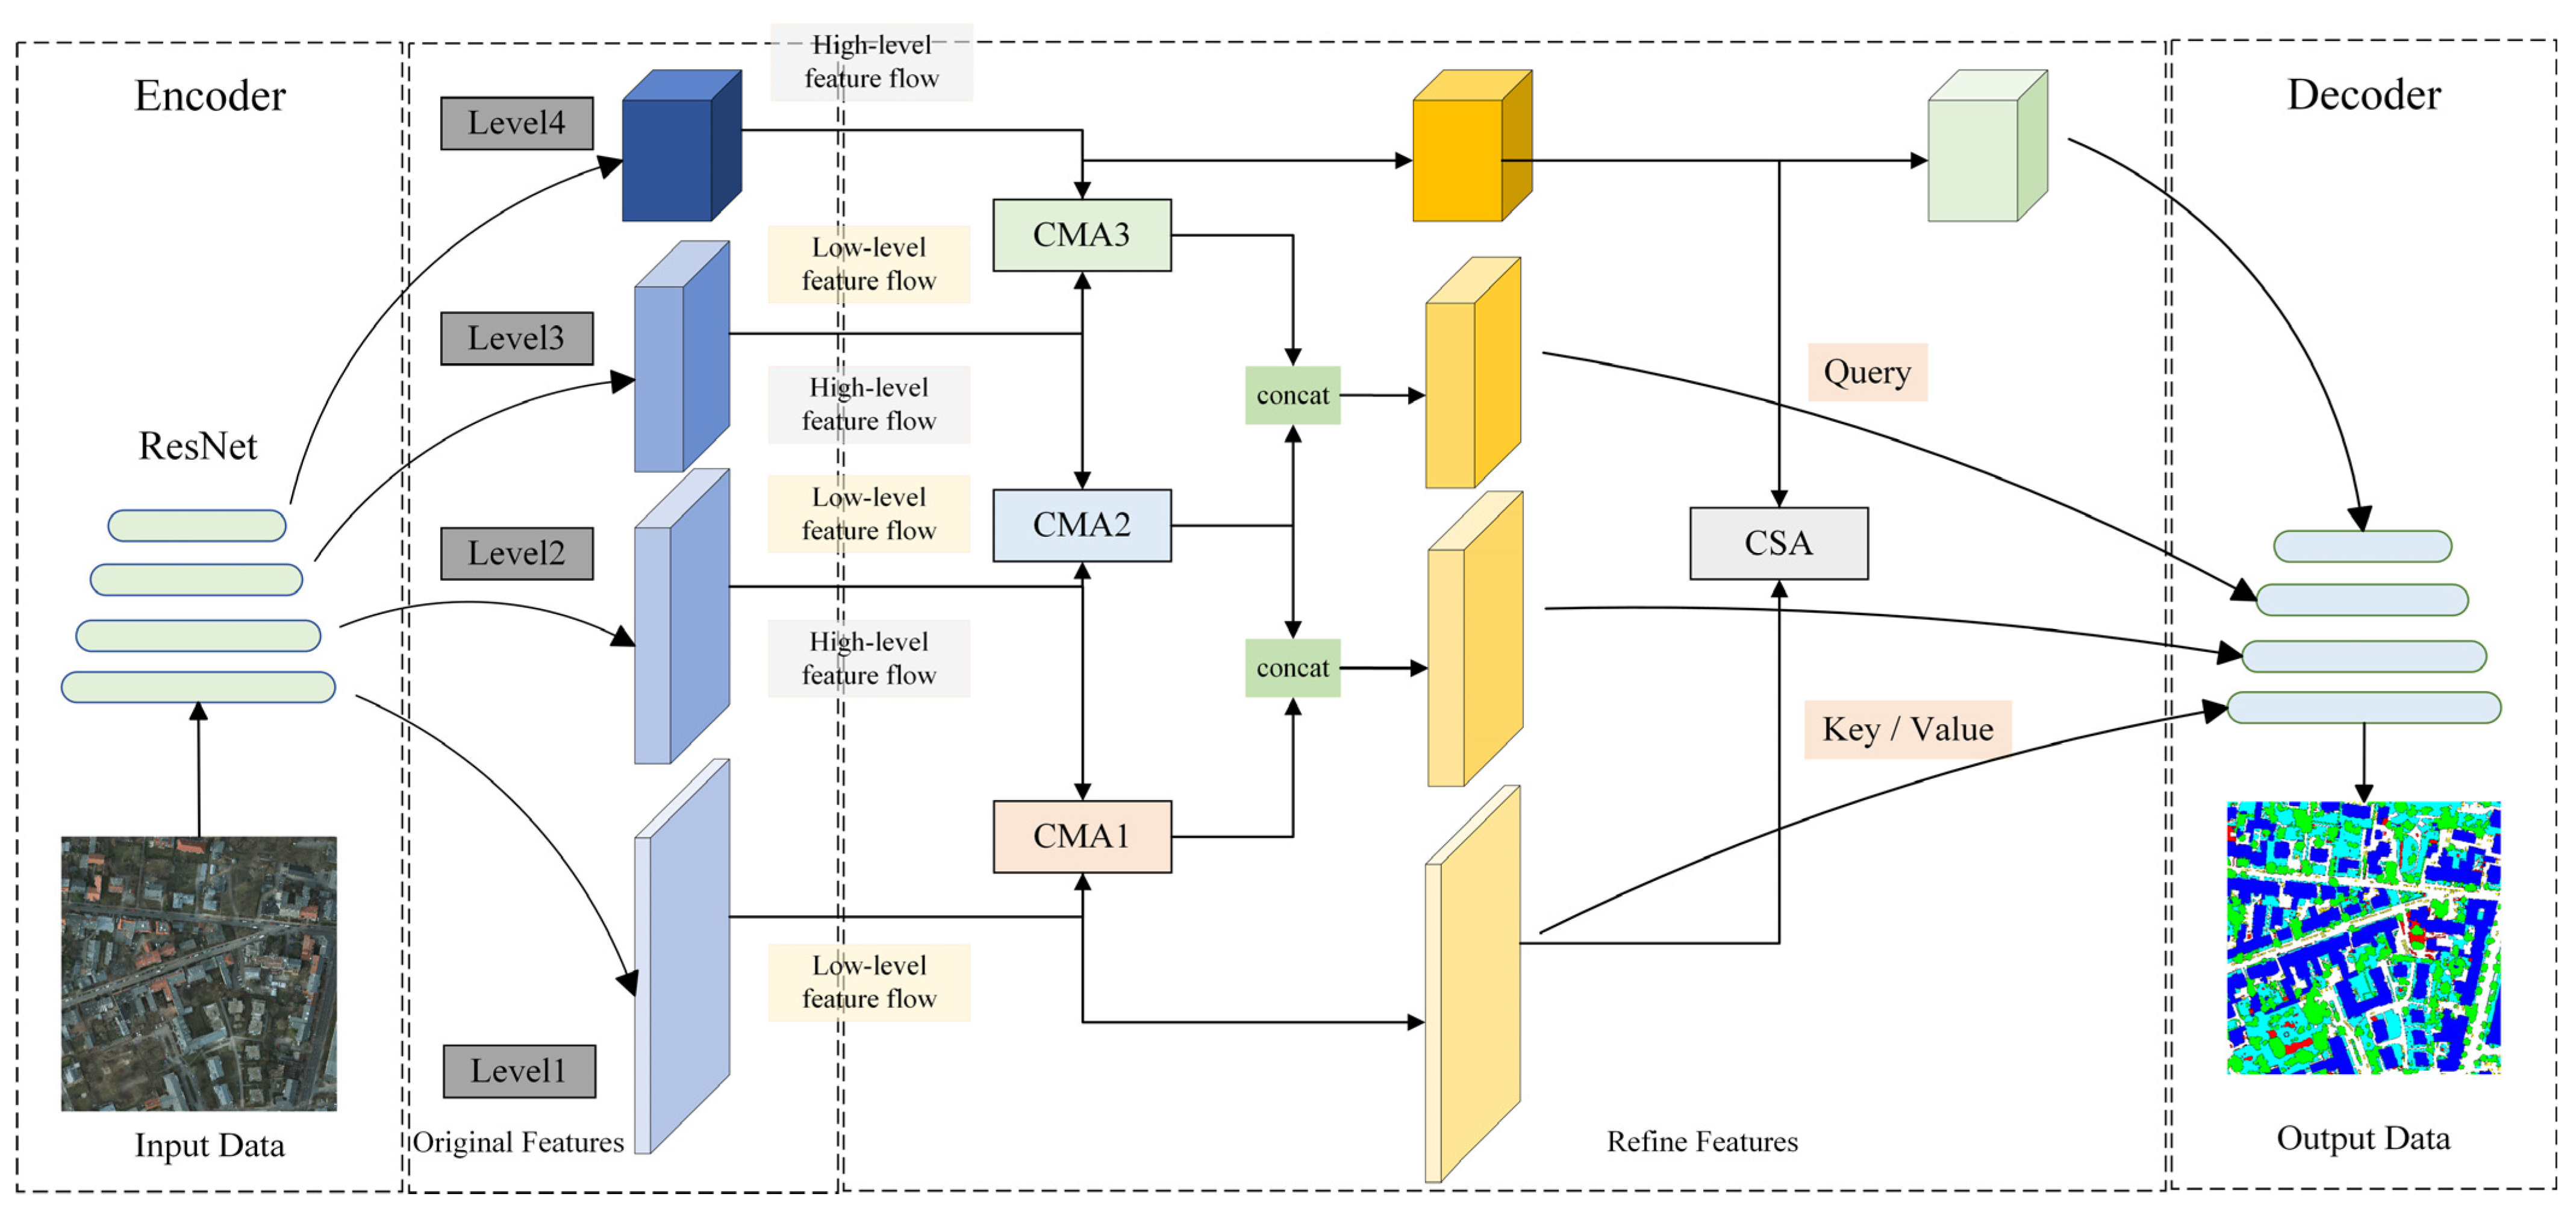
As illustrated in Figure 4, CANet utilizes ResNet50 [16] pre-trained on ImageNet as the backbone network, and its four output feature maps correspond to the output results of the network from shallow to deep layers with low to high feature levels, respectively. The CMA and CSA modules contain dot-product attention, which is relatively computationally intensive. Therefore, we employed 1D convolution to reduce the number of channels of the output feature graph to one-fourth of the original to promote computational efficiency. We adopted three CMA modules and one CSA module to communicate information about the feature maps at different levels. The three CMA modules work on and , and , and and , respectively, where the input feature maps of and are the original features output by ResNet50 when they are involved in the different modules. For the purpose of reducing the computational effort, we merely exploit and in the operations of the CSA module. The feature maps processed by the CMA and CSA modules are skip connected to the counterpart layers of the decoder. For the decoder part, the same structure is applied to each layer. First, feature maps with reduced numbers of channels can be produced by 1D convolution. Then, we use deconvolution to alter the shape of the feature graph. Finally, 1D convolution is utilized to convert the number of feature map channels to a specified number. Eventually, the output result of the last layer of the decoder is upsampled to a similar shape as the input image as the result of semantic segmentation.
The algorithm implementation flow of CANet is demonstrated in Algorithm 1.
| Algorithm 1 The algorithm implementation process of CANet (Vaihingen dataset) |
| Input: (NIR, R, G, DSM) Output: (Prediction results of semantic segmentation) // Step1: Extracting multi-level feature maps from the encoder = // Step2: CMA and CSA performs characteristic aggregation of multi-level features for i in {1, 2, 3} do = end = // Step3: Skip connection of refine features to decoders for i in {1, 2, 3, 4} do = + end // Step4: Output prediction results = end |
3.5. Loss Function
In the training phase, we employ cross-entropy loss as a loss function to measure the difference between the prediction results of CANet and the ground truth data.
where is the prediction result, and is the ground truth data.
3.6. Dataset
For a more impartial test of the model’s performance, we trained and tested it by employing the ISPRS Potsdam and Vaihingen datasets.
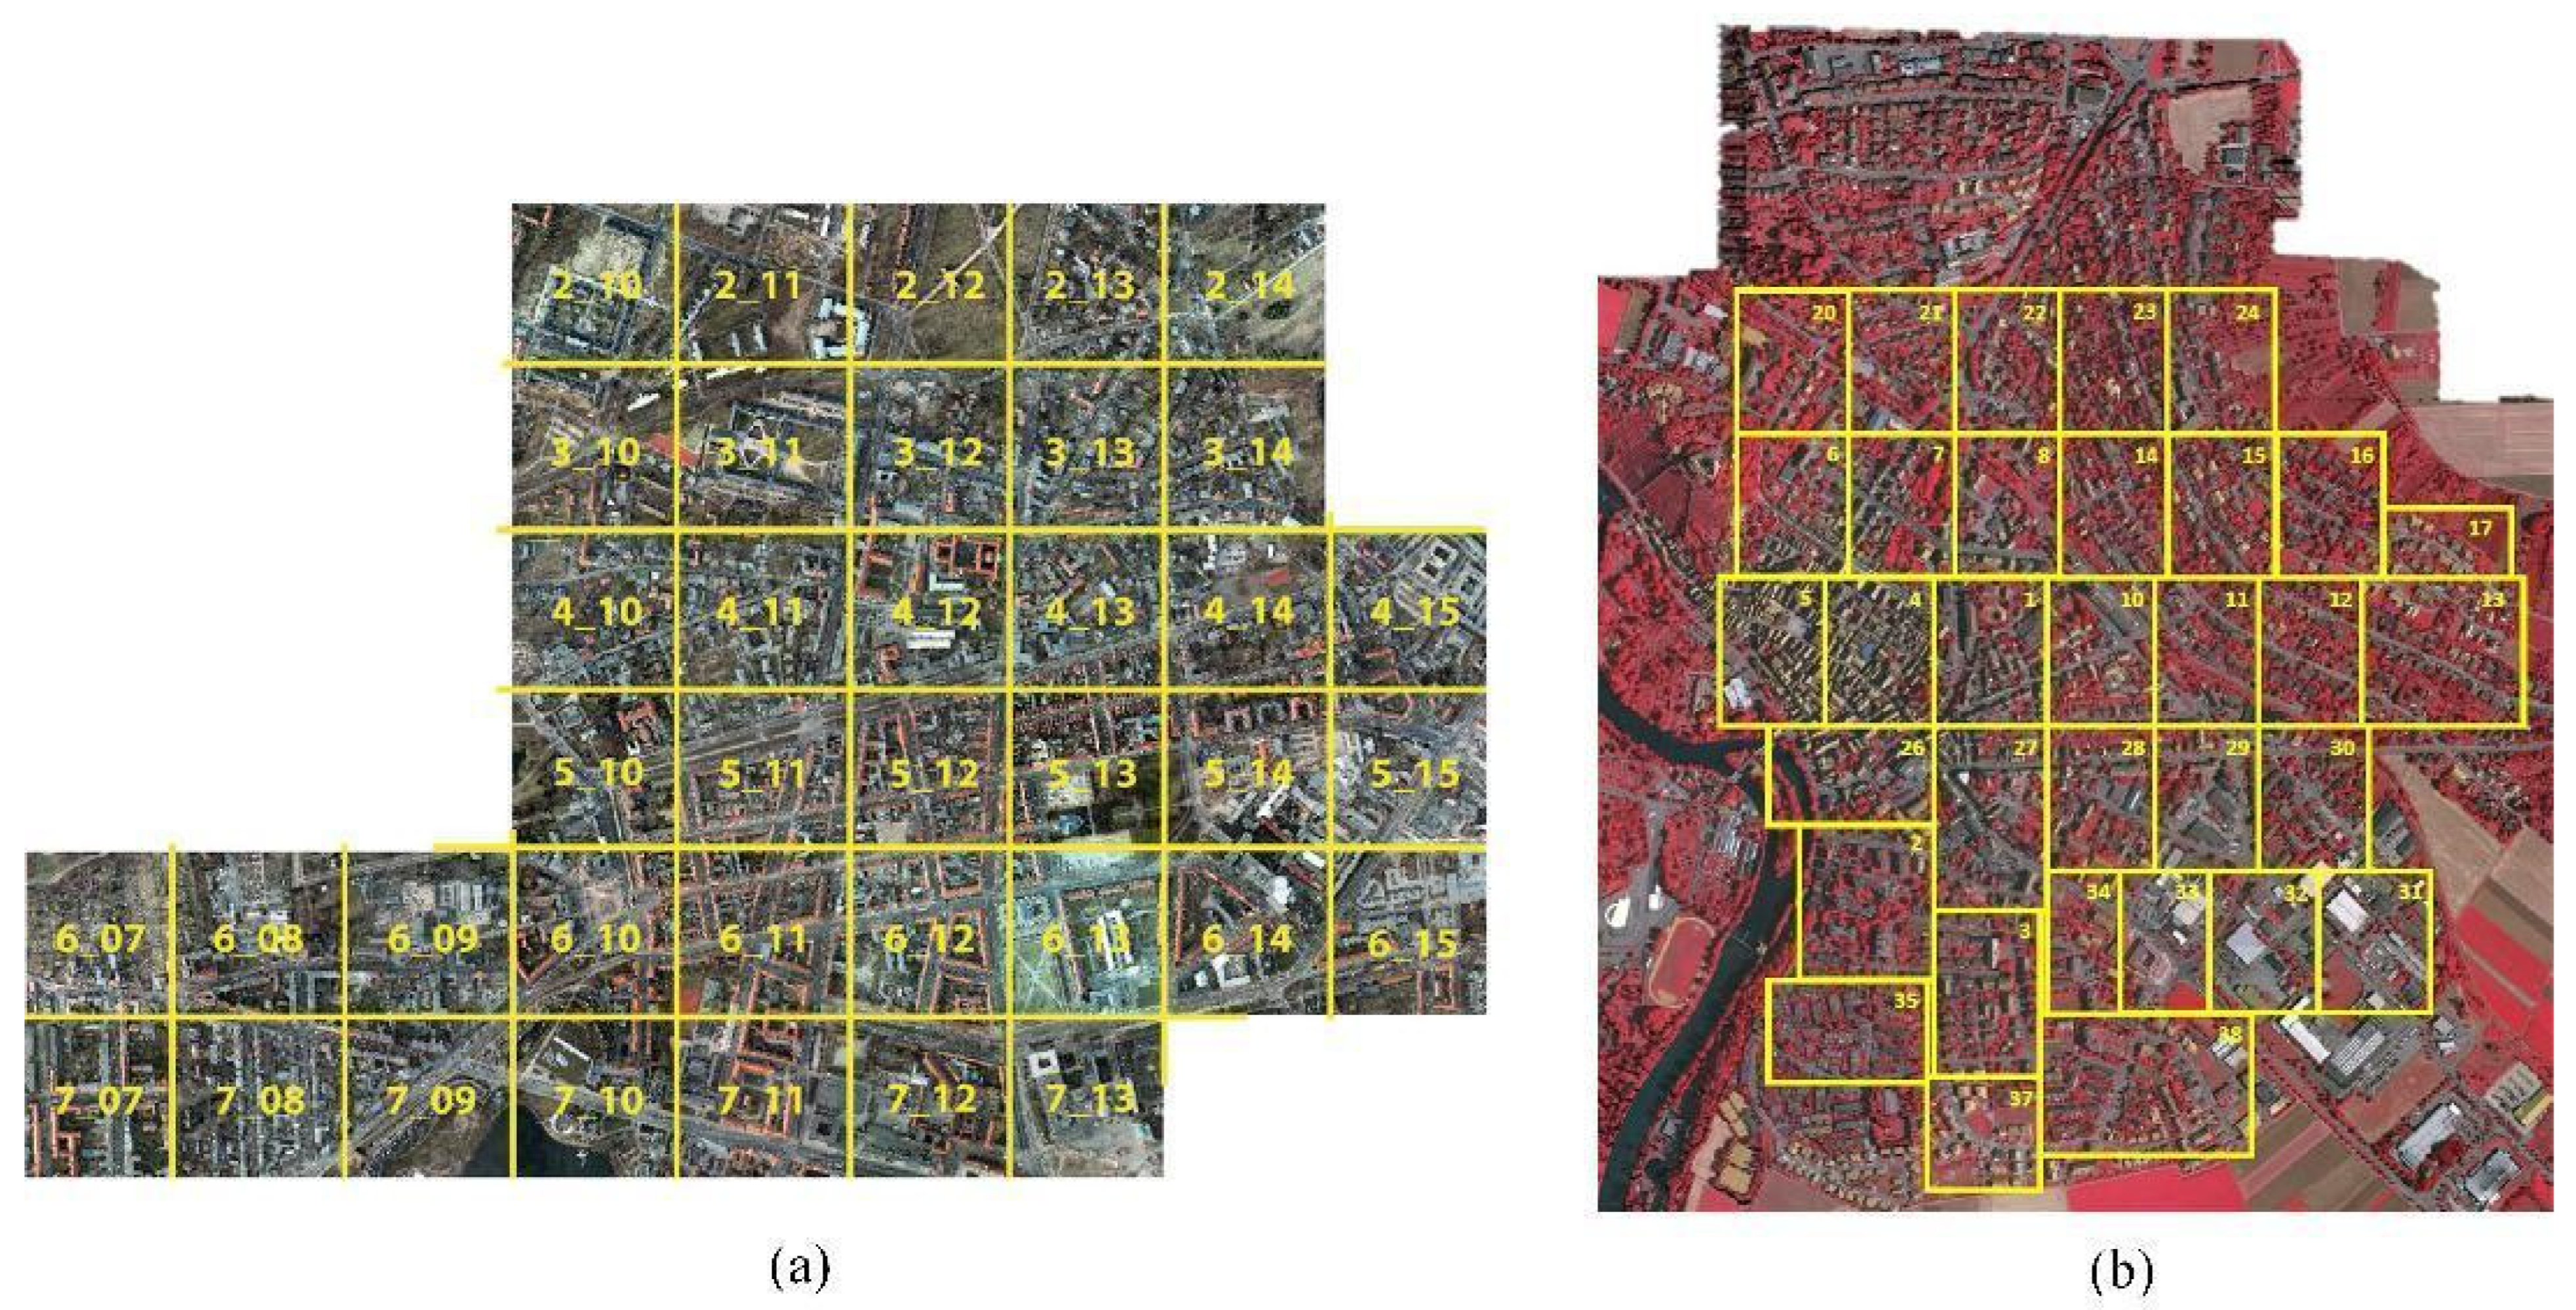
The Potsdam dataset provides 38 remotely sensed images of urban areas taken by UAV at high resolution. The images have a spatial resolution of 5 cm and a size of 6000 6000, which contain NIR, red, green, blue, DSM and normalized DSM images. In addition, each image corresponds to a surface truth image. The dataset contains six classes, which are impervious surfaces, building, low vegetation, tree, car, and clutter/background. We employed images numbered 2_13, 2_14, 3_13, 3_14, 4_13, 4_14, 4_15, 5_13, 5_14, 5_15, 6_13, 6_14, 6_15, and 7_13 for testing, images numbered 20_10 for validation, and the remaining 22 images for training.
The Vaihingen dataset consists of 33 remotely sensed images. Similar to the Potsdam dataset, this remote sensing image was also acquired by aerial photography from a UAV. Therefore, it has a high spatial resolution (i.e., 9 cm). Within this dataset, each image provides NIR, red, green, and DSM bands as well as surface truth data. The dataset comprises the identical classifiable categories as the Potsdam dataset. We utilized images numbered 2, 4, 6, 8, 10, 12, 14, 16, 20, 22, 24, 27, 29, 31, 33, 35, and 38 for testing, image number 30 for validation, and the remaining 15 images for training.
Figure 5 shows images of the entire Potsdam and Vaihingen datasets.
3.7. Data Pre-Processing and Experimental Setting
To reduce the memory consumption and increase the diversity of the data, the original images are randomly cropped and randomly flipped, and the crop size is 512 512. Note that each original image is cropped by 1000 images to enhance the amount of trainable data. The images are re-cropped at each epoch. Simultaneously, the probability of random flipping in all four directions is 25%. Moreover, in the training and testing phases, the input data are all bands provided by the dataset. In the training phase, we set the initial learning rate to 0.0002 and selected the cosine annealing strategy for the decay of the learning rate. Meanwhile, Adam is utilized as the optimizer. All experiments of this study were accomplished by PyTorch on a NVIDIA Tesla V100 GPU with 16-GB RAM.
3.8. Accuracy Evaluation
We utilized three evaluation metrics to assess the capability of the model, namely, overall accuracy, F1-score, and mean intersection over union.
where are true negative, and false negatives, true positive, false positive, respectively, and k is the number of categories.
4. Results
4.1. Ablation Study
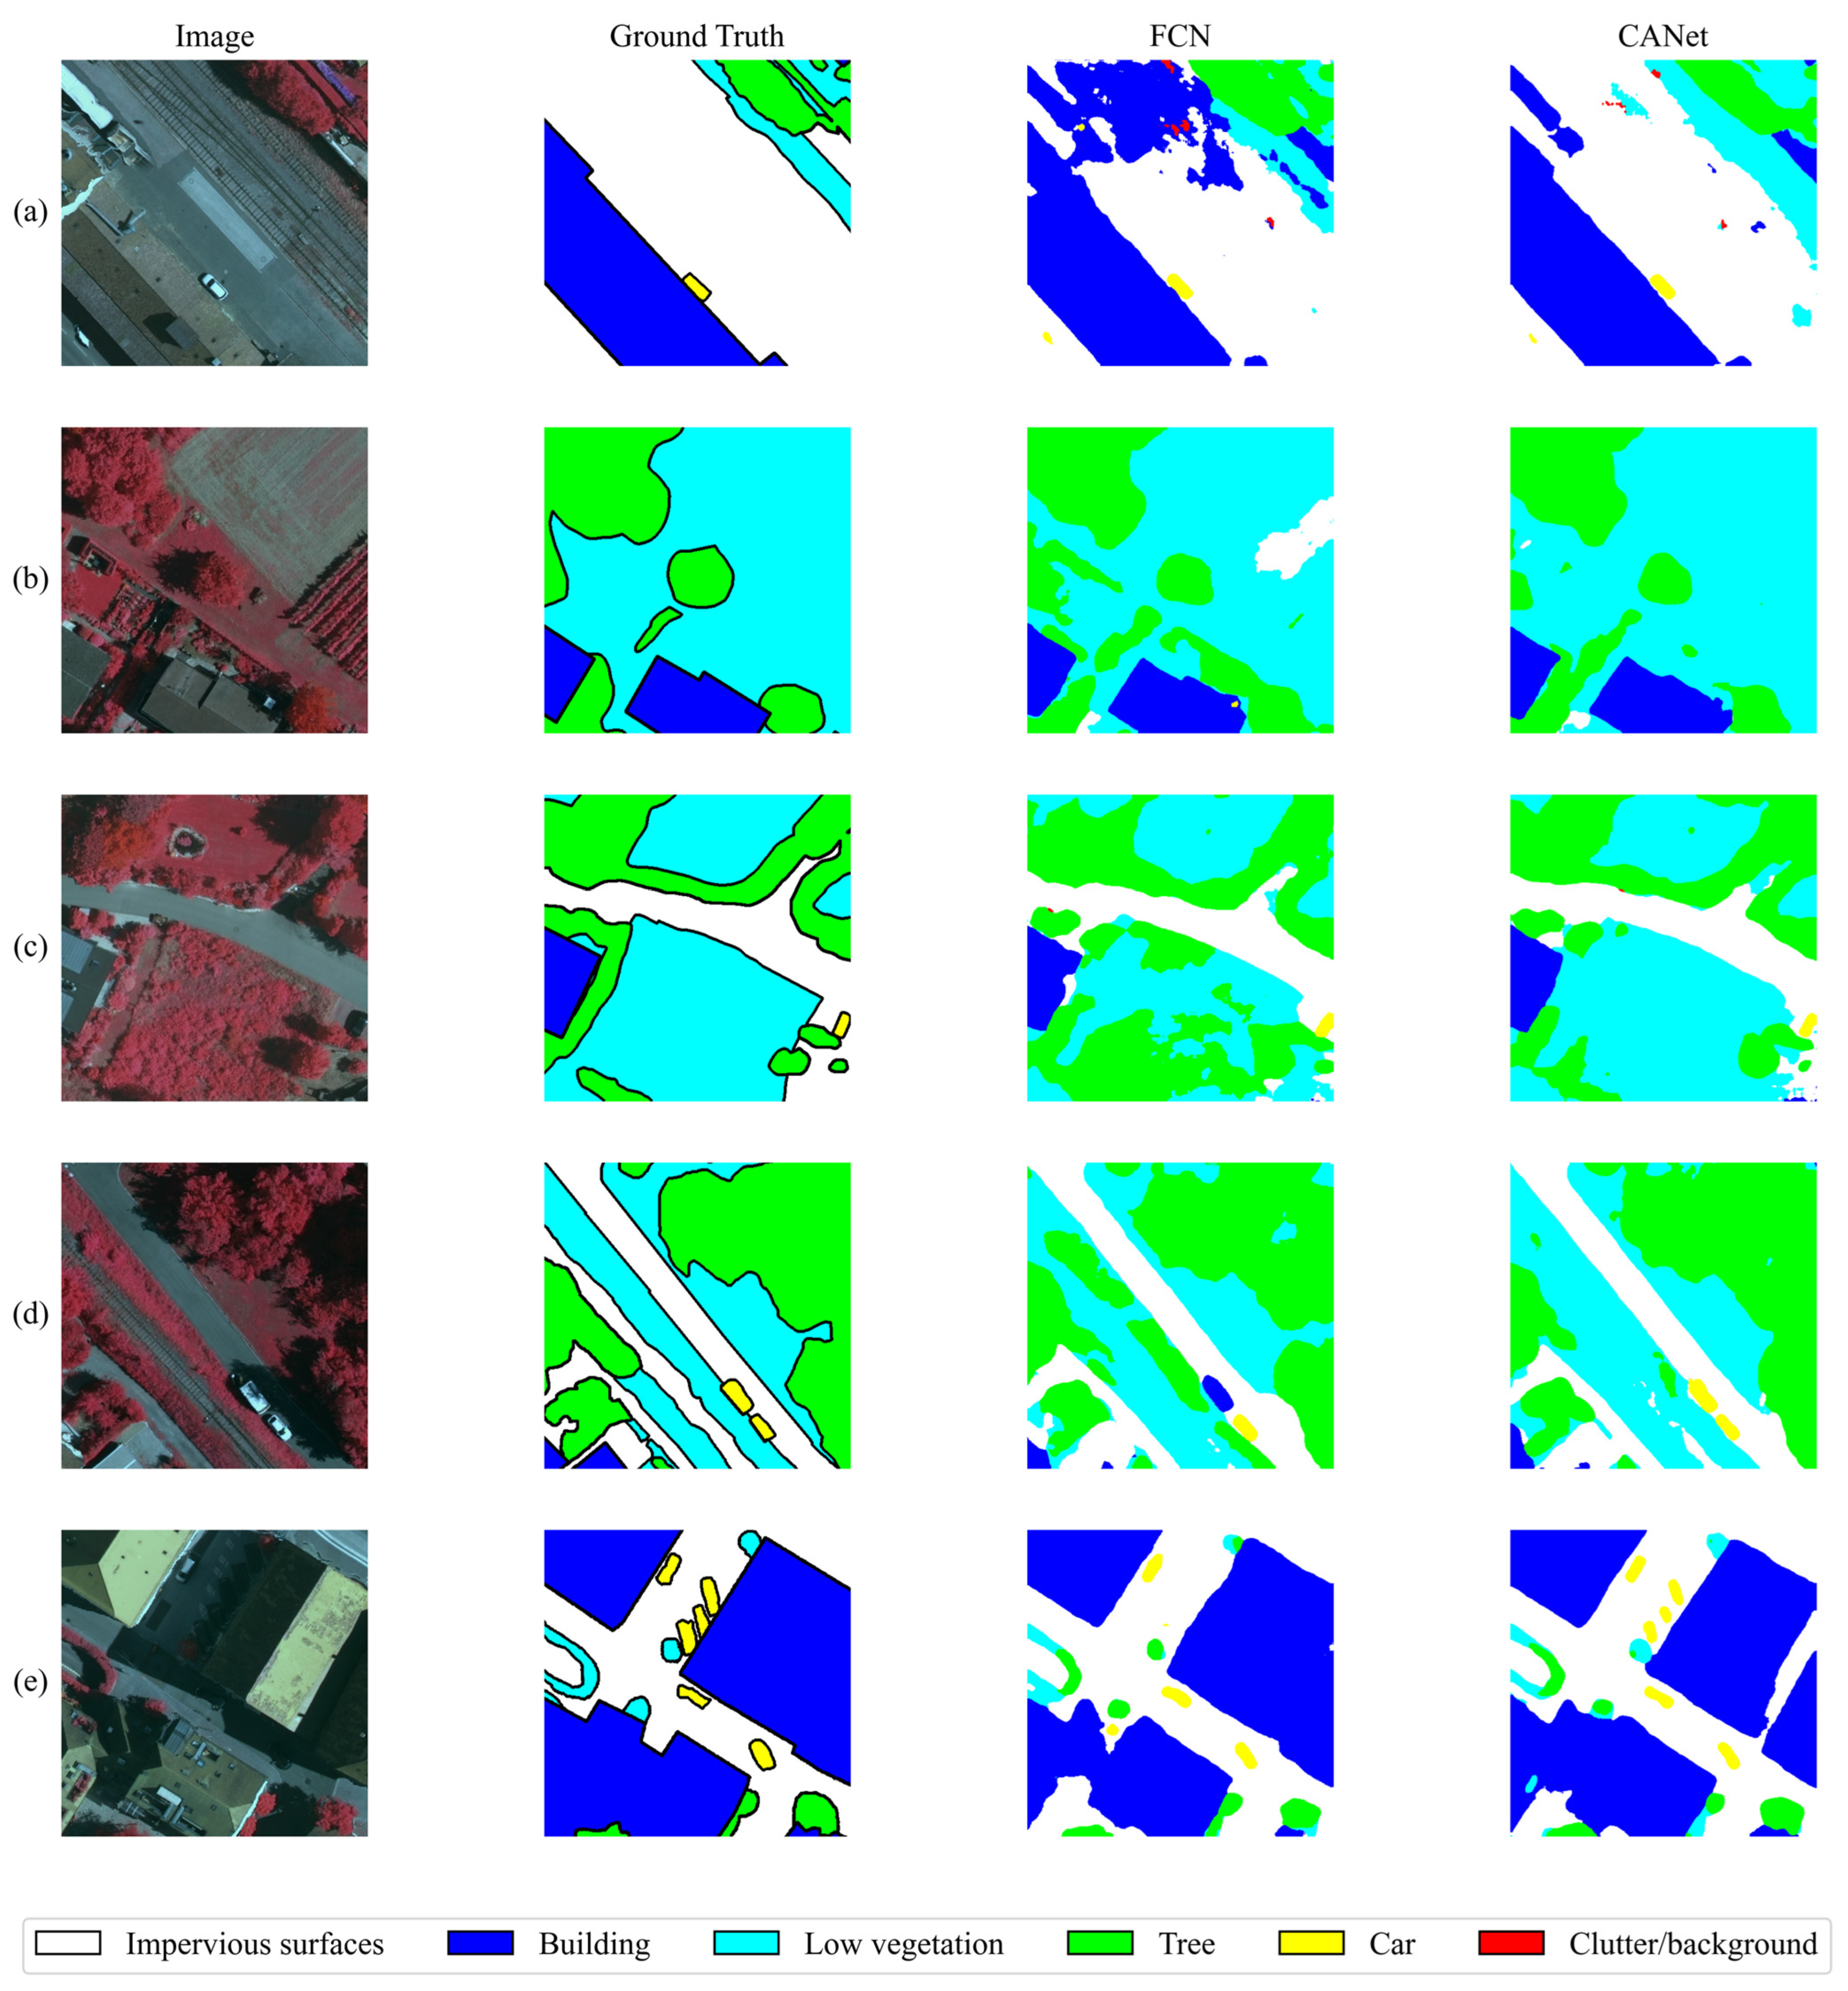
To evaluate the performance of the constructed CANet as well as the attention modules CMA and CSA, we performed an ablation study on the Vaihingen dataset. The training baseline for the study was an FCN [24] model with ResNet50 as the encoder. Table 1 demonstrates the comparison of the results of the ablation experiment executed on the Vaihingen dataset.
Compared to FCN, Mean F1 improved by 1.87%, OA by 1.8% and mIoU by 2.99% with the addition of merely one CSA module. As can be shown from Table 1, CMA2 achieves better results with the application of barely a single CMA module. Among them, and are more inclined to contain spatial detail features, while the semantic information in and is richer, and the gap between the representational information of high-level features and low-level features is not large. Therefore, the effect of CMA on feature aggregation is not obvious. On the one hand, the comparison results of Figure 6a–c indicate that CANet can better segment the targets in the large-impervious surfaces and low vegetation categories. Meanwhile, for the low vegetation and tree categories with similar spectral characteristics, CANet can accurately distinguish them by aggregating the global information and capturing the small semantic feature variances between them. On the other hand, as illustrated in Figure 6d–e, CANet is very capable of identifying fine targets (e.g., cars) compared to FCN. In addition, CANet enhances 3.43%, 3.33% and 5.44% over FCN in Mean F1, OA and mIoU accuracy metrics, respectively. These results indicate that CANet achieves the bridging of the gap between high-level and low-level feature information characterization capabilities and physical content through the CMA and CSA modules, maintaining the ability to aggregate global contextual content while achieving high-precision extraction of tiny targets.
4.2. Quantitative Comparison of Various Modules
The communicating attention modules CMA and CSA narrow the gap between high-level features and low-level features by computing the attention map and embedding geometric detail features into high-level features to enable low-level features to aggregate semantic information. In other words, the CMA and CSA modules achieve multi-scale feature fusion through the attention mechanism. Therefore, we compare the mainstream attention mechanism modules (e.g., SE [32] and CBAM [33]) and multiscale feature fusion methods (e.g., PPM [40] and ASPP [27]) with the PAM and AEM modules proposed in LANet [18] in our experiments. The study results are illustrated by Table 2, where a single utilization of attention or multiscale feature fusion modules achieves only a limited improvement in accuracy compared to FCN [24]. It is worth noting that although the PAM and AEM module enables the semantic features of high-level features to be embedded in low-level features through the attention module, it does not fuse the spatial tiny information of low-level features into high-level features. Hence, both our proposed CMA and CSA modules attain better results than other attentional mechanisms and multi-scale feature fusion modules on both Vaihingen and Potsdam datasets.
4.3. Quantitative Comparison of Various Models
For a more impartial test of the model’s performance, we quantitatively compared CANet with the current dominant semantic segmentation models. Both PSPNet [40] and DeepLabV3+ [27] models include a feature pyramid module to extract multi-scale features. MACUNet [47] and LANet [18] utilize a channel attention module to perform multi-scale feature interaction and fusion. The comparison results on the Vaihingen and Potsdam datasets can be seen in Table 3 and Table 4. Compared to FCN [24], both PSPNet and DeepLabV3+ have improved F1-scores, but the acquisition of exhaustive information by enhancing the receptive field leads to a reduction in segmentation accuracy for small target objects (e.g., cars). MACUNet and LANet utilize only channel attention, which leads to a degradation in their ability to capture global semantic information. CANet maintains global contextual features while enhancing the geometric detail characterization capability, making it optimal on all three evaluation metrics (i.e., F1-score, OA, mIoU) for both datasets. It is worth noting that CANet improves the F1-score accuracy by 9.11% over the DeepLabV3+ in the car category on the Vaihingen dataset, which illustrates the strong segmentation capability of the proposed model for tiny objects.
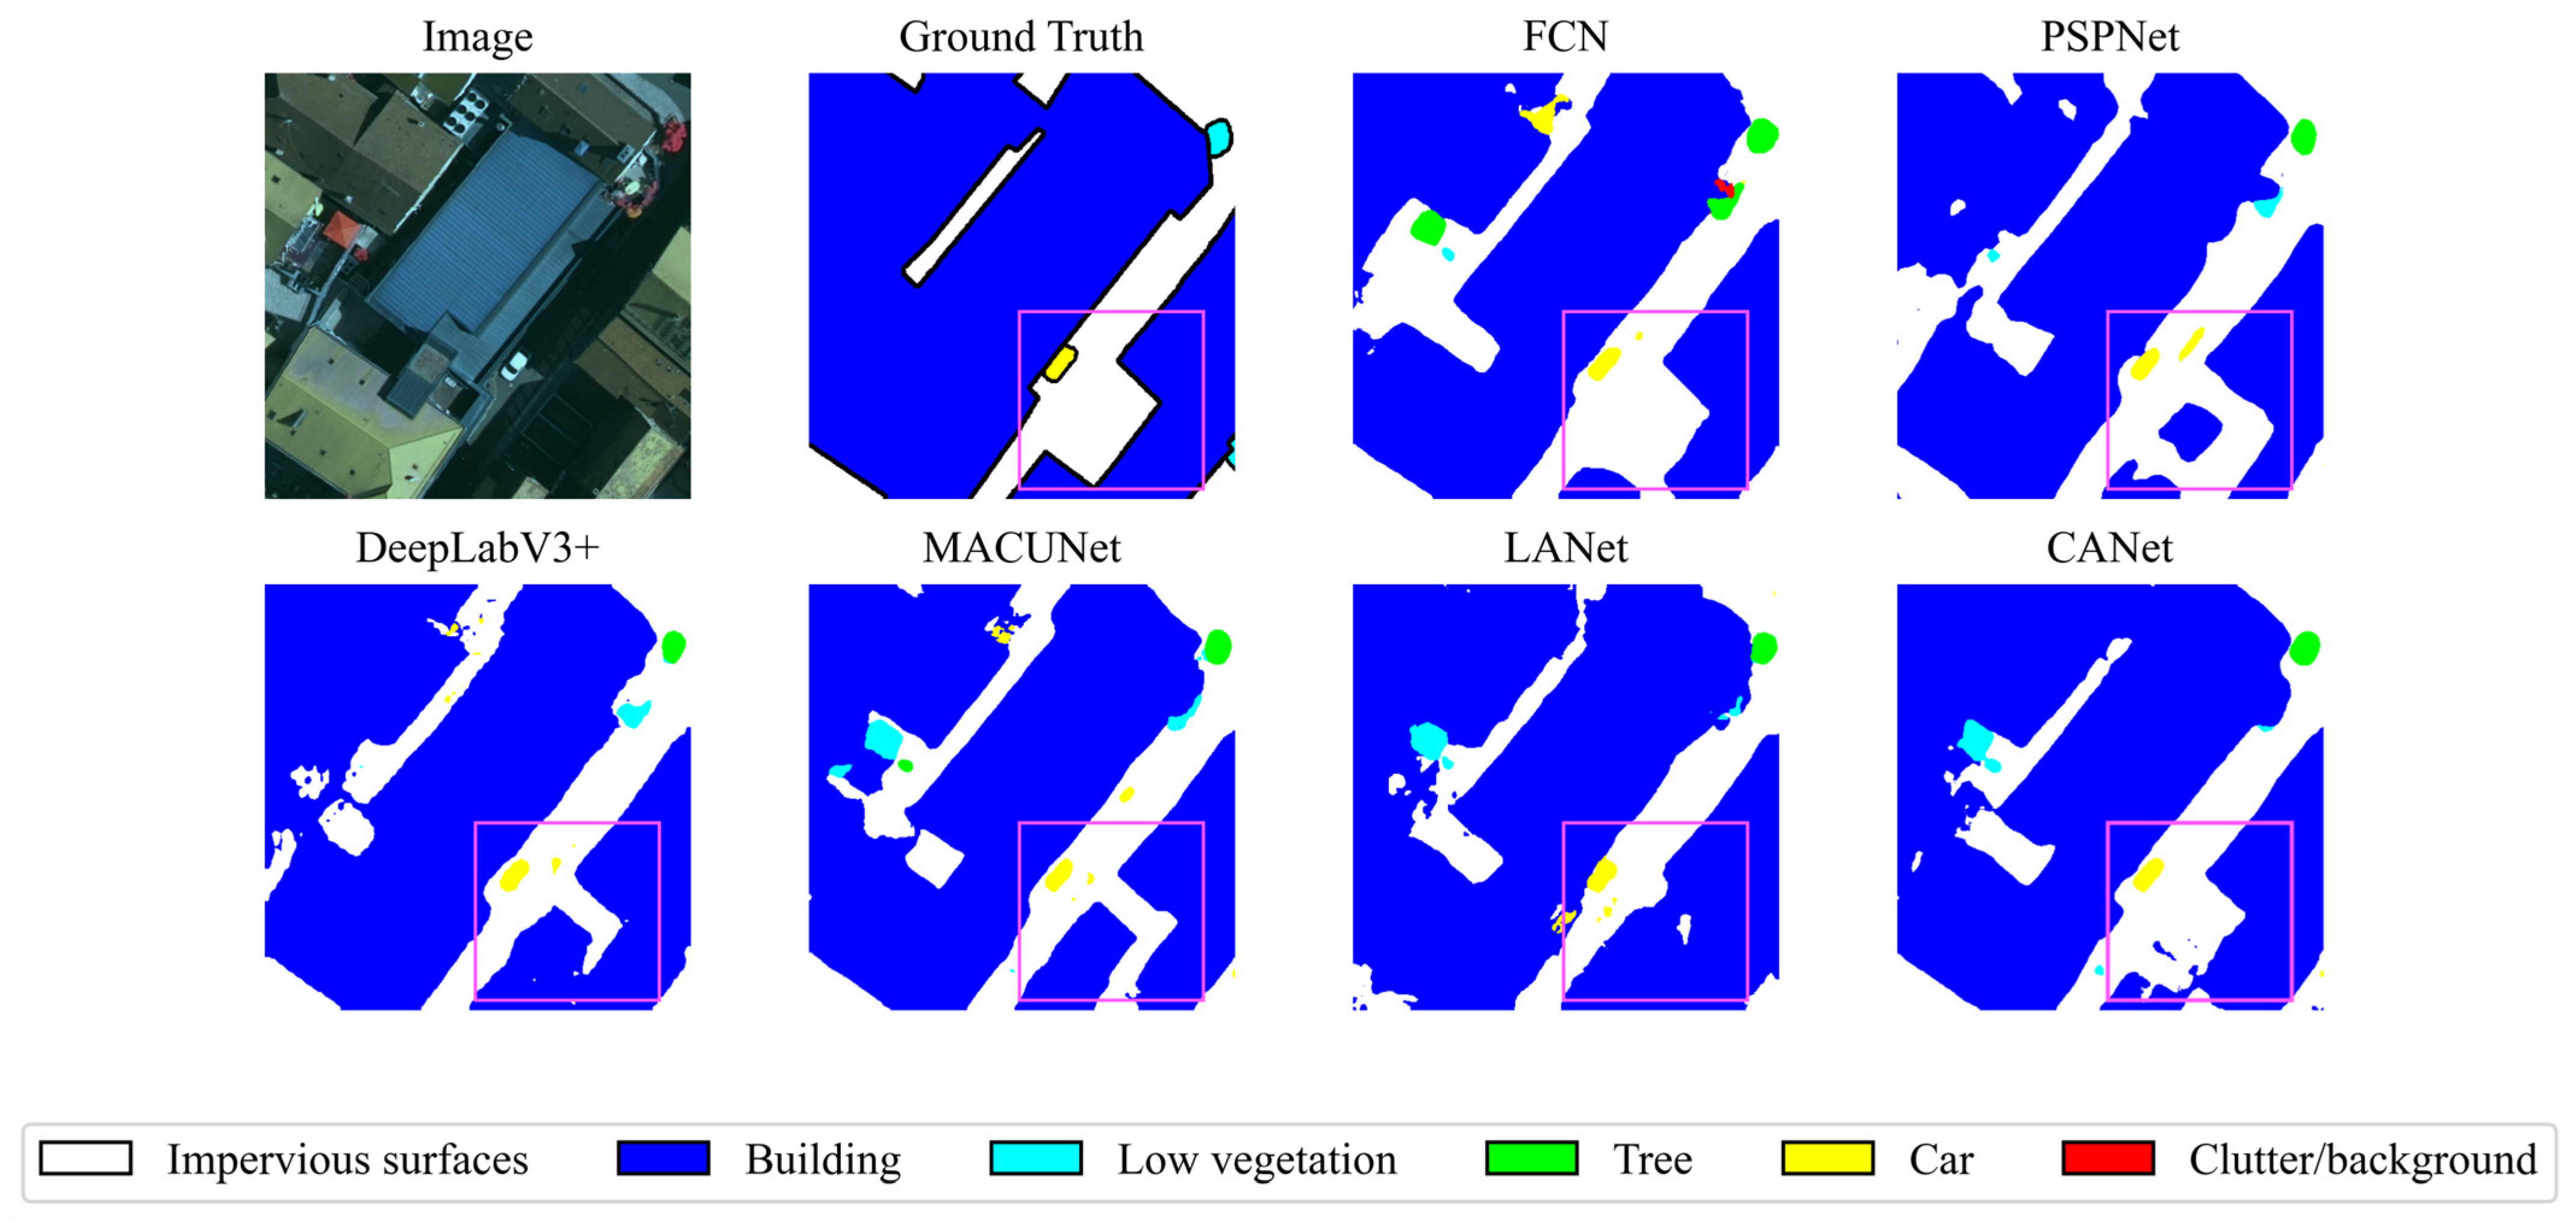
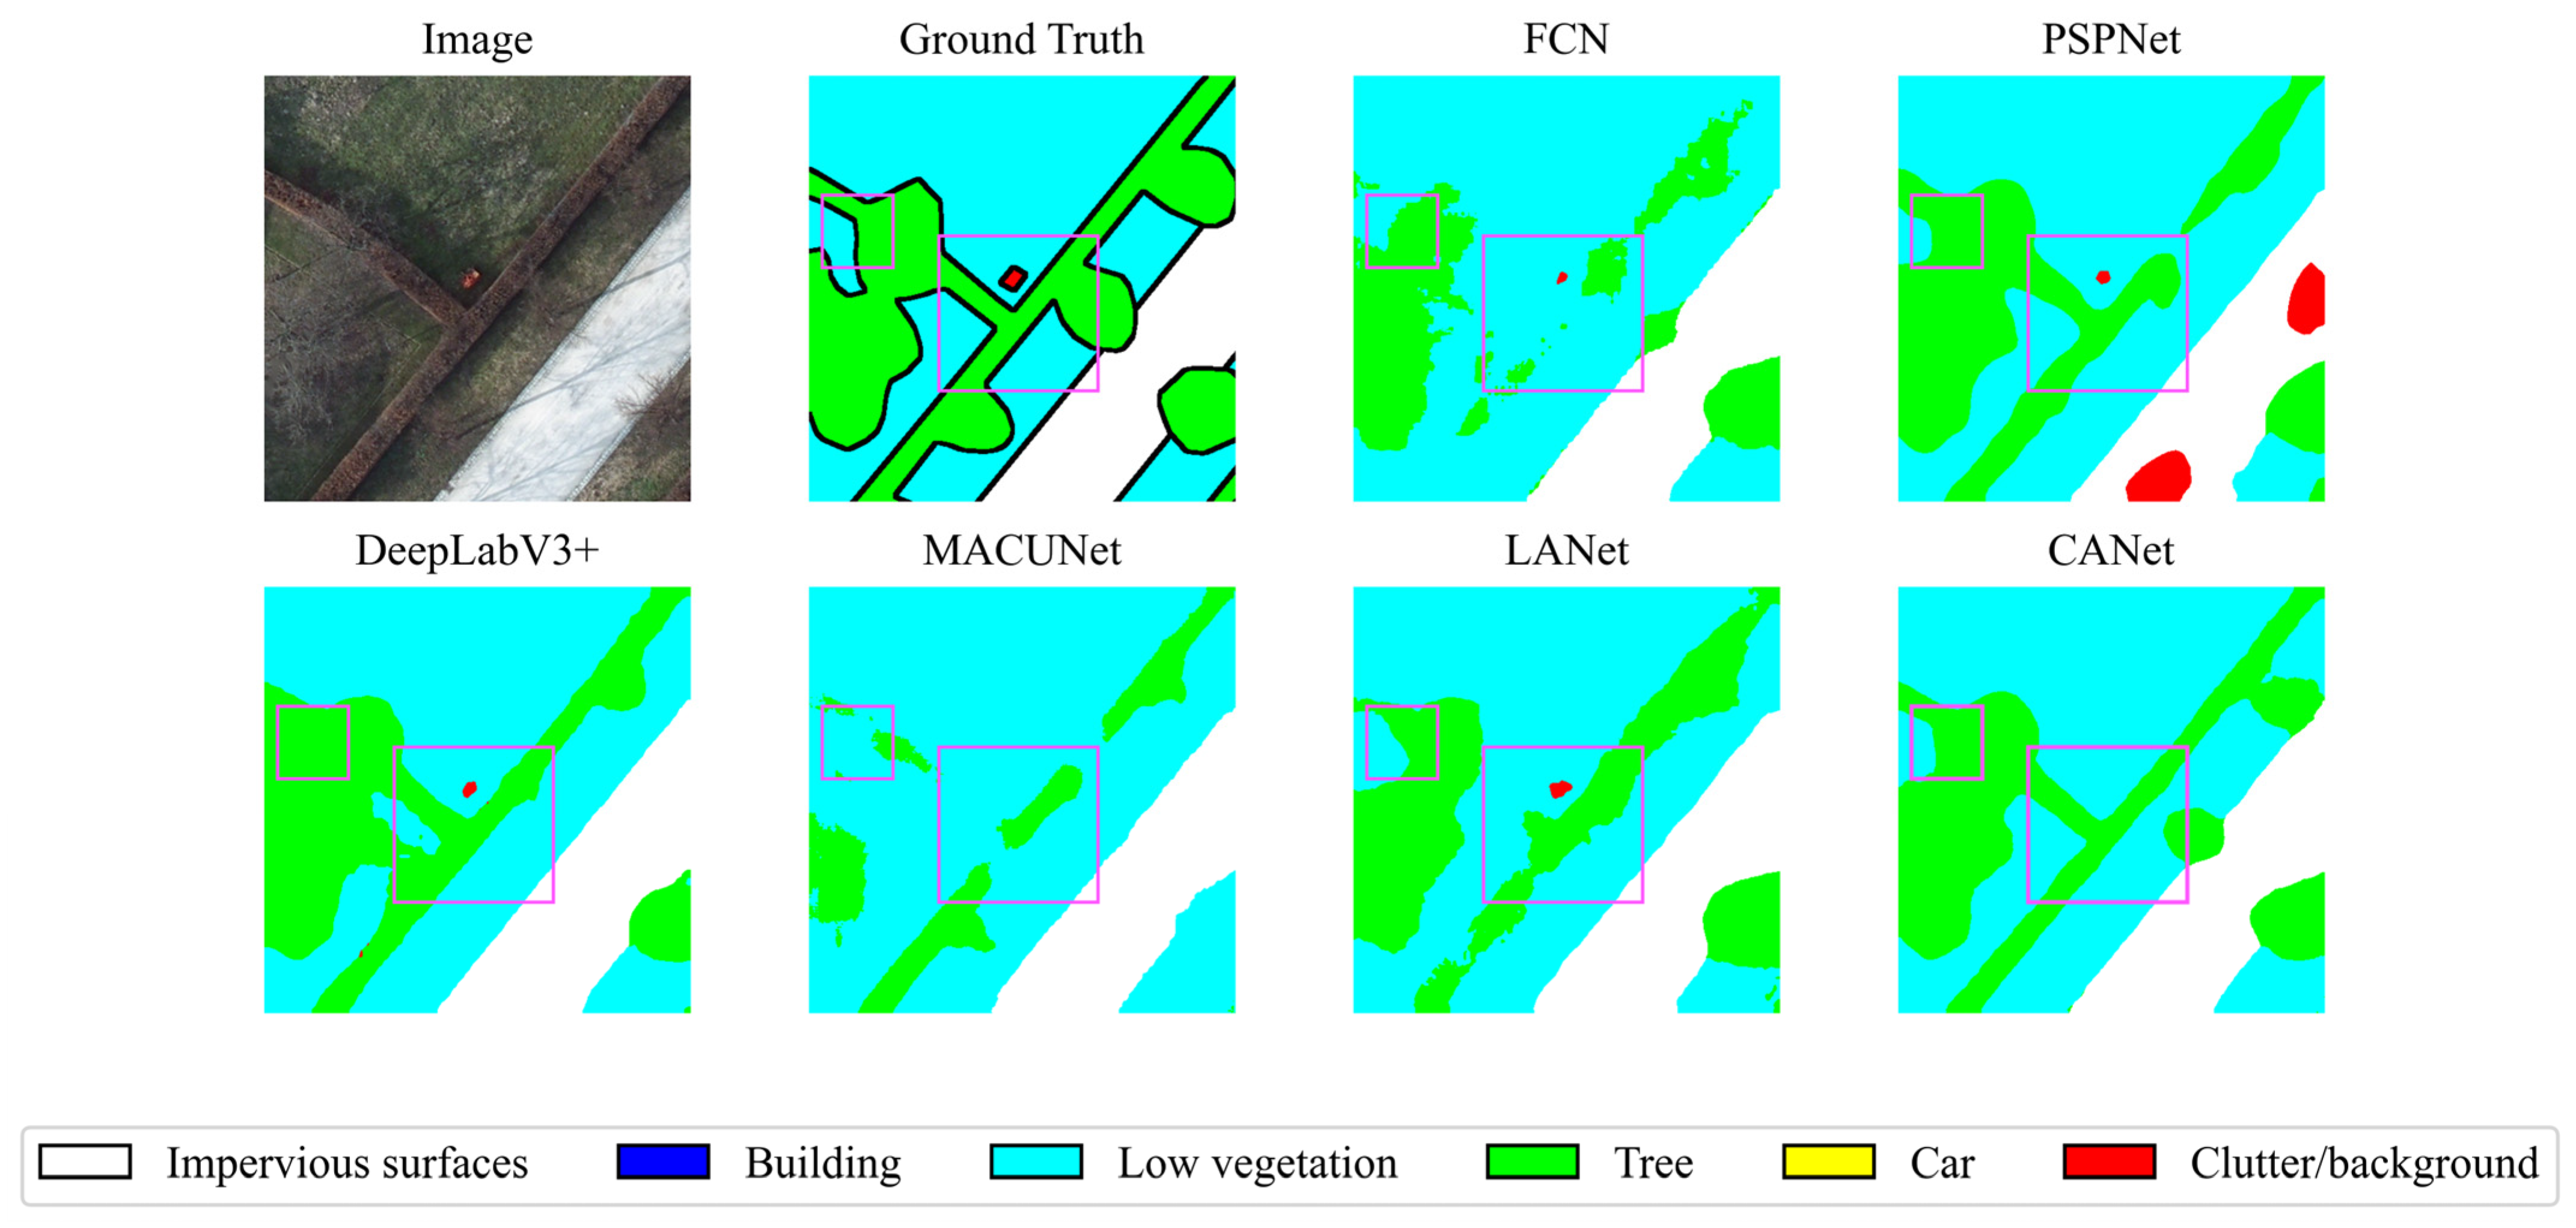
For the purpose of comparing the performance of each model more intuitively, we visualized their prediction results, in which the contrasting areas are highlighted with pink boxes. Figure 7. demonstrates the results for local areas in the Vaihingen dataset. Despite the successful segmentation of cars by each model, there is confusion between the impervious surfaces category and the car category for all models except CANet. In addition, CANet outperforms the other models in distinguishing between buildings and impervious surfaces. The local areas of the Potsdam dataset illustrated in Figure 8 are mainly low vegetation and tree categories, with very similar spectral characteristics. PSPNet and DeepLabV3+ enhance the representation of contextual information by increasing the receptive field and achieve better results, but the classification results are inferior for the more mixed location of low vegetation and tree. CANet maintains a balance between global contextual features and local geometric characterization ability and has better performance in classifying confusable categories with interleaved distribution.
5. Discussion
5.1. Interaction of High-Level and Low-Level Features
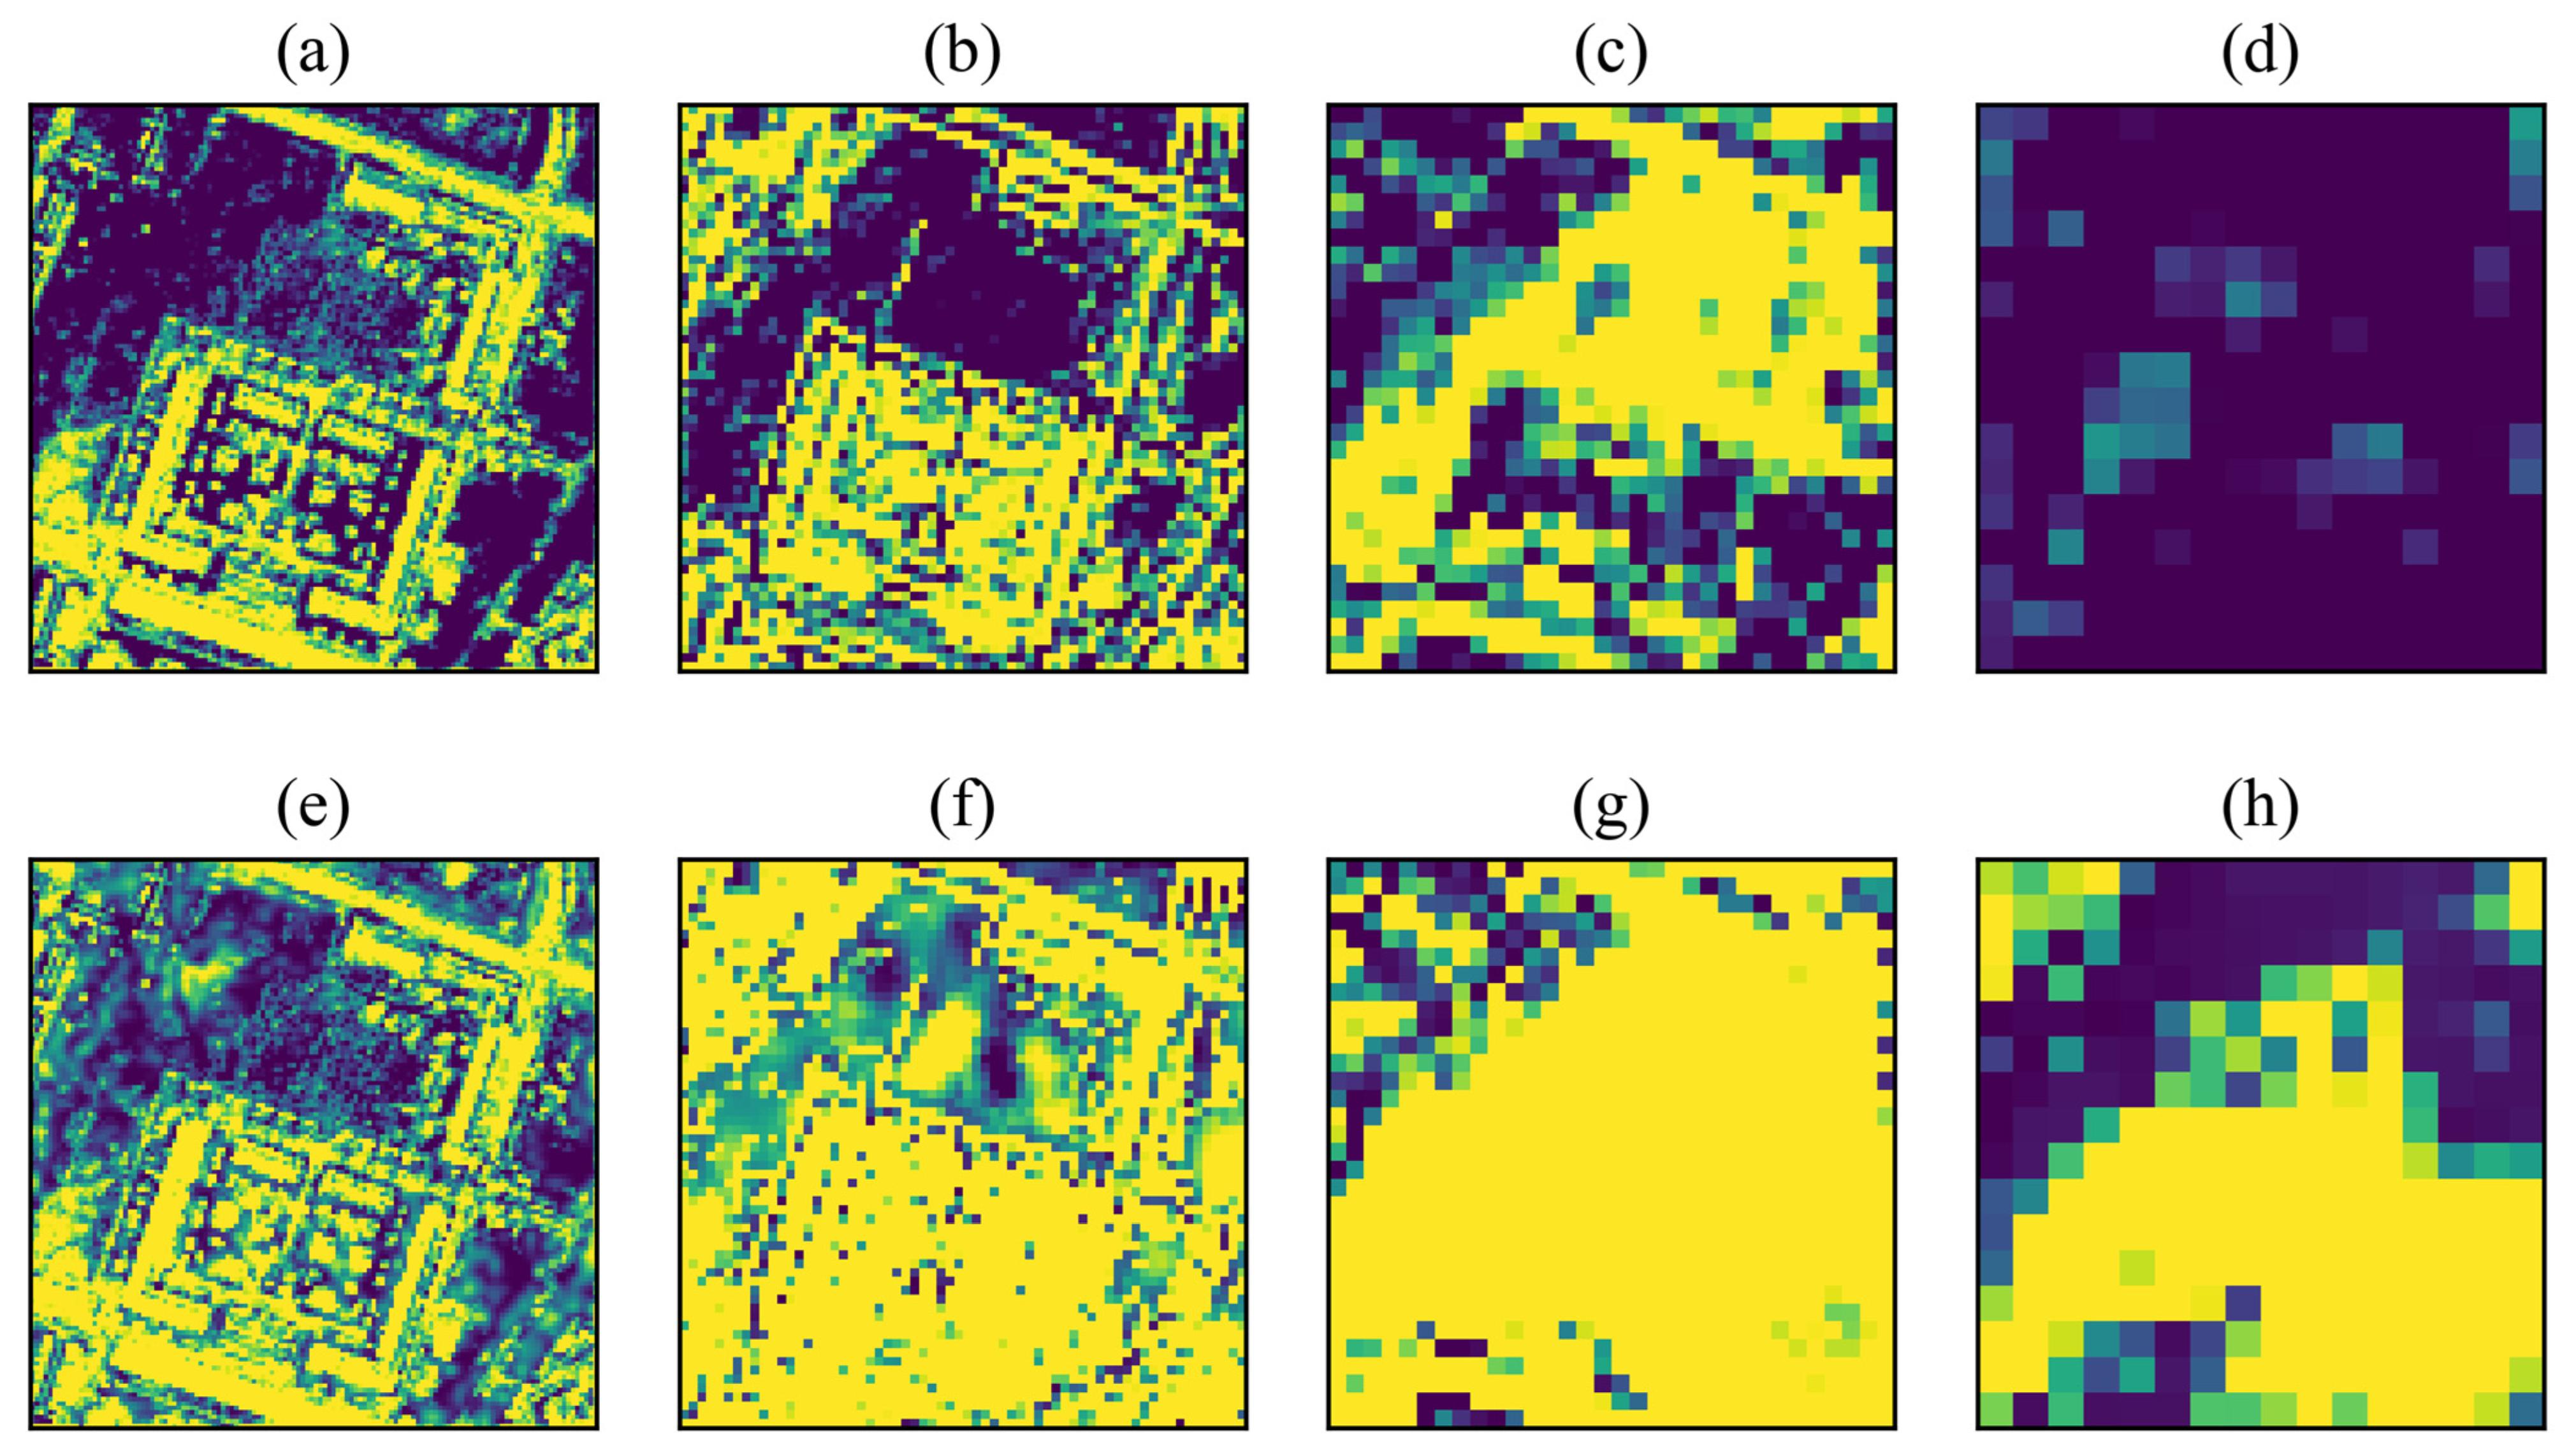
In order to be capable of clearly illustrating the changes in the feature maps before and after the deployment of CMA and CSA, we visualized them. As demonstrated in Figure 9, before the utilization of CMA and CSA, the high-level features captured rich semantic information and the low-level features were more powerful in maintaining spatial details. However, there is a notable gap between the high-level features and the low-level features. Therefore, we implemented the interaction between high-level features and low-level features by reassigning and aggregating different features using CMA and CSA modules. By using this method, we can see that the gap between features of neighboring levels is reduced. Meanwhile, after involving the low-level features in the generation of the attention map of the high-level features through the CSA module, the high-level features are embedded with spatially detailed information while maintaining the global contextual contents. It is worth noting that after inserting the CMA and CSA modules into the model, we achieved a model that does not lose global semantic features but enhances the geometric representation of the feature maps.
5.2. Number of High-Level and Low-Level Feature Cycles
As seen in Figure 2 (In Section 3.2), the high-level feature flow and the low-level feature flow in the CMA module are combined into one loop. In all the above experiments, when the high-level features and the low-level features pass through the CMA module, they do feature interaction merely once. Therefore, to explore the effect of the frequency of feature interactions on the semantic segmentation accuracy, we conducted experiments on the Vaihingen dataset with the number of exchanges set to two and three, respectively. As presented in Table 5, the OA, Mean F1 and mIoU precision metrics exhibit a decreasing trend as the number of interactions increases. On the one hand, the spatial details in the low-level features become ambiguous when the number of high-level and low-level feature interactions increases. On the other hand, the high-level features induce the noise of the low-level features, leading to the integrity of the contextual information being destroyed. Consequently, the best segmentation capability model can be attained only by setting a reasonable number of feature interactions.
5.3. Computational Complexity of the Algorithm
The time and space complexity of the model is crucial for the large-scale application and deployment of the algorithm. Therefore, it is necessary to analyze the computational complexity of the algorithm. The module that occupies the main computational time and memory in the CMA and CSA modules is the self-attention module, where the time complexity of computing the matrix product operation of and is , the time complexity of computing is , and the time complexity of computing the matrix product operation of and is . Therefore, the time complexity of the self-attention mechanism module is . In addition, the space complexity of the self-attention mechanism module is .
6. Conclusions
Features at different levels have different data distributions and information contents. Therefore, the integration and aggregation of multi-scale features is essential to achieve accurate semantic segmentation. We propose a novel attention module and CNN-based neural network (CANet) for semantic segmentation of high-resolution remote sensing images of urban areas. To reduce the difference in feature characterization ability between high-level features and low-level features, we designed the CMA and CSA modules to enable the interaction of different levels of feature maps. We employed CMA to aggregate the spatially detailed information of low-level features into high-level features and embed the global semantic information of high-level features into low-level features. To maintain the balance between global contextual information and spatial characteristics, we utilized the CSA module to introduce the geometric features of the low-level features into the attention map computation of the high-level features. The model was tested in a series of ablation and comparison studies on the ISPRS Vaihingen and Potsdam datasets. The results (i.e., 89.61% and 92.60% mean F1-score) demonstrate the effectiveness of the method in the semantic segmentation task of high-resolution remote sensing images in urban areas. However, the temporal and spatial complexity of our model is high, which is challenging for large-scale deployment.
In the future, the work will inspire research on the fusion and interaction of features at different levels. Meanwhile, we will improve the model algorithm to reduce the computational complexity and we will continue to explore the relationship between multi-scale features and methods to aggregate global contextual information which further enhances the capability of the model.
Author Contributions
Conceptualization, Y.H.; Methodology, X.M. and L.Z.; Software, X.M.; Validation, L.Z.; Formal Analysis, H.Z.; Investigation, X.M. and L.Z.; Resources, H.Z.; Data Curation, X.M.; Writing—Original Draft Preparation, X.M. and L.Z.; Writing—Review and Editing, H.Z.; Visualization, L.Z.; Supervision, H.Z. and Y.H.; Project Administration, H.Z. and Y.H.; Funding Acquisition, H.Z. and Y.H. All authors have read and agreed to the published version of the manuscript.
Funding
This work was supported by the Natural Science Foundation of Shandong Province (grant number ZR2022QD141); National Natural Science Foundation of China (grant number 42271273); National Natural Science Foundation of China (grant number 42201440); The Fundamental Research Funds for Chinese Academy of Surveying and Mapping (grant number AR2201); The China Post doctoral Science Foundation (grant number 2022M712936); and National Natural Science Foundation of China (grant number 42201278).
Data Availability Statement
Thanks to ISPRS for the training and testing datasets for remote sensing image semantic segmentation tasks, which can be found at the following URLs. Vaihingen: https://www2.isprs.org/commissions/comm2/wg4/benchmark/2d-sem-label-vaihingen/, accessed on 20 October 2020; Potsdam: https://www2.isprs.org/commissions/comm2/wg4/benchmark/2d-semlabel-potsdam/, accessed on 20 October 2020.
Acknowledgments
The authors would appreciate GPU support from the Chinese Academy of Surveying and Mapping.
Conflicts of Interest
The authors declare no conflict of interest.
References
- Yuan, X.; Shi, J.; Gu, L. A review of deep learning methods for semantic segmentation of remote sensing imagery. Expert Syst. Appl. 2021, 169, 114417. [Google Scholar] [CrossRef]
- Kemker, R.; Salvaggio, C.; Kanan, C. Algorithms for semantic segmentation of multispectral remote sensing imagery using deep learning. ISPRS J. Photogramm. Remote Sens. 2018, 145, 60–77. [Google Scholar] [CrossRef] [Green Version]
- Diakogiannis, F.I.; Waldner, F.; Caccetta, P.; Wu, C. ResUNet-a: A deep learning framework for semantic segmentation of remotely sensed data. ISPRS J. Photogramm. Remote Sens. 2020, 162, 94–114. [Google Scholar] [CrossRef] [Green Version]
- Wang, S.; Chen, W.; Xie, S.M.; Azzari, G.; Lobell, D.B. Weakly supervised deep learning for segmentation of remote sensing imagery. Remote Sens. 2020, 12, 207. [Google Scholar] [CrossRef] [Green Version]
- Shafique, A.; Cao, G.; Khan, Z.; Asad, M.; Aslam, M. Deep learning-based change detection in remote sensing images: A review. Remote Sens. 2022, 14, 871. [Google Scholar] [CrossRef]
- Chen, H.; Shi, Z. A spatial-temporal attention-based method and a new dataset for remote sensing image change detection. Remote Sens. 2020, 12, 1662. [Google Scholar] [CrossRef]
- Deng, Z.; Sun, H.; Zhou, S.; Zhao, J.; Lei, L.; Zou, H. Multi-scale object detection in remote sensing imagery with convolutional neural networks. ISPRS J. Photogramm. Remote Sens. 2018, 145, 3–22. [Google Scholar] [CrossRef]
- Carvalho, O.L.F.D.; de Carvalho Júnior, O.A.; Albuquerque, A.O.D.; Bem, P.P.D.; Silva, C.R.; Ferreira, P.H.G.; Moura, R.D.S.D.; Gomes, R.A.T.; Guimaraes, R.F.; Borges, D.L. Instance segmentation for large, multi-channel remote sensing imagery using mask-RCNN and a mosaicking approach. Remote Sens. 2020, 13, 39. [Google Scholar] [CrossRef]
- Chen, M.; Wu, J.; Liu, L.; Zhao, W.; Tian, F.; Shen, Q.; Zhao, B.; Du, R. DR-Net: An improved network for building extraction from high resolution remote sensing image. Remote Sens. 2021, 13, 294. [Google Scholar] [CrossRef]
- Maggiori, E.; Tarabalka, Y.; Charpiat, G.; Alliez, P. Convolutional neural networks for large-scale remote-sensing image classification. IEEE Trans. Geosci. Remote Sens. 2016, 55, 645–657. [Google Scholar] [CrossRef] [Green Version]
- Ali, M.; Clausi, D. Using the Canny edge detector for feature extraction and enhancement of remote sensing images. In Proceedings of the IGARSS 2001. Scanning the Present and Resolving the Future. Proceedings. IEEE 2001 International Geoscience and Remote Sensing Symposium (Cat. No. 01CH37217), Sydney, NSW, Australia, 9–13 July 2001; pp. 2298–2300. [Google Scholar]
- Wang, Z.; Jensen, J.R.; Im, J. An automatic region-based image segmentation algorithm for remote sensing applications. Environ. Model. Softw. 2010, 25, 1149–1165. [Google Scholar] [CrossRef]
- Goodfellow, I.; Bengio, Y.; Courville, A. Deep Learning; MIT Press: Cambridge, MA, USA, 2016. [Google Scholar]
- Kattenborn, T.; Leitloff, J.; Schiefer, F.; Hinz, S. Review on Convolutional Neural Networks (CNN) in vegetation remote sensing. ISPRS J. Photogramm. Remote Sens. 2021, 173, 24–49. [Google Scholar] [CrossRef]
- Alam, M.; Wang, J.-F.; Guangpei, C.; Yunrong, L.; Chen, Y. Convolutional neural network for the semantic segmentation of remote sensing images. Mob. Netw. Appl. 2021, 26, 200–215. [Google Scholar] [CrossRef]
- He, K.; Zhang, X.; Ren, S.; Sun, J. Deep residual learning for image recognition. In Proceedings of the IEEE Conference on Computer Vision and Pattern Recognition, Las Vegas, NV, USA, 27–30 June 2016; pp. 770–778. [Google Scholar]
- Ghassemian, H. A review of remote sensing image fusion methods. Inf. Fusion 2016, 32, 75–89. [Google Scholar] [CrossRef]
- Ding, L.; Tang, H.; Bruzzone, L. LANet: Local attention embedding to improve the semantic segmentation of remote sensing images. IEEE Trans. Geosci. Remote Sens. 2020, 59, 426–435. [Google Scholar] [CrossRef]
- Yang, M.Y.; Kumaar, S.; Lyu, Y.; Nex, F. Real-time semantic segmentation with context aggregation network. ISPRS J. Photogramm. Remote Sens. 2021, 178, 124–134. [Google Scholar] [CrossRef]
- Li, R.; Zheng, S.; Zhang, C.; Duan, C.; Wang, L.; Atkinson, P.M. ABCNet: Attentive bilateral contextual network for efficient semantic segmentation of Fine-Resolution remotely sensed imagery. ISPRS J. Photogramm. Remote Sens. 2021, 181, 84–98. [Google Scholar] [CrossRef]
- Ju, J.; Gopal, S.; Kolaczyk, E.D. On the choice of spatial and categorical scale in remote sensing land cover classification. Remote Sens. Environ. 2005, 96, 62–77. [Google Scholar] [CrossRef]
- Pham, H.M.; Yamaguchi, Y.; Bui, T.Q. A case study on the relation between city planning and urban growth using remote sensing and spatial metrics. Landsc. Urban Plan. 2011, 100, 223–230. [Google Scholar] [CrossRef]
- Li, J.; Pei, Y.; Zhao, S.; Xiao, R.; Sang, X.; Zhang, C. A review of remote sensing for environmental monitoring in China. Remote Sens. 2020, 12, 1130. [Google Scholar] [CrossRef] [Green Version]
- Long, J.; Shelhamer, E.; Darrell, T. Fully convolutional networks for semantic segmentation. In Proceedings of the IEEE Conference on Computer Vision and Pattern Recognition, Boston, MA, USA, 7–12 June 2015; pp. 3431–3440. [Google Scholar]
- Badrinarayanan, V.; Kendall, A.; Cipolla, R. Segnet: A deep convolutional encoder-decoder architecture for image segmentation. IEEE Trans. Pattern Anal. Mach. Intell. 2017, 39, 2481–2495. [Google Scholar] [CrossRef]
- Ronneberger, O.; Fischer, P.; Brox, T. U-net: Convolutional networks for biomedical image segmentation. In Proceedings of the Medical Image Computing and Computer-Assisted Intervention–MICCAI 2015: 18th International Conference, Munich, Germany, 5–9 October 2015; Proceedings, Part III 18. pp. 234–241. [Google Scholar]
- Chen, L.-C.; Zhu, Y.; Papandreou, G.; Schroff, F.; Adam, H. Encoder-decoder with atrous separable convolution for semantic image segmentation. In Proceedings of the European Conference on Computer Vision (ECCV), Munich, Germany, 8–14 September 2018; pp. 801–818. [Google Scholar]
- Wang, J.; Sun, K.; Cheng, T.; Jiang, B.; Deng, C.; Zhao, Y.; Liu, D.; Mu, Y.; Tan, M.; Wang, X. Deep high-resolution representation learning for visual recognition. IEEE Trans. Pattern Anal. Mach. Intell. 2020, 43, 3349–3364. [Google Scholar] [CrossRef] [PubMed] [Green Version]
- Fu, J.; Liu, J.; Tian, H.; Li, Y.; Bao, Y.; Fang, Z.; Lu, H. Dual attention network for scene segmentation. In Proceedings of the IEEE/CVF Conference on Computer Vision and Pattern Recognition, Long Beach, CA, USA, 15–20 June 2019; pp. 3146–3154. [Google Scholar]
- Lv, Z.; Zhang, P.; Sun, W.; Benediktsson, J.A.; Li, J.; Wang, W. Novel Adaptive Region Spectral-Spatial Features for Land Cover Classification with High Spatial Resolution Remotely Sensed Imagery. IEEE Trans. Geosci. Remote Sens. 2023, 61, 5609412. [Google Scholar] [CrossRef]
- Jaderberg, M.; Simonyan, K.; Zisserman, A. Spatial transformer networks. In Advances in Neural Information Processing Systems; Curran Associates, Inc.: Red Hook, NY, USA, 2015; Volume 28. [Google Scholar]
- Hu, J.; Shen, L.; Sun, G. Squeeze-and-excitation networks. In Proceedings of the IEEE Conference on Computer Vision and Pattern Recognition, Salt Lake City, UT, USA, 18–23 June 2018; pp. 7132–7141. [Google Scholar]
- Woo, S.; Park, J.; Lee, J.-Y.; Kweon, I.S. Cbam: Convolutional block attention module. In Proceedings of the European Conference on Computer Vision (ECCV), Munich, Germany, 8–14 September 2018; pp. 3–19. [Google Scholar]
- Wang, Q.; Wu, B.; Zhu, P.; Li, P.; Zuo, W.; Hu, Q. ECA-Net: Efficient channel attention for deep convolutional neural networks. In Proceedings of the IEEE/CVF Conference on Computer Vision and Pattern Recognition, Seattle, WA, USA, 13–19 June 2020; pp. 11534–11542. [Google Scholar]
- Li, X.; Wang, W.; Hu, X.; Yang, J. Selective kernel networks. In Proceedings of the IEEE/CVF Conference on Computer Vision and Pattern Recognition, Long Beach, CA, USA, 15–20 June 2019; pp. 510–519. [Google Scholar]
- Li, R.; Zheng, S.; Zhang, C.; Duan, C.; Su, J.; Wang, L.; Atkinson, P.M. Multiattention network for semantic segmentation of fine-resolution remote sensing images. IEEE Trans. Geosci. Remote Sens. 2021, 60, 1–13. [Google Scholar] [CrossRef]
- Wang, L.; Li, R.; Zhang, C.; Fang, S.; Duan, C.; Meng, X.; Atkinson, P.M. UNetFormer: A UNet-like transformer for efficient semantic segmentation of remote sensing urban scene imagery. ISPRS J. Photogramm. Remote Sens. 2022, 190, 196–214. [Google Scholar] [CrossRef]
- Li, X.; Lei, L.; Sun, Y.; Li, M.; Kuang, G. Collaborative attention-based heterogeneous gated fusion network for land cover classification. IEEE Trans. Geosci. Remote Sens. 2020, 59, 3829–3845. [Google Scholar] [CrossRef]
- Lin, T.-Y.; Dollár, P.; Girshick, R.; He, K.; Hariharan, B.; Belongie, S. Feature pyramid networks for object detection. In Proceedings of the IEEE Conference on Computer Vision and Pattern Recognition, Honolulu, HI, USA, 21–26 July 2017; pp. 2117–2125. [Google Scholar]
- Zhao, H.; Shi, J.; Qi, X.; Wang, X.; Jia, J. Pyramid scene parsing network. In Proceedings of the IEEE Conference on Computer Vision and Pattern Recognition, Honolulu, HI, USA, 21–26 July 2017; pp. 2881–2890. [Google Scholar]
- Chen, L.-C.; Papandreou, G.; Schroff, F.; Adam, H. Rethinking atrous convolution for semantic image segmentation. arXiv 2017, arXiv:1706.05587. [Google Scholar]
- Zhang, T.; Qi, G.-J.; Xiao, B.; Wang, J. Interleaved group convolutions. In Proceedings of the IEEE International Conference on Computer Vision, Venice, Italy, 22–29 October 2017; pp. 4373–4382. [Google Scholar]
- Howard, A.G.; Zhu, M.; Chen, B.; Kalenichenko, D.; Wang, W.; Weyand, T.; Andreetto, M.; Adam, H. Mobilenets: Efficient convolutional neural networks for mobile vision applications. arXiv 2017, arXiv:1704.04861. [Google Scholar]
- Sandler, M.; Howard, A.; Zhu, M.; Zhmoginov, A.; Chen, L.-C. Mobilenetv2: Inverted residuals and linear bottlenecks. In Proceedings of the IEEE Conference on Computer Vision and Pattern Recognition, Salt Lake City, UT, USA, 18–23 June 2018; pp. 4510–4520. [Google Scholar]
- Hou, Q.; Zhou, D.; Feng, J. Coordinate attention for efficient mobile network design. In Proceedings of the IEEE/CVF Conference on Computer Vision and Pattern Recognition, Nashville, TN, USA, 20–25 June 2021; pp. 13713–13722. [Google Scholar]
- Ding, L.; Lin, D.; Lin, S.; Zhang, J.; Cui, X.; Wang, Y.; Tang, H.; Bruzzone, L. Looking outside the window: Wide-context transformer for the semantic segmentation of high-resolution remote sensing images. arXiv 2021, arXiv:2106.15754. [Google Scholar] [CrossRef]
- Li, R.; Duan, C.; Zheng, S.; Zhang, C.; Atkinson, P.M. MACU-Net for semantic segmentation of fifine-resolution remotely sensed images. IEEE Geosci. Remote Sens. Lett. 2021, 19, 1–5. [Google Scholar]
Figure 1.
The gap between low-level features and high-level features. (a) is a visualization of low-level features. (b) is a visualization of high-level features.
Figure 1.
The gap between low-level features and high-level features. (a) is a visualization of low-level features. (b) is a visualization of high-level features.

Figure 2.
Illustration of Communicating Mutual Attention (CMA).

Figure 3.
Proposed Communicating Self Attention (CSA).

Figure 4.
Structure of designed CANet.

Figure 5.
Remote sensing images of the area where the dataset is located. (a) is an overview map of the Potsdam dataset set, (b) is an overview map of the Vaihingen dataset set. The different numbers are the IDs of the different images in the dataset.
Figure 5.
Remote sensing images of the area where the dataset is located. (a) is an overview map of the Potsdam dataset set, (b) is an overview map of the Vaihingen dataset set. The different numbers are the IDs of the different images in the dataset.

Figure 6.
Comparison of ablation experimental results of FCN and CANet. (a–e) are the five regions in the Vaihingen dataset used to compare the original image, the ground truth image, the prediction results from FCN and CANet.
Figure 6.
Comparison of ablation experimental results of FCN and CANet. (a–e) are the five regions in the Vaihingen dataset used to compare the original image, the ground truth image, the prediction results from FCN and CANet.

Figure 7.
Model comparison visualization results on the Vaihingen datasets. The pink color selects the area where the contrast between the predictions of the different models is most pronounced.
Figure 7.
Model comparison visualization results on the Vaihingen datasets. The pink color selects the area where the contrast between the predictions of the different models is most pronounced.

Figure 8.
Model comparison visualization results on the Potsdam datasets. The pink color selects the area where the contrast between the predictions of the different models is most pronounced.
Figure 8.
Model comparison visualization results on the Potsdam datasets. The pink color selects the area where the contrast between the predictions of the different models is most pronounced.

Figure 9.
Comparison of multi-level feature maps before and after using the CMA and CSA modules. Where (a–d) are the feature maps of levels 1–4 before using the attention module. (e–h) are the feature maps of levels 1–4 after applying the attention module.
Figure 9.
Comparison of multi-level feature maps before and after using the CMA and CSA modules. Where (a–d) are the feature maps of levels 1–4 before using the attention module. (e–h) are the feature maps of levels 1–4 after applying the attention module.


Table 1.
Ablation experiments on the Vaihingen dataset.
| Method | Imp. Surf. | Building | Low Veg. | Tree | Car | Mean F1 | OA | mIoU |
|---|---|---|---|---|---|---|---|---|
| FCN [24] | 89.05 | 91.54 | 79.01 | 87.10 | 84.22 | 86.18 | 87.0 | 75.97 |
| FCN + CMA1 | 91.30 | 94.69 | 81.20 | 88.11 | 86.50 | 88.36 | 89.12 | 79.44 |
| FCN + CMA2 | 92.21 | 94.96 | 82.29 | 88.51 | 86.75 | 88.95 | 89.79 | 80.38 |
| FCN + CMA3 | 91.35 | 94.37 | 81.10 | 87.87 | 87.77 | 88.49 | 89.0 | 79.64 |
| FCN + CMA123 | 91.67 | 94.58 | 83.31 | 88.94 | 87.84 | 89.27 | 89.83 | 80.83 |
| FCN + CSA | 90.82 | 94.44 | 80.56 | 87.95 | 86.48 | 88.05 | 88.80 | 78.96 |
| CANet | 92.49 | 95.26 | 83.34 | 89.18 | 87.75 | 89.61 | 90.33 | 81.41 |
Table 2.
Quantitative comparison results of multiple modules.
| Dataset | Method | Mean F1 | OA | mIoU |
|---|---|---|---|---|
| Vaihingen | FCN [24] | 86.18 | 87.0 | 75.97 |
| FCN + SE [32] | 87.23 | 89.71 | 77.89 | |
| FCN + CBAM [33] | 88.19 | 89.96 | 79.61 | |
| FCN + PPM [40] | 86.47 | 89.36 | 76.78 | |
| FCN + ASPP [27] | 86.77 | 89.12 | 77.12 | |
| FCN + PAM and AEM [18] | 88.09 | 89.83 | - | |
| CANet | 89.61 | 90.33 | 81.41 | |
| FCN [24] | 88.05 | 88.02 | 81.41 | |
| Potsdam | FCN + SE [32] | 91.39 | 89.60 | 85.38 |
| FCN + CBAM [33] | 91.73 | 89.89 | 85.65 | |
| FCN + PPM [40] | 89.98 | 90.14 | 81.99 | |
| FCN + ASPP [27] | 90.86 | 89.18 | 84.24 | |
| FCN + PAM and AEM [18] | 91.95 | 90.84 | - | |
| CANet | 92.60 | 91.44 | 86.48 |
Table 3.
Quantitative comparison of model accuracy on the Vaihingen dataset.
| Method | Imp.Surf. | Building | Low Veg. | Tree | Car | Mean F1 | OA | mIoU |
|---|---|---|---|---|---|---|---|---|
| FCN [24] | 89.05 | 91.54 | 79.01 | 87.10 | 84.22 | 86.18 | 87.0 | 75.97 |
| PSPNet [40] | 90.83 | 94.48 | 80.51 | 88.28 | 84.14 | 87.65 | 88.83 | 78.35 |
| DeepLabV3+ [27] | 90.41 | 94.05 | 80.27 | 88.31 | 78.64 | 86.34 | 88.50 | 76.44 |
| MACUNet [47] | 91.66 | 93.67 | 80.76 | 87.78 | 83.66 | 87.51 | 88.80 | 78.11 |
| LANet [18] | 92.41 | 94.90 | 82.89 | 88.92 | 81.31 | 88.09 | 89.83 | - |
| CANet | 92.49 | 95.26 | 83.34 | 89.18 | 87.75 | 89.61 | 90.33 | 81.41 |
Table 4.
Quantitative comparison of model accuracy on the Potsdam dataset.
| Method | Imp.Surf. | Building | Low Veg. | Tree | Car | Mean F1 | OA | mIoU |
|---|---|---|---|---|---|---|---|---|
| FCN [24] | 92.24 | 95.35 | 84.29 | 83.12 | 94.53 | 89.19 | 88.60 | 82.06 |
| PSPNet [40] | 90.80 | 95.17 | 85.76 | 86.99 | 91.14 | 89.97 | 88.82 | 81.94 |
| DeepLabV3+ [27] | 91.59 | 96.03 | 86.09 | 86.50 | 94.23 | 90.59 | 89.41 | 83.54 |
| MACUNet [47] | 92.64 | 97.00 | 86.30 | 87.49 | 95.14 | 91.71 | 90.36 | 84.97 |
| LANet [18] | 93.05 | 97.19 | 87.30 | 88.04 | 94.19 | 91.95 | 90.84 | - |
| CANet | 93.91 | 97.22 | 87.59 | 88.23 | 96.07 | 92.60 | 91.44 | 86.48 |
Table 5.
Comparison experiment of the number of interactions between high-level features and low-level features.
Table 5.
Comparison experiment of the number of interactions between high-level features and low-level features.
| Cycle Number | Imp.Surf. | Building | Low Veg. | Tree | Car | Mean F1 | OA | mIoU |
|---|---|---|---|---|---|---|---|---|
| 1 | 92.49 | 95.26 | 83.34 | 89.18 | 87.75 | 89.61 | 90.33 | 81.41 |
| 2 | 92.41 | 95.02 | 82.82 | 88.91 | 87.12 | 89.26 | 90.07 | 80.86 |
| 3 | 91.75 | 94.57 | 82.54 | 88.27 | 86.04 | 88.64 | 89.55 | 79.85 |
Disclaimer/Publisher’s Note: The statements, opinions and data contained in all publications are solely those of the individual author(s) and contributor(s) and not of MDPI and/or the editor(s). MDPI and/or the editor(s) disclaim responsibility for any injury to people or property resulting from any ideas, methods, instructions or products referred to in the content. |
© 2023 by the authors. Licensee MDPI, Basel, Switzerland. This article is an open access article distributed under the terms and conditions of the Creative Commons Attribution (CC BY) license (https://creativecommons.org/licenses/by/4.0/).
Share and Cite
MDPI and ACS Style
Meng, X.; Zhu, L.; Han, Y.; Zhang, H. We Need to Communicate: Communicating Attention Network for Semantic Segmentation of High-Resolution Remote Sensing Images. Remote Sens. 2023, 15, 3619. https://doi.org/10.3390/rs15143619
AMA Style
Meng X, Zhu L, Han Y, Zhang H. We Need to Communicate: Communicating Attention Network for Semantic Segmentation of High-Resolution Remote Sensing Images. Remote Sensing. 2023; 15(14):3619. https://doi.org/10.3390/rs15143619
Chicago/Turabian StyleMeng, Xichen, Liqun Zhu, Yilong Han, and Hanchao Zhang. 2023. "We Need to Communicate: Communicating Attention Network for Semantic Segmentation of High-Resolution Remote Sensing Images" Remote Sensing 15, no. 14: 3619. https://doi.org/10.3390/rs15143619
Note that from the first issue of 2016, this journal uses article numbers instead of page numbers. See further details here.