Article

About the Assessment of Cover Crop Albedo Potential Cooling Effect: Risk of the Darkening Feedback Loop Effects

1
NetCarbon, 33300 Bordeaux, France
2
DESR, Météo-France, CNRS, 31100 Toulouse, France
3
European Commission, Joint Research Centre (JRC), 21027 Ispra, Italy
4
CESBIO, Université de Toulouse, CNES/CNRS/INRAE/IRD/UT3, 31400 Toulouse, France
5
GMGEC, Météo-France, CNRS, 31100 Toulouse, France
*
Author to whom correspondence should be addressed.
Remote Sens. 2023, 15(13), 3231; https://doi.org/10.3390/rs15133231
Submission received: 11 May 2023 / Revised: 12 June 2023 / Accepted: 13 June 2023 / Published: 22 June 2023
(This article belongs to the Special Issue Remote Sensing of Solar Radiation Absorbed by Land Surfaces)

Abstract

:
Today societies face an unprecedented challenge to limit global warming and restore agricultural soils. Recent studies show that the introduction of cover crops over Europe could result in a cooling impact due to an increase in soil organic carbon stocks, a decrease in the use of fertilizers, and an increase in surface albedo of the croplands. Based on the use of remote sensing data, land cover database, meteorological data, national agricultural statistics, and ground measurements, a generic model was developed to simulate the radiative forcing following the change in surface albedo. This article analyzes the impact of the introduction of cover crops in Europe during the fallow periods. Compared to previous studies, this work discusses: (i) The maximum greening potential in Europe and the associated indirect surface properties changes (ii) for snowfall episodes, and (iii) due to an increase in organic matter. This study shows that the mitigation potential of cover crops through albedo effects could reach 6.74 MtCO2-eq.yr−1 by extending the periods of the introduction of the cover crops to all possible fallow periods. This mitigation could be limited to 5.68 MtCO2-eq.yr−1 if the impact of snowfalls is considered. This would be equivalent to 9.12 gCO2.m−2.yr−1. Finally, this study investigates the feedback loop due to soil darkening with soil organic carbon content increase when cover crops are introduced, considering two scenarios. The first considers the soil organic carbon content increase following repeated incorporation of cover crop biomass into the soil, simulated with the DayCent model. The second, more conceptual and extreme scenario aims at alerting on the possible impact of a combination of carbon farming practices, such as biochar or organic amendments. Our results show that this effect could lead to a loss of 20% of the climate benefit (i.e., 5.39 MtCO2-eq.yr−1). In conclusion, this study shows that cover crops have a strong potential for climate mitigation through direct albedo effects (soil coverage). However, once introduced, cropland should be permanently covered by vegetation or straws in order to avoid this darkening feedback loop effect.

1. Introduction

Since the beginning of the industrial era, atmospheric carbon dioxide concentration has been continuously rising, increasing global temperature. The objective of the 2015 United Nations Climate Change Conference (COP21) was to contain the global air temperature increase below 1.5 °C by the end of the 21st century. However, current climate projections indicate that this limit is likely to be exceeded without efficient mitigation strategies [1]. Simultaneously, and despite 95% of soils underlying human food [2], the conversion of natural to agricultural ecosystem severely degraded soil health. On a global scale, it notably results in a decrease in soil organic carbon of 60 to 75% [3] and a loss of 10 million ha of cropland due to soil erosion [4]. To meet the objectives of the COP21, societies are very likely to resort to geoengineering technics, which could also contribute to solving soil health issues.
‘Geoengineering’, also called ‘climate engineering’, refers to “a broad set of methods and technologies that aim to deliberately alter the climate system in order to alleviate the impacts of climate change” [1]. Those methods can be divided into two categories: Carbon dioxide removal (CDR) and solar radiation management (SRM) techniques. CDR approaches are intended to remove carbon dioxide from the atmosphere to reduce the greenhouse effect. To do so, those techniques either aim at increasing natural C sinks, e.g., through ocean fertilization [5] or afforestation/reforestation [6] or aim at capturing CO2 through different methods [7,8,9]. SRM approaches aim at increasing the fraction of solar radiation reflected back to space by increasing Earth’s albedo. Among SRM approaches, some suggest increasing the atmosphere’s albedo by seeding clouds [10] or consider injecting sulfate aerosol into the atmosphere [11,12]. Other studies consider increasing land surface albedo, which seems less dangerous as it can be implemented gradually and is reversible. For instance, Akbara et al. [13] and Jacobson and Ten Hoeve [14] investigate the climatic impact of painting rooftops in white worldwide. Furthermore, Ridgwell et al. [15] and Singarayer and Davies-Barnard [16] analyzed the cooling effect of increasing crop leaf albedo through varietal selection.
In this context, the recent “A Soil Deal” EU Mission and the ‘4 per 1000′ initiative [17,18], respectively, aim at restoring soil health and increasing global soil organic carbon (SOC) stocks of all non-permafrost soils by 4‰ per year to counterbalance the anthropogenic GHG emissions. Several studies identified cover crops (CC) as an efficient management practice to sequester carbon in the soils [19,20,21] as the CC biomass is incorporated into the soil, enabling an increase in SOC stocks. This practice can thus be considered CDR effective, but recent have studies shown that they can also increase surface albedo. Indeed, for most croplands in Europe, the vegetation albedo is higher than that of bare soil [22,23]. Therefore, the introduction of CC during fallow periods can lead to an increase in surface albedo and, thus, to a negative albedo-induced radiative forcing (RFα) corresponding to a cooling effect. Kaye and Quemada [19] estimated the climatic impact of CC at the field scale by considering carbon storage effects, N2O direct and indirect fluxes, emissions associated with field operations, and albedo effects. They showed that the CC albedo effect could induce an RFα equivalent to 12–46 gCO2.m−2.yr−1. Nevertheless, as in other studies (e.g., [24]), they used a constant atmospheric transmittance value, while it is known to vary temporally and spatially. Sieber et al. [25] highlighted the importance of considering those variations because it could lead to wrong RF estimates and even resulting in a warming instead of a cooling effect. Later, Carrer et al. [26] estimated that the RFα induced by the European cropland albedo increase following the introduction of CC could be equivalent to 16–20 gCO2.m−2.yr−1, which is consistent with estimates from Kaye and Quemada [19]. One major difference between the two studies is the calculation of a dynamic (spatially and temporally) atmospheric transmittance in Carrer et al. [26]. Nevertheless, in their study, Carrer et al. [26] only consider a maximum of three-month introduction of CC after a winter crop and before a summer crop, while CC can be introduced over a longer period and also between two summer crops and between two winter crops [27].
Moreover, the albedo products used by Carrer et al. [26] were snow-free, leading to an overestimation of the mitigation potential over areas that tend to be covered by snow. More recently Lugato et al. [20] overpassed those issues and showed that, considering snow cover, the radiative mitigation potential of CC would be between -7 and 12 gCO2.m−2.yr−1. However, they considered that below 21 cm of snow, the CC always emerge from snow, decreasing surface albedo. This strong assumption has since been challenged by Hunter et al. [28], who showed, through in situ observations, that the presence of CC was unlikely to decrease surface albedo as they increase snow depth and snow cover duration because of an increase in surface roughness.
Furthermore, several studies have analyzed the impact of CC on soil SOC storage [20,21,29]. They have shown a gradual soil SOC increase for the first 45–50 years (up to a maximum soil carbon storage capacity) following CC introduction. However, the increase in SOC results in a gradual darkening of the soils [30,31,32,33,34]. However, none of the studies addressing the direct albedo effect of CC associated with soil coverage considered the indirect effect of soil darkening.
This article is a companion paper of Carrer et al. [26] and offers a further analysis of the CC impact on the RFα in Europe as well as the subsequent soil darkening effect following SOC content increase. Compared to recent studies [19,20], this work discusses: (i) The maximum greening potential in Europe and the associated indirect surface properties changes (ii) for snowfall episodes and (iii) due to an increase of organic matter.
In Section 2, the data and the model are presented along with the experimental protocol. Section 3 shows the results. Finally, Section 4 concludes the paper and discusses the advantages/inconveniences of CC for climate mitigation.

2. Materials and Methods

2.1. Data

2.1.1. Climatic Data

Estimating top-of-atmosphere radiative forcing resulting from changes in surface albedo requires meteorological data of seasonal incoming shortwave radiation (SWin) at the surface and of atmospheric transmittance (TA). We also considered the effect of precipitation on CC emergence with a consequence on RFα. The ERA-5 products ([34], available at a global scale (https://cds.climate.copernicus.eu, last access 1 April 2021), at an hourly time step and at a spatial resolution of 1/4° (ERA5, i.e., solar radiation) or 1/10° (ERA5-Land, i.e., precipitation) were used. The TA was estimated for each grid point on a daily basis as the ratio between SWin and the incoming solar radiation at TOA (RTOA). Finally, in order to assess the CC albedo effect when snowfall occurs, the snow depth from the ERA5-Land product was also used.

2.1.2. ECOCLIMAP Classification

To define the areas and periods of potential CC introduction, the ECOCLIMAP classification [35,36] was used. This database provides the fraction of crop types according to their photosynthesis (i.e., C3 or C4) as well as the fraction of bare soil all over Europe and at a spatial resolution of 1 km. The proposed method aims at simulating CC introduction between two cash crops (either summer or winter crops). However, crops are usually distinguished according to their growth period (i.e., winter or summer crops) rather than according to their photosynthesis types. As in Carrer et al. [26], a correction factor was thus defined for each country from the fraction of C3 plants in ECOCLIMAP and the fraction of winter crops of the 2011 Eurostat database (https://ec.europa.eu/eurostat/fr/web/agriculture/data/database, last access 1 April 2021). This correction factor was then applied to each pixel of the associated country.

2.1.3. Vegetation Indices and Albedo Products

Assessing RFα induced by the CC requires estimating changes in surface albedo following their introduction in the crop rotations. To do so, data on bare soil and vegetation albedos, as well as vegetation indices for cropland, are needed.
The MODerate Resolution Imaging Spectroradiometer (MODIS) data (MCD43FG) from AQUA and TERRA [37] provide gap-filled snow-free albedo products. However, the current spatial resolution (~1 km at the Equator) of these products is not sufficient because the croplands are rarely pure at 1 × 1 km2. Moreover, satellite observations provide only total surface albedo and not bare soil and vegetation albedo. These two components (bare soil and vegetation albedos) are needed to address the evaluation of the introduction of CC for fallow periods. To address this issue, Carrer et al. [23] retrieved separate bare soil (αBS) and vegetation (αVEG) albedos and vegetation indices (veg) of up to 11 co-existing vegetation types (grass, evergreen, summer crop, etc.) from MODIS products, using a Kalman-Filter method, and the ECOCLIMAP classification. This led to a global soil and vegetation albedo mapping for cropland at a temporal resolution of 8-day over the period 2001–2010 and at 1/20° resolution. For cropland, the total albedo of the surface, αTOT, is thus obtained as a combination of αBS, the αVEG for cropland, and of the cropland vegetation indices (see Section 2.2.3).

2.2. Calculation of the CC Albedo Effect

The definition of the regions and periods of CC introduction as well as cropland albedo changes and associated RF were estimated following the methodology designed by Carrer et al. [26].

2.2.1. Regions and Periods of Cover Crop Introduction

In most of Europe, the cultivated crops can be split into 2 categories: Winter crops (sown in fall and harvested in early summer) and summer crops (sown in spring and harvested at fall). To simulate the introduction of CC, the crop rotations between summer and winter crops must be rebuilt. From the ECOCLIMAP derived vegetation indices of the winter and the summer crops, vegetation indices corresponding to the four possible crop rotations between winter and summer crops were rebuilt, i.e., winter-winter, summer-summer, winter-summer, and summer-winter (hereafter noted RWW, RSS, RWS, and RSW). Table 1 presents these 4 crop rotations, which are characterized by a fallow period during which CC can be introduced.
The rules used to define the potential periods of CC introduction were established by Carrer et al. [26] and by Launay et al. [38]. They are summarized here:
  • The fallow period after a summer crop and before a winter crop was considered too short for a CC introduction (no CC on RSW, see Table 1).
  • The CC are introduced after winter crops and before summer crops or between two summer crops. Note that the RSW and RWS crop rotations are identical with a one-year shift.
  • If the sowing date of the crop following the CC occurs in spring or in summer (i.e., before 21 September), at least one month of bare soil is required before the sowing of the following crop, causing early CC destruction. These agronomical rules typically aim at reducing water consumption before the sowing of a summer crop and reducing water stress at emergence.
  • If the sowing date of the crop following the CC occurs after early fall (i.e., after 21 September), no fallow period is needed before the next crop. Therefore, the CC is destroyed at the same time as the sowing of the following crop.
Following Carrer et al. [26], we considered that the vegetation indices (vegCC) and albedo (αVEG_CC) of the CC were defined considering that:
  • The value of αVEG_CC does not exceed 0.95 of the maximum value of αVEG in a given grid cell.
  • That vegCC is defined by a constant value corresponding to 0.95 of the maximum vegetation index of the winter crop of the same pixel. A linear interpolation is applied for the first 32 days (4 × 8 days) to reach this value, which corresponds to the CC development.
For each considered pixel of the study area containing a crop fraction, crop rotation fractions were estimated based on the Eurostat national statistics and agronomic expertise as in Carrer et al. [26]. Pixels covered by crops over less than 20% are not considered (see [26] for more details). A detailed description of the rules of introduction is available in Carrer et al. [26].

2.2.2. Influence of Snow and SOC on Surface Albedo

Compared to Carrer et al. [26], the following methodological improvements were added:
Snow albedo-Since the albedo products we used ([23] are snow-free and because Kaye and Quemada [19] and more recently Lugato et al. [20] highlighted the importance of taking the snow cover into account to estimate the CC RFα effect, the impact of snow cover has been introduced in this study. The ERA-5 snow depth product was used to filter periods and areas concerned by CC introduction and covered by snow for calculation of the daily RFα following the conclusions from Hunter et al. [28].
Soil darkening effect-Two methods were used to estimate the radiative impact of the soil darkening following SOC increase:
First, we used outputs from DayCent ecosystem model [39] following the approach proposed by Lugato et al. [20], who developed a framework integrating DayCent and the largest soil survey dataset available in Europe: LUCAS [40]. Soil property information from the LUCAS dataset and management information from official statistics were used as input to run the DayCent model, which allowed estimation of the amount of CC biomass that could be introduced into the soil and subsequent SOC accumulation. Moreover, using the dataset available in Post et al. [33], we defined an equation linking SOC (%) and soil albedo:
α s o i l = 0.052 × l n S O C + 0.17
This equation was then used to estimate the decrease in bare soil albedo following the increase of SOC estimated by DayCent model. It thus leads to an estimation of the radiative impact of soil albedo decrease following CC incorporation in the soil. A change in RF associated with soil darkening is thus available for 85 years of simulation and more than 7000 LUCAS points and was then used to modify the simulated RFα. For each grid node of our model, an RFα decrease coefficient was defined either by averaging all changes in RF (all LUCAS points) inside the grid point or by using the closest change in RF if no LUCAS points were contained in the grid point. These coefficients were linearly interpolated to our grid and directly used in our approach to modify the RF linked to cover crop introduction. Figure 1 shows the distribution of the LUCAS points over the study area, together with the proportion of cropland within each pixel (see Section 2.1.2). The spatial coverage of the LUCAS points matches well with the cropland areas. We consider this scenario to realistically estimate the potential impact of CC on soil albedo decrease and the subsequent RF effect of both CC soil coverage and soil darkening. Note that the decrease in soil albedo has an impact on total surface albedo during fallow but also during crop development periods when vegetation is not fully covering the soil.
A more extreme soil darkening scenario was simulated in an attempt to alert to the potential impact of soil albedo decrease resulting from a combination of carbon farming practices (e.g., biochar, organic amendments) in combination with CC. This drastic scenario considers that the bare soil albedo had decreased until reaching the current darkest soil over our area of study. Several assumptions were made. First, in order to calculate the dynamic of the soil albedo decrease, we used SOC sequestration dynamics over 50 years following CC introduction, similar to the ones simulated by Poeplau and Don [29] and Tribouillois et al. [21]. After 50 years of CC, the authors stated that the soil reached a new equilibrium and that no more carbon could be stored in the soil. The limit of this approach is that it does not consider the impact of other carbon farming practices on the SOC sequestration dynamics, including the effect of biochar application that would affect more rapidly the soil albedo dynamics. Then, to define the new value of αBS after 50 years of carbon farming practices for a given location and its associated seasonal dynamics, we used as a reference the pixel which has today the lowest αBS in the study area. This pixel is located over chernozem soils in Romania (Figure 1). This chernozem soil area is well-known for being one of the two regions in the world with the highest SOC content. As the aim of this extreme scenario is to estimate what would be the RFα of combined carbon farming practices, we considered a decrease in albedo (mean value and seasonal dynamics) to reach the one observed in Romania compared to the initial αBS mean value and amplitude.

2.2.3. Radiative Forcing Calculation

RFα is estimated on a daily basis from the difference in albedo between a baseline scenario (corresponding to 2001–2010 observations, i.e., without CC) and the albedo resulting from CC introduction at a given time during the fallow period. The total albedo of the cropland equal to αTOT, or αTOT_CC in case of CC introduction, and the albedo loss or gain (∆α) is estimated as:
α T O T = α V E G × v e g + α B S × 1 v e g
α T O T C C = α V E G C C × v e g C C + α B S × 1 v e g C C
Δ α = α T O T C C α T O T
where αVEG is the vegetation albedo of the crop, αVEGCC is the CC albedo, veg is the crop rotation vegetation index, vegCC is the CC vegetation index, αBS is the bare soil albedo. vegCC and αVEGCC are defined following the rules defined in Section 2.2.1.
We constrain here the albedo of CC below the maximum of observed vegetation albedo (as in Carrer et al. [26], which minimizes the radiative mitigation potential. If CC are used to increase cropland albedo, it may be more appropriate to select species with high albedo, as discussed in Sakowska et al. [41], where the authors considered a chlorophyll mutant soybean with an albedo of 0.29.
Once the change in surface albedo is estimated, the daily albedo-induced radiative forcing is calculated as:
R F α = S W i n × T A × Δ α
where SWin is the daily shortwave incoming global radiation and TA is the daily atmospheric transmittance. Since TA is not directly provided in the ERA-5 database, we estimated it as:
T A = S W i n S W T O A

2.2.4. Conversion into Equivalent CO2

In the objective of comparing the RFα with other CC effects, such as carbon storage or GHG budget, the RFα was converted into equivalent CO2. To do so, the global warming potential (GWP) method was used [42]. This metric has already been used to estimate the albedo-induced climatic impact [32,43]. It considers the cumulative RF induced by an effect (i.e., change in albedo) relative to that of the CO2 at a specific time horizon (TH). GWP is defined as:
G W P = t = 0 T H R F T O A t k C O 2 t = 0 T H y C O 2 t
where GWP is expressed in kgCO2-eq.m−2, kCO2 is the CO2 radiative efficiency in the atmosphere (W.m−2.kg−1) at a constant concentration (389 ppm [44]) and yCO2(t) is the CO2 impulse-response function.

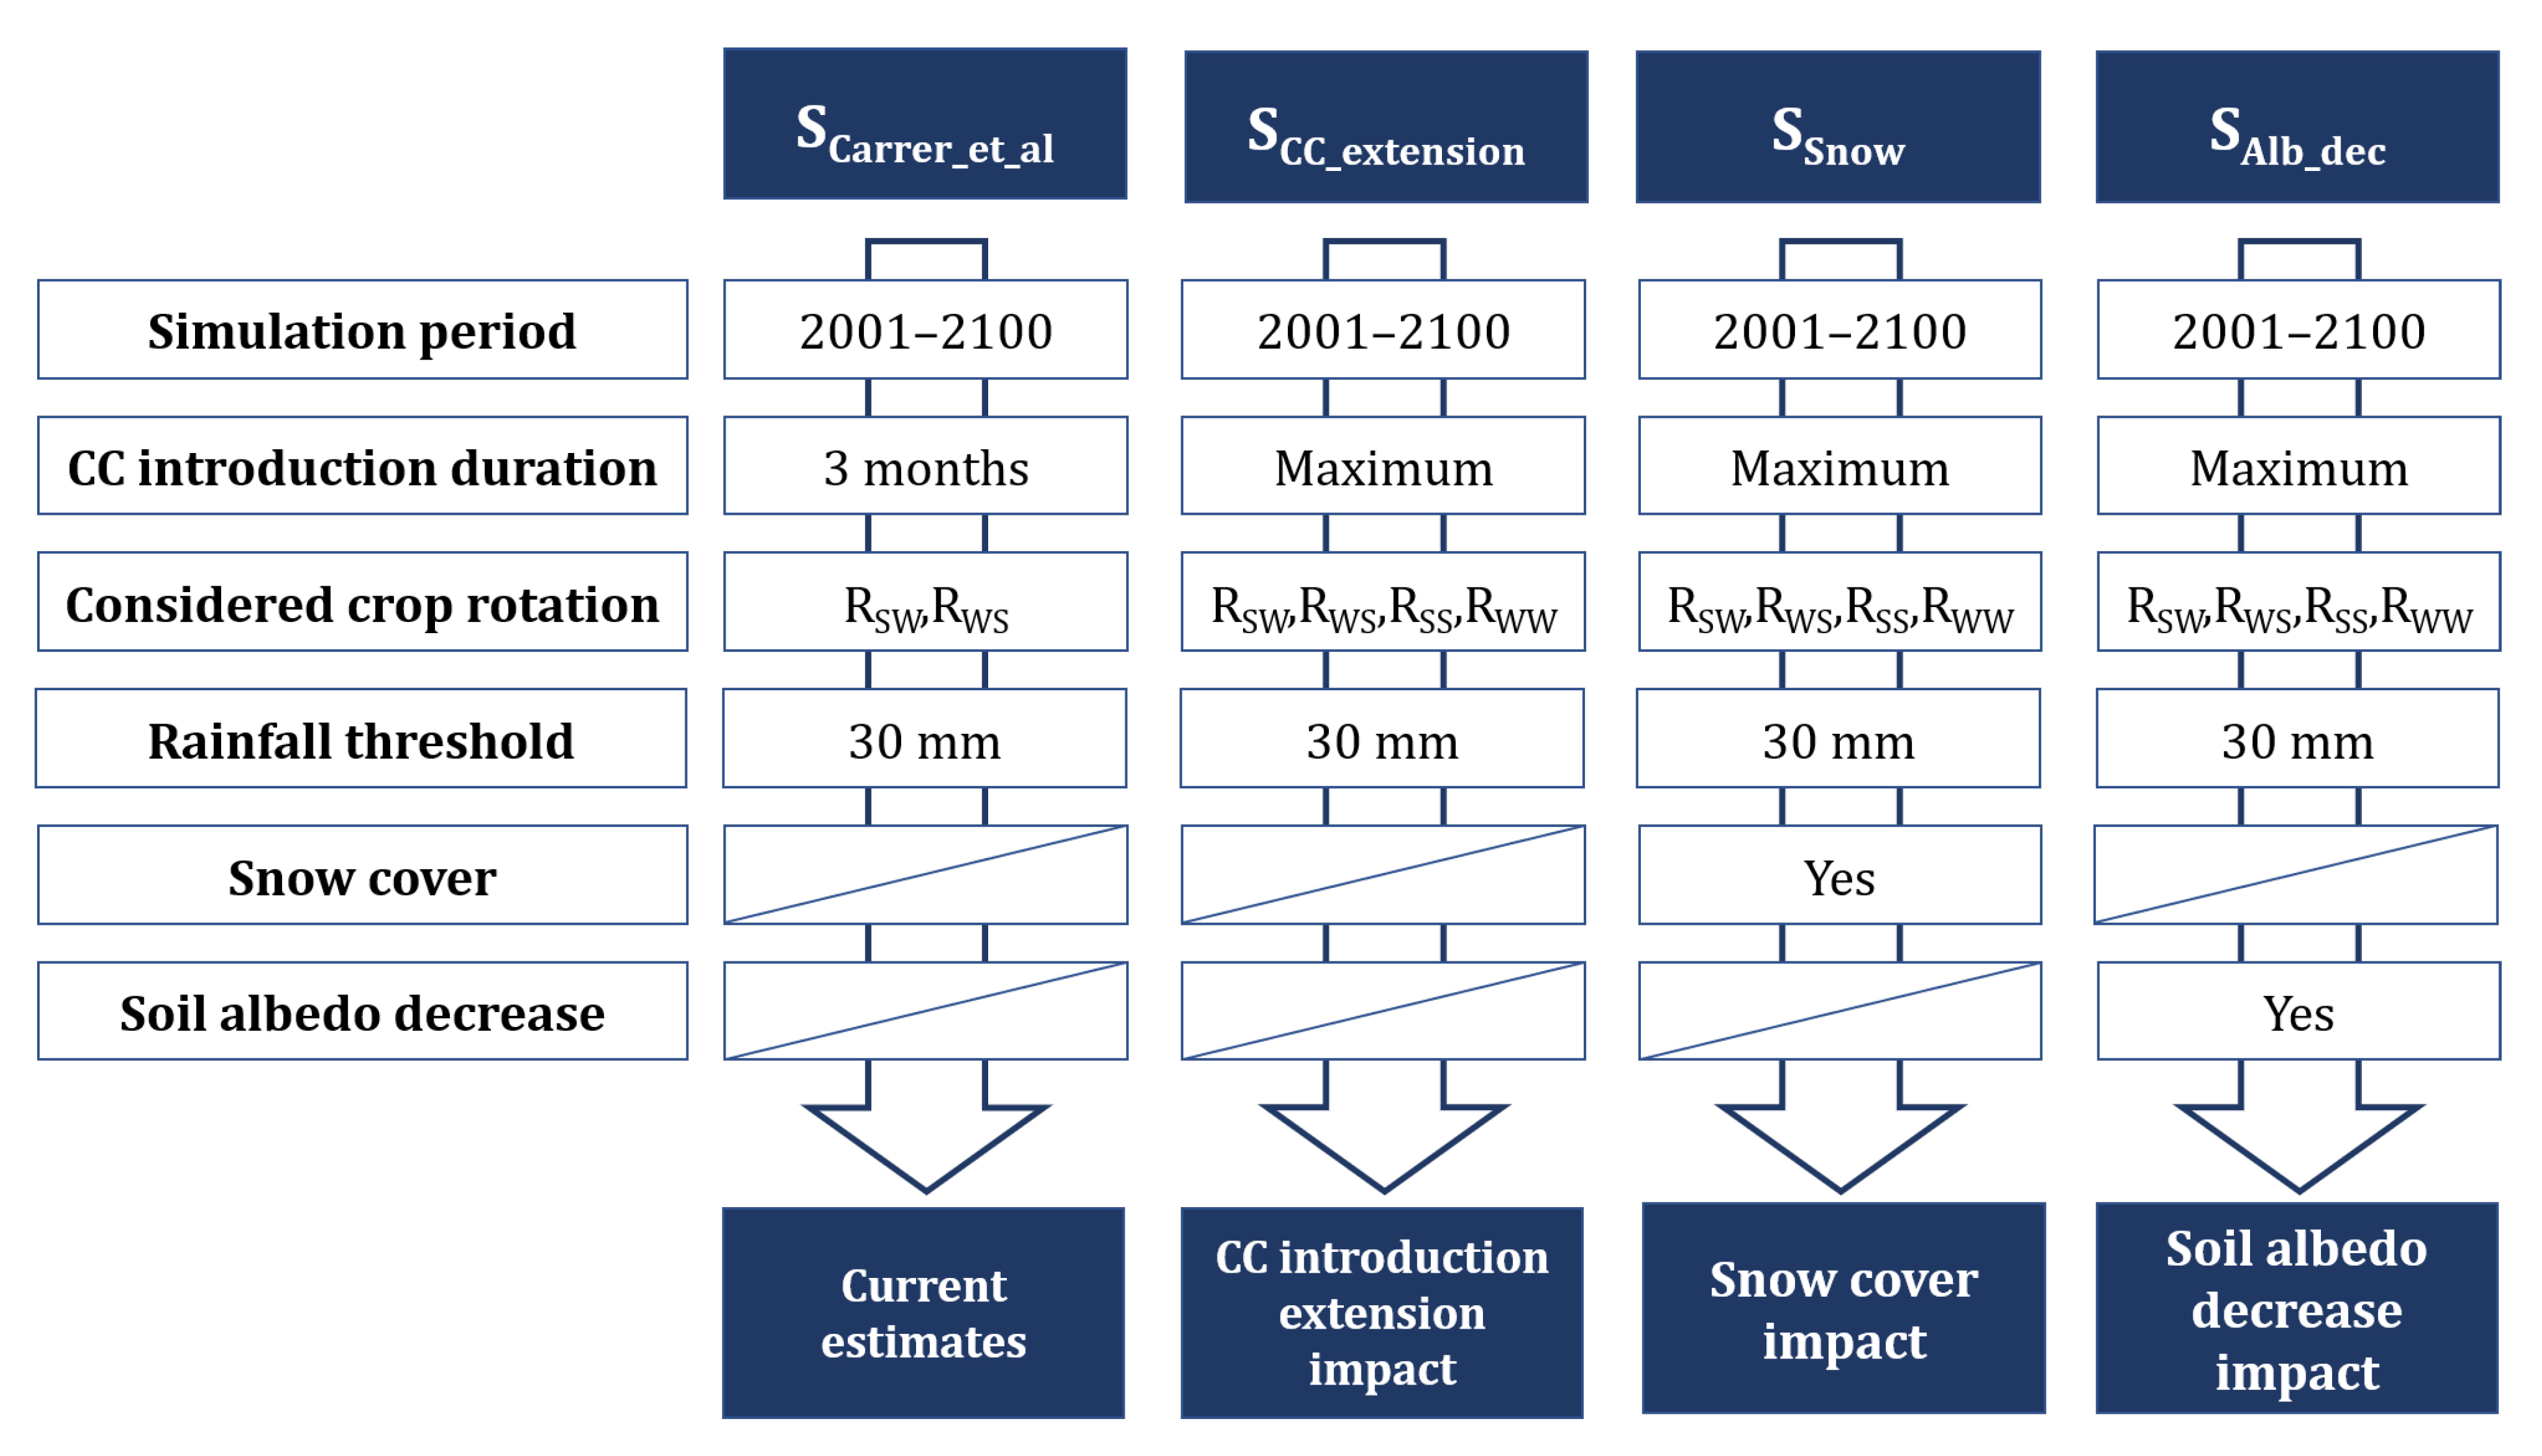
2.3. Simulation Scenarios

Based on the different data presented in Section 2.1 and on the rules for introducing the CC presented in Section 2.2.1 and Section 2.2.2, different scenarios have been simulated and analyzed. Figure 2 summarizes these scenarios.
Scenario SCarrer_et_al-The first scenario is based on the work of Carrer et al. [26]. In that study, the authors estimated the radiative impact of the introduction of CC using the same model as in this study but only for RSW and RWS (see Table 1), which usually correspond to the crop rotations having the longest fallow period. The maximum duration of the introduction of the CC was fixed to three months before their destruction and incorporation in the soil by the farmer. In Carrer et al. [26], the simulation was performed by using only three years of data. In order to reduce the sensitivity of our estimates to potential inter-annual climatic effects, the present study is based on 10 years of data (2001–2010). Moreover, the model was modified to increase the simulation period up to 100 years. As no climate change scenario was applied, we replicated the 2001–2010 dataset ten times. As suggested by Brisson et al. [45], a threshold limiting the emergence of CC below 30 mm of rainfall the month following their introduction was considered.
Scenario SCC_extension-The SCarrer_et_al scenario was modified in order to introduce the CC during all the fallow periods when and where possible (not only in the RSW and RWS). Therefore, CC were also introduced in RWW and RSS when the fallow period lasted for at least 2.5 months (see Table 1). The duration of the CC introduction is limited by the intercropping duration and rules relative to the time span between their destruction and the seeding of the following crop as described in Section 2.2.1.
Scenario SSnow-Based on the SCC_extension, another experiment was carried out to account for the snow cover effect on the RFα. In this scenario, the periods and areas covered by snow were filtered as explained in Section 2.2.2, meaning that during those periods, the RFα was equal to zero (αTOT = αTOT_CC = αSNOW).
Scenarios SAlb_dec-Finally, we analyzed how the progressive decrease in soil albedo following the repeated incorporation of CC biomass in the soil could affect the RFα. The realistic scenario presented here is based on the work of Lugato et al. [20] and described in Section 2.2.2. From the SCC_extension, we applied a coefficient to the simulated RF on each pixel that takes into account the radiative impact of soil albedo decrease following SOC increase.
An additional scenario was simulated in order to estimate the potential impact of soil albedo decrease resulting from a combination of novel carbon farming practices (e.g., biochar application, organic amendments, etc.). This drastic scenario is based on the SCC_extension and considers that the bare soil albedo had decreased until reaching the darkest soil reference for SOC-saturated cropland. As this scenario is more conceptual than those described in Figure 2 and thus based on strong assumptions, it is discussed separately.
The following Section 3.1 analyzes the results of the three scenarios described in Figure 2.

3. Results

3.1. Analysis of the Results for Each Scenario

Table 2 summarizes the mean albedo changes following CC introduction for each country concerned by the study area, as well as the CC introduction areas and the mean RFα (expressed by unit of CC introduction area) and GWP for each country and for the four scenarios.

3.1.1. Effect of the Extension of the Duration of CC Introduction

While the potential CC introduction area was estimated to represent 3.9% of the total area (EU27 + UK, Switzerland and Norway) according to the SCarrer_et_al, it represented 4.2% in Carrer et al. [26], considering the scenario that did not take rainfall limitation into account. Therefore, the difference with the SCarrer_et_al (i.e., 0.3%) comes from the consideration of rainfall as a limiting factor for the CC development. The countries concerned by the largest CC introduction area are France, Romania, and Poland, with, respectively, 33704, 32,526, and 24,639 km2 (see Table 2). The countries showing the highest RFα per surface unit (m2) are Portugal, Greece, and Italy (see Table 2). These countries are among those that receive the highest radiation and that have the highest atmospheric transmittances, which explains the high RFα. For the opposite reasons, the lowest RFα per surface area unit are observed in Nordic countries (see Figure 3). The GWP per country induced by the CC is a combination between the RFα and the area on which CC can be introduced (see Equation (7)). The three countries exhibiting the highest mitigation potential are France (0.60 MtCO2-eq.yr−1), Romania (0.34 MtCO2-eq.yr−1), and Bulgaria (0.19 MtCO2-eq.yr−1).
Figure 3 shows the mean RFα (per m2 of introduced CC) estimated over 100 years of simulation. A north-south gradient is clearly visible, corresponding to the influence of incoming radiation, which allows southern countries to have high RFα. However, Spain has a low RFα compared to other southern countries and exhibits some positive RFα. In fact, large areas of Spain have limestone soils with high albedo, and, therefore, covering soil with CC often results in surface albedo decrease resulting in low or even positive RFα. However, the positive RFα induced by those decreases in surface albedo could be compensated by other biogeophysical (e.g., decrease in sensible heat fluxes and infrared radiations, see Ceschia et al. [46]) or biogeochemical effects (e.g., soil carbon storage). On the other hand, countries cumulating high radiation and dark soils present the highest potential RFα (see Romania and Bulgaria in Figure 3).
In the SCC_extension, CC are introduced as described in Section 2.2.1 whenever it is possible in each crop rotation (see Table 2). In this scenario, the potential CC introduction area represents 13.0% of the total area. According to the SCC_extension, this practice could be introduced on 58.2% of the arable land of the study area. It would increase the surface albedo by 0.017, and it could induce an RFα of −0.62 W.m−2, equivalent to a mitigation potential of 6.74 MtCO2-eq.yr−1, i.e., three times larger compared to SCarrer_et_al (2.17 MtCO2-eq.yr−1).
The areas of CC introduction per country in the SCC_extension are rather proportional to the national area of arable lands. The countries concerned by the largest CC introduction area are thus Poland, France, Germany, and Romania, with, respectively, 96,582, 89,247, 87,383, and 54,608 km2 (see Table 2). The countries showing the highest RFα per surface unit (m2) are Portugal, Cyprus, Greece, and Bulgaria (see Table 2). Finally, in the SCC_extension, the three countries exhibiting the highest mitigation potential are France (1.59 MtCO2-eq.yr−1), Romania (1.05 MtCO2-eq.yr−1), and Italy (0.73 MtCO2-eq.yr−1).

3.1.2. Impact of Snow Cover

In order to refine the estimates of the SCC_extension, the snow cover was considered in the SSnow, allowing identifying the most affected countries, compared to the SCC_extension, the areas of the introduction of the CC are the same (see Table 2), and the difference in mitigation potential between the two scenarios only comes from the differences in snow effect (see Figure 1 and Section 2.3). The southern countries (Portugal, Cyprus, Spain, etc.) are not impacted by the snow, contrarily to northern and eastern countries (Sweden, Slovakia, Lithuania, etc.). As a result, the average albedo change over the total study area decreases in this scenario (0.012) compared to the SCC_extension (0.017). Over the total area, this albedo change results in an RFα of −0.52 W.m−2, which corresponds to a cooling effect equivalent to 5.68 MtCO2-eq.yr−1, i.e., a 16% loss compared to the SCC_extension.

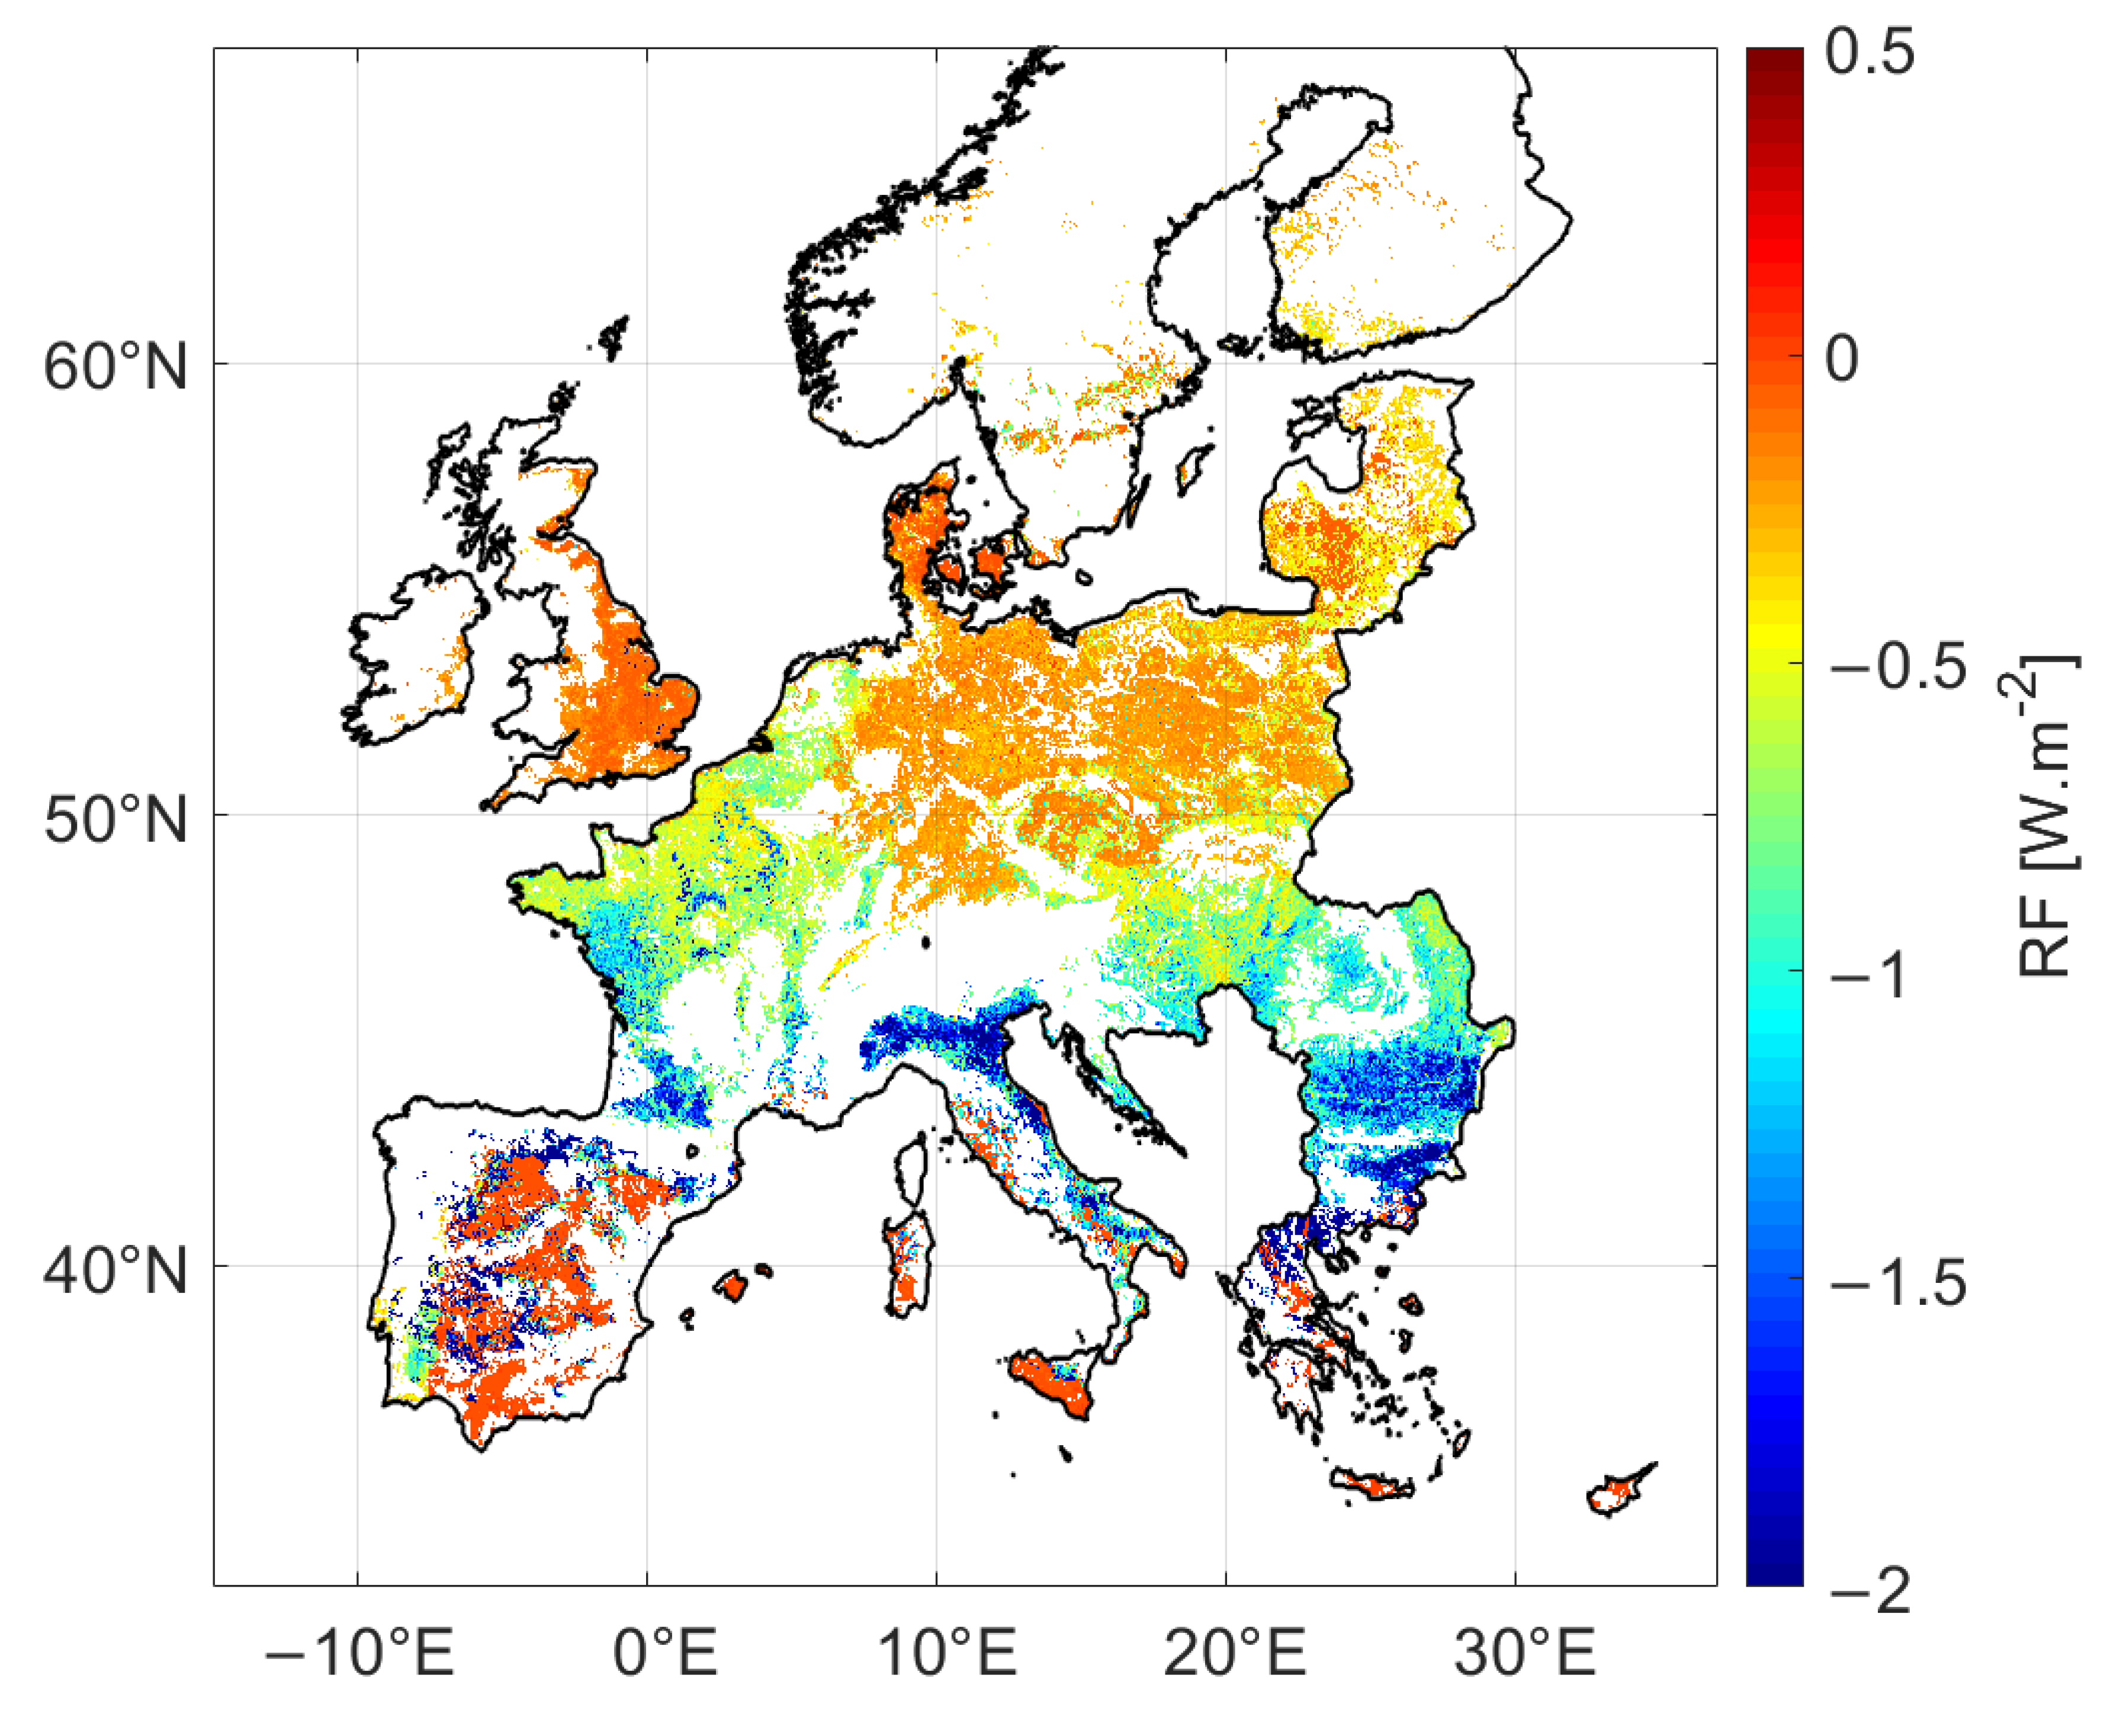
3.1.3. Impact of the Soil Albedo Decrease following CC Introduction

For the SAlb_dec, the results have been obtained by applying a correction coefficient to the RF obtained in the SCC_extension. Therefore, only the RF (and GWP) changes between these two scenarios (see Table 2). Overall, the soil albedo reduction induces a loss of 19% of the RF, compared to SCC_extension, resulting in an RF of −0.50 W.m−2 at the study area scale corresponding to a cooling effect of 5.39 MtCO2-eq.yr−1. According to this scenario, Belgium, Malta, and Ireland have higher (in absolute value) RFα, which means that the cooling effect is more important when the soil albedo decrease is considered. Only three LUCAS points were available for Ireland and none for Malta, leading to non-realistic estimates of SOC increase and, hence, RF. For Belgium, the soil characteristics are probably not suitable for applying the equation (see Equation (1)) linking soil albedo and SOC. For all other countries, we observed a decrease in RFα. Norway and Cyprus lose the entire CC cooling effect, but as for Ireland and Malta, no LUCAS points were available, forcing us to estimate a change in RF based on the coefficients of the nearest country. According to the SAlb_dec, France, Romania, and Italy (the three countries previously exhibiting the highest mitigation potential) would lose, respectively, 16%, 18%, and 6% of the cooling effect compared to the SCC_extension.

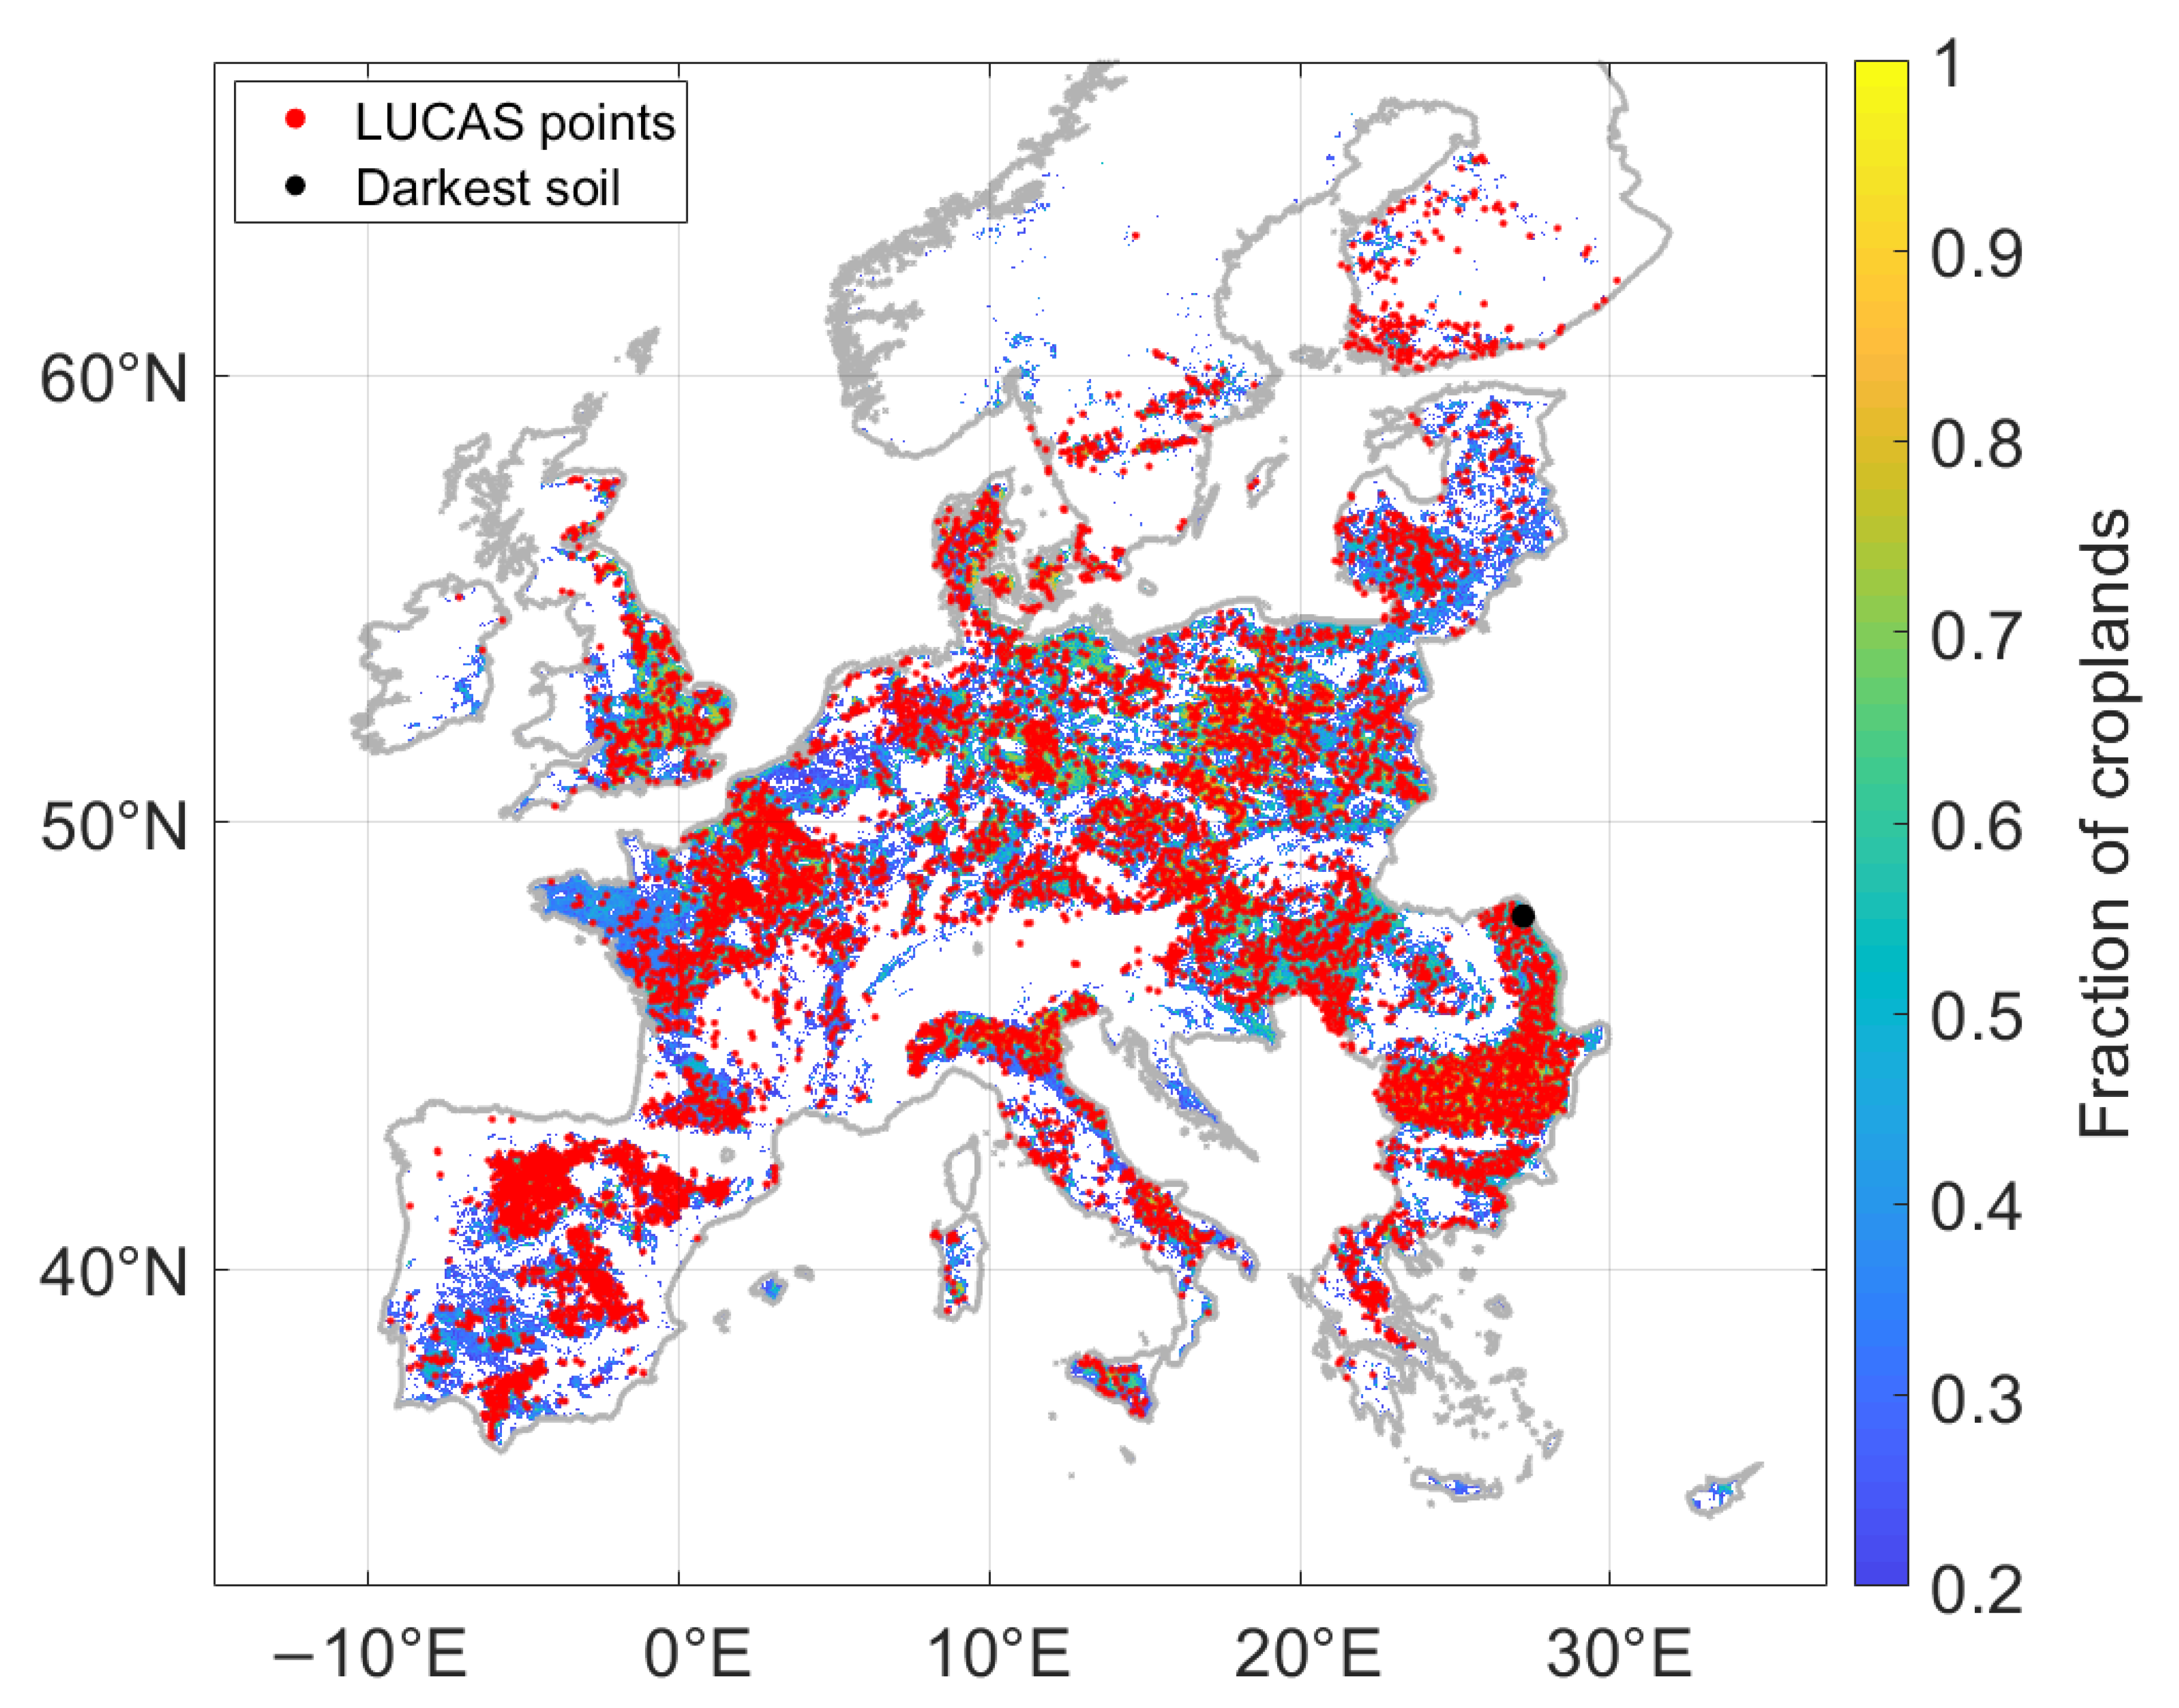
3.1.4. Impact of Drastic Soil Darkening

Concerning the conceptual scenario of extreme soil darkening, results show that the immediate effect following the introduction of CC is a surface albedo increase that is progressively counterbalanced by the soil darkening effect of the carbon farming practices. However, as the length of CC soil coverage (surface albedo increases) is longer than the periods of the bare soil (surface albedo decreases), most of the countries still exhibit mean annual increases in surface albedo. On the European scale, it results in a mean surface albedo increase over the 100 years of study equal to 0.002. The countries that exhibit a decrease in total surface albedo are concerned by initial bright soil (Spain, Malta, Cyprus) or by short CC introduction periods (Ireland, UK, Denmark). According to this scenario, the resulting RFα is positive (warming effect) for all countries except Portugal. As a consequence, over the study area, the albedo changes induce a positive RFα of 0.51 W.m−2 equivalent to a warming effect of −5.49 MtCO2-eq.yr−1. The explanation of this strong negative RF is that compared to the reference scenario (no CC introduction), the surface albedo increases due to CC soil coverage often occurring during winter time (when global radiation is low), while surface albedo decreases due to SOC increase occurs mostly during summer time (when global radiation is high and for bare soil periods in the crop rotations). As a result, the soil darkening effect on RFα predominates at an annual scale over the soil coverage effect of the CC. Here again, the impact of the soil darkening effect on the RFα and on the GWP is proportional to the surface of the arable land of each country. The countries contributing the most to the warming effect on the European scale are now Spain (−1.55 MtCO2-eq.yr−1), Germany (−0.64 MtCO2-eq.yr−1), and France and Poland (−0.53 MtCO2-eq.yr−1).

4. Discussion

In this study, we simulated the change in surface albedo following the introduction of CC on the European scale under several scenarios and the associated RFα. First, we analyzed the effect of implementing CC in all croplands areas whenever it is possible (SCC_extension) following the extension CC scenario defined in Launay et al. [38] and considering that a threshold of 30 mm of rain the month following the potential CC introduction is required for CC emergence. According to this scenario, the CC could induce, on average, an RFα of −0.62 W.m−2, and we estimate that CC could potentially be introduced over 13.0% of the total surface area of the study (EU27 + UK + Norway + Switzerland). It represents 68.8% of the total agricultural area, and considering that this practice would be maintained over 100 years, the mitigation potential was estimated to be 6.74 MtCO2-eq.yr−1. Expressed by the area of introduced CC, the mean mitigation potential is equivalent to 10.8 gCO2.m−2.yr−1 over 100 years. This value per unit area of introduced CC is lower than the first estimates found by Carrer et al. [26] (i.e., 15.91 gCO2.m−2.yr−1) because CC are introduced here over larger areas but often for shorter periods (e.g., between two summer crops). Still, considering the total area on which CC could be introduced, the cumulated effect is higher than in Carrer et al. [26]. Moreover, the mean mitigation potential estimated in this study is comparable to estimates from Lugato et al. [20], who found radiative mitigation potential for CC ranging from 5.7 to 16.3 gCO2.m−2.yr−1 in their snow-free scenario. However, those results expressed in CO2-eq should be considered with caution because of the uncertainty of the methods for converting albedo effects in CO2-eq [47]. Furthermore, changes in surface albedo following CC introduction trigger predominantly local climatic effects, while it is difficult to predict non-local and global effects due to teleconnections in the climate system, climate feedback, and changes in other biogeophysical (e.g., surface roughness) and biogeochemical effects. Indeed, Ceschia et al. [46] showed that the introduction of CC could result in a substantial decrease in sensible heat fluxes, surface temperature, and infrared radiation while evapotranspiration increases. Kaye and Quemada et al. [19] and Lugato et al. [20] showed that CC introduction could result in increases in N2O fluxes. To avoid this, Guardia et al. [48] suggested implementing integrated soil fertility management techniques following CC destruction. Nevertheless, Abdalla et al. [49] estimated that the impact of CC on direct N2O emissions and SOC changes could mitigate GHG-based climate change by 206 +/− 210 MtCO2-eq.yr−1. Using these estimates and adding the albedo effect found in this study, the total CC mitigation effect would be equivalent to 135 MtCO2-eq.yr−1. According to Eurostat (http://ec.europa.eu/eurostat/, accessed on 1 April 2021) the agricultural GHG emission of the EU-28 (+ Switzerland and Norway) has been estimated to 435 MtCO2-eq.yr−1 in 2019. Therefore, the implementation of CC across Europe could mitigate agricultural GHG emissions by 31%, and the albedo effect would represent 5% of this effect.
Nevertheless, Kaye and Quemada [19], Lombardozzi et al. [50], and Lugato et al. [20] suggested that during periods with snow, CC could cause a positive radiative forcing as the vegetation could emerge from the snow. In their study, Lugato et al. [20] considered that CC were not buried by snow even under 21 cm of snow height. As a consequence, some countries exhibited warming radiative forcing once the snow was taken into account. On the other hand, based on field evidence, Hunter et al. [28] considered that CC would have little effect or could even induce an additional cooling effect over areas concerned by snow cover, notably because CC tend to be entirely covered with snow and because they allow the snow cover to remain on the ground longer. As no consensus has emerged yet concerning the combined effect of snow and cover crops, we decided to filter areas and periods affected by snow cover in the snow scenario (SSnow) following the hypothesis that CC had no effect on RFα. Our results suggest that the RFα of CC would decrease by 16% on average over the study area compared to the SCC_extension. Those different studies highlight the importance of assessing the true impact of CC for areas concerned by snow eventually through in-situ monitoring that could provide answers concerning, for instance, the effect of cover crop on the snow pack dynamic but also interactions between cover crop architecture and snow cover.
Based on the recent study by Lugato et al. [20], we created a scenario (SAlb_dec) that takes into account the decrease in soil albedo following the increase in SOC associated with the incorporation of CC into the soil. We used the RFα simulated in the SCC_extension, and we applied to it a coefficient estimated with the approach developed by Lugato et al. [20] and the data provided by Post et al. [33] (see Section 2.2.2). According to this scenario, the decrease in soil albedo could lead to a loss of 19% of the cooling effect compared to the SCC_extension.
Of course, for the extreme soil darkening scenario, the methodological approach was very simplistic, and therefore our results should only be considered as a word of caution and an incentive to intensify scientific studies on the potential antagonisms between the SOC effect of carbon farming practices and their RFα effect on climate. Still, those results alert to the fact that a progressive soil albedo decrease following an increase in soil organic matter could partly counterbalance (1) the direct increase in surface albedo following CC introduction and (2), more generally, the climate benefit associated with carbon farming practices.
Therefore, we recommend accounting for the soil albedo darkening effects following carbon farming practices for implementing more efficient climate change mitigation strategies in the medium or long term once management practices increasing SOC storage are adopted. It can be achieved by permanently covering the soil with active vegetation or crop residues as it has been proved that, besides CC implementation, no-till practices-maintaining crop residues at the surface allow increasing surface albedo for most soils in Europe [51]. This is particularly important for summer fallow that is characterized by high solar radiations and transmittances.
Overall, the implementation or not of carbon farming practices, such as the CC, will depend on other considerations, such as additional labor and cost for the farmers, but they may be promoted or not depending on local specificities, such as climate and soil characteristics. For instance, the introduction of CC over agricultural areas concerned by very bright soils (e.g., Spain) risk to induce a warming RFα due to a strong decrease in soil albedo. If this warming effect is not compensated by C sequestration or other climate benefits, the introduction of CC is unfavorable for climate mitigation in the corresponding region. Moreover, Tribouillois et al. [21] showed that CC had an impact on water balance by increasing soil water holding capacity and evapotranspiration, which, in turn, induced a decrease in surface temperature. These results illustrate the importance of analyzing jointly the biogeochemical and biogeophysical effects associated with land management changes in order to promote efficient climate mitigation strategies or to adapt the ones currently adopted.

5. Conclusions

In this study, we demonstrated that cover crop introduction at European scale could have a significant mitigation potential through albedo effects. This mitigation potential could reach 6.74 MtCO2-eq.yr−1 if cover crops are introduced in all favorable fallow periods, but their effect could be limited to 5.68 MtCO2-eq.yr−1 when considering the impact of snow cover. Our study also shows that the progressive soil darkening following the repeated incorporation of cover crop biomass into the soil could reduce the mitigation potential to 5.39 MtCO2-eq.yr−1 on the European scale and without considering snow cover. In order to avoid the mitigation loss effect associated with soil darkening when implementing carbon farming practices, we, therefore, recommend covering the soil at all times, either with vegetation or crop residues, once those carbon farming practices are implemented.

Author Contributions

Conceptualization, G.P., D.C. and E.C.; methodology, G.P., D.C., R.G. and E.C.; software, G.P. and D.C.; validation, G.P., D.C., E.L., R.F., R.G. and E.C.; formal analysis, G.P., D.C., E.L., R.F., R.G. and E.C.; investigation, G.P., D.C., E.L. and E.C.; resources, D.C. and E.L.; data curation, G.P. and D.C.; writing—original draft preparation, G.P. E.C. and R.F.; writing—review and editing, G.P., D.C., E.L., R.F., R.G. and E.C.; visualization, G.P. and D.C.; supervision, E.C. and D.C.; project administration, E.C. and D.C.; funding acquisition, E.C. and D.C. All authors have read and agreed to the published version of the manuscript.

Funding

This research was funded by the ADEME (REACCTIF program through the CICC project), the Agence de l’Eau Adour-Garonne (BAG’AGES project), the European Commission (EC) under the Horizon 2020 SENSAGRI (Grant Agreement no. 730074) and ClieNfarms (Grant Agreement no. 101036822) projects, the CNRS-INSU who is supporting the OSR (Observatoire Spatial Regional) and the LSA-SAF project of EUMETSAT.

Data Availability Statement

Data is not publicly available.

Acknowledgments

The authors thank the MODIS team who are developing satellite-derived surface albedo products (especially Qingsong Sun and Crystal Schaaf). The authors also thank N Boukachaba and E Azzi for their assistance.

Conflicts of Interest

The authors declare no conflict of interest.

References

  1. IPCC. Climate Change 2014 Summary Chapter for Policymakers Synthesis Report; IPCC: Geneva, Switzerland, 2014. [Google Scholar]
  2. FAO. 2015. FAO Statistical Databases. Available online: http://faostat.fao.org/ (accessed on 10 May 2023).
  3. Lal, R. Soil Carbon Sequestration Impacts on Global Climate Change and Food Security. Science 2004, 304, 1623–1627. [Google Scholar] [CrossRef] [Green Version]
  4. Pimentel, D.; Burgess, M. Soil Erosion Threatens Food Production. Agriculture 2013, 3, 443–463. [Google Scholar] [CrossRef] [Green Version]
  5. Watson, A.; Boyd, P.; Turner, S.; Jickells, T.; Liss, P. Designing the next generation of ocean iron fertilization experiments. Mar. Ecol. Prog. Ser. 2008, 364, 303–309. [Google Scholar] [CrossRef] [Green Version]
  6. Caldeira, K.; Bala, G.; Cao, L. The Science of Geoengineering. Annu. Rev. Earth Planet. Sci. 2013, 41, 231–256. [Google Scholar] [CrossRef]
  7. Bao, L.; Trachtenberg, M.C. Facilitated transport of CO2 across a liquid membrane: Comparing enzyme, amine, and alkaline. J. Membr. Sci. 2006, 280, 330–334. [Google Scholar] [CrossRef]
  8. Gray, M.L.; Champagne, K.J.; Fauth, D.; Baltrus, J.P.; Pennline, H. Performance of immobilized tertiary amine solid sorbents for the capture of carbon dioxide. Int. J. Greenh. Gas Control. 2008, 2, 3–8. [Google Scholar] [CrossRef]
  9. Mahmoudkhani, M.; Keith, D.W. Low-energy sodium hydroxide recovery for CO2 capture from atmospheric air—Thermodynamic analysis. Int. J. Greenh. Gas Control. 2009, 3, 376–384. [Google Scholar] [CrossRef]
  10. Latham, J.; Rasch, P.; Chen, C.-C.; Kettles, L.; Gadian, A.; Gettelman, A.; Morrison, H.; Bower, K.; Choularton, T. Global temperature stabilization via controlled albedo enhancement of low-level maritime clouds. Philos. Trans. R. Soc. A Math. Phys. Eng. Sci. 2008, 366, 3969–3987. [Google Scholar] [CrossRef]
  11. Crutzen, P.J. Albedo Enhancement by Stratospheric Sulfur Injections: A Contribution to Resolve a Policy Dilemma? Clim. Change 2006, 77, 211–220. [Google Scholar] [CrossRef] [Green Version]
  12. Robock, A.; Marquardt, A.; Kravitz, B.; Stenchikov, G. Benefits, risks, and costs of stratospheric geoengineering. Geophys. Res. Lett. 2009, 36, L19703. [Google Scholar] [CrossRef] [Green Version]
  13. Akbari, H.; Menon, S.; Rosenfeld, A. Global cooling: Increasing world-wide urban albedos to offset CO2. Clim. Change 2009, 94, 275–286. [Google Scholar] [CrossRef] [Green Version]
  14. Jacobson, M.Z.; Ten Hoeve, J.E. Effects of Urban Surfaces and White Roofs on Global and Regional Climate. J. Clim. 2012, 25, 1028–1044. [Google Scholar] [CrossRef]
  15. Ridgwell, A.; Singarayer, J.S.; Hetherington, A.M.; Valdes, P.J. Tackling Regional Climate Change by Leaf Albedo Bio-geoengineering. Curr. Biol. 2009, 19, 146–150. [Google Scholar] [CrossRef] [Green Version]
  16. Singarayer, J.S.; Davies-Barnard, T. Regional climate change mitigation with crops: Context and assessment. Philos. Trans. R. Soc. A Math. Phys. Eng. Sci. 2012, 370, 4301–4316. [Google Scholar] [CrossRef] [Green Version]
  17. Chabbi, A.; Lehmann, J.; Ciais, P.; Loescher, H.W.; Cotrufo, M.F.; Don, A.; SanClements, M.; Schipper, L.; Six, J.; Smith, P.; et al. Aligning agriculture and climate policy. Nat. Clim. Change 2017, 7, 307–309. [Google Scholar] [CrossRef]
  18. Minasny, B.; Malone, B.P.; McBratney, A.B.; Angers, D.A.; Arrouays, D.; Chambers, A.; Chaplot, V.; Chen, Z.-S.; Cheng, K.; Das, B.S.; et al. Soil carbon 4 per mille. Geoderma 2017, 292, 59–86. [Google Scholar] [CrossRef]
  19. Kaye, J.P.; Quemada, M. Using cover crops to mitigate and adapt to climate change. A review. Agron. Sustain. Dev. 2017, 37, 4. [Google Scholar] [CrossRef] [Green Version]
  20. Lugato, E.; Cescatti, A.; Jones, A.; Ceccherini, G.; Duveiller, G. Maximising climate mitigation potential by carbon and radiative agricultural land management with cover crops. Environ. Res. Lett. 2020, 15, 094075. [Google Scholar] [CrossRef]
  21. Tribouillois, H.; Constantin, J.; Justes, E. Cover crops mitigate direct greenhouse gases balance but reduce drainage under climate change scenarios in temperate climate with dry summers. Glob. Change Biol. 2018, 24, 2513–2529. [Google Scholar] [CrossRef]
  22. Campbell, G.S.; Norman, J.M. Introduction to Environmental Biophysics, 2nd ed.; Springer: New York, NY, USA, 1998. [Google Scholar]
  23. Carrer, D.; Meurey, C.; Ceamanos, X.; Roujean, J.-L.; Calvet, J.-C.; Liu, S. Dynamic mapping of snow-free vegetation and bare soil albedos at global 1 km scale from 10-year analysis of MODIS satellite products. Remote Sens. Environ. 2014, 140, 420–432. [Google Scholar] [CrossRef]
  24. Lenton, T.M.; Vaughan, N.E. The radiative forcing potential of different climate geoengineering options. Atmos. Chem. Phys. 2009, 9, 5539–5561. [Google Scholar] [CrossRef] [Green Version]
  25. Sieber, P.; Ericsson, N.; Hansson, P.-A. Climate impact of surface albedo change in Life Cycle Assessment: Implications of site and time dependence. Environ. Impact Assess. Rev. 2019, 77, 191–200. [Google Scholar] [CrossRef]
  26. Carrer, D.; Pique, G.; Ferlicoq, M.; Ceamanos, X.; Ceschia, E. What is the potential of cropland albedo management in the fight against global warming? A case study based on the use of cover crops. Environ. Res. Lett. 2018, 13, 044030. [Google Scholar]
  27. Pellerin, S.; Bamière, L.; Launay, C.; Martin, R.; Schiavo, M.; Angers, D.; Augusto, L.; Balesdent, J.; Doelsch, I.B.; Bellassen, V.; et al. Stocker du carbone dans les sols français, quel potentiel au regard de l’objectif 4 pour 1000 et à quel coût? INRA Science & Impact, 2019; p. 118. [Google Scholar]
  28. Hunter, M.C.; White, C.M.; Kaye, J.P.; Kemanian, A.R. Ground-Truthing a Recent Report of Cover Crop–Induced Winter Warming. Agric. Environ. Lett. 2019, 4, 190007. [Google Scholar] [CrossRef] [Green Version]
  29. Poeplau, C.; Don, A. Carbon sequestration in agricultural soils via cultivation of cover crops—A meta-analysis. Agric. Ecosyst. Environ. 2015, 200, 33–41. [Google Scholar] [CrossRef]
  30. Cierniewski, J.; Ceglarek, J.; Karnieli, A.; Ben-Dor, E.; Królewicz, S.; Kaźmierowski, C. Shortwave Radiation Affected by Agricultural Practices. Remote Sens. 2018, 10, 419. [Google Scholar] [CrossRef] [Green Version]
  31. Ladoni, M.; Bahrami, H.A.; Alavipanah, S.K.; Norouzi, A.A. Estimating soil organic carbon from soil reflectance: A review. Precis. Agric. 2010, 11, 82–99. [Google Scholar] [CrossRef]
  32. Meyer, S.; Bright, R.M.; Fischer, D.; Schulz, H.; Glaser, B. Albedo Impact on the Suitability of Biochar Systems To Mitigate Global Warming. Environ. Sci. & Technol. 2012, 46, 12726–12734. [Google Scholar]
  33. Post, D.F.; Fimbres, A.; Matthias, A.D.; Sano, E.E.; Accioly, L.; Batchily, A.K.; Ferreira, L.G. Predicting Soil Albedo from Soil Color and Spectral Reflectance Data. Soil Sci. Soc. Am. J. 2000, 64, 1027. [Google Scholar] [CrossRef]
  34. Hersbach, H.; Bell, B.; Berrisford, P.; Hirahara, S.; Horányi, A.; Muñoz-Sabater, J.; Nicolas, J.; Peubey, C.; Radu, R.; Schepers, D.; et al. The ERA5 global reanalysis. Q. J. R. Meteorol. Soc. 2020, 146, 1999–2049. [Google Scholar] [CrossRef]
  35. Faroux, S.; Tchuenté, A.T.K.; Roujean, J.-L.; Masson, V.; Martin, E.; Le Moigne, P. ECOCLIMAP-II/Europe: A twofold database of ecosystems and surface parameters at 1 km resolution based on satellite information for use in land surface, meteorological and climate models. Geosci. Model Dev. 2013, 6, 563–582. [Google Scholar] [CrossRef] [Green Version]
  36. Masson, V.; Champeaux, J.L.; Chauvin, F.; Meriguet, C.; Lacaze, R. Ecoclimap: A Global Database of Land Surface Parameters at 1-km Resolution in Meteorological and Climate Models. J. Clim. 2003, 16, 1261–1282. [Google Scholar] [CrossRef]
  37. Sun, Q.; Wang, Z.; Li, Z.; Erb, A.; Schaaf, C.B. Evaluation of the global MODIS 30 arc-second spatially and temporally complete snow-free land surface albedo and reflectance anisotropy dataset. Int. J. Appl. Earth Obs. Geoinf. 2017, 14, 36–49. [Google Scholar] [CrossRef]
  38. Launay, C.; Constantin, J.; Chlebowski, F.; Houot, S.; Graux, A.; Klumpp, K.; Martin, R.; Mary, B.; Pellerin, S.; Therond, O. Estimating the carbon storage potential and greenhouse gas emissions of French arable cropland using high-resolution modeling. Glob. Change Biol. 2021, 27, 1645–1661. [Google Scholar] [CrossRef]
  39. Parton, W.J.; Hartman, M.; Ojima, D.; Schimel, D. DAYCENT and its land surface submodel: Description and testing. Glob. Planet. Change 1998, 19, 35–48. [Google Scholar] [CrossRef]
  40. Orgiazzi, A.; Ballabio, C.; Panagos, P.; Jones, A.; Fernández-Ugalde, O. LUCAS Soil, the largest expandable soil dataset for Europe: A review. Eur. J. Soil Sci. 2018, 69, 140–153. [Google Scholar] [CrossRef] [Green Version]
  41. Sakowska, K.; Alberti, G.; Genesio, L.; Peressotti, A.; Delle Vedove, G.; Gianelle, D.; Colombo, R.; Rodeghiero, M.; Panigada, C.; Juszczak, R.; et al. Leaf and canopy photosynthesis of a chlorophyll deficient soybean mutant: Photosynthesis of a Chl-deficient mutant. Plant Cell Environ. 2018, 41, 1427–1437. [Google Scholar] [CrossRef]
  42. Myhre, G.; Shindell, D.; Pongratz, J.; 2014 Myhre, G.; Shindell, D.; Pongratz, J. Anthropogenic and natural radiative forcing. In Climate Change 2013: The Physical Science Basis; IPCC: Geneva, Switzerland, 2014; pp. 659–740. [Google Scholar]
  43. Cherubini, F.; Bright, R.M.; Strømman, A.H. Site-specific global warming potentials of biogenic CO2 for bioenergy: Contributions from carbon fluxes and albedo dynamics. Environ. Res. Lett. 2012, 7, 045902. [Google Scholar] [CrossRef]
  44. Joos, F.; Roth, R.; Fuglestvedt, J.S.; Peters, G.P.; Enting, I.G.; von Bloh, W.; Brovkin, V.; Burke, E.J.; Eby, M.; Edwards, N.R.; et al. Carbon dioxide and climate impulse response functions for the computation of greenhouse gas metrics: A multi-model analysis. Atmos. Chem. Phys. 2013, 13, 2793–2825. [Google Scholar] [CrossRef] [Green Version]
  45. Brisson, N.; Launay, M.; Mary, B.; Beaudoin, N. Conceptual Basis, Formalisations and Parameterization of the STICS Crop Model; Editions Quae: Versailles, France, 2009. [Google Scholar]
  46. Ceschia, E.; Mary, B.; Ferlicoq, M.; Pique, G.; Carrer, D.; Dejoux, J.-F.; Dedieu, G. Potentiel d’atténuation des changements climatiques par les couverts intermédiaires. Innov. Agron. 2017, 62, 43–58. [Google Scholar]
  47. Bright, R.M.; Bogren, W.; Bernier, P.; Astrup, R. Carbon-equivalent metrics for albedo changes in land management contexts: Relevance of the time dimension. Ecol. Appl. 2016, 26, 1868–1880. [Google Scholar] [CrossRef] [PubMed]
  48. Guardia, G.; Aguilera, E.; Vallejo, A.; Sanz-Cobena, A.; Alonso-Ayuso, M.; Quemada, M. Effective climate change mitigation through cover cropping and integrated fertilization: A global warming potential assessment from a 10-year field experiment. J. Clean. Prod. 2019, 241, 118307. [Google Scholar] [CrossRef]
  49. Abdalla, M.; Hastings, A.; Cheng, K.; Yue, Q.; Chadwick, D.; Espenberg, M.; Truu, J.; Rees, R.M.; Smith, P. A critical review of the impacts of cover crops on nitrogen leaching, net greenhouse gas balance and crop productivity. Glob. Change Biol. 2019, 25, 2530–2543. [Google Scholar] [CrossRef] [PubMed] [Green Version]
  50. Lombardozzi, D.L.; Bonan, G.B.; Wieder, W.; Grandy, A.S.; Morris, C.; Lawrence, D.L. Cover Crops May Cause Winter Warming in Snow-Covered Regions. Geophys. Res. Lett. 2018, 45, 9889–9897. [Google Scholar] [CrossRef]
  51. Davin, E.L.; Seneviratne, S.I.; Ciais, P.; Olioso, A.; Wang, T. Preferential cooling of hot extremes from cropland albedo management. Proc. Natl. Acad. Sci. USA 2014, 111, 9757–9761. [Google Scholar] [CrossRef] [Green Version]
Figure 1. Distribution of the LUCAS points (in red). The background color represents the fraction of croplands above 20%. The black dot indicates the location of the darkest soil (see Section 2.2.2).
Remotesensing 15 03231 g001
Figure 2. List of simulated experiments.
Remotesensing 15 03231 g002
Figure 3. Albedo-induced radiative forcing due to CC introduction averaged over 100 years. Only pixels with at least 20% of cropland are shown.
Remotesensing 15 03231 g003
Table 1. Possible crop rotations between winter and summer crops: Summer-summer (RSS), winter-winter (RWW), summer-winter (RSW), and winter-summer (RWS). Summer and winter crops correspond, respectively, to black and grey boxes. Potential periods of CC introduction are represented by green boxes. Note that these periods and durations vary spatially in Europe.
Year nYear n+1
JFMAMJJASONDJFMAMJJASOND
RSS
RWW
RSW
RWS
Table 2. 100-year average of the albedo changes, cover crop introduction area, albedo-induced radiative forcing, and global warming potential simulated for the four scenarios.
Albedo ChangeCover Crop Introduction Area (km²)Albedo-Induced Radiative Forcing (W.m−2)Global Warming Potential (MtCO2-eq.yr−1)
SCarrer_et_alSCC_extensionSSnowSAlb_decSCarrer_et_alSCC_extensionSSnowSAlb_decSCarrer_et_alSCC_extensionSSnowSAlb_decSCarrer_et_alSCC_extensionSSnowSAlb_dec
Austria0.0120.0180.0110.01830937504−0.61−0.58−0.42−0.370.040.080.060.05
Belgium0.0120.0280.0250.02819733973−0.48−0.69−0.64−0.830.020.060.060.07
Bulgaria0.0120.0290.0200.02917,10024,925−0.86−1.49−1.15−0.980.190.470.360.31
Croatia0.0140.0280.0200.02825805618−0.58−1.03−0.81−0.970.030.130.100.12
Cyprus/0.0100.0100.010/323/−2.04−2.040.000.000.010.000.00
Czech Republic0.0120.0120.0060.012347425,066−0.51−0.30−0.19−0.240.030.120.070.09
Denmark0.0120.0040.0030.004110016,410−0.53−0.08−0.07−0.040.010.030.020.01
Estonia0.0130.0320.0100.0323374186−0.22−0.33−0.17−0.180.000.020.010.01
Finland0.0130.0390.0120.0394254986−0.24−0.34−0.21−0.340.000.060.040.06
France0.0090.0180.0160.01833,70489,247−0.84−0.84−0.81−0.700.601.591.531.32
Germany0.0110.0090.0070.00915,71387,383−0.63−0.26−0.22−0.240.180.410.350.39
Greece0.0080.0240.0190.02438996046−0.94−1.69−1.51−1.380.080.230.210.19
Hungary0.0130.0250.0170.02515,59128,885−0.50−0.77−0.61−0.540.130.370.290.26
Ireland0.0080.0070.0070.0073001541−0.47−0.20−0.20−0.240.010.010.010.01
Italy0.0090.0220.0190.02210,05539,160−0.91−1.20−1.09−1.130.140.730.660.69
Latvia0.0130.0240.0090.02413208439−0.23−0.29−0.15−0.180.000.020.010.01
Lithuania0.0130.0220.0090.022230417,981−0.25−0.29−0.15−0.180.010.060.030.03
Luxembourg0.0110.0130.0100.01315160−0.48−0.34−0.28−0.210.000.000.000.00
Malta/0.0070.0070.007/12/−0.46−0.46−0.680.000.000.000.00
Netherlands0.0120.0270.0250.02717734763−0.37−0.56−0.53−0.480.020.060.060.05
Norway0.0130.0300.0080.0301201910−0.23−0.65−0.19−0.020.000.020.010.00
Poland0.0110.0130.0070.01324,63996,582−0.43−0.28−0.20−0.200.140.360.250.25
Portugal0.0070.0260.0260.0266571937−1.49−2.25−2.25−1.440.020.070.070.04
Romania0.0130.0310.0200.03132,52654,608−0.62−1.14−0.83−0.930.341.050.760.85
Slovakia0.0130.0180.0100.01828928221−0.59−0.51−0.35−0.250.040.090.060.04
Slovenia0.0140.0300.0190.030327510−0.57−1.02−0.72−0.740.010.020.010.01
Spain0.0040.0100.0090.010638626,206−0.77−1.03−1.01−0.900.090.490.480.43
Sweden0.0140.0250.0110.0255909879−0.25−0.32−0.22−0.290.000.060.040.06
Switzerland0.0110.0120.0060.012290998−0.67−0.49−0.31−0.330.010.020.010.01
United Kingdom0.0100.0040.0040.004400145,197−0.62−0.12−0.12−0.070.040.100.100.05
All0.0110.0170.0120.01718,718362,2656−0.66−0.62−0.52−0.502.176.745.685.39
Disclaimer/Publisher’s Note: The statements, opinions and data contained in all publications are solely those of the individual author(s) and contributor(s) and not of MDPI and/or the editor(s). MDPI and/or the editor(s) disclaim responsibility for any injury to people or property resulting from any ideas, methods, instructions or products referred to in the content.

